the Creative Commons Attribution 4.0 License.
the Creative Commons Attribution 4.0 License.
 | 19 Oct 2020
Modelling dynamic interactions between soil structure and the storage and turnover of soil organic matter
Katharina Hildegard Elisabeth Meurer
Claire Chenu
Elsa Coucheney
Anke Marianne Herrmann
Thomas Keller
Thomas Kätterer
David Nimblad Svensson
Nicholas Jarvis
Models of soil organic carbon (SOC) storage and turnover can be useful tools to analyse the effects of soil and crop management practices and climate change on soil organic carbon stocks. The aggregated structure of soil is known to protect SOC from decomposition and, thus, influence the potential for long-term sequestration. In turn, the turnover and storage of SOC affects soil aggregation, physical and hydraulic properties and the productive capacity of soil. These two-way interactions have not yet been explicitly considered in modelling approaches. In this study, we present and describe a new model of the dynamic feedbacks between soil organic matter (SOM) storage and soil physical properties (porosity, pore size distribution, bulk density and layer thickness). A sensitivity analysis was first performed to understand the behaviour of the model. The identifiability of model parameters was then investigated by calibrating the model against a synthetic data set. This analysis revealed that it would not be possible to unequivocally estimate all of the model parameters from the kind of data usually available in field trials. Based on this information, the model was tested against measurements of bulk density, SOC concentration and limited data on soil water retention and soil surface elevation made during 63 years in a field trial located near Uppsala (Sweden) in three treatments with different organic matter (OM) inputs (bare fallow, animal and green manure). The model was able to accurately reproduce the changes in SOC, soil bulk density and surface elevation observed in the field as well as soil water retention curves measured at the end of the experimental period in 2019 in two of the treatments. Treatment-specific variations in SOC dynamics caused by differences in OM input quality could be simulated very well by modifying the value for the OM retention coefficient ε (0.37 for animal manure and 0.14 for green manure). The model approach presented here may prove useful for management purposes, for example, in an analysis of carbon sequestration or soil degradation under land use and climate change.
- Article
(344 KB) - Full-text XML
-
Supplement
(84 KB) - BibTeX
- EndNote


As a consequence of intensive cultivation, most agricultural soils have lost ca. 25 %–75 % of their antecedent store of SOC (Lal, 2013; Sanderman et al., 2017). Apart from contributing to the increase in atmospheric CO2, this has also degraded the inherent physical quality and productivity of soil (e.g. Lal, 2007; Rickson et al., 2015; Henryson et al., 2018). This is because many important soil physical and hydraulic (e.g. water retention and hydraulic conductivity) properties are strongly influenced by soil organic matter (SOM). For example, SOM increases porosity and reduces soil bulk density (e.g. Haynes and Naidu, 1998; Ruehlmann and Körschens, 2009; Jarvis et al., 2017). This is partly because the density of organic matter is less than that of soil minerals, but more importantly, it is a consequence of the aggregated soil structure induced by the microbial decomposition of fresh organic matter (Tisdall and Oades, 1982; Young and Crawford, 2004; Cosentino et al., 2006; Feeney et al., 2006; Bucka et al., 2019). Changes in the SOM content may also affect the pore size distribution, although the magnitude of these effects across different ranges of pore diameter is still a matter of some controversy (e.g. Hudson, 1994; Rawls et al., 2003; Loveland and Webb, 2003; Minasny and McBratney 2018; Libohova et al., 2018).
The relationship between SOM and soil pore space properties can be characterized as a dynamic two-way interaction. This is because, in addition to the effects of SOM on soil pore size distribution and porosity, decomposition rates of SOM are reduced within microporous regions of soil that are poorly aerated and where the carbon is physically much less accessible to microorganisms (e.g. Ekschmitt et al., 2008; Dungait et al., 2012; Lehmann and Kleber, 2015). Whereas sorption interactions with mineral surfaces are probably the dominant mechanisms protecting SOM from decomposition in coarse-textured soils, the additional physical protection afforded by microporous regions of the soil may lead to an enhanced long-term storage of SOM in structured fine-textured soils (e.g. Hassink et al., 1993; Chevallier et al., 2004; Souza et al., 2017; Dignac et al., 2017). Thus, the turnover of both particulate and soluble SOM has been shown to depend on its location in soil pore networks of different diameters and connectivity and with contrasting microbial communities (e.g. Strong et al., 2004; Ruamps et al., 2011; Nunan et al., 2017). Recent studies using novel X-ray imaging techniques have also provided additional insights into how the soil pore space architecture regulates the physical protection of SOM in structured soil (Kravchenko and Guber, 2017). For example, Kravchenko et al. (2015) showed that the decomposition rates of intra-aggregate particulate SOM were three to 15 times faster in the presence of connected networks of aerated soil pores >13 µm in diameter than in the absence of such pores. Toosi et al. (2017) showed that plant residues decomposed more slowly in soil microcosms dominated by pores 5–10 µm in diameter than in those containing a significant proportion of pores >30 µm in diameter. Quigley et al. (2018) showed that pores 40–90 µm in size were associated with a fast influx of fresh carbon, followed by its rapid decomposition, whereas soil pores <40 µm in diameter were associated with reduced rates of carbon decomposition. From the foregoing, it follows that the turnover of SOM will be significantly affected by any physical or biological mixing process which transfers SOM between different pore regions in soil. For example, soil tillage may promote decomposition by exposing SOM that was previously effectively protected from microbial attack within microporous regions of the soil (e.g. Balesdent et al., 2000; Chevallier et al., 2004). Physical protection of SOM is also affected by the mixing resulting from the ingestion and casting of soil by earthworms (e.g. Martin, 1991; Görres et al. 2001; Angst et al., 2017).
Some widely used models of SOM turnover and storage attempt to implicitly account for the effects of chemical and physical protection by introducing a stable or inert pool (e.g. Falloon and Smith, 2000; Barré et al., 2010). Other models have also been proposed that explicitly predict the effects of soil structure on SOM storage and turnover by making use of the concept of soil micro- and macro-aggregates (e.g. Stamati et al., 2013; Segoli et al., 2013). An alternative approach would be to define soil structure in terms of the soil pore space. The advantage of this is that it allows a straightforward coupling to models of flow and transport processes in soil (e.g. Young et al., 2001; Rabot et al., 2018). From a mathematical point of view, soil structure can be concisely described by the volume and connectivity of solids and pore space and the surface area and curvature of their interface, all expressed as a function of pore diameter (Vogel et al., 2010). Of these metrics, we focus here on the pore size distribution and its integral, the total porosity, since these properties underlie widely used soil hydrological models based on the Richards equation. Incorporating such a pore-space-based approach to the interactions between SOM and soil structure into a soil–crop model would enable explicit recognition of the feedback links that exist between SOM dynamics, soil hydrological processes and plant growth (Henryson et al., 2018). Kuka et al. (2007) earlier proposed a pore-based model of SOM turnover carbon turnover in pore space (CIPS), although they did not account for any feedbacks to soil physical properties and hydraulic functions.
Here, we propose and test a new model that describes the dynamic two-way interactions between SOM storage and turnover, soil structure and soil physical properties. We first performed a sensitivity analysis of the proposed model and also investigated parameter identifiability using a synthetic data set (e.g. Luo et al., 2017). This was done because the data usually available from field experiments for testing models of SOM storage and turnover may be insufficient to uniquely identify the parameters of even the simplest models (Juston et al., 2010; Luo et al., 2017). Such problems of parameter non-identifiability or equifinality (Beven, 2006) may introduce considerable uncertainties into model predictions under changing agro-environmental conditions (e.g. Sierra et al., 2015; Bradford, 2016; Luo et al., 2017). Making use of the results of this sensitivity and uncertainty analysis, we calibrated the model against field data obtained from two treatments (bare fallow and animal manure) at the Ultuna long-term frame trial in Uppsala, Sweden, using measurements of the temporal changes in SOC concentrations and bulk density and limited data on both the soil pore size distribution derived from water retention curves and surface elevation. As a further test, we also compared predictions of the calibrated model with independent observations made in a green manure treatment in the same experiment.
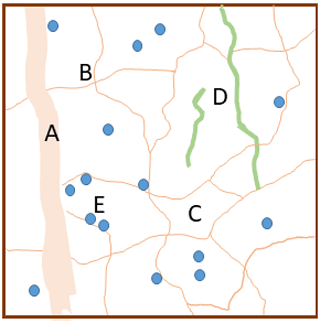
Figure 1Schematic illustration of the conceptual model with the soil pore space comprising macropores (A), mesopores (thin lines; B) and micropores (C) and with two qualities of organic matter, namely particulate organic matter (POM; e.g. decaying roots; green lines; D) and microbially processed organic matter (blue circles; E), both of which are stored either in contact only with micropores (and therefore partially protected from decomposition) or in contact with mesopores.
2.1 Conceptual model
The model describes the dynamic two-way interactions between SOM storage and turnover and soil porosity and pore size distribution. A simple conceptual model is adopted to capture how the soil pore space changes as a result of changes in soil organic matter concentration (Figs. 1 and 2). A list of all variables and their symbols can be found in Table S1 in the Supplement. We consider that the total pore volume, Vp, comprises the sum of a constant textural pore volume, Vtext, defined as the minimum value of the pore volume found in a purely mineral soil matrix without SOM (e.g. Fies and Stengel, 1981; Yoon and Gimenéz, 2012) and a dynamic structural pore volume comprising both macropores, Vmac, and an aggregation pore volume, Vagg, generated as a consequence of the microbial turnover of organic matter (OM). The biological processes underlying the generation of aggregation pore space (Dignac et al., 2017) would be difficult to model individually in a mechanistic way, so we make no attempt to do so in our model. Instead, in our model approach, which is based on the dynamics of soil pore space, the term aggregation is simply defined as the additional pore space in soil associated with the presence of organic matter. Based on empirical knowledge, we assume a linear relationship between this aggregation pore volume, Vagg, and the volume of soil organic matter (e.g. Emerson and McGarry, 2003; Boivin et al., 2009; Johannes et al., 2017). Thus, individual soil aggregates are not considered as explicit entities in this model. In addition to classifying the soil pore space in terms of its origin, the model also considers three pore size classes (Figs. 1 and 2). In addition to macropores, the soil matrix porosity is partitioned into mesopores and micropores.
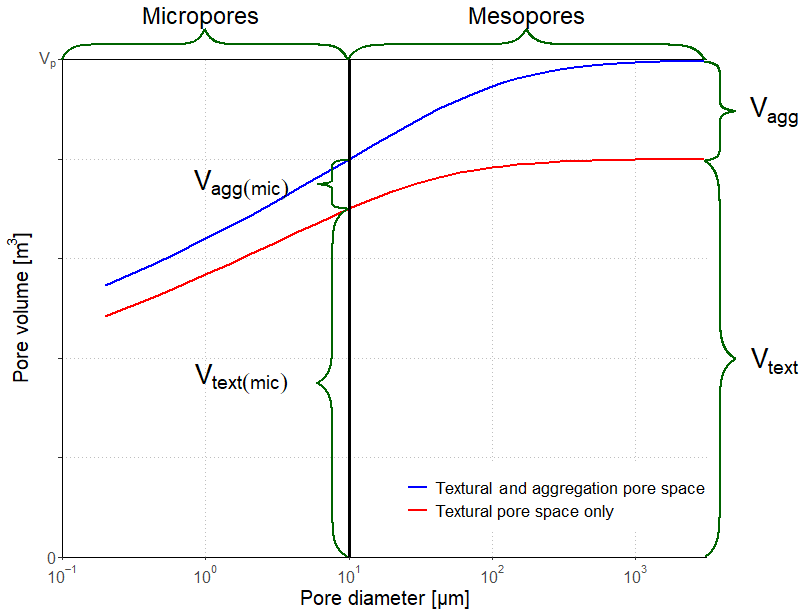
Figure 2Schematic illustration of pore volumes and pore classes in the model (for explanation of symbols, see text). In this example, macroporosity has been neglected, and the total pore space is comprised of 80 % textural pores and 20 % aggregation pores induced by soil organic matter, with a maximum micropore diameter of 10 µm.
The model currently neglects the storage of SOM in macropores because we expect that SOM, per se, would have little direct influence on the properties of soil macropore networks (e.g. Larsbo et al., 2016; Jarvis et al., 2017), but also because it would most likely be a minor component of the long-term SOM balance. The pore size distribution in the soil matrix influences SOM storage and turnover in the model in two ways. First, the mineralization rate of SOM in microporous regions is reduced due to physical protection. Second, the partitioning of OM inputs derived from plant roots between the two pore classes is determined by their relative volumes in an attempt to mimic, in a simple way, how changes in soil structure affect the spatial distribution of root proliferation in soil. SOM is transferred between the two pore size classes using a simple mixing concept to reflect the homogenizing effects of soil tillage and faunal bioturbation. In this sense, the model has some conceptual similarities to the dual-pore region models that are commonly used to quantify the effects of soil structure on water flow and solute transport (e.g. Larsbo et al., 2005).
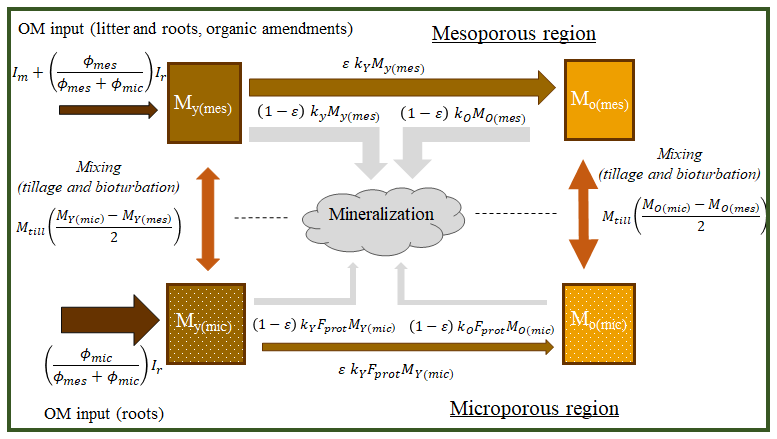
Figure 3Schematic diagram of the structure of the organic matter model showing storages and flows. For explanations of the symbols, see the text in connection with Eqs. (1) to (6).
2.2 Soil organic matter storage and turnover
Four pools of organic matter (kg OM m−2), comprising two types (qualities) of organic matter stored in the two pore regions of the soil matrix (Figs. 1 to 3), are considered in the model. The model tracks two pools of young undecomposed organic matter, with one stored in parts of the soil in contact with well-aerated mesopore networks and the other stored in microporous soil regions (MY(mes) and MY(mic) respectively). Similarly, the model accounts for two pools of older microbially processed organic matter stored in the mesoporous and microporous regions of soil respectively (MO(mes) and MO(mic)). Both types of organic matter are transferred between the two pore regions by biophysical mixing processes such as tillage and bioturbation. The SOM fluxes and rates of change in storage in the four pools of organic matter in the model are given by a modified version of the ICBM model (Andrén and Kätterer, 1997; Wutzler and Reichstein, 2013) extended to account for organic matter storage in two pore regions, as follows:
where φmic and φmes are micro- and mesoporosity (m3 m−3), kY and kO are the first-order rate constants for the decomposition of fresh and microbially processed organic matter (yr−1), Fprot is a response factor (–) varying from zero to unity that reduces decomposition in the micropore region to reflect a degree of physical protection, ε is an OM retention coefficient varying from zero to unity (–), and Ir and Imare the below-ground (root residues and exudates) and above-ground (litter and organic amendments, e.g. manure) inputs of organic matter (kg m−2 yr−1). It can be seen from Eqs. (1) and (3) that the model assumes that root-derived organic matter is added to the microporous and mesoporous regions in proportion to their volumes, while above-ground litter and organic amendments are added solely to the mesopore region. Finally, TY and TO are source–sink terms (kg m−2 yr−1) for the exchange of organic matter (e.g. by tillage or earthworm bioturbation) between the two pore classes given by the following:
where kmix is a rate coefficient (yr−1) determining how much of the stored organic matter is mixed annually, varying between zero (no mixing) and unity (complete mixing on an annual timescale). It should be apparent from Eqs. (1) to (6) that the effects of soil structure on SOM turnover become weaker as kmix and/or Fprot tend to unity.
2.3 Soil physical properties
The model of SOM turnover and storage described by Eqs. (1)–(6) above considers how the soil pore space influences SOM dynamics. We now derive a simple model of the feedback effects of SOM on porosity and pore size distribution. Our starting point is the fundamental phase relation for the total soil volume, Vt (m3), as follows:
where Vs, Vs(o), Vs(m) and Vp are the volumes (m3) of solids, organic matter, mineral matter and pore space, γo and γm are the densities (kg m−3) of organic and mineral matter, Axs is a nominal cross-sectional area in the soil (=1 m2), Ms(m) is the mass of mineral matter (kg m−2), and Ms(o) is the total mass of organic matter (kg OM m−2) given by the following:
The mineral mass, Ms(m), in Eq. (7) is assumed constant and is obtained from user-defined values of a minimum matrix porosity, φmin (m3 m−3), and thickness of the soil layer, Δzmin (m), corresponding to the theoretical minimum soil volume, Vmin (m3), attained when Ms(o)=0, as follows:
The volume of organic matter, Vs(o), and thus the total soil volume, Vt, in Eq. (7) naturally changes as the stored mass of soil organic matter, Ms(o), changes. The total soil volume is also affected by changes in the dynamic soil pore volume, which comprises macropores, Vmac and aggregation pore space, Vagg, induced by microbial activity, whereas the textural pore volume linked to soil mineral matter, Vtext (see Fig. 2), remains constant. For the sake of simplicity, we assume here that the soil macroporosity is also constant, such that Vmac is maintained in proportion to the total soil volume. With these assumptions, the total pore volume, Vp, is given by the following:
where fagg is an aggregation factor (m3 pore space m−3 organic matter) defined as the slope of the linear relationship assumed between the volume of aggregation pore space, Vagg, and the volume of organic matter, Vs(o), φmac is the macroporosity (m3 m−3), and Δz is the layer thickness (m). The constant volume of textural pores, Vtext (m3), is obtained by combining Eqs. (7), (9) and (10) with Ms(o)=0.
Temporal variations in Vs(o) and Vp induce changes in the total soil volume (and therefore the soil layer thickness), porosity and bulk density. Combining Eqs. (7), (9) and (11), gives the soil layer thickness, as follows:
and the matrix porosity, φmat (m3 m−3), total porosity, φ (m3 m−3), and soil bulk density, γb (kg m−3), are as follows:
It is also helpful to derive expressions for porosity and bulk density as functions of the soil organic matter concentration, fsom (kg kg−1), rather than of Ms(o), since fsom is more often measured in the field. The organic matter concentration is defined as follows:
Combining Eqs. (9) and (16) gives the following:
Substituting Eq. (17) into Eqs. (13)–(15) leads to the following expressions for the matrix porosity and the soil bulk density:
In the absence of other governing processes, Eqs. (14), (18) and (19) enable the identification of the upper and lower limits of porosity and bulk density that occur at limit SOM concentrations of zero (i.e. a purely mineral soil) and unity (i.e. organic soils). Setting fsom to zero defines the maximum and minimum values of bulk density and porosity respectively, as follows:
Conversely, bulk density and porosity attain minimum and maximum values respectively in an organic soil when fsom=1 kg kg−1, such that, in the following:
Finally, the matrix porosity, φmat, is partitioned between micro- and mesoporosity as follows:
where Vagg(mic) and Vtext(mic) are the volumes (m3) of aggregation and textural micropores respectively (see Fig. 2), and Ftext(mic) represents the proportion (–) of the textural pore space that comprises micropores. It should be feasible to estimate Ftext(mic) from data on soil texture, since pore and particle size distributions are similar in the absence of structural pores (e.g. Arya et al., 1999; Yoon and Gimenéz, 2012; Arya and Heitman, 2015).

Figure 4Equation (19) fitted to data from three Swedish field sites. Ultuna data taken from Kirchmann et al. (1994), Gerzabek et al. (1997), Kirchmann and Gerzabek, (1999) and Kätterer et al. (2011). Måtteby data taken from Larsbo et al. (2016), with the soil under grass. Offer data taken from Jarvis et al. (2017); harrowed soil had been ploughed and harrowed (samples were taken at 2–6 cm depth) and ploughed soil was only ploughed (samples were taken at 13–17 cm depth). Data used in this study are highlighted in red (fallow, animal manure and green manure). Soil organic matter content was estimated from soil organic carbon by multiplying by two (Pribyl, 2010). Equation (19) was fitted by non-linear least-squares regression, assuming a priori that γm=2.7, γo=1.2 g cm−3 and ømin=0.35 cm3 cm−3.
The model described by Eq. (19) was first derived by Stewart et al. (1970), albeit in a simpler form in which macroporosity is neglected and γo and fagg are lumped into one parameter, i.e. the bulk density of a purely organic soil given by Eq. (22) with φmac=0. This simple model has been shown to accurately represent the observed relationships between organic matter concentration and bulk density in forest soils in Wales (Stewart et al., 1970; Adams, 1973) and northeastern USA (Federer et al., 1993) and agricultural soils in Australia (Tranter et al., 2007). More recently, this function has been incorporated into the Jena model (Ahrens et al., 2015; Yu et al., 2020). The validity of the extended model approach presented here, which explicitly incorporates macroporosity and soil aggregation, is confirmed by Fig. 4, which shows that Eq. (19) gives reasonably good fits to measurements of bulk density and organic matter concentration made at three agricultural field sites in Sweden, including the Ultuna frame trial.
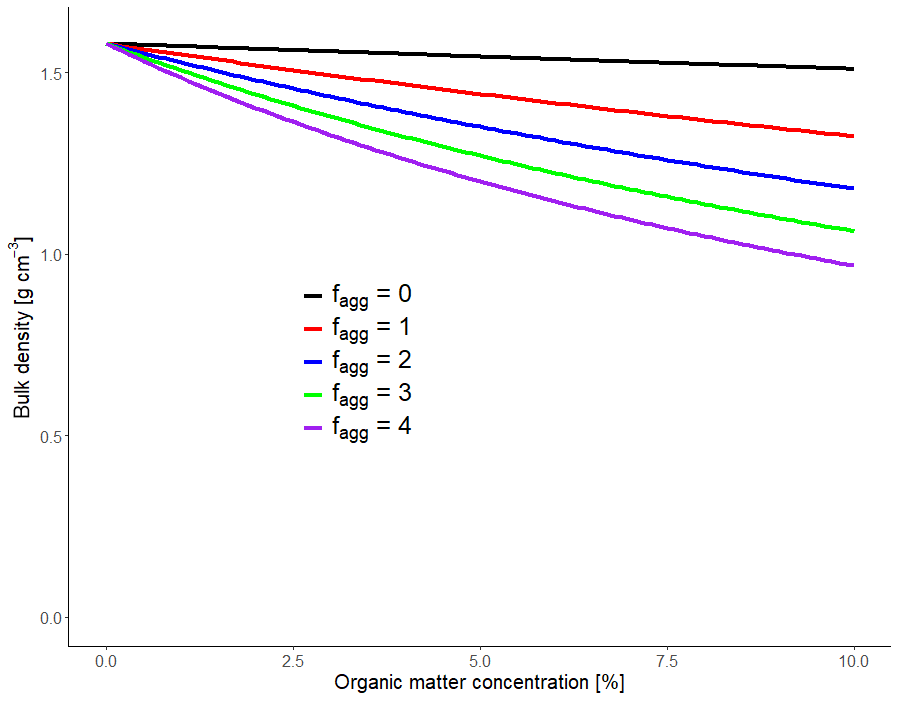
Figure 5Plots of Eq. (19) for contrasting values of the aggregation factor, fagg, with γm=2.7 g cm−3, γo=1.2 g cm−3 ømac=0.1 and ømin=0.35 cm3 cm−3.
Figure 5 shows the relationship between bulk density and organic matter concentration predicted by Eq. (19) for values of fagg lying between zero and four. A comparison of the curves for values of fagg, similar to those obtained in the model fitting to the data (ca. 2–4; see Fig. 4), with that of fagg=0 (i.e. when no additional pore space is generated due to the presence of organic matter) demonstrates that aggregation dominates the effects of organic matter on soil bulk density, while the different densities of organic and mineral matter (γo and γm) only have a minor effect. It should be noted that the composition of OM sources may affect the extent of soil aggregation generated by microbial activity (e.g. Bucka et al., 2019). In this respect, each of the four OM pools could have been characterized by a different value of the aggregation factor. However, we have assumed here that the two qualities of organic matter modify the pore space to the same extent in both the micropore and mesopore regions so that only a single aggregation factor, fagg, is required in the model. As we will see later, this is because unequivocal parameterization of a more detailed model would be difficult to achieve given the amount and kinds of data normally available from field experiments. Alternatively, a model of intermediate complexity can be envisaged in which fagg would take different values in micropore and mesopore regions. Such a model would only introduce one additional parameter compared with the simplest case assumed here, but even this modest increase in complexity could cause difficulties with parameter identifiability.
2.4 Soil hydraulic properties
Equations (13), (24) and (25) describe a partitioning of the matrix pore space into two size classes as a dynamic function of soil organic matter storage. This partitioning can also be used to estimate continuous model functions for soil hydraulic properties (water retention and hydraulic conductivity) to enable a straightforward coupling to hydrological models based on Richards' equation. Most commonly used models of soil water retention employ two shape parameters to characterize the pore size distribution. Thus, one requirement of this approach is that one of these two parameters must be assumed to remain constant. We illustrate this approach, taking the widely used van Genuchten (1980) equation as an example. If residual water is negligible, the water content θ (m3 m−3) is given by the following:
where ψ (centimeters) is the soil water pressure head, and α (cm−1) and n (–) are shape parameters that reflect the pore size distribution. We assume that n can be held constant, since it is known to be strongly determined by soil texture (e.g. Wösten et al., 2001; Vereecken et al., 2010), while α is allowed to vary, as it is more influenced by the nature of the structural pore space in soil (Assouline and Or, 2013). In this case, α (cm−1) is given by the following:
where ψmic∕mes is a fixed user-defined pressure head (centimeters) defining the size of the largest micropore in soil. This model only considers the two pore size classes comprising matrix porosity. However, it is possible to extend this model to account for macropores by making use of dual-porosity concepts (Durner, 1994; Larsbo et al., 2005).
3.1 Sensitivity analysis
We performed a Monte Carlo sensitivity analysis to better understand the behaviour of this new model. We ran 500 simulations with parameter values obtained by Latin hypercube sampling from uniform distributions. The simulations were run for 2000 years to make the outputs independent of the assumed initial conditions. Organic matter was added solely from below-ground residues at a rate (0.02 g cm−2 yr−1) that gave a final organic matter concentration of 0.03 kg kg−1 for the mean simulation. The sensitivity of the model parameters was quantified by the Spearman rank partial correlation coefficients for three target output variables, namely the final values of bulk density, γb, soil organic matter concentration, fsom, and the micropore fraction of the matrix porosity, fmic (), as a measure to characterize the soil pore size distribution (see Eq. 27). Parameter ranges of Fprot and Ftext(mic) (0.05<Fprot<0.2; 0.5<Ftext(mic)<0.9; see Table 1) were selected to represent a well-structured loamy to fine-textured soil, assuming a maximum pore size of the micropores of 5 µm (i.e. cm). Our analysis focuses on matrix pore space properties and SOM, so the macroporosity was fixed at a constant value in these simulations. The sampled ranges for the remaining model parameters shown in Table 1 were selected to approximately match their expected variations based on previous modelling experience.
Table 1Sampled parameter ranges and the Spearman rank partial correlation coefficients (r) between parameters and target outputs. Values marked in bold show a significant correlation (p<0.01). Note: fsom – soil organic matter concentration, γb – bulk density and fmic – fraction of micropores.
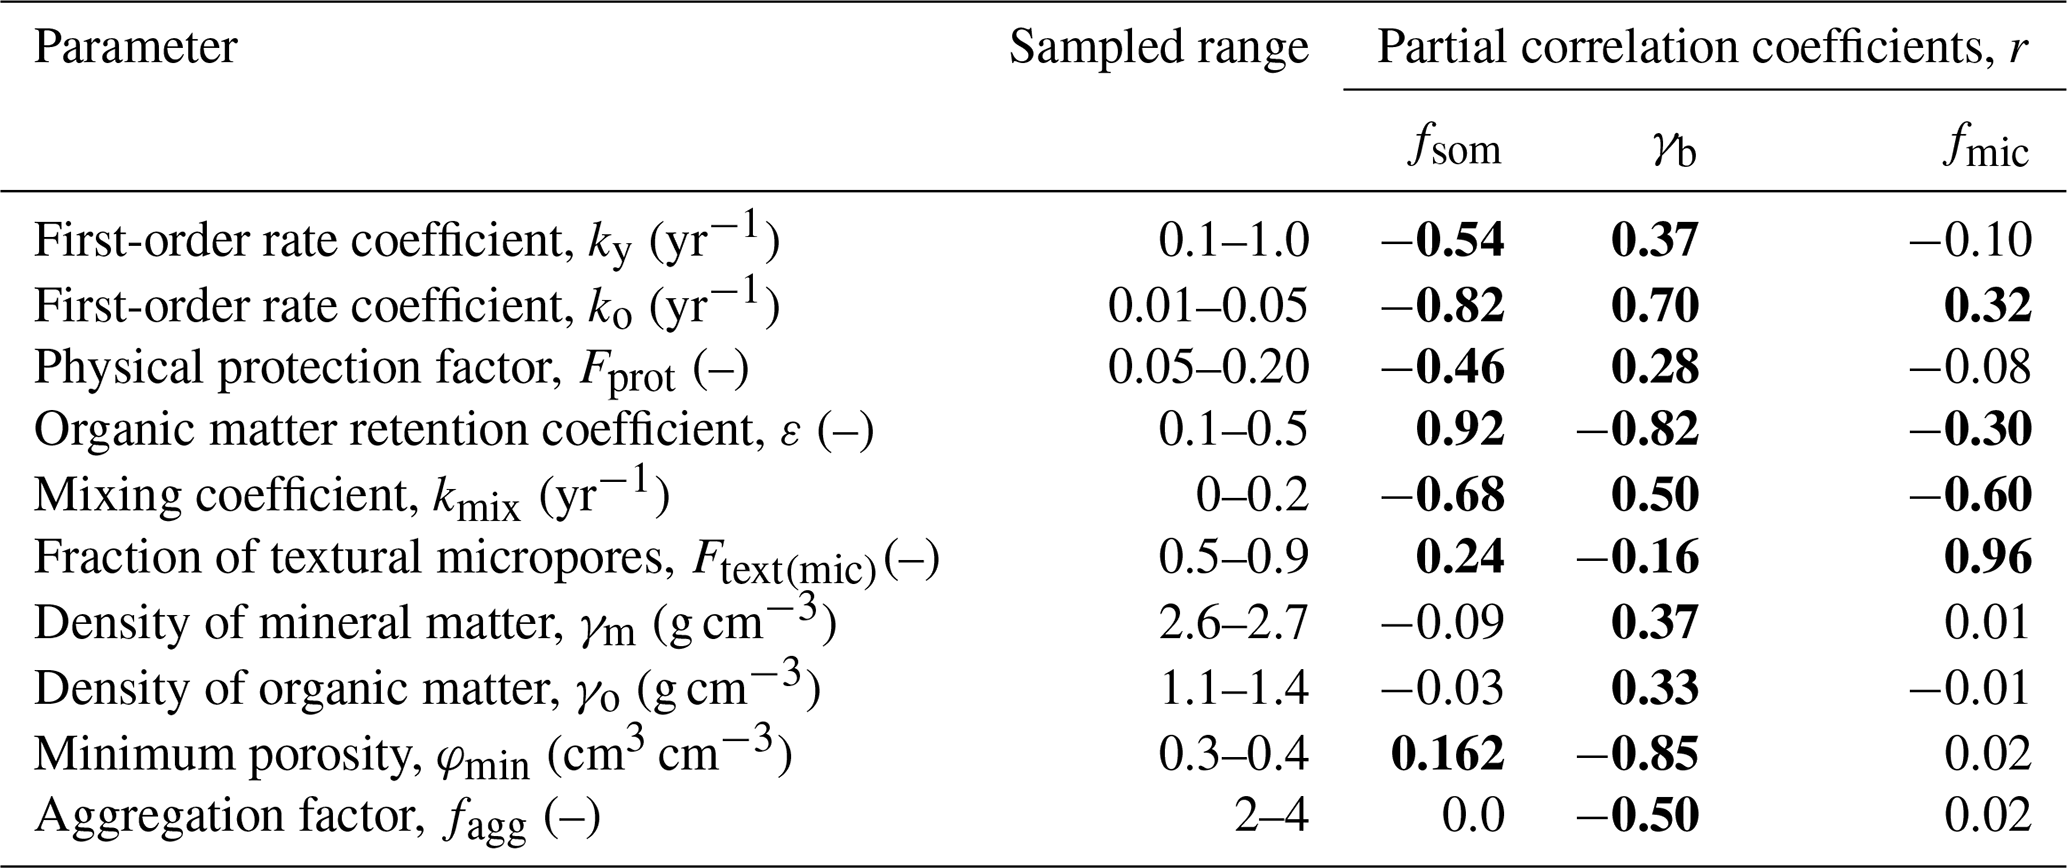
The partial rank correlation coefficients are shown in Table 1. Not surprisingly, the organic matter concentration fsom was most affected by parameters regulating SOM turnover, especially the OM retention coefficient, ε, and the first-order rate coefficient for the microbially processed OM pool, ko. As expected, the physical protection factor, Fprot, was also highly significantly (and negatively) correlated with fsom. Parameters controlling organic matter turnover also strongly affected the simulated bulk density, γb, along with soil physical parameters, especially the aggregation factor, fagg, and the minimum (i.e. textural) porosity, φmin. The pore size distribution, as expressed by the fraction of micropores, fmic, was most sensitive to changes in the micropore fraction of the textural pore space, Ftext(mic) (Table 1). This is encouraging because it is well known that soil texture exerts the most important control on the pore size distribution in soil. The fraction of micropores was also highly significantly (and negatively) correlated with the mixing coefficient, kmix, presumably because this mixing transferred root-derived OM from micropores to mesopores. This is also the reason why the bulk density, γb, and fsom are also strongly correlated with kmix (Table 1), given that OM decomposition rates differ between the pore regions.
3.2 Parameter identifiability
The fact that model parameters are sensitive does not imply that they will be identifiable in a calibration procedure, since their effects on the target outputs may be correlated (e.g. Luo et al., 2017). We therefore investigated the identifiability of the model parameters using synthetic data generated by 50-year forward simulations of the model for two scenarios with different OM inputs, namely a bare fallow scenario with no OM inputs and a scenario with a constant OM input of 0.06 g cm−2 yr−1. As initial conditions, the organic matter pools were set to values in equilibrium with a constant OM input of 0.02 g cm−2 yr−1, giving an initial fsom of 0.03 kg kg−1. Simulated bulk density, γb, soil organic matter concentration, fsom, and the soil microporosity, φmic, were used as target output variables in the calibration. The SOM concentration was assumed to have been sampled every fifth year, while data for bulk density and microporosity were assumed to be available only at the start of the experiment and on two subsequent occasions (after 20 and 50 years). Errors were added to the model-simulated values for all three target output variables to represent measurement and sampling uncertainties due to spatial variability. We calculated these errors assuming 10 replicates per sampling occasion and normally distributed errors with a coefficient of variation of 10 %. The parameter values used to generate the synthetic data are listed in Table 2.
Table 2Parameter values used to generate the synthetic data and the sampled range in the model calibration.
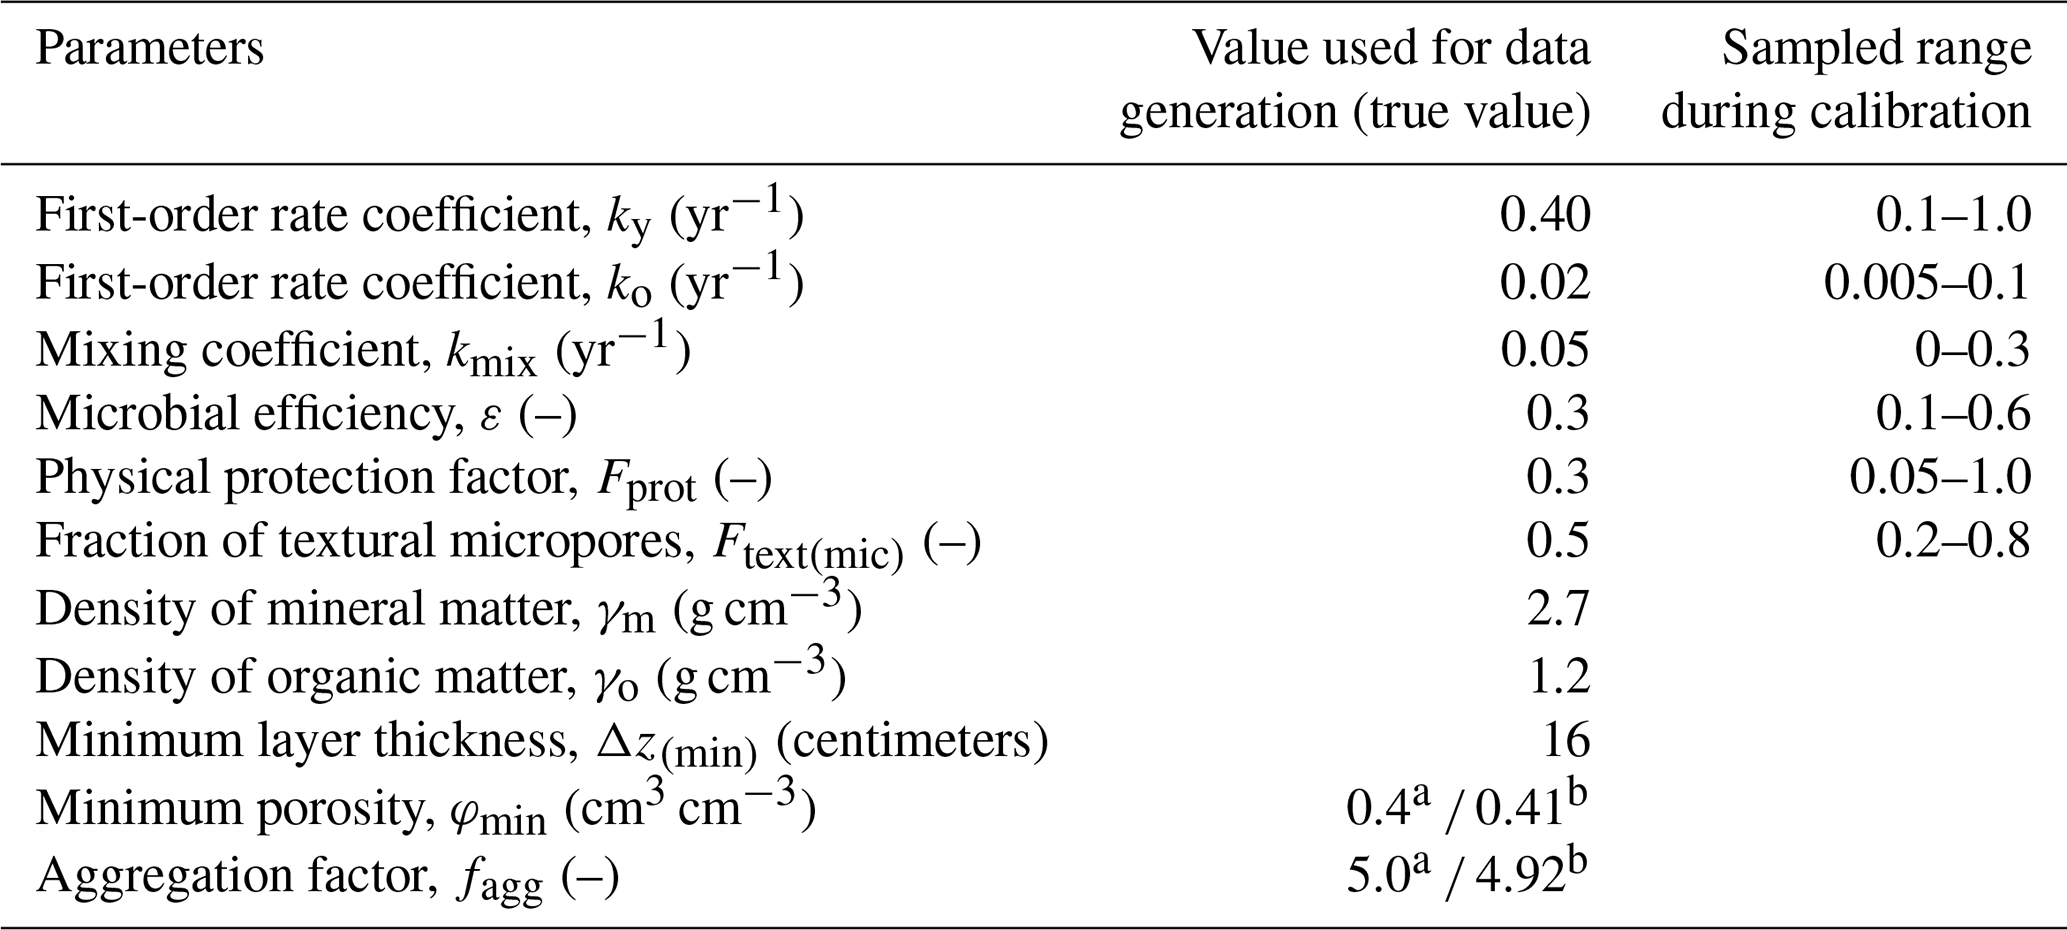
a Used for data generation. b Estimated by regression (Fig. 4) and fixed during calibration.
The model was calibrated against the synthetic data using the Powell conjugate gradient method (Powell, 2009), within given parameter ranges defined by minimum and maximum values (Table 2), and using the sum of squared errors as the goal function. The analysis was repeated 100 times for different initial starting values for the parameters in order to assess the uniqueness of the optimized parameter estimates. Two relatively insensitive parameters, γo and γm (Table 1), were assumed to be known and fixed at their true values (Table 2). Two further parameters were excluded from the calibration, namely the aggregation factor, fagg, and minimum porosity, φmin. Instead, they were fixed a priori by a non-linear least squares regression on the synthetic data generated for bulk density and fsom using Eq. (19; with φmac=0) and known values of γo and γm (Table 2). Optimized parameter sets with goal function values less than 10 % larger than the global optimum (n=36) were considered acceptable (Beven, 2006). Figure 6 shows that the best simulation with the calibrated model closely matched the synthetic data for bulk density, SOM and microporosity. Nevertheless, only three of the six parameters (ε, ko and Ftext(mic)) were identifiable, with values for the 36 best parameter sets limited to narrow ranges around the true values (Fig. 7). This was not the case for the three remaining parameters; optimized values of kmix and ky covered almost the whole tested range, while optimized Fprot values were restricted to roughly half of the sampled range (Fig. 7). As can be seen in Table 3, the mixing coefficient kmix correlated strongly with ky, ko, Fprot and Ftext(mic) but not with ε. The strongest correlations were found between the rate constants ky and ko (r=0.95) and ko and Fprot (). A strong correlation was also found between ε, ky and ko and Fprot.
Table 3Correlation matrix for parameter estimates for the 36 best parameter sets of 100 calibration runs against synthetic data for soil bulk density, SOC and microporosity (Fig. 6). Values highlighted in bold show a significant correlation (p<0.01).
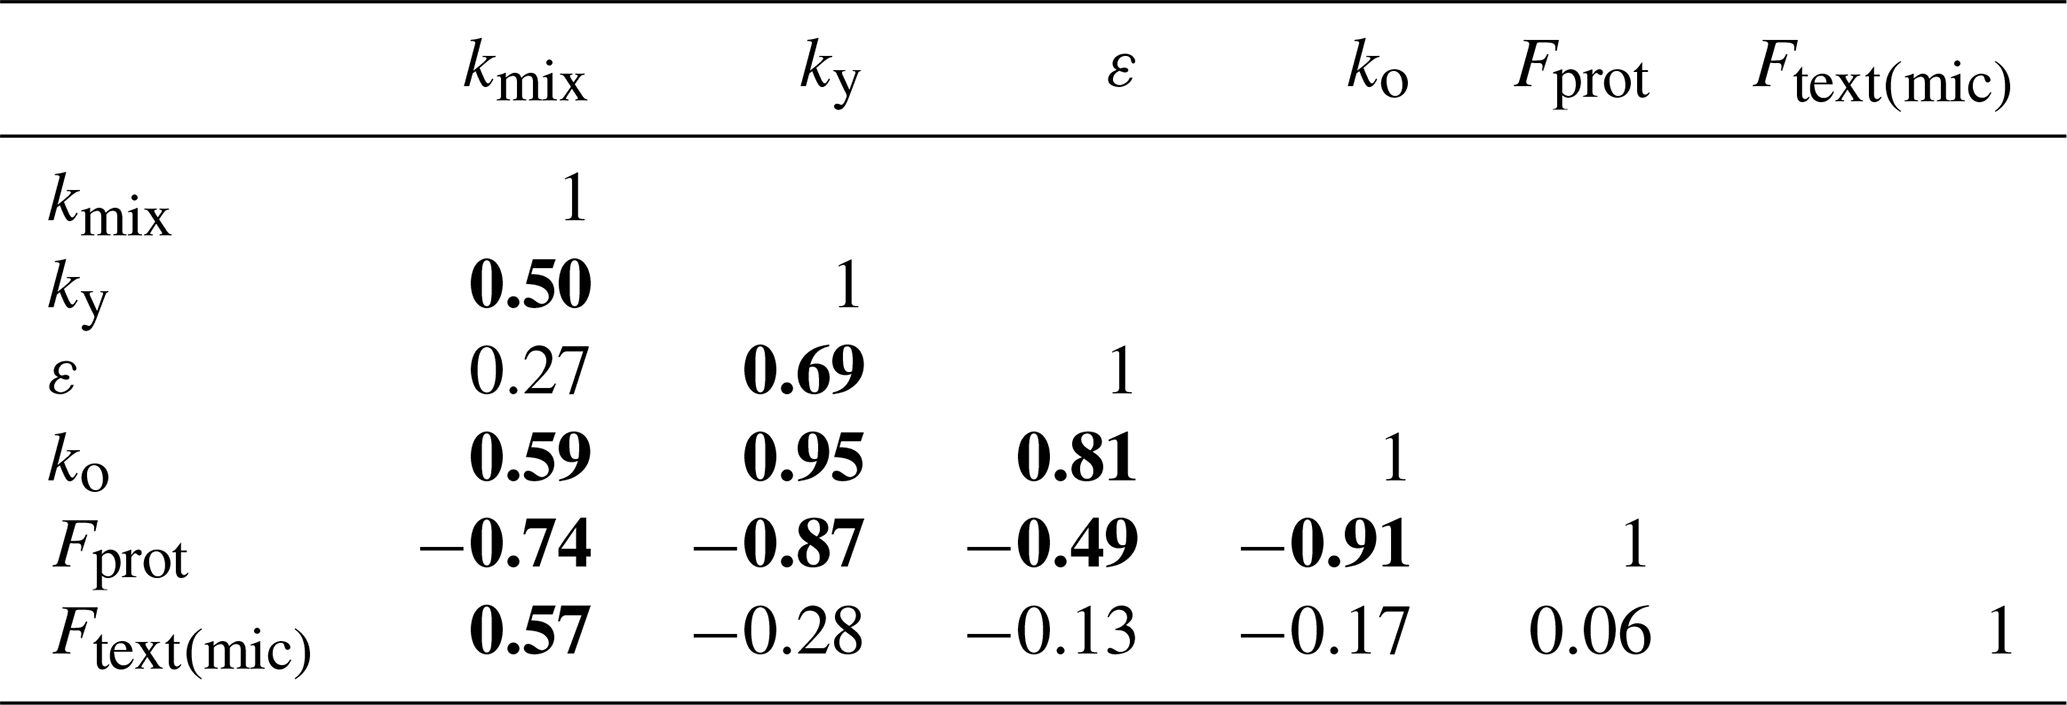
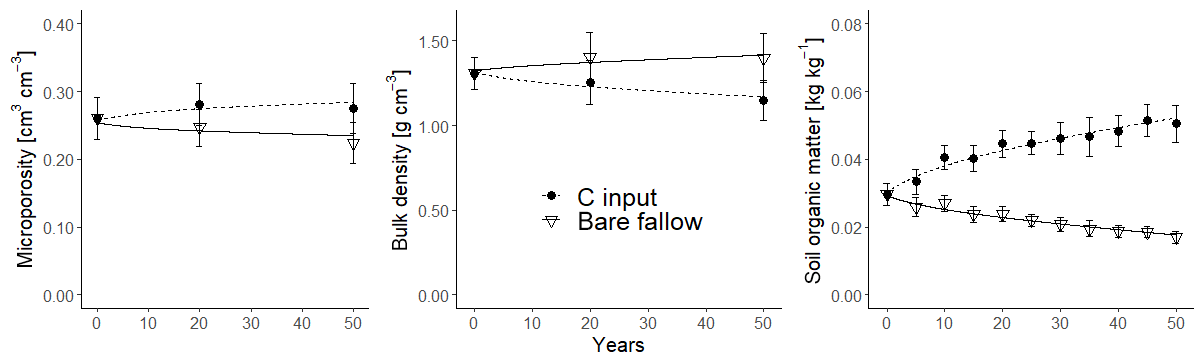
Figure 6Synthetic data (symbols; bars show standard deviations) for microporosity, bulk density and soil organic matter concentration and model simulations (lines) after calibration.
3.3 Model evaluation with data from a long-term field trial
3.3.1 Field measurements at the Ultuna frame trial
The model was tested against data from the Ultuna long-term soil organic matter experiment in Uppsala, Sweden (59.82∘ N, 17.65∘ E; Kirchmann et al., 1994; Witter, 1996; Herrmann and Witter, 2008; Kätterer et al., 2011). The climate is cold temperate and subhumid, with an annual mean air temperature of 6.3 ∘C and a mean annual precipitation of 554 mm (1981–2014). The experiment was started in 1956 at the Swedish University of Agricultural Sciences in order to investigate the long-term effects of mineral N fertilizers and different organic amendments on crop yields, soil organic matter concentrations and soil physical properties. The soil texture in the uppermost 20 cm is clay loam (37 % clay, 41 % silt and 22 % sand).
Of the 15 treatments included in the experiment, the following three were chosen for model testing: a bare soil treatment (bare fallow) that has received neither mineral N fertilizer nor any organic amendments since the beginning of the experiment and two other treatments receiving no mineral N fertilizer but 4 t ha−1 C as organic amendments every second year in the form of green manure and animal manure respectively. All three treatments receive P and K fertilizer (20 and 38 kg ha−1 yr−1) and are annually dug by hand, with the organic amendments mixed into the soil to a depth of 20 cm. The organic amendments were added irregularly at the beginning of the experiment, i.e. in 1956, 1960 and 1963, but have since been supplied every second year. Maize has been grown exclusively on all the cropped plots since 2000. Before 2000, the crop rotation included a sequence of barley, oats, beets (excluded after 1966) and occasionally rape. Samples for the measurement of SOC were taken after the harvest of the crops every second year. The three selected treatments show contrasting temporal trends in SOC during the 63 years of the experiment. While SOC concentrations have decreased steadily in the bare fallow treatment, they are still increasing in the plots fertilized with animal manure. The addition of green manure led to a slight increase in SOC concentrations during the first 10–15 years of the experiment, followed by a period of approximately steady-state conditions and then a slight decline in SOC concentrations on the most recent sampling occasions. Soil bulk density was measured occasionally, i.e. in 1956, 1975, 1991 (Kirchmann et al., 1994), 1993 (Gerzabek et al., 1997), 1997 (Kirchmann and Gerzabek, 1999), 2009 (Kätterer et al., 2011) and in 2019 (this study). Kätterer et al. (2011) also reported measurements of relative surface elevation in 2009, which we utilize as additional validation data. Of the three treatments, the bare fallow plots show the largest bulk densities and the animal manure treatments the smallest. Information on the soil pore size distribution was provided by the water retention curves measured on samples taken in the uppermost 10 cm of soil on three different sampling occasions. As soil water retention was not measured at the start of the experiment, we made use of measurements made in 1969 (13 years later) on samples taken from just outside the experimental plots (Wiklert et al., 1983) to initialize the model. Soil water retention was also measured on four replicate undisturbed core samples taken from the three treatments in 1997, 41 years after the start of the experiment (Kirchmann and Gerzabek, 1999), and on eight replicate samples taken in 2019, although on this occasion they were only sampled from the animal manure and bare fallow treatments.
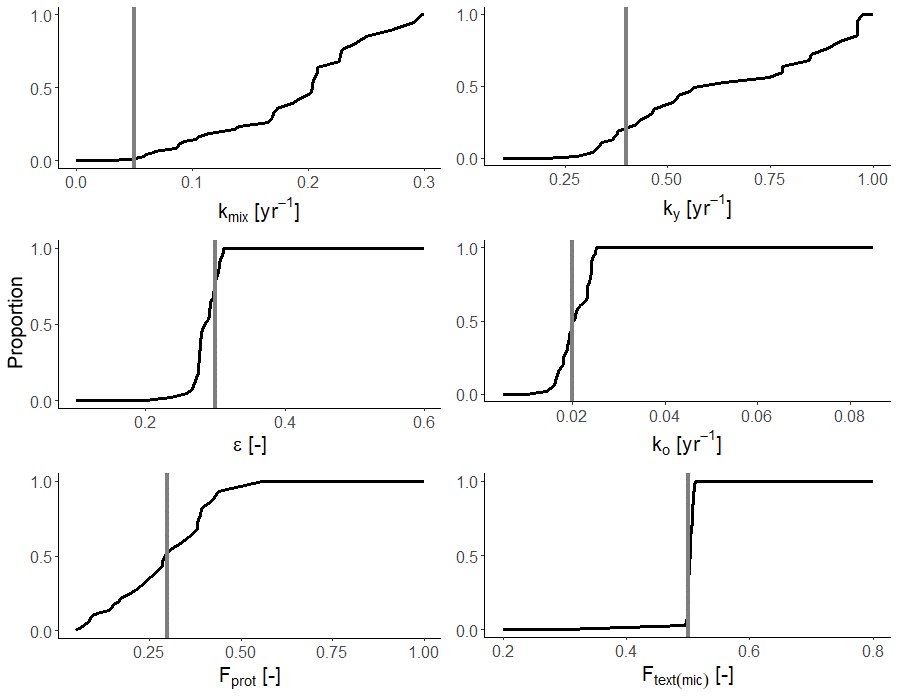
Figure 7Cumulative frequency distributions of parameter estimates for the 36 best parameter sets of 100 calibration runs against synthetic data for soil bulk density, SOC and microporosity. The grey lines mark the true values used to generate the synthetic data.
3.3.2 Parameterization and calibration
The model was simultaneously calibrated against data from the bare fallow and animal manure treatments using the measurements of average soil bulk density and SOC concentrations in the uppermost 20 cm of soil and the microporosity estimated from soil water retention curves, assuming a value for the maximum pore diameter of micropores of 5 µm (equivalent to a pressure head ψmic∕mes of −600 cm). A factor of 0.5 (Pribyl, 2010) was used to convert simulated SOM to measured SOC concentrations. We simulated a soil profile consisting of five soil layers, each initially 4.5 cm in thickness. The model equations were solved explicitly by Euler integration at an annual time step. A spin-up phase of 5000 years with constant root-derived OM input was included to initialize the four SOM pools at a steady-state condition. During the 63-year experimental period, annual average OM inputs from roots and above-ground crop residues were used in the model. Following Kätterer et al. (2011), these were calculated for each treatment from annual yield data and the crop-specific root allocation coefficients reported by Bolinder et al. (2007). The root-derived input of OM to the simulated soil profile was calculated from an assumed root distribution estimated with a Michaelis–Menten-type function (Kätterer et al., 2011) and distributed uniformly among the soil layers. The organic amendments (8 t OM ha−1 every other year in both the animal and green manure treatments) were assumed to be uniformly distributed within the 20 cm depth of soil hand dug by hand. This means that some of this added OM becomes incorporated into the subsoil below 20 cm (i.e. the depth of digging) if soil layer thicknesses increase (and bulk density decreases) due to an increase in SOM concentration (see Eq. 12).
Table 4Fixed parameters and range of parameter values included in the calibration, and the final parameter estimates after calibration. The range of the best fit parameter values for the calibration runs with goal function values no more than 5 % larger than the value for the best simulation (n=85) is given within parenthesis.
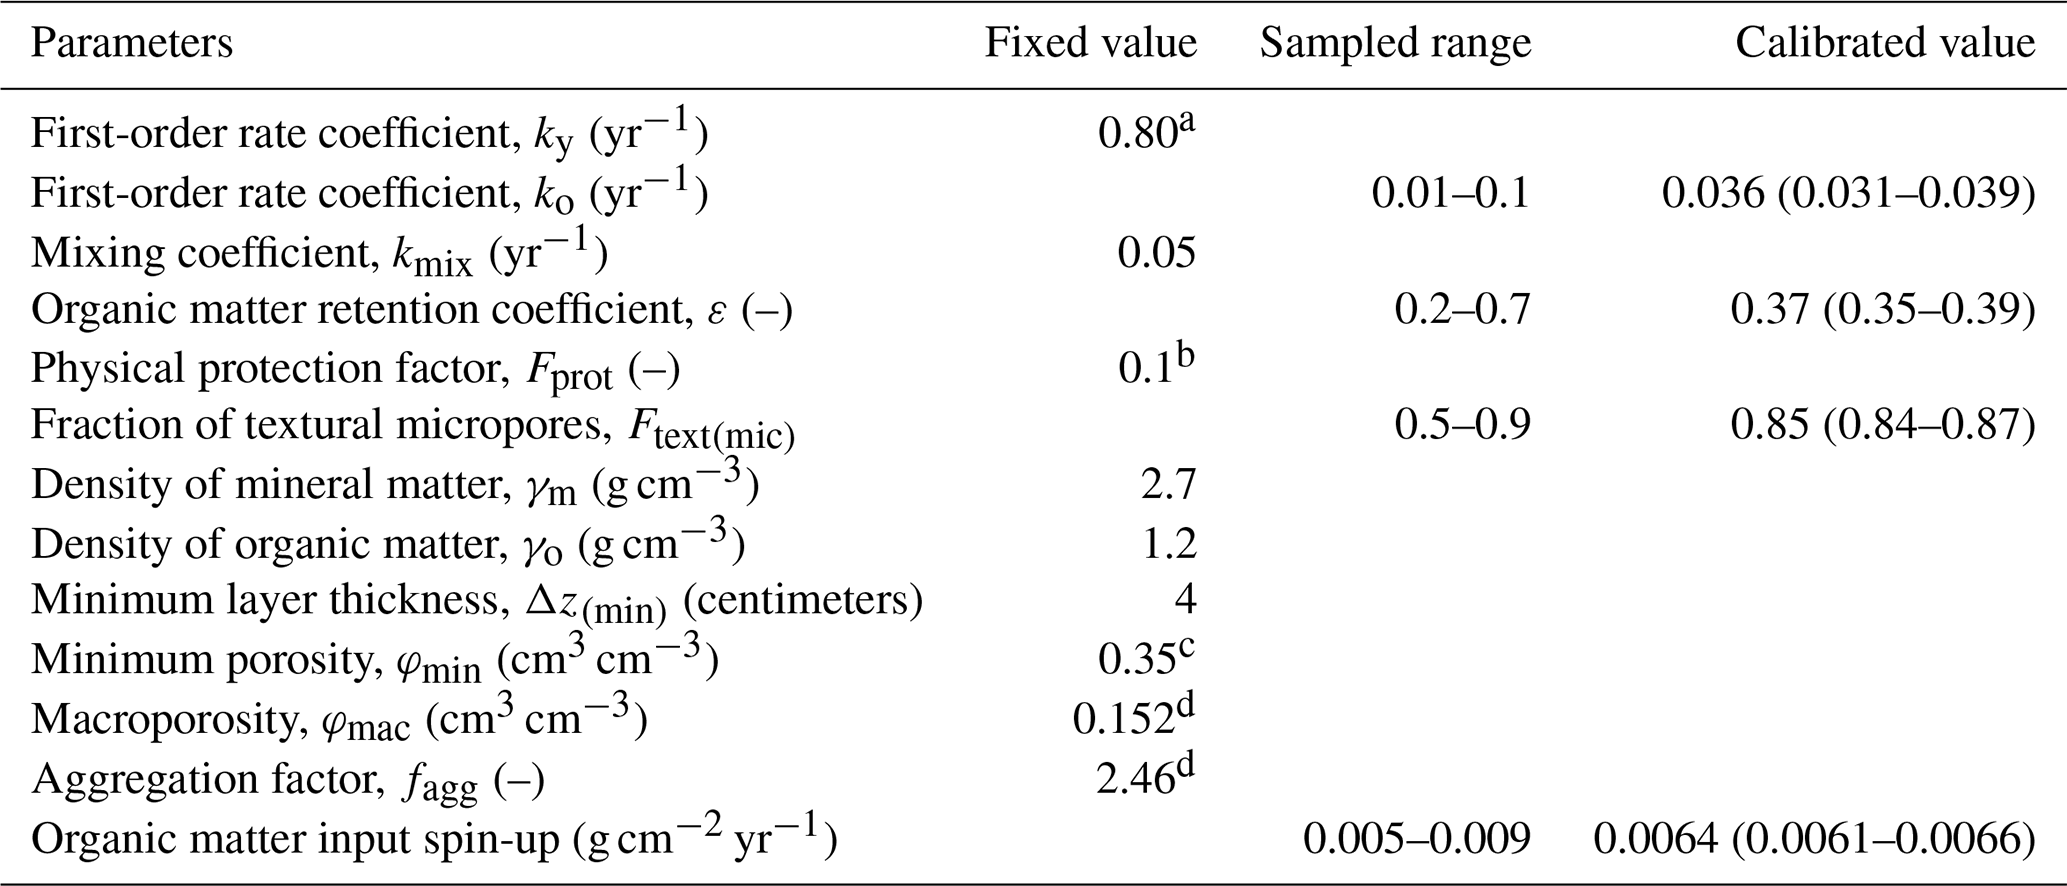
a Andrén and Kätterer (1997), b Kravchenko et al. (2015), c Nimmo (2013) and d Fig. 4.
Based on the results of the sensitivity analysis and model calibration against the synthetic data, we decided to calibrate only the following four parameters, namely the ones that we expected to be clearly identifiable: the input of organic matter during the spin-up period, the fraction of micropores in the textural pore region Ftext(mic), the OM retention coefficient ε and the first-order rate coefficient for microbially processed organic matter, ko (Table 4). Values for φmac and fagg were estimated using Eq. (19) from non-linear regression between bulk densities and SOM concentrations, assuming a value of φmin of 0.35 cm3 cm−3 (Nimmo, 2013), and including data from all three of the treatments (i.e. bare fallow, animal and green manure; Fig. 4). Similarly, van Genuchten's n was fixed to a value (=1.073) obtained from a simultaneous fit of Eq. (26) to the water retention data measured in 2019 in the fallow and animal manure treatments. The remaining parameters were determined a priori because they were less well identified in the calibration against the synthetic data. Given that the micropore region comprises pores smaller than 5 µm in diameter, we set the physical protection factor Fprot to 0.1, a value which lies within the range observed in the experiments described by Kravchenko et al. (2015). Following Andrén and Kätterer (1997), we assumed ky=0.8 yr−1. Estimating the mixing coefficient kmix is problematic because it is highly sensitive for all target outputs (Table 1) but not identifiable by calibration (Fig. 7). From preliminary simulations, we also concluded that kmix must be set to a much smaller value in the spin-up period than during the 63-year experimental period in order to avoid obtaining unrealistically large calibrated estimates of the OM input prior to the experiment. A smallerkmix value during the spin-up period presumably reflects the crop rotation practised at the site prior to the experiment, which included frequent grass leys, so that the soil was tilled less often. For the sake of simplicity, we set kmix to zero during the spin-up period and to 0.05 yr−1 during the experiment. This gave a calibrated value of the OM input during the spin-up period (0.0064 g cm−2 yr−1; Table 4) that is similar to the root OM input estimated for the green manure and animal manure plots during the experiment (0.0061 and 0.0071 g cm−2 yr−1 respectively).
The calibration method was the same as described earlier for the synthetic data set. The calibrated model was then applied to the green manure treatment by running a forward simulation, using the calibrated parameter values and the treatment-specific OM inputs. Again, a spin-up period of 5000 years was run in order to bring the SOM pools and total organic matter concentration to an initial steady-state condition. The goodness of fit of the model simulations was evaluated by three criteria, i.e. the Pearson correlation coefficient r, the root mean squared error (RMSE) and the mean absolute error (MAE; Eqs. 28 to 30). While r is a measure of the strength of the relationship between the observations and simulations, with a value of 1 showing a perfect positive linear relationship and a value of −1 showing a perfect negative linear relationship, RMSE and MAE measure the average magnitude of the error between observations and simulations. Both of them vary from zero to unity, with smaller values representing a better agreement. However, for the RMSE the errors are squared before averaging, which gives comparatively greater weight to larger errors.
where y and represent the observations and simulation results respectively, cov is the covariance, σy and are the standard deviations of y and , e is the model error, i.e. y-, and n is the number of observations. The analyses were carried out with R (version 3.5.1; R Core Team, 2018) using the openxlsx (Walker, 2019) and plyr (Wickham, 2011) packages.
Table 5Goodness of fit of the model simulations to observed bulk density and soil organic carbon concentration. Note: r – correlation coefficient, RMSE – root mean squared error and MAE – mean absolute error.
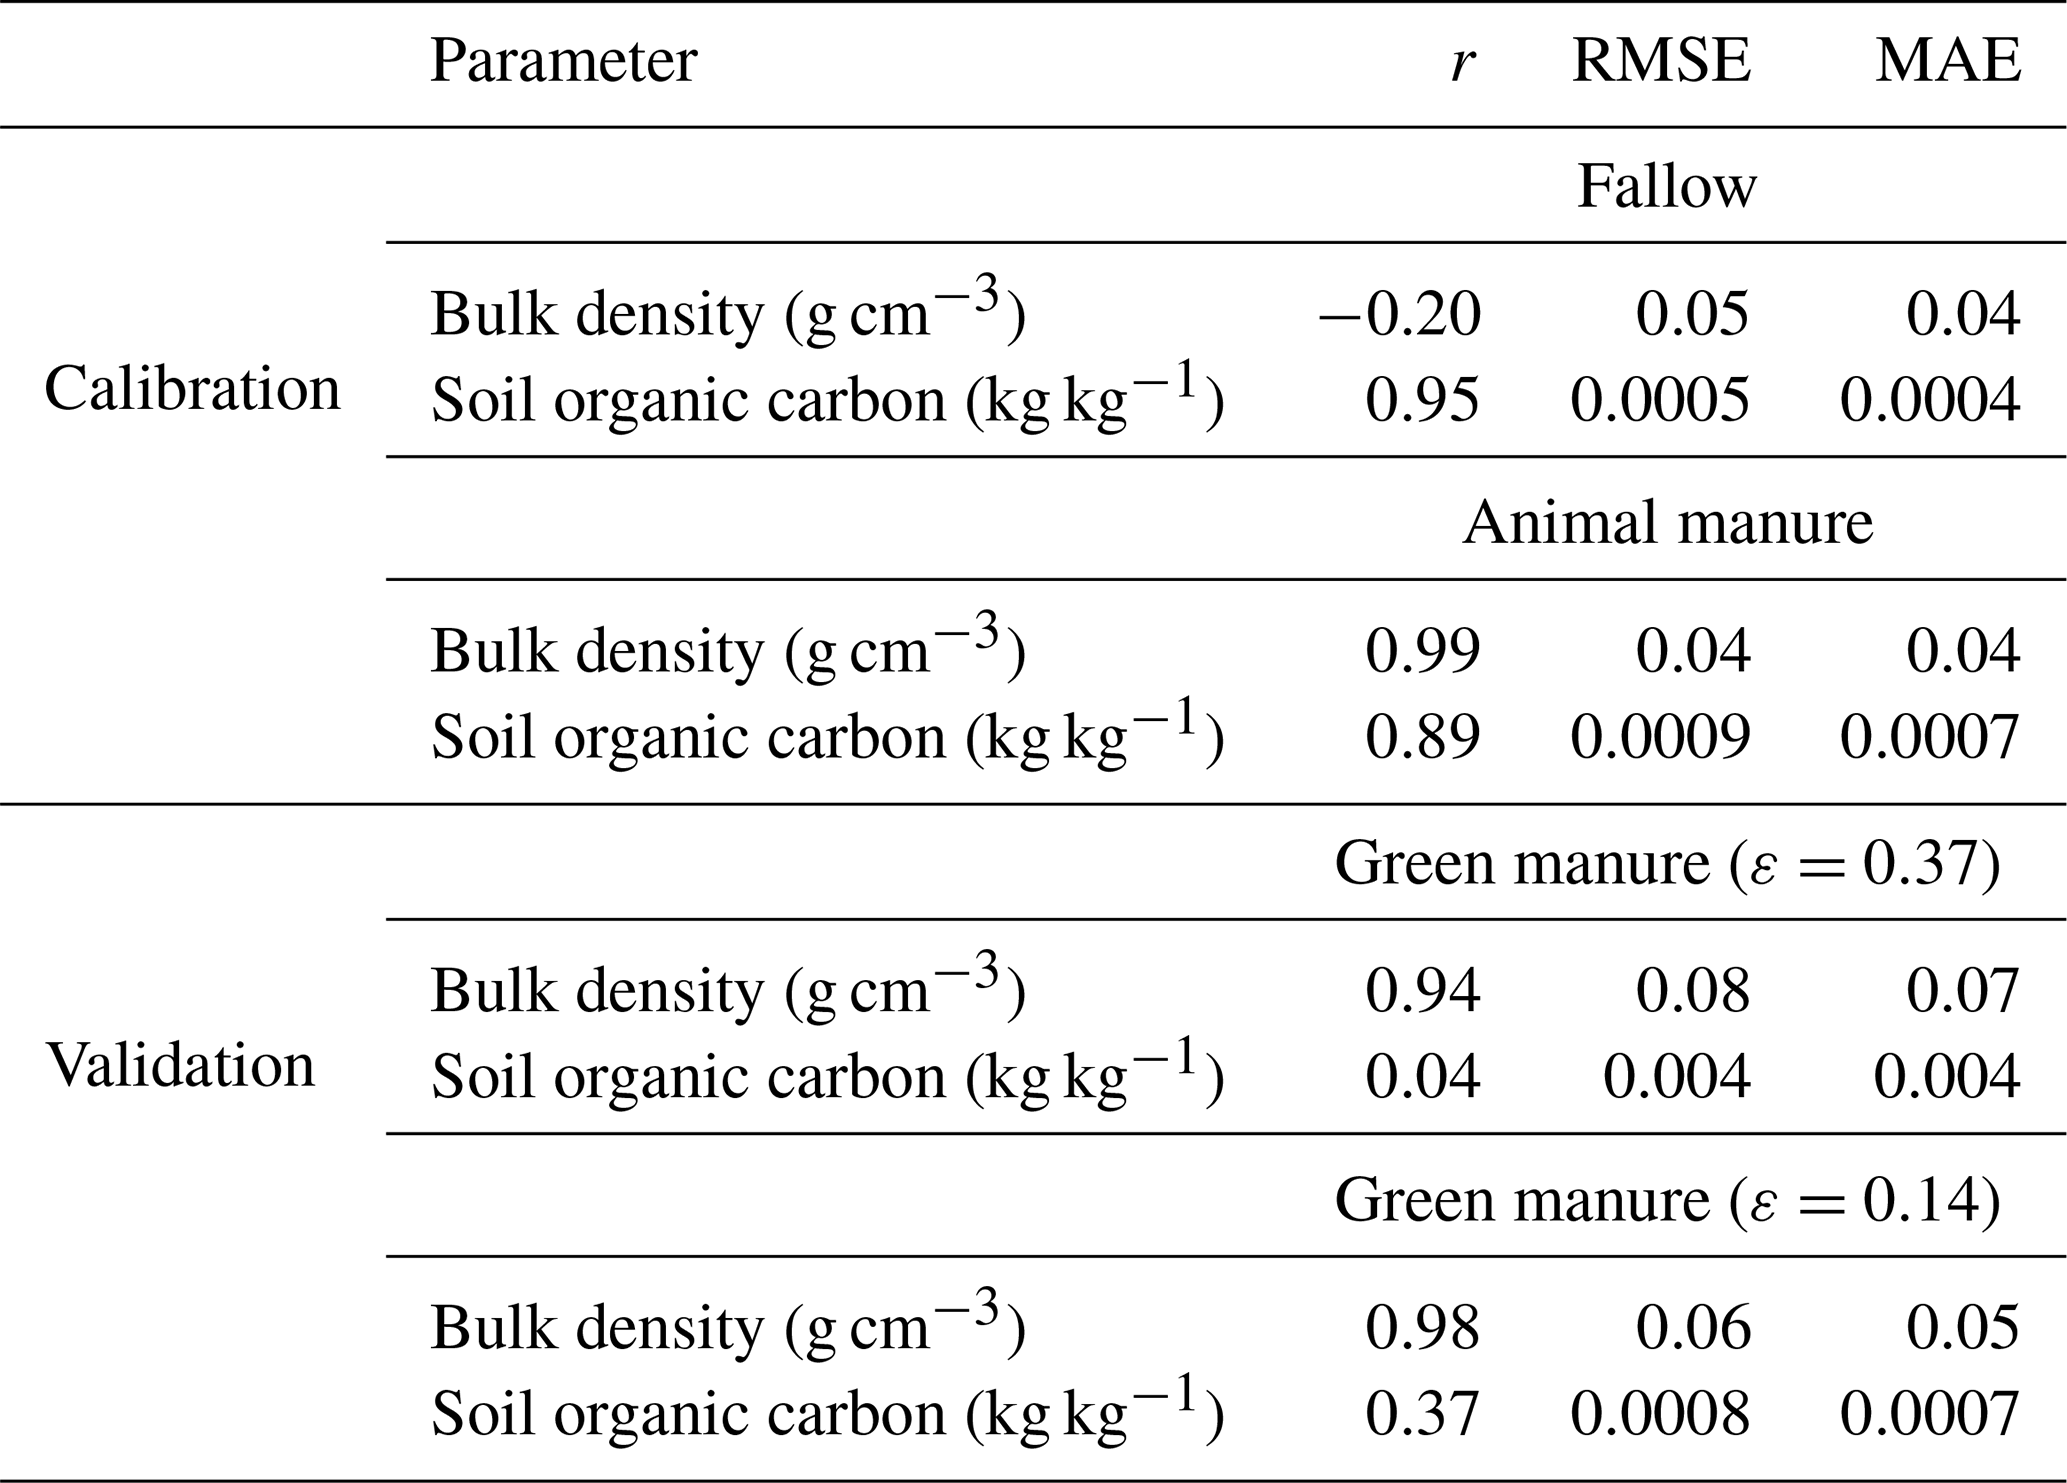
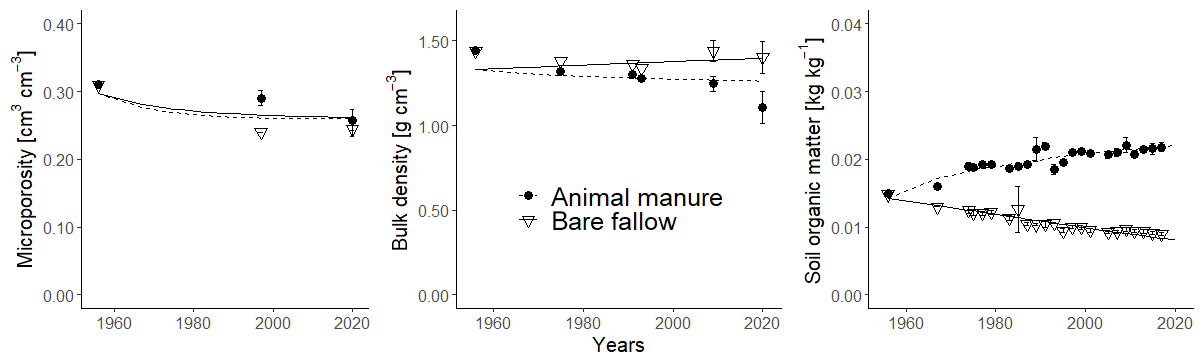
Figure 8Observed (symbols; bars show standard deviations) and simulated (lines) microporosity (cm3 cm−3), bulk density (g cm−3) and soil organic carbon concentration (kg kg−1) for the fallow and animal manure treatments.
Figure 8 and Table 5 show that the calibrated model accurately matched the trends observed in soil organic carbon in the bare fallow and animal manure treatments. The data suggests that the soil bulk density increased in the bare fallow treatment during the experiment, whereas it decreased in the animal manure treatment. These trends were also reasonably well described by the model (Fig. 8; Table 5). As the soil organic carbon content was accurately simulated, the somewhat poorer match sometimes found between the model predictions of bulk density and the measurements reflects, to a large extent, the unexplained variation in the relationship between γb and fsom (Eq. 19). In this respect, it is likely that the macroporosity, and therefore the bulk density, at the time of sampling in autumn may vary from year to year, depending on the way the topsoil was dug and the soil conditions at the time of cultivation. Kätterer et al. (2011) found that the elevation of the soil surface in the plots treated with animal manure was 2.6 cm higher relative to the bare fallow plots in 2009. In comparison, the model predicted a difference in the elevation of the soil surface of 2.7 cm between the two treatments in the same year (2009). The optimized values of the four calibrated parameters (Table 4) are very well constrained and also appear reasonable. The calibrated value of Ftext(mic) (i.e. the fraction of textural pores smaller than 5 µm) was 0.85 (Table 4). Calculations with the Arya and Heitman (2015) model, based on particle size distribution data from the site (Kirchmann et al., 1994), give a predicted value for Ftext(mic) of 0.9, which is in excellent agreement with the estimate from model calibration.
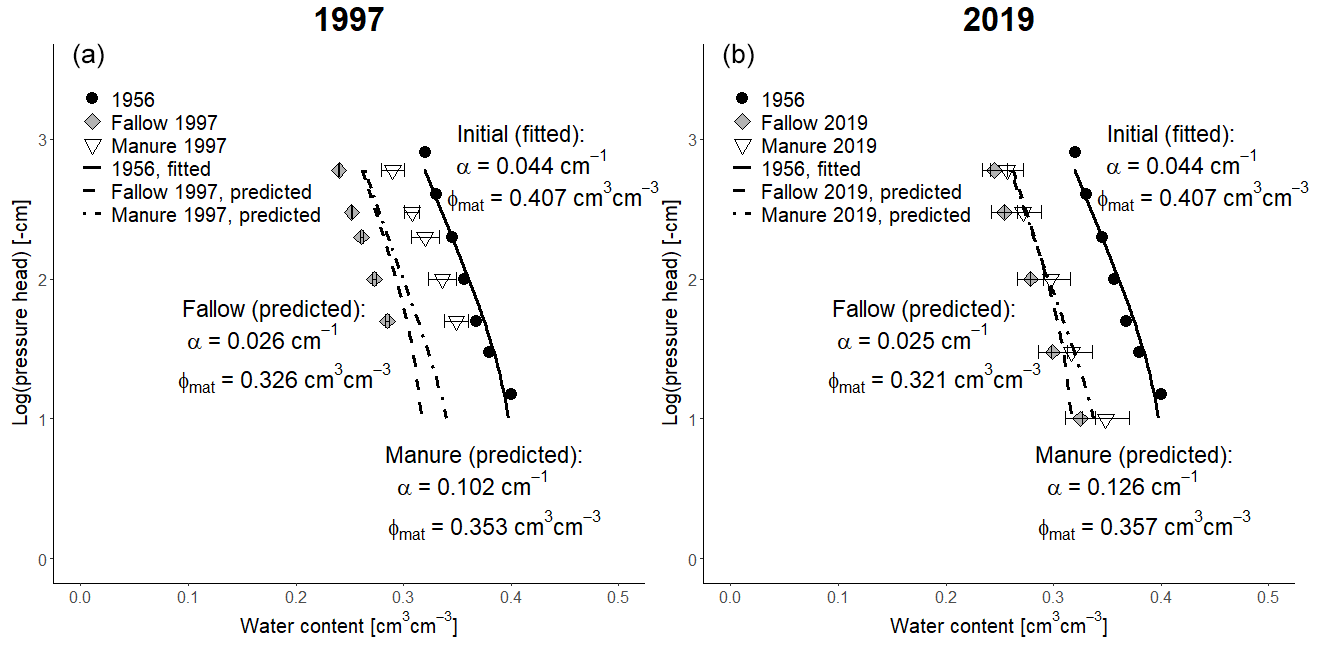
Figure 9Observed (symbols; bars show standard deviations) and simulated (dashed and dotted lines) soil water retention curves in the fallow and animal manure treatments using Eqs. (26) and (27). (a) Measurements taken in 1997, and (b) the measurements taken in 2019. The measurements used as the initial condition in 1956 are also shown, together with a fitted curve. Van Genuchten's n was fixed at 1.073 for all water retention curves.
Figure 9 shows a comparison of the water retention curves measured in 1997 and 2019 and the corresponding model predictions using Eqs. (26) and (27), alongside the measurements utilized as an initial condition in 1956. The model accurately matched the data in 2019 for both treatments (Fig. 9). However, although the shapes of the water retention curves measured in 1997 were also successfully reproduced, the measured matrix porosity differed significantly between the treatments in 1997, and this difference could not be matched by the model (Fig. 9). It is unclear whether this discrepancy can be attributed solely to model error. Spatial variability in the field may also have played a significant role, since only four replicate core samples were taken in 1997. Regardless of the reason for the discrepancy, the results suggest that it should be a reasonable assumption to hold the parameter n in van Genuchten's (1980) equation constant in dynamic models of soil matrix hydraulic properties. Figure 9 shows that whilst n is fixed, van Genuchten's (1980) α increased in the manure treatment, reflecting an improvement in structure, and decreased in the bare fallow, indicating structural degradation. The soil microporosity apparently decreased during the experiment in both treatments, while the mesoporosity remained largely unchanged in the fallow plots and only increased slightly in the manured treatment (Figs. 8 and 9). The model simulations suggest some possible explanations for these results, which are surprising at first. In the case of the bare fallow plots with no OM input, we might expect physical protection to lead to a slower decline in the organic matter stock in the micropore region compared with the mesopore region (and thus an increase in the proportion of micropores). However, the bare fallow soil was tilled every year. The simulation results (Fig. 10) suggest that this leads to a homogenization of the OM distribution in soil, with a net transfer of OM from the micropore region to the mesopores at a rate that exceeds the difference in decomposition rates between the pore regions. In the case of the manured plots, the stock of OM in the micropore region decreases in the model as a result of the significant increase in tillage intensity at the onset of the experiment, despite the large increase in the OM input as the manure is input solely to the mesopore region (Fig. 10). Furthermore, a successively smaller proportion of the root OM is added to the micropores as the aggregation mesopore volume increases (Eq. 3).

Figure 10Simulated temporal development of young undecomposed (Y) and older microbially processed (O) organic matter (kg m−2) stored in meso- and microporous regions in the bare fallow (a) and manure (b) treatment.
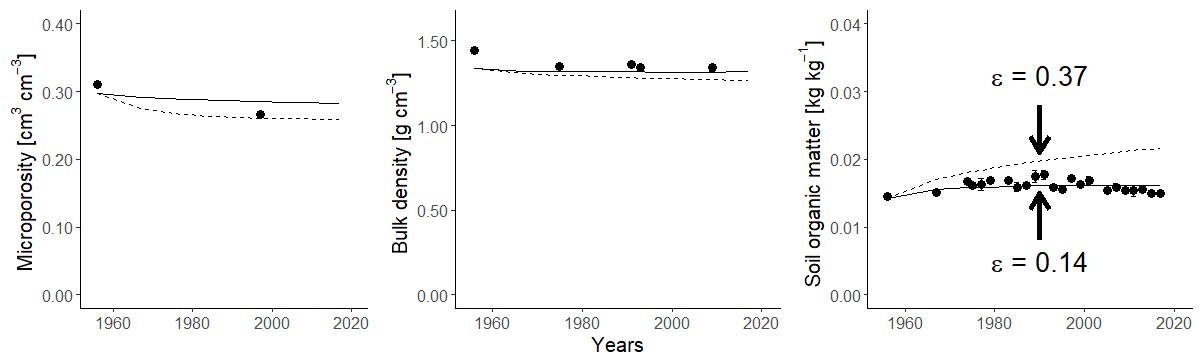
Figure 11Observed (symbols; bars show standard deviations) and simulated (lines) microporosity (cm3 cm−3), bulk density (g cm−3) and soil organic carbon concentration (kg kg−1) for the green manure treatment for two different values of the OM retention coefficient, ε.
3.3.3 Model testing using data from the green manure treatment
The model predictions for the green manure treatment tended to underestimate bulk density, whilst clearly overestimating SOC concentrations (Fig. 11). The model predicted a steady increase in SOC throughout the experiment, which was not observed in the field. As the animal and green manure treatments only differ slightly in the amount of C provided by roots and straw, the significant difference in SOC concentrations must be related to differences in the quality of the organic amendments. We therefore recalibrated ε using the data from the green manure treatment, keeping all other parameters fixed at the values obtained from the calibration against the other two treatments. The resulting calibrated value for ε was 0.14, which significantly improved the fit of the model to the data for both SOC and bulk density (Fig. 11; Table 5). The difference in the elevation of the soil surface between the green manure plots and the bare fallow plots measured by Kätterer et al. (2011) in 2009 (=1.4 cm) was also accurately simulated by the model (=1.6 cm). The smaller value of ε in the green manure treatment implies that less of the supplied OM is retained in the soil compared to the organic matter added to the soil as animal manure. This finding is supported by several previous studies that have analysed data from this experiment with different approaches (e.g. Witter, 1996; Paustian et al., 1992; Hyvönen et al., 1996; Andrén and Kätterer, 1997; Herrmann, 2003). Many studies have shown that the quantity and quality of organic amendments can strongly affect SOC turnover rates by altering the biomass, composition and activity of the soil microbial community (e.g. Blagodatskaya and Kuzyakov, 2008; Dignac et al., 2017). Herrmann et al. (2014) showed that, despite similar levels of microbial activity measured by heat dissipation, the soil from the green manure treatment had a significantly larger CO2 production for the same energy input than the soil from the plots receiving animal manure.
We presented a new model that describes, for the first time, the dynamic two-way interactions between SOM, soil pore space structure and soil physical properties. In this study, we tested the model against data taken from plots with contrasting OM inputs in a long-term field trial in Ultuna, Sweden. In a bare fallow treatment, the bulk density increased and soil profile thickness decreased as the SOC concentration decreased during the experiment, while the opposite trends were observed in plots amended with animal manure. Small changes were also detected during the experiment in the matrix pore size distribution (i.e. the shape of soil water retention curve). Our relatively simple model concept to couple organic matter storage and turnover with soil pore space structure was able to satisfactorily simulate these changes in SOC stocks and soil properties resulting from the contrasting OM inputs.
A form of the simple two-pool ICBM model (Wutzler and Reichstein, 2013) is obtained if the interactions between organic matter and soil structure are removed from our model. Successful applications of the ICBM model to the data from the Ultuna frame trial have already been published by Juston et al. (2010), for data available until 2007, and by Poeplau et al. (2015), for data until 2013. Although we do not show the results here, ICBM matches the SOC data until 2019 for the manure and bare fallow treatments almost as well as the model described here (RMSE values are slightly larger than those shown in Table 5), albeit with different parameter values. The retention efficiency ε is similar (0.35 vs. 0.37) but ko is much smaller (0.015 vs. 0.036 yr−1), since physical protection is not modelled explicitly. However, in principle, for the same parameterization, the predictions of our model must diverge from those of ICBM for treatments with contrasting organic matter input rates. This is because ICBM is strictly a first-order kinetic model, such that steady-state soil organic matter contents are linearly dependent on the input. In contrast, in a similar way to earlier models based on concepts of carbon saturation (e.g. Hassink and Whitmore, 1997; Stewart et al., 2007), the extended model described and tested here, which explicitly incorporates two-way soil structure–SOM interactions, does not show such a linear response. This non-linearity of the response of steady-state OM contents to OM inputs becomes stronger as the mixing between the pore regions becomes weaker.
Even though it may be possible to satisfactorily calibrate a simple OM model such as ICBM to the time series of OM measurements at one particular site, a model that explicitly incorporates soil structure–OM feedbacks has some important advantages. For example, it potentially enables direct (forward) simulations of the effects of soil structure and physical protection on OM turnover in contrasting soil types (e.g. sand vs. clay) without having to resort to recalibrating model parameters describing OM turnover for each soil, as was done, for example, by Poeplau et al. (2015). In our model, some of the key parameters controlling physical protection can, in principle, be determined a priori from measurements. Thus, ømin and fagg can be derived from paired data on soil organic matter contents and bulk density (Eq. 19), while Ftext(mic) can be calculated from particle size distributions (e.g. Arya and Heitman, 2015). In principle, our model also has a broader range of potential management applications. For example, it could be used to simulate the effects of contrasting tillage systems or faunal bioturbation on SOM dynamics and sequestration potential.
The model currently neglects some processes that may be important for determining the long-term storage of organic carbon in soil under changing environmental conditions, such as the interactions of organic carbon with mineral phases in soil and the regulation of decomposition rates by both abiotic factors (i.e. soil temperature and moisture) and the biomass and the community composition and activity of microbial populations (Dignac et al., 2017). Moreover, organic matter inputs to the macropores, either by root ingrowth (Pankhurst et al., 2002) or the incorporation of surface litter by earthworms (e.g. Don et al., 2008), and its subsequent turnover are not considered in the model. Extending the model to account for these processes would be feasible, but it would require more comprehensive data to ensure effective and reliable results from model calibration. The model described here could also be further developed towards a more complete coupled model of soil structure dynamics and soil processes by accounting for the dynamic effects of other physical (e.g. tillage and/or traffic and swelling and shrinkage) and biological processes (e.g. root growth and faunal activity) on soil pore space properties and OM turnover. It should also be worthwhile to incorporate our model approach into more comprehensive models of the soil–crop system that integrate descriptions of hydrological processes, carbon and nutrient cycling and crop growth. Such a next-generation soil–crop modelling tool should prove useful in supporting a wide range of analyses related to the long-term effects of land use and climate change on SOM dynamics, soil hydrological processes and crop production.
The model and the data will be made available upon request.
The supplement related to this article is available online at: https://doi.org/10.5194/bg-17-5025-2020-supplement.
NJ set up the project and developed the model based on discussions with EC, KHEM, AMH, TKä, CC and TKe. KHEM analysed the data. DNS ran the sensitivity analysis, and KHEM ran the calibrations. NJ and KHEM wrote a first draft of the paper. CC, EC, AMH, TKe, TKä and DNS reviewed and edited the paper.
The authors declare that they have no conflict of interest.
This work was funded by the Swedish Research Council for Sustainable Development (Formas) as part of the “Soil structure and soil degradation: improved model tools to meet sustainable development goals under climate and land use change” project (grant no. 2018-02319).
This research has been supported by the Swedish Research Council for Sustainable Development (Formas; grant no. 2018-02319).
This paper was edited by Andreas Richter and reviewed by three anonymous referees.
Adams, W. A.: The effect of organic matter on the bulk and true densities of some uncultivated podzolic soils, J. Soil Sci., 24, 10–17, 1973.
Ahrens, B., Braakhekke, M., Guggenberger, G., Schrumpf, M., and Reichstein, M.: Contribution of sorption, DOC transport and microbial interactions to the 14C age of a soil organic carbon profile: Insights from a calibrated process model, Soil Biol. Biochem., 88, 390–402, 2015.
Andrén, O. and Kätterer, T.: ICBM: the introductory carbon balance model for exploration of soil carbon balances, Ecol. Appl., 7, 1226–1236, 1997.
Angst, Š., Mueller, C., Cajthaml, T., Angst, G., Lhotáková, Z., Bartuška, M., Špaldoňová, A., and Frouz, J.: Stabilization of soil organic matter by earthworms is connected with physical protection rather than with chemical changes of organic matter, Geoderma, 289, 29–35, 2017.
Arya, L. and Heitman, J.: A non-empirical method for computing pore radii and soil water characteristics from particle-size distribution, Soil Sci. Soc. Am. J., 79, 1537–1544, 2015.
Arya, L., Leij, F., van Genuchten, M., and Shouse, P.: Scaling parameter to predict the soil water characteristic from particle-size distribution data, Soil Sci. Soc. Am. J., 63, 510–519, 1999.
Assouline, S. and Or, D.: Conceptual and parametric representation of soil hydraulic properties: a review, Vadose Zone J., 12, vzj2013.07.0121, https://doi.org/10.2136/vzj2013.07.0121, 2013.
Balesdent, J., Chenu, C., and Balabane, M.: Relationship of soil organic matter dynamics to physical protection and tillage, Soil Till. Res., 53, 215–230, 2000.
Barré, P., Eglin, T., Christensen, B., Ciais, P., Houot, S., Kätterer, T., van Oort, F., Peylin, P., Poulton, P., Romanenkov, V., and Chenu, C.: Quantifying and isolating stable organic carbon using long-term bare fallow experiments, Biogeochemistry, 7, 3839–3850, 2010.
Beven, K.: A manifesto for the equifinality thesis, J. Hydrol., 320, 18–36, 2006.
Blagodatskaya, E. and Kuzyakov, Y.: Mechanisms of real and apparent priming effects and their dependence on soil microbial biomass and community structure: critical review, Biol. Fert. Soils, 45, 115–131, 2008.
Boivin, P., Schäffer, B., and Sturny, W.: Quantifying the relationship between soil organic carbon and soil physical properties using shrinkage modelling, Eur. J. Soil Sci., 60, 265–275, 2009.
Bolinder M., Janzen, H., Gregorich, E., Angers, D., and van den Bygaart, A.: An approach for estimating net primary productivity and annual carbon inputs to soil for common agricultural crops in Canada, Agr. Ecosyst. Environ., 118, 29–42, 2007.
Bradford, M.: Managing uncertainty in soil carbon feedbacks to climate change, Nat. Clim. Change, 6, 751–758, 2016.
Bucka, F., Kölbl, A., Uteau, D., Peth, S., and Kögel-Knabner, I.: Organic matter input determines structure development and aggregate formation in artificial soils, Geoderma, 354, 113881, https://doi.org/10.1016/j.geoderma.2019.113881, 2019.
Chevallier, T., Blanchart, E., Albrecht, A., and Feller, C.: The physical protection of soil organic carbon in aggregates: a mechanism of carbon storage in a Vertisol under pasture and market gardening (Martinique, West Indies), Agr. Ecosyst. Environ., 103, 375–387, 2004.
Cosentino, D., Chenu, C., and Le Bissonnais, Y.: Aggregate stability and microbial community dynamics under drying-wetting cycles in a silt loam soil, Soil Biol. Biochem., 38, 2053–2062, 2006.
Dignac, M.-F., Derrien, D., Barré, P., Barot, S., Cécillon, L., Chenu, C., Chevallier, T., Freschet, G., Garnier, P., Guenet, B., Hedde, M., Klumpp, K., Lashermes, G., Maron, P.-A., Nunan, N., Roumet, C., and Basile-Doelsch, I.: Increasing soil carbon storage: mechanisms, effects of agricultural practices and proxies, A review, Agron. Sustain. Dev., 37, 1–27, https://doi.org/10.1007/s13593-017-0421-2, 2017.
Don, A., Steinberg, B., Schöning, I., Pritsch, K., Joschko, M., Gleixner, G., and Schulze, E.: Organic carbon sequestration in earthworm burrows, Soil Biol. Biochem., 40, 1803–1812, 2008.
Dungait, J., Hopkins, D., Gregory, A., and Whitmore, A.: Soil organic matter turnover is governed by accessibility not recalcitrance, Glob. Change Biol., 18, 1781–1796, 2012.
Durner, W.: Hydraulic conductivity estimation for soils with heterogeneous pore structure, Water Resour. Res., 30, 211–223, 1994.
Ekschmitt, K., Kandeler, E., Poll, C., Brune, A., Buscot, F., Friedrich, M., Gleixner, G., Hartmann, A., Kästner, M., Marhan, S., Miltner, A., Scheu, S., and Wolters, V.: Soil-carbon preservation through habitat constraints and biological limitations on decomposer activity, J. Soil Sci. Plant Nutr., 171, 27–35, 2008.
Emerson, W. and McGarry, D.: Organic carbon and soil porosity, Austr. J. Soil Res., 41, 107–118, 2003.
Falloon, P. and Smith, P.: Modelling refractory soil organic matter, Biol. Fert. Soils, 30, 388–398, 2000.
Federer, C., Turcotte, D., and Smith, C.: The organic fraction–bulk density relationship and the expression of nutrient content in forest soils, Can. J. Forest Res., 23, 1026–1032, 1993.
Feeney, D., Crawford, J., Daniell, T., Hallett, P., Nunan, N., Ritz, K., Rivers, M., and Young, I.: Three-dimensional microorganization of the soil-root-microbe system, Microb. Ecol., 52, 151–158, 2006.
Fies, J.-C. and Stengel, P.: Densité texturale de sols naturels I. – Méthode de mesure, Agronomie, 1, 651–658, 1981.
Gerzabek, M., Pichlmayer, F., Kirchmann, H., and Haberhauer, G.: The response of organic matter to manure amendments in a long-term experiment at Ultuna, Sweden, Eur. J. Soil Sci., 48, 273–282, 1997.
Görres, J., Savin, M., and Amador, J.: Soil micropore structure and carbon mineralization in burrows and casts of an anecic earthworm (Lumbricus terrestris), Soil Biol. Biochem., 33, 1881–1887, 2001.
Hassink, J., Bouwman, L., Zwart, K., Bloem, J., and Brussaard, L.: Relationships between soil texture, physical protection of organic matter, soil biota, and C and N mineralization in grassland soils, Geoderma, 57, 105–128, 1993.
Hassink, J. and Whitmore, A.: A model of the physical protection of organic matter in soils, Soil Sci. Soc. Am. J., 61, 131–139, 1997.
Haynes, R. and Naidu, R.: Influence of lime, fertiliser and manure applications on soil organic matter content and soil physical conditions: a review, Nutr. Cycl. Agr., 51, 123–137, 1998.
Henryson, K., Sundberg, C., Kätterer, T., and Hansson, P.-A.: Accounting for long-term soil fertility effects when assessing the climate impact of crop cultivation, Agr. Syst., 164, 185–192, 2018.
Herrmann, A. M.: Predicting nitrogen mineralization from soil organic matter – a chimera? Doctoral Thesis, Swedish University of Agricultural Sciences, Uppsala, Sweden, ISSN 1401-6249, ISBN 91-576-6468-4, 2003.
Herrmann, A. M. and Witter, E.: Predictors of gross N mineralization and immobilization during decomposition of stabilized organic matter in agricultural soil, Eur. J. Soil Sci., 59, 653–664, 2008.
Herrmann, A. M., Coucheney, E., and Nunan, N.: Isothermal microcalorimetry provides new insight into terrestrial carbon cycling, Environ. Sci. Technol., 48, 4344–4352, 2014.
Hudson, B.: Soil organic matter and available water capacity, J. Soil Water Conserv., 49, 189–194, 1994.
Hyvönen, R., Ågren, G. I., and Andrén, O.: Modelling long-term carbon and nitrogen dynamics in an arable soil receiving organic matter, Ecol. Appl., 6, 1345–1354, 1996.
Jarvis, N. J., Forkman, J., Koestel, J., Kätterer, Larsbo, M., and Taylor, A.: Long-term effects of grass-clover leys on the structure of a silt loam soil in a cold climate, Agr. Ecosyst. Environ., 247, 319–328, 2017.
Johannes A., Matter, A., Schulin, R., Weisskopf, P., Baveye, P., and Boivin, P.: Optimal organic carbon values for soil structure quality of arable soils. Does clay content matter?, Geoderma, 302, 14–21, 2017.
Juston, J., Andrén, O., Kätterer, T., and Jansson, P.-E.: Uncertainty analyses for calibrating a soil carbon balance model to agricultural field trial data in Sweden and Kenya, Ecol. Modell., 221, 1880–1888, 2010.
Kätterer, T., Bolinder, M., Andrén, O., Kirchmann, H., and Menichetti, L.: Roots contribute more to refractory soil organic matter than above-ground crop residues, as revealed by a long-term field experiment, Agr. Ecosyst. Environ., 141, 184–192, 2011.
Kirchmann, H. and Gerzabek, M.: Relationship between soil organic matter and micropores in a long-term experiment at Ultuna, Sweden, J. Plant Nutr. Soil Sci., 162, 493–498, 1999.
Kirchmann, H., Persson, J., and Carlgren, K.: The Ultuna long-term soil organic matter experiment, 1956–1991, Department of Soil Sciences, Reports and Dissertations 17, Swedish University of Agricultural Sciences, Uppsala, Sweden, 1994.
Kravchenko, A. and Guber, A.: Soil pores and their contributions to soil carbon processes, Geoderma, 287, 31–39, 2017.
Kravchenko, A., Negassa, W., Guber, A., and Rivers, M.: Protection of soil carbon within macro-aggregates depends on intra-aggregate pore characteristics, Sci. Rep., 5, 16261, https://doi.org/10.1038/srep16261, 2015.
Kuka, K., Franko, U., and Rühlmann, J.: Modelling the impact of pore space distribution on carbon turnover, Ecol. Modell., 208, 295–306, 2007.
Lal, R.: Carbon management in agricultural soils, Mitigation and Adaptation Strategies for global change, Mitig. Adapt. Strat. Gl., 12, 303–322, 2007.
Lal, R.: Intensive agriculture and the soil carbon pool, J. Crop Improv., 27, 735–751, 2013.
Larsbo, M., Roulier, S., Stenemo, F., Kasteel, R., and Jarvis, N.: An improved dual-permeability model of water flow and solute transport in the vadose zone, Vadose Zone J., 4, 398–406, 2005.
Larsbo, M., Koestel, J., Kätterer, T., and Jarvis, N.: Preferential transport in macropores is reduced by soil organic carbon, Vadose Zone J., 15, 1–7, https://doi.org/10.2136/vzj2016.03.0021, 2016.
Lehmann J. and Kleber, M.: The contentious nature of soil organic matter, Nature, 528, 60–68, 2015.
Libohova, Z., Seybold, C., Wysocki, D., Wills, S., Schoeneberger, P., Williams, C., Lindbo, D., Stott, D., and Owens, P.: Reevaluating the effects of soil organic matter and other properties on available water-holding capacity using the National Cooperative Soil Survey Characterization Database, J. Soil Water Conserv., 73, 411–421, 2018.
Loveland, P. and Webb, J.: Is there a critical level of organic matter in the agricultural soils of temperate regions: a review, Soil Till. Res., 70, 1–18, 2003.
Luo, Z., Wang, E., and Sun, O.: Uncertain future soil carbon dynamics under global change predicted by models constrained by total carbon measurements, Ecol. Appl., 27, 1001–1009, 2017.
Martin, A.: Short- and long-term effects of the endogeic earthworm Millsonia anomala (Omodeo)(Megascolecidae, Oligochaeta) of tropical savannas, on soil organic matter, Biol. Fert. Soils, 11, 234–238, 1991.
Minasny, B. and McBratney, A.: Limited effect of organic matter on soil available water capacity, Eur. J. Soil Sci., 69, 39–47, 2018.
Nimmo, J.: Porosity and pore size distribution. Reference module in earth systems and environmental Sciences, Elsevier, 27 September 2013, https://doi.org/10.1016/B978-0-12-409548-9.05265-9, 2013.
Nunan, N., Leloup, J., Ruamps, L. S., Pouteau, V., and Chenu, C.: Effects of habitat constraints on soil microbial community function, Sci. Rep., 7, 4280, https://doi.org/10.1038/s41598-017-04485-z, 2017.
Pankhurst, C., Pierret, A., Hawke, B., and Kirby, J.: Microbiological and chemical properties of soil associated with macropores at different depths in a red-duplex soil in NSW Australia, Plant Soil, 238, 11–20, 2002.
Paustian, K., Parton, W., and Persson, J.: Modeling soil organic-matter in organic-amended and nitrogen-fertilized long-term plots, Soil Sci. Soc. Am. J., 56, 476–488, 1992.
Poeplau, C., Kätterer, T., Bolinder, M., Börjesson, G., Berti, A., and Lugato, E.: Low stabilization of aboveground crop residue carbon in sandy soils of Swedish long-term experiments, Geoderma, 237/238, 246–255, 2015.
Powell, M.: The BOBYQA algorithm for bound constrained optimization without derivatives (Report), available at: http://www.damtp.cam.ac.uk/user/na/NA_papers/NA2009_06.pdf (last access: 21 October 2019), 2009.
Pribyl, D.: A critical review of the conventional SOC to SOM conversion factor, Geoderma 156, 75–83, 2010.
Quigley, M., Negassa, W., Guber, A., Rivers, M., and Kravchenko, A.: Influence of pore characteristics on the fate and distribution of newly added carbon, Front. Environ. Sci., 6, 51 pp., https://doi.org/10.3389/fenvs.2018.00051, 2018.
R Core Team: R: A language and environment for statistical computing. R Foundation for Statistical Computing, Vienna, Austria, available at: https://www.R-project.org/ (last access: 14 October 2020), 2018.
Rabot, E., Wiesmeier, M., Schlüter, S., and Vogel, H.-J.: Soil structure as an indicator of soil functions: a review, Geoderma, 314, 122–137, 2018.
Rawls, W., Pachepsky, Y., Ritchie, J., Sobecki, T., and Bloodworth, H.: Effect of soil organic carbon on soil water retention, Geoderma, 116, 61–76, 2003.
Rickson, J., Deeks, L., Graves, A., Harris, J., Kibblewhite, M., and Sakrabani, R.: Input constraints to food production: the impact of soil degradation, Food Secur., 7, 351–364, 2015.
Ruamps, L. S., Nunan, N., and Chenu, C.: Microbial biogeography at the soil pore scale, Soil Biol. Biochem., 43, 280–286, 2011.
Ruehlmann, J. and Körschens, M.: Calculating the effect of soil organic matter concentration on soil bulk density, Soil Sci. Soc. Am. J., 73, 876–885, 2009.
Sanderman, J., Hengl, T., and Fiske, G.: Soil carbon debt of 12,000 years of human land use, P. Natl. Acad. Sci. USA, 114, 9575–9580, 2017.
Segoli, S., De Gryze, S., Dou, F., Lee, J., Post, W., Denef, K., and Six, J.: AggModel: a soil organic matter model with measurable pools for use in incubation studies, Ecol. Modell., 263, 1–9, 2013.
Sierra, C., Malghani, S., and Müller, M.: Model structure and parameter identification of soil organic matter models, Soil Biol. Biochem., 90, 197–203, 2015.
Souza, I., Almeida, L., Jesus, G., Kleber, M., and Silva, I.: The mechanisms of organic carbon protection and dynamics of C-saturation in Oxisols vary with particle-size distribution, Eur. J. Soil Sci., 68, 726–739, 2017.
Stamati, F., Nikolaidis, N., Banwart, S., and Blum, W.: A coupled carbon, aggregation, and structure turnover (CAST) model for topsoils, Geoderma, 211/212, 51–64, 2013.
Stewart, C., Paustian, K., Conant, R., Plante, A., and Six, J.: Soil carbon saturation: concept, evidence and evaluation, Biogeochemistry, 86, 19–31, 2007.
Stewart, V. I., Adams, W. A., and Abdulla, H. H.: Quantitative pedological studies on soils derived from Silurian mudstones, II. The relationship between stone content and the apparent density of the fine Earth, J. Soil Sci., 21, 242–247, 1970.
Strong, D., de Wever, H., Merckx, R., and Recous, S.: Spatial location of carbon decomposition in the soil pore system, Eur. J. Soil Sci., 55, 739–750, 2004.
Tisdall, J. M. and Oades, J. M.: Organic matter and water stable aggregates in soils, J. Soil Sci., 33, 141–163, 1982.
Toosi, E., Kravchenko, A., Guber, A., and Rivers, M.: Pore characteristics regulate priming and fate of carbon from plant residue, Soil Biol. Biochem., 113, 219–230, 2017.
Tranter, G., Minasny, B., McBratney, A., Murphy, B., McKenzie, N., Grundy, M., and Brough, D.: Building and testing conceptual and empirical models for predicting soil bulk density, Soil Use Manage., 23, 437–443, 2007.
van Genuchten, M.: A closed-form equation for predicting the hydraulic conductivity of unsaturated Soils, Soil Sci. Soc. Am. J., 44, 892–898, 1980.
Vereecken, H., Weynants, M., Javaux, M., Pachepsky, Y., Schaap, M., and van Genuchten, M.: Using pedotransfer functions to estimate the van Genuchten-Mualem soil hydraulic properties: a review, Vadose Zone J., 9, 795–820, 2010.
Vogel, H.-J., Weller, U., and Schlüter, S.: Quantification of soil structure based on Minkowski functions, Comput. Geosci., 36, 1236–1245, 2010.
Walker, A.: Openxlsx: Read, Write and Edit XLSX Files, P package version 4.1.0.1, available at: https://cran.r-project.org/web/packages/openxlsx/index.html (last access: 14 October 2020), 2019.
Wickham, H.: The Split-Allpy-Combine Strategy for Data Analysis, J. Stat. Softw., 40, 1–29, 2011.
Wiklert, P., Andersson, S., and Weidow, B.: Studier av markprofiler i svenska åkerjordar, En faktasammanställning. Del I. Ultunajordar, Report 132, Dept. Soil Sciences, Division of Agricultural Hydrotechnics, Swedish University of Agricultural Sciences, 125 pp., 1983.
Witter, E.: Soil C balance in a long-term field experiment in relation to the size of the microbial biomass, Biol. Fert. Soils, 23, 33–37, 1996.
Wösten, H., Pachepsky, Y., and Rawls, W.: Pedotransfer functions: bridging the gap between available basic soil data and missing soil hydraulic characteristics, J. Hydrol., 251, 123–150, 2001.
Wutzler, T. and Reichstein, M.: Priming and substrate quality interactions in soil organic matter models, Biogeosciences, 10, 2089–2103, https://doi.org/10.5194/bg-10-2089-2013, 2013.
Yoon, S. and Gimenéz, D.: Entropy characterization of soil pore systems derived from soil-water retention curves, Soil Science, 177, 361–368, 2012.
Young, I. and Crawford, J.: Interactions and self-organization in the soil-microbe complex, Science, 304, 1634–1637, 2004.
Young, I., Crawford, J., and Rappoldt, C.: New methods and models for characterising structural heterogeneity of soil, Soil Till. Res., 61, 33–45, 2001.
Yu, L., Ahrens, B., Wutzler, T., Schrumpf, M., and Zaehle, S.: Jena Soil Model (JSM v1.0; revision 1934): a microbial soil organic carbon model integrated with nitrogen and phosphorus processes, Geosci. Model Dev., 13, 783–803, https://doi.org/10.5194/gmd-13-783-2020, 2020.