the Creative Commons Attribution 4.0 License.
the Creative Commons Attribution 4.0 License.
 | 09 Nov 2020
Use of optical absorption indices to assess seasonal variability of dissolved organic matter in Amazon floodplain lakes
Maria Paula da Silva
Lino A. Sander de Carvalho
Evlyn Novo
Daniel S. F. Jorge
Claudio C. F. Barbosa
Given the importance of dissolved organic matter (DOM) in the carbon cycling of aquatic ecosystems, information on its seasonal variability is crucial. In this study we assess the use of optical absorption indices available in the literature based on in situ data to both characterize the seasonal variability of DOM in a highly complex environment and for application in large-scale studies using remote sensing data. The study area comprises four lakes located in the Mamirauá Sustainable Development Reserve (MSDR). Samples for the determination of colored dissolved organic matter (CDOM) and measurements of remote sensing reflectance (Rrs) were acquired in situ. The Rrs was used to simulate the response of the visible bands of the Sentinel-2 MultiSpectral Instrument (MSI), which was used in the proposed models. Differences between lakes were tested using the CDOM indices. The results highlight the role of the flood pulse in the DOM dynamics at the floodplain lakes. The validation results show that the use of the absorption coefficient of CDOM (aCDOM) as a proxy of the spectral slope between 275 and 295 nm (S275–295) during rising water is worthwhile, demonstrating its potential application to Sentinel-2 MSI imagery data for studying DOM dynamics on the large scale.
- Article
(7244 KB) - Full-text XML
-
Supplement
(285 KB) - BibTeX
- EndNote


Floodplain is a type of wetland that is characterized by a mosaic of landscapes, and it oscillates periodically between aquatic and terrestrial systems. This oscillation represents a key aspect in the biogeochemistry, ecology and hydrology of floodplain lakes (Junk et al., 1989; Moreira-Turq et al., 2003). Among other effects, the flood pulse (sensu Junk et al., 1989) affects the proportion of autochthonous and allochthonous sources contributing to the dissolved organic matter (DOM) pool in floodplain lakes throughout the year (de Melo et al., 2020).
DOM represents the largest pool of organic carbon in the aquatic environment, and it has an important role in the ecosystem carbon budgets (Seekell et al., 2018; Tranvik et al., 2009; Richey et al., 2002). Moreover, DOM also controls light availability in the water column, playing a vital role in the primary productivity of aquatic ecosystems and, consequently, fisheries and other food webs (Hastie et al., 2019; Maia and Volpato, 2013; Volpato et al., 2004). Nonetheless, the role of DOM in the environment changes according to its quality (Inamdar et al., 2012).
The DOM concentration in the environment is usually determined by the concentration of dissolved organic carbon (DOC; Coble, 2007). However, simple measurement of the DOC concentration can limit the study of the seasonal variation in the DOM quality (e.g., composition) and origin as it is related only to the DOM bulk (Jaffé et al., 2008). Qualitative parameters are needed to better understand DOM dynamics. Ultraviolet (UV) and visible absorption measurements and fluorescence can be applied in this case as an alternative to costly laboratory analysis (Li and Hur, 2017). Water absorption has been widely used to study DOM dynamics in streams and lakes. Based on UV and visible measurements, Helms et al. (2008) showed that the spectral slope calculated in the range between 275 and 295 nm (S275–295) is an indicator of the DOM molecular weight and a tracer of the degradation processes. S275–295, the absorption coefficient of colored dissolved organic matter (CDOM) at 350 nm (aCDOM (350)) and the DOC concentration have also been used to study the dynamics of dissolved organic matter between rivers and floodplains (Spencer et al., 2008; Shen et al., 2012).
To study DOM dynamics over a wide spatial–temporal scale, satellite images have been assessed as a source of optical information on CDOM. Many studies have used Landsat images to investigate aCDOM at different wavelengths, most commonly at 350, 440 and 420 nm (Fichot et al., 2013; Kutser et al., 2005; Zhu et al., 2014; Brezonik et al., 2015). Fichot et al. (2013) also estimated S275–295 from satellite data, using MODIS marine reflectance. However, the reflectance of water in the visible bands may not reflect changes in the spectral slope of CDOM in the UV domain (Vantrepotte et al., 2015). Therefore, Vantrepotte et al. (2015) proposed the use of aCDOM as a proxy for S275–295 as it proved to be less affected by the water optical quality and atmospheric correction. Both studies (Fichot et al., 2013; Vantrepotee et al., 2015) used MODIS data whose spatial resolution (250–1000 m) restricts their application to inland water studies. In recent years the availability of MultiSpectral Instrument (MSI) images, onboard Sentinel-2A (June/2015) and Sentinel-2B (March 2017), has expanded the potential of remote sensing application for DOM monitoring due to its high spatial (10 and 20 m), temporal (5 d) and radiometric (12 bit) resolutions (Toming et al., 2016). Nonetheless, it remains unclear if the optical absorption indices proposed in the literature can be used to study DOM dynamics in a highly complex system such as the Amazon floodplain lakes.
The main objectives of this study are (i) to investigate the variability of aCDOM in floodplain lakes during the receding and rising limbs of the Solimões River, (ii) to examine the potential of S275–295 for distinguishing differences in DOM by comparing it in two hydrograph stages and (iii) to propose an algorithm to estimate aCDOM (440) as a proxy for S275–295 using simulated MSI Sentinel-2 bands to support the future application of satellite remote sensing for inland DOM studies.
2.1 Study area
The study sites are four lakes located in the floodplain built at the confluence between the Solimões and Japurá rivers, near Tefé and inside the Mamirauá Sustainable Development Reserve (MSDR; Fig. 1b), which is a well-preserved flooded forest under low human pressure (Ayres, 1995; Castello et al., 2009; Mori et al., 2019; Queiroz, 2007). In this area, the seasonal flood is caused by both rainfall (in the upper Amazon Basin and locally – from December to May, with an average of 300 mm per month) and the annual melt of the Andes mountain range during austral summer (Junk, 1989). In the MSDR, the variation in the water level is 12 m on average between the wet and dry seasons (Queiroz, 2007). The increase in the water level (the rising stage) begins in January and continues until late April; the water begins to recede (the receding stage) in July. During the flood period, which begins in May, the floodplain is occupied by water until the beginning of the receding stage (Affonso et al., 2011). The study lakes were selected according to criteria defined in Jorge et al. (2017a): guaranteed access to them throughout the hydrological year and sizes compatible with the spatial resolution of the visible bands of MSI Sentinel-2A (10 and 20 m). Additionally, the lakes have intrinsic differences: two of them (Buabuá and Mamirauá) are small perennial lakes surrounded by flood forest, whereas the other two (Pantaleão and Pirarara) are lakes connected to the Japurá River throughout the hydrological year, with variable size and depth in response to the flood pulse of the river.

Figure 1(a) Overview of the Amazon. (b) OLI/Landsat 8 true color image from 30 July 2015 showing the study areas and sampling stations: (I) Buabuá, (II) Mamirauá, (III) Pantaleão and (IV) Pirarara. (c) The mean water flow rate (2000–2010) calculated for the Japurá and Solimões rivers (Brazilian Water National Agency – ANA; Agência Nacional de Águas, 2020).
2.2 Data source
Data were acquired in the Buabuá, Mamirauá, Pantaleão and Pirarara lakes by the Instrumentation Laboratory for Aquatic Systems team (LabISA – http://www.dpi.inpe.br/labisa, last access: 26 October 2020) of the National Institute for Space Research (INPE-Brazil). More details about the fieldwork and measurements are provided in Jorge et al. (2017a, b).
The field campaigns were carried out in March–April and July–August of 2016; these periods correspond to the rising and receding stages of the Solimões River, respectively. In total, 87 samples were collected among the lakes and seasons.
2.3 Measurements
2.3.1 Remote sensing reflectance
The radiometric measurements to derive the remote sensing reflectance (Rrs) were carried out for all sampling points using three intercalibrated RAMSES–TriOS sensors. The sensors measured above-water radiance, sky radiance and water surface irradiance, between 350 and 900 nm. During the measurements, the sensors were positioned with azimuth angles between 90 and 135∘ in relation to the sun and a zenith angle of 45∘ to avoid sun glint effects (Mueller and Fargion, 2002). The measurement framework follows Mobley (1999). All of the measurements were made between 10:00 and 13:00 LT (local time), and at least 15 measurements were made at each sampling point. The data set was processed using MSDA_XE (TRIOS, 2018) and MATLAB (Mathworks, Natick, MA, USA). The Rrs estimate followed Mobley (1999), with sun glint correction based on each sampling point. The calculated Rrs was used to simulate the reflectance of the MSI bands. For this, the MSI relative spectral response (RSR) of the sensor was used (Eq. 1):
where is the Rrs measured in situ, and Rrs(Bi) is the Rrs simulated for the ith band of Sentinel-2A, in the wavelength range from λm to λn. The MSI RSR was taken from the sensor user guide (https://earth.esa.int, last access: 23 June 2018).
2.3.2 CDOM absorption coefficient
Water samples were first filtered through Whatman GF/F (0.7 µm) filters (burned at 400 ∘C) and then through 0.22 µm pore size polycarbonate filters. The filtrated sample was stored in sterilized dark glass bottles and was kept refrigerated for up to 14 d until analysis. During the analysis, all samples were kept at ambient temperature. CDOM spectral absorbance was measured with a Shimadzu UV-2600 spectrophotometer in the wavelength range between 220 and 800 nm with increments of 1 nm and was converted to aCDOM(λ) according to Eq. (2) (Bricaud et al., 1981):
where A(λ) is the spectral absorbance of the filtered sample in the specific wavelength λ (nm), and L is the cuvette path length (0.1 m).
The average of aCDOM between 750 and 800 nm was used to correct the residual absorption spectra due to baseline drift, temperature, scattering and refractive effects (Coble, 2007).
2.3.3 Spectral slope determination
Helms et al. (2008) showed that the spectral slope calculated in the range between 275 and 295 nm (S275–295) is an indicator of the DOM molecular weight and a tracer of the degradation processes. In the present study, S275–295 was computed according to Eq. (3) using a nonlinear fit (Helms et al., 2008; Bricaud et al., 1981). This function describes the aCDOM(λ) behavior along the electromagnetic spectrum and is expressed as follows:
where S is the spectral slope parameter (nm−1) between the λ−λref wavelength interval, and λref is a reference wavelength (nm).
The spectral slope between the 350–400 nm (S350–400) wavelength interval was also computed as described in Eq. (3). The spectral slope ratio (SR) was calculated from the ratio between S275–295 and S350–400.
2.3.4 Statistical analyses
The temporal variability of DOM was assessed using aCDOM(440). This wavelength was chosen due to the high CDOM absorption at low wavelengths (Jorge et al., 2017a), and it is also a region that has been used as a reference in remote sensing studies for at least the last 36 years (Bricaud et al., 1981; Brezonik et al., 2015; Bukata et al.,1995; Werdell et al., 2018).
The coefficient of variance (CV) was also computed to assess the aCDOM(440) variability. A Kruskal–Wallis test (one-way ANOVA on ranks) with a significance level of 95 % was applied to test the differences between the lakes and hydrograph stages with respect to the aCDOM(440) values as follows: (i) in the first run, the entire data set was used; (ii) in the second run, samples from Buabuá and Mamirauá acquired during the rising period were removed.
The mean S275–295 of the 2 months representing the same hydrograph stages (e.g., July and August for receding; March and April for rising) was computed for each sampling point in order to analyze their variability within each lake and hydrograph stage. All of the statistical analyses were performed using MATLAB software (Mathworks, Natick, MA, USA).
2.3.5 Model calibration and validation
When estimating aCDOM from Rrs in complex environments, there is always the challenge of distinguishing the CDOM signal from the non-algal particle (NAP) signal (Matsuoka et al., 2009, 2012). In this study, we propose a new model for estimating aCDOM(440) that includes the ratio between the near-infrared (NIR) bands in order to remove the NAP contribution. The rationale for introducing this ratio is the null signal of CDOM and the dominance of NAP in the NIR range (Kirk, 2011). Previous studies have also shown that the inclusion of bands at wavelengths >600 nm increases the accuracy of the CDOM estimation model (Chen et al., 2017; Zhu et al., 2014). Thus, to determine aCDOM(440), the exponential of the ratio between bands 6 (λ central wavelength (λcw) = 740 nm) and 5 (λcw = 705 nm) are subtracted from the exponential of the ratio between bands 2 (λcw = 490 nm) and 3 (λcw = 560 nm) (Eq. 4):
where, x, y and z are the coefficients, and B2, B3, B5 and B6 are the MSI sensor-simulated bands 2, 3, 5 and 6.
The Monte Carlo method was applied to Eq. (4) to calibrate the model. From 42 samples collected during the rising limb, 29 were randomly selected for model calibration. This process was repeated 10 000 times, and the mean square error (MSE) and equation coefficients (x and y) were recorded at each iteration.
The final model selection (the most representative model based on the MSE modal value) follows the procedure from Augusto-Silva et al. (2014): (i) construct a histogram of the MSE, (ii) compute the mean and standard deviations of the model's coefficients in the most frequent error interval, (iii) rank the coefficients in the range of the mean ± standard deviation according to their MSE and (iv) select the model with the smallest MSE.
The chosen model was validated using the 13 remaining samples (not used in the calibration process), and the final accuracy was assessed using the following metrics: the coefficient of determination (r2), the MSE and normalized root mean square error as a percentage (%NRMSE).
3.1 Seasonal and spatial variability of DOM
The water level of the Solimões River during the sampling campaigns in the rising and receding limbs was very similar (30.04±1.38 m). However, the DOC concentration was almost 2-fold higher at the Buabuá and Mamirauá lakes during the rising limb compared with the other samples (Table 1). During the receding limb, the DOC concentration was low and was also very similar between lakes. The same pattern was observed for the aCDOM(440) (Fig. 2). The highest amplitude of aCDOM(440) in the entire data set (e.g., across all sites) occurred in March (1.22 to 5.46 m−1) and April (1.60 to 5.97 m−1) with averages of 2.56 and 3.01 m−1, respectively. In July and August, the amplitude was smaller (1.32 to 2.03 and 1.27 to 2.19 m−1, respectively) and both averaged below 2 m−1. Furthermore, higher variability (CV = 52.45 %) in aCDOM (440) was observed during the rising limb, whereas the variability (CV = 14.74 %) in aCDOM (440) was much lower in the lakes during the receding limb. The Kruskal–Wallis test using samples from all lakes and dates indicated that there were significant differences (p<0.001) in aCDOM(440) between the lakes and hydrograph stages. However, after the removal of the Buabuá and Mamirauá samples acquired in March and April (rising), the Kruskal–Wallis results showed no significant differences in aCDOM(440) values between both lakes and hydrograph stages (p=0.51). The two runs indicate that the DOM at Buabuá and Mamirauá during the rising limb have a much higher absorption at 440 nm than the DOM in the remaining lakes and months.
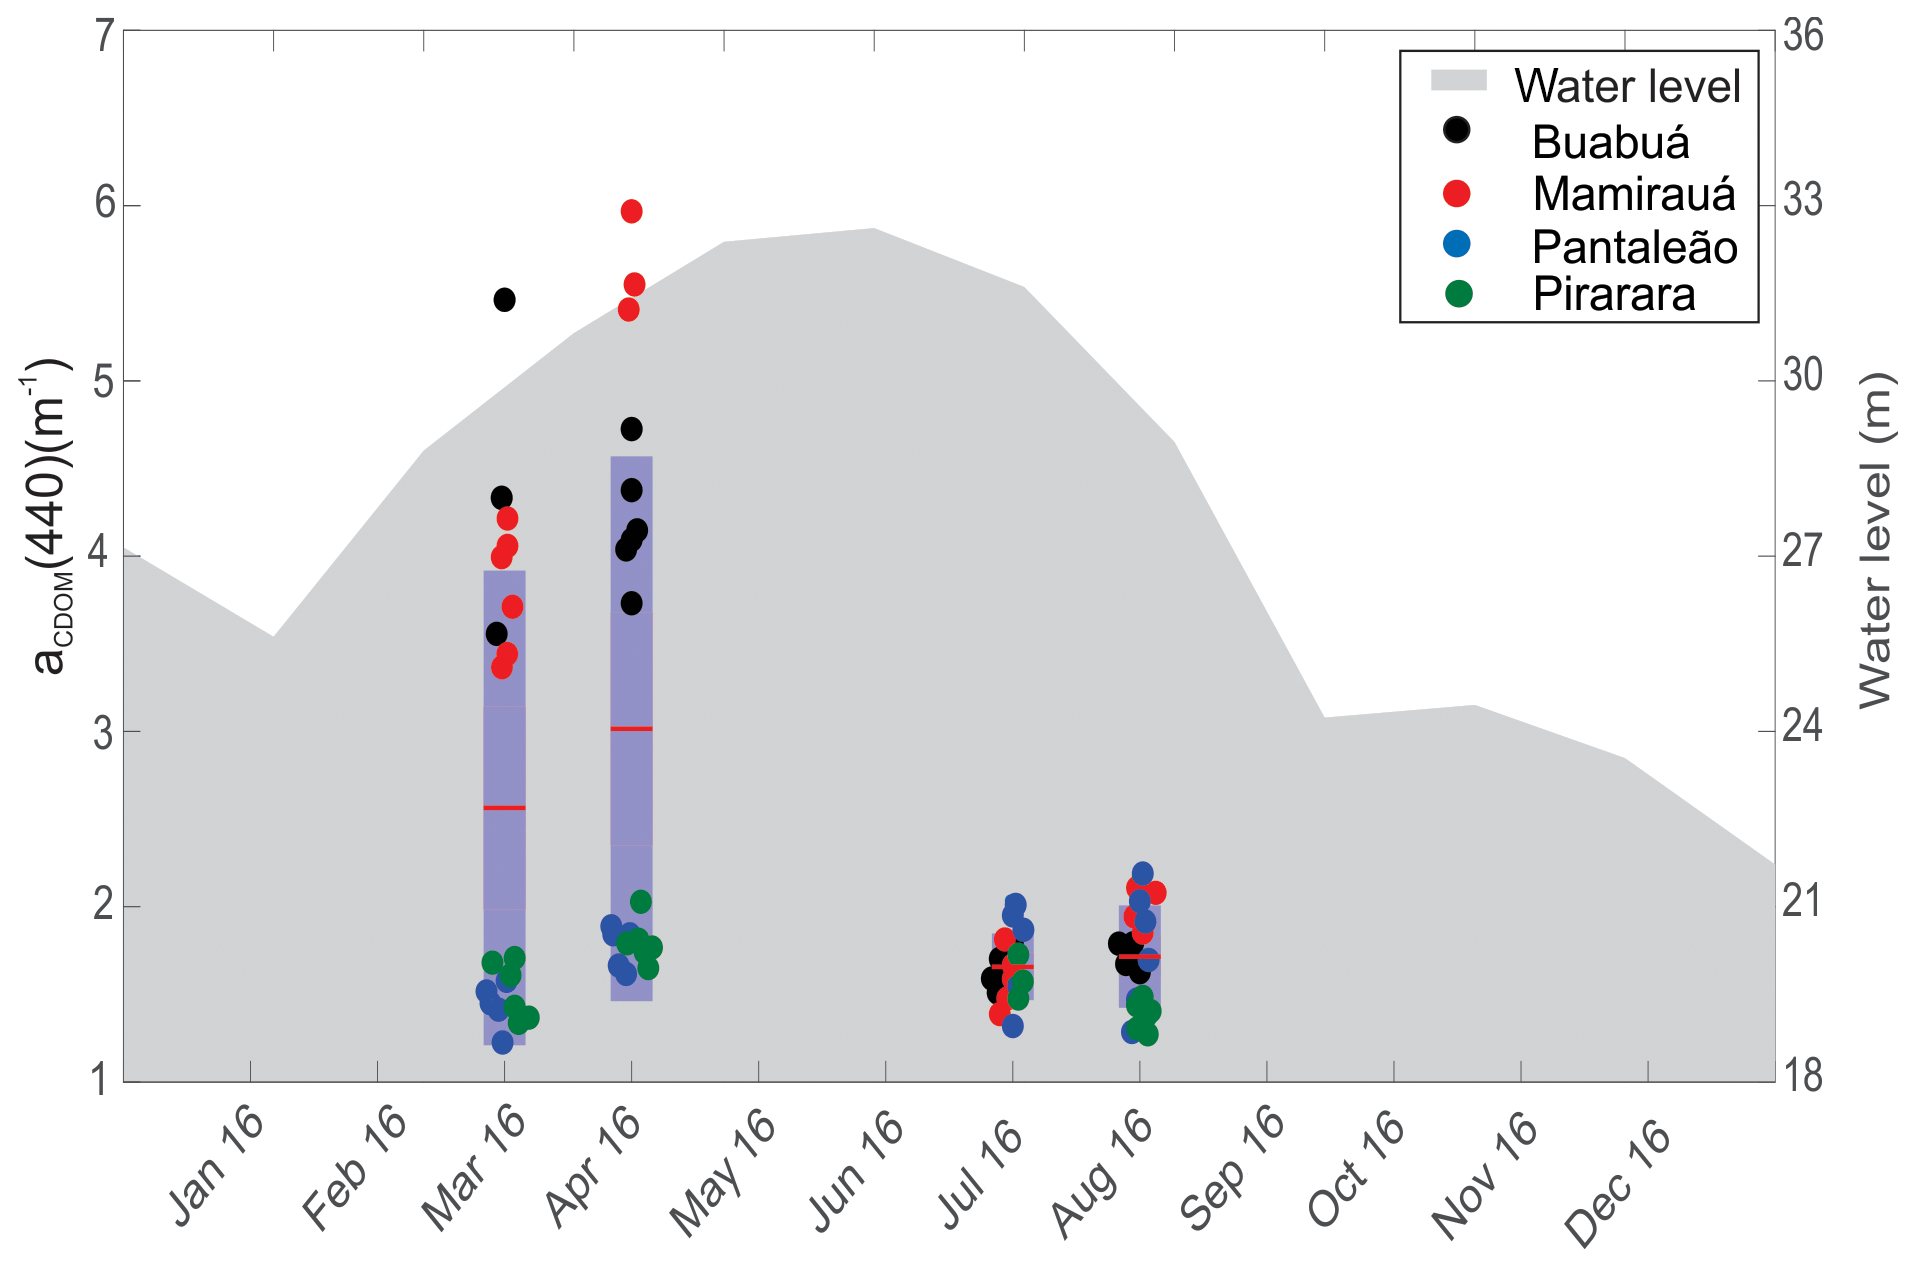
Figure 2Seasonal box plot of aCDOM(440) (m−1) and the water level (m) of the Mamirauá channel in 2016. The red lines are the mean aCDOM(440), each dot represents the aCDOM(440) value at each sample station, and the blue boxes represent the interval between the first and third quartile. The water level was measured at Mamirauá channel (Mamirauá Sustainable Development Institute, 2018).
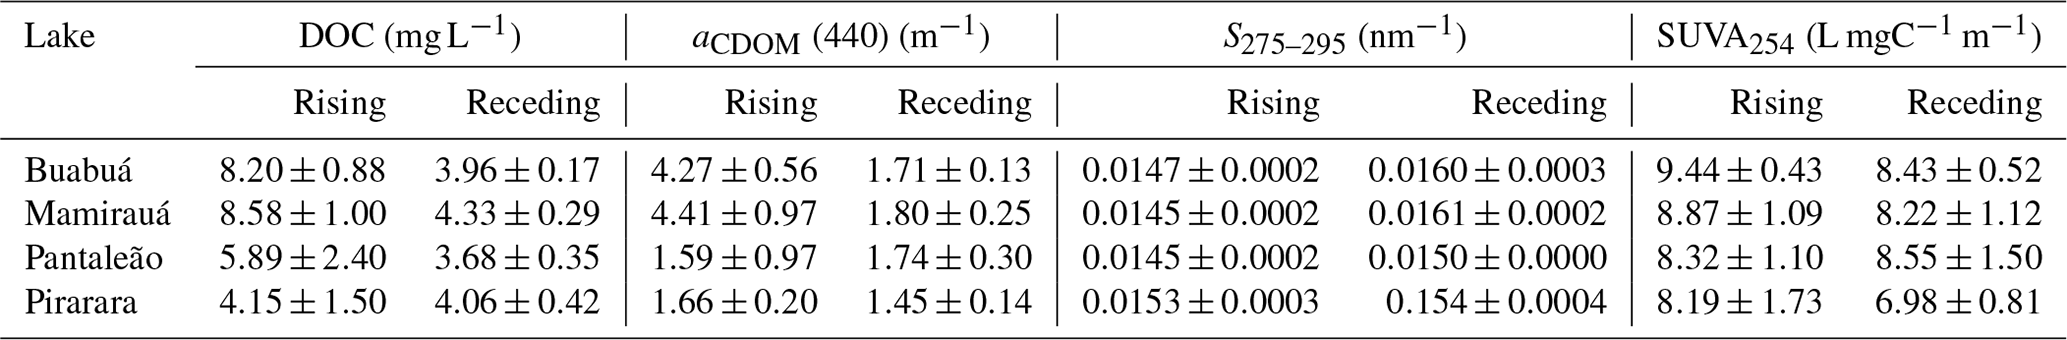
Not only were differences in aCDOM(440) observed, but differences in the aCDOM spectra were also noted (Fig. 3). The entire set of aCDOM spectra can be divided into two groups: the first group is comprised of Buabuá and Mamirauá spectra acquired at the rising limb, and the second group is composed of both Pantaleão and Pirarara spectra at the rising limb as well as samples from all of the lakes acquired during the receding limb. In the second group, the presence of a shoulder between 245 and 290 nm in the absorption spectra (black arrows in Fig. 3) was noticeable. The presence of a shoulder in the aCDOM spectra can influence the calculation of S275–295 (Xie et al., 2012), but this effect was not observed in our data set (see Fig. S1 in the Supplement).
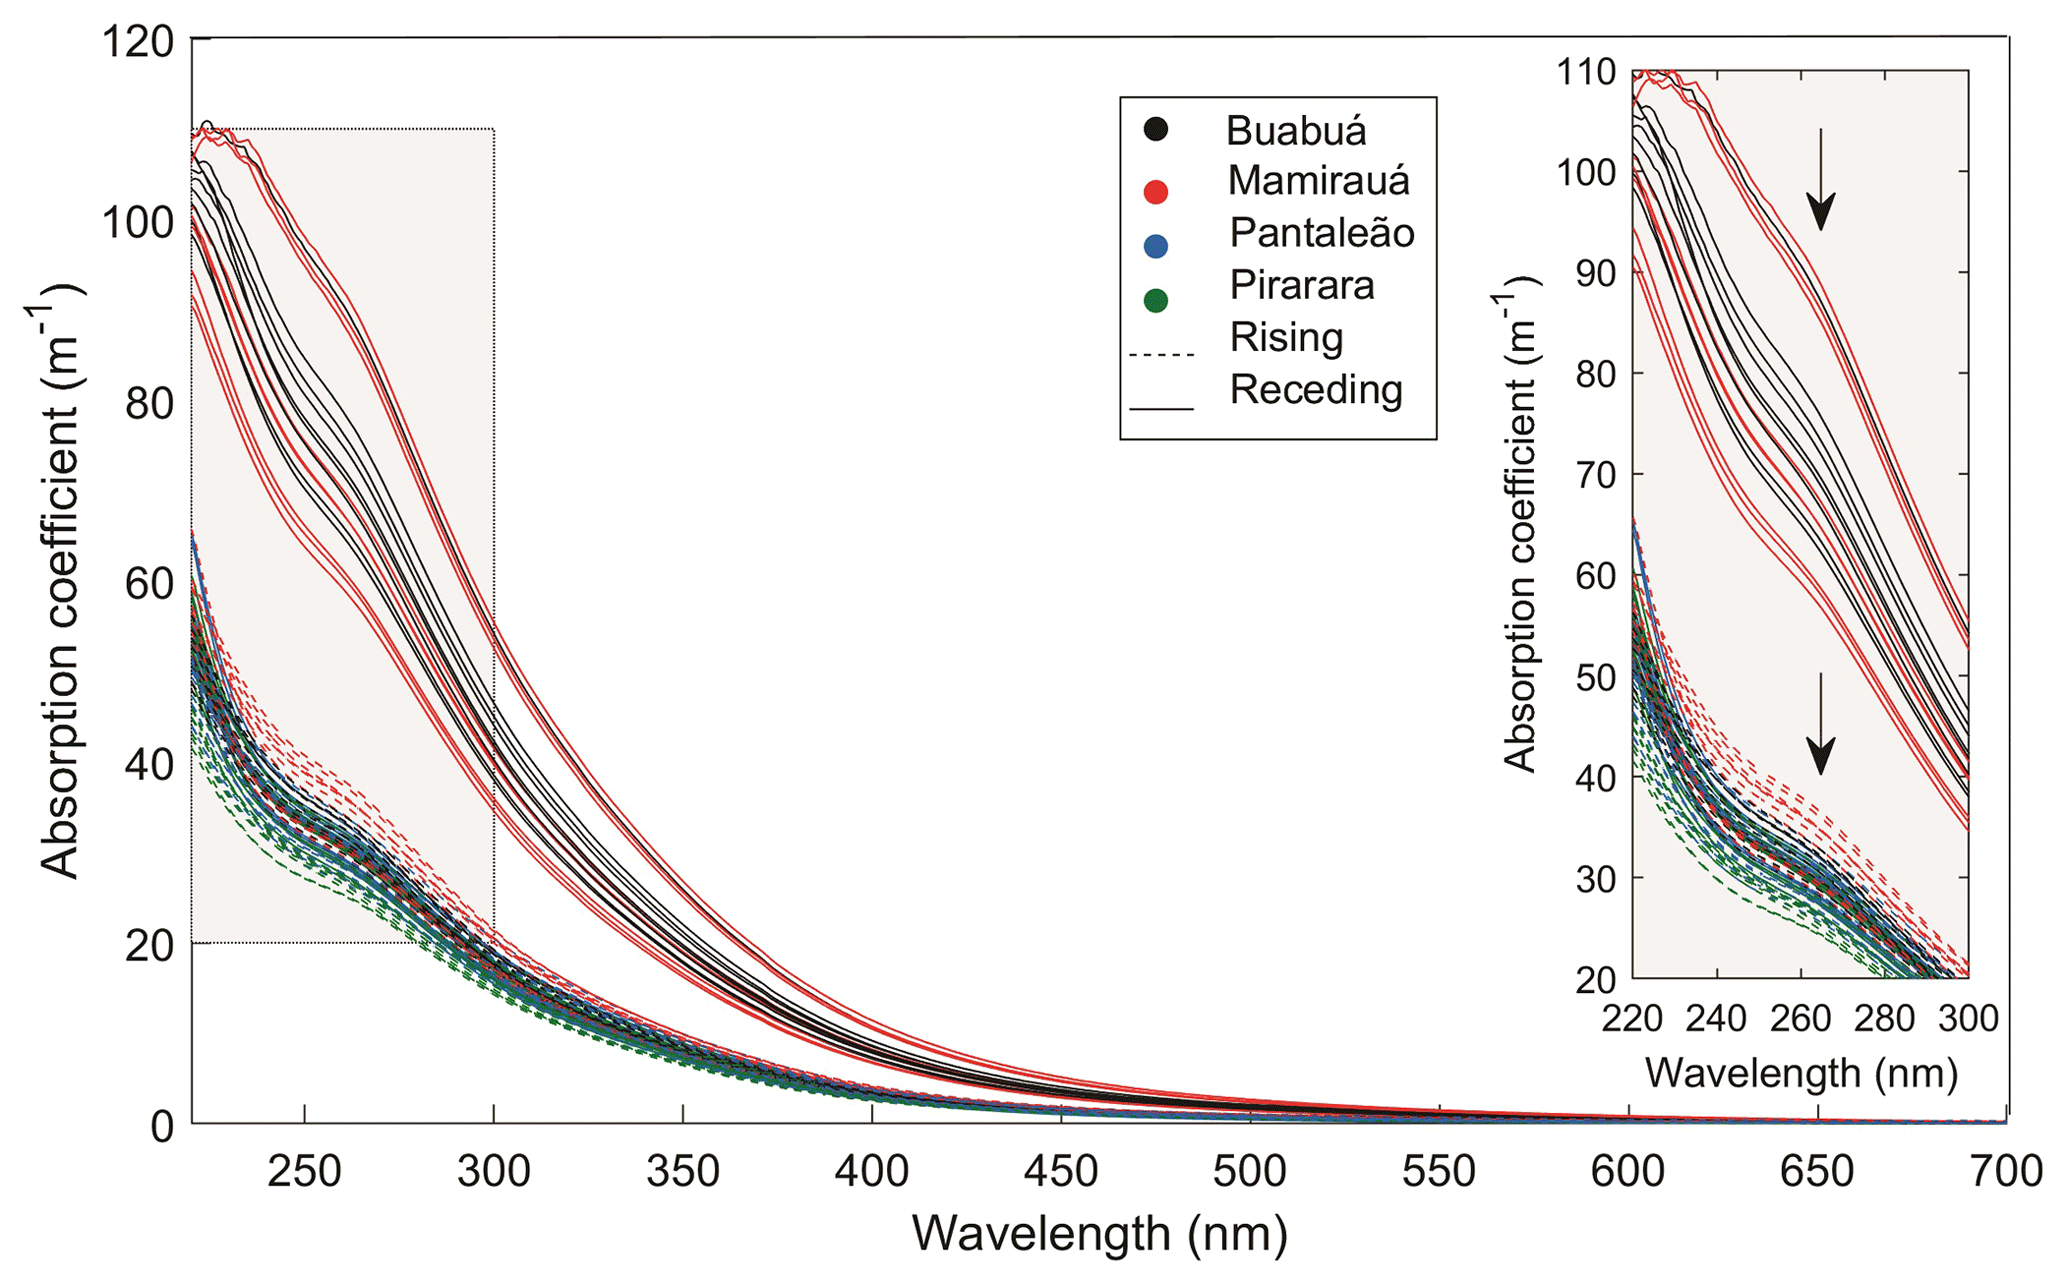
Figure 3aCDOM absorption spectra collected in the Buabuá (black), Mamirauá (red), Pantaleão (blue) and Pirarara (green) lakes during rising (solid line) and receding (dash line) limb of hydrograph. The gray rectangle represents the zoomed-in area on the right-hand side. The black arrows indicate the shoulder between 245 and 290 nm.
The mean S275–295 of each hydrograph stage also displayed the presence of two distinct groups: one including Mamirauá and Buabuá samples and the other including Pantaleão and Pirarara (Fig. 4). S275–295 in all samples from Buabuá and Mamirauá was close to or below 0.015 nm−1 in the rising limb and equal to or higher than 0.016 nm−1 in the receding limb. However, S275–295 in all samples from Pantaleão and Pirarara was above 0.015 nm−1 in the rising limb and below 0.0155 nm−1 in the receding limb (except for one single sample from Pantaleão). Nonetheless, the average S275–295 of each hydrograph stage was also significantly different between stages (one-way ANOVA, p=0.03).
Figure 4Dispersion diagram of average S275–295 (nm−1) at each hydrograph stage (rising and receding) and in all lakes. The dotted ellipses represent the two groups identified.
The average SR of each hydrograph stage the same as S275–295 indicated differences between the lakes surrounded by flooded forest and those near the river (see Fig. S2). The relationship between these two parameters (linear correlation, r2=0.9, p<0.001) indicated that they could be tracking similar pools of DOM (Hansen et al., 2016).
Different values for SUVA254 were also observed, although with less scatter, with values ranging from 9.44 L mgC−1 m−1 at Buabuá during the rising limb to 6.98 L mgC−1 m−1 at Pirarara during the receding limb (Table 1).
3.2 Seasonal relationship between aCDOM and S275–295
The relationship between aCDOM(440) and S275–295 varied between the hydrograph stages (Fig. 5). At the receding limb, S275–295 varied between samples while aCDOM(440) remained almost constant. However, during the rising limb, the variation in S275–295 was followed by changes in aCDOM(440). The relationship between S275–295 and aCDOM(440) during the rising limb is described by Eq. (5):
Once the relationship between aCDOM(440) and S275–295 was established for rising water, the model for estimating aCDOM(440) based on Rrs was also calibrated for this period (Eq. 6):
Validation results showed a good explanation of the model's variance (r2=0.78) and predicted values close to the observed values (%NRMSE = 15.12, MSE = 0.53 m−1), indicating the feasibility of estimating aCDOM(440) from Rrs (Fig. 6).
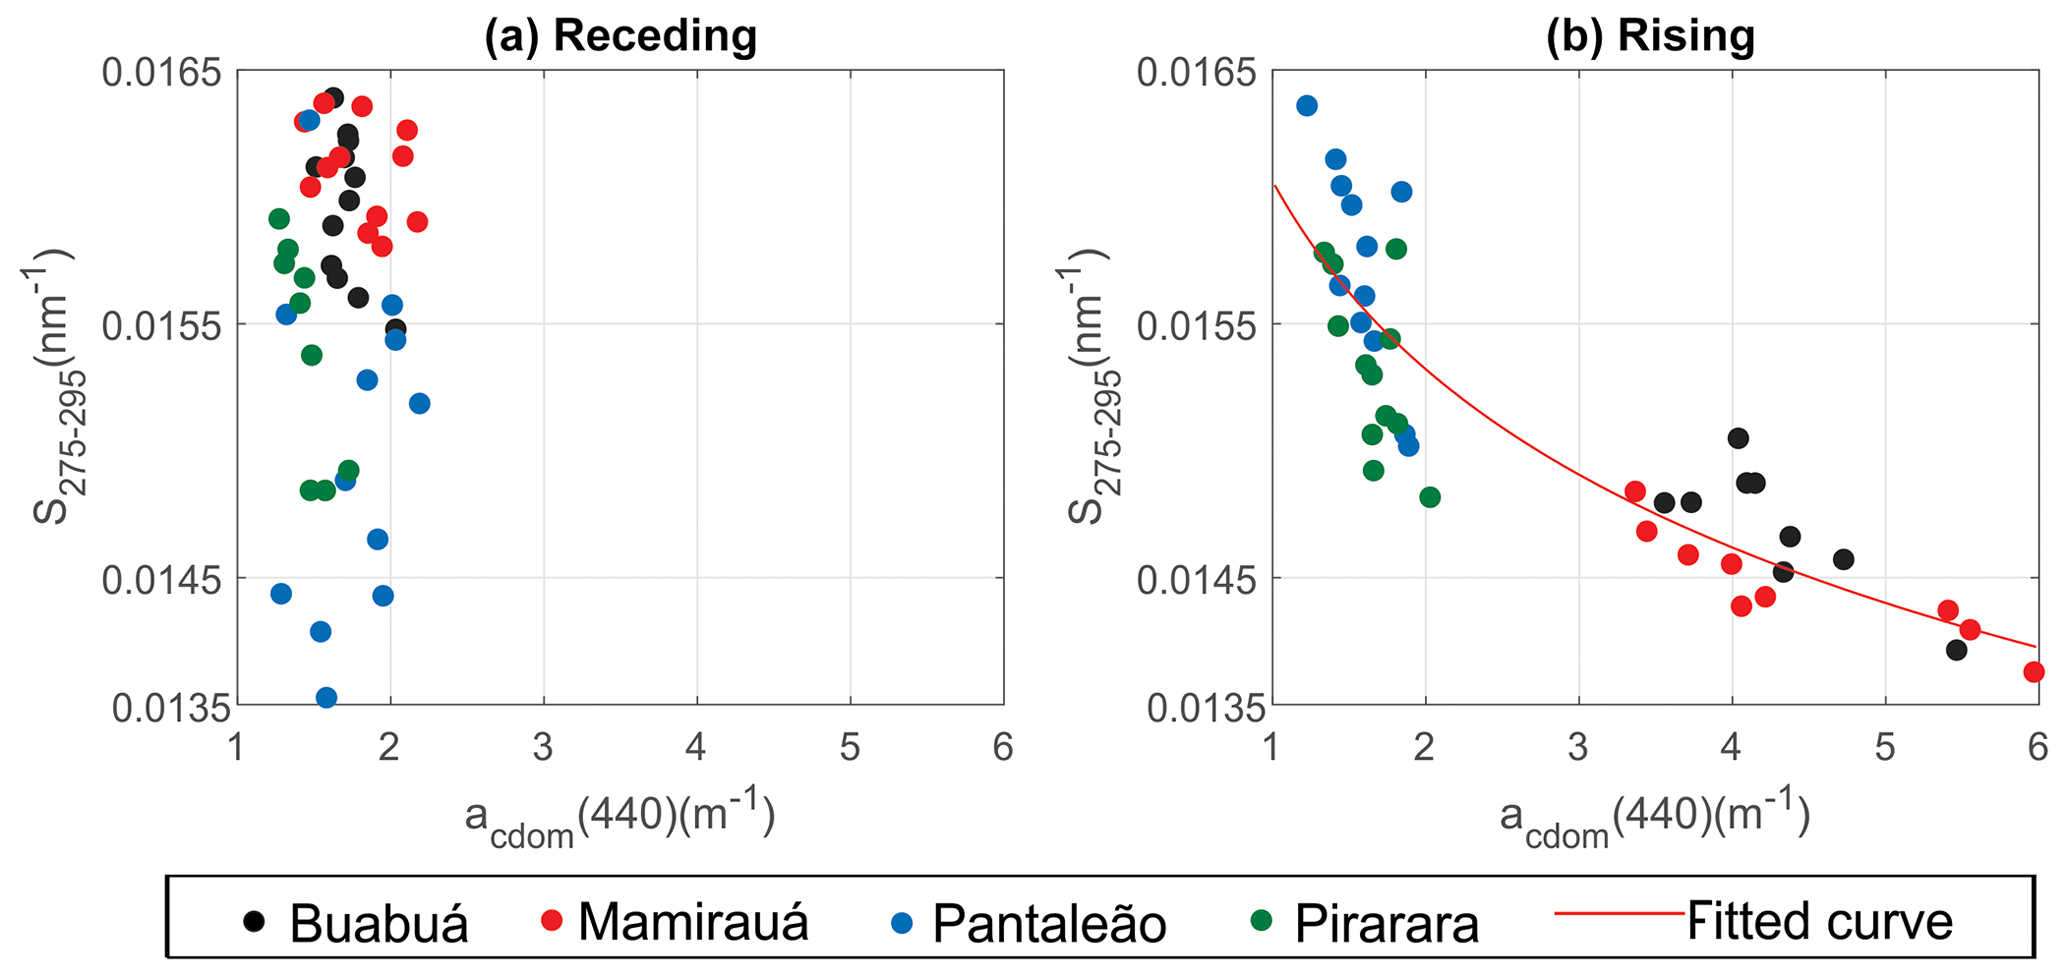
Figure 5Scatterplot of aCDOM(440) (m−1) versus S275–295 (nm−1) for the (a) receding and (b) rising limbs of the hydrograph.
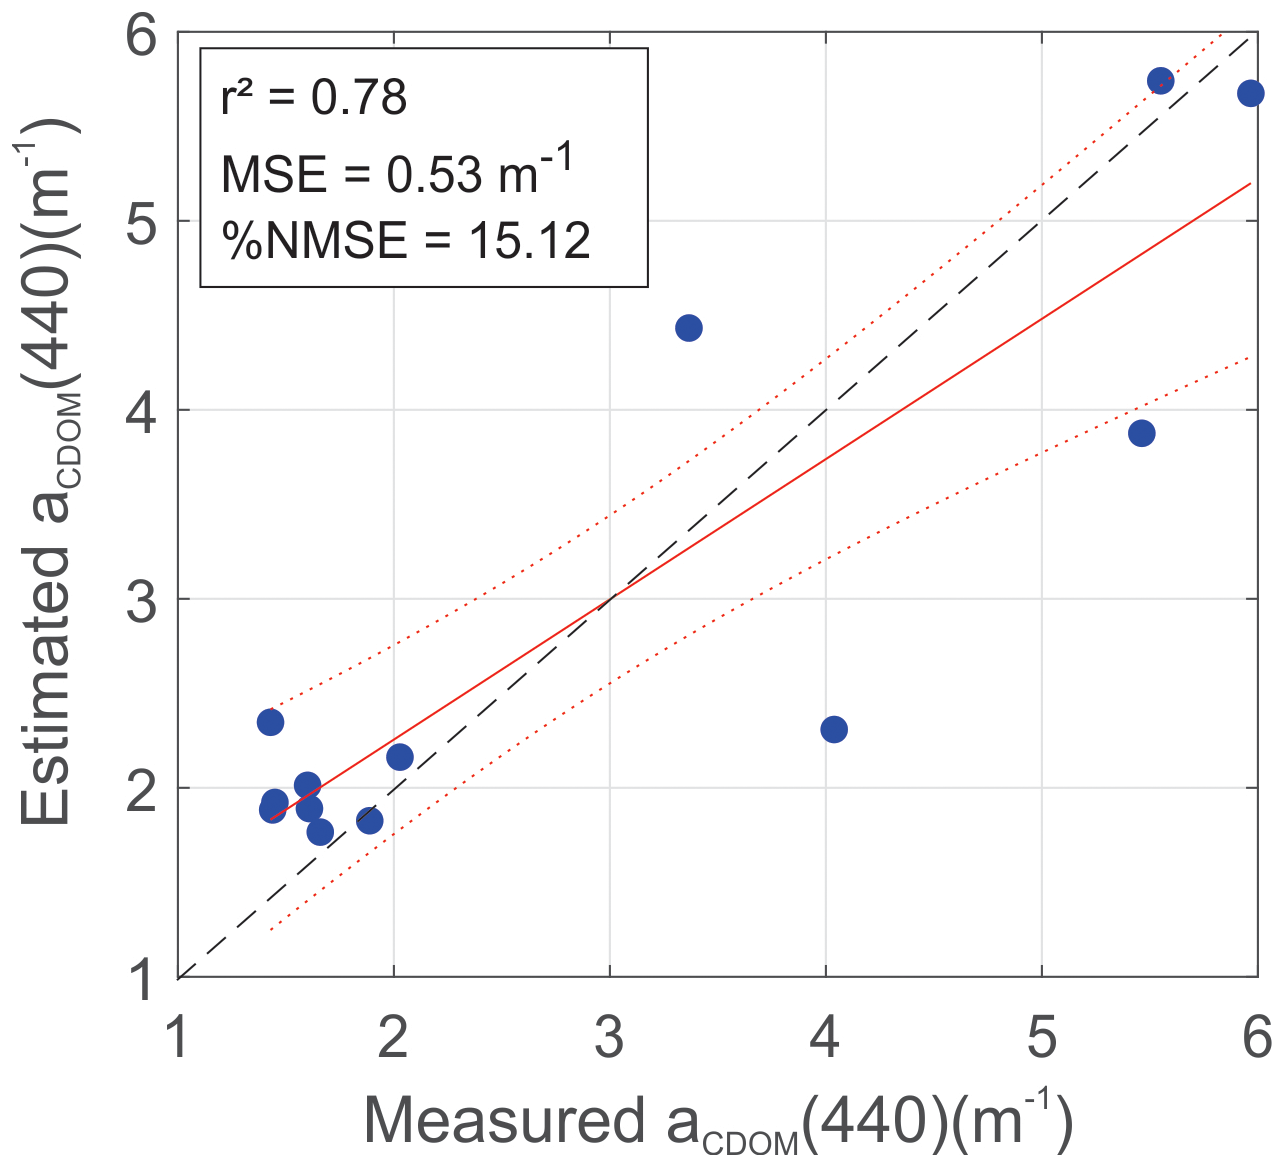
Figure 6Measured versus estimated aCDOM(440) (m−1). Equation (4) was used to estimate aCDOM(440) (y axis). The red solid line indicates the regression line between the measured and estimated values, the two red dotted lines show the 95 % confidence interval, and the black dashed line is the 1 : 1 line.
The water levels of the rivers in the floodplain were quite similar between the sampling campaigns during the rising and receding limbs, suggesting that the influence of the rivers into the lakes is similar. Thus, the flood pulse should be an important factor in the mobilization of DOM into the lakes. During the rising limb, the lakes surrounded by flood forest and close to the Solimões River have more DOM, which is indicated by a higher DOC concentration and a higher aCDOM(440), compared with those located close to Japurá River. A large amount of DOM is also characterized by a higher degree of aromaticity (high SUVA254) and a high molecular weight (low S275–295) in Mamirauá and Buabuá lakes, even though the chlorophyll-a concentration is higher in these lakes during this stage (Jorge et al., 2017b). The higher aromaticity and molecular weight at the rising limb is indicative of allochthonous DOM in these lakes (de Melo et al., 2020; Shen et al., 2012; Spencer et al., 2008). However, the DOC concentration was low, and DOM was characterized by a low molecular weight during the rising limb at Pantaleão and Pirarara lakes. These distinct DOM characteristics between lakes are explained by the flood pulse of the Solimões River. During the rising limb, the Solimões River inflow into the floodplain as overland flow crosses a large area of forest and carries a considerable amount of organic matter into Buabuá and Mamirauá lakes, increasing the amount of fresh plant-derived DOM. This results in more high molecular weight DOM at these lakes. Pantaleão and Pirarara lakes, in comparison, are located far from Solimões River and are instead connected to Japurá River, which is located in the eastern extreme of the floodplain. Thus, they are not affected by the Solimões River overland flow at the beginning of the rising limb, receiving only a minor input of organic matter compared with Buabuá and Mamirauá. Therefore, at the rising limb of the hydrograph, DOM is expected to show significant differences between the lakes surrounded by flooded forests located near the Solimões River and those connected to Japurá River (Abdo and Silva, 2004; Almeida and Melo, 2009; Carvalho et al., 2011; Henderson, 1999; Queiroz, 2007). However, this difference no longer existed during the receding limb, and no variation in the DOM quality parameters was observed between lakes. All of the lakes showed a low DOC concentration, a low aCDOM(440), a high S275–295 and a low SUVA254.
As the study area consists entirely of a floodplain, the entire ecosystem is flooded during the high water period. According to Ferreira-Ferreira et al. (2015), the entire area shown in Fig. 1 is flooded for periods of up to 295 d in a year depending on the flood peak. A previous study in this area (Affonso et al., 2011) indicated that all water bodies become interconnected with the main channels and rivers during the high water period and display the lowest spatial variability in all limnological variables, including the DOC concentration. The DOC coefficient of variation among the sampled water bodies dropped from 53.87 % at low water to 20.89 % at high water in the 2009 hydrological year (Affonso et al., 2011). In the Amazon Basin, DOC accounts for 70 % of the total organic matter, and floodplain areas are relevant sources of DOC to the Solimões River/Amazon River (Morreira-Turq et al., 2003). Thus, due to the connection of the entire floodplain during the high water phase, it is expected that the DOM quality parameters will be similar across lakes at the beginning of the receding limb.
The shape of the aCDOM spectra also highlights the differences in the DOM quality between the studied lakes and hydrograph stages. The presence of a shoulder in most of the spectra indicates that transformation processes are changing the DOM quality. The observed feature could be a result of the in situ production of protein-like materials by biological processes and/or due to photodegradation (Yamashita and Tanoue, 2009). The difference in the spectra from Buabuá and Mamirauá between the hydrograph stages could be caused by both the higher time of insolation (+35 %) during receding water compared with that of the rising water (Mamirauá Sustainable Development Institute, 2018) and the entrance of fresh material during the rising period compared with the presence of old, degraded material during the receding period. Higher SR values during the receding limb compared with rising limb also indicate that photodegradation processes are stronger during this period. Transformation processes affecting the DOM quality in aquatic environments may make up for sources of DOM. Therefore, the absorption indices analyzed here demonstrate their potential with respect to studying the dynamics of DOM in the lakes.
The DOM quality dynamics between the rising and receding limbs was also reflected in aCDOM, demonstrating its importance as a monitoring parameter. Looking at large-scale studies, the literature reports several models relating aCDOM(440) and remote sensing data; however, as they are empirical, they are environmentally and seasonally dependent (Zhu et al., 2014). Kutser et al. (2016) tried to calibrate a model using data from Estonian lakes, Três Marias Reservoir (Brazil) and a floodplain lake located in the Amazon (Curuai Lake). However, they were not able to fit a model describing the entire data set, which indicates that model development depends on DOM quality and degradation dynamics (Hansen et al., 2016). Because of the distinct dynamics of DOM observed during the hydrograph stages (in response to the flood pulse), it is rational to divide the data set into two sections: the rising and receding limbs. For the receding limb, it was difficult to draw conclusions regarding DOM origin and to evaluate DOM quality once the DOM present in the lakes was old, highly degraded and may have originated from a mixture of different pools (Wagner et al., 2019). For the rising limb, a significant correlation between aCDOM(440) and S275–295 was found, with high (low) aCDOM(440) values corresponding to low (high) S275–295 values. The rising limb is the crucial phase in the study of DOM quality once the fresh, mobilized DOM into the lakes can be differentiated from the already old and degraded DOM. Thus, DOM dynamics could be studied using remote sensing during the rising limb in the floodplain lakes.
Models available in the literature to estimate aCDOM usually use the ratio between the green and red bands (Toming et al., 2016; Zhu et al., 2014). In this study, we tested the correlation between aCDOM(440) values and the ratio between the green and red bands, but the results were poor (see Fig. S3). Thus, we proposed a new model to estimate aCDOM(440) using additional bands (Eq. 6). The validation of the aCDOM(440) model showed an accurate estimation of values, especially considering the various uncertainties related to remote sensing methods. Thus, the modeling results are encouraging and suggest that MSI images, when available, might be applied to the study of the DOM properties of the Amazon floodplain lakes during the rising water level. However, the models have the following limitations: (1) an empirical nature that demands calibration for application in other data sets and (2) a small range of aCDOM sampled (1.2 to 6.0 m−1). These limitations indicate the need for new experiments that include a larger number of lakes spread over a wider range of distances from the Solimões River bank, a wider span of the rising hydrograph stage and DOM molecular analyses to validate the optical indices.
The present study indicates that the use of DOM optical indices provided a deeper understanding of the connections between the Solimões and Japurá rivers' flood pulses and DOM dynamics in the Amazon floodplain lakes. These results corroborate the most recent findings in the literature and indicate that there is an urgent need for research that explores new types of indices which integrate both optical spectral properties and remote sensing data. The relationship between aCDOM(440) and S275–295 established during one crucial hydrography stage in DOM mobilization highlights the possibility of expanding the study of DOM dynamics using remote sensing.
The empirical model relating Rrs and aCDOM(440) provided robust statistics, indicating the high potential of the MSI sensor for the study of DOM. Even though this study is a first attempt to use simulated MSI data to estimate aCDOM in Amazon floodplain lakes, the results discussed herein seem very promising, particularly considering the new generation of higher temporal resolution satellite-borne sensors and the resources (costs and time) involved with DOM analysis in the laboratory.
Data were provided by the Instrumentation Laboratory for Aquatic Systems of the National Institute for Space Research and will be made available upon request.
The supplement related to this article is available online at: https://doi.org/10.5194/bg-17-5355-2020-supplement.
MPdS, LASdC, EN and CCFB planned and designed the research. DSFJ and CCFB carried out parts of the field work and conducted a first version of the data processing. MPdS undertook the statistical analysis and wrote the paper with contributions from all co-authors.
The authors declare that they have no conflict of interest.
We are very grateful to Vitor Martins, Renato Ferreira, Jean Farhat, Franciele Sarmento and Waterloo Pereira Filho for their assistance during field missions. We would like to acknowledge Helder Queiroz and the Mamirauá Institute for their support. We would also like to thank Otávio Cristiano Montanher for the correction of flow rate data and Ivan Bergier for suggestions. We are grateful to the reviewers for their thoughtful comments and their efforts towards improving our paper.
This research has been supported by the National Council for Scientific and Technological Development (grant nos. CNPq 461469/2014-6, CNPq 304568/2014-7 and CNPq 131242/2016-4) and the Brazilian Development Bank (grant no. MSA-BNDES 1022114003005).
This paper was edited by Koji Suzuki and reviewed by three anonymous referees.
Abdo, M. S. A. and Silva, C. J.: Limnological characteristics of the water bodies of the Corutuba Nesting Site in Brazil's Pantanal, Acta Limnologica Brasiliensia, 6, 359–368, 2004.
Affonso, A. G., Queiroz, H. L. d., and Novo, E. M. L. d. M.: Limnological characterization of floodplain lakes in Mamirauá Sustainable Development Reserve, Central Amazon (Amazonas State, Brazil), Acta Limnologica Brasiliensia, 23, 95–108, 2011.
Agencia Nacional de Aguas (ANA): Hidroweb, available at: http://www.snirh.gov.br/hidroweb/, last access: 26 October 2020.
Almeida, F. F. and Melo, S.: Limnological considerations about an Amazonian floodplain lake (Catalao lake–Amazonas State, Brazil)/Consideracoes limnologicas sobre um lago da planicie de inundacao amazonica, Acta Sci., 31, 387–396, 2009.
Augusto-Silva, P. B., Ogashawara, I., Barbosa, C. C. F., De Carvalho, L. A. S., Jorge, D. S. F., Fornari, C. I., and Stech, J. L.: Analysis of MERIS reflectance algorithms for estimating chlorophyll-a concentration in a Brazilian reservoir, Remote Sensing, 6, 11689–11707, https://doi.org/10.3390/rs61211689, 2014.
Ayres, J. M.: As matas de várzea do Mamirauá, Conselho Nacional de Desenvolvimento Científico e Tecnológico, Sociedade Civil Mamirauá, Tefé, Brasil, 99 pp., 1995.
Brezonik, P. L., Olmanson, L. G., Finlay, J. C., and Bauer, M. E.: Factors affecting the measurement of CDOM by remote sensing of optically complex inland waters, Remote Sens. Environ., 157, 199–215, https://doi.org/10.1016/j.rse.2014.04.033, 2015.
Bricaud, A., Morel, A., and Prieur, L.: Absorption by dissolved organic matter in the sea (yellow substance) in the UV and visible domains, Limnol. Oceanogr., 26, 43–53, https://doi.org/10.4319/lo.1981.26.1.0043, 1981.
Bukata, R. P. J., Jerome, J. H., Kondratyev, K. Y., and Pozdnyakov, D. V.: Optical properties and remote sensing of inland and coastal waters, Boca Taton, Florida, CRC Press LLC, 362 pp., 1995.
Carvalho, P., Bini, L. M., Thomaz, S. M., Oliveira, L. G., Robertson, B., Tavechio, W. L. G., and Darwisch, A. J.: Comparative limnology of South American floodplain lakes and lagoons, Acta Scientiarum Maringa, 23, 256–273, 2011.
Castello, L., Viana, J. P., Watkins, G., Pinedo-Vasquez, M., and Luzadis, V. A.: Lessons from integrating fishers of arapaima in small-scale fisheries management at the Mamirauá Reserve, Amazon, Environ. Manage., 43, 197–209, https://doi.org/10.1007/s00267-008-9220-5, 2009.
Chen, J., Zhu, W. N., Tian, Y. Q., and Yu, Q.: Estimation of colored dissolved organic matter from landsat-8 imagery for complex inland water: case study of Lake Huron, J. Appl. Remote Sens., 11, 1–12, https://doi.org/10.1109/tgrs.2016.2638828, 2017.
Coble, P. G.: Marine optical biogeochemistry: the chemistry of ocean color, Chem. Rev., 107, 402–418, https://doi.org/10.1021/cr050350+, 2007.
de Melo, M. L., Kothawala, D. N., Bertilsson, S., Amaral, J. H., Forsberg, B., and Sarmento, H.: Linking dissolved organic matter composition and bacterioplankton communities in an Amazon floodplain system, Limnol. Oceanogr., 65, 63–76, 2020.
Ferreira-Ferreira, J., Silva, T. S. F., Streher, A. S. Affonso, A. G., Furtado, L. F. A., Forsberg, B. R., Valsecchi, J., Queiroz, H. L., and Novo, E. M. L. M.: Combining ALOS/PALSAR derived vegetation structure and inundation patterns to characterize major vegetation types in the Mamirauá Sustainable Development Reserve, Central Amazon floodplain, Brazil, Wetl. Ecol. Manag., 23, 41–59, https://doi.org/10.1007/s11273-014-9359-1, 2015.
Fichot, C. G., Kaiser, K., Hooker, S. B., Amon, R. M., Babin, M., Bélanger, S., Walker, S. A., and Benner, R.: Pan-Arctic distributions of continental runoff in the Arctic Ocean, Sci. Rep., 3, 1053, https://doi.org/10.1038/srep01053, 2013.
Hansen, A. M., Kraus, T. E. C., Pellerin, B. A., Fleck, J. A., Downing, B. D., and Bergamaschi, B. A.: Optical properties of Dissolved Organic Matter (DOM): effects of biological and photolytic degradation, Limnol. Oceanogr., 61, 1015–1032, https://doi.org/10.1002/lno.10270, 2016.
Hastie, A., Lauerwald, R., Ciais, P., and Regnier, P.: Aquatic carbon fluxes dampen the overall variation of net ecosystem productivity in the Amazon basin: An analysis of the interannual variability in the boundless carbon cycle, Glob. Change Biol., 25, 2094–2111, 2019.
Helms, J. R., Stubbins, A., Ritchie, J. D., Minor, E. C., Kieber, D. J., and Mopper, K.: Absorption spectral slopes and slope ratios as indicators of molecular weight, source, and photobleaching of chromophoric dissolved organic matter, Limonol. Oceanogr., 53, 955–969, https://doi.org/10.4319/lo.2008.53.3.0955, 2008.
Henderson, P. A.: O ambiente aquático da Reserva Mamirauá, in: Estratégias de Manejo de recursos Pesqueiros em Mamirauá, edited by: Queiroz, H. L. and Crampton, W. G. R., SCM, MCT-CNPq. Brasília, Cap. 1, 1–9, 1999.
Inamdar, S., Finger, N., Singh, S., Mitchell, M., Levia, D., Bais, H., Scott, D., and McHale, P.: Dissolved organic matter (DOM) concentration and quality in a forested mid-Atlantic watershed, USA, Biogeochemistry, 108, 55–76, https://doi.org/10.1007/s10533-011-9572-4, 2012.
Jaffé, R., McKnight, D., Maie, N., Cory, R., McDowell, W. H., and Campbell, J. L.: Spatial and temporal variations in DOM composition in ecosystems: The importance of long-term monitoring of optical properties, J. Geophys. Res.-Biogeo., 113, G04032, https://doi.org/10.1029/2008JG000683, 2008.
Jorge, D. S. F., Barbosa, C. C., Affonso, A. G., and Novo, E. M. L. d. M.: Spatial-temporal characterization of optical properties of 4 lakes in the Mamirauá Sustainable Development Reserve – AM (MSDR), in: Anais XVIII Simpósio Brasileiro de Sensoriamento Remoto, Santos – SP, 2017a.
Jorge, D. S. F., Barbosa, C. C., Carvalho, L. S. d., Affonso, A. G., Lobo, F. d. L., and Novo, E. M. L. d. M.: SNR (signal-to-noise ratio) impact on water constituent retrieval from simulated images of optically complex amazon lakes, Remote Sensing, 9, 644, https://doi.org/10.3390/rs9070644, 2017b.
Junk, W. J., Bayley, P. B., and Sparks, R. E.: The flood pulse concept in river-floodplain systems, in: Proceedings of the International Large River Symposium, edited by: Dodge, D. P., Canadian Government Publishing Centre, Ottawa, 110–127, Special Publication of the Canadian Journal of Fisheries and Aquatic Sciences, no. 106, 1989.
Kirk, J. T. O.: Light and photosynthesis in aquatic ecosystems, 3rd Edn., Cambridge University Press, Cambridge, England, 528 pp., 2011.
Kutser, T., Pierson, D. C., Kallio, K. Y., Reinart, A., and Sobek, S.: Mapping lake CDOM by satellite remote sensing, Remote Sens. Environ., 94, 535–540, 2005.
Kutser, T., Casal Pascual, G., Barbosa, C., Paavel, B., Ferreira, R., Carvalho, L., and Toming, K.: Mapping inland water carbon content with Landsat 8 data, Int. J. Remote Sens., 37, 2950–2961, 2016.
Li, P. and Hur, J.: Utilization of UV-Vis spectroscopy and related data analyses for dissolved organic matter (DOM) studies: A review, Crit. Rev. Environ. Sci. Technol., 47, 131–154, 2017.
Maia, C. M. and Volpato, G. L.: Environmental light color affects the stress response of Nile tilapia, Zoology, 116, 64–66, https://doi.org/10.1016/j.zool.2012.08.001, 2013.
Mamirauá Sustainable Development Institute: Database of fluviometric data from Mamirauá Sustainable Development Reserve, available at: http://mamiraua.org.br/pt-br/pesquisa-e-monitoramento/monitoramento/fluviometrico/, last access: 23 June 2018.
Matsuoka, A., Larouche, P., Poulin, M., Vinvent, W., and Hattori, H.: Phytoplankton community adaptation to changing light levels in the southern Beaufort Sea, Canadian Arctic, Estuar. Coast. Shelf S., 82, 537–546, 2009.
Matsuoka, A., Bricaud, A., Benner, R., Para, J., Sempéré, R., Prieur, L., Bélanger, S., and Babin, M.: Tracing the transport of colored dissolved organic matter in water masses of the Southern Beaufort Sea: relationship with hydrographic characteristics, Biogeosciences, 9, 925–940, https://doi.org/10.5194/bg-9-925-2012, 2012.
Mobley, C. D.: Estimation of the remote-sensing reflectance from above-surface measurements, Appl. Optics, 38, 7442–7455, https://doi.org/10.1364/ao.38.007442, 1999.
Moreira-Turcq, P., Seyler, P., Guyot, J. L., and Etcheber, H.: Exportation of organic carbon from the Amazon River and its main tributaries, Hydrol. Process., 17, 1329–1344, 2003.
Mori, G. B., Schietti, J., Poorter, L., and Piedade, M. T. F.: Trait divergence and habitat specialization in tropical floodplain forests trees, PLoS ONE, 14, e0212232, https://doi.org/10.1371/journal.pone.0212232, 2019.
Mueller, J. L. and Fargion, G. S.: Ocean Optics Protocols for Satellite Ocean Color Sensor Validation, Revision 3, NASA TM 2002-210004, NASA Goddard Space Flight Center, Greenbelt, MD, USA, p. 308, 2002.
Queiroz, H. L.: Classification of water bodies based on biotic and abiotic parameters at the várzeas of Mamirauá Reserve, Central Amazon, Uakari, 3, 19–34, 2007.
Richey, J. E., Melack, J. M., Aufdenkampe, A. K., Ballester, V. M., and Hess, L. L.: Outgassing from Amazonian rivers and wetlands as a large tropical source of atmospheric CO2, Nature, 416, 617–620, https://doi.org/10.1038/416617a, 2002.
Seekell, D. A., Lapierre, J.-F., and Cheruvelil, K. S.: A geography of lake carbon cycling, Limnol. Oceanogr. Lett., 3, 49–56, 2018.
Shen, Y., Fichot, C. G., and Benner, R.: Floodplain influence on dissolved organic matter composition and export from the Mississippi-Atchafalaya River system to the Gulf of Mexico, Limnol. Oceanogr., 57, 1149–1160, 2012.
Spencer, R. G., Aiken, G. R., Wickland, K. P., Striegl, R. G., and Hernes, P. J.: Seasonal and spatial variability in dissolved organic matter quantity and composition from the Yukon River basin, Alaska, Global Biogeochem. Cy., 22, GB4002, https://doi.org/10.1029/2008GB003231, 2008.
Toming, K., Kutser, T., Laas, A., Sepp, M., Paavel, B., and Noges, T.: First experiences in mapping lake water quality parameters with Sentinel-2 MSI imagery, Remote Sensing, 8, 1–14, https://doi.org/10.3390/rs8080640, 2016.
Tranvik, L. J., Downing, J. A., Cotner, J. B., Loiselle, S. A., Striegl, R. G., Ballatore, T. J., Dillon, P., Finlay, K., Fortino, K., Knoll, L. B., Kortelainen, P. L., Kutser, T., Larsen, S., Laurion, I., Leech, D. M., McCallister, S. L., McKnight, D. M., Melack, J. M., Overholt, E., Porter, J. A., Prairie, Y., Renwick, W. H., Roland, F., Sherman, B. S., Schindler, D. W., Sobek, S., Tremblay, A., Vanni, M. J., Verschoor, A. M., von Wachenfeldt, E., and Weyhenmeyer, G. A.: Lakes and reservoirs as regulators of carbon cycling and climate, Limnol. Oceanogr., 54, https://doi.org/10.4319/lo.2009.54.6_part_2.2298, 2009.
TRIOS: Trios sensor, avaliable at: https://www.trios.de/en/ (last access: 26 October 2020), 2018.
Vantrepotte, V., Danhiez, F. P., Loisel, H., Ouillon, S., Mériaux, X., Cauvin, A., and Dessailly, D.: CDOM-DOC relationship in contrasted coastal waters: implication for doc retrieval from ocean color remote sensing observation, Opt. Express, 23, 33–54, https://doi.org/10.1364/oe.23.000033, 2015.
Volpato, G. L., Duarte, C. R. A., and Luchiari, A. C.: Environmental color affects Nile tilapia reproduction, Braz. J. Med. Biol. Res., 37, 479–483, https://doi.org/10.1590/s0100-879x2004000400004, 2004.
Wagner, S., Fair, J. H., Matt, S., Hosen, J. D., Raymond, P., Saiers, J., Shanley, J. B., Dittmar, T., and Stubbins, A.: Molecular Hysteresis: Hydrologically Driven Changes in Riverine Dissolved Organic Matter Chemistry During a Storm Event, J. Geophys. Res.-Biogeo., 124, 759–774, 2019.
Werdell, J., McKinna, L. I. W., Boss, E., Ackleson, S. G., Craig, S. E., Gregg, W. W., Lee, Z., Maritorena, S., Roesler, C. S., Rousseaux, C. S., Stramski, D., Sullivan, J. M., Twardowski, M. S., Tzortziou, M., and Zhang, X.: An overview of approaches and challenges for retrieving marine inherent optical properties from ocean color remote sensing, Prog. Oceanogr., 160, 186–212, https://doi.org/10.1016/j.pocean.2018.01.001, 2018.
Xie, H., Aubry, C., Bélanger, S., and Song, G.: The dynamics of absorption coefficients of CDOM and particles in the St. Lawrence estuarine system: Biogeochemical and physical implications, Mar. Chem., 128, 44–56, 2012.
Yamashita, Y. and Tanoue, E.: Basin scale distribution of chromophoric dissolved organic matter in the Pacific Ocean, Limnol. Oceanogr., 54, 598–609, 2009.
Zhu, W., Yu, Q., Tian, Y. Q., Becker, B. L., Zheng, T., and Carrick, H. J.: An assessment of remote sensing algorithms for colored dissolved organic matter in complex freshwater environments, Remote Sens. Environ., 140, 766–778, https://doi.org/10.1016/j.rse.2013.10.015, 2014.