the Creative Commons Attribution 4.0 License.
the Creative Commons Attribution 4.0 License.
 | 14 Nov 2020
Particulate rare earth element behavior in the North Atlantic (GEOVIDE cruise)
Marion Lagarde
Nolwenn Lemaitre
Hélène Planquette
Mélanie Grenier
Moustafa Belhadj
Pascale Lherminier
Catherine Jeandel
Particulate concentrations of the 14 Rare Earth Elements (PREE), yttrium, and 232-thorium were measured in 200 samples collected in the epipelagic (ca. 0–200 m) and mesopelagic (ca. 200–1500 m) zones of the North Atlantic during the GEOVIDE cruise (May/June 2014, R/V Pourquoi Pas?, GEOTRACES GA01), providing the most detailed snapshot of the PREE distribution in the North Atlantic so far. Concentrations of particulate cerium (PCe) varied between 0.2 and 16 pmol L−1, while particulate neodymium (PNd) concentrations ranged between 0.1 and 6.1 pmol L−1. Particulate ytterbium (PYb) concentrations ranged between 0.01 and 0.50 pmol L−1. In addition, this study showed that PREE distributions were also controlled by the biological production in the upper sunlit ocean and by remineralization processes in the mesopelagic area. Low surface concentrations combined with normalized PREE patterns displaying a negative Ce anomaly and HREE enrichments pointed to freshly formed biogenic particles imprinting the seawater signature. A significant relationship between biogenic silica (BSi) and PHREE was also observed in the Labrador and Irminger seas, due to the occurrence of strong diatom blooms at the sampling time. In order to identify dissolved-particulate processes independent of the ionic radius, we used PHo∕PY ratios and showed that absorption processes were predominant in the upper ocean, while adsorption processes dominated at deeper depths.
This study highlighted different lithogenic fractions of PREE and dispersion depending on the shelf: off the Iberian margin, up to 100 % of the PREE were determined to have a lithogenic origin. This lithogenic input spread westward along an intermediate nepheloid layer (INL), following isopycnals up to 1700 km away from the margin. In contrast, along the Greenland and Newfoundland margins, the circulation maintained lithogenic inputs of PREE along the coasts.
- Article
(5694 KB) - Full-text XML
-
Supplement
(1180 KB) - BibTeX
- EndNote


Particles and water mass circulation are the main vectors in transferring chemical species from the surface to the deep ocean (Gehlen et al., 2006; Kwon et al., 2009; Lam and Marchal, 2015; Ohnemus and Lam, 2015). Particles are abundant in the upper ocean (up to 1000 µg L−1), where dust inputs or important blooms occur and their concentrations decrease with depth in the subsurface and deep ocean (5 to 60 µg L−1 on average; McCave and Hall, 2002; Stemmann et al., 2002). Particles are usually divided in two classes: large sinking particles that dominate the vertical flux, and small particles that are in suspension in the water column. These small suspended particles represent over 80 % of the total particle mass (Lam et al., 2015, and references therein). In addition, their higher surface to volume ratios make suspended particles the main drivers of dissolved-particulate exchanges (Crecelius, 1980; Trull and Armand, 2001). Elements are up to 1000 times more concentrated in particles than in the dissolved phase (Lam et al., 2015), and among them trace metals are especially enriched in particles. For example, in the subpolar North Atlantic, particulate iron (PFe) concentrations can reach 50 nmol L−1, while dissolved Fe concentrations do not exceed 2.5 nmol L−1 (Tonnard et al., 2020). As the size spectrum between the particulate and dissolved phases is continuous, the separation between the two pools is truly operational, based on the porosity of the filters used to discriminate the two phases, usually 0.4 µm (Planquette and Sherrell, 2012). Concentrations may then depend on the choice of this limit.
In the ocean, three main sources of particles are distinguishable (Fowler and Knauer, 1986; Jeandel et al., 2015; Lam et al., 2015, and references therein). The first one is lithogenic, with inputs from the rivers, dust deposits, ice melting, hydrothermalism and resuspension of deposited sediments. The second is biogenic and related to the production of fresh organic matter by photosynthetic activity followed by zooplankton grazing and the following food web activity. The last one results from authigenic processes such as the precipitation and formation of red clays, oxides, and hydroxides. All these sources and processes lead to a very heterogeneous pool in time, space, and composition, evolving throughout their stay in the ocean and controlling the density of particles and consequently their fate in the water column. Then, exchanges between the particulate and dissolved phases determine the chemistry of seawater and the residence time of the chemical species in the ocean (Jeandel et al., 2015; Jeandel and Oelkers, 2015; Turekian, 1977).
Oceanic tracers such as Rare Earth Elements (REE) are adapted to the study of these exchanges (Jeandel et al., 1995; Kuss et al., 2001; Tachikawa et al., 1999b). Rare Earth Elements form a homogenous family characterized by a gradual filling of the 4f orbital as their atomic number increases. Except for cerium (Ce), their external orbital comprises three electrons, rendering their chemical properties relatively similar. However, the increasing weight concomitant with an increasing atomic number and the decreasing ionic radius generates slight differences between the light and heavy REE behaviors (LREE and HREE, respectively). In seawater REE are mostly complexed by carbonates, this complexation increasing with the atomic number: 86 % of lanthanum (La, the first REE of the series) is found as carbonates complexes, while this proportion is 99 % of lutetium (Lu, the last REE of the series; Schijf et al., 2015). Thus, the REE will react differently in the water column depending on various physical and geochemical processes, such as aggregation–disaggregation, dissolution, complexation, sorption, mineralization, and scavenging. These processes will lead to a fractionation along the REE series. Consequently, measuring the distribution of REE between the solid and dissolved phases can help trace and quantify these processes.
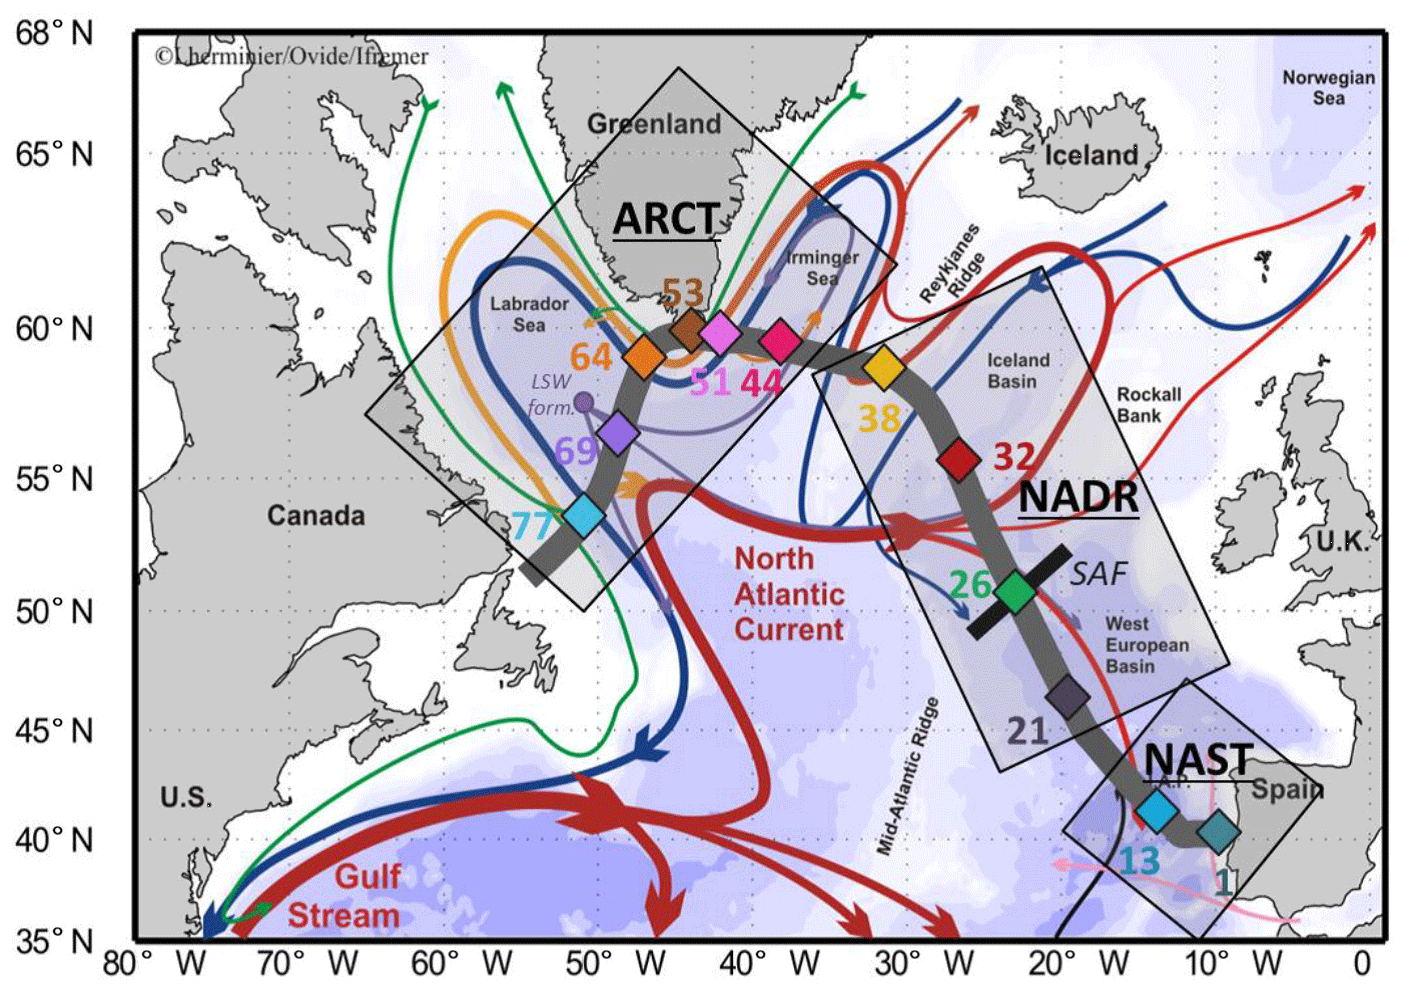
Figure 1Map of the studied area (subpolar North Atlantic, SPNA), including schematized circulation features, adapted from García-Ibáñez et al. (2015). Bathymetry is plotted in color with interval boundaries at 100 m, 1000 m, and every 1000 m below 1000 m. Red and green arrows represent the main surface currents; pink and orange arrows represent currents at intermediate depths; blue and purple arrows represent the deep currents. Diamonds indicate station locations in three distinct areas (grey squares): the North Atlantic Subtropical province (NAST), the North Atlantic Drift Region (NADR), and the Arctic region (ARCT). The approximate locations of the subarctic front (SAF; black bar crossing station no. 26) and the formation site of the Labrador Sea Water (LSW form.) are also indicated. The section used in ODV figures is symbolized by the thick grey line. From Lemaitre et al. (2018b).
Documenting these exchanges in the subarctic North Atlantic using REE among other tracers was one of the goals of the GEOVIDE cruise (2014, GA01 GEOTRACES cruise; Fig. 1). The North Atlantic is a key region of the global ocean, as it is the most important oceanic sink of anthropogenic CO2 (Khatiwala et al., 2013), and it is (i) a major place of deep water formation, mainly by convection, which drives the Atlantic Meridional Overturning Circulation (AMOC), and (ii) a productive area, representing up to 18 % of the global oceanic primary production (Sanders et al., 2014). The GEOVIDE section investigated stations close to the Iberian, Greenland, and Canadian coasts and crossed areas of contrasted surface productivity. This cruise was part of the GEOTRACES program, which aims to document trace elements cycles in the ocean by a better understanding of their sources and sinks, including their export by particles (Henderson et al., 2007). Constraining the drivers of the particle–solution exchanges is thus an important issue in this area.
In this context, we present the first basin-scale section of PREE concentrations and fractionation patterns in suspended particles collected in the subpolar North Atlantic (SPNA), along the GEOVIDE section, from the surface to 1500 m depth. In the following, we specifically discuss processes affecting the PREE distribution, such as lithogenic inputs from the margins, influence of biological activity, and the role of ionic radius in their fate in the water column.
2.1 Study area: hydrographical and biogeochemical context
Samples were collected in the epipelagic and mesopelagic zones (0–1500 m) during the GEOVIDE cruise (16 May to 30 June 2014, R/V Pourquoi Pas?) along the transect presented in Fig. 1. This figure also presents the main surface currents, as described in detail in Zunino et al. (2017) and García-Ibáñez et al. (2018), together with the three main biogeochemical provinces identified by Longhurst (1995) and described in detail by Lemaitre et al. (2018b): the subtropical North Atlantic (NAST), North Atlantic drift (NADR), and Arctic (ARCT) regions. The locations of the stations where suspended particles were sampled (Fig. 1) were chosen to be representative of the diversity of water masses (Fig. 2) and biogeochemical provinces (Sarthou et al., 2018). Warm and salty waters coming from the tropical Atlantic are advected towards the Arctic by the North Atlantic Current (NAC; see Table 1 for the abbreviation list). In response to air–sea exchanges and mixing with polar waters, surface waters become colder and fresher, but more importantly, denser. Thus, they tend to mix with underlying waters, particularly during convection events triggered by storms. In the Nordic Seas (between 65 and 80∘ N), the water column can be ventilated down to the bottom, while convection never exceeds 2000 m in the subpolar gyre. The freshly formed deep water then returns southwards mainly through western boundary currents (Daniault et al., 2016; García-Ibáñez et al., 2015, 2018; Zunino et al., 2017).
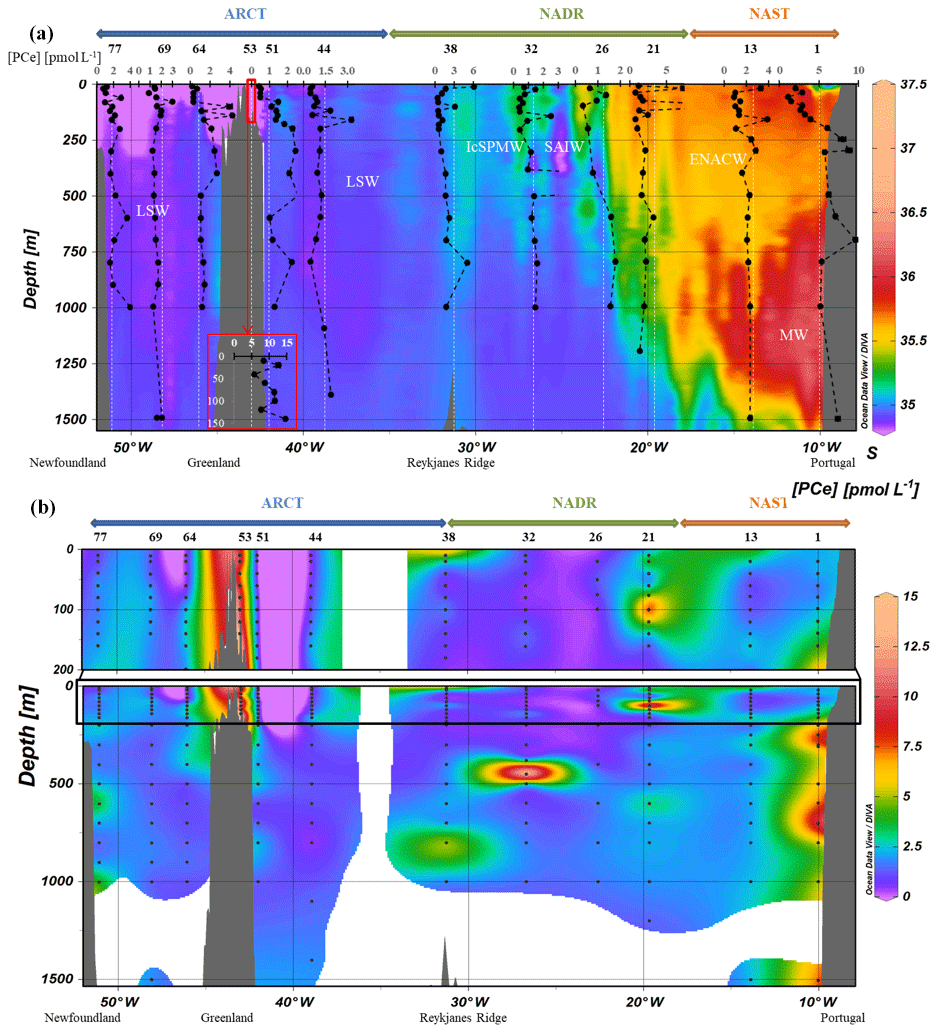
Figure 2(a) Vertical profiles of particulate [Ce] concentrations superimposed on salinity (S) measured by CTD at every GEOVIDE station (Lherminier and Sarthou, 2017); in white, the prevailing water masses characterized by a multi-parametric (OMP) analysis: the Mediterranean Water (MW), the Subarctic Intermediate Water, the East North Atlantic Central Water (ENACW), the Subpolar Mode Water (SPMW), the Irminger Subpolar Mode Water (IrSPMW), and the LSW (García-Ibáñez et al., 2018). For station no. 53, profiles are shifted to the bottom at a lower scale because of the shallow depth of the station. This map and the following were created with the software Ocean Data View (Schlitzer, 2016). (b) Particulate [Ce] concentrations interpolated with the DIVA gridding function of Ocean Data View along the section defined in Fig. 1, with a zoom on the first 200 m in the upper panel.
At the southeastern end of the section, the NAST province is characterized by warm and salty waters (García-Ibáñez et al., 2018; Longhurst, 1995; Reygondeau et al., 2018; Zunino et al., 2017). This province is depleted in nutrients despite being under the influence of continental inputs and was sampled during the declining stage of the cyanobacteria bloom (Lemaitre et al., 2018b). Station nos. 1 and 13 were sampled in the NAST. The North Atlantic Drift Region (NADR) is located between the NAST and the Reykjanes Ridge, with higher nutrient concentrations than in the NAST (Longhurst, 1995). A strong bloom of coccolithophorids, with a maximum intensity in the Icelandic basin, was occurring during the sampling time, and was associated with the highest primary production rate determined during the GEOVIDE cruise (1740 molC m−2 d−1, station no. 26, Fonseca-Batista et al., 2019) and with high carbon export (up to 80 molC m−2 d−1, station no. 32, Lemaitre et al., 2018b). Four open ocean stations were sampled in this province: within the southern branch of the NAC (station nos. 21 and 32), at the Subpolar Front (station no. 26), and above the Reykjanes Ridge (station no. 38).
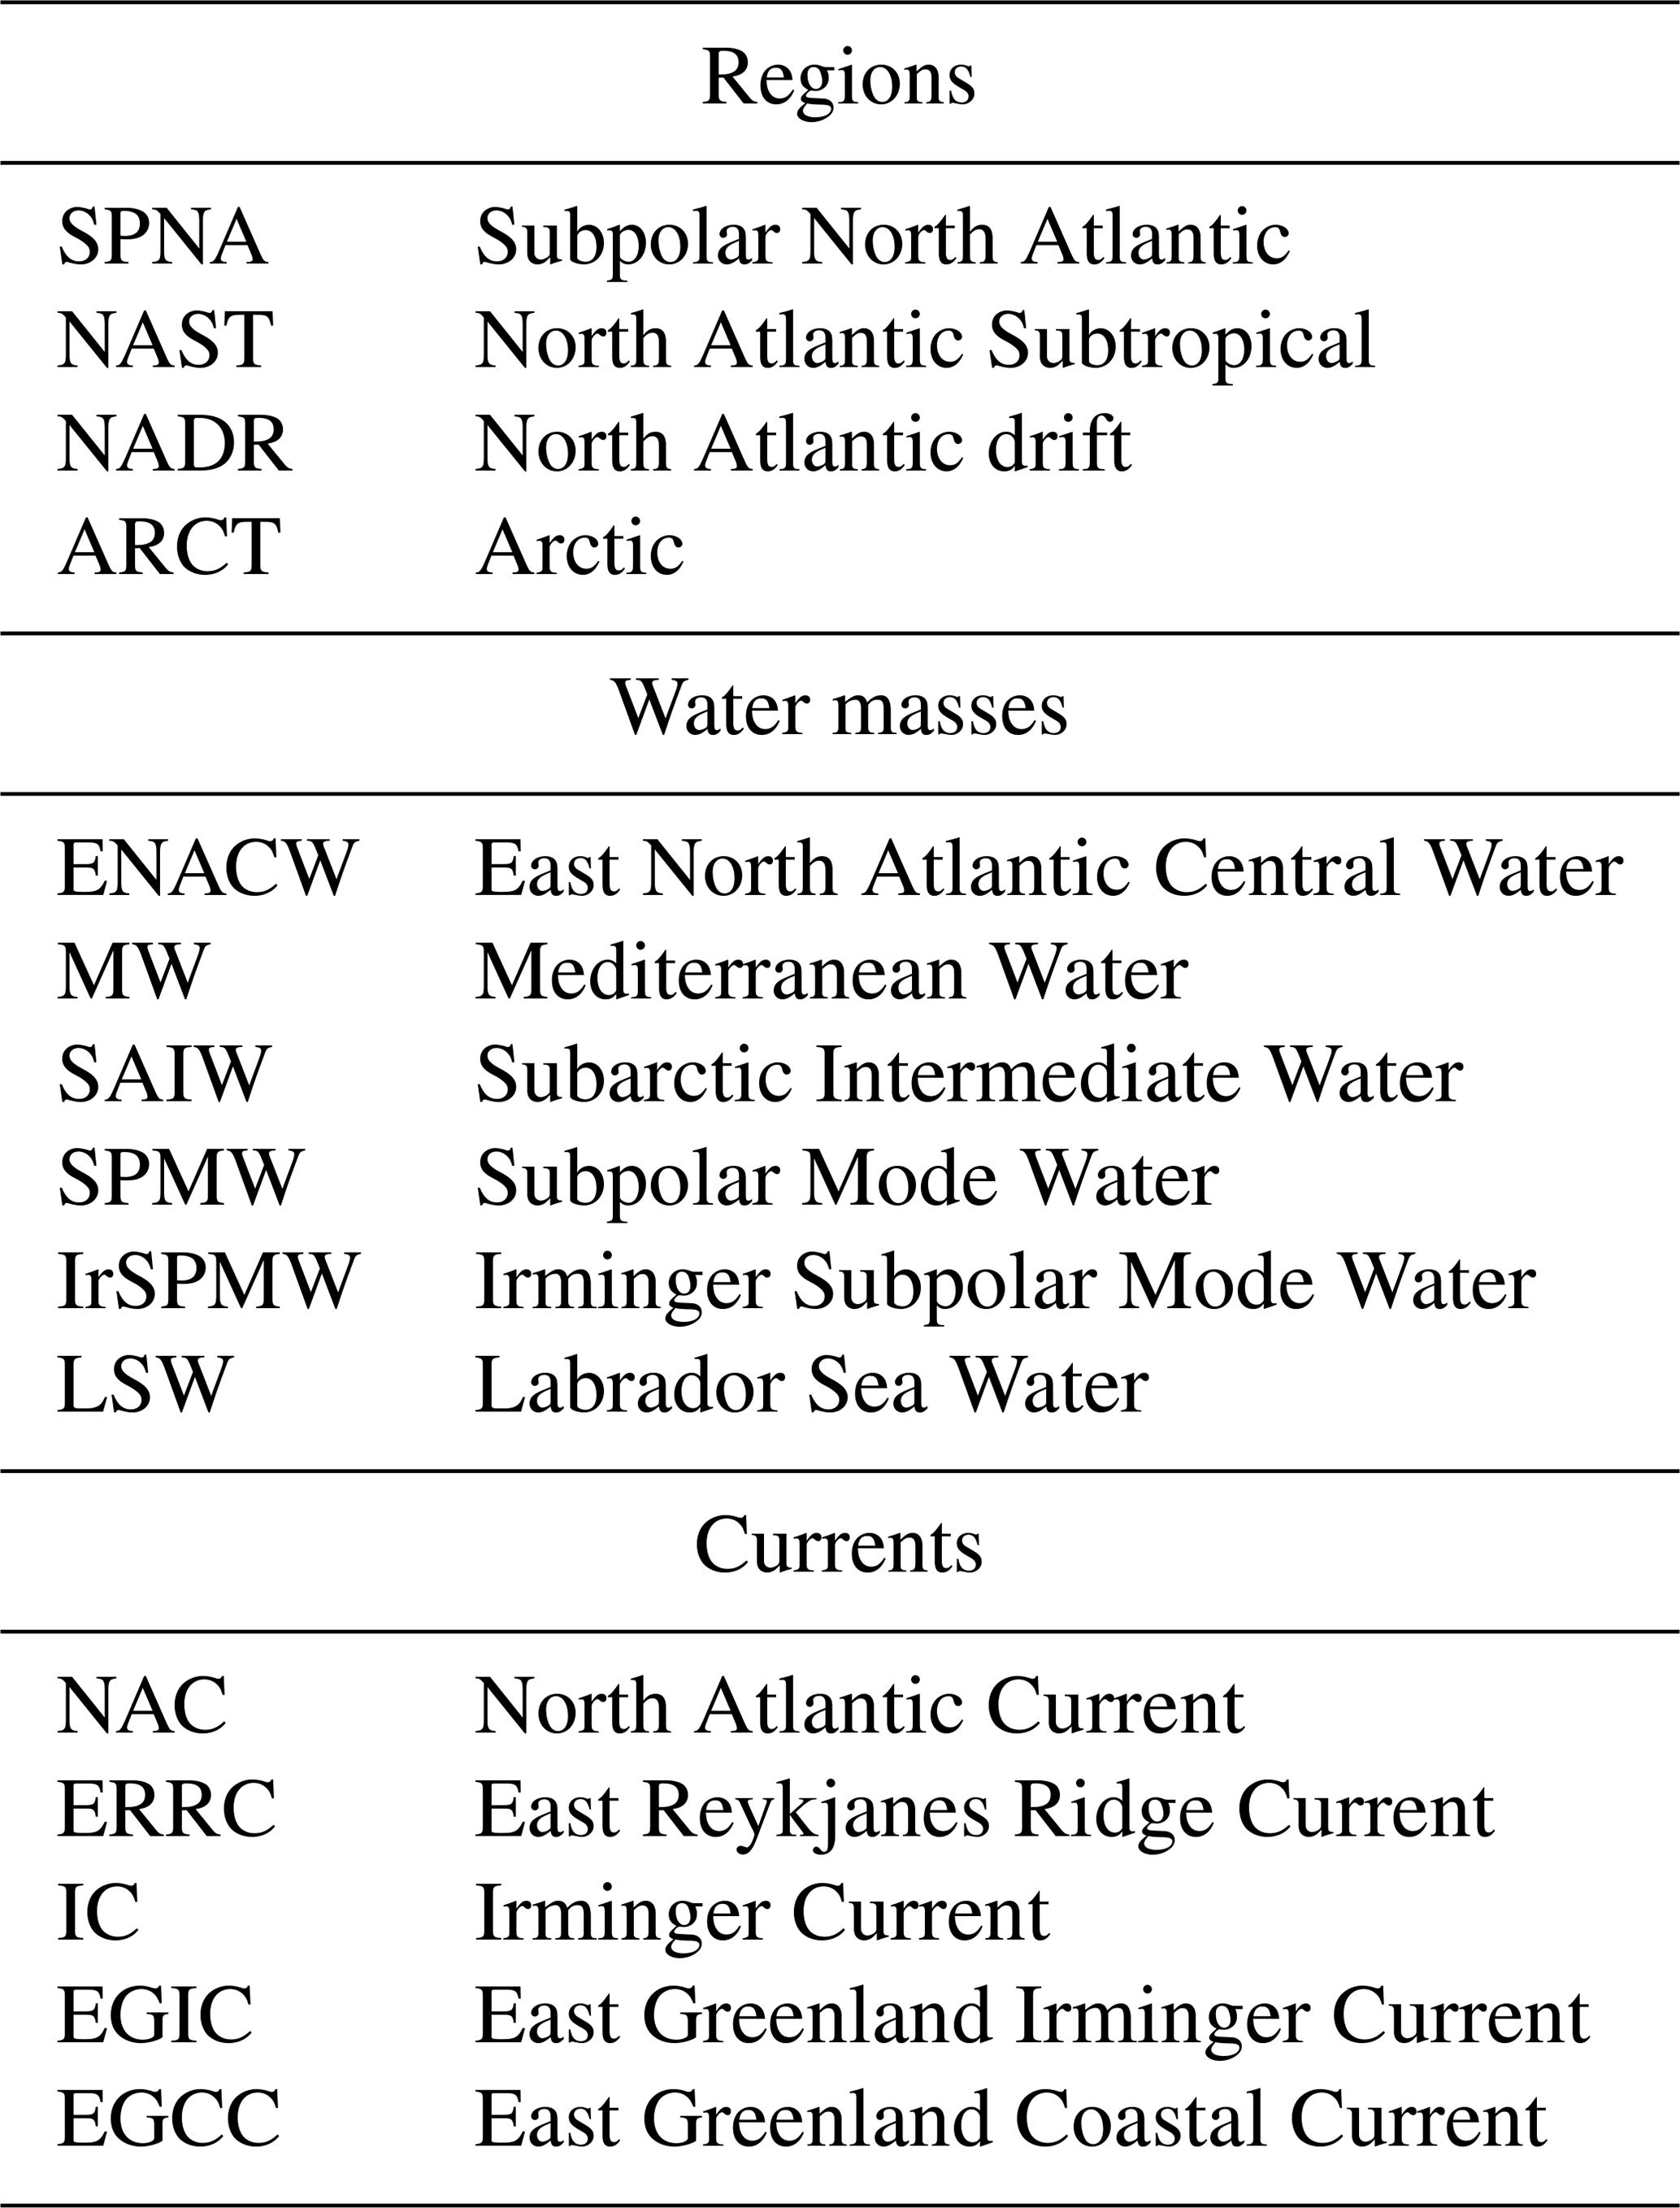
Table 1List of regions and water masses with their acronyms investigated in this study.
West of the Reykjanes Ridge, the Irminger and Labrador seas (Fig. 1) located in the Arctic region (ARCT) were nutrient-replete. Large blooms of diatoms occurred in this area, with a maximum of primary production at the end of May, 3 weeks before the GEOVIDE sampling in the Labrador Sea and 1 month before the sampling in the Irminger Sea (Lemaitre et al., 2018b). The western part of the ARCT region is under the influence of the Newfoundland margin. In this province, station no. 44 was sampled in the middle of the gyre, station no. 51 in the East Greenland Coastal Current (EGCC), and station no. 53 on the Greenland shelf. In the Labrador Sea, station no. 64 was influenced by the West Greenland Current (following the EGCC after it crossed Cape Farewell), while station no. 69 was located within the formation area of LSW, where strong convection events occurred the winter before GEOVIDE (García-Ibáñez et al., 2018; de Jong and de Steur, 2016). Westward, station no. 77 was located close to the Newfoundland margin (ca. 300 km).
2.2 Sampling at sea
Suspended particles were collected with 12 L Niskin bottles mounted on a standard rosette, and samples were dedicated to the concentration analyses of particulate barium in excess (Baxs, biogenic Ba), dissolved and particulate REE (including Nd isotopic composition), and yttrium (often integrated to REE as a chemical analog, named YREE in such a case) as well as ancillary parameter analyses, including particulate 232-thorium (232Th). The description of the sampling and filtration methods for water collected with this rosette follows that of Lemaitre et al. (2018b). Sampling bottles were shaken three times as recommended in the GEOTRACES cookbook (https://geotracesold.sedoo.fr/Cookbook.pdf, last access: 10 August 2020), to avoid the loss of particles by sticking to the walls or settling at the bottom of the bottle. Then, 4–8 L of seawater were filtered offline using clean slightly air-pressurized containers (Perspex®). Suspended particles were collected onto polycarbonate filters of 0.4 µm porosity (Nuclepore®, 47 mm or 90 mm of diameter). After sample filtration, the filter was rinsed with ≤5 mL of ultra-pure water (Milli-Q; 18.2 MΩ cm) to remove most of sea salts. Finally, filters were carefully removed using plastic tweezers, were dried under a laminar flow hood at ambient temperature, and then were stored in clean Petri dishes. Samples were handled in line in order to avoid contamination.
Ba, 232Th, yttrium Y, and PREE digestion procedures were performed on the same sample, and the resulting solution was shared between analysts. 232Th and Ba (but not Y) were first measured at the Royal Museum for Central Africa (Tervuren, Belgium), and then Ba, 232Th, Y, and PREE were later analyzed at LEGOS (Toulouse, France; this work). Details of this procedure are described in Sect. 2.3.1.
A clean sampling system was also deployed at the same stations to collect suspended particles dedicated to the analysis of trace metals prone to contamination like iron (Fe) or zinc (Zn). It was composed of a clean rosette equipped with 12 L GO-FLO bottles. Suspended particulate samples were collected on paired polyethersulfone and mixed ester cellulose filters of 0.45 and 5 µm porosity, respectively. The sample digestion and the subsequent analytical work were conducted in LEMAR, Brest (Gourain et al., 2019). The digestion procedure was slightly different than the procedure used on filters collected with the standard rosette (see Sect. 2.3.2). Ba and Y were also measured on these “clean samples” together with other trace metals, in Brest.
2.3 Sample preparation and analysis
2.3.1 Leaching procedure and analysis for the PYREE
Polycarbonate filters mounted on the Perspex® filtration units were first cut into two parts using a ceramic blade. One half was archived, while the other half was placed in a clean Teflon vial (Savillex®). The filter was then digested at Tervuren with a strong acid solution made of 1.5 mL HCl, 1 mL HNO3 and 0.5 mL HF, all concentrated (Merck® Suprapur Grades) (Lemaitre et al., 2018b). Vials were left on hot plates at 90 ∘C overnight. After this, the filter was fully digested, and the solution was then evaporated until near dryness. Finally, 13 mL of 0.32 mol L−1 HNO3 (Merck® Suprapur Grades) were added in the Savillex® vials and the leaching solutions were transferred into clean polypropylene tubes (VWR™). Then, Y, Ba, 232Th, and REE concentrations were measured using 2 mL of these archive solutions. Only a few samples required an additional dilution by a factor between 1.3 and 1.5 using HNO3 0.32 mol L−1 (prepared from Merck® nitric acid 65 %, EMSURE® distilled twice at LEGOS to get the purest product), because the archive solution volume was below 2 mL, which is the volume required by the ICP-MS measurement. These aliquots were placed in clean 5 mL polypropylene tubes and doped with a solution containing In and Re (ca. 100 ppt of both tracers) in order to correct matrix effects and sensitivity shifts during analysis. Analyses were performed at the Observatoire Midi Pyrénées (Toulouse, France) using a high-resolution inductively coupled plasma mass spectrometer (SF-ICP-MS, Element XR, Thermo Fischer Scientific®) in low-resolution mode. The SF-ICP-MS was coupled to a desolvating nebulizer (Aridus II, CETAC Technologies®) to minimize oxide and hydroxide production rates and thus (hydr)oxide interferences (Aries et al., 2000). Oxide production rates were determined at the beginning and the end of every session using a Ce solution (CeO <0.03 %). Other REE (hydr)oxide rates were then determined using the constant proportionality factor between them, previously determined with the same analytical configuration (Aries et al., 2000). Oxide–hydroxide interferences represented 0.001 % to 1 % of the signal except for Eu (0.3 % to 10 %). Isobaric interferences were corrected directly by the software of the ICP-MS and thoroughly checked before the session. A five-point calibration curve was established using a multi-elemental standard solution at the beginning, the middle, and the end of the analysis. The 20.10−12 g g−1 of the REE standard was measured every five samples. Standards were prepared by the dilution of a multi-elemental stock solution (SCP Science, PlasmaCAL, Custom standard) in 0.32 mol L−1 HNO3 with ca 0.1 ppb of In and of Re to match the relative concentrations measured in the samples. The certified reference material SLRS-5 (NRC Canada) was systematically analyzed with the samples and their concentrations are within the error bar of the consensual values published by Yeghicheyan et al. (2013), with a smaller error (see Fig. S1 in the Supplement). Reproducibility was assessed by measuring two or three times 2 mL of 23 samples from the same leaching solution. The difference between replicates varied from 0 % to 20 %, and were mostly under 10 %. The average percentage of difference between these analytical replicates is presented in Fig. S2. Procedural blanks have been estimated by conducting the same chemical procedure on clean, unused filters. The average chemical blank (n=8) represented 0.01 % to 5 % of the sample concentrations, except for Y and Lu, for which the contribution of the blank was generally higher (between 1 % and 30 %). Blanks were finally subtracted to the measured concentrations.
Four sources of errors could affect the final data: errors in (i) the proportion of filters analyzed that comes from cutting the filters into halves; (ii) the volume of leachate; (iii) the volume taken in the archive for analysis; (iv) the standard deviation associated with ICP-MS measurements. The final error was calculated by propagating the uncertainties of these different sources, except for the cutting error, which is rather theoretical than empirical and was impossible to evaluate at the time. We assumed that particles had a homogenous distribution on the filters as heterogeneity is difficult to assess. This hypothesis is supported by the good agreement of Y, Ba, and 232Th between the samples from Niskin bottles and the samples from GO-FLO bottles, which were not cut into halves (see Sect. 2.3.2 below). The different errors, their method of calculation and their comparison are summarized in Fig. S3.
2.3.2 Laboratory-to-laboratory comparisons and validation of our data
Ba and 232Th results were used to compare the data obtained between Tervuren and Toulouse in order to assess the consistency of the different ICP-MS analyses. Y was used to compare the consistency of data obtained between Brest and Toulouse using two different sampling systems, filtration, digestion, and analytical procedures. Y concentrations were more specifically used to validate the YREE sampling with the standard rosette, which is less prone to contamination than Fe or Zn, as underlined by van de Flierdt et al. (2012).
Results are presented in Fig. S4. Analytical determinations of Ba and 232Th concentrations were performed in Toulouse and in Tervuren (Lemaitre et al., 2018b). In Tervuren, an inductively coupled plasma quadrupole mass spectrometer (ICP-QMS; X Series 2 Thermo Fischer®) was used, while a high-resolution mass spectrometer was used in Toulouse (HR-ICP-MS; Element XR Thermo Fischer®). “Toulouse” versus “Tervuren” Ba concentrations show a regression slope of 0.86 (r2=0.91, n=198). For 232Th, “Toulouse” versus “Tervuren” concentrations show a slope of 1.05 (r2=0.98, n=198; Fig. S4).
The comparison between the two sampling and subsequent analytical procedures is illustrated by Y concentrations analyzed in “Brest” and “Toulouse”. In Brest, filters collected with the clean rosette were leached with a mixture of HF and HNO3 during 4 h at 130 ∘C before evaporation (for details, see Gourain et al., 2019), while in Toulouse, filters collected with the standard rosette were digested with a HCl, HF, and HNO3 solution (see above Sect. 2.3.1). The comparison shows an excellent consistency between both datasets: for Y, the regression slope is 0.93 (r2=0.82, n=78; Fig. S4). For Ba, the regression slope is 0.86 (r2=0.91, n=78). This intercomparison exercise supports the excellent reliability of our PREE data and allows us to discuss the PREE concentrations in the context of trace metal concentrations from Gourain et al. (2019) in the following parts.
Table 2Particulate REE, Y, Ba, and 232Th concentrations in pmol L−1 with the corresponding 2σ error.
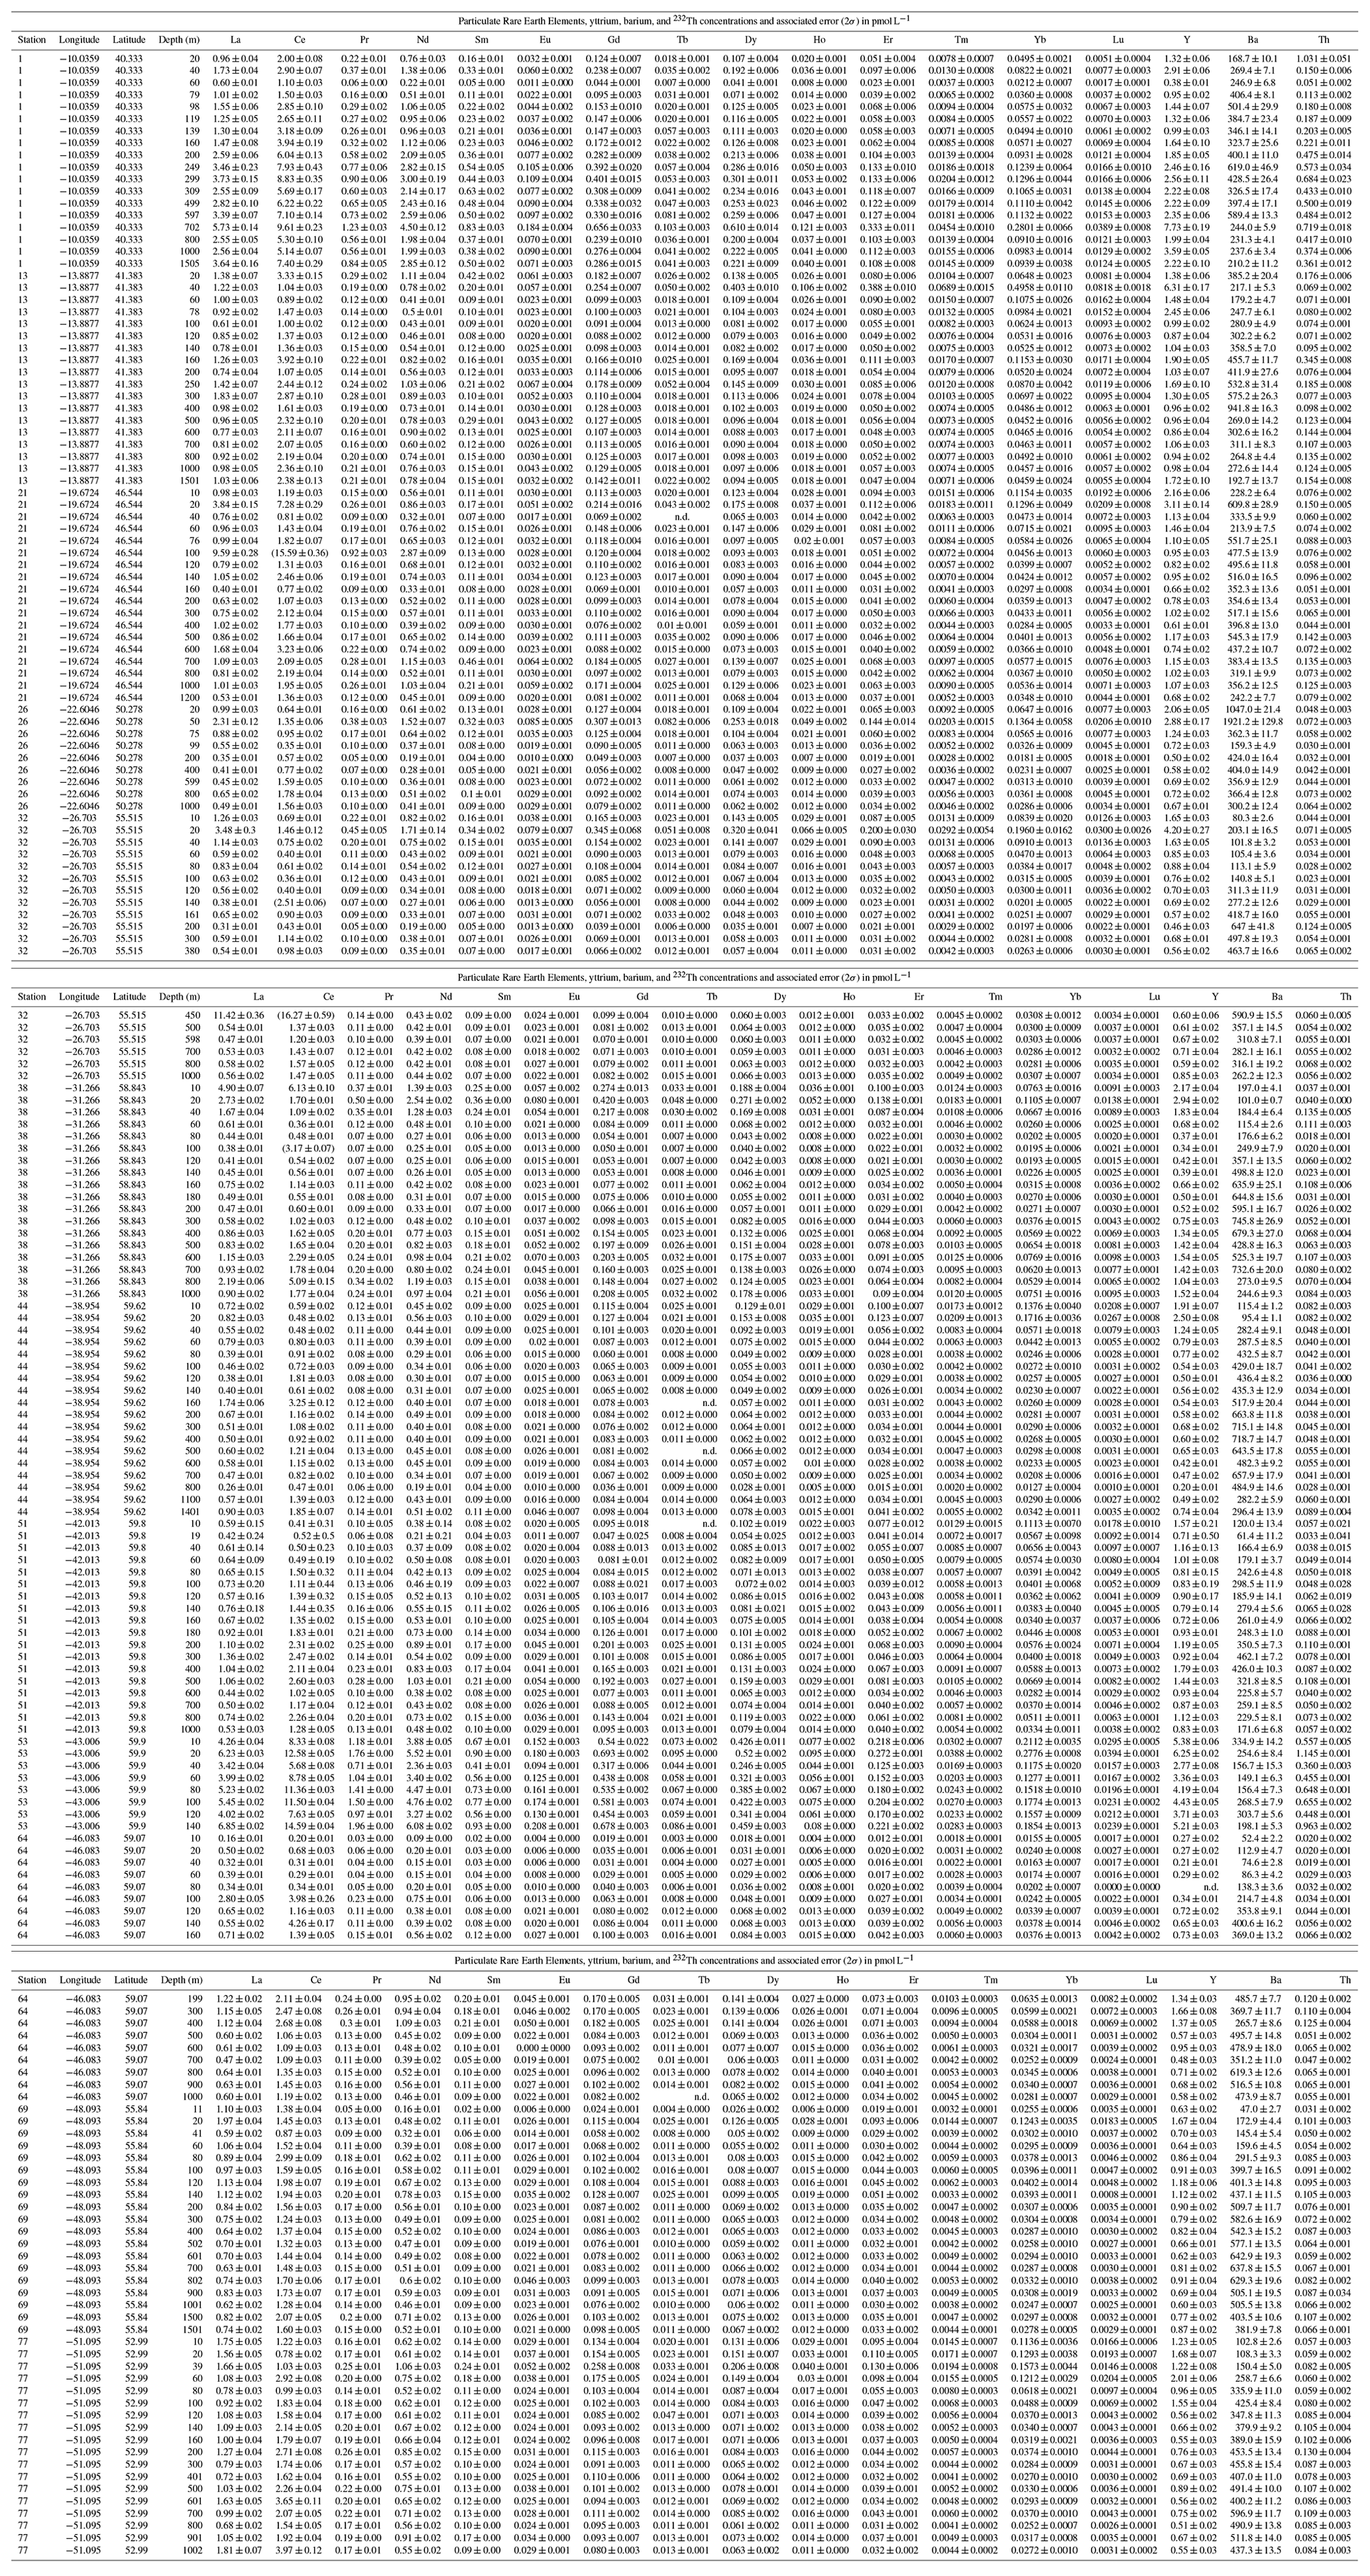
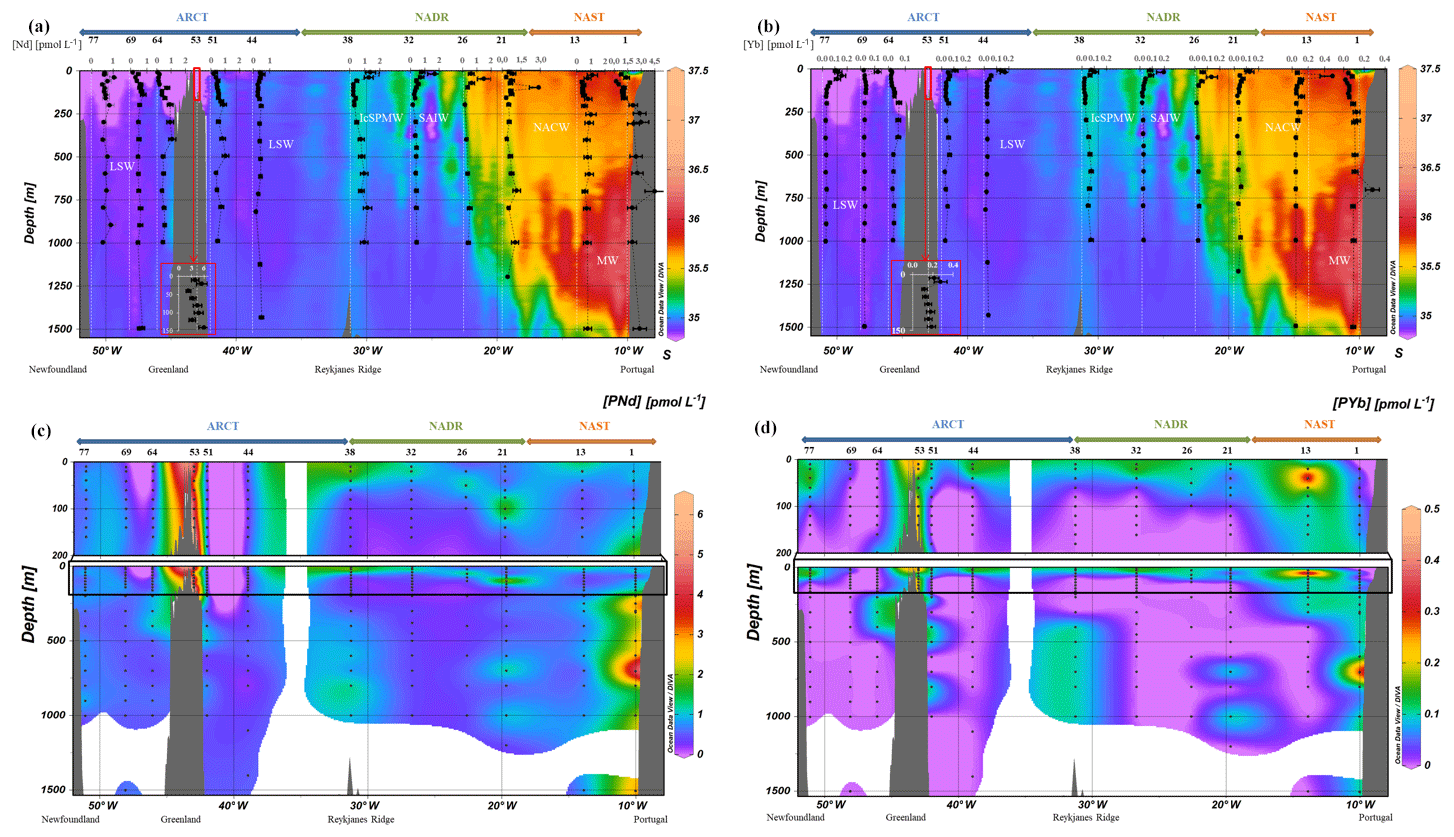
Figure 3(a) Vertical profiles of particulate [Nd] and (b) [Yb] concentrations superimposed on salinity (S) measured by CTD at every GEOVIDE station (Lherminier and Sarthou, 2017); in white, the prevailing water masses characterized by a multi-parametric (OMP) analysis as in Fig. 2. At station no. 53, profiles are shifted to the bottom at a lower scale because of the shallow depth of the station. (c) Particulate [Nd] and (d) [Yb] concentrations interpolated with the DIVA gridding function of Ocean Data View along the section defined in Fig. 1, with a zoom on the first 200 m in (c, d).
Concentrations of PY, PREE, PBa, and P232Th are compiled in Table 2. For the sake of clarity, we only displayed PCe, PNd, and PYb concentrations (Figs. 2 and 3) since these three REE represent the light REE (Nd), heavy REE (Yb), and a specific behavior (Ce). Notably, LREE and HREE are not equally influenced by dissolved-particulate exchanges (Koeppenkastrop et al., 1991; Koeppenkastrop and De Carlo, 1992, 1993; Sholkovitz, 1992; Sholkovitz et al., 1994). As free trivalent LREE are more abundant in seawater, they are more prone to adsorption on particles than HREE (Schijf et al., 2015). The specific behavior of Ce is due to the occurrence of its IV oxidation state in addition to the III oxidation state common to all the REE. Two mechanisms for Ce oxidation have been proposed so far: a microbially mediated oxidation in seawater under oxic conditions that leads to formation of insoluble CeO2, more particle reactive than Ce(III) (Byrne and Kim, 1990; Elderfield, 1988; Moffett, 1990, 1994; Sholkovitz and Schneider, 1991), and an oxidative scavenging onto Mn oxide particles (De Carlo et al., 1997; Koeppenkastrop and De Carlo, 1992). These two processes act in addition to the general scavenging process that affects all the trivalent REE by surface complexation, thus leading to the Ce enrichment in particles and its stronger depletion in the dissolved phase compared to other REE.
Particulate Ce concentrations are higher than PNd concentrations (Figs. 2, 3a, and b), which are higher than PYb concentrations (Fig. 3c and d), in agreement with the natural abundance and reactivity of these three REE: the light Ce and Nd are more abundant than the heavy Yb, and Ce is the most particle-reactive of the REE.
3.1 Cerium
As shown in Fig. 2, particulate Ce concentrations varied between 0.2 pmol L−1 (station no. 64) and 16.3 pmol L−1 (station no. 32; Fig. 2). They were higher close to the Iberian margin (station no. 1: 1 pmol L−1 < PCe <9.4 pmol L−1) and on the Greenland shelf (station no. 53: 5.7 pmol L−1< PCe <14.6 pmol L−1). In the NAST (station no. 13) and NADR (station nos. 21 to 38) regions, vertical profiles presented a surface or subsurface maximum at all stations. A second maximum was observed at 160 m at station no. 13 and in the NADR region (except close to the subarctic front, at station no. 26). Below 200 m depth, PCe concentrations decreased and reached a value of 2 pmol L−1 within the mesopelagic area. Particulate Ce concentrations were higher to the east of the subarctic front (station nos. 13 and 21) compared to the west (station nos. 26, 32, and 38). In the ARCT region, surface PCe concentrations were lower and increased between 80 and 160 m, with all PCe >1 pmol L−1 at all open-sea stations. Maximum concentrations were observed just below 200 m, at station nos. 44, 64, and 69. At depths greater than 200 m, PCe concentrations were more variable in the ARCT region than in the NADR region. They were higher than those observed at the surface except at station no. 69, where they remained between 1 and 2 pmol L−1. Particulate Ce profiles differed from that of PNd and PYb at two stations only: station no. 38, where higher concentrations were observed at 100 and 800 m for PCe only; and station no. 44, where PCe concentrations were more variable in the epipelagic zone than PNd and PYb, with maxima located at 120 and 160 m depth. These maxima were not observed for other PREE at this station.
3.2 Neodymium
As for PCe (and other PREE; see Supplement and Table 2), PNd concentrations were the highest close to the Iberian and Greenland margins, with values up to 4.5 pmol L−1 in the upper 100 m (Fig. 3a and b). Concentrations decreased as the distance to margins increased, as seen at stations no. 13, where PNd was lower than 1 pmol L−1. Low PNd values were also measured at station no. 77, which is relatively close to the Newfoundland margin yet located outside of the continental shelf.
3.3 Ytterbium
Distributions of PNd and PYb differed in several ways (Fig. 3). Station nos. 13, 44, and 69 displayed a maximum in subsurface for PYb that was not observed for PNd. In contrast, a local maximum in PNd was identified at 160 m at station nos. 64 and 69 but not for PYb. In the open ocean, at station nos. 21, 26, 32, and 38, concentrations of both elements were higher in the surface layer than below. The highest PYb concentrations were determined in the NADR region, which was the most productive at the time of the cruise (Fonseca-Batista et al., 2019). Concentrations then decreased with depth to become constant, except at station no. 38, where they increased again in the mesopelagic zone (below 300 m). In the ARCT region, surface concentrations of PNd were lower at 100 m than at 250 m, similar to station no. 1, contrasting on this point with the NADR region.
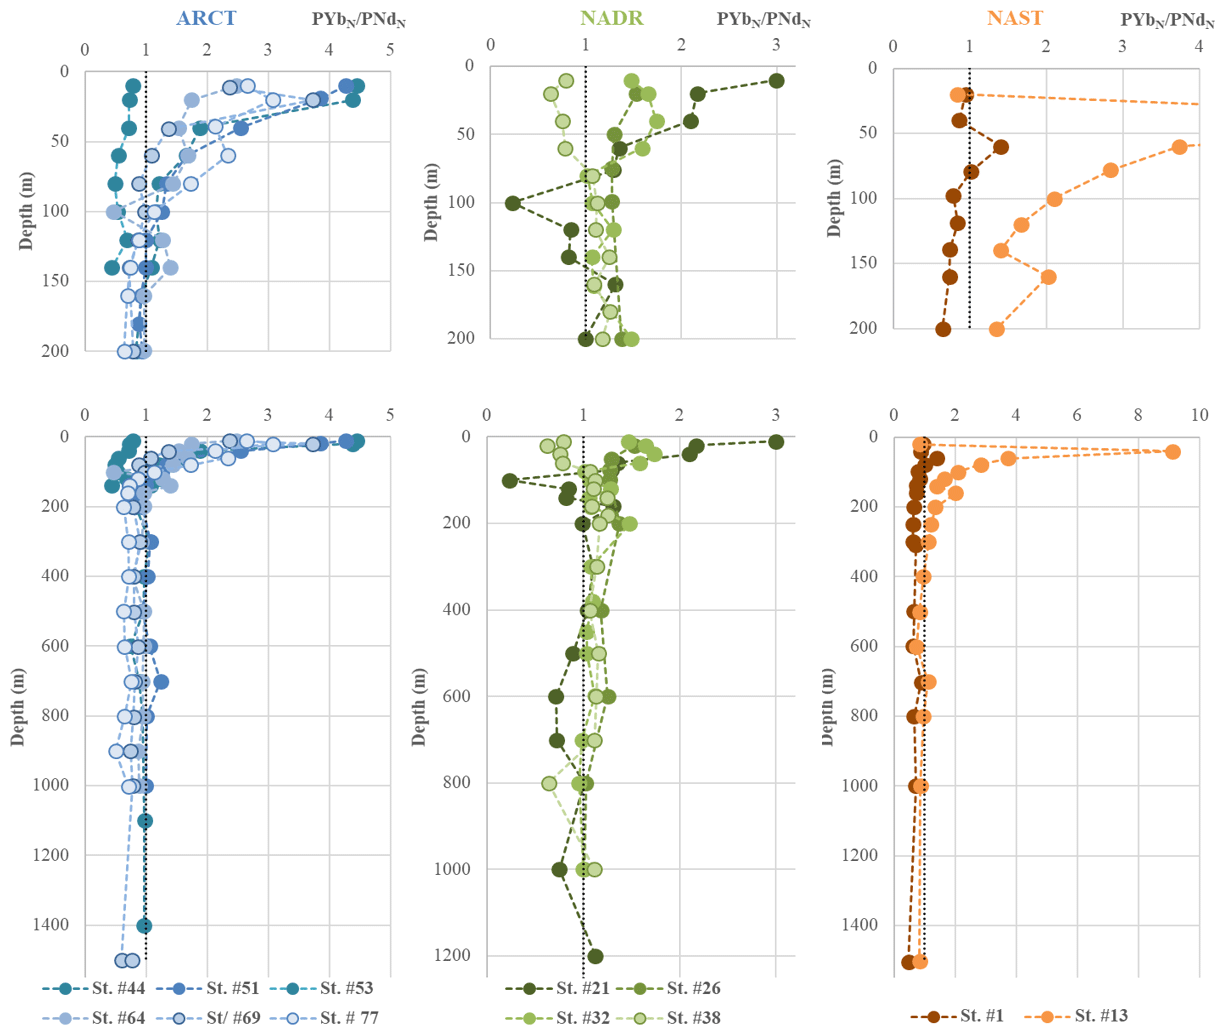
Figure 4Vertical profiles of PYb∕PNd ratios normalized to PAAS in each biogeochemical province (ARCT, NADR, NAST). The upper panels present the first 200 m and the lower panels all the data. The dashed black vertical line in each panel represents a ratio equal to the one of PAAS.
3.4 PYbN∕PNdN ratios
To highlight a possible fractionation between LREE and HREE, the PYbN∕PNdN ratio is calculated from concentrations normalized to the Post Archean Australian Shale (PAAS), commonly used for REE normalization, in order to get rid of the natural abundance “zig zag distribution” of the REE (Piper and Bau, 2013). This normalization allows (i) a better diagnostic of the fractionation between PREE and (ii) comparison with patterns in the literature. Results are presented in Fig. 4. The PYbN∕PNdN ratio varied between 0.2 and 4.5, with an outlier (9) at station no. 13 at 40 m. Lower ratios (<1) were observed along the margins, increasing with the distance from the coast. In the open ocean, except at station no. 38, PYbN∕PNdN was higher at the surface (>1.4) and decreased in the subsurface layers, ranging between 1 and 1.4. At station no. 38, it was smaller than 1 in the upper 100 m and around 1 below. The lowest PYbN∕PNdN ratio was determined in the core of the epipelagic zone at station no. 21 at 100 m (Fig. 4), where high concentrations of PLa, PCe, PPr, and PNd (in other words, LREE) were measured. However, for other stations with a similar enrichment, no low PYbN∕PNdN ratios were observed (stations nos. 21 at 600 m, 32 at 450 m, and 38 at 800 m).
4.1 Comparison with other studies
Particulate REE data in suspended particles are very scarce in the literature. To our knowledge, for the North Atlantic, only one other set of concentrations was published by Kuss et al. (2001), who measured PREE in samples centrifuged from several m3 of water at a depth of 7 m, collected along the 20∘ W meridian between 30 and 60∘ N. Even though this study is located in a different area of the North Atlantic Ocean, and only in the surface, similarities can be pointed out. Kuss et al. (2001) observed PCe concentrations ranging between 0.2 and 4.9 pmol L−1 with higher concentrations close to the margins especially near the Iberian margin, consistent with our data. Their PNd concentrations of ca. 0.5 pmol L−1 to the southeast of the NADR are also consistent with ours. The PNd concentrations reported by Tachikawa et al. (1999b) at a station located in a mesotrophic zone of the northeastern tropical Atlantic and directly influenced by Saharan dust (6 to 15 g m−2 r−1, Rea, 1994) were almost 2 times higher than those reported here (PNd =2.6 pmol L−1 at 10 m at station M, when PNd <1.4 pmol L−1 for GEOVIDE at 10 m; Fig. S5). The same authors measured lower concentrations than ours at the oligotrophic site of their study, where the dust flux was lower than at the mesotrophic site (4–5 g m−2 yr−1, Rea, 1994) but higher than that found during the GEOVIDE cruise (2 to 500 ng m−3, Shelley et al., 2017). Interestingly, PCe concentrations measured by these authors are similar to those reported in this study, for both the mesotrophic and oligotrophic sites. The difference of concentrations observed for the other PREE can be due to the fact that particle concentrations are usually higher in the subpolar North Atlantic than in the tropical Atlantic (Gehlen et al., 2006).
4.2 Lithogenic and authigenic PREE fractions
Particulate REE are found in both the lithogenic and authigenic phases of particles. Schematically, particles are often represented with a “lithogenic core” coated by authigenic material (Bayon et al., 2004; Sholkovitz et al., 1994). The “lithogenic core” has an external origin, product of the continental weathering transported by the winds or discharged by the rivers to the continental margins. The authigenic phases are produced in the water column, and particulate REE present in this phase can result from surface biological activity or scavenging by organic coatings and/or iron and manganese oxides and hydroxides (Bau, 1999; Bau and Koschinsky, 2009; Lam et al., 2015). Traces of the biological absorption can be found in inorganic planktonic tests (CaCO3, Palmer, 1985; Roberts et al., 2012; and BSi, Akagi, 2013) or in biogenic byproducts like barite (Baxs, Garcia-Solsona et al., 2014; Guichard et al., 1979). The common view is that LREE are more sensitive to oxide phases of Fe and Mn, while HREE, more soluble, could preferentially react with biogenic phases (Akagi, 2013; Bertram and Elderfield, 1992; Grenier et al., 2018; Pham et al., 2019). In the Bering Strait, Akagi et al. (2011) also observed a strong association between particulate HREE and biogenic silica collected in sediment traps. This specific BSi control on HREE behavior is discussed in Sect. 4.6. Distribution coefficients also vary between HREE and LREE with depth and the nature of the particle phases (Schijf et al., 2015).
Thus, differentiating the distribution of REE between the lithogenic and authigenic phases can allow estimation of the fraction implied in scavenging and/or absorption processes by the authigenic phase, while the lithogenic fraction can be used to picture continental inputs. The lithogenic REE fraction could also be estimated using conservative lithogenic tracers such as Al, 232Th, or Ti (e.g., Gourain et al., 2019; Tachikawa et al., 1997). These authors used Al as a lithogenic tracer, while here we chose to use 232Th. Indeed, the lithogenic fractions calculated from particulate Al (PAl) concentrations were often higher than 100 % in surface waters close to the margins, revealing that a fraction of the total PAl is likely in the authigenic phase (Lerner et al., 2018; Van Beueskom et al., 1997). In addition, as Al is more prone to contamination, it was sampled with the clean rosette (Gourain et al., 2019), while 232Th was measured in the same samples as PREE, collected with the standard rosette. The concentration of the lithogenic PREE fraction in particles is calculated by multiplying the 232Th concentration in a given sample by the ratio of the considered REE on 232Th in the upper continental crust (UCC, Rudnick and Gao, 2014, Eq. 1), a value similar to the uniform 232Th concentrations reported by Chase et al. (2001) in marine sediments from cores of the South Atlantic.
These PREE lithogenic concentrations are then divided by the total PREE concentrations to obtain the fraction of particulate REE of lithogenic origin (Eq. 1). The authigenic fraction is then obtained by subtracting the lithogenic fraction from 100 % (Eq. 2).
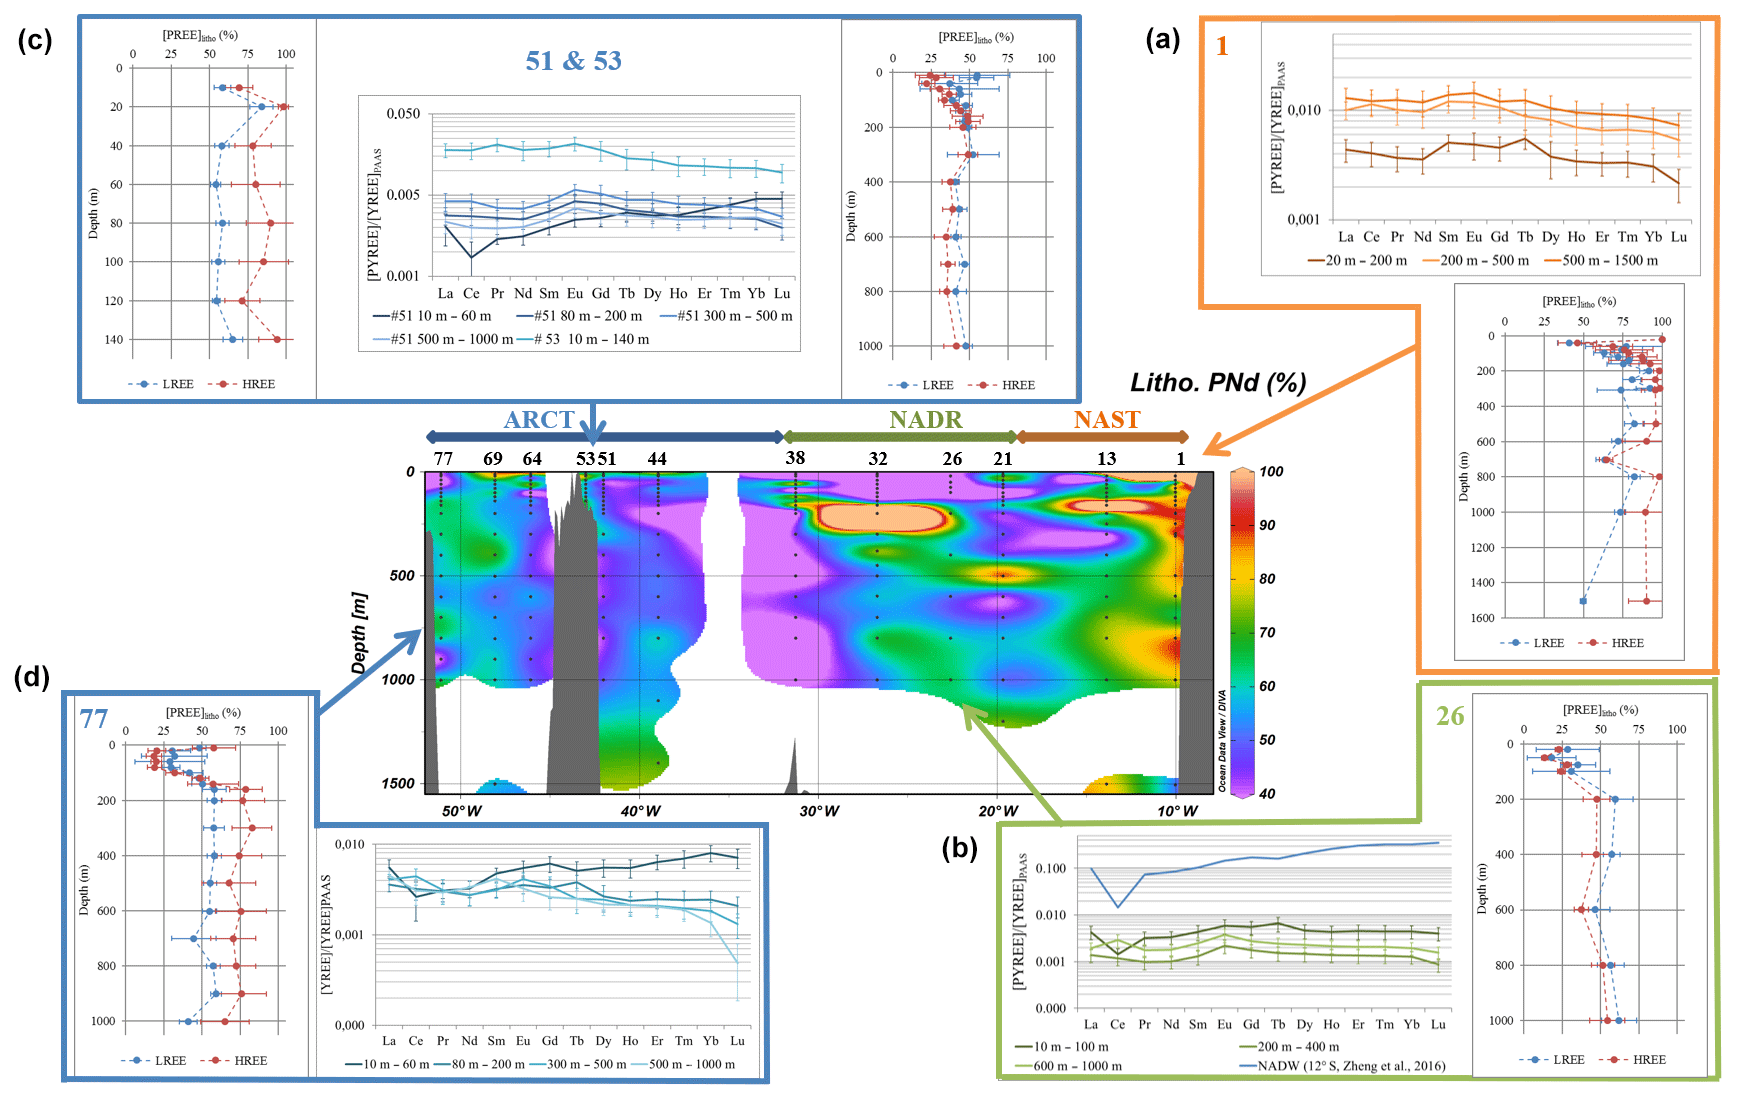
Figure 5Center: fraction of lithogenic PNd along the GEOVIDE section (in %); side plots: vertical profiles of the lithogenic fraction of LREE (except Ce, blue lines) and HREE (red lines) and PAAS-normalized REE patterns of the total fraction at station nos. (a) 1, (b) 26, (c) 51, and 53 and (d) no. 77. Patterns are averaged by depth intervals displaying similar values. Error bars represent the standard deviation of the concentration series. A typical seawater pattern (NADW; 12∘ S, 2499 m, Zheng et al., 2016) is represented along with patterns of station no. 26 with a blue line.
The percentage of lithogenic PNd along the section is represented in Fig. 5. In this figure, we also chose to represent the average value of the lithogenic fractions of the remaining PREE for the PLREE at five selected stations, excepted for PCe because of its distinctive behavior that leads to higher affinity for particles. We also plotted the PHREE at the same stations (nos. 1, 26, 51, 53, and 77). Error bars represent the standard deviation of the resulting averages. These five stations are representative of the three dominant biogeochemical contexts observed along the section: under lithogenic input influence (no. 1, no. 53), dominated by biological activity (no. 26, no. 51), and influenced by both (no. 77). Sometimes, the estimated Nd lithogenic fraction exceeded 100 % (up to 550 % at 20 m at station no. 1 and up to 130 % at 160 m at station no. 13 and at 200 m at station no. 32). This suggests an excess of 232Th in the particles, likely authigenic, or a difference between the adsorption kinetics of 232Th and REE, as reported by Hayes et al. (2015). In these cases, we capped the lithogenic proportion to 100 %. The occurrence of an authigenic fraction of 232Th may lead to a bias in the calculation of the lithogenic contribution and an overestimation of lithogenic contributions cannot be excluded at the surface. However, 232Th remains predominantly lithogenic, and the comparison between the fractions calculated with Al and 232Th provided in Fig. S6 for station nos. 1, 13, 32, 51, and 77 validates the use of 232Th.
4.3 PAAS normalization and REE patterns
The patterns of PAAS-normalized concentrations are represented in Fig. 5 together with the profiles for the same five stations as in Sect. 4.2. For ease of reading, patterns are averaged by depth intervals displaying similar values. Error bars represent the standard deviation of the concentration series. A dissolved REE pattern obtained in the North Atlantic Deep Water at 12∘ S at 2499 m (Zheng et al., 2016) is also represented, for comparison with a “typical” dissolved seawater pattern, marked by a negative Ce anomaly and a pronounced normalized HREE/LREE positive slope (De Baar et al., 1985; Elderfield, 1988; Elderfield and Greaves, 1982; Tachikawa et al., 1999a). The patterns of other stations are represented in Fig. S7.
The validity of using PAAS for normalization is assessed by the fact that PAAS does not present any significant difference in REE composition between shales and loess from Europe, North America, and China (Rudnick and Gao, 2014), which are potential sources of lithogenic material for Europe and North America. Normalization to atmospheric depositions has been put aside as these inputs were very low during the cruise (Shelley et al., 2017), and the REE patterns of these dusts are not available. In addition, normalization to dusts would not have allowed us to compare our data with the REE patterns in the literature, which commonly uses PAAS to normalize.
4.4 Lithogenic supply at the margins
The high PREE concentrations close to the Iberian margin and on the Greenland shelf suggest that particulate material is released by the margins to the water column (Fig. 3 and Table 2), the highest concentrations being measured at station no. 1 (Fig. 5). At these stations, the lithogenic PREE fractions range between 50 % and 100 % (Fig. 3). The relatively flat total PREE patterns displayed at these stations show only a slight enrichment in LREE due to their preferential scavenging compared to the HREE (Fig. 5; Sholkovitz et al., 1994).
High percentages of lithogenic PREE were visible along two isopycnals (σ0=27.05 and σ0=27.4) visible from station no. 1 to station no. 32 (in other words beyond the Subpolar Front), spreading over 1700 km from the Iberian margin (Fig. 6). Similar maxima have been reported for lithogenic particulate iron (PFe) and particulate manganese (PMn) by Gourain et al. (2019) (their Fig. 6b).
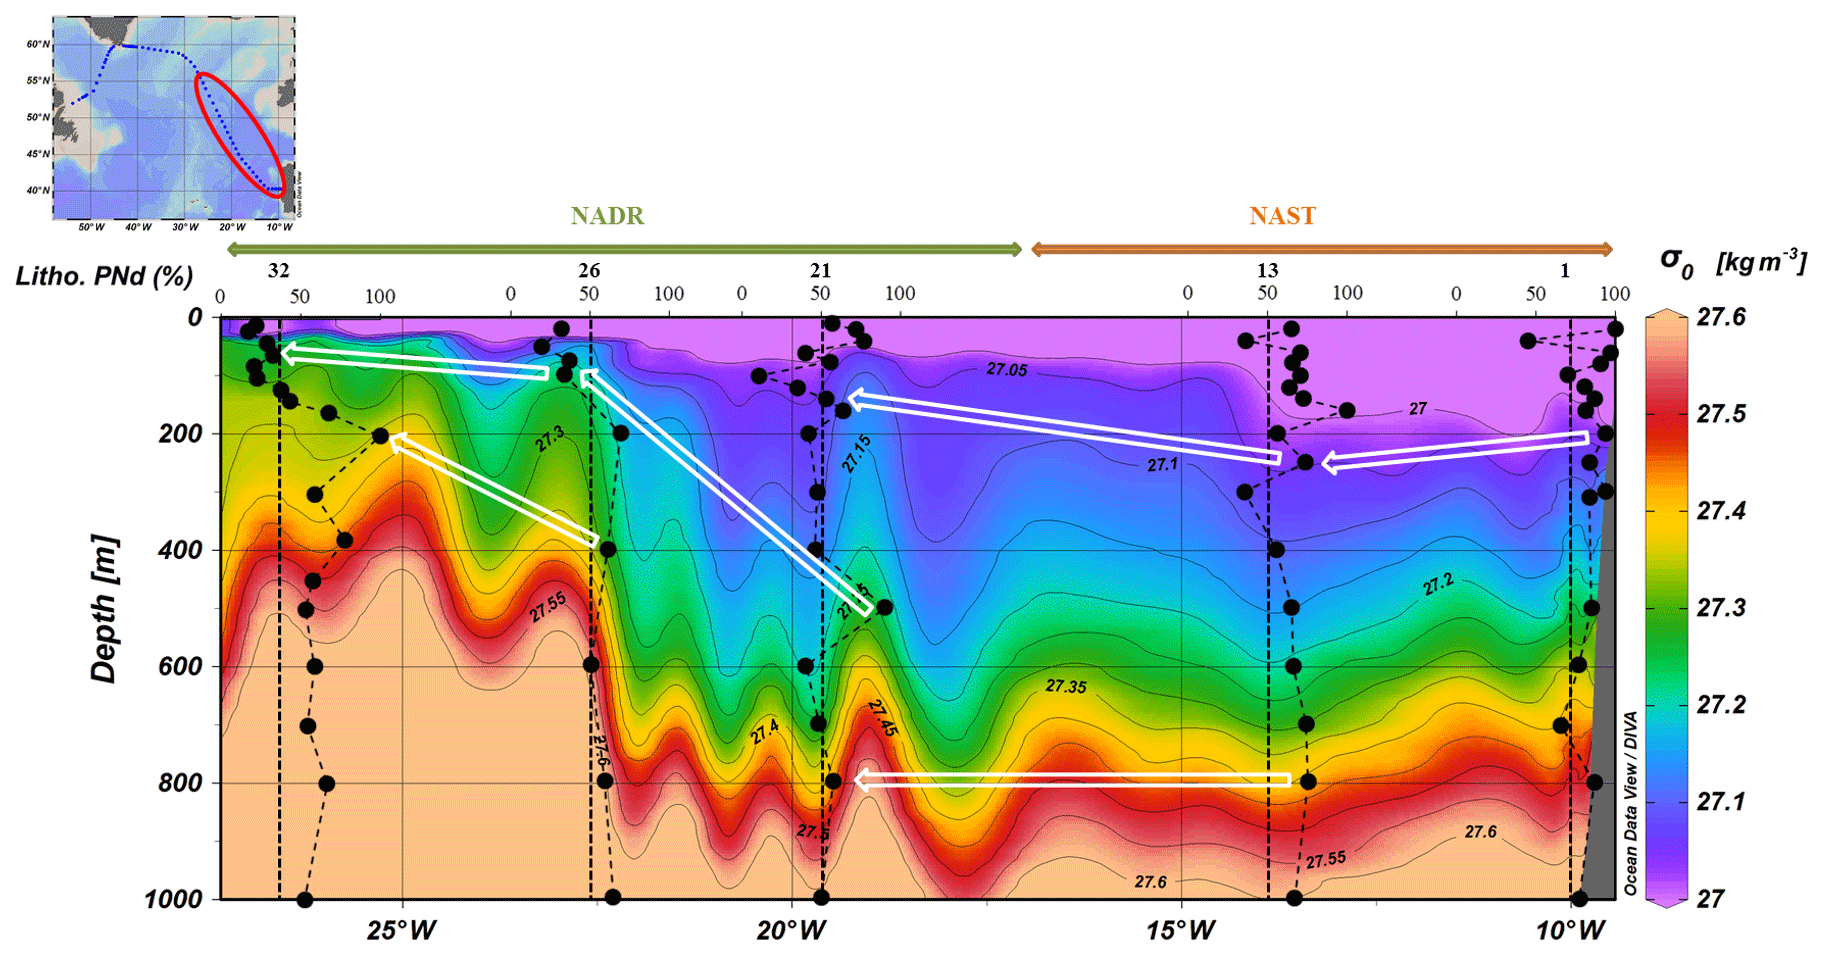
Figure 6Estimated fraction of lithogenic PNd in the upper 1000 m superimposed on density from station nos. 1 to 32. White arrows follow the high lithogenic fractions spreading along the isopycnals σ0=27.05 and σ0=27.4.
Above the Greenland shelf, at station no. 53, the fraction of lithogenic PREE was also high (55 % to 86 % for PNd), only slightly lower than at station no. 1, with a median lithogenic contribution of 59 % for PLREE and 83 % for PHREE (Fig. 5). Unlike what was observed at the southeastern end of the GEOVIDE section from station nos. 1 to 26, these lithogenic particles do not spread offshore. Indeed, except at the surface, the lithogenic fraction for LREE was lower than 50 % at station nos. 51 and 64 in the Irminger Sea and in the Labrador Sea, respectively. This can be explained by the circulation: the East Greenland Irminger Current (EGIC) is a strong narrow current bypassing Greenland along its shelf (23.4±1.9 Sv, Daniault et al., 2016), likely preventing exchanges between the Irminger Subpolar Mode Water (IrSBPMW) and waters of the Greenland shelf, transported by the EGCC, which flows parallel to the coast (green and orange arrows around the Greenland southeastern tip in Fig. 1). Our observations are consistent with those of Lacan and Jeandel (2005), who showed that the Nd isotopic signatures (εNd) of SPMW transported by the EGIC do not vary significantly along the Greenland shelf. In the same way, the lithogenic influence is moderate at station no. 77, where land–ocean exchanges are reduced due to the EGCC (1.5±0.2 Sv, Daniault et al., 2016). While the lithogenic fraction is still relatively high at this station (50 % < REElitho<80 % below 150 m), the fractionated patterns indicate that other processes are at play (Fig. 5), for example, preferential scavenging of LREE on Mn and Fe oxyhydroxides (Bau, 1999) and/or fractionation by diatoms (Akagi et al., 2011). The roughly constant lithogenic contribution around 60 % at station no. 77 indicates that like around Greenland, no nepheloid layers are spreading from the Newfoundland margin, at least at the time of the cruise.
Gourain et al. (2019) reported similar results for lithogenic PFe and PMn fractions estimated during the same cruise. These authors also observed a strong contribution of lithogenic material from the Iberian margin spreading until station no. 32, a lower contribution along the Newfoundland margin, and almost no lithogenic contribution from the slope of the Greenland margin. Using lithogenic PMn as a tracer of sediment resuspension, they estimated that 100 % of PMn originated from sediment resuspension at station no. 1 between 250 m and 1000 m (their Fig. 4). Interestingly, E. Le Roy (Le Roy, 2019) observed an unexpected maximum of 227Ac activity at 500 m at station nos. 1 and 21, indicating the influence of a sediment source, also consistent with the PREE lithogenic fraction. However, at station no. 13, the lithogenic PREE maximum was not found at the same depth as for 227Ac (160 m instead of 200 m). Unfortunately, the different sampling resolutions for PREE and 227Ac did not permit us to further compare data between these tracers except at the surface of station no. 1, where a maximum of 227Ac was consistent with the lithogenic PREE signal.
These highly enriched depths in lithogenic tracers could be due to the formation of intermediate nepheloid layers (INLs) at 250 and 500 m along the Iberian margin, similar to those revealed slightly more north by McCave and Hall (2002). A contribution of the Mediterranean Water (MW) to these high concentrations and lithogenic proportions cannot be excluded, but the lack of data in the core of the MW (1000 to 1500 m, García-Ibáñez et al., 2018) prevented us from concluding further.
A highly energetic process is needed to generate strong resuspension of lithogenic matter. It may result from the friction and energetic excitation of internal waves along the continental slope (Cacchione, 2002). Another possible source is the erosion of the coast by the strong current (from 0.05 to 0.1 m s−1) coming from Gibraltar and flowing northward along the Iberian margin (Gourain et al., 2019; McCave and Hall, 2002; Zunino et al., 2017). A combination of all these dynamic processes generating internal waves north of station no. 1 could have led to strong sediment resuspension and subsequent advection of resulting particles southward by the current.
To sum up, margins can provide significant amounts of particulate lithogenic REE to the ocean that must be considered in the mass balance of REE. Occurrence and magnitude of these inputs depend on the morphology of the margin, the hydrodynamical forcing, and the amount and composition of sediments leading (or not) to the formation of nepheloid layers.
4.5 Rare Earth Element fractionation: Ce anomalies
As briefly mentioned above, Ce presents a unique chemistry among REE, with the coexistence of a trivalent form and a tetravalent form. In seawater, the redox cycles of Ce and Mn are strongly linked (Bau and Dulski, 1996; Elderfield, 1988; Moffett, 1990, 1994). Biotic and abiotic oxidations of Ce have been previously reported. In seawater, the oxidation of Ce3+ in CeO2 is microbially catalyzed and the resulting tetravalent CeO2 is insoluble, and thus preferentially adsorbed by surface complexes of particles (Byrne and Kim, 1990; Elderfield, 1988; Moffett, 1990, 1994). This pattern of oxidation, which is similar to Mn oxidation, suggests a common mechanism and possible coprecipitation, yet with different kinetics (Moffett, 1990, 1994). Mn oxides can catalyze Ce abiotic oxidation at the surface of particles, leading to an oxidative scavenging of Ce by Mn oxides (Bau, 1999; Bau and Koschinsky, 2009; Byrne and Kim, 1990; De Carlo et al., 1997; Koeppenkastrop and De Carlo, 1992). Also, a Ce enrichment in Fe hydroxides by sequential leaching of ferromanganese crusts has been reported (Bau and Koschinsky, 2009). In contrast, experiments of REE addition during Mn oxide and Fe hydroxide precipitation showed little (Davranche et al., 2004) or no evidence of a preferential Ce scavenging by Fe hydroxides unlike for Mn oxides (De Carlo et al., 1997; Koeppenkastrop and De Carlo, 1992; Ohta and Kawabe, 2001). Therefore, the preferential Ce scavenging onto Fe hydroxides is still under debate. This exceptional behavior among REE results in a Ce depletion in seawater.
Conversely, in particles, this leads to a “symmetrical” Ce enrichment compared to other REE when concentrations are normalized to a lithogenic reference as PAAS (Garcia-Solsona et al., 2014; Tachikawa et al., 1999a). This Ce enrichment is quantified using the Ce anomaly, calculated with the concentrations normalized to PAAS. The expression of Bolhar et al. (2004, Eq. 4) is used in this paper:
This expression uses Pr and Nd concentrations and is preferred to the one using La and Nd concentrations, as La can also present anomalies in seawater (Bau and Dulski, 1996).
In this dataset, most of the Ce/Ce* ratios are greater than one (i.e., positive anomaly). At station nos. 26, 32, 51, and 77 between the surface and ca. 100 m, PCe was depleted compared to other PREE, and () <1. This surface minimum was followed by a pronounced positive anomaly down to 200 m. At deeper depths, the anomaly was relatively higher in the NADR region compared to the NAST and ARCT regions, where they are around 1 when they are ≥1.2 in the NADR region (Fig. 7).
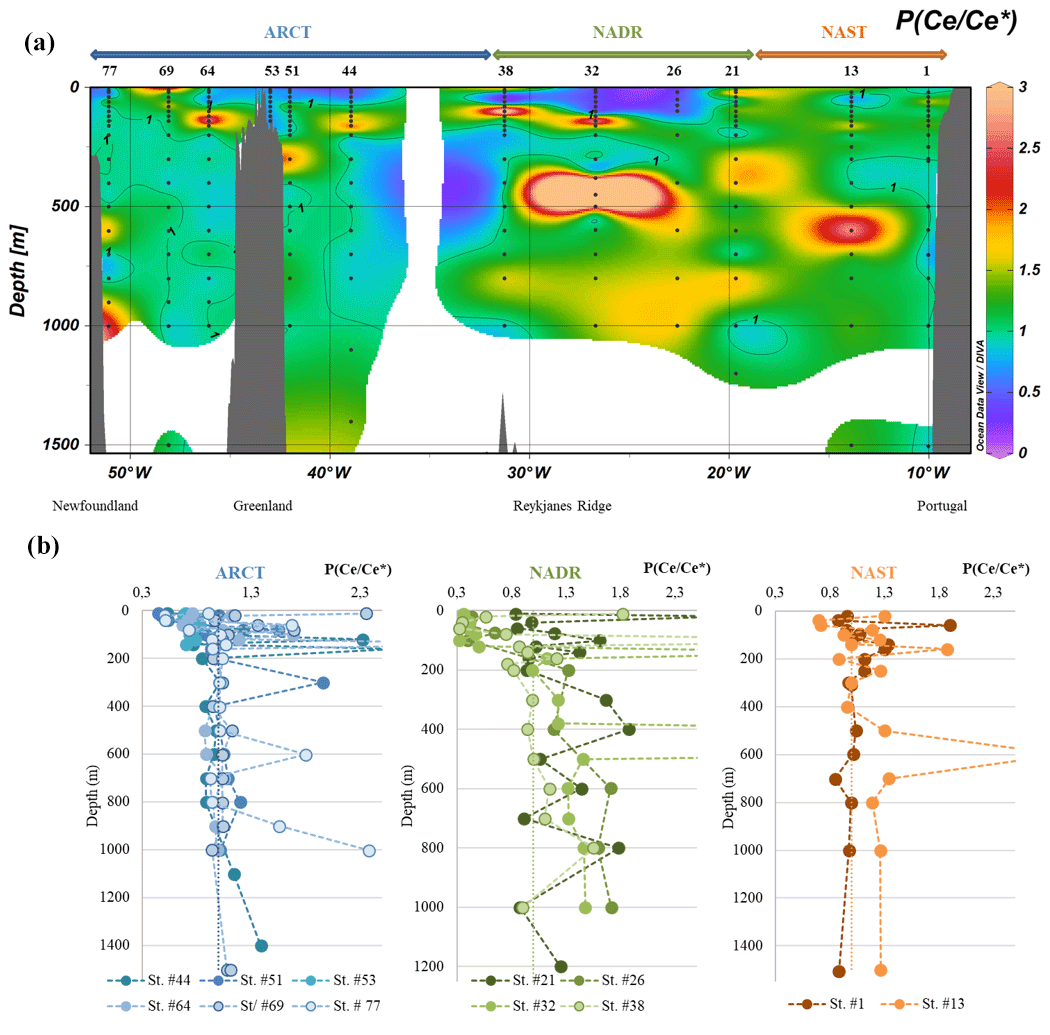
Figure 7(a) Particulate Ce anomaly () along the GEOVIDE section, interpolated with the DIVA gridding function of Ocean Data View and (b) profiles grouped by biogeochemical provinces (ARCT, NADR, NAST). Panel (a) presents the first 200 m and panel (b) all the data. Values above 2.5 are not represented. The dashed black vertical line in each panel represents the absence of anomaly (1).
In the NADR region, between the surface and 50 m (station nos. 26 and 32) and between 20 and 60 m (station no. 38, which showed a surprising positive anomaly at the surface), the negative PCe anomaly was related to the seawater-like patterns, produced by REE uptake in seawater during formation of biogenic matter (Garcia-Solsona et al., 2014; Tachikawa et al., 1999b): all REE were absorbed from seawater without fractionation. These PCe anomalies were rather constant or showed a slight increase with depth until 50 m or 100 m, depending on the stations. Below, the PCe anomalies increased with depth. These PCe anomaly variations were consistent with the high productivity and export characterizing this area (Lemaitre et al., 2018b). Indeed, if particles were removed faster than Ce is oxidized, the Ce anomaly would have been limited with depth (Moffett, 1990). Two factors could explain the step in observed between 50 and 100 m in the NADR: the beginning of remineralization in favor of the release of trivalent REE; and/or a decrease in the particle settling speed, in favor of CeO2 adsorption from seawater and precipitation of Mn oxides which catalyzed Ce oxidation onto particles. Both factors could act simultaneously. The anomaly became even larger between 200 and 400 m, depending on the profiles, and was constant below 600 m, suggesting an equilibrium between Ce oxidation, trivalent REE desorption, and remineralization processes. The behavior of PCe at station no. 21 was less clear, the profile displaying strong vertical variations (Fig. 7b): an important increase in was observed at 40 m depth; then, Ce/Ce* decreased at 200 m to a value similar to the surface one. These sharp variations suggested an influence of lithogenic particles, which was not observed at the other stations. A comparison between PCe lithogenic fractions and the Ce anomaly vertical profiles showed mirror variations: less pronounced PCe anomalies were correlated with higher PCe lithogenic proportions (Fig. S8). This could be explained by advection of quite well preserved lithogenic material with smooth Ce anomaly. This is consistent with the spreading of nepheloid layers from the Iberian margin discussed above.
In the ARCT region, negative anomalies were also determined at the surface, but they were less pronounced than in the NADR region (Fig. 7). The PCe anomalies increased with depth down to 200 m at station nos. 44, 51, 64, and 77 but remained lower than in the NADR region for the same depth range. These profiles could be compared to the profiles of station nos. 26 and 32, with a rather constant PCe anomaly in the first meters that increased after a “critical” depth (here about 40 m versus 100 m in the NADR). The PCe anomaly was then roughly constant below 200 m at station nos. 51, 64, and 69. At station nos. 44 and 77, the anomaly increased below 700 and 1000 m, respectively. The weaker negative anomaly at the surface was consistent with a lower primary production (Lemaitre et al., 2018b). The roughly constant PCe anomaly at depths below 200 m indicated that equilibrium between biotic and abiotic Ce oxidation, adsorption and remineralization of trivalent REE was reached faster in the ARCT region.
At station no. 69, high PCe positive anomalies were observed at the surface, and there was no significant increase in the anomaly with depth. These variations were consistent with the fraction of lithogenic PCe, but not as much as at station no. 21, where the lithogenic fraction was smaller (<60 %, Fig. S8). At this station, the equilibrium between the reactions leading to a PCe enrichment and adsorption-remineralization of all REE was reached at ca. 100 m, which was deeper than at the other stations of the region, suggesting a lower particle flux. At station no. 53, Ce anomaly was roughly constant (around 1), which is consistent with a station dominated by lithogenic inputs.
Four points displayed a >3 (station no. 32 at 140 and 450 m, station no. 38 at 100 m, and station no. 64 at 140 m). Although we cannot exclude punctual contamination in Ce during the sampling, we do not have a clear explanation and decided not to consider these data further. They are reported in parentheses in Table 2 and are not included in the figures.
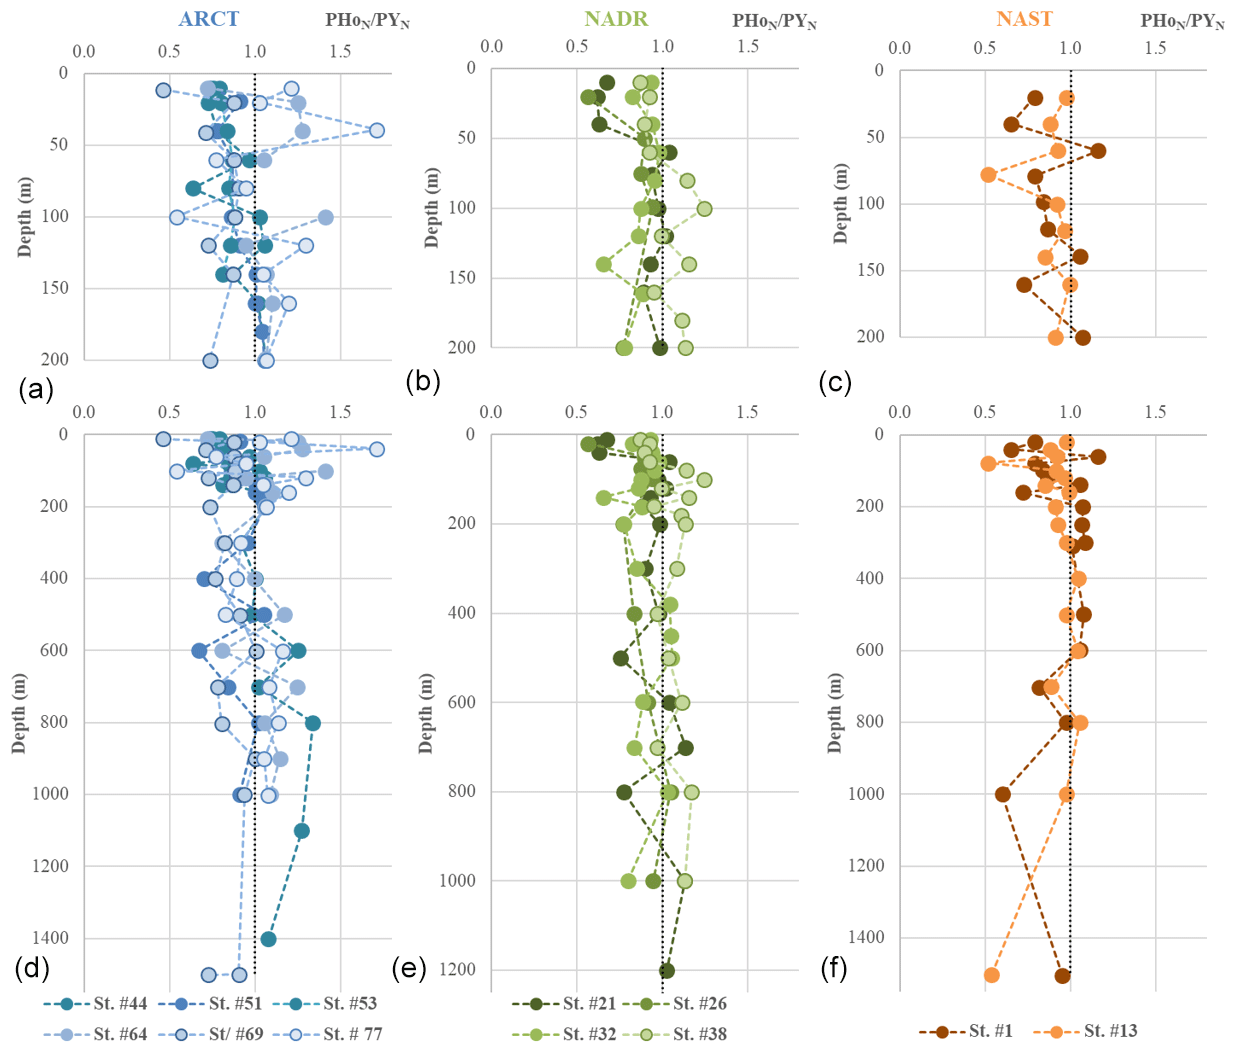
Figure 8PAAS-normalized PHo∕PY profiles grouped by biogeochemical provinces (ARCT, NADR, NAST). (a), (b), and (c) present the first 200 m and (d), (e), and (f) all the data. The dashed black vertical line in each panel represents the PAAS ratio (1).
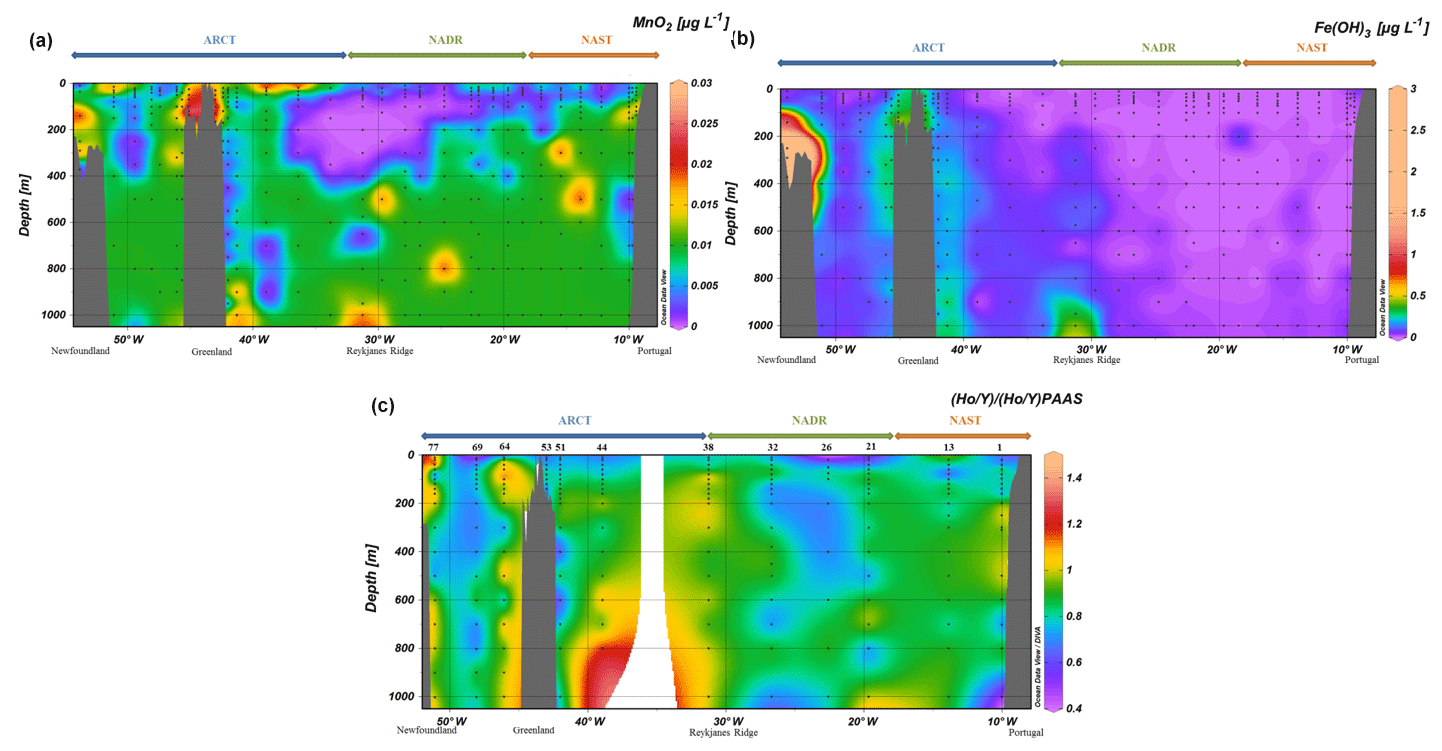
Figure 9(a) MnO2 and (b) Fe(OH)3 concentrations (in µg L−1) calculated with the formula proposed by Lam et al. (2017) using particulate Mn, Fe, and Al concentrations from Gourain et al. (2019). (c) PHo∕PY normalized to PAAS.
4.6 The influence of biological activity on the PREE distributions
At station nos. 26, 32, 38, and 44, which displayed a seawater-like pattern at the surface, the formation of biogenic matter associated with high particle fluxes could explain the negative Ce anomaly and high PYbN∕PNdN ratios (>1 and up to 4.5). These patterns were progressively attenuating with depth due to the Ce oxidation discussed in the preceding section. However, the enrichment in HREE could reach 1000 m (Fig. 4), while the negative Ce anomaly was never observed at depths deeper than 100 m. Yet surprisingly, this could indicate that HREE are not fully associated with the soft tissues of the biogenic material. A LREE enrichment was simultaneously observed, consistent with the preferential scavenging of LREE onto solid phases.
When looking more closely at the authigenic phase of these samples, an uncommon enrichment of PHREE was observed, consistent with the total PREE patterns (Figs. 5 and S7). A strong primary production was determined at all these stations (Fonseca-Batista et al., 2019), so the preferential transfer of HREE from the dissolved phase to the authigenic particulate phase likely occurred when the biological stripping was active. This transfer seemed to have been even more important in the ARCT region, leading to more pronounced HREE enrichments, while the strongest bloom was observed in the NADR region. In the ARCT surface waters the PYbN∕PNdN could reach 4.5, whereas PYbN∕PNdN never exceeded 3 in the NADR region. In the ARCT region, the bloom was dominated by diatoms, still active at station nos. 51 and 44 and declining at the others (Fonseca-Batista et al., 2019; Lemaitre et al., 2018b). This declining bloom led to a strong export, but high remineralization rates decreased the biological imprint in favor of the lithogenic signature at depth (Fig. 5). Thus, we suspect that biological uptake had a strong effect on the total and authigenic PREE patterns observed during GEOVIDE. A relationship between HREE and biogenic silica (BSi) was suggested by Akagi (2013), following thermodynamic calculations. According to this work, between 40 % and 65 % of REE form a REE(H3SiO4)2+ could complex with silicic acid in the deep North Atlantic. Complexation of REE with silicates was further confirmed by Patten and Byrne (2017), although these authors estimated a lower complexation constant, and a smaller fraction of silica-complexed REE. In addition, significant correlations were observed between dissolved Si and dissolved HREE by Bertram and Elderfield (1992; western Indian Ocean), Stichel et al. (2012) and Garcia-Solsona et al. (2014, both in the Atlantic sector of the Southern Ocean), Grenier et al. (2018; Kerguelen Islands), and Pham et al. (2019; Solomon Sea). Contrastingly, in other areas, Patten and Byrne (laboratory experiment, 2017, their Fig. 7) and Zheng et al. (tropical South Atlantic, 2016, their Fig. 11) showed that the relationship between SiOH4 and REE was either curvilinear or not significant. In our study, the highest surface authigenic PYbN∕PNdN ratios were located in the Irminger and Labrador seas, where the highest BSi concentrations of the GEOVIDE section were also measured (Sarthou et al., 2018) (Fig. S9a and b). A correlation between BSi and PHREE concentrations was detected, although it remained weak, the highest correlation coefficient being R2=0.4 for Lu. Interestingly, this correlation coefficient increased with the atomic mass number, confirming that BSi has a significant effect on authigenic PHREE distributions, from Tb to Lu, but not on lighter REE (Fig. S9c). These correlations may indicate that in some areas characterized by high diatom blooms, the HREE distributions could be partly linked to the BSi formation, in agreement with Akagi's hypotheses. This relationship would depend on the abundance and the nature of particles (i.e., the occurrence of diatoms) and on the speciation of REE in the dissolved phase (de Baar et al., 2018). Akagi (2013) suggested that silica–REE complexes could be incorporated during frustule formation, but the mechanism underlying this enrichment during diatom blooms still has to be clarified. Linking it to what is known about complexation and adsorption processes of the REE is beyond the scope of this work. In addition, an effective relationship between BSi and PHREE can be blurred by other scavenging processes involving particulate Mn and Fe (hydr)oxides, also known to influence the slope between LREE and HREE.
If diatoms are effectively preferentially incorporating the HREE, the high prevalence of coccolithophorids characterizing the NADR bloom (Lemaitre et al., 2018b) could explain the relatively low HREE enrichment in surface. Besides, patterns flatten with depth to present a quasi-lithogenic signature below 60 m, suggesting that particles with a strong organic signature did not reach this depth at the time of sampling.
4.7 The PAAS-normalized particulate Ho / Y ratio: a proxy of processes independent of the ionic radius
Yttrium (Y) and lanthanide holmium (Ho) are characterized by roughly the same ionic radius and charge, making them “geochemical twins” (Bau, 1999). The PAAS-normalized particulate ratio (PHoN∕PYN) highlights differences in their distributions and therefore allows identification of radius-independent fractionation processes affecting YREE in seawater. We choose to normalize PHo∕PY measured in our particulate samples to the PAAS ratio in order to reveal any relative loss or enrichment compared to continental material (Fig. 8). Because of different electron configurations, Ho is more prone to establishing ionic bounds and thus to being preferentially adsorbed onto (hydr)oxides like FeOH3 and MnO2. In comparison, Y preferentially establishes covalent bounds, and will be preferentially absorbed compared to Ho (Censi et al., 2007; Bau, 1999; Bau et al., 1995). Along the GEOVIDE section, PHoN∕PYN ratios varied between 0.4 and 1.5, with most of the values being smaller than 1 (i.e., depleted in Ho compared to PAAS). To assess the influence of FeOH3 and MnO2 on PHoN∕PYN distributions, we calculated their concentrations using the formula of Lam et al. (2015) and PMn and PFe data from Gourain et al. (2019). There was no obvious relationship between PHoN∕PYN and FeOH3 and MnO2 (Fig. 9). Notably, PHoN∕PYN ratios were higher when [Fe(OH)3] >10−2 µg L−1 and when MnO2 content increased. However, the PHoN∕PYN ratio was low (<0.6) in the Labrador Sea surface waters (station no. 69), the Irminger Sea (station nos. 44 and 51), and from the surface to 750 m depth in the NADR region (station nos. 21, 26, and 32; Fig. 8). This is consistent with the fact that both these locations are depleted in MnO2 and Fe(OH)3, leading to a weak adsorption of Ho (Fig. 9). All along the section, low PHoN∕PYN ratios were observed from the surface to 800 m depth at productive stations (station nos. 21, 26, and 32, PHoN∕PYN <0.9). This suggested a preferential absorption of Y during the formation of biogenic matter, as reported by Censi et al. (2007). In the NADR region, between 200 and 600 m depth, PCe anomalies were positive (>1), PHREE were enriched, and PHo concentrations were relatively depleted at station nos. 26 and 21 (PHoN∕PYN <1). The low remineralization rates observed in this area (Lemaitre et al., 2018a) could explain the enrichment of PY concentrations at the surface. At station no. 32, high PHo concentrations between 350 and 600 m depth were concomitant with the largest PCe positive anomaly (>1.2), indicating intensive adsorption processes, leading to an enhanced scavenging of REE.
In the ARCT region, at station no. 69, slightly lower PHoN∕PYN ratios were observed compared to the other stations of this region (0.5 at the surface, around 0.7 to 0.9 with depth). This station was characterized by a low primary production and the highest remineralization rates of the section (Fonseca-Batista et al., 2019; Lemaitre et al., 2018a, b). This could have led to high adsorption of Ho relative to Y. As Ho is more prone to being released from particles than Y, a lower PHoN∕PYN ratio was observed. The higher PHoN∕PYN ratios determined at the other ARCT stations point to scavenging by particles, although the Ce anomaly was lower than in the NADR region.
Although the PHoN∕PYN ratios were not directly correlated with MnO2 and Fe(OH)3 estimated concentrations, this ratio was lower when the primary production was high, in agreement with a preferential incorporation of Y into the biogenic matter. The change in PHoN∕PYN ratios with depth reflects a balance between two processes: the preferential scavenging of Ho by adsorption onto MnO2 (identified with PCe anomalies) and remineralization.
Particulate concentrations of the 14 Rare Earth Elements and 232Th were measured in 200 samples of suspended particles collected in the epipelagic and mesopelagic zones of the subpolar North Atlantic during the GEOVIDE cruise (GEOTRACES GA01) during the late spring–early summer of 2014, providing one of the only available PREE distribution snapshots in the North Atlantic. All PREE concentrations were higher close to the margins, especially at the Iberian margin (station no. 1) and on the Greenland shelf (station no. 53). These high concentrations contrasted with the low concentrations measured in the surface waters of the NADR region (station nos. 26, 32, and 38) and in the Irminger Sea (station no. 44).
The use of 232Th as a lithogenic tracer allowed identification of the lithogenic and authigenic REE fractions. The greatest PREE lithogenic fractions were determined close to the Iberian margin, where 80 % to 100 % of PREE have a lithogenic origin, in particular within two nepheloid layers located at 250 and 500 m depth. These two nepheloid layers extended westward, mostly along isopycnals σ0=27.05 and σ0=27.4. This lithogenic signature was still visible at station no. 32, in other words at 1700 km from the margin, due to strong currents and energetic dynamics potentially enhanced by internal waves. Lower lithogenic fractions, between 50 % and 80 % of REE, were determined close to the Newfoundland margin and on the Greenland shelf (station no. 53). No significant lithogenic inputs could be observed far from the Greenland shelf at station nos. 51 and 64. This is due to the strong EGIC current that prevents exchanges between the shelf and the open ocean.
The influence of biological activity on REE scavenging has also been evaluated. In areas of high biological productivity, the authigenic phase of particles was enriched in HREE compared to LREE. These particles also displayed negative PCe anomalies as well as low PHoN∕YN ratios, suggesting recently formed particles with a preferential uptake of HREE and Y by absorption. In the NADR region, PCe anomaly and LREE enrichment increased with depth, while the PHoN∕PYN ratio remained low (<1). Low remineralization rates could maintain low PHoN∕PYN ratios while promoting exchanges with the dissolved phase. This also led to the building of the PCe anomaly through sorption processes and to PLREE enrichment. In the Labrador Sea, remineralization rates were higher and moderate PCe positive anomalies were observed together with low PHoN∕PYN ratios (, PHoN∕PYN <1). High remineralization rates could have induced an increase in exchanges between particulate and the dissolved pools, leading to a lower number of adsorption sites on the authigenic coatings, and to subsequent lower PCe anomalies. The low PHoN∕PYN ratios can also be attributed to these reduced exchanges. Thus, our results suggested that the PHoN∕PYN ratios were less controlled by MnO2 and Fe(OH)3 than previously proposed but more likely controlled by other processes such as absorption and adsorption that do not involve these two (hydr)oxides.
We also highlighted the importance of biogenic silica for HREE preferential scavenging, shown by a clear increase in the PHREE concentrations in the surface waters of the ARCT region, where a massive diatom bloom occurred. The correlation coefficient between BSi and REE concentrations showed no particular links with the atomic mass number from La to Gd, while it increased from Tb to Lu. This relationship was only observed for PHREE and the underlying mechanisms will have to be investigated in future studies.
All data are included in the article in Table 2 and have been submitted to be included in the GEOTRACES Intermediate Data Product 2021 (IDP2021).
The supplement related to this article is available online at: https://doi.org/10.5194/bg-17-5539-2020-supplement.
NL did the sampling during the cruise, helped by CJ and HP. NL did the leaching on the PC filters and conducted first Ba measurements. CJ, MB, MG and ML did REE measurements. ML wrote the draft, which was upgraded and corrected by CJ, HP, MG, NL and PL.
The authors declare that they have no conflict of interest.
We are thankful to the captain, Gilles Ferrand, and crew of the R/V Pourquoi Pas? for their help during the GEOVIDE mission. Geraldine Sarthou, PI of GEOVIDE with Pascale Lherminier (co-author), is acknowledged for her serene management of this long cruise. We would like to give special thanks to Pierre Branellec, Floriane Desprez de Gésincourt, Michel Hamon, Catherine Kermabon, Philippe Le Bot, Stéphane Leizour, Olivier Ménage, Fabien Pérault, and Emmanuel de Saint Léger for their technical expertise and to Catherine Schmechtig for the GEOVIDE database management. We also thank the trace metal clean sampling team.
We thank Aurelie Marquet, Camille Duquenoy, and Jerome Chmeleff for making the (sometimes capricious) HR-ICP-MS operational. Many thanks to Michael Bau for the fruitful discussion we had during the Goldschmidt conference.
We are also deeply grateful to Rob Sherrell and one anonymous reviewer, whose comments helped us to improve this paper.
This research has been supported by the French National Research Agency (grant ANR-13-BS06-0014, ANR-12-PDOC-0025-01), the French National Centre for Scientific Research (grant CNRS-LEFE-CYBER), the LabexMER (grant ANR-10-LABX-19), and Ifremer. It was supported in the logistics by DT-INSU and GENAVIR.
This paper was edited by Caroline P. Slomp and reviewed by two anonymous referees.
Akagi, T.: Rare earth element (REE) – silicic acid complexes in seawater to explain the incorporation of REEs in opal and the “leftover” REEs in surface water: New interpretation of dissolved REE distribution profiles, Geochim. Cosmochim. Ac., 113, 174–192, https://doi.org/10.1016/j.gca.2013.03.014, 2013.
Akagi, T., Fu, F., Hongo, Y., and Takahashi, K.: Composition of rare earth elements in settling particles collected in the highly productive North Pacific Ocean and Bering Sea: Implications for siliceous-matter dissolution kinetics and formation of two REE-enriched phases, Geochim. Cosmochim. Ac., 75, 4857–4876, https://doi.org/10.1016/j.gca.2011.06.001, 2011.
Aries, S., Valladon, M., Polvé, M., and Dupré, B.: A Routine Method for Oxide and Hydroxide Interference Corrections in ICP-MS Chemical Analysis of Environmental and Geological Samples, Geostandard. Geoanal. Res., 24, 19–31, https://doi.org/10.1111/j.1751-908X.2000.tb00583.x, 2000.
Bau, M.: Scavenging of dissolved yttrium and rare earths by precipitating iron oxyhydroxide: Experimental evidence for Ce oxidation, Y-Ho fractionation, and lanthanide tetrad effect, Geochim. Cosmochim. Ac., 63, 67–77, 1999.
Bau, M. and Dulski, P.: Distribution of yttrium and rare-earth elements in the Penge and Kuruman iron-formations, Transvaal Supergroup, South Africa, Precambrian Res., 79, 37–55, https://doi.org/10.1016/0301-9268(95)00087-9, 1996.
Bau, M. and Koschinsky, A.: Oxidative scavenging of cerium on hydrous Fe oxide: Evidence from the distribution of rare earth elements and yttrium between Fe oxides and Mn oxides in hydrogenetic ferromanganese crusts, Geochem. J., 43, 37–47, https://doi.org/10.2343/geochemj.1.0005, 2009.
Bau, M., Dulski, P., and Moller, P.: Yttrium and Holmium in South Pacific Seawater: Vertical Distribution and Possible Fractionation Mechanisms, Chem. Erde, 55, 1–15, 1995.
Bayon, G., German, C. R., Burton, K. W., Nesbitt, R. W., and Rogers, N.: Sedimentary Fe–Mn oxyhydroxides as paleoceanographic archives and the role of aeolian flux in regulating oceanic dissolved REE, Earth Planet. Sci. Lett., 224, 477–492, https://doi.org/10.1016/j.epsl.2004.05.033, 2004.
Bertram, C. J. and Elderfield, H.: The geochemical balance of the rare earth elements and neodymium isotopes in the oceans, Geochim. Cosmochim. Ac., 57, 1957–1986, 1992.
Bolhar, R., Kamber, B. S., Moorbath, S., Fedo, C. M., and Whitehouse, M. J.: Characterisation of early Archaean chemical sediments by trace element signatures, Earth Planet. Sc. Lett., 222, 43–60, https://doi.org/10.1016/j.epsl.2004.02.016, 2004.
Byrne, R. H. and Kim, K.-H.: Rare earth element scavenging in seawater, Geochim. Cosmochim. Ac., 54, 2645–2656, https://doi.org/10.1016/0016-7037(90)90002-3, 1990.
Cacchione, D. A.: The Shaping of Continental Slopes by Internal Tides, Science, 296, 724–727, https://doi.org/10.1126/science.1069803, 2002.
Censi, P., Zuddas, P., Larocca, D., Saiano, F., Placenti, F., and Bonanno, A.: Recognition of water masses according to geochemical signatures in the Central Mediterranean sea: Y/Ho ratio and rare earth element behaviour, Chem. Ecol., 23, 139–153, https://doi.org/10.1080/02757540701197879, 2007.
Chase, Z., Anderson, R. F. and Fleisher, M. Q.: Evidence from authigenic uranium for increased productivity of the glacial subantarctic ocean, Paleoceanography, 16, 468–478, https://doi.org/10.1029/2000PA000542, 2001.
Crecelius, E. A.: The solubility of coal fly ash and marine aerosols in seawater, Mar. Chem., 8, 245–250, https://doi.org/10.1016/0304-4203(80)90013-4, 1980.
Daniault, N., Mercier, H., Lherminier, P., Sarafanov, A., Falina, A., Zunino, P., Pérez, F. F., Ríos, A. F., Ferron, B., Huck, T., Thierry, V., and Gladyshev, S.: The northern North Atlantic Ocean mean circulation in the early 21st century, Prog. Oceanogr., 146, 142–158, https://doi.org/10.1016/j.pocean.2016.06.007, 2016.
Davranche, M., Pourret, O., Gruau, G., and Dia, A.: Impact of humate complexation on the adsorption of REE onto Fe oxyhydroxide, J. Colloid Interf. Sci., 277, 271–279, https://doi.org/10.1016/j.jcis.2004.04.007, 2004.
De Baar, H. J. W., Bacon, M. P., Brewer, P. G., and Bruland, K. W.: Rare earth elements in the Pacific and Atlantic Oceans, Geochim. Cosmochim. Ac., 49, 1943–1959, https://doi.org/10.1016/0016-7037(85)90089-4, 1985.
de Baar, H. J. W., Bruland, K. W., Schijf, J., van Heuven, S. M. A. C., and Behrens, M. K.: Low cerium among the dissolved rare earth elements in the central North Pacific Ocean, Geochim. Cosmochim. Ac., 236, 5–40, https://doi.org/10.1016/j.gca.2018.03.003, 2018.
De Carlo, E. H., Wen, X.-Y., and Irving, M.: The Influence of Redox Reactions on the Uptake of Dissolved Ce by Suspended Fe and Mn Oxide Particles, Aquat. Geochem., 3, 357–389, https://doi.org/10.1023/A:1009664626181, 1997.
de Jong, M. F. and de Steur, L.: Strong winter cooling over the Irminger Sea in winter 2014–2015, exceptional deep convection, and the emergence of anomalously low SST: Irminger sea cooling and convection, Geophys. Res. Lett., 43, 7106–7113, https://doi.org/10.1002/2016GL069596, 2016.
Elderfield H.: The oceanic chemistry of the rare-earth elements, Philos. T. R. Soc. Lond. Ser. A, 325, 105–126, 1988.
Elderfield, H. and Greaves, M. J.: The rare earth elements in seawater, Nature, 296, 214–219, https://doi.org/10.1038/296214a0, 1982.
Fonseca-Batista, D., Li, X., Riou, V., Michotey, V., Deman, F., Fripiat, F., Guasco, S., Brion, N., Lemaitre, N., Tonnard, M., Gallinari, M., Planquette, H., Planchon, F., Sarthou, G., Elskens, M., LaRoche, J., Chou, L., and Dehairs, F.: Evidence of high N2 fixation rates in the temperate northeast Atlantic, Biogeosciences, 16, 999–1017, https://doi.org/10.5194/bg-16-999-2019, 2019.
Fowler, S. W. and Knauer, G. A.: Role of large particles in the transport of elements and organic compounds through the oceanic water column, Prog. Oceanogr., 16, 147–194, https://doi.org/10.1016/0079-6611(86)90032-7, 1986.
García-Ibáñez, M. I., Pardo, P. C., Carracedo, L. I., Mercier, H., Lherminier, P., Ríos, A. F., and Pérez, F. F.: Structure, transports and transformations of the water masses in the Atlantic Subpolar Gyre, Prog. Oceanogr., 135, 18–36, https://doi.org/10.1016/j.pocean.2015.03.009, 2015.
García-Ibáñez, M. I., Pérez, F. F., Lherminier, P., Zunino, P., Mercier, H., and Tréguer, P.: Water mass distributions and transports for the 2014 GEOVIDE cruise in the North Atlantic, Biogeosciences, 15, 2075–2090, https://doi.org/10.5194/bg-15-2075-2018, 2018.
Garcia-Solsona, E., Jeandel, C., Labatut, M., Lacan, F., Vance, D., Chavagnac, V., and Pradoux, C.: Rare earth elements and Nd isotopes tracing water mass mixing and particle-seawater interactions in the SE Atlantic, Geochim. Cosmochim. Ac., 125, 351–372, 2014.
Gehlen, M., Bopp, L., Emprin, N., Aumont, O., Heinze, C., and Ragueneau, O.: Reconciling surface ocean productivity, export fluxes and sediment composition in a global biogeochemical ocean model, Biogeosciences, 3, 521–537, https://doi.org/10.5194/bg-3-521-2006, 2006.
Gourain, A., Planquette, H., Cheize, M., Lemaitre, N., Menzel Barraqueta, J.-L., Shelley, R., Lherminier, P., and Sarthou, G.: Inputs and processes affecting the distribution of particulate iron in the North Atlantic along the GEOVIDE (GEOTRACES GA01) section, Biogeosciences, 16, 1563–1582, https://doi.org/10.5194/bg-16-1563-2019, 2019.
Grenier, M.: Differentiating Lithogenic Supplies, Water Mass Transport, and Biological Processes On and Off the Kerguelen Plateau Using Rare Earth Element Concentrations and Neodymium Isotopic Compositions, Front. Mar. Sci., 5, 426, https://doi.org/10.3389/fmars.2018.00426, 2018.
Guichard, F., Church, T. M., Treuil, M., and Jaffrezic, H.: Rare earths in barites: distribution and effects on aqueous partitioning, Geochim. Cosmochim. Ac., 43, 983–997, https://doi.org/10.1016/0016-7037(79)90088-7, 1979.
Hayes, C. T., Anderson, R. F., Fleisher, M. Q., Vivancos, S. M., Lam, P. J., Ohnemus, D. C., Huang, K.-F., Robinson, L. F., Lu, Y., Cheng, H., Edwards, R. L., and Moran, S. B.: Intensity of Th and Pa scavenging partitioned by particle chemistry in the North Atlantic Ocean, Mar. Chem., 170, 49–60, https://doi.org/10.1016/j.marchem.2015.01.006, 2015.
Henderson, G. M., Anderson, R. F., Adkins, J., Andersson, P., Boyle, E. A., Cutter, G., de Baar, H., Eisenhauer, A., Frank, M., Francois, R., Orians, K., Gamo, T., German, C., Jenkins, W., Moffett, J., Jeandel, C., Jickells, T., Krishnaswami, S., Mackey, D., Measures, C. I., Moore, J. K., Oschlies, A., Pollard, R., van der Loeff, M. R., Schlitzer, R., Sharma, M., von Damm, K., Zhang, J., Masque, P., and Grp, S. W.: GEOTRACES – An international study of the global marine biogeochemical cycles of trace elements and their isotopes, Chemie Der Erde-Geochem., 67, 85–131, https://doi.org/10.1016/j.chemer.2007.02.001, 2007.
Jeandel, C. and Oelkers, E. H.: The influence of terrigenous particulate material dissolution on ocean chemistry and global element cycles, Chem. Geol., 395, 50–66, https://doi.org/10.1016/j.chemgeo.2014.12.001, 2015.
Jeandel, C., Bishop, J. K., and Zindler, A.: Exchange of neodymium and its isotopes between seawater and small and large particles in the Sargasso Sea, Geochim. Cosmochim. Ac., 59, 535–547, https://doi.org/10.1016/0016-7037(94)00367-U, 1995.
Jeandel, C., Rutgers van der Loeff, M., Lam, P. J., Roy-Barman, M., Sherrell, R. M., Kretschmer, S., German, C., and Dehairs, F.: What did we learn about ocean particle dynamics in the GEOSECS–JGOFS era?, Prog. Oceanogr., 133, 6–16, https://doi.org/10.1016/j.pocean.2014.12.018, 2015.
Khatiwala, S., Tanhua, T., Mikaloff Fletcher, S., Gerber, M., Doney, S. C., Graven, H. D., Gruber, N., McKinley, G. A., Murata, A., Ríos, A. F., and Sabine, C. L.: Global ocean storage of anthropogenic carbon, Biogeosciences, 10, 2169–2191, https://doi.org/10.5194/bg-10-2169-2013, 2013.
Koeppenkastrop, D. and De Carlo, E. H.: Sorption of rare-earth elements from seawater onto synthetic mineral particles: An experimental approach, Chem. Geol., 95, 251–263, https://doi.org/10.1016/0009-2541(92)90015-W, 1992.
Koeppenkastrop, D. and De Carlo, E. H.: Uptake of rare earth elements from solution by metal oxides, Environ. Sci. Technol., 27, 1796–1802, https://doi.org/10.1021/es00046a006, 1993.
Koeppenkastrop, D., De Carlo, E. H., and Roth, M.: A method to investigate the interaction of rare earth elements in aqueous solution with metal oxides, J. Radioan. Nucl. Chem., 152, 337–346, https://doi.org/10.1007/BF02104687, 1991.
Kuss, J., Garbe-Schönberg, C.-D., and Kremling, K.: Rare earth elements in suspended particulate material of North Atlantic surface waters, Geochim. Cosmochim. Ac., 65, 187–199, https://doi.org/10.1016/S0016-7037(00)00518-4, 2001.
Kwon, E. Y., Primeau, F., and Sarmiento, J. L.: The impact of remineralization depth on the air–sea carbon balance, Nat. Geosci., 2, 630–635, https://doi.org/10.1038/ngeo612, 2009.
Lacan, F. and Jeandel, C.: Acquisition of the neodymium isotopic composition of the North Atlantic Deep Water: neodymium isotopic composition, Geochem. Geophy. Geosy., 6, Q12008, https://doi.org/10.1029/2005GC000956, 2005.
Lam, P. J. and Marchal, O.: Insights into Particle Cycling from Thorium and Particle Data, Annu. Rev. Mar. Sci., 7, 159–184, https://doi.org/10.1146/annurev-marine-010814-015623, 2015.
Lam, P. J., Twining, B. S., Jeandel, C., Roychoudhury, A., Resing, J. A., Santschi, P. H., and Anderson, R. F.: Methods for analyzing the concentration and speciation of major and trace elements in marine particles, Prog. Oceanogr., 133, 32–42, https://doi.org/10.1016/j.pocean.2015.01.005, 2015.
Lam, P. J., Lee, J., Heller, M. I., Mehic, S., Xiang, Y., and Bates, N. R.: Size-fractionated distributions of suspended particle concentration and major phase composition from the U.S. GEOTRACES Eastern Pacific Zonal Transect (GP16), Mar. Chem., 201, 90–107, https://doi.org/10.1016/j.marchem.2017.08.013, 2017.
Lemaitre, N., Planchon, F., Planquette, H., Dehairs, F., Fonseca-Batista, D., Roukaerts, A., Deman, F., Tang, Y., Mariez, C., and Sarthou, G.: High variability of particulate organic carbon export along the North Atlantic GEOTRACES section GA01 as deduced from 234Th fluxes, Biogeosciences, 15, 6417–6437, https://doi.org/10.5194/bg-15-6417-2018, 2018a.
Lemaitre, N., Planquette, H., Sarthou, G., Jacquet, S., García-Ibáñez, M. I., Gourain, A., Cheize, M., Monin, L., André, L., Laha, P., Terryn, H., Dehairs, F., and Dehairs, F.: Particulate barium tracing of significant mesopelagic carbon remineralisation in the North Atlantic, Biogeosciences, 15, 2289–2307, https://doi.org/10.5194/bg-15-2289-2018, 2018b.
Lerner, P., Marchal, O., Lam, P. J., and Solow, A.: Effects of particle composition on thorium scavenging in the North Atlantic, Geochim. Cosmochim. Ac., 233, 115–134, https://doi.org/10.1016/j.gca.2018.04.035, 2018.
Le Roy, E.: Distribution des radionucléides naturels (226Ra et 227Ac) le long de la section GA01 dans l'Atlantique Nord., Université de Toulouse III – Paul Sabatier, Toulouse, available at: https://hal.archives-ouvertes.fr/tel-02454460 (last access: 5 May 2020), 2019.
Lherminier, P. and Sarthou, G.: The 2014 Greenland-Portugal GEOVIDE CTDO2 hydrographic and SADCP data (GO-SHIP A25 and GEOTRACES GA01), SEANOE, https://doi.org/10.17882/52153, 2017.
Longhurst, A.: Seasonal cycles of pelagic production and consumption, Prog. Oceanogr., 36, 77–167, https://doi.org/10.1016/0079-6611(95)00015-1, 1995.
McCave, I. and Hall, I.: Turbidity of waters over the Northwest Iberian continental margin, Prog. Oceanogr., 52, 299–313, https://doi.org/10.1016/S0079-6611(02)00012-5, 2002.
Moffett, J. W.: Microbially mediated cerium oxidation in sea water, Nature, 345, 421–423, https://doi.org/10.1038/345421a0, 1990.
Moffett, J. W.: The relationship between cerium and manganese oxidation in the marine environment, Limnol. Oceanogr., 39, 1309–1318, https://doi.org/10.4319/lo.1994.39.6.1309, 1994.
Ohnemus, D. C. and Lam, P. J.: Cycling of lithogenic marine particles in the US GEOTRACES North Atlantic transect, Deep-Sea Res. Pt. II, 116, 283–302, https://doi.org/10.1016/j.dsr2.2014.11.019, 2015.
Ohta, A. and Kawabe, I.: REE(III) adsorption onto Mn dioxide (δ-MnO2) and Fe oxyhydroxide: Ce(III) oxidation by δ-MnO2, Geochim. Cosmochim. Ac., 65, 695–703, 2001.
Palmer, M. R.: Rare earth elements in foraminifera tests, Earth Planet. Sc. Lett., 73, 285–298, 1985.
Patten, J. T. and Byrne, R. H.: Assessment of Fe(III) and Eu(III) complexation by silicatein aqueous solutions, Geochim. Cosmochim. Ac., 202, 361–373, https://doi.org/10.1016/j.gca.2016.12.004, 2017.
Pham, V. Q., Grenier, M., Cravatte, S., Michael, S., Jacquet, S., Belhadj, M., Nachez, Y., Germineaud, C., and Jeandel, C.: Dissolved rare earth elements distribution in the Solomon Sea, Chem. Geol., 524, 11–36, https://doi.org/10.1016/j.chemgeo.2019.05.012, 2019.
Piper, D. Z. and Bau, M.: Normalized Rare Earth Elements in Water, Sediments, and Wine: Identifying Sources and Environmental Redox Conditions, Am. J. Anal. Chem., 4, 69–83, https://doi.org/10.4236/ajac.2013.410A1009, 2013.
Planquette, H. and Sherrell, R. M.: Sampling for particulate trace element determination using water sampling bottles: methodology and comparison to in situ pumps, Limnol. Oceanogr.-Method., 10, 367–388, https://doi.org/10.4319/lom.2012.10.367, 2012.
Rea, D. K.: The paleoclimatic record provided by eolian deposition in the deep sea: The geologic history of wind, Rev. Geophys., 32, 159–195, https://doi.org/10.1029/93RG03257, 1994.
Reygondeau, G., Guidi, L., Beaugrand, G., Henson, S. A., Koubbi, P., MacKenzie, B. R., Sutton, T. T., Fioroni, M., and Maury, O.: Global biogeochemical provinces of the mesopelagic zone, J. Biogeogr., 45, 500–514, https://doi.org/10.1111/jbi.13149, 2018.
Roberts, N. L., Piotrowski, A. M., Elderfield, H., Eglinton, T. I., and Lomas, M. W.: Rare earth element association with foraminifera, Geochim. Cosmochim. Ac., 94, 57–71, https://doi.org/10.1016/j.gca.2012.07.009, 2012.
Rudnick, R. L. and Gao, S.: Composition of the Continental Crust, in: Treatise on Geochemistry, Elsevier, 1–51, 2014.
Sanders, R., Henson, S. A., Koski, M., De La Rocha, C. L., Painter, S. C., Poulton, A. J., Riley, J., Salihoglu, B., Visser, A., Yool, A., Bellerby, R., and Martin, A. P.: The Biological Carbon Pump in the North Atlantic, Prog. Oceanogr., 129, 200–218, https://doi.org/10.1016/j.pocean.2014.05.005, 2014.
Sarthou, G., Lherminier, P., Achterberg, E. P., Alonso-Pérez, F., Bucciarelli, E., Boutorh, J., Bouvier, V., Boyle, E. A., Branellec, P., Carracedo, L. I., Casacuberta, N., Castrillejo, M., Cheize, M., Contreira Pereira, L., Cossa, D., Daniault, N., De Saint-Léger, E., Dehairs, F., Deng, F., Desprez de Gésincourt, F., Devesa, J., Foliot, L., Fonseca-Batista, D., Gallinari, M., García-Ibáñez, M. I., Gourain, A., Grossteffan, E., Hamon, M., Heimbürger, L. E., Henderson, G. M., Jeandel, C., Kermabon, C., Lacan, F., Le Bot, P., Le Goff, M., Le Roy, E., Lefèbvre, A., Leizour, S., Lemaitre, N., Masqué, P., Ménage, O., Menzel Barraqueta, J.-L., Mercier, H., Perault, F., Pérez, F. F., Planquette, H. F., Planchon, F., Roukaerts, A., Sanial, V., Sauzède, R., Schmechtig, C., Shelley, R. U., Stewart, G., Sutton, J. N., Tang, Y., Tisnérat-Laborde, N., Tonnard, M., Tréguer, P., van Beek, P., Zurbrick, C. M., and Zunino, P.: Introduction to the French GEOTRACES North Atlantic Transect (GA01): GEOVIDE cruise, Biogeosciences, 15, 7097–7109, https://doi.org/10.5194/bg-15-7097-2018, 2018.
Schijf, J., Christenson, E. A., and Byrne, R. H.: YREE scavenging in seawater: A new look at an old model, Mar. Chem., 177, 460–471, https://doi.org/10.1016/j.marchem.2015.06.010, 2015.
Schlitzer, R.: Ocean Data View, available at: http://odv.awi.de (last access: 31 October 2020), 2016.
Shelley, R. U., Roca-Martí, M., Castrillejo, M., Sanial, V., Masqué, P., Landing, W. M., van Beek, P., Planquette, H., and Sarthou, G.: Quantification of trace element atmospheric deposition fluxes to the Atlantic Ocean (>40∘ N; GEOVIDE, GEOTRACES GA01) during spring 2014, Deep-Sea Res. Pt. I, 119, 34–49, https://doi.org/10.1016/j.dsr.2016.11.010, 2017.
Sholkovitz, E. R.: Chemical evolution of rare earth elements: fractionation between colloidal and solution phases of filtered river water, Earth Planet. Sc. Lett., 114, 77–84, https://doi.org/10.1016/0012-821X(92)90152-L, 1992.
Sholkovitz, E. R. and Schneider, D. L.: Cerium redox cycles and rare earth elements in the Sargasso Sea, Geochim. Cosmochim. Ac., 55, 2737–2743, https://doi.org/10.1016/0016-7037(91)90440-G, 1991.
Sholkovitz, E. R., Landing, W. M., and Lewis, B. L.: Ocean particle chemistry: The fractionation of rare earth elements between suspended particles and seawater, Geochim. Cosmochim. Ac., 58, 1567–1579, https://doi.org/10.1016/0016-7037(94)90559-2, 1994.
Stemmann, L., Gorsky, G., Marty, J.-C., Picheral, M., and Miquel, J.-C.: Four-year study of large-particle vertical distribution (0–1000 m) in the NW Mediterranean in relation to hydrology, phytoplankton, and vertical flux, Deep-Sea Res. Pt. II, 49, 2143–2162, https://doi.org/10.1016/S0967-0645(02)00032-2, 2002.
Stichel, T., Frank, M., Rickli, J., and Haley, B. A.: The hafnium and neodymium isotope composition of seawater in the Atlantic sector of the Southern Ocean, Earth Planet. Sc. Lett., 317/318, 282–294, https://doi.org/10.1016/j.epsl.2011.11.025, 2012.
Tachikawa, K., Handel, C., and Dupré, B.: Distribution of rare earth elements and neodymium isotopes in settling particulate material of the tropical Atlantic Ocean (EUMELI site), Deep-Sea Res. Pt. I, 44, 1769–1792, https://doi.org/10.1016/S0967-0637(97)00057-5, 1997.
Tachikawa, K., Jeandel, C., and Roy-Barman, M.: A new approach to the Nd residence time in the ocean: the role of atmospheric inputs, Earth Planet. Sc. Lett., 170, 433–446, https://doi.org/10.1016/S0012-821X(99)00127-2, 1999a.
Tachikawa, K., Jeandel, C., Vangriesheim, A., and Dupré, B.: Distribution of rare earth elements and neodymium isotopes in suspended particles of the tropical Atlantic Ocean (EUMELI site), Deep-Sea Res. Pt. I, 46, 733–755, https://doi.org/10.1016/S0967-0637(98)00089-2, 1999b.
Tonnard, M., Planquette, H., Bowie, A. R., van der Merwe, P., Gallinari, M., Desprez de Gésincourt, F., Germain, Y., Gourain, A., Benetti, M., Reverdin, G., Tréguer, P., Boutorh, J., Cheize, M., Lacan, F., Menzel Barraqueta, J.-L., Pereira-Contreira, L., Shelley, R., Lherminier, P., and Sarthou, G.: Dissolved iron in the North Atlantic Ocean and Labrador Sea along the GEOVIDE section (GEOTRACES section GA01), Biogeosciences, 17, 917–943, https://doi.org/10.5194/bg-17-917-2020, 2020.
Trull, T. W. and Armand, L.: Insights into Southern Ocean carbon export from the C of particles and dissolved inorganic carbon during the SOIREE iron release experiment, Deep-Sea Res., 48, 2655–2680, 2001.
Turekian, K. K.: The fate of metals in the oceans, Geochim. Cosmochim. Ac., 41, 1139–1144, https://doi.org/10.1016/0016-7037(77)90109-0, 1977.
Van Beueskom, J. E. E., Van Bennekom, A. J., Tréguer, P., and Morvan, J.: Aluminium and silicic acid in water and sediments of the Enderby and Crozet Basins, Deep-Sea Res. Pt II, 44, 987–1003, https://doi.org/10.1016/S0967-0645(96)00105-1, 1997.
van de Flierdt, T., Pahnke, K., Amakawa, H., Andersson, P., Basak, C., Coles, B., Colin, C., Crocket, K., Frank, M., Frank, N., Goldstein, S. L., Goswami, V., Haley, B. A., Hathorne, E. C., Hemming, S. R., Henderson, G. M., Jeandel, C., Jones, K., Kreissig, K., Lacan, F., Lambelet, M., Martin, E. E., Newkirk, D. R., Obata, H., Pena, L., Piotrowski, A. M., Pradoux, C., Scher, H. D., Schöberg, H., Singh, S. K., Stichel, T., Tazoe, H., Vance, D., and Yang, J.: GEOTRACES intercalibration of neodymium isotopes and rare earth element concentrations in seawater and suspended particles, Part 1: reproducibility of results for the international intercomparison: Intercalibration of Seawater Nd Isotopes, Limnol. Oceanogr. Method., 10, 234–251, https://doi.org/10.4319/lom.2012.10.234, 2012.
Yeghicheyan, D., Bossy, C., Bouhnik Le Coz, M., Douchet, C., Granier, G., Heimburger, A., Lacan, F., Lanzanova, A., Rousseau, T. C. C., Seidel, J.-L., Tharaud, M., Candaudap, F., Chmeleff, J., Cloquet, C., Delpoux, S., Labatut, M., Losno, R., Pradoux, C., Sivry, Y., and Sonke, J. E.: A Compilation of Silicon, Rare Earth Element and Twenty-One other Trace Element Concentrations in the Natural River Water Reference Material SLRS-5 (NRC-CNRC), Geostand. Geoanal. Res., 37, 449–467, https://doi.org/10.1111/j.1751-908X.2013.00232.x, 2013.
Zheng, X.-Y., Plancherel, Y., Saito, M. A., Scott, P. M., and Henderson, G. M.: Rare earth elements (REEs) in the tropical South Atlantic and quantitative deconvolution of their non-conservative behavior, Geochim. Cosmochim. Ac., 177, 217–237, https://doi.org/10.1016/j.gca.2016.01.018, 2016.
Zunino, P., Lherminier, P., Mercier, H., Daniault, N., García-Ibáñez, M. I., and Pérez, F. F.: The GEOVIDE cruise in May–June 2014 reveals an intense Meridional Overturning Circulation over a cold and fresh subpolar North Atlantic, Biogeosciences, 14, 5323–5342, https://doi.org/10.5194/bg-14-5323-2017, 2017.