the Creative Commons Attribution 4.0 License.
the Creative Commons Attribution 4.0 License.
 | 27 Nov 2020
Hysteretic temperature sensitivity of wetland CH4 fluxes explained by substrate availability and microbial activity
William J. Riley
Patrick M. Crill
Robert F. Grant
Scott R. Saleska
Methane (CH4) emissions from wetlands are likely increasing and important in global climate change assessments. However, contemporary terrestrial biogeochemical model predictions of CH4 emissions are very uncertain, at least in part due to prescribed temperature sensitivity of CH4 production and emission. While statistically consistent apparent CH4 emission temperature dependencies have been inferred from meta-analyses across microbial to ecosystem scales, year-round ecosystem-scale observations have contradicted that finding. Here, we show that apparent CH4 emission temperature dependencies inferred from year-round chamber measurements exhibit substantial intra-seasonal variability, suggesting that using static temperature relations to predict CH4 emissions is mechanistically flawed. Our model results indicate that such intra-seasonal variability is driven by substrate-mediated microbial and abiotic interactions: seasonal cycles in substrate availability favors CH4 production later in the season, leading to hysteretic temperature sensitivity of CH4 production and emission. Our findings demonstrate the uncertainty of inferring CH4 emission or production rates from temperature alone and highlight the need to represent microbial and abiotic interactions in wetland biogeochemical models.
- Article
(7257 KB) - Full-text XML
-
Supplement
(2823 KB) - BibTeX
- EndNote


Methane (CH4) is the second most important climate forcing gas with at least a 28-fold higher global warming potential (GWP) than carbon dioxide (CO2) over a 100-year horizon (Myhre et al., 2013). Atmospheric CH4 concentrations have more than doubled since 1750 (Saunois et al., 2016) and have contributed about 20 % of the additional radiative forcing accumulated in the lower atmosphere (Ciais et al., 2013). Recent assessments have found that CH4 emissions from wetland and other inland waters are the largest and most uncertain sources affecting the global CH4 budget (Kirschke et al., 2013; Poulter et al., 2017; Saunois et al., 2016). Such CH4 emissions account for 25 % to 32 % of current global total CH4 emissions (Saunois et al., 2016) and contribute substantially to the renewed and sustained atmospheric CH4 growth after 2006 (Saunois et al., 2017). Increasing CH4 emissions could offset mitigation efforts and accelerate climate change (Bastviken et al., 2011; Kirschke et al., 2013) due to their strong influence on the global radiative energy budget (Neubauer and Megonigal, 2015). However, CH4 emission estimates are poorly constrained due to insufficient quality-controlled measurements (Bastviken et al., 2011; Kirschke et al., 2013; Saunois et al., 2016) and uncertain model structures and parameterizations (Melton et al., 2013; Wania et al., 2013; Xu et al., 2016). In fact, simulations in the ongoing Coupled Model Intercomparison Project Phase 6 (CMIP6; Eyring et al., 2016) do not even request wetland CH4 emission predictions for the historical or 21st century periods. A number of knowledge gaps (Xu et al., 2016) need to be addressed to improve CH4 model representations and thereby CH4 climate feedback predictions (Dean et al., 2018). Such efforts are imperative because, among other reasons, permafrost degradation resulting from observed global-scale permafrost warming (Biskaborn et al., 2019) can stimulate organic matter decomposition (Schuur et al., 2015) that could augment global warming with a strong contribution from CH4 (Knoblauch et al., 2018).
Many contemporary terrestrial biogeochemical models parameterize CH4 production (or even CH4 emissions) as a static temperature function of net primary production or heterotrophic respiration (Melton et al., 2013; Wania et al., 2013; Xu et al., 2016). Such parameterization is supported by recent meta-analyses that indicate a static and consistent apparent CH4 production and emission temperature dependence across microbial to ecosystem scales (Yvon-Durocher et al., 2014). However, measurements collected across sites with similar wetland climate, hydrology, and plant community compositions suggest large spatial and temporal variability in the ratio between ecosystem productivity and CH4 emissions (Hemes et al., 2018). Further, ecosystem-scale CH4 emissions have hysteretic responses to seasonal changes in gross primary productivity (GPP), water table depth (WTD), and temperature (Brown et al., 2014; Goodrich et al., 2015; Rinne et al., 2018; Zona et al., 2016), suggesting that CH4 biogeochemistry may not be accurately represented by static relationships. Consequently, a mechanistic understanding of factors modulating CH4 production and emission rates is urgently needed to improve the currently uncertain CH4 biogeochemistry parameterization.
Although observations of changes in CH4 production, oxidation, and emission rates; spatial heterogeneity; and seasonal dynamics following permafrost degradation have been discussed (Hodgkins et al., 2014; McCalley et al., 2014; Olefeldt et al., 2013; Perryman et al., 2020), an understanding of mechanisms regulating intra-seasonally varying CH4 emissions and their response to temperature is still lacking. We therefore investigated the impacts of soil thermal and hydrological history on CH4 emissions to improve understanding of apparent CH4 emission temperature dependence and inform CH4 model structure and parameterization. We hypothesized that a static apparent CH4 emission temperature dependence is not sufficient for modeling CH4 emissions due to substrate-mediated hysteretic microbial and abiotic interactions (Tang and Riley, 2014) over seasonal timescales. We used a comprehensive biogeochemistry model (ecosys) to investigate observed intra-seasonal changes in apparent CH4 emission temperature dependence at two high-latitude sites: Stordalen Mire (68.2∘ N, 19.0∘ E) and Utqiaġvik (formerly Barrow; 71.3∘ N, 156.5∘ W). We focus most of the detailed analysis at Stordalen Mire, where we recently validated the modeled CH4 production pathways using acetoclastic and hydrogenotrophic methanogen relative abundance inferred from 16S rRNA gene amplicon sequencing data (Chang et al., 2019b). We also evaluated the uncertainty of ignoring substrate-mediated hysteretic microbial and abiotic interactions.
2.1 Study site description
The Stordalen Mire sites are about 10 km east of the Abisko Scientific Research Station in the discontinuous permafrost zone of northern Sweden and include intact permafrost palsa, partly thawed bog, and fen (Hodgkins et al., 2014). The mean annual air temperatures and precipitation rates at the Stordalen Mire are around 0.6 ∘C and 336 mm yr−1, respectively. The measured CH4 emissions are near zero in the palsa due to its deeper WTD and shallower active layer depth (ALD) (Bäckstrand et al., 2008a, b, 2010); we therefore did not include this site in our analysis. The bog is ombrotrophic (pH ∼ 4.2) with WTD fluctuating from the peat surface to 35 cm below the peat surface (Bäckstrand et al., 2008a, b; Olefeldt and Roulet, 2012) and is dominated by Sphagnum spp. mosses with a moderate abundance of short sedges such as Eriophorum vaginatum and Carex bigelowii (Bäckstrand et al., 2008a, b; Malmer et al., 2005; Olefeldt and Roulet, 2012). The fen is minerotrophic (pH ∼ 5.7), has WTD near or above the peat surface throughout the growing season, and is dominated by tall sedges such as E. angustifolium, C. rostrata, and Esquisetum spp. (Bäckstrand et al., 2008a, b; Olefeldt and Roulet, 2012). The Stordalen Mire bog and fen both have a peat layer ranging from 0.5 to 1 m (Rydén and Kostov, 1980) and an ALD greater than 0.9 m (Bäckstrand et al., 2008b).
The Utqiaġvik site is located at the Barrow Experimental Observatory at the northern tip of Alaska's Arctic coastal plain and is characterized by polygonal landforms caused by seasonal freezing and thawing of tundra soil (Hinkel et al., 2005). These polygonal landforms were categorized into separate features based on moisture variation determined by surface elevations (Wainwright et al., 2015). We analyzed CH4 emissions modeled in the low-centered polygonal landform that was represented as a connected combination of trough, rim, and center structures (Grant et al., 2017b). The mean annual air temperature and precipitation at Utqiaġvik are around −12 ∘C and 106 mm yr−1, respectively. The ALD varies spatially from approximately 20 to 60 cm, which is influenced by soil texture, vegetation, soil moisture, and interannual variability (Shiklomanov et al., 2010).
2.2 Field measurements
A system of six automated gas-sampling chambers made of transparent Lexan was installed at the Stordalen Mire in 2001 (three in the bog and three in the fen). Each chamber covered an area of 0.14 m2 (38 cm × 38 cm) with a height of 25–45 cm, depending on the vegetation and the depth of insertion, and was closed for 5 min every 3 h. In addition, each chamber is instrumented with thermocouples measuring air and ground surface temperatures, and WTD is measured manually 3 to 5 times per week from June to October each year (McCalley et al., 2014). The system was updated with a new chamber design similar to that described in Bubier et al. (2003) in 2011. The new chambers each cover an area of 0.2 m2 (45 cm × 45 cm), with a height ranging from 15 to 75 cm depending on habitat vegetation.
2.3 Apparent temperature dependence calculation
We quantify the apparent temperature dependencies of daily CH4 emission and CH4 production by fitting Boltzmann–Arrhenius functions of the following form:
where Fi(T) is the rate of CH4 emission (i=1) and CH4 production (i=2) at absolute temperature T; (in electronvolt, eV) and correspond to the fitted apparent activation energy (slope) and base reaction rate (intercept), respectively. k is the Boltzmann constant ( eV K−1).
We defined earlier and later periods as the times before and after the highest daily temperature analyzed in a given thawed season, respectively, to quantify intra-seasonal changes in apparent CH4 emission or production temperature dependencies. Thawed seasons were defined as the time period when measured or modeled temperatures are at least 1 ∘C to avoid low CH4 emissions in the 0–1 ∘C temperature window that can alter the base reaction rate of our Boltzmann–Arrhenius functions. Four types of temperature were used in our analysis: (1) measured soil surface temperature (e.g., Fig. 1), (2) modeled vertical mean 0–20 cm soil temperature (e.g., Fig. 2), (3) measured air temperature (e.g., Fig. S1 in the Supplement), and (4) modeled air temperature (e.g., Fig. S2). The vertical mean 0–20 cm soil temperature was chosen for our analysis because CH4 production at our study site is concentrated in the top 20 cm of soil (Chang et al., 2019b). Consistent hysteretic temperature responses were derived with above-zero vertical mean 0–20 cm soil temperatures (i.e., include the modeled 0–1 ∘C temperature window), e.g., Fig. 2 vs. Fig. S3.
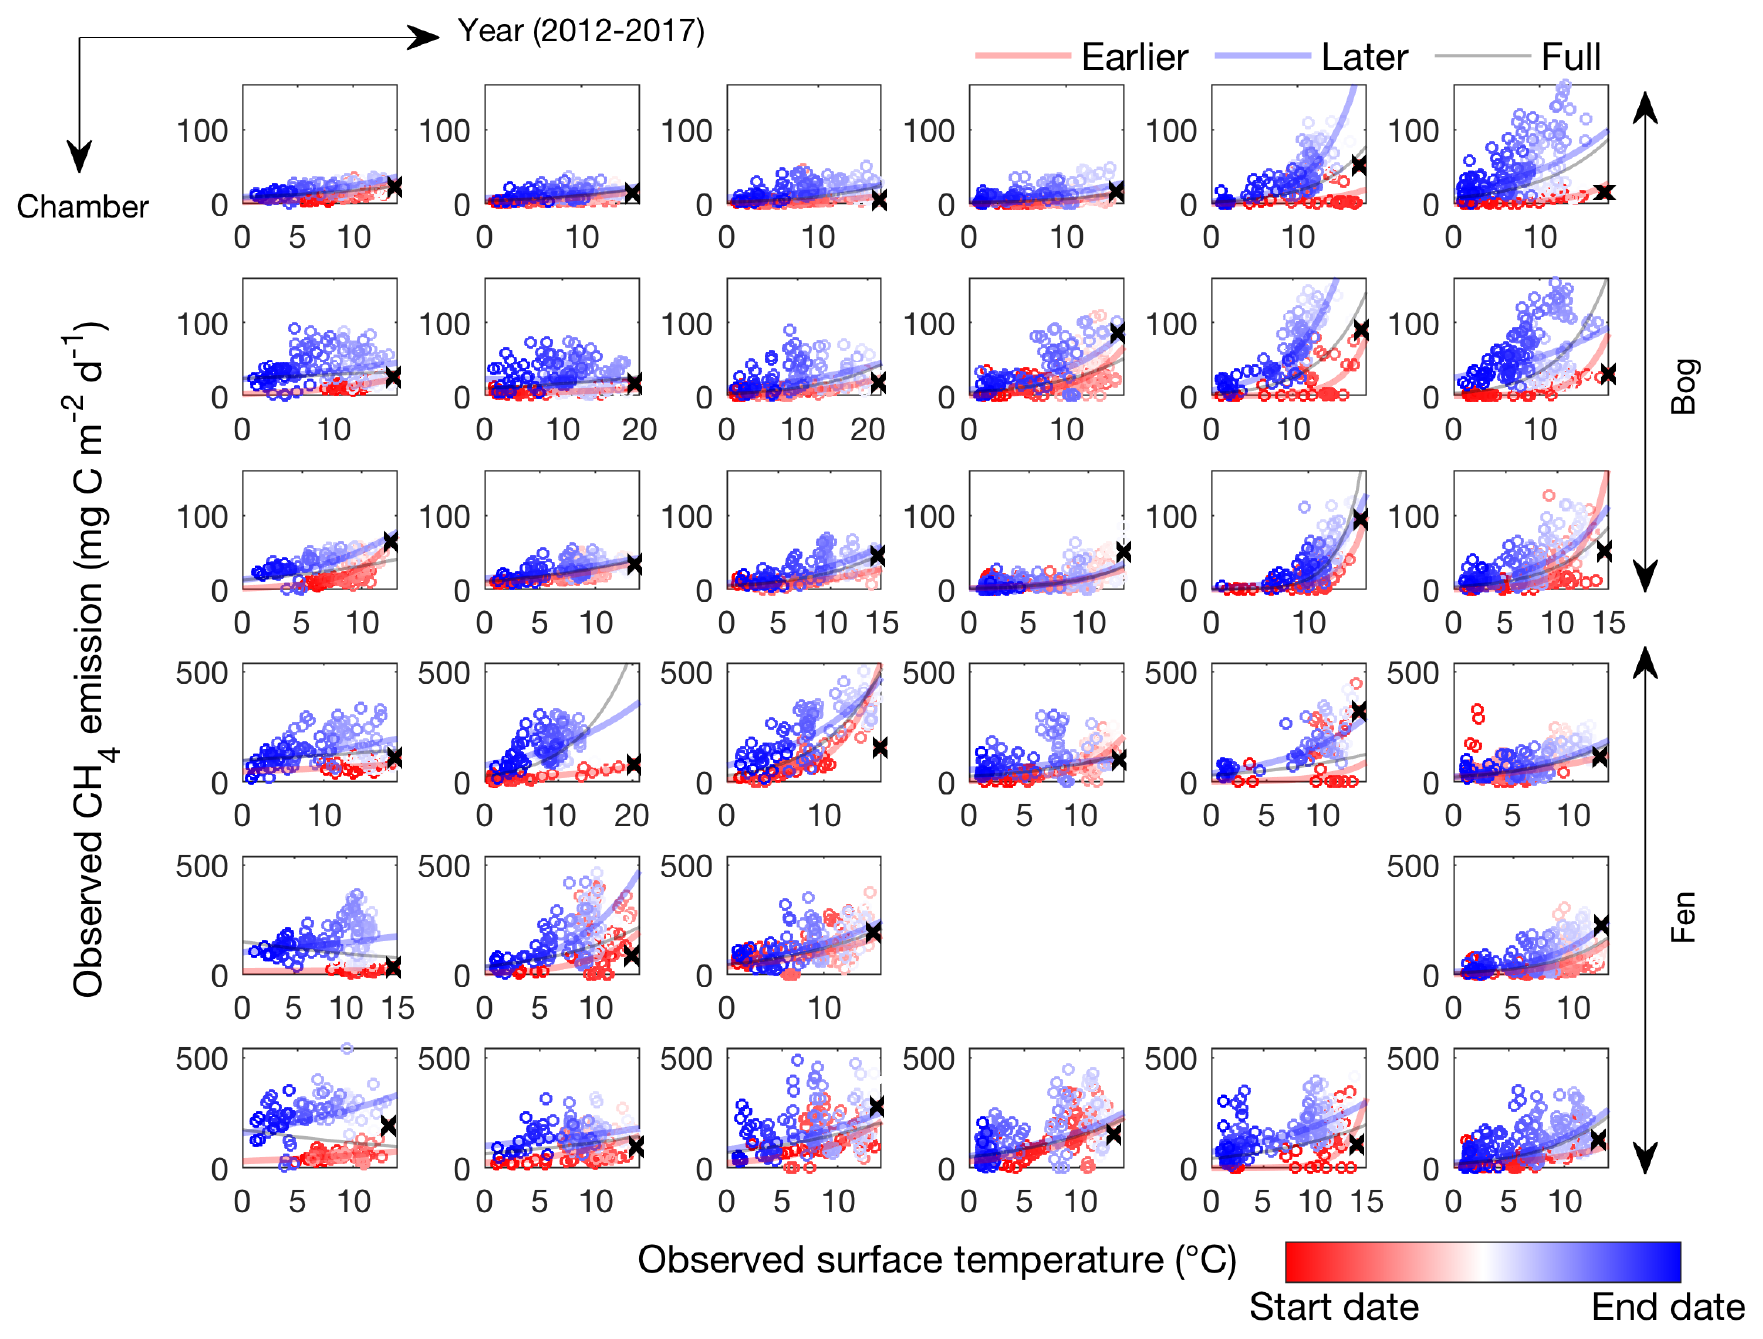
Figure 1CH4 emissions are hysteretic to soil surface temperature measured in individual automated chambers at the Stordalen Mire bog (top three panels) and fen (bottom three panels) sites from 2012 to 2017 thawed seasons (left to right). Open circles and lines represent the daily data points and the fitted apparent CH4 emission temperature dependence, respectively. The earlier, later, and full-season periods are colored in red, blue, and black, respectively. Earlier and later periods are defined as the time before and after the seasonal maximum soil surface temperature denoted by black cross signs. Start date and end dates represent the beginning and ending of a thawed season defined as the period when measured daily soil surface temperature is above 1 ∘C, respectively.

Figure 2CH4 emissions are hysteretic to soil temperature modeled in the Stordalen Mire bog (a–c) and fen (d–f) and the Utqiaġvik low-centered polygon (g–i) from 2011 to 2013 thawed seasons. Dots and lines represent the daily data points and the fitted apparent temperature dependence, respectively. Earlier, later, and full-season period lines are colored in red, blue, and black, respectively. Earlier and later periods are defined as the time before and after the seasonal maximum 0–20 cm soil temperature, denoted by black cross signs. Start date and end dates represent the beginning and ending of a thawed season defined as the period when modeled daily 0–20 cm soil temperature is above 1 ∘C, respectively.
2.4 Model description
The ecosys model is a comprehensive biogeochemistry model that explicitly represents interactions among biogeophysical (i.e., hydrological and thermal), biogeochemical (including carbon, nitrogen, and phosphorus), plant, and microbial processes. The aboveground processes are represented in multi-specific multilayer plant canopies, and the belowground processes are represented in multiple soil layers with multiphase subsurface reactive transport. CH4 production (i.e., acetoclastic and hydrogenotrophic methanogenesis), CH4 oxidation, and CH4 transport (i.e., diffusion, aerenchyma, and ebullition) are explicitly represented in ecosys. The ecosys model operates at variable time steps (seconds to 1 h) determined by convergence criteria, and it can be applied at patch scale (spatially homogenous one-dimensional scale; e.g., Chang et al., 2019a) and landscape scale (spatially variable two- or three-dimensional scale; e.g., Grant et al., 2017a, b). The ecosys model has been extensively examined against field measurements made in 2002–2007 (Chang et al., 2019a) and 2011–2013 (Chang et al., 2019b) at our study sites at the Stordalen Mire and in 2013 at our study sites at Utqiaġvik (Grant et al., 2017a, b, 2019). A qualitative summary of the ecosys model is provided in the Supplement to this article, and detailed descriptions are available in the supplements of Grant et al. (2017a, b). The ecosys model structure remains unchanged from that in earlier studies.
2.5 Experimental design
The primary purpose of this study is to explore the implications of the observed CH4 emission hysteresis (Fig. 1) and highlight the need to recognize factors other than temperature that control ecosystem-scale CH4 emissions. We develop a mechanistic explanation for such hysteresis by investigating how the modeled environmental drivers modulate CH4 emission hysteresis. The modeled data used in this study are extracted from our earlier simulations that can be downloaded from the IsoGenie database (https://isogenie-db.asc.ohio-state.edu/, last access: 19 November 2020; Chang et al., 2019a, b) and the NGEE-Arctic database (https://ngee-arctic.ornl.gov/, last access: 19 November 2020; Chang and Riley, 2020; Grant et al., 2017a, b). Our analysis focuses on modeled data because some factors (e.g., root exudates, substrate availability, and methanogenic population and activity) modulating CH4 production, oxidation, and emission rates are not continuously measured at our study sites. Our recently published model results at the Stordalen Mire and Utqiaġvik sites indicate good comparisons with observations, including for thaw depth (R2=0.75 to 0.90), WTD (mean bias = −4.3 to 4.0 cm), and CO2 (R2=0.43 to 0.88) and CH4 (R2=0.31 to 0.93) surface fluxes (Chang et al., 2019a, 2019b; Grant et al., 2017a, b, 2019). In particular, the CH4 production pathway modeled at our Stordalen Mire sites has been validated by the relative abundances of acetoclastic and hydrogenotrophic methanogenic lineages reported in McCalley et al. (2014), suggesting that substrate and microbial dynamics are reasonably represented. For conciseness, we focus the discussion in the remainder of the paper on the Stordalen Mire fen site, since it exhibits strong apparent hysteresis, and the underlying mechanisms leading to hysteretic CH4 emissions are similar across all study sites.
We note the relevant point that the ecosys model itself represents temperature dependence of soil metabolic activity and gas production through locally simulated soil temperature profiles with a modified Arrhenius function that includes terms for low- and high-temperature inactivation (Grant, 2015). Besides temperature effects, the ecosys model also represents substrate controls (through Michaelis–Menten kinetics) on microbial biomass and activity (e.g., Chang et al., 2019b), which is not explicitly characterized by inferring an apparent whole system temperature dependence (e.g., Eq. 1). These representations allow the model to simulate overall CH4 emission patterns with more complex dynamics than represented in the apparent temperature dependence function alone, making it a suitable tool for investigating the relative importance of temperature dependence versus other factors.
3.1 Observed patterns of apparent CH4 emission hysteresis
The CH4 emissions measured in the Stordalen Mire bog and fen exhibit hysteretic responses to soil surface temperature; that is, at the same soil surface temperature, greater CH4 emissions occur during the later compared to the earlier periods of the thawed season (Fig. 1). At both sites, plotting time- and chamber-specific CH4 emission and soil surface temperature measurements from the beginning to end of the thawed season result in a counterclockwise hysteresis loop at each site and year (2012 to 2017). Such hysteretic responses lead to intra-seasonally varying apparent CH4 emission temperature dependencies, suggesting that a proper representation of temporal variability is needed to recognize factors modulating CH4 emissions. For example, three distinct apparent CH4 emission temperature dependencies can be derived from the same chamber sampling at different periods within the same thawed season (i.e., earlier period, later period, and full season). Despite the high spatial heterogeneity, the observed patterns of CH4 emission hysteresis are consistent across chambers within and between the bog and fen habitats. Our results thus demonstrate that CH4 emissions are generally more sensitive to temperature changes during the later part of the thawed season and that CH4 emission strength and temperature dependence vary substantially among sites and years. Consistent hysteretic responses can be found in CH4 emission and air temperature measurements (Fig. S1), suggesting that the apparent CH4 emission hysteresis is not dependent on time lags between air and soil temperatures (Wohlfahrt and Galvagno, 2017). The observed CH4 emission hysteresis indicates that models cannot accurately represent CH4 dynamics without representing the large spatial and temporal variability in apparent CH4 emission temperature dependencies.
3.2 Modeled patterns of apparent CH4 emission hysteresis
The CH4 emissions modeled by ecosys, extracted from our recently published results at the Stordalen Mire and the Utqiaġvik sites (Chang et al., 2019b; Grant et al., 2017b), have hysteretic responses to mean 0–20 cm soil temperature (Fig. 2) and air temperature (Fig. S2). The apparent CH4 emission temperature dependence inferred from the modeled results varies substantially from the beginning to the end of the thawed season, suggesting that CH4 emissions may not be accurately represented as a single function of temperature. For each site and year, CH4 emissions modeled in the later period are greater than those in the earlier period at the same temperature (e.g., Fig. 2), consistent with observations (e.g., Fig. 1). The apparent CH4 emission hysteresis is larger and clearer in the Stordalen Mire fen compared to the bog and the Utqiaġvik low-centered polygon, likely from its warmer soil temperatures, shallower WTD, and higher CH4 emissions (Chang et al., 2019b). Consistent hysteresis patterns are found at weekly timescales (Fig. S4), suggesting that the apparent CH4 emission hysteresis is not sensitive to temporal resolution nor the timing of maximum seasonal temperature. In addition to temporal variability, changes in biogeophysical conditions driven by fine-scale hydrology and vegetation differences can also alter the apparent functional relationship between CH4 emission and temperature. For example, apparent CH4 emission temperature dependencies inferred for individual topographic features (i.e., troughs, rims, and centers) vary substantially within the same wetland ecosystem at Utqiaġvik (Fig. S5).
We evaluate the effects of intra-seasonal variability on ecosystem-scale CH4 emissions by estimating apparent CH4 emission temperature dependencies during different parts of the thawed season. By fitting the Boltzmann–Arrhenius function (Eq. 1) to the CH4 emissions and 0–20 cm soil temperatures modeled during different time frames (i.e., earlier period, later period, and full season), we developed and evaluated three temperature dependence models for each thawed season. Our results show that CH4 emission estimates improve when apparent CH4 emission temperature dependencies were separately represented in the earlier and later periods compared to those assuming a seasonally invariant apparent CH4 emission temperature dependence (Tables S1, S2 in the Supplement). In the Stordalen Mire, neglecting intra-seasonal variability in apparent CH4 emission temperature dependence leads to overestimated (10 % to 81 %) and underestimated (−21 % to −40 %) CH4 emissions during the earlier and later periods, respectively (Table S1). Consistent prediction biases were found in the Utqiaġvik low-centered polygon, except in the rims where drier conditions limit CH4 emissions (Table S2).
These results demonstrate that models based on a seasonally invariant apparent CH4 emission temperature dependence may introduce errors by improperly prescribing the seasonal dynamics of CH4 biogeochemistry with a static function of temperature. The substantial intra-seasonal variability, potentially led by site-specific thermal and hydrological history (Updegraff et al., 1998), could be an important and overlooked property of natural wetlands that currently account for 25 % to 32 % of global total CH4 emissions (Saunois et al., 2016). Representing intra-seasonally variable apparent CH4 emission or production temperature dependencies in large-scale wetland biogeochemical models may thus reduce CH4 emission prediction biases and model structural uncertainty.
3.3 Microbial substrate-mediated CH4 production hysteresis
For conciseness, we focus our discussion on the potential drivers causing the hysteretic relationship between CH4 emission and soil temperature modeled at the Stordalen Mire fen at 2011, as the underlying mechanisms are consistent across all sites and years. The temporal evolution of CH4 emissions modeled by ecosys follows that of CH4 production, with limited offsets from CH4 oxidation (Fig. 3a). Modeled CH4 emission (e.g., Fig. 2d) and production (Fig. 3b) rates both exhibit intra-seasonal variations in their apparent temperature dependencies during the thawed season, consistent with the varying temperature responses to microbial thermal history reported in laboratory incubations (Updegraff et al., 1998). The relatively low CH4 oxidation suggests that hysteretic responses of modeled CH4 emissions to temperature (Fig. 2) primarily result from hysteretic CH4 production (Fig. 3b) associated with asymmetric methanogen biomass (Fig. 3c) and activity (Fig. 3d) between the earlier and later periods. Further, the consistent seasonal cycles in CH4 production, oxidation, and emission rates modeled from 2011 to 2013 (Fig. S6) indicate that the CH4 emission hysteresis modeled in that period (Fig. 2d, e, f) is not caused by relatively low CH4 oxidation modeled in a particular site and year. This result is consistent with isotopic measurements which also indicated that changes in CH4 production, not CH4 oxidation, determine the CH4 emissions observed in the Stordalen Mire sites (McCalley et al., 2014).
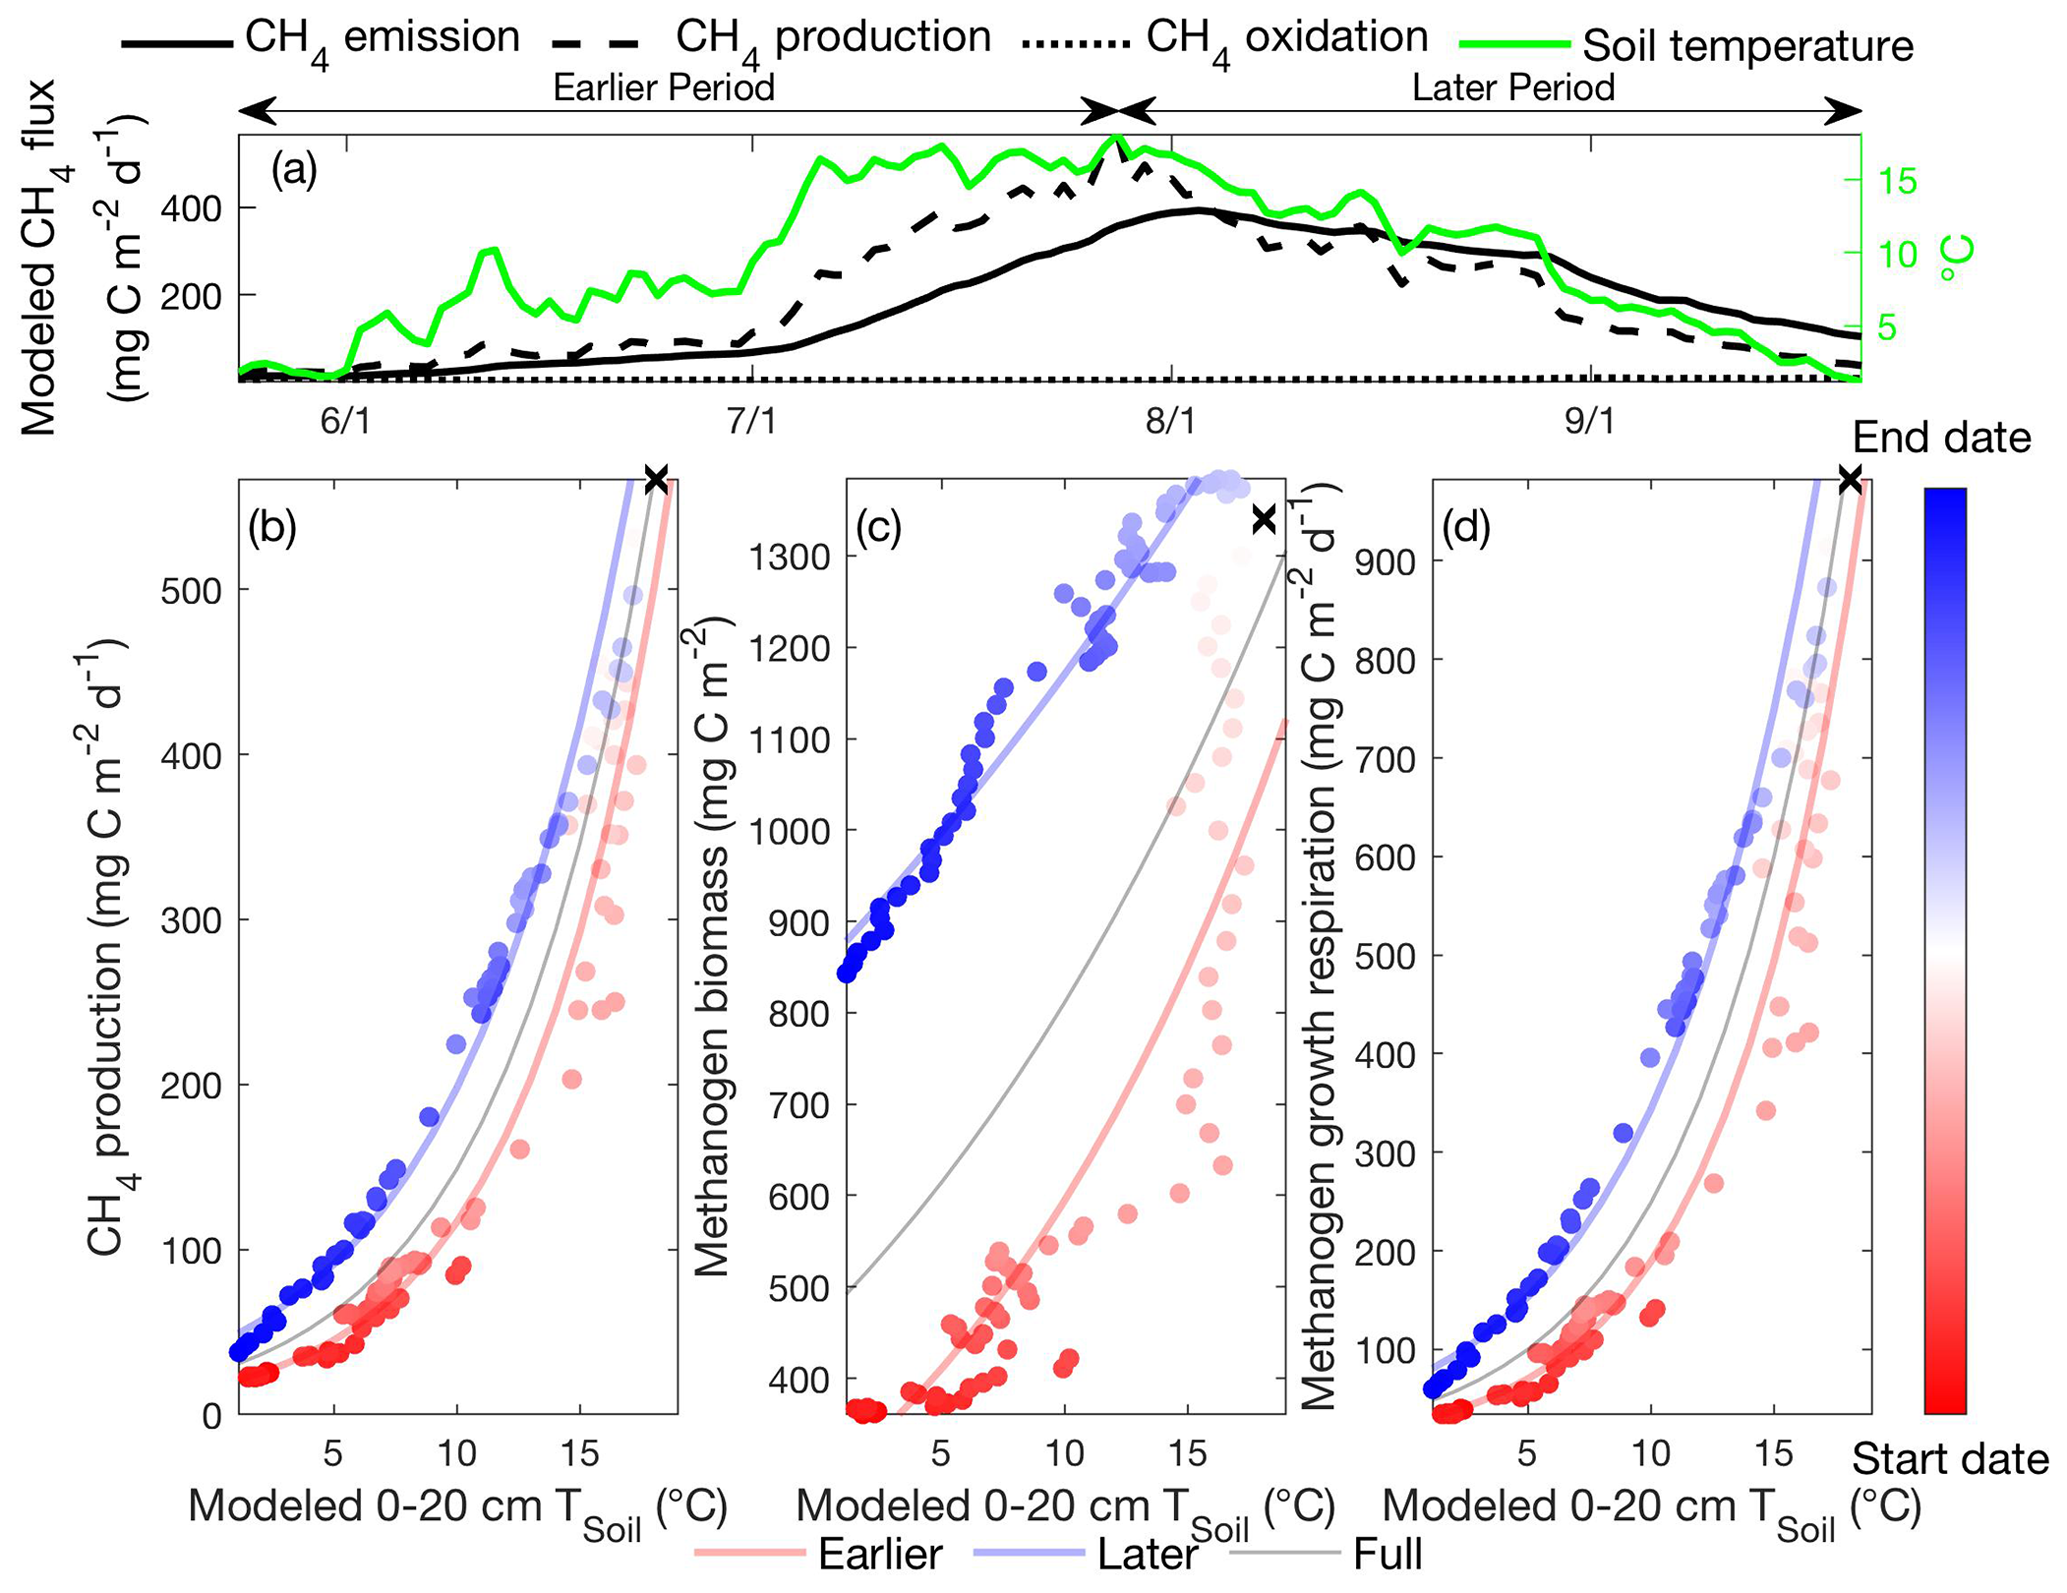
Figure 3Intra-seasonal variations in apparent CH4 production temperature dependence result from asymmetric microbial biomass and activity modeled between the earlier and later periods. Daily CH4 emissions, CH4 production, CH4 oxidation, and 0–20 cm soil temperature modeled in the Stordalen Mire fen during the 2011 thawed season (a). The corresponding apparent temperature dependence of the modeled CH4 production (b), methanogen biomass (c), and methanogen growth respiration (d) during the 2011 thawed season. Earlier, later, and full-season periods are colored in red, blue, and black, respectively. Earlier and later periods are defined as the time before and after the seasonal maximum 0–20 cm soil temperature denoted by black cross signs. Start date and end dates represent the beginning and ending of a thawed season defined as the period when modeled daily 0–20 cm soil temperature is above 1 ∘C, respectively.
Although CH4 oxidation has been proposed to be an important control regulating wetland CH4 emissions, e.g., Perryman et al. (2020) and Singleton et al. (2018), the competitive dynamics between methanogens and methanotrophs throughout the year has not been included in such studies. The modeled CH4 oxidation rate is relatively low during the thawed season when CH4 production is strongest, and relatively high during the shoulder season when CH4 production is weakest (Fig. S6). These strong seasonal variations suggest that the relative importance of CH4 production and oxidation on regulating CH4 emissions may fluctuate throughout the year, highlighting the need to properly represent the underlying dynamics controlling CH4 biogeochemistry.
Increased soil temperatures elevate oxygen demands for aerobic heterotrophs while reducing oxygen solubility, which favors fermenter and methanogens and thereby enhance CH4 production. Our model results indicate that the elevated methanogen biomass and activity during the later period are driven by the increased substrate availability for methanogenesis later in the thawed season. Specifically, modeled substrate concentrations remain relatively high after peak substrate production rate at maximum seasonal soil temperature for both acetoclastic methanogenesis (AM; Fig. 4a) and hydrogenotrophic methanogenesis (HM; Fig. 5a). Relatively high AM (Fig. 4b) and HM (Fig. 5b) substrate availability during the later period elevates AM and HM energy yields at a given soil temperature, resulting in higher methanogen growth (Fig. 3d) and biomass (Fig. 3c) later in the thawed season. Therefore, CH4 production rates during the later period become higher than those during the earlier period at the same soil temperature (Fig. 3b), which drives higher CH4 emissions with increased aqueous CH4 concentrations. Although AM and HM each exhibit microbial substrate-mediated hysteretic temperature responses, AM appears to be more hysteretic to soil temperature than HM (Fig. 6). The stronger AM hysteresis is consistent with the larger and clearer CH4 emission hysteresis found in the Stordalen Mire fen (Fig. 2), where the fractional contribution of AM to total CH4 production is higher than in the Stordalen Mire bog (Chang et al., 2019b; McCalley et al., 2014). A schematic summarizing the abovementioned mechanisms for microbial substrate-mediated CH4 production hysteresis is presented in Fig. 7.

Figure 4Daily acetate concentration and acetate production modeled in the Stordalen Mire fen during the 2011 thawed season (a). The corresponding apparent temperature dependence of the modeled acetate concentration (b) and acetate production (c) during the 2011 thawed season. Dots and lines represent the daily data points and the fitted apparent temperature dependence, respectively. The earlier, later, and full-season periods are colored in red, blue, and black, respectively. Earlier and later periods are defined as the time before and after the seasonal maximum 0–20 cm soil temperature denoted by black cross signs. Start date and end dates represent the beginning and ending of a thawed season defined as the period when modeled daily 0–20 cm soil temperature is above 1 ∘C, respectively.
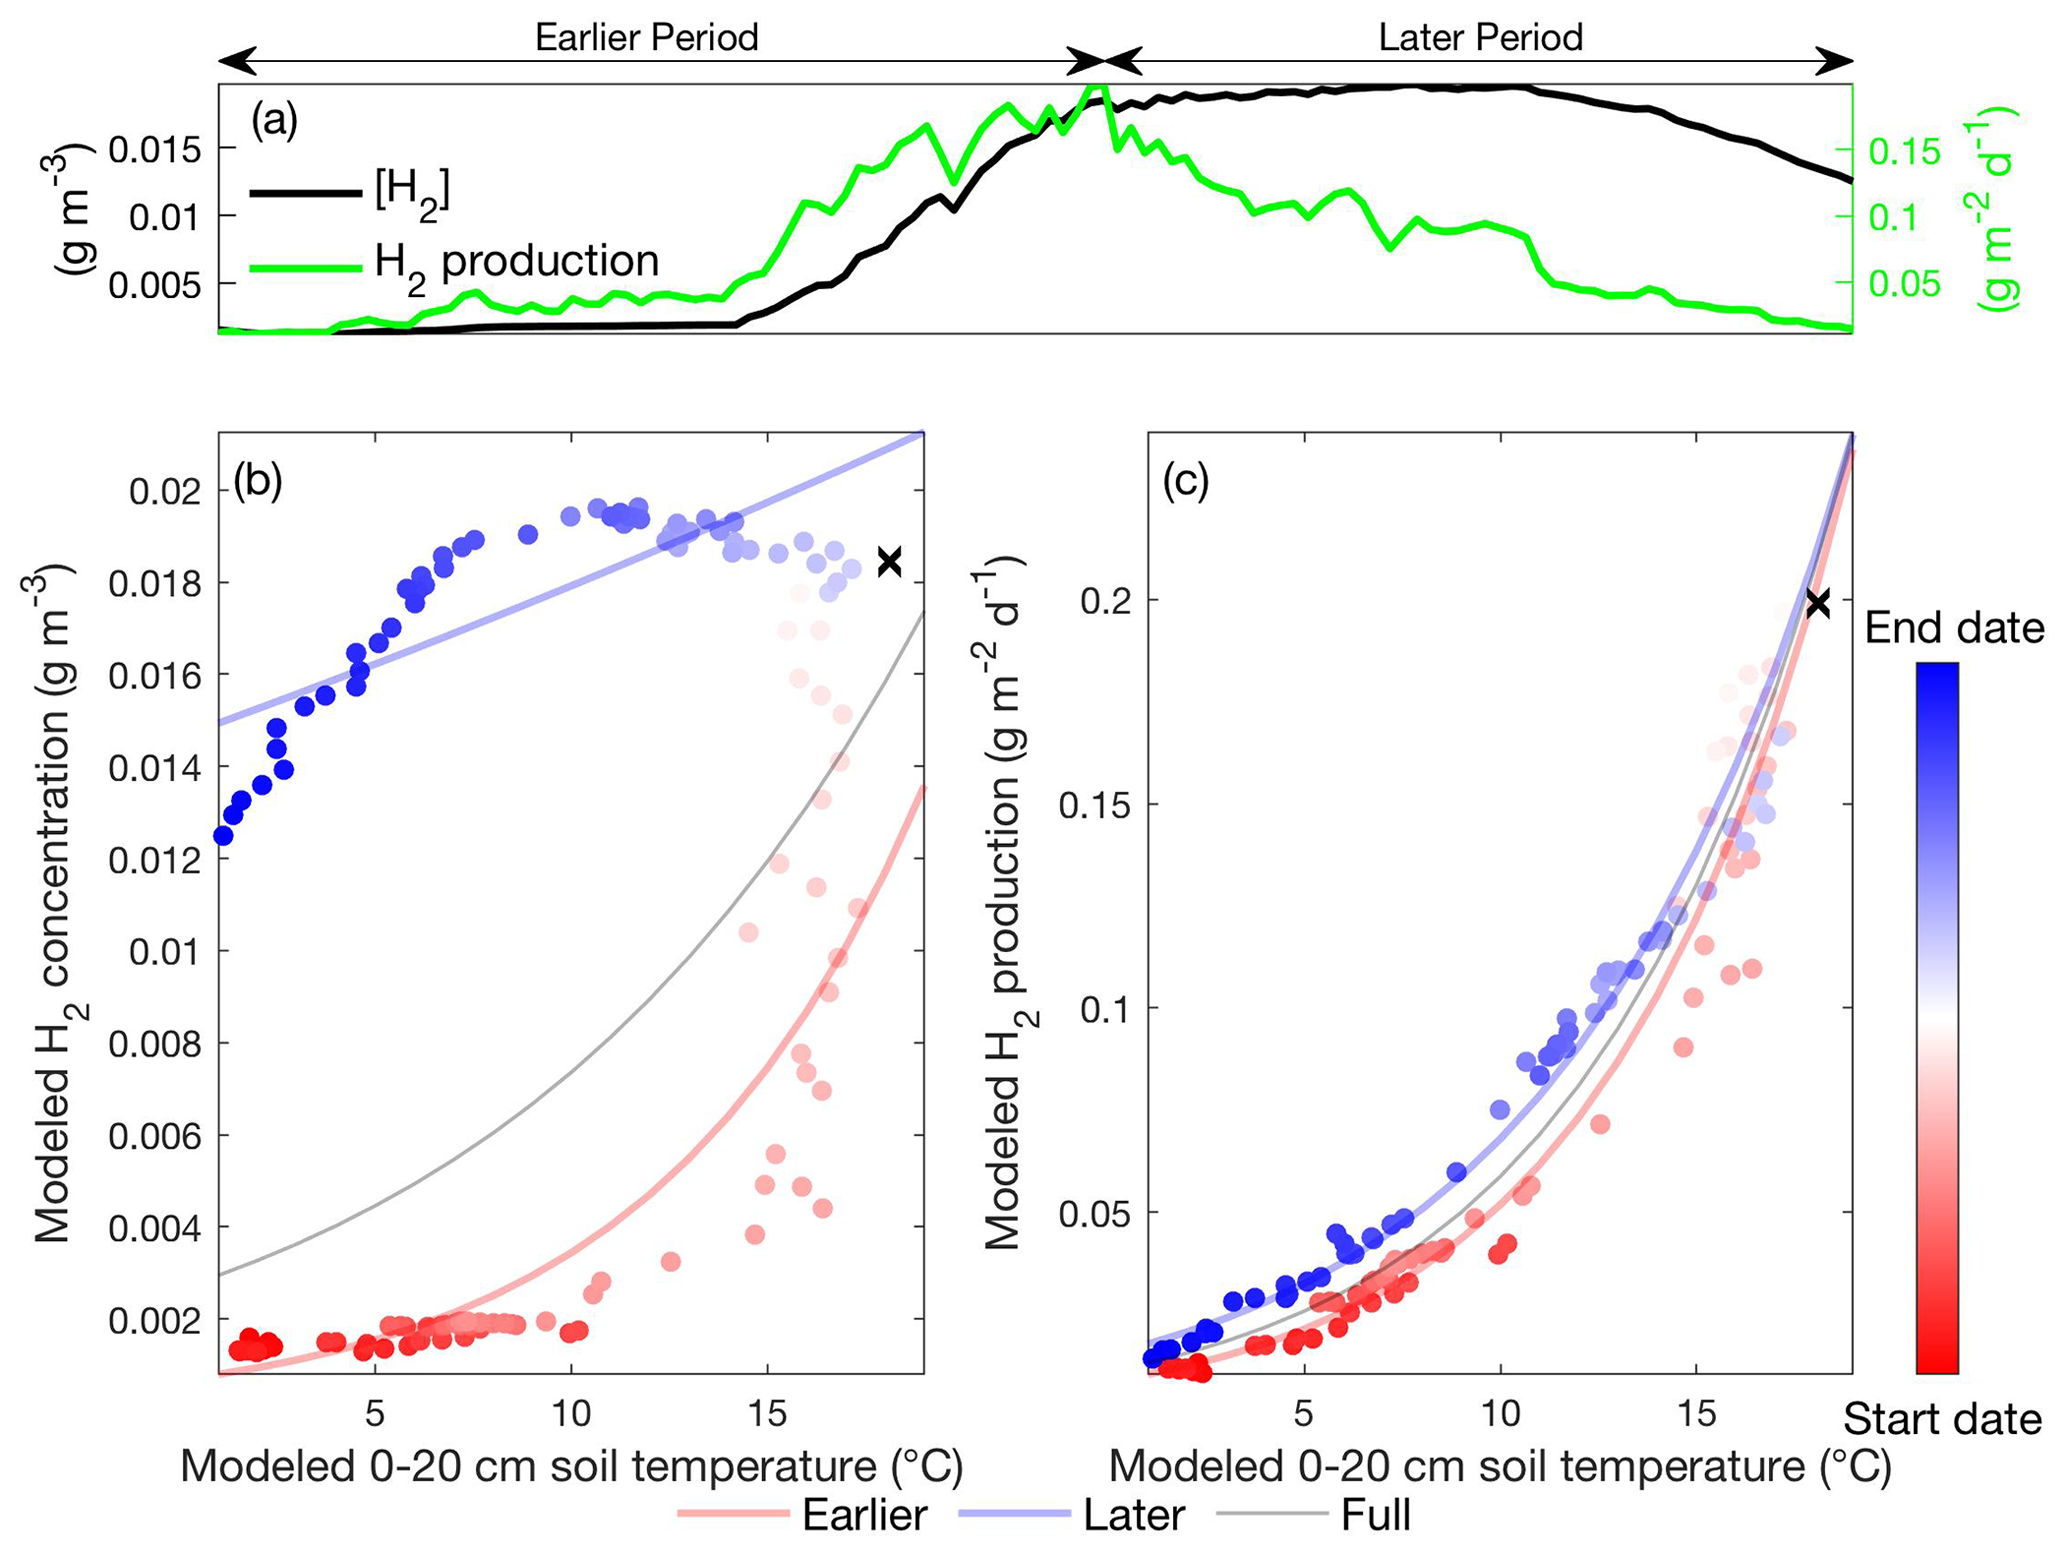
Figure 5Daily hydrogen concentration and hydrogen production modeled in the Stordalen Mire fen during the 2011 thawed season (a). The corresponding apparent temperature dependence of the modeled hydrogen concentration (b) and hydrogen production (c) during the 2011 thawed season. Dots and lines represent the daily data points and the fitted apparent temperature dependence, respectively. The earlier, later, and full-season periods are colored in red, blue, and black, respectively. Earlier and later periods are defined as the time before and after the seasonal maximum 0–20 cm soil temperature denoted by black cross signs. Start date and end dates represent the beginning and ending of a thawed season defined as the period when modeled daily 0–20 cm soil temperature is above 1 ∘C, respectively.

Figure 6Apparent temperature dependence of daily CH4 production for acetoclastic (a) and hydrogenotrophic (b) methanogenesis and daily growth respiration for acetoclastic (c) and hydrogenotrophic (d) methanogens modeled in the Stordalen Mire fen during the 2011 thawed season. Dots and lines represent the daily data points and the fitted apparent temperature dependence, respectively. The earlier, later, and full-season periods are colored in red, blue, and black, respectively. Earlier and later periods are defined as the time before and after the seasonal maximum 0–20 cm soil temperature denoted by black cross signs. Start date and end dates represent the beginning and ending of a thawed season defined as the period when modeled daily 0–20 cm soil temperature is above 1 ∘C, respectively.
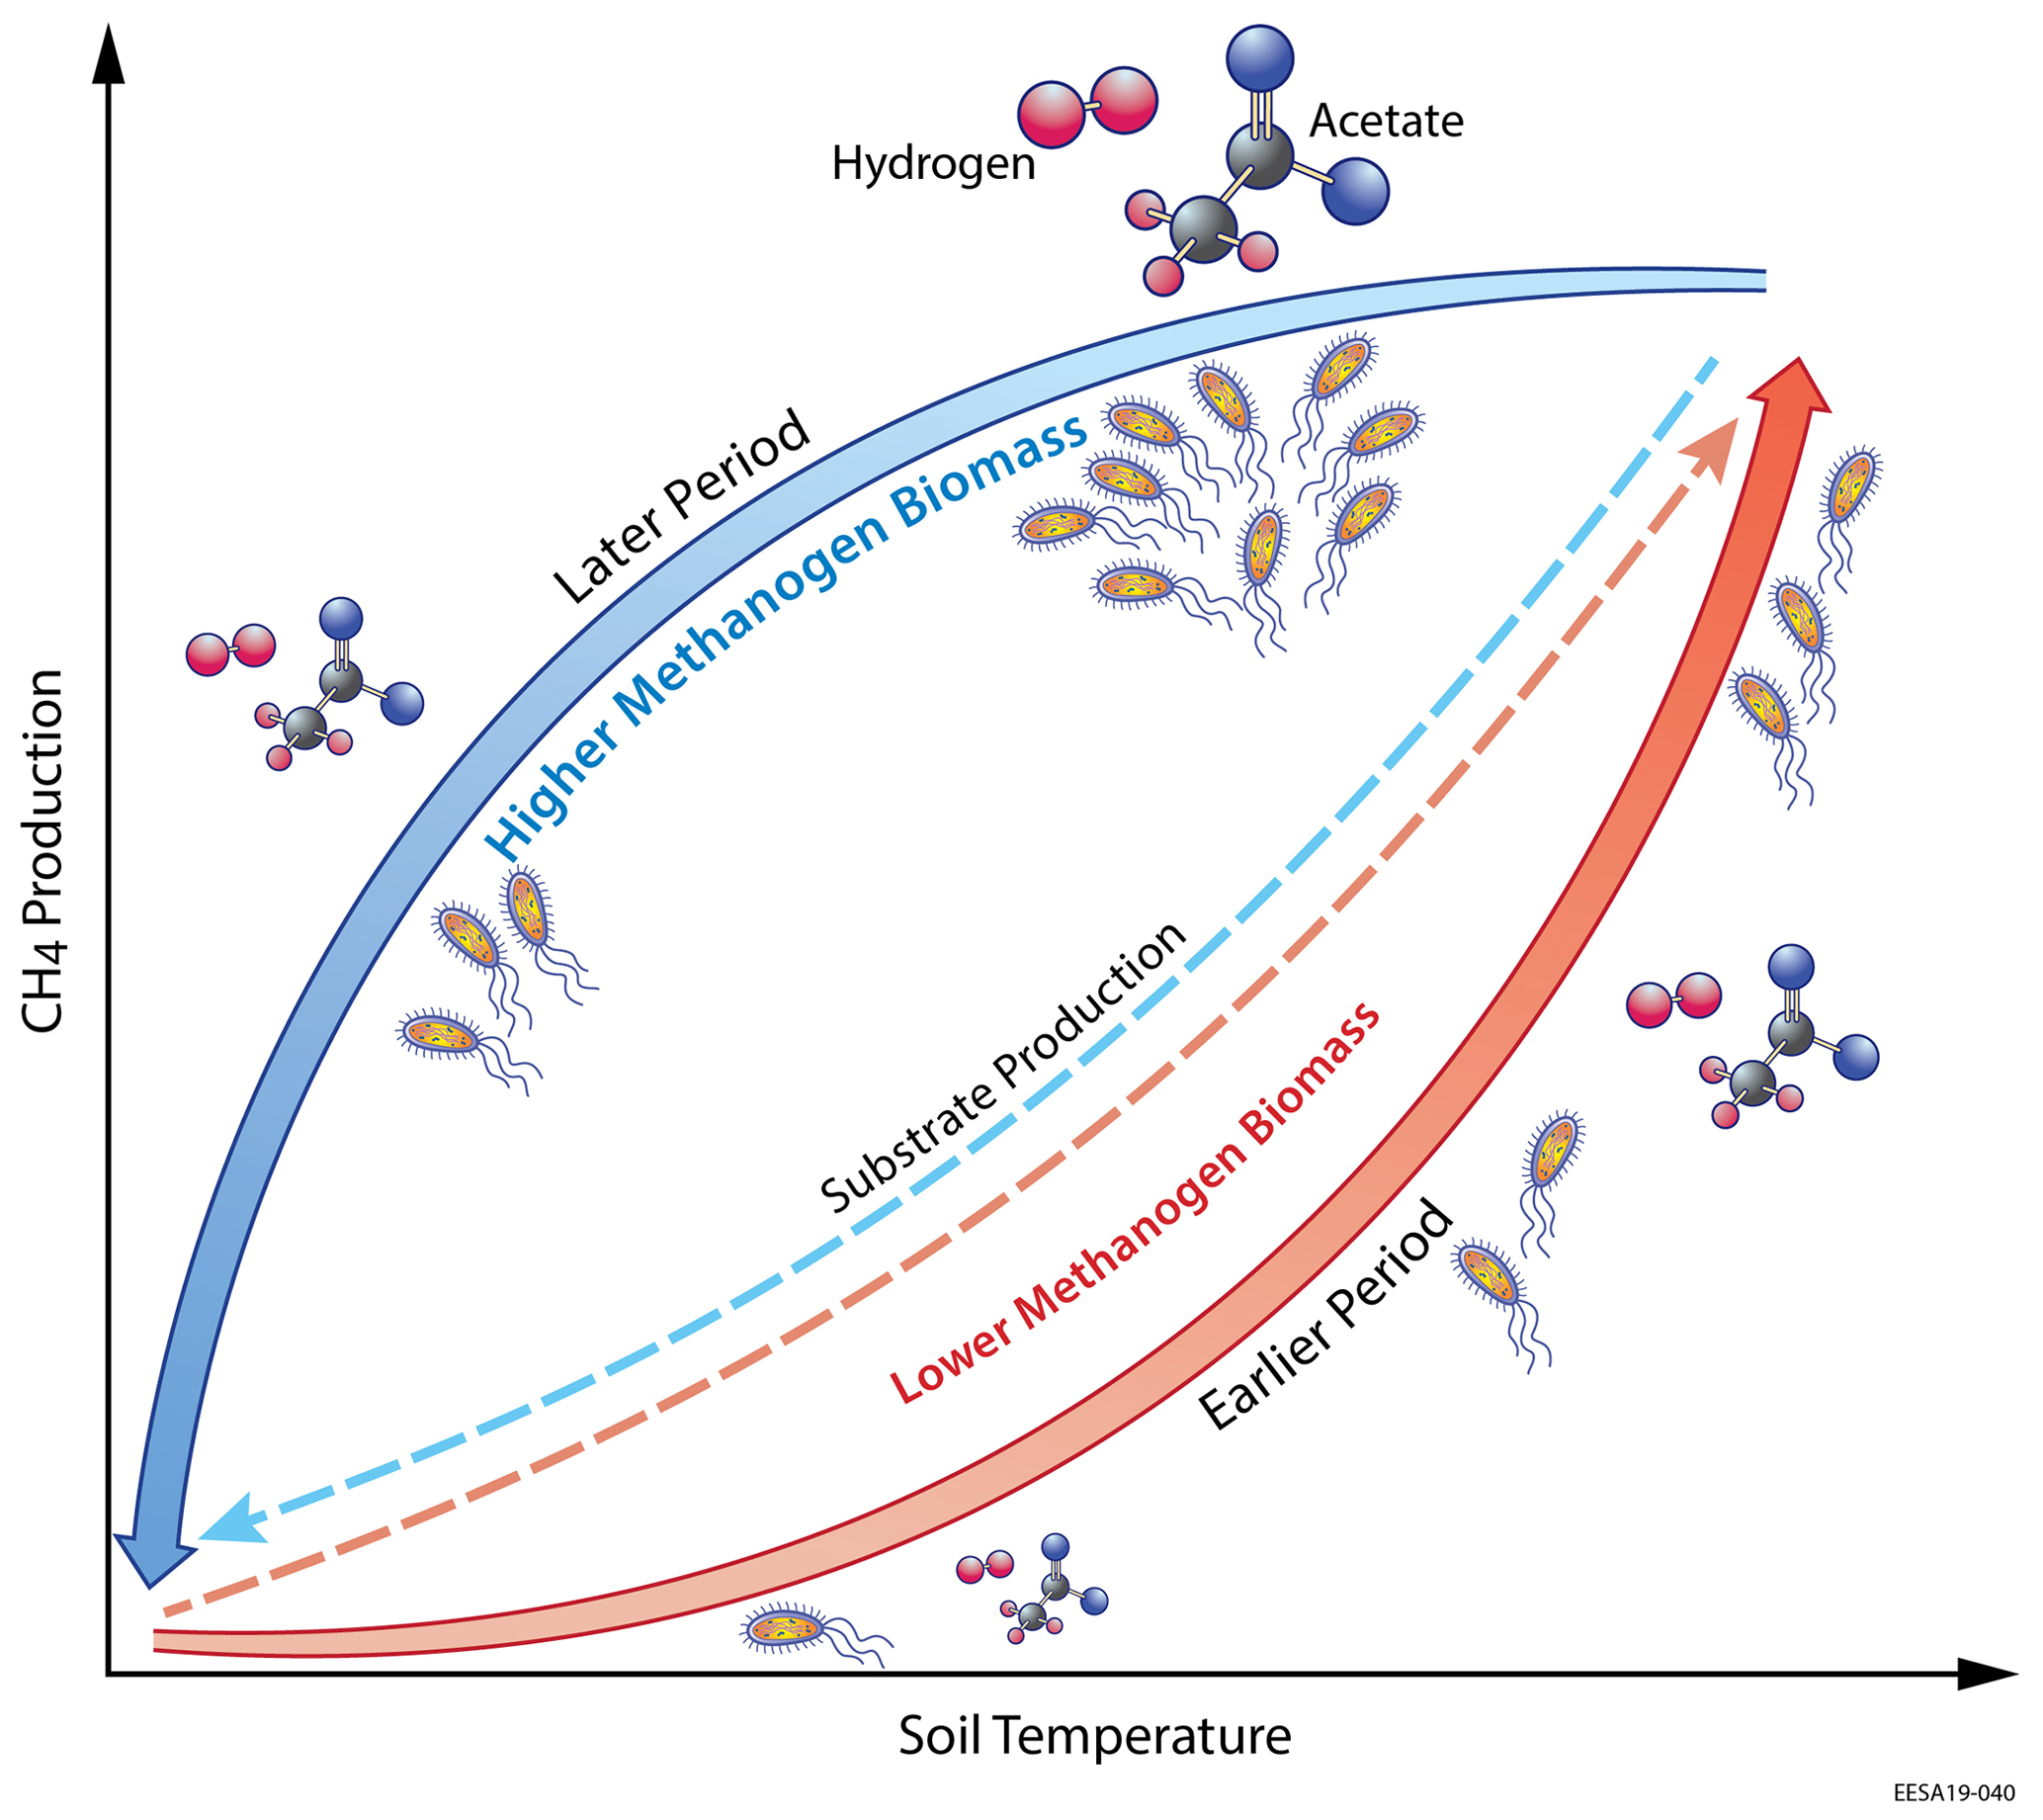
Figure 7Schematic of the microbial substrate-mediated CH4 production hysteresis proposed in this study. Higher substrate (i.e., acetate and hydrogen) availability stimulates higher methanogen biomass during the later period, which leads to intra-seasonal differences in CH4 production between the earlier and later periods.
Although the CH4 emission rates and CH4 production pathways modeled in the Stordalen Mire fen have been examined (Chang et al., 2019b), continuous substrate concentration measurements are lacking for validating the substrate-mediated hysteretic temperature responses proposed here. Wide ranges of acetate and hydrogen concentrations have been reported from incubation experiments studying methanogenesis (e.g., Hines et al., 2008; Tveit et al., 2015; Zhang et al., 2020); however, those values may not be used to validate the time- and space-specific substrate concentrations modeled at our study sites. Therefore, further studies and additional field measurements are needed to test our proposed hypothesis of the causes of observed CH4 emission hysteresis.
3.4 Other factors regulating intra-seasonal CH4 emissions
To evaluate whether microbial substrate-mediated CH4 production hysteresis is the primary cause of the observed hysteretic relationship between CH4 emission and temperature, we evaluated four alternative hypotheses: interactions with (1) water table depth, (2) GPP (via exudation, root litter inputs, and aerenchyma development), (3) thaw depth, and (4) residual pore-water CH4 concentrations at the end of the earlier part of the thawed season.
First, studies have found that seasonal variations of WTD determine CH4 cycling dynamics by regulating the temperature response of CH4 emissions, leading to hysteretic CH4 emissions when drought-induced WTD drawdown below the critical zone for CH4 production (Brown et al., 2014; Goodrich et al., 2015). The substantial CH4 emission hysteresis observed in the Stordalen Mire fen is unlikely caused by seasonal variations in WTD, because the observed WTDs are around or above the peat surface throughout the thawed season with limited effects on CH4 emissions (Bäckstrand et al., 2008b).
Second, Rinne et al. (2018) reported that the temporal variations of CH4 emissions are strongly regulated by GPP, and the time required to convert GPP to methanogenesis substrates may cause the observed apparent hysteresis found between GPP and CH4 emissions. Such apparent hysteresis was also modeled at our study sites (e.g., Fig. 8a), which shows higher CH4 emissions later in the thawed season at a given GPP. We further analyzed factors linking GPP and CH4 emissions modeled at the Stordalen Mire fen to explore whether an apparent hysteretic relationship between CH4 emissions and GPP is causally connected. We examined three primary pathways by which GPP could lead to a delayed effect on CH4 emissions and thereby apparent hysteresis: increases in (1) fresh carbon inputs from root exudation (Fig. 8b), (2) belowground litter inputs (Fig. 8c), and (3) aerenchyma transport caused by GPP-induced growth of porous sedge roots (Fig. 8d). In contrast to the apparent hysteresis with GPP, all three of these mechanisms exhibit reversed hysteresis cycles compared to those between CH4 emissions and temperature. Therefore, these three primary mechanisms are inconsistent with a causal hysteretic relationship between GPP and CH4 emissions.

Figure 8Daily CH4 emissions have hysteretic responses to gross primary productivity (a), carbon released from root exudation (b), carbon released from belowground litter decomposition (c), the amount of root biomass for sedges (d), and thaw depth (e) modeled in the Stordalen Mire fen during the 2011 thawed season. Dots and lines represent the daily data points and the fitted apparent temperature dependence, respectively. Black cross signs represent the seasonal maximum 0–20 cm soil temperature. Start date and end dates represent the beginning and ending of a thawed season defined as the period when modeled daily 0–20 cm soil temperature is above 1 ∘C, respectively.
Third, studies have suggested that soil temperature increases can expand the volume of unfrozen soil and thereby stimulate deep carbon decomposition, which can also contribute to higher carbon emissions later in the thawed season, as has been observed for upland CO2 emissions (Goulden et al., 1998) and wetland CH4 emissions (Iwata et al., 2015). Our results show a weak correlation between thaw depth and CH4 emissions during the later part of the thawed season, although CH4 emissions appear to increase with deeper thaw during the earlier period (Fig. 8e). Therefore, the hysteretic relationship between CH4 emission and soil temperature found at our study sites is not causally connected with the greater volume of unfrozen soil later in the thawed season. This result may be explained by the relatively shallow zone (mostly within the top 20 cm of soil) of CH4 production (Chang et al., 2019b) compared with the much deeper thaw depth (>90 cm) measured and modeled during the peak CH4 emission period (i.e., July to August) (Chang et al., 2019a).
Fourth, we conducted a sensitivity test to examine the amount of lagged CH4 emissions resulting from CH4 residual stored in the soil profile at the end of the earlier part of the thawed season. In the sensitivity test, we turned off CH4 production during the later part of the thawed season so the later-period CH4 emissions modeled in this run are driven by lagged releases of earlier-period CH4 production. At the Stordalen Mire fen, later-period CH4 emissions resulting from earlier-period CH4 residual concentrations decreased approximately exponentially and contributed about 25 % of the CH4 emissions during the later period (Fig. 9). The timing and magnitude of later-period CH4 emissions attributed to lagged CH4 emissions do not match with the relatively high CH4 emissions modeled during the later period. Therefore, our results suggest that lagged CH4 emissions from residual CH4 produced in the earlier period are not a dominant factor leading to the observed CH4 emission hysteresis, although lagged CH4 emissions may amplify the apparent CH4 emission hysteresis detected in the system.
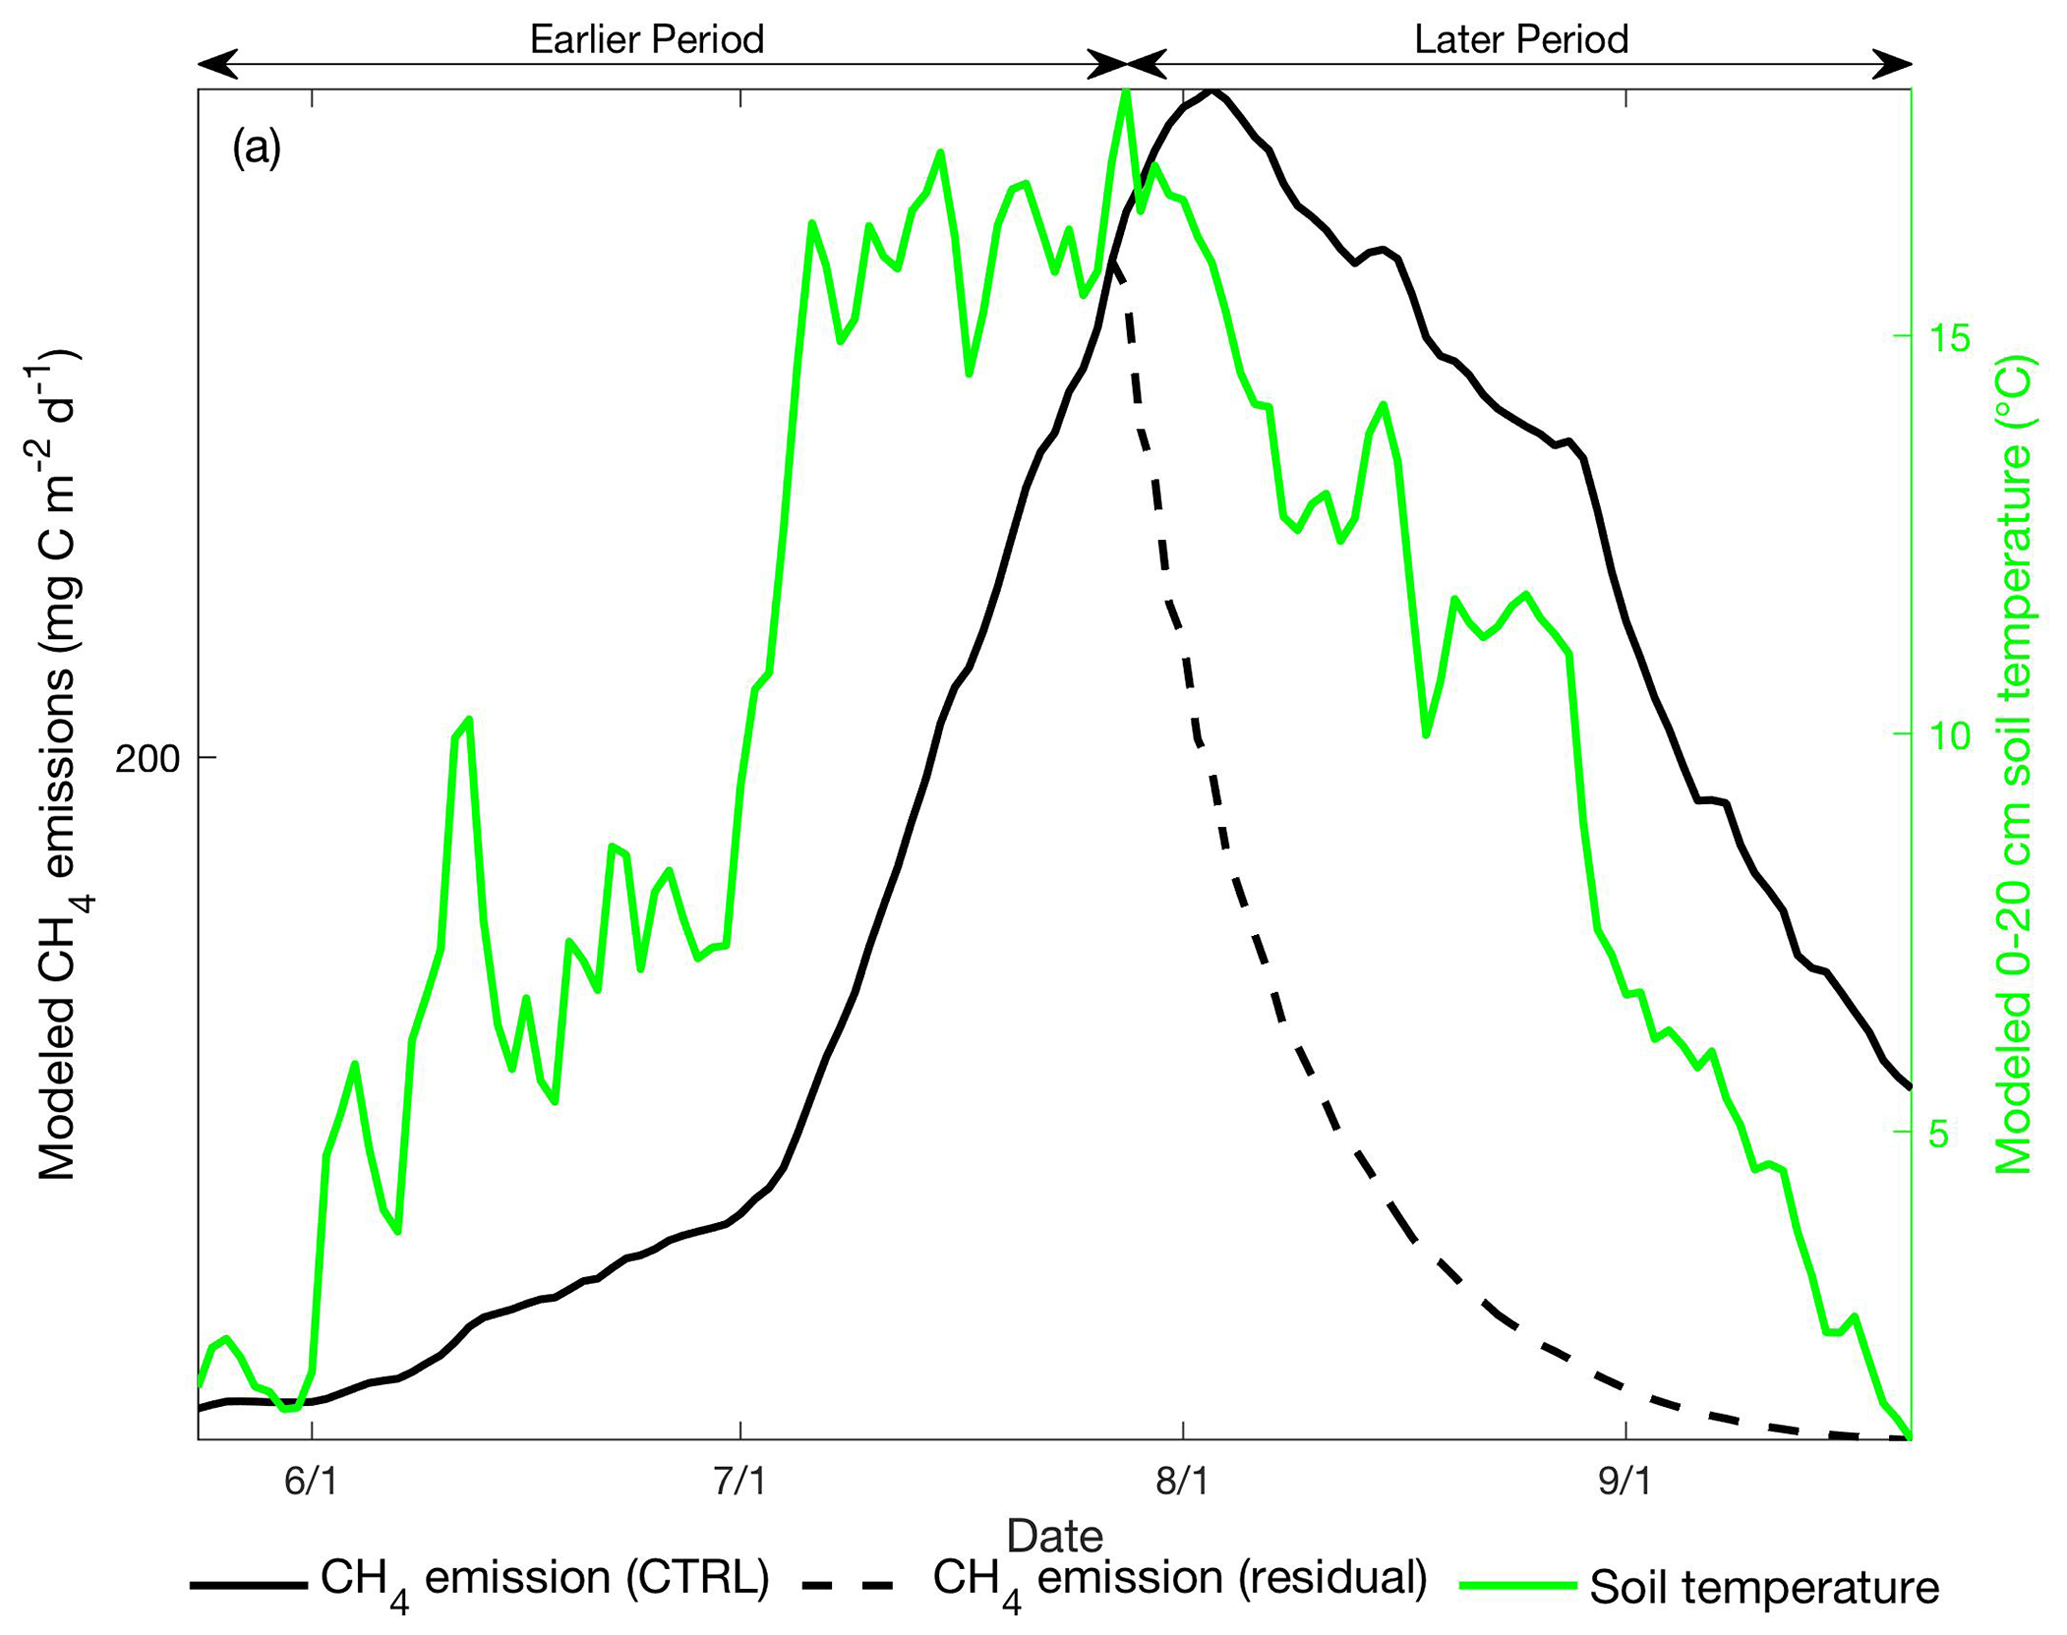
Figure 9Daily CH4 emissions (black line, left axis) and 0–20 cm mean soil temperature (green line, right axis) modeled at the Stordalen Mire fen during the 2011 thawed season. Black solid and dashed lines represent the modeled CH4 emissions with and without CH4 production during the later period, respectively. Earlier and later periods are defined as the time before and after the modeled seasonal maximum 0–20 cm soil temperature.
Collectively, our results suggest that microbial substrate-mediated CH4 production hysteresis is likely to be the primary control of the observed apparent CH4 emission hysteresis. The physical controls on CH4 production and emission (and potentially their hysteresis patterns) in the sediments of terrestrial freshwater systems may differ from those we derived from vegetated peat surfaces (Wik et al., 2016), and further investigation is needed to assess their apparent temperature dependence. To better understand factors controlling CH4 production and emission, continuous measurements of seasonal development of methanogenesis substrates and soil temperature at the depth where CH4 production is prevalent are needed.
Many contemporary CH4 models parameterize wetland CH4 production (or emission) as a fixed fraction of net primary productivity or heterotrophic respiration regulated by a single static function of temperature (Melton et al., 2013; Wania et al., 2013). Our results suggest that such a parameterization is not accurate because it oversimplifies microbial responses to changing thermal and hydrological conditions that modulate wetland CH4 production and emission rates. More continuous observations across sites are required to assess model prediction uncertainty and the broader extent to which our mechanistic explanations apply. In summary, we found that apparent CH4 emission temperature dependencies vary from the earlier to later part of the thawed season due to substrate-mediated CH4 production hysteresis caused by intra-seasonal changes in methanogen biomass and activity. We examined four alternative mechanisms that may contribute to the observed CH4 emission hysteresis with temperature and found that none of them can exclusively explain the underlying dynamics. Our findings motivate explicit model representations of microbial dynamics that physiologically link microbial and abiotic interactions, as only 3 of 40 recently reviewed CH4 models mechanistically represent CH4 biogeochemistry (Xu et al., 2016).
The ecosys source code is available at Zenodo (https://doi.org/10.5281/zenodo.3906642; Tang, 2020).
The data presented in this study are available at the NGEE Arctic Database (https://doi.org/10.5440/1635534, Chang and Riley, 2020).
The supplement related to this article is available online at: https://doi.org/10.5194/bg-17-5849-2020-supplement.
KYC and WJR designed the study. PMC synthesized field measurements and RFG developed the ecosys model. KYC performed the analyses and led the writing of the paper. All authors contributed thoughtful discussions and insights to the study, and all authors contributed to the editing of the paper.
The authors declare that they have no conflict of interest.
This study was funded by the Genomic Science Program of the United States Department of Energy Office of Biological and Environmental Research under the ISOGENIE (DE-SC0016440) and NGEE-Arctic projects under contract DE-AC02-05CH11231 to Lawrence Berkeley National Laboratory and grants from Swedish VR (Vetenskaprådet) and Swedish FORMAS to Patrick M. Crill. We acknowledge the US National Science Foundation MacroSystems program (NSF EF 1241037) support for autochamber measurements between 2013 and 2017. We thank the Abisko Scientific Research Station of the Swedish Polar Research Secretariat for providing the meteorological data.
This research has been supported by the United States Department of Energy (grant nos. DE-SC0016440 and DE-AC02-05CH11231).
This paper was edited by Tina Treude and reviewed by two anonymous referees.
Bäckstrand, K., Crill, P. M., Mastepanov, M., Christensen, T. R., and Bastviken, D.: Non-methane volatile organic compound flux from a subarctic mire in Northern Sweden, Tellus B, 60, 226–237, https://doi.org/10.1111/j.1600-0889.2007.00331.x, 2008a.
Bäckstrand, K., Crill, P. M., Mastepanov, M., Christensen, T. R., and Bastviken, D.: Total hydrocarbon flux dynamics at a subarctic mire in northern Sweden, J. Geophys. Res., 113, G03026, https://doi.org/10.1029/2008JG000703, 2008b.
Bäckstrand, K., Crill, P. M., Jackowicz-Korczyñski, M., Mastepanov, M., Christensen, T. R., and Bastviken, D.: Annual carbon gas budget for a subarctic peatland, Northern Sweden, Biogeosciences, 7, 95–108, https://doi.org/10.5194/bg-7-95-2010, 2010.
Bastviken, D., Tranvik, L. J., Downing, J. A., Crill, P. M., and Enrich-Prast, A.: Freshwater methane emissions offset the continental carbon sink, Science, 331, 50 pp., https://doi.org/10.1126/science.1196808, 2011.
Biskaborn, B. K., Smith, S. L., Noetzli, J., Matthes, H., Vieira, G., Streletskiy, D. A., Schoeneich, P., Romanovsky, V. E., Lewkowicz, A. G., Abramov, A., Allard, M., Boike, J., Cable, W. L., Christiansen, H. H., Delaloye, R., Diekmann, B., Drozdov, D., Etzelmüller, B., Grosse, G., Guglielmin, M., Ingeman-Nielsen, T., Isaksen, K., Ishikawa, M., Johansson, M., Johannsson, H., Joo, A., Kaverin, D., Kholodov, A., Konstantinov, P., Kröger, T., Lambiel, C., Lanckman, J. P., Luo, D., Malkova, G., Meiklejohn, I., Moskalenko, N., Oliva, M., Phillips, M., Ramos, M., Sannel, A. B. K., Sergeev, D., Seybold, C., Skryabin, P., Vasiliev, A., Wu, Q., Yoshikawa, K., Zheleznyak, M., and Lantuit, H.: Permafrost is warming at a global scale, Nat. Commun., 10, 1–11, https://doi.org/10.1038/s41467-018-08240-4, 2019.
Brown, M. G., Humphreys, E. R., Moore, T. R., Roulet, N. T., and Lafleur, P. M.: Evidence for a nonmonotonic relationship between ecosystem-scale peatland methane emissions and water table depth, J. Geophys. Res.-Biogeo., 119, 826–835, https://doi.org/10.1002/2013JG002576, 2014.
Bubier, J., Crill, P., Mosedale, A., Frolking, S., and Linder, E.: Peatland responses to varying interannual moisture conditions as measured by automatic CO2 chambers, Global Biogeochem. Cy., 17, 1–15, https://doi.org/10.1029/2002GB001946, 2003.
Chang, K.-Y. and Riley, W.: Hysteretic temperature sensitivity of wetland CH4 fluxes explained by substrate availability and microbial activity: Model Archive, Next Gener. Ecosyst. Exp. Arct. Data Collect. Oak Ridge Natl. Lab., U.S. Dep. Energy, Oak Ridge, Tennessee, USA, https://doi.org/10.5440/1635534, 2020.
Chang, K.-Y., Riley, W. J., Crill, P. M., Grant, R. F., Rich, V. I., and Saleska, S. R.: Large carbon cycle sensitivities to climate across a permafrost thaw gradient in subarctic Sweden, The Cryosphere, 13, 647–663, https://doi.org/10.5194/tc-13-647-2019, 2019a.
Chang, K.-Y., Riley, W. J., Brodie, E. L., McCalley, C. K., Crill, P. M., and Grant, R. F.: Methane Production Pathway Regulated Proximally by Substrate Availability and Distally by Temperature in a High-Latitude Mire Complex, J. Geophys. Res.-Biogeo., 124, 3057–3074, https://doi.org/10.1029/2019JG005355, 2019b.
Ciais, P., Sabine, C., Bala, G., Bopp, L., Brovkin, V., Canadell, J., Chhabra, A., DeFries, R., Galloway, J., Heimann, M., Jones, C., Le Quéré, C., Myneni, R. B., Piao, S., and Thornton, P.: Carbon and Other Biogeochemical Cycles, in: Climate Change 2013 – The Physical Science Basis, edited by: Stocker, T. F., Qin, D., Plattner, G.-K., Tignor, M., Allen, S. K., Boschung, J., Nauels, A., Xia, Y., Bex, V., and Midgley, P. M., Cambridge University Press, Cambridge, United Kingdom, 465–570, 2013.
Dean, J. F., Middelburg, J. J., Röckmann, T., Aerts, R., Blauw, L. G., Egger, M., Jetten, M. S. M., de Jong, A. E. E., Meisel, O. H., Rasigraf, O., Slomp, C. P., in't Zandt, M. H., and Dolman, A. J.: Methane Feedbacks to the Global Climate System in a Warmer World, Rev. Geophys., 56, 207–250, https://doi.org/10.1002/2017RG000559, 2018.
Eyring, V., Bony, S., Meehl, G. A., Senior, C. A., Stevens, B., Stouffer, R. J., and Taylor, K. E.: Overview of the Coupled Model Intercomparison Project Phase 6 (CMIP6) experimental design and organization, Geosci. Model Dev., 9, 1937–1958, https://doi.org/10.5194/gmd-9-1937-2016, 2016.
Goodrich, J. P., Campbell, D. I., Roulet, N. T., Clearwater, M. J., and Schipper, L. A.: Overriding control of methane flux temporal variability by water table dynamics in a Southern Hemisphere, raised bog, J. Geophys. Res.-Biogeo., 120, 819–831, https://doi.org/10.1002/2014JG002844, 2015.
Goulden, M. L., Wofsy, S. C., Harden, J. W., Trumbore, S. E., Crill, P. M., Gower, S. T., Fries, T., Daube, B. C., Fan, S.-M., Sutton, D. J., Bazzaz, A., and Munger, J. W.: Sensitivity of Boreal Forest Carbon Balance to Soil Thaw, Science 279, 214–217, https://doi.org/10.1126/science.279.5348.214, 1998.
Grant, R. F.: Ecosystem CO2 and CH4 exchange in a mixed tundra and a fen within a hydrologically diverse Arctic landscape: 2. Modeled impacts of climate change, J. Geophys. Res.-Biogeo., 120, 1388–1406, https://doi.org/10.1002/2014JG002889, 2015.
Grant, R. F., Mekonnen, Z. A., Riley, W. J., Wainwright, H. M., Graham, D., and Torn, M. S.: Mathematical Modelling of Arctic Polygonal Tundra with Ecosys: 1. Microtopography Determines How Active Layer Depths Respond to Changes in Temperature and Precipitation, J. Geophys. Res.-Biogeo., 122, 3161–3173, https://doi.org/10.1002/2017JG004035, 2017a.
Grant, R. F., Mekonnen, Z. A., Riley, W. J., Arora, B., and Torn, M. S.: Mathematical Modelling of Arctic Polygonal Tundra with Ecosys: 2. Microtopography Determines How CO2 and CH4 Exchange Responds to Changes in Temperature and Precipitation, J. Geophys. Res.-Biogeo., 122, 3174–3187, https://doi.org/10.1002/2017JG004037, 2017b.
Grant, R. F., Mekonnen, Z. A., Riley, W. J., Arora, B., and Torn, M. S.: Modelling climate change impacts on an Arctic polygonal tundra. Part 2: Changes in CO 2 and CH 4 exchange depend on rates of permafrost thaw as affected by changes in vegetation and drainage, J. Geophys. Res.-Biogeo., 124, 1323–1341, https://doi.org/10.1029/2018JG004645, 2019.
Hemes, K. S., Chamberlain, S. D., Eichelmann, E., Knox, S. H., and Baldocchi, D. D.: A Biogeochemical Compromise: The High Methane Cost of Sequestering Carbon in Restored Wetlands, Geophys. Res. Lett., 45, 6081–6091, https://doi.org/10.1029/2018GL077747, 2018.
Hines, M. E., Duddleston, K. N., Rooney-Varga, J. N., Fields, D., and Chanton, J. P.: Uncoupling of acetate degradation from methane formation in Alaskan wetlands: Connections to vegetation distribution, Global Biogeochem. Cycles, 22, 1–12, https://doi.org/10.1029/2006GB002903, 2008.
Hinkel, K. M., Frohn, R. C., Nelson, F. E., Eisner, W. R., and Beck, R. A.: Morphometric and spatial analysis of thaw lakes and drained thaw lake basins in the western Arctic Coastal Plain, Alaska, Permafr. Periglac. Process., 16, 327–341, https://doi.org/10.1002/ppp.532, 2005.
Hodgkins, S. B., Tfaily, M. M., McCalley, C. K., Logan, T. A., Crill, P. M., Saleska, S. R., Rich, V. I., and Chanton, J. P.: Changes in peat chemistry associated with permafrost thaw increase greenhouse gas production, P. Natl. Acad. Sci., 111, 5819–5824, https://doi.org/10.1073/pnas.1314641111, 2014.
Iwata, H., Harazono, Y., Ueyama, M., Sakabe, A., Nagano, H., Kosugi, Y., Takahashi, K., and Kim, Y.: Methane exchange in a poorly-drained black spruce forest over permafrost observed using the eddy covariance technique, Agric. For. Meteorol., 214/215, 157–168, https://doi.org/10.1016/j.agrformet.2015.08.252, 2015.
Kirschke, S., Bousquet, P., Ciais, P., Saunois, M., Canadell, J. G., Dlugokencky, E. J., Bergamaschi, P., Bergmann, D., Blake, D. R., Bruhwiler, L., Cameron-Smith, P., Castaldi, S., Chevallier, F., Feng, L., Fraser, A., Heimann, M., Hodson, E. L., Houweling, S., Josse, B., Fraser, P. J., Krummel, P. B., Lamarque, J.-F., Langenfelds, R. L., Le Quéré, C., Naik, V., O'Doherty, S., Palmer, P. I., Pison, I., Plummer, D., Poulter, B., Prinn, R. G., Rigby, M., Ringeval, B., Santini, M., Schmidt, M., Shindell, D. T., Simpson, I. J., Spahni, R., Steele, L. P., Strode, S. A., Sudo, K., Szopa, S., van der Werf, G. R., Voulgarakis, A., van Weele, M., Weiss, R. F., Williams, J. E., and Zeng, G.: Three decades of global methane sources and sinks, Nat. Geosci., 6, 813–823, https://doi.org/10.1038/ngeo1955, 2013.
Knoblauch, C., Beer, C., Liebner, S., Grigoriev, M. N., and Pfeiffer, E. M.: Methane production as key to the greenhouse gas budget of thawing permafrost, Nat. Clim. Chang., 8, 309–312, https://doi.org/10.1038/s41558-018-0095-z, 2018.
Malmer, N., Johansson, T., Olsrud, M., and Christensen, T. R.: Vegetation, climatic changes and net carbon sequestration in a North-Scandinavian subarctic mire over 30 years, Glob. Chang. Biol., 11, 1895–1909, https://doi.org/10.1111/j.1365-2486.2005.01042.x, 2005.
McCalley, C. K., Woodcroft, B. J., Hodgkins, S. B., Wehr, R. A., Kim, E.-H., Mondav, R., Crill, P. M., Chanton, J. P., Rich, V. I., Tyson, G. W., and Saleska, S. R.: Methane dynamics regulated by microbial community response to permafrost thaw, Nature, 514, 478–481, https://doi.org/10.1038/nature13798, 2014.
Melton, J. R., Wania, R., Hodson, E. L., Poulter, B., Ringeval, B., Spahni, R., Bohn, T., Avis, C. A., Beerling, D. J., Chen, G., Eliseev, A. V., Denisov, S. N., Hopcroft, P. O., Lettenmaier, D. P., Riley, W. J., Singarayer, J. S., Subin, Z. M., Tian, H., Zürcher, S., Brovkin, V., van Bodegom, P. M., Kleinen, T., Yu, Z. C., and Kaplan, J. O.: Present state of global wetland extent and wetland methane modelling: conclusions from a model inter-comparison project (WETCHIMP), Biogeosciences, 10, 753–788, https://doi.org/10.5194/bg-10-753-2013, 2013.
Myhre, G., D., Shindell, F.-M., Bréon, F.-M., Collins, W., Fuglestvedt, J., Huang, J., Koch, D., Lamarque, J.-F., Lee, D., Mendoza, B., Nakajima, T., Robock, A., Stephens, G., Takemura, T., and Zhang, H.: Anthropogenic and Natural Radiative Forcing, in: Climate Change 2013 - The Physical Science Basis, vol. 23, edited by: Intergovernmental Panel on Climate Change, Cambridge University Press, Cambridge, UK, 659–740, 2013.
Neubauer, S. C. and Megonigal, J. P.: Moving Beyond Global Warming Potentials to Quantify the Climatic Role of Ecosystems, Ecosystems, 18, 1000–1013, https://doi.org/10.1007/s10021-015-9879-4, 2015.
Olefeldt, D. and Roulet, N. T.: Effects of permafrost and hydrology on the composition and transport of dissolved organic carbon in a subarctic peatland complex, J. Geophys. Res.-Biogeo., 117, 1–15, https://doi.org/10.1029/2011JG001819, 2012.
Olefeldt, D., Turetsky, M. R., Crill, P. M., and Mcguire, A. D.: Environmental and physical controls on northern terrestrial methane emissions across permafrost zones, Glob. Change Biol., 19, 589–603, https://doi.org/10.1111/gcb.12071, 2013.
Perryman, C. R., McCalley, C. K., Malhotra, A., Fahnestock, M. F., Kashi, N. N., Bryce, J. G., Giesler, R., and Varner, R. K.: Thaw Transitions and Redox Conditions Drive Methane Oxidation in a Permafrost Peatland, J. Geophys. Res.-Biogeo., 124, e2019JG005526, https://doi.org/10.1029/2019JG005526, 2020.
Poulter, B., Bousquet, P., Canadell, J. G., Ciais, P., Peregon, A., Saunois, M., Arora, V. K., Beerling, D. J., Brovkin, V., Jones, C. D., Joos, F., Gedney, N., Ito, A., Kleinen, T., Koven, C. D., McDonald, K., Melton, J. R., Peng, C., Peng, S., Prigent, C., Schroeder, R., Riley, W. J., Saito, M., Spahni, R., Tian, H., Taylor, L., Viovy, N., Wilton, D., Wiltshire, A., Xu, X., Zhang, B., Zhang, Z., and Zhu, Q.: Global wetland contribution to 2000–2012 atmospheric methane growth rate dynamics, Environ. Res. Lett., 12, 094013, https://doi.org/10.1088/1748-9326/aa8391, 2017.
Rinne, J., Tuittila, E. S., Peltola, O., Li, X., Raivonen, M., Alekseychik, P., Haapanala, S., Pihlatie, M., Aurela, M., Mammarella, I., and Vesala, T.: Temporal Variation of Ecosystem Scale Methane Emission From a Boreal Fen in Relation to Temperature, Water Table Position, and Carbon Dioxide Fluxes, Global Biogeochem. Cy., 32, 1087–1106, https://doi.org/10.1029/2017GB005747, 2018.
Rydén, B. E. and Kostov, L.: Thawing and Freezing in Tundra Soils, Ecol. Bull., 30, 251–281, 1980.
Saunois, M., Bousquet, P., Poulter, B., Peregon, A., Ciais, P., Canadell, J. G., Dlugokencky, E. J., Etiope, G., Bastviken, D., Houweling, S., Janssens-Maenhout, G., Tubiello, F. N., Castaldi, S., Jackson, R. B., Alexe, M., Arora, V. K., Beerling, D. J., Bergamaschi, P., Blake, D. R., Brailsford, G., Brovkin, V., Bruhwiler, L., Crevoisier, C., Crill, P., Covey, K., Curry, C., Frankenberg, C., Gedney, N., Höglund-Isaksson, L., Ishizawa, M., Ito, A., Joos, F., Kim, H.-S., Kleinen, T., Krummel, P., Lamarque, J.-F., Langenfelds, R., Locatelli, R., Machida, T., Maksyutov, S., McDonald, K. C., Marshall, J., Melton, J. R., Morino, I., Naik, V., O'Doherty, S., Parmentier, F.-J. W., Patra, P. K., Peng, C., Peng, S., Peters, G. P., Pison, I., Prigent, C., Prinn, R., Ramonet, M., Riley, W. J., Saito, M., Santini, M., Schroeder, R., Simpson, I. J., Spahni, R., Steele, P., Takizawa, A., Thornton, B. F., Tian, H., Tohjima, Y., Viovy, N., Voulgarakis, A., van Weele, M., van der Werf, G. R., Weiss, R., Wiedinmyer, C., Wilton, D. J., Wiltshire, A., Worthy, D., Wunch, D., Xu, X., Yoshida, Y., Zhang, B., Zhang, Z., and Zhu, Q.: The global methane budget 2000–2012, Earth Syst. Sci. Data, 8, 697–751, https://doi.org/10.5194/essd-8-697-2016, 2016.
Saunois, M., Bousquet, P., Poulter, B., Peregon, A., Ciais, P., Canadell, J. G., Dlugokencky, E. J., Etiope, G., Bastviken, D., Houweling, S., Janssens-Maenhout, G., Tubiello, F. N., Castaldi, S., Jackson, R. B., Alexe, M., Arora, V. K., Beerling, D. J., Bergamaschi, P., Blake, D. R., Brailsford, G., Bruhwiler, L., Crevoisier, C., Crill, P., Covey, K., Frankenberg, C., Gedney, N., Höglund-Isaksson, L., Ishizawa, M., Ito, A., Joos, F., Kim, H.-S., Kleinen, T., Krummel, P., Lamarque, J.-F., Langenfelds, R., Locatelli, R., Machida, T., Maksyutov, S., Melton, J. R., Morino, I., Naik, V., O'Doherty, S., Parmentier, F.-J. W., Patra, P. K., Peng, C., Peng, S., Peters, G. P., Pison, I., Prinn, R., Ramonet, M., Riley, W. J., Saito, M., Santini, M., Schroeder, R., Simpson, I. J., Spahni, R., Takizawa, A., Thornton, B. F., Tian, H., Tohjima, Y., Viovy, N., Voulgarakis, A., Weiss, R., Wilton, D. J., Wiltshire, A., Worthy, D., Wunch, D., Xu, X., Yoshida, Y., Zhang, B., Zhang, Z., and Zhu, Q.: Variability and quasi-decadal changes in the methane budget over the period 2000–2012, Atmos. Chem. Phys., 17, 11135–11161, https://doi.org/10.5194/acp-17-11135-2017, 2017.
Schuur, E. A. G., McGuire, A. D., Schädel, C., Grosse, G., Harden, J. W., Hayes, D. J., Hugelius, G., Koven, C. D., Kuhry, P., Lawrence, D. M., Natali, S. M., Olefeldt, D., Romanovsky, V. E., Schaefer, K., Turetsky, M. R., Treat, C. C., and Vonk, J. E.: Climate change and the permafrost carbon feedback, Nature, 520, 171–179, https://doi.org/10.1038/nature14338, 2015.
Shiklomanov, N. I., Streletskiy, D. A., Nelson, F. E., Hollister, R. D., Romanovsky, V. E., Tweedie, C. E., Bockheim, J. G., and Brown, J.: Decadal variations of active-layer thickness in moisture-controlled landscapes, Barrow, Alaska, J. Geophys. Res.-Biogeo., 115, G00I04, https://doi.org/10.1029/2009JG001248, 2010.
Singleton, C. M., McCalley, C. K., Woodcroft, B. J., Boyd, J. A., Evans, P. N., Hodgkins, S. B., Chanton, J. P., Frolking, S., Crill, P. M., Saleska, S. R., Rich, V. I., and Tyson, G. W.: Methanotrophy across a natural permafrost thaw environment, ISME J., 12, 2544–2558, https://doi.org/10.1038/s41396-018-0065-5, 2018.
Tang, J.: Ecosys v1.0 release (Version v1.0), Zenodo, https://doi.org/10.5281/zenodo.3906642, 2020.
Tang, J. and Riley, W. J.: Weaker soil carbon-climate feedbacks resulting from microbial and abiotic interactions, Nat. Clim. Chang., 5, 56–60, https://doi.org/10.1038/nclimate2438, 2014.
Tveit, A. T., Urich, T., Frenzel, P., and Svenning, M. M.: Metabolic and trophic interactions modulate methane production by Arctic peat microbiota in response to warming, P. Natl. Acad. Sci. USA, 112, E2507–E2516, https://doi.org/10.1073/pnas.1420797112, 2015.
Updegraff, K., Bridgham, S. D., Pastor, J., and Weishampel, P.: Hysteresis in the temperature response of carbon dioxide and methane production in peat soils, Biogeochemistry, 43, 253–272, https://doi.org/10.1023/A:1006097808262, 1998.
Wainwright, H. M., Dafflon, B., Smith, L. J., Hahn, M. S., Curtis, J. B., Wu, Y., Ulrich, C., Peterson, J. E., Torn, M. S., and Hubbard, S. S.: Identifying multiscale zonation and assessing the relative importance of polygon geomorphology on carbon fluxes in an Arctic tundra ecosystem, J. Geophys. Res.-Biogeo., 120, 788–808, https://doi.org/10.1002/2014JG002799, 2015.
Wania, R., Melton, J. R., Hodson, E. L., Poulter, B., Ringeval, B., Spahni, R., Bohn, T., Avis, C. A., Chen, G., Eliseev, A. V., Hopcroft, P. O., Riley, W. J., Subin, Z. M., Tian, H., van Bodegom, P. M., Kleinen, T., Yu, Z. C., Singarayer, J. S., Zürcher, S., Lettenmaier, D. P., Beerling, D. J., Denisov, S. N., Prigent, C., Papa, F., and Kaplan, J. O.: Present state of global wetland extent and wetland methane modelling: methodology of a model inter-comparison project (WETCHIMP), Geosci. Model Dev., 6, 617–641, https://doi.org/10.5194/gmd-6-617-2013, 2013.
Wik, M., Varner, R. K., Anthony, K. W., MacIntyre, S., and Bastviken, D.: Climate-sensitive northern lakes and ponds are critical components of methane release, Nat. Geosci., 9, 99–105, https://doi.org/10.1038/ngeo2578, 2016.
Wohlfahrt, G. and Galvagno, M.: Revisiting the choice of the driving temperature for eddy covariance CO2 flux partitioning, Agr. Forest Meteorol., 237/238, 135–142, https://doi.org/10.1016/j.agrformet.2017.02.012, 2017.
Xu, X., Yuan, F., Hanson, P. J., Wullschleger, S. D., Thornton, P. E., Riley, W. J., Song, X., Graham, D. E., Song, C., and Tian, H.: Reviews and syntheses: Four decades of modeling methane cycling in terrestrial ecosystems, Biogeosciences, 13, 3735–3755, https://doi.org/10.5194/bg-13-3735-2016, 2016.
Yvon-Durocher, G., Allen, A. P., Bastviken, D., Conrad, R., Gudasz, C., St-Pierre, A., Thanh-Duc, N., and Del Giorgio, P. A.: Methane fluxes show consistent temperature dependence across microbial to ecosystem scales, Nature, 507, 488–491, https://doi.org/10.1038/nature13164, 2014.
Zhang, L., Liu, X., Duddleston, K., and Hines, M. E.: The Effects of pH, Temperature, and Humic-Like Substances on Anaerobic Carbon Degradation and Methanogenesis in Ombrotrophic and Minerotrophic Alaskan Peatlands, Aquat. Geochem., 26, 221–244, https://doi.org/10.1007/s10498-020-09372-0, 2020.
Zona, D., Gioli, B., Commane, R., Lindaas, J., Wofsy, S. C., and Miller, C. E.: Cold season emissions dominate the Arctic tundra methane budget, P. Natl. Acad. Sci., 113, 40–45, https://doi.org/10.1073/pnas.1516017113, 2016.