the Creative Commons Attribution 4.0 License.
the Creative Commons Attribution 4.0 License.
 | 09 Dec 2020
Adult life strategy affects distribution patterns in abyssal isopods – implications for conservation in Pacific nodule areas
Saskia Brix
Karen J. Osborn
Stefanie Kaiser
Sarit B. Truskey
Sarah M. Schnurr
Nils Brenke
Marina Malyutina
Pedro Martinez Arbizu
With increasing pressure to extract minerals from the deep-sea bed, understanding the ecological and evolutionary processes that limit the spatial distribution of species is critical to assessing ecosystem resilience to mining impacts. The aim of our study is to gain a better knowledge about the abyssal isopod crustacean fauna of the central Pacific manganese nodule province (Clarion–Clipperton Fracture Zone, CCZ). In total, we examined 22 epibenthic sledge (EBS) samples taken at five abyssal areas located in the central northern Pacific including four contracting areas and one Area of Particular Environmental Interest (APEI3). Additional samples come from the DISturbance and reCOLonization experiment (DISCOL) area situated in the Peru Basin, southeastern Pacific. Using an integrative approach that combined morphological and genetic methods with species delimitation analyses (SDs) we assessed patterns of species range size, diversity, and community composition for four different isopod families (Munnopsidae Lilljeborg, 1864; Desmosomatidae Sars, 1897; Haploniscidae Hansen, 1916; and Macrostylidae Hansen, 1916) displaying different dispersal capacities as adults. Isopods are brooders, so their distribution and connectivity cannot be explained by larval dispersal but rather by adult locomotion. In particular, our objectives were to (1) identify potential differences in the distributional ranges of isopod families relative to their locomotory potential and to (2) evaluate the representativeness of the APEI for the preservation of regional biodiversity in the CCZ following mining disturbances. From 619 specimens, our SD analysis could distinguish 170 species, most of which were new to science (94.1 %). We found that increased locomotory ability correlated with higher species diversity with 9 species of Macrostylidae, 23 of Haploniscidae, 52 of Desmosomatidae, and 86 of Munnopsidae. This is supported by family-level rarefaction analyses. As expected, we found the largest species ranges in the families with swimming abilities, with a maximum recorded species range of 5245 and 4480 km in Munnopsidae and Desmosomatidae, respectively. The less motile Haploniscidae and Macrostylidae had maximal species ranges of 1391 and 1440 km, respectively. Overall, rarefaction analyses indicated that species richness did not vary much between areas, but the real number of species was still not sufficiently sampled. This is also indicated by the large proportion of singletons (40.5 %) found in this study. The investigated contractor areas in the CCZ were more similar in species composition and had a higher proportion of shared species between each other than the closely located APEI3 and the distantly located DISCOL area. In fact, the DISCOL area, located in the Peru Basin, had more species in common with the core CCZ areas than APEI3. In this regard, APEI3 does not appear to be representative as serving as a reservoir for the fauna of the investigated contractor areas, at least for isopods, as it has a different species composition. Certainly, more data from other APEIs, as well as preservation reference zones within contractor areas, are urgently needed in order to assess their potential as resources of recolonization of impacted seabed.
- Article
(8009 KB) - Full-text XML
-
Supplement
(164 KB) - BibTeX
- EndNote


Spanning 60 % of the Earth's surface, deep-sea areas (below 200 m water depth) harbor an immense diversity of habitats and species but also large deposits of metal-rich seafloor minerals, for example, polymetallic sulfides, cobalt-rich ferromanganese crusts and phosphorite and polymetallic (Mn) nodules. Despite the challenges to initial endeavors to explore these resources starting in the 1960s, growing economic interests coupled with advancing technologies to extract minerals from the seafloor have now made deep-sea mining a reality (Wedding et al., 2015) that may become happen in the coming years.
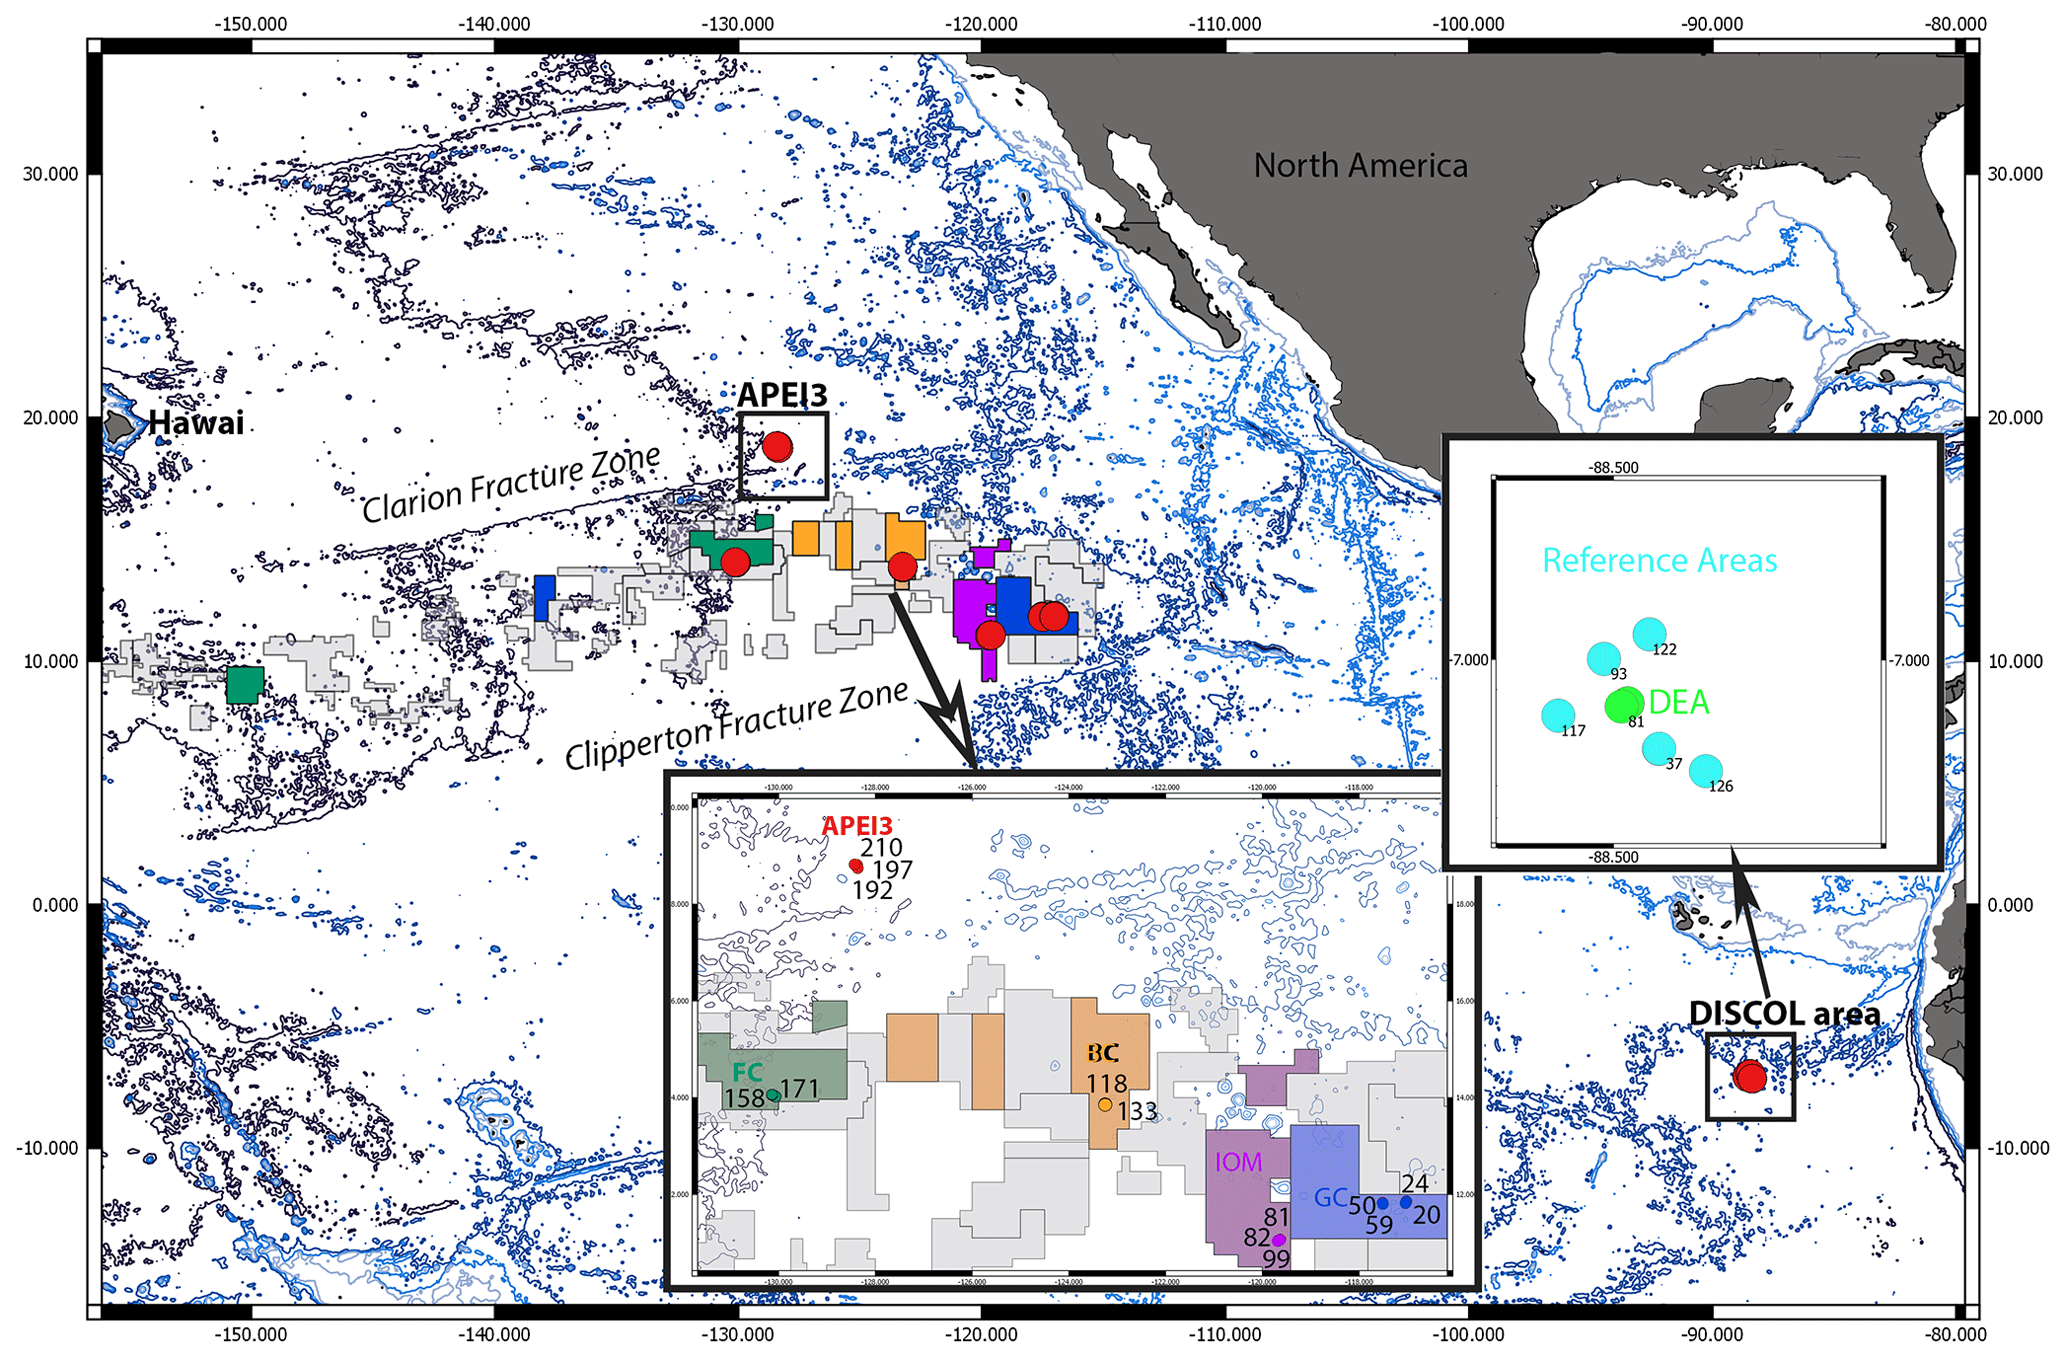
Figure 1Map of the locations of the epibenthic sledge (EBS) sampling sites (red dots) within the manganese nodule contractor area and the DISturbance and reCOLonization experiment (DISCOL) Experimental Area (DEA) in the northeastern and southeastern Pacific. The color code in this map reflects the color code given in the circle trees (Figs. 2–5) but is not reflected in the statistical graphs (Figs. 6–10). In the CCZ, the samples were taken in four contractor areas from east to west: GC (dark blue – German contractor: BGR), IOM (violet – Interoceanmetal Joint Organization), BC (orange – Belgian contractor: GSR), and FC (dark green – French contractor: IFREMER). In addition, the APEI3 (red – Area of Particular Environmental Interest number 3) and DISCOL Experimental Area (light green/blue – DEA and reference areas).
The abyssal Clarion–Clipperton Fracture Zone (CCZ; Fig. 1), located in the tropical northeastern Pacific, is commercially the most important area for exploring Mn nodule mining (in the CCZ it is one step further than prospection). Extraction of these mineral resources will inevitably lead to habitat loss and changes at the directly mined sites primarily through removal, blanketing, and compaction of the upper sediment layer (5–20 cm) (Miljutin et al., 2011; Ramirez-Llodra et al., 2011; Jones et al., 2017; Gollner et al., 2017). Furthermore, areas beyond the actual mining block may be indirectly affected through the generation of a sediment cloud, as well as discharge water from dewatering processes at the sea surface (Oebius et al., 2001; Hauton et al., 2017). The impacts associated with deep-sea mining have already been outlined in earlier studies (e.g., Thiel and Forschungsverbund Tiefsee-Umweltschutz, 2001). As part of their environmental management plan (EMP), the International Seabed Authority (ISA) designated a network of nine Areas of Particular Environmental Interest (APEIs) bordering the CCZ where no mining takes place to enable the recovery of impacted populations and communities (Smith et al., 2008a; Wedding et al., 2013, 2015; Lodge et al., 2014). The prerequisite for these areas is that they are representative in terms of biodiversity and species composition and cover the entire spectrum of the habitat and community types available in the CCZ. However, data from APEIs, which have been very limited to date, bring into question their representativeness and suitability as a biodiversity reservoir (Vanreusel et al., 2016; Bonifacio et al., 2020; Christodoulou et al., 2020).
As mining will severely impact the communities along large swathes of the seafloor, recovery will only be possible through recolonization from surrounding areas. In order to make predictions on the recolonization potential of the deep-sea fauna, sound understanding of the modes and drivers of species' geographic distributions is required. That is to say that species with a broader distribution and better dispersal ability likely have a greater potential to recolonize impacted areas compared to species with narrower geographic ranges, which likely have an increased risk of local extinction following regional mining disturbance (Roberts and Hawkins, 1999). In turn, this understanding would contribute to defining the extent and location of ecological reserve areas in the CCZ (Baco et al., 2016; Vanreusel et al., 2016; De Smet et al., 2017).
In this study, we assess the role of adult lifestyle in determining the large-scale distribution of asellote isopods across the CCZ. Asellota of the superfamily Janiroidea are one of the most numerous and diverse crustacean taxa encountered within abyssal benthic samples (Brandt et al., 2007). With only a few exceptions, isopods lack planktonic larvae, and thus levels of gene flow result from the active and/or passive migration of adults (Brandt, 1992). For these reasons, they have been frequently used as model organisms to study patterns of species range size and diversity in the deep sea (Rex et al., 1993; Stuart et al., 2003; Brandt et al., 2007, 2012; Kaiser et al., 2007; Janssen et al., 2015; Wilson, 2017; Brix et al., 2018; Jennings et al., 2019). Asellotes are principally detritivores and foraminiferivores, but different groups show different lifestyles.
In this study, we chose four families along a spectrum of adult locomotion abilities: the Munnopsidae Lilljeborg, 1864, the Desmosomatidae Sars, 1897, the Haploniscidae Hansen, 1916, and the Macrostylidae Hansen, 1916 (Fig. 2).
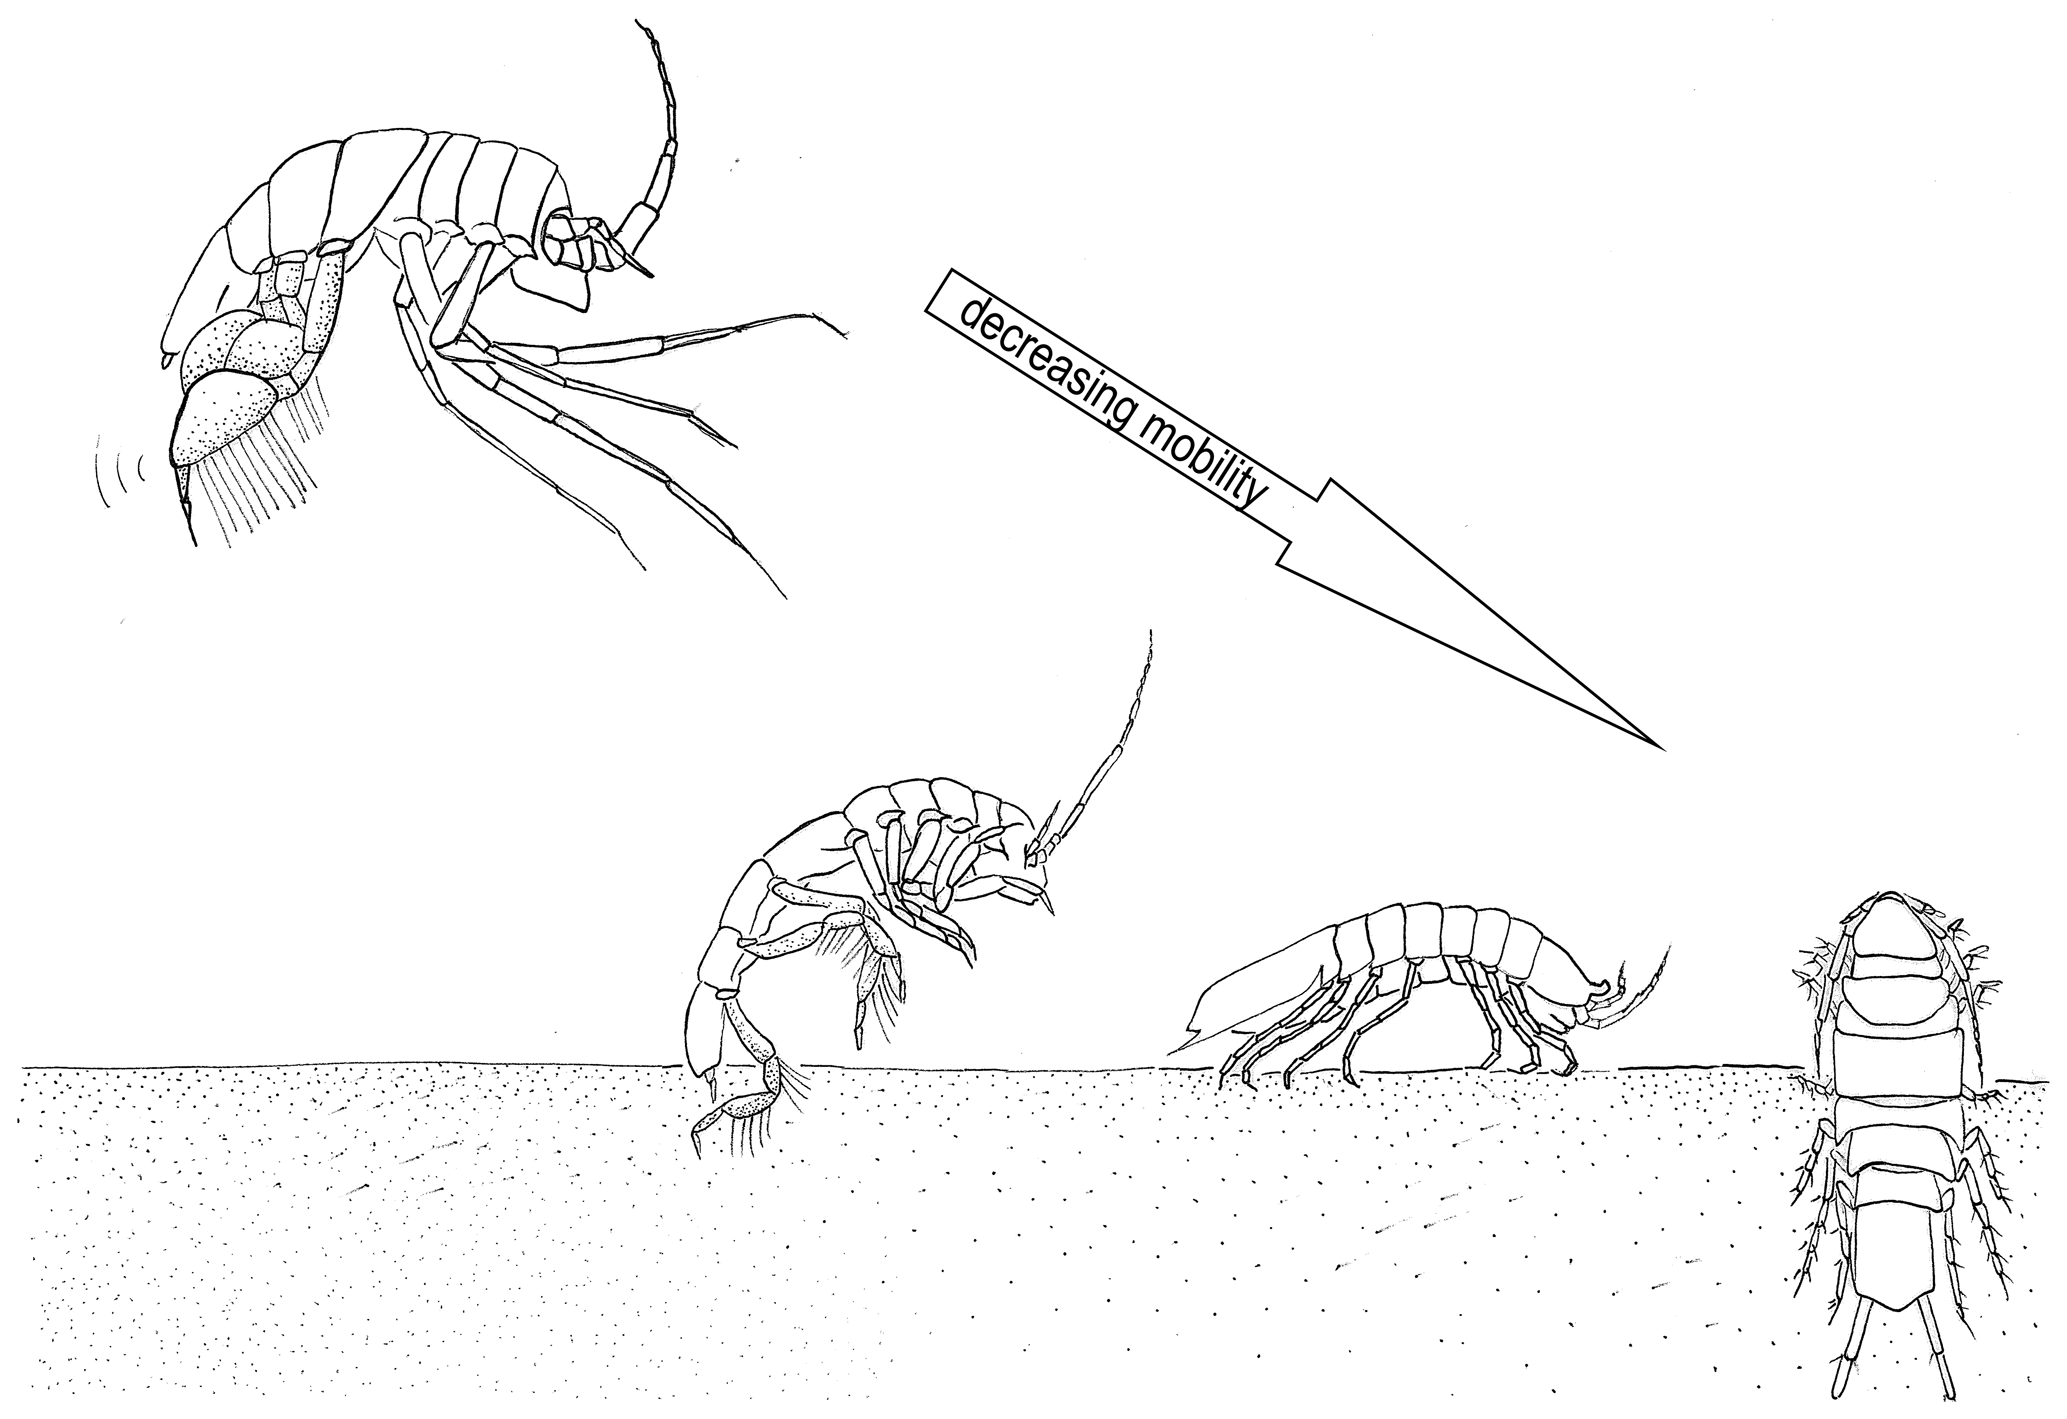
Figure 2Illustration of the locomotion of the four isopod families. From right to left decreasing mobility: Munnopsidae – swimming; Desmosomatidae – walking/swimming; Haploniscidae – walking; and Macrostylidae – burrowing.
The Munnopsidae Lilljeborg, 1864, are the most diverse and abundant janiroids in the deep sea, and their diversity is reflected in numerous morphological and ecological adaptations, the most important of which is their paddle-like posterior legs that are highly specialized for swimming and digging (Malyutina et al., 2020; Riehl et al., 2020). Some munnopsid species have moved towards a benthopelagic (e.g., in Munnopsoides Tattersall, 1905) or even holopelagic (e.g., in Paramunnopsis Hansen, 1916) mode, while others follow a burrowing (e.g., in Ilyarachna Sars, 1869, and Bellibos Haugsness and Hessler, 1979) or epibenthic (e.g., in Rectisura Malyutina, 2003, and Vanhoeffenura Malyutina, 2004) lifestyle (reviewed in Osborn, 2009). In the Desmosomatidae, usually referred to as an epifaunal family, swimming adaptations are only poorly expressed compared to the Munnopsidae (Hessler, 1981; Hessler and Stromberg, 1989). Yet, desmosomatids bear long natatory setae on their posterior pereopods and are thus considered to be moderate swimmers (Hessler, 1981; Svarvasson, 1984; Hessler and Strömberg, 1989; Brix et al., 2015; Bober et al., 2018). The Haploniscidae have no modifications for swimming or burrowing. While in situ observations are lacking, information from epibenthic sledge (EBS) and core sampling suggests haploniscids live at or near the sediment surface (Harrison, 1989). Finally, the Macrostylidae, due to their infaunal tubicolous mode of life, are expected to have the least dispersal potential and thus the smallest distributional ranges. However, their sexual dimorphism may allow males of some lineages to be more mobile on the suprabenthos compared to the females (Harrison, 1989; Hessler and Strömberg, 1989; Riehl and Kaiser, 2012; Bober et al., 2018).
In a previous molecular assessment of widespread isopod species across the Mid-Atlantic Ridge (MAR), Bober et al. (2018) found lifestyle to have a profound effect on dispersal distances, with munnopsid species maintaining gene flow across the MAR, while distributional ranges in desmosomatids, nannoniscids (Brix et al., 2018), and macrostylids were much more restricted (Riehl et al., 2018). Thus, we expect munnopsid species to exhibit the widest geographic distributions compared to other families. Furthermore, we expect to find the correlation between geographic distance and faunistic dissimilarity to be more pronounced in lineages with limited dispersal ability (Haye et al., 2012; Janssen et al., 2015; Riehl et al., 2018). In the absence of detailed information on species' distributional ranges in the CCZ and the abyss in general, using lifestyle as a dispersal ability proxy may be useful in forecasting faunal recolonization potential following disturbance events and related environmental changes. Such proxies become useful for defining operational units for conservation planning due to their high richness of, unfortunately, largely undescribed isopod species.
In the course of the Joint Programming Initiative' Healthy and Productive Seas and Oceans (JPI Oceans) pilot action “Ecological Aspects of Deep-sea Mining” (JPIO), sampling was conducted during the SO239 and SO242 expeditions in 2015 to obtain samples from contractor areas in the CCZ and APEI3, as well as the DISturbance and reCOLonization experiment (DISCOL) area in the Peru Basin. From these samples, the isopod fauna has been examined. The primary objective of this study is two-fold: first, to identify potential differences in distributional ranges of four different deep-sea janiroid families with varying lifestyles (Munnopsidae, Desmosomatidae, Haploniscidae, and Macrostylidae) and in order to determine if these can be used as surrogates to estimate dispersal distances; and second, to gain knowledge of the diverse species composition and the connectivity of the core CCZ contractor areas in contrast to a closely located APEI and the distantly located Mn nodule area DISCOL.
2.1 Sampling and sample preparation
Samples were collected during two expeditions in the course of the JPI Oceans pilot action “Ecological Aspects of Deep-sea Mining” (JPIO) to the CCZ and DISCOL areas in the northeastern and southeastern Pacific, respectively (see cruise reports by Greinert, 2015; Boetius, 2015; Martinez Arbizu and Haeckel, 2015; Fig. 1). Within the CCZ, samples were collected from four different contacting areas from east to west: BGR (German contractor), IOM (Interoceanmetal Joint Organization), GSR (Belgian contractor), IFREMER (French contractor), and one APEI (APEI3: Area of Particular Environmental Interest number 3). Isopod specimens were collected with an epibenthic sledge (EBS) in the CCZ (SO239 cruise, 13 EBS deployments; Table S1) and the Peru Basin (SO242-1 cruise, nine EBS deployments; Table S1) from RV Sonne in 2015.
Samples were immediately fixed on deck in prechilled 96 % non-denatured ethanol and kept cool throughout the sorting process according to Riehl et al. (2014). One to three posterior legs of each isopod specimen were dissected and used for DNA extraction. Before DNA extraction all isopod specimens were morphologically determined to family level and given individual voucher numbers. All voucher specimens will be stored at the Center of Natural History, Hamburg (CeNak), or the crustacean collection of Senckenberg, Frankfurt, after final species descriptions. Before being formally described, the isopod specimens will remain in storage at the German Center for Marine Biodiversity Research (DZMB). After DNA extraction, all isopod specimens were identified morphologically to species level using a Leica MZ 12.5 stereomicroscope by Saskia Brix, Nils Brenke, and Marina Malyutina. All determinations were entered into an excel spreadsheet (Table S1) using this as the baseline for creating maps in quantum geographic information system (QGIS), as well as for statistical analysis.
2.2 Data storage and handling
All specimen information and molecular data are managed via the Barcode of Life Database (BoLD) for the projects “CCZ – Clarion and Clipperton Fracture Zones biodiversity” and “DISCOL – DISturbance and reCOLonization experiment in a manganese nodule area of the SE Pacific Ocean”. For this publication, we created a dataset “Dataset – DS-LOCOM locomotion of adult isopods influences distribution”, holding a subset of 619 specimens for GenBank submission whose sequences will be made available after publication. All data are stored in BoLD along with the DS-LOCOM dataset that contains all available data and is made publicly available via GenBank submission. The BIN system in BoLD compares newly submitted sequences with all already available sequences in BoLD, clustering them according to their molecular divergence using clustering algorithms. Each cluster receives a unique BIN (barcode identity number as stated for each specimen with cytochrome oxidase subunit 1, COI, sequence in Table 1).
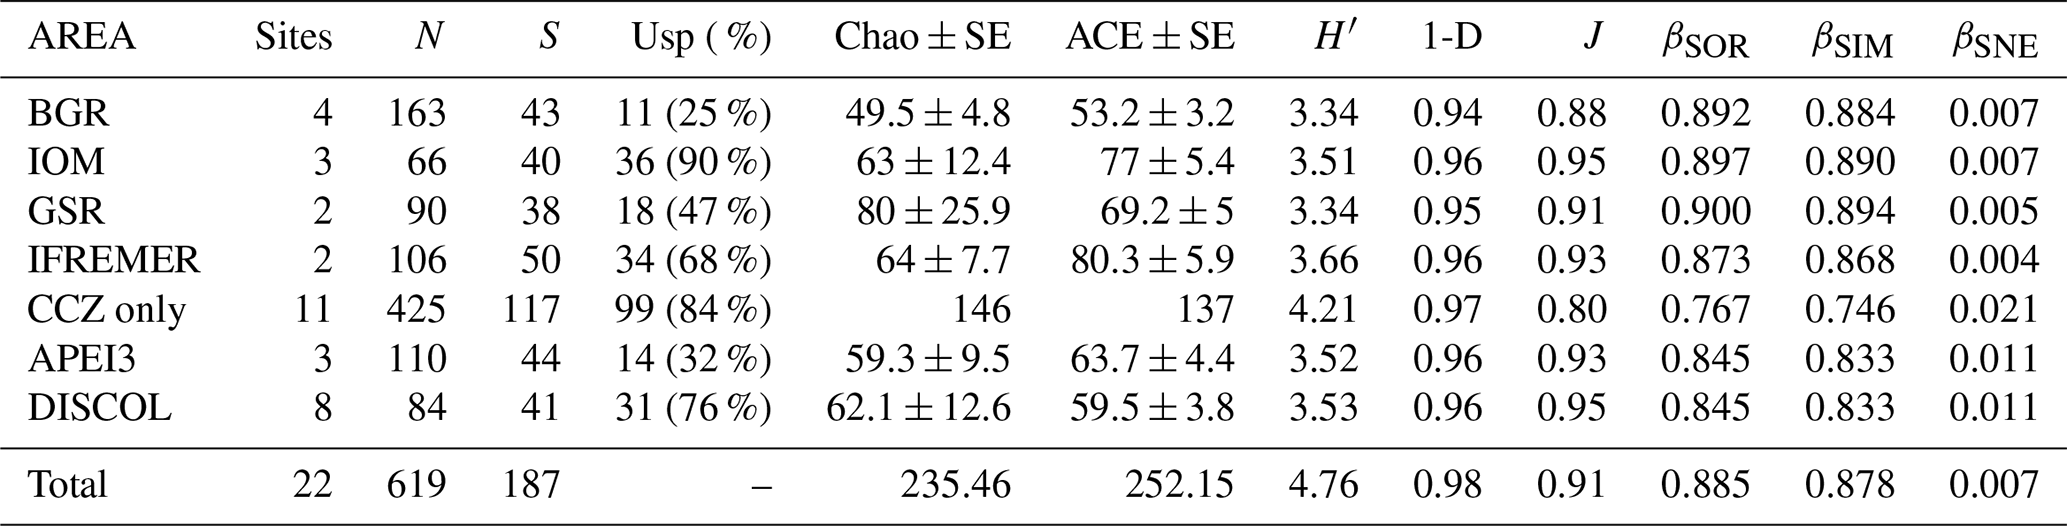
Table 1Summary of diversity parameters per sampled area. “Sites” signifies number of epibenthic sledge deployments, N signifies number of specimens, S signifies number of species, “Usp” signifies number of unique species, Chao ± SE signifies Chao estimated number of species with standard error, ACE ± SE signifies ACE estimated number of species with standard error, H′ signifies Shannon diversity, 1-D signifies Simpson's diversity, and J signifies Jaccard's evenness. βSOR, βSIM, and βSNE express multiple-site total beta diversity, multiple-site species turnover, and multiple-site nestedness, respectively. Note that in the rows of each area, the beta-diversity values are the result of excluding this area except for the rows “Total” (which includes all areas) and “CCZ only” (which includes all but APEI3 and DISCOL).
2.3 Molecular methods
We carried out a molecular analysis of two mitochondrial DNA markers (COI and 16S) backed up by morphological determinations to delineate species in an integrative approach. Based on this species delimitation, we compared species richness and the community composition of the different areas (APEI vs. contractor areas vs. DISCOL). A fragment of the mitochondrial gene COI was amplified and sequenced using the primers jgHCO2198 and jgLCO1490 (Geller et al., 2013) following the protocol of Riehl et al. (2014). Ribosomal 16S sequences were amplified and sequenced using the primers 16Sar and 16Sbr (Palumbi, 1991). The sequences were processed using Geneious 11.1.3 and compared against the GenBank nucleotide database. Sequences were aligned using MAAFT 7.388 (Katoh and Standley, 2013) implemented within Geneious version 10.1.3. COI sequences were translated into amino-acid sequences within Geneious and checked for stop codons to prevent the inclusion of pseudogenes (Buhay, 2009). COI and 16S datasets were used individually for vectorized search (VSEARCH) and automatic barcode gap discovery (ABGD) species delimitation analyses and were used both individually and concatenated as a single mitochondrial dataset for phylogenetic tree reconstruction and Poisson tree process/multi-rate Poisson tree process (PTP/mPTP) species delimitation analyses. Tree estimations for each family were run in RAxML (Katoh and Standley, 2013) using the GTRGAMMA model and 1000 bootstrap replicates.
Outgroups for each family tree consisted of the following. The Macrostylidae tree includes Thaumastosoma diva KY951731, Thaumastosoma platycarpus IDesm10, Ketosoma vemae VTDes013 (16S only), KM14-Iso261 Ketosoma sp. 2, KY951731, and Ketosoma hessleri KY951729. The Haploniscidae tree includes Ianiropsis epilittoralis AF260835, AF260836, AF260858, and AF260859. The Desmosomatids tree includes Betamorpha fusiformis EF116524, EF116525, EF116527, EF116528, and Betamorpha africana EF682292. The Munnopsidae tree includes Thaumastosoma platycarpus IDesm10, Ketosoma vemae VTDes013, Ketosoma werneri D3D60 (COI only), and Thaumastosoma diva D3D64 (16S only). Outgroups were chosen based on the most recent evidence for likely sister groups and available sequences.
2.4 Molecular species delimitation
Multiple species delimitation methods were applied to the four datasets, and results varied based on the amount of within-clade sampling, occurrence of singletons, and within- and between-clade variation. VSEARCH (Rognes et al., 2016) applies a pairwise identity threshold and generates clusters of sequences that fall within a specified percent identity, thus assuming a barcode gap, though these can be hard to identify in some cases. VSEARCH was performed on individual genes without an outgroup. ABGD was performed through the online ABGD web server (http://wwwabi.snv.jussieu.fr/public/abgd/abgdweb.html, last access: 18 August 2018; X = 0.5) on COI and 16S alignments by family. ABGD was performed on uncorrected p distances using entire datasets under the assumption that the smallest gap in the pairwise distance histogram reflected the boundary between intraspecific variation (smaller values) and interspecific variation (larger values). Poisson tree processes (PTPs) and multi-rate PTPs were run using the stand-alone mPTP software implementing single- and multi-switch commands on the fully bifurcated trees generated in this paper. Our data contained multiple individuals with the same haplotypes, but the replicate haplotypes can confound delimitation analyses and lead to over-splitting (Marki et al., 2018), so we calculated the minimum branch length for each sequence and used the minimum branch threshold option in order to ignore these replicate branches in subsequent PTP/mPTP analyses. Markov chain Monte Carlo (MCMC) analyses were run for 100 million generations, sampling every 10 000 and discarding the first 2 million generations as burn-in. Analyses were initiated using a random delimitation as the starting point. We ran three MCMC chains for each analysis and assessed chain convergence by checking average standard deviation of delimitation support values (ASDDSVs) across the three independent MCMC runs, accepting values near zero and below 0.05 as individual MCMC chains appearing to converge on the same distribution of delimitations (Ronquist et al., 2012; Kapli et al., 2017). We inspected the MCMC output trees and collapsed all putative species clades that had support below 0.70, which resulted in the number of supported clades being within the credible range of delimited species (CCI) and the range across CCI in which the probability is 0.95 (HPD). The maximum likelihood (ML) estimate, on the other hand, was not always within these intervals, meaning that this ML point estimate delimitation was not supported by MCMC analyses (the estimate may instead represent a local maximum or random solution derived across the ML likelihood surface) and demonstrating the importance of running MCMC analyses. Singletons greatly affected mPTP analyses but not PTP or ABGD; thus, singletons were removed from mPTP and retained for PTP and ABGD.
2.5 Isopod communities and diversity analyses
An analysis of community similarity between areas and their diversity was performed in R using the package “vegan” (Oksanen et al., 2008). The sampling effort, expressed as the number of EBS deployments per area, was uneven, ranging from two to eight deployments per sampling area; therefore, the similarity between communities was done using relative abundance (chord distance; see Legendre and Gallagher, 2001) and “presence–absence” to explore faunistic differences. Ordination was done using non-metric multidimensional scaling (nMDS). The community table (Table S2) shows the number of specimens from each species found and adds up all EBS samples for a given area. As the number of specimens found differs between areas, a diversity comparison was achieved using rarefaction curves, together with the standard diversity indices Shannon, Simpson, and Jaccard's evenness. The expected number of species per area was inferred using extrapolation methods. Chao1 (Chao, 1994; Colwell and Coddington, 1994) uses the proportions of singletons and doubletons in the sample to estimate expected species richness, while ACE (Chazdon et al., 1998) is an abundance-based coverage estimator. For the analysis of beta (regional) diversity, the total multiple-site beta diversity βSOR was calculated using the modified Sørensen index (Sørensen, 1948; Balseaga and Orme, 2012), and βSOR was decomposed into its additive components “multiple-site species turnover” βSIM (Simpson Index, Simpson, 1943) and “multiple-site nestedness” βSNE using the R package betapart (Balseaga, 2010; Balseaga and Orme, 2012). In order to explore the relative contribution of every area to species turnover and nestedness, these values were calculated taking one area out each time in a jackknife approach. Changes in turnover and nestedness are then attributable to the area excluded from the analysis. UpSet plots were done using the R package UpSetR (Conway et al., 2017).
3.1 Species delimitation
All isopod families were reciprocally monophyletic (Figs. 3–6). As expected with fast-evolving genes such as COI and 16S, good resolution was given at the tips of the tree and for the most recent relationships, such as species and sometimes even generic levels; however, no resolution of relationships deeper in the trees was obtained. Given that the research question here is one of species delimitation, we did not attempt to find markers that would resolve deeper nodes in the trees.
It is notable that the percentage of species new to science was quite high, reaching 94.1 % in our dataset. Of the 10 described species, five were either described in the course of the JPIO sampling campaign or other CCZ and DISCOL collections (Malyutina and Wägele, 2001; Malyutina, 2011; Malyutina et al., 2020; Riehl and De Smet, 2020). The remaining species, all belonging to the Munnopsidae, appear to have wide (pan-oceanic) distributions.
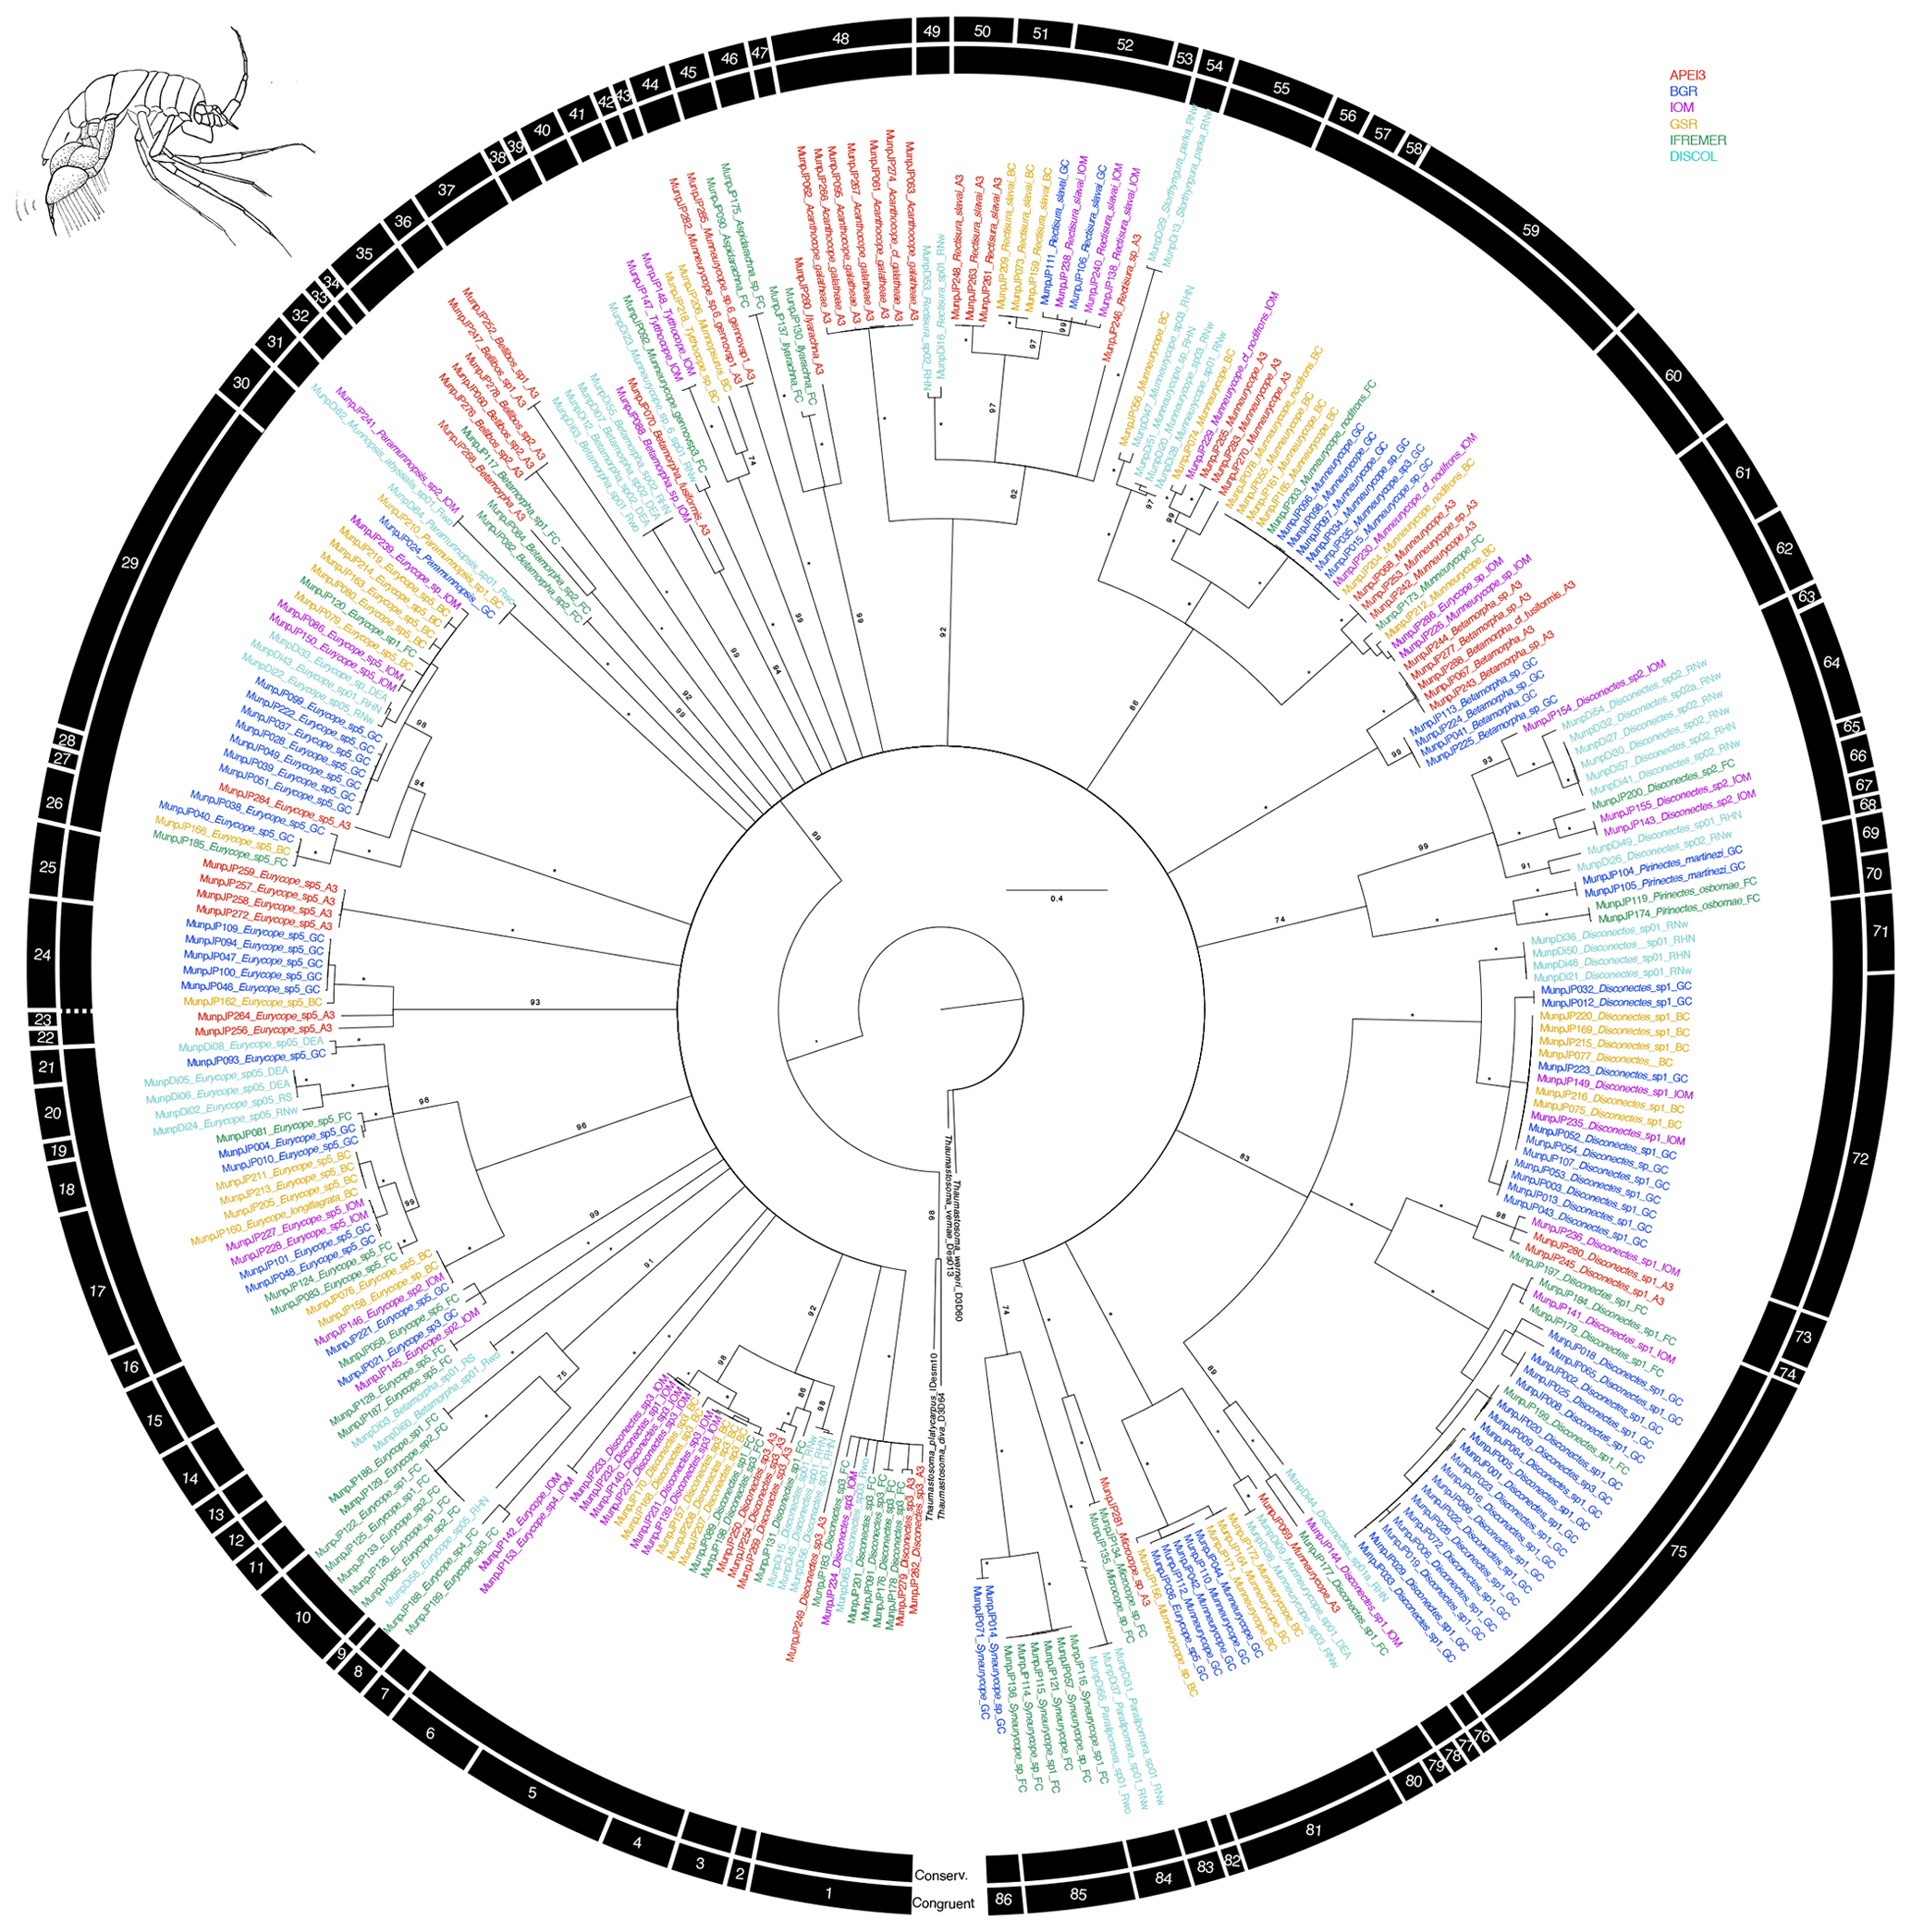
Figure 3Phylogenetic tree of all munnopsid samples based on 16S and COI sequences for 294 specimens. Colors indicate collection location with black indicating outgroups. All unsupported branches were collapsed, and bootstrap support is indicated with asterisks indicating 100 % bootstrap support. The outer two bars summarize the results of the species delimitation analyses which included morphological determination, VSEARCH for individual genes, ABGD for individual genes, and PTP and mPTP for both individual genes and the concatenated datasets. The conservative bar indicates that all SD analyses supported that split, while the congruent bar indicates that the majority of SD analyses showed that split. Numbers on congruent bars are arbitrary and are provided to allow a way to refer to specific supported clades.
The congruent species delimitation resulted in 86 munnopsid species operational taxonomic units (OTUs) (Table S1, Fig. 3). Putative species clade definition based on genetic data suggested there was substantial cryptic diversity within the Munnopsidae. Specimens identified as being Disconectes belonged to 14 different putative species, and those putative species formed seven higher level clades. Specimens identified as being part of the “catch-all” genus Eurycope belonged to 22 different putative species, and those putative species formed nine higher level clades. One putative Paramunnopsis species was collected from three different regions, while another was collected from two different regions and was found to be within the same putative species clade as a specimen identified as Munnopsis abyssalis. Of the six putative Betamorpha species, four were singletons and one contained specimens collected from three different regions. All collected Bellibos, belonging to two putative species, were collected from a single region.
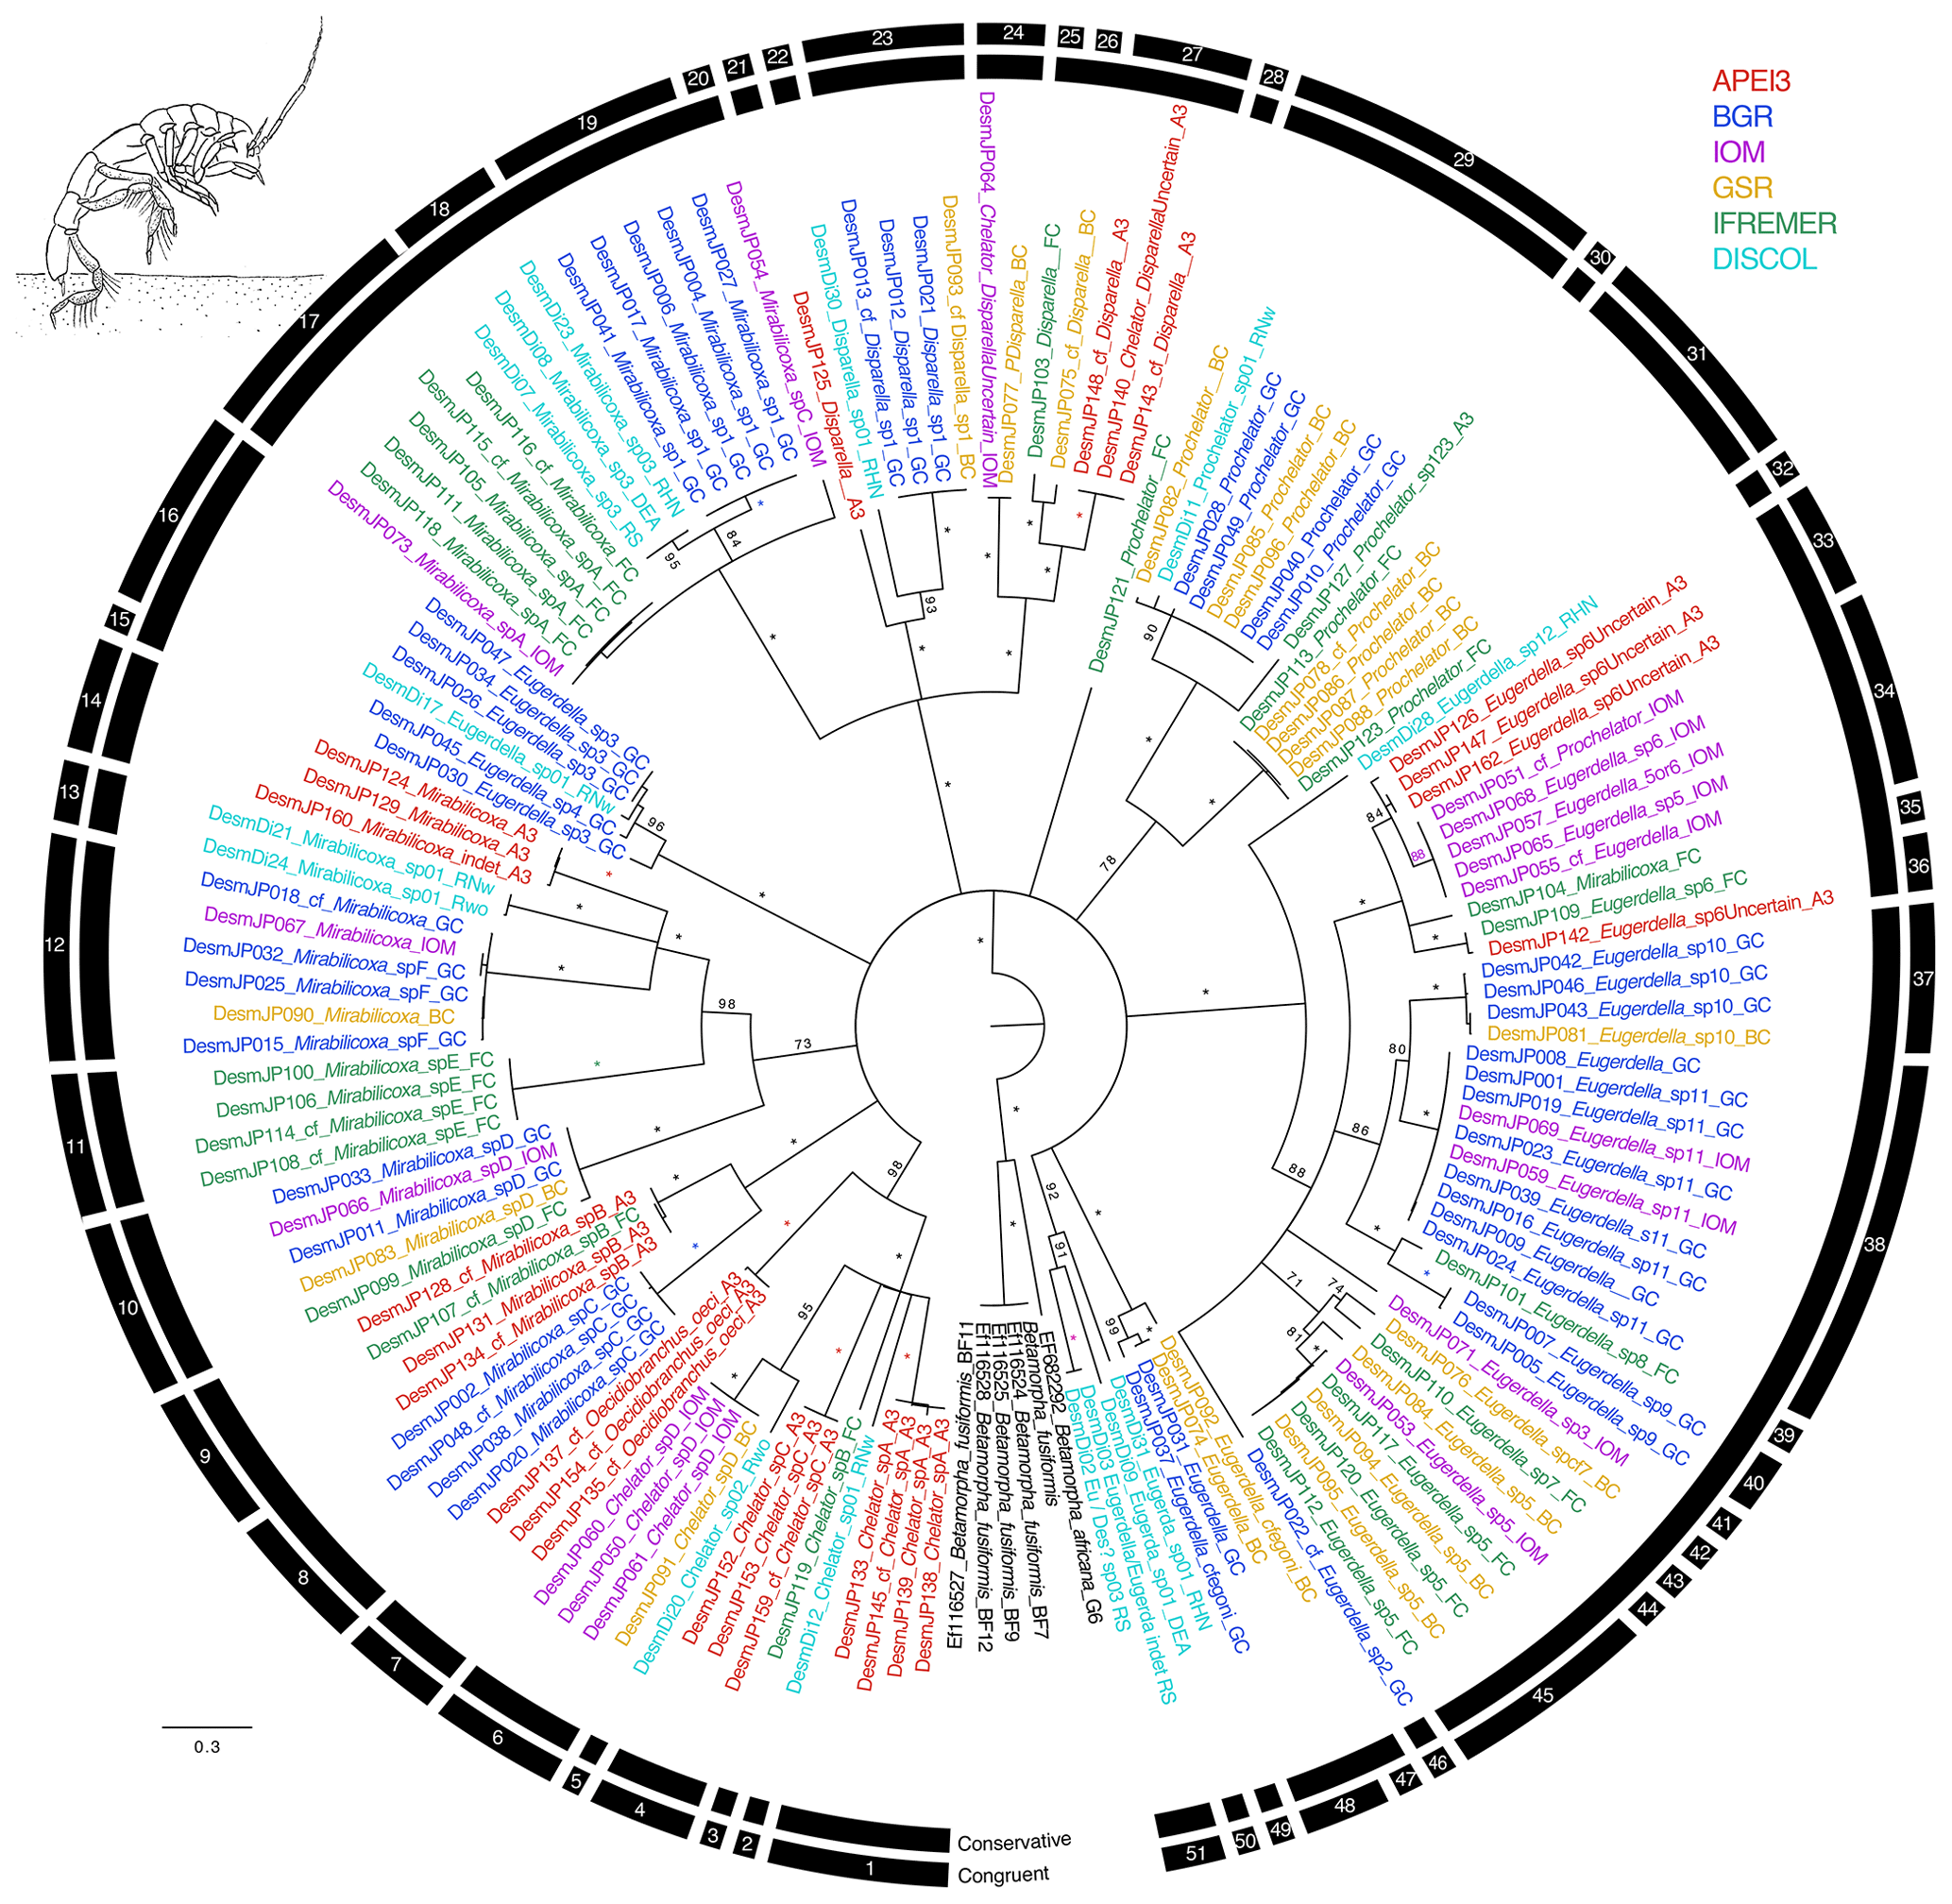
Figure 4Phylogenetic tree of all desmosomatid samples based on 16S and COI sequences for 143 specimens. Colors indicate collection location with black indicating outgroups. All unsupported branches were collapsed, and bootstrap support is indicated with asterisks indicating 100 % bootstrap support. The outer two bars summarize the results of the species delimitation analyses which included morphological determination, VSEARCH for individual genes, ABGD for individual genes, and PTP and mPTP for both individual genes and the concatenated datasets. The conservative bar indicates that all SD analyses supported that split, while the congruent bar indicates that the majority of SD analyses showed that split. Numbers on congruent bars are arbitrary and are provided to allow a way to refer to specific supported clades.
The congruent species delimitation resulted in 52 desmosomatid species OTUs (Table S1, Fig. 4). The genera Chelator Hessler, 1970 (6 spp.), Oecidiobranchus Hessler, 1970 (1 sp.), Mirabilicoxa Hessler, 1970 (12 spp.), Eugerdella Kussakin, 1965 (18 spp.), Disparella Hessler, 1970 (5 spp.), Prochelator Hessler, 1970 (4 spp.), and Eugerda Meinert, 1895 (3 spp.) were present in our dataset. Genetically defined clade composition closely mirrored the morphological identification (Fig. 4).
The congruent species delimitation resulted in 23 haploniscid species OTUs (Table S1, Fig. 5), which are all new to science. The clades represent the genera Mastigoniscus (9 spp.), Haploniscus (9 spp.), and Chauliodoniscus (5 spp.).
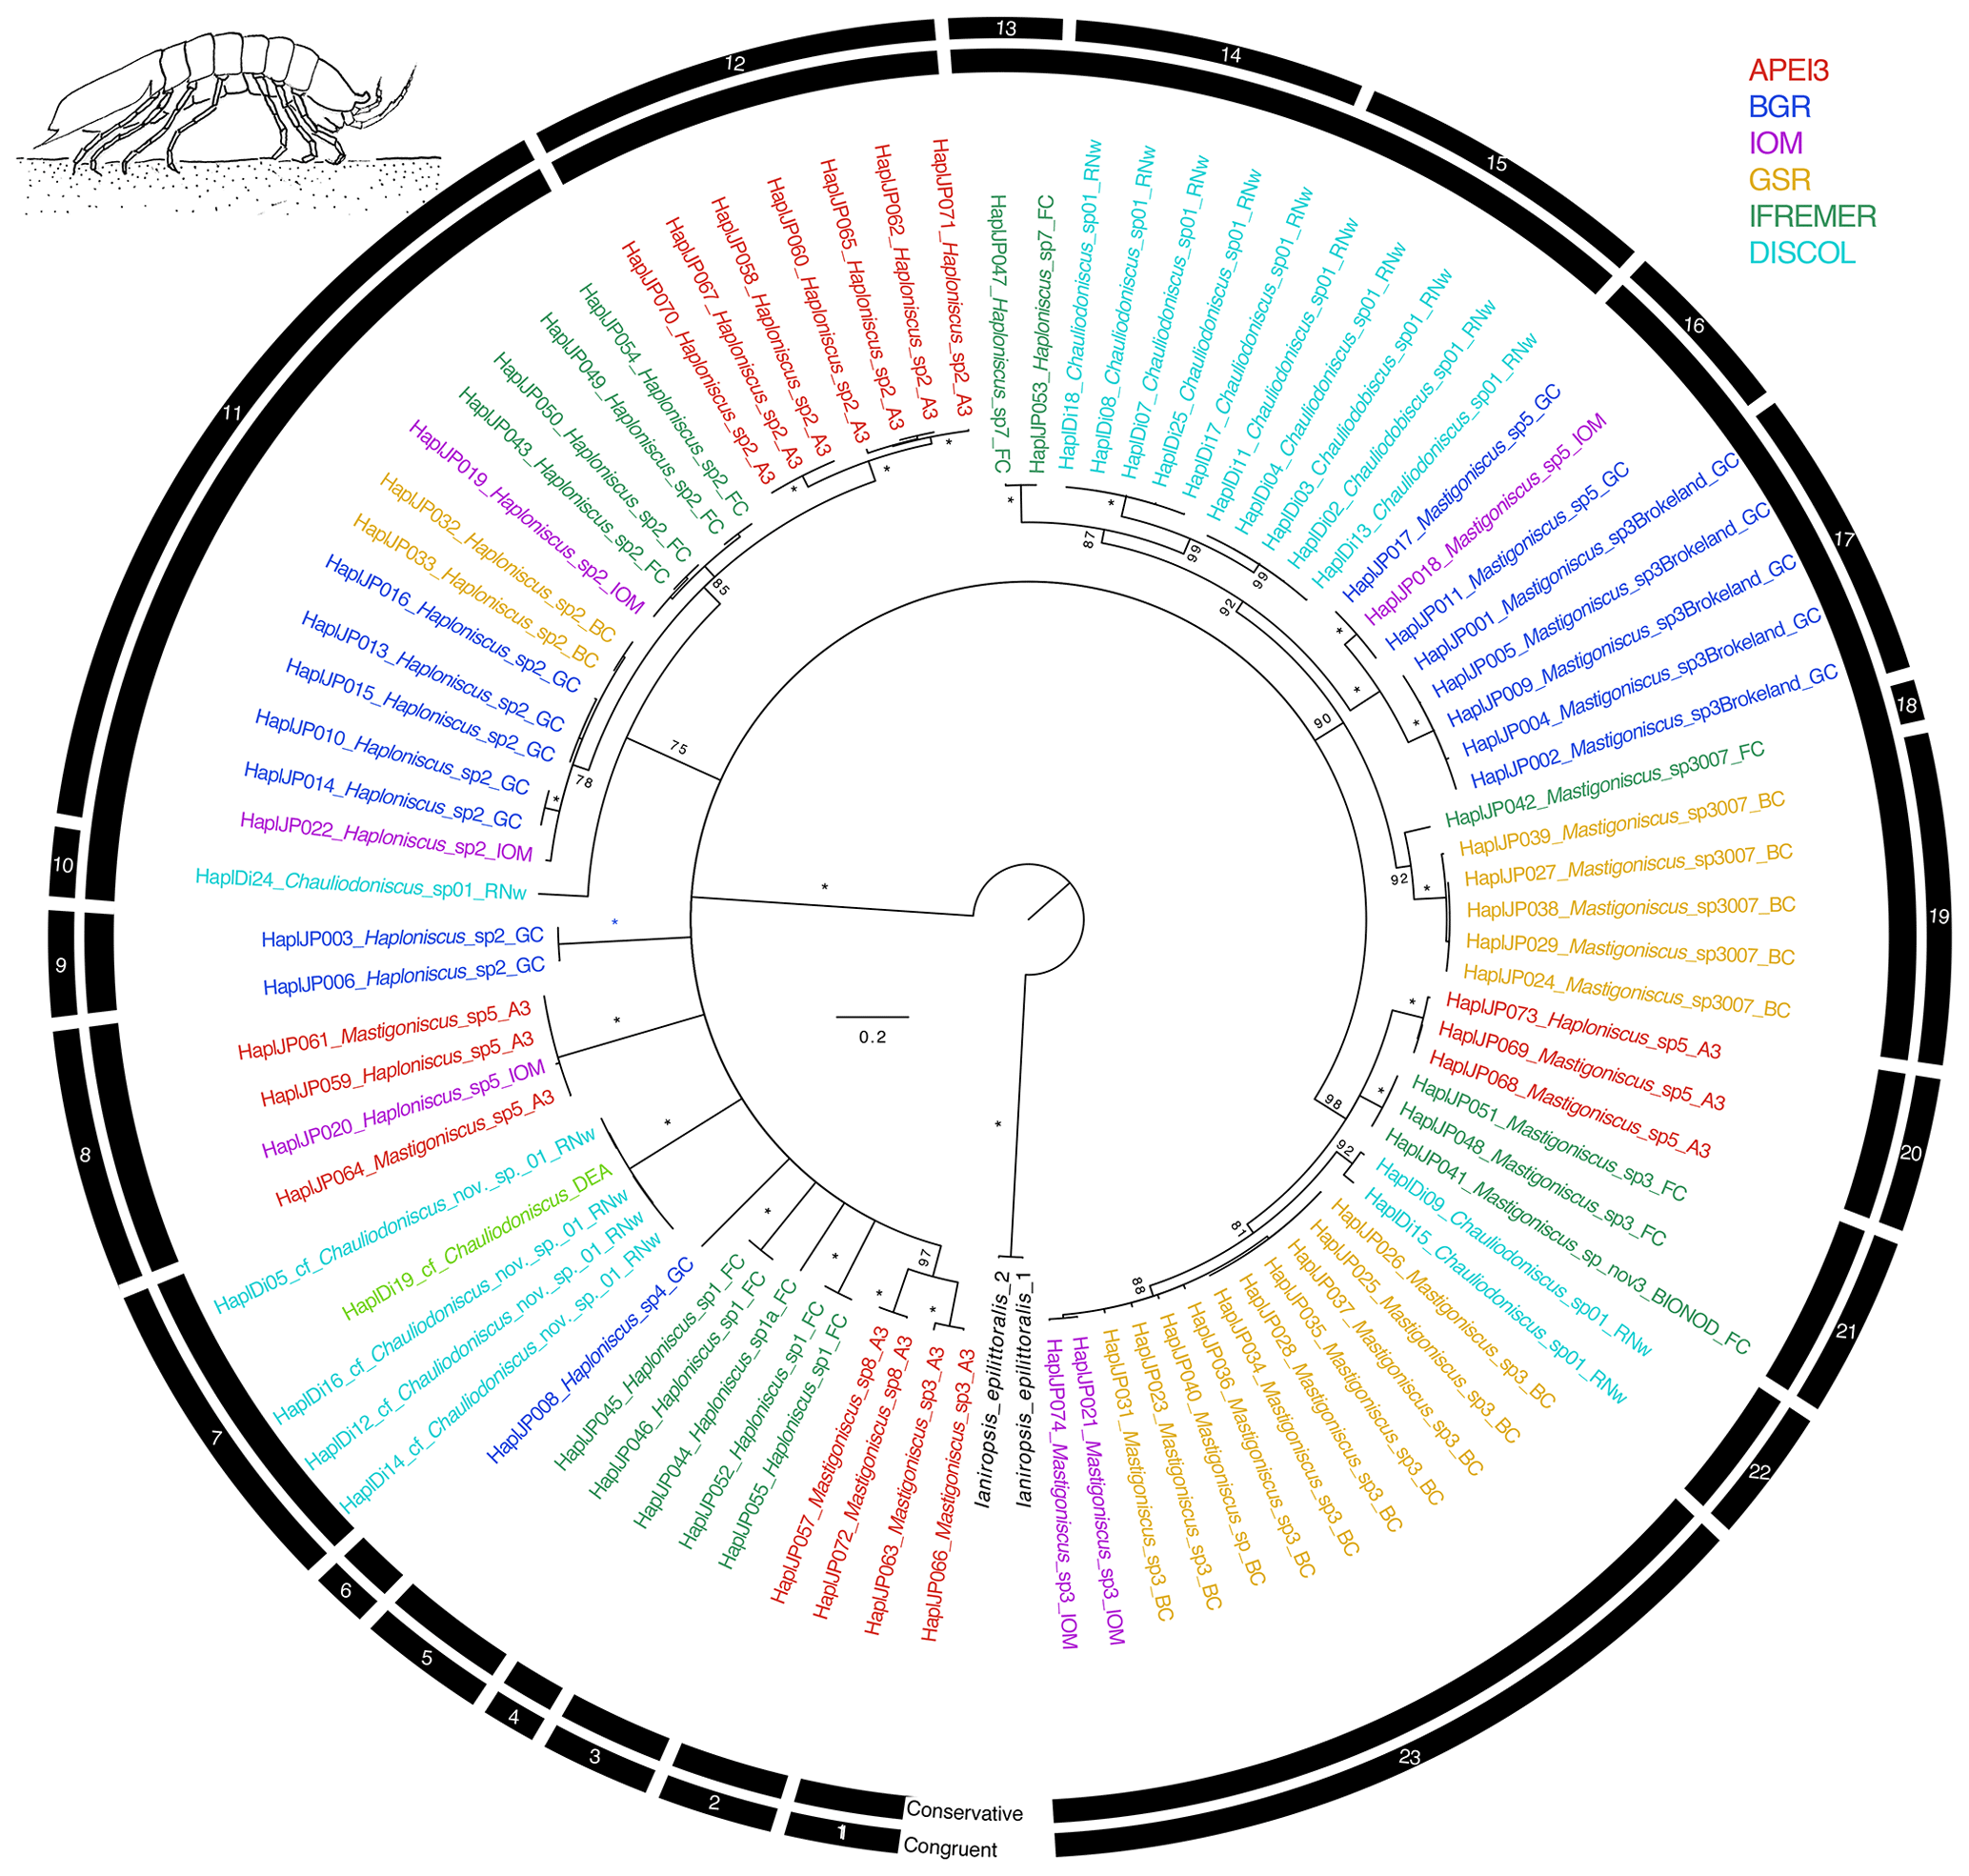
Figure 5Phylogenetic tree of all haploniscid samples based on 16S and COI sequences for 88 specimens. Colors indicate collection location with black indicating outgroups. All unsupported branches were collapsed, and bootstrap support is indicated with asterisks indicating 100 % bootstrap support. The outer two bars summarize the results of the species delimitation analyses which included morphological determination, VSEARCH for individual genes, ABGD for individual genes, and PTP and mPTP for both individual genes and the concatenated datasets. The conservative bar indicates that all SD analyses supported that split, while the congruent bar indicates that the majority of SD analyses showed that split. Numbers on congruent bars are arbitrary and are provided to allow a way to refer to specific supported clades.
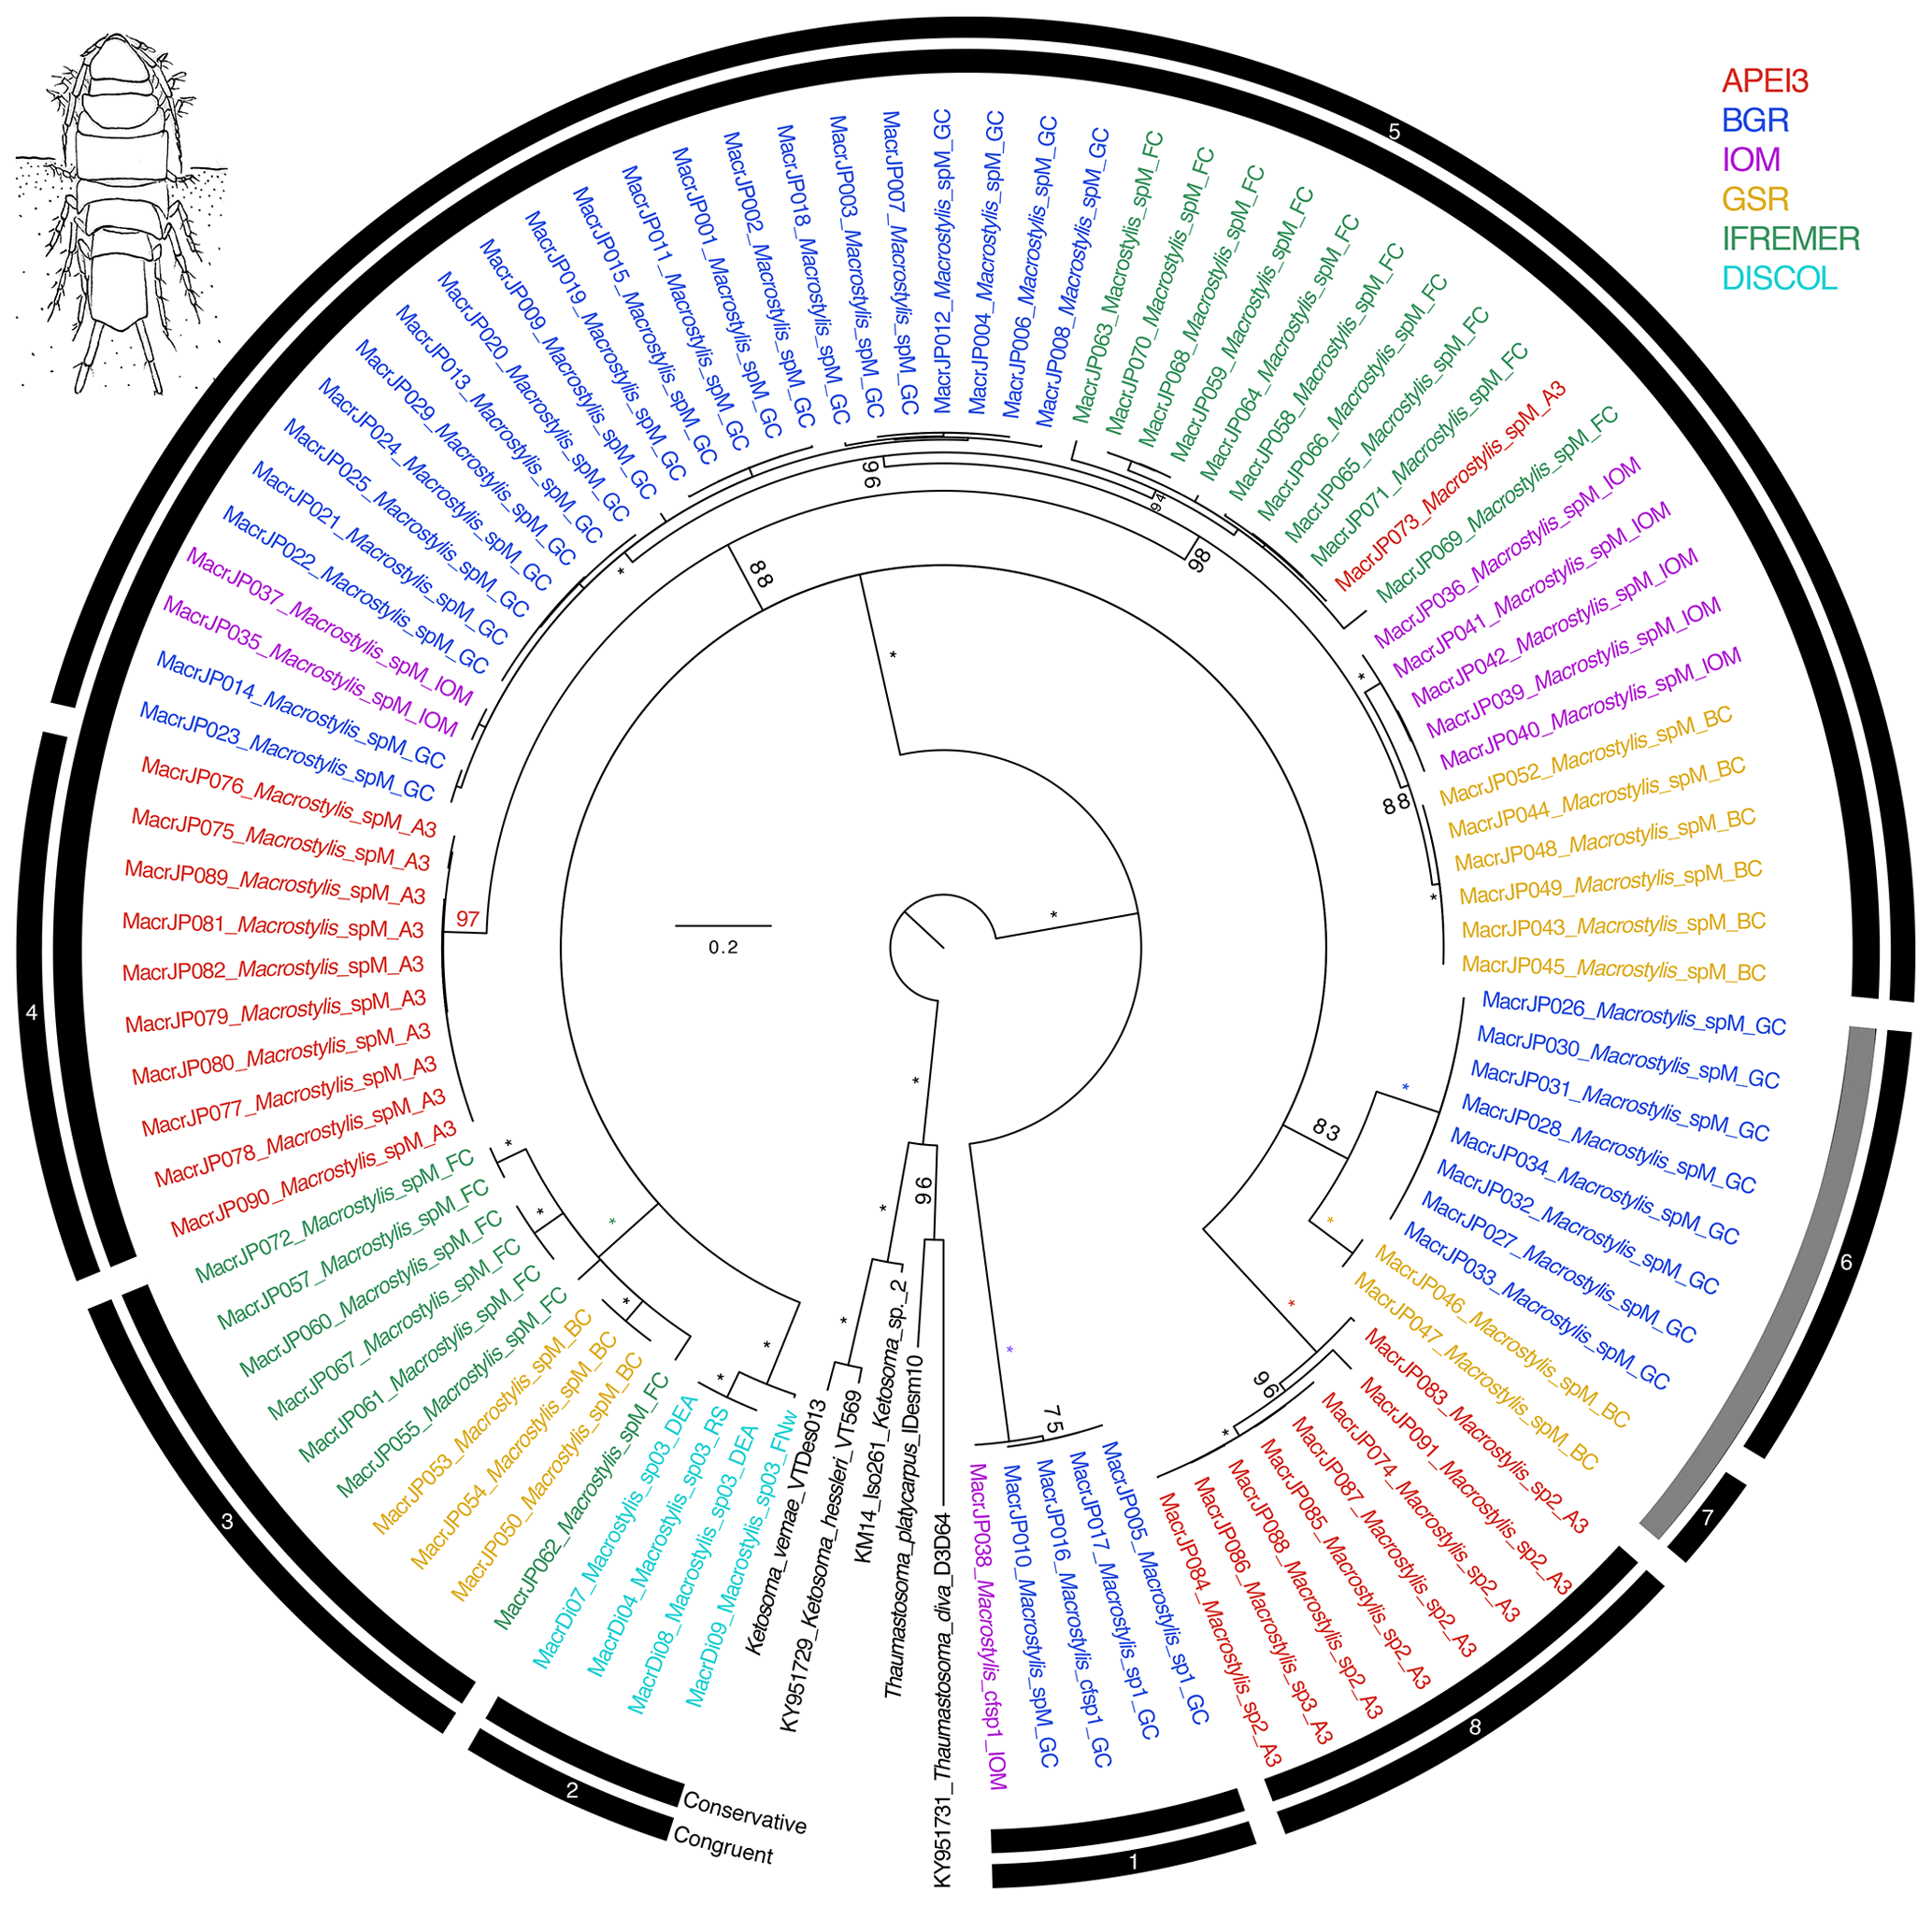
Figure 6Phylogenetic tree of all macrostylid samples based on 16S and COI sequences for 94 specimens. Colors indicate collection location with black indicating outgroups. All unsupported branches were collapsed, and bootstrap support is indicated with asterisks indicating 100 % bootstrap support. The outer two bars summarize the results of the species delimitation analyses which included morphological determination, VSEARCH for individual genes, ABGD for individual genes, and PTP and mPTP for both individual genes and the concatenated datasets. The conservative bar indicates that all SD analyses supported that split, while the congruent bar indicates that the majority of SD analyses showed that split. Numbers on congruent bars are arbitrary and are provided to allow a way to refer to specific supported clades.
The congruent species delimitation resulted in nine macrostylid species in this monogeneric family (Table S1, Fig. 6). Putative species Macrostylis sp. 1, collected both from the GC area and adjacent to the IOM area, was strongly supported as being a sister to the rest of the available macrostylids. The remainder of the macrostylids formed a single clade that was differentiated into seven individual putative species clades (Fig. 6). Only two of these putative species clades can be easily distinguished from the others based on morphology, while the rest have yet to have morphological apomorphies identified for them. All eight putative species clades were supported by a minimum bootstrap value of 97 % in the maximum-likelihood-based phylogenetic estimations. These nine species are the same that were stable across both COI/16S species delimitation analyses (details for species delimitation analyses comparing methods and challenges with each family's dataset are available on request to the authors – contact: Karen J. Osborn – and will be published as a methods paper separately). It may be possible with additional sampling to separate the putative species further, but based on this dataset, there was not consistent evidence for further splitting, so we chose to be conservative with regard to splitting putative species. Four species clades were geographically isolated within a single CCZ region (Fig. 6; clades 4, 6, 7, and 8), while the rest contained members from two to five regions. There was a genetic signal that suggested genetic differentiation between regions within the largest putative species clade with representatives collected from five regions, but this differentiation, or perhaps our sample size, was not sufficient to support further species level splits.
3.2 Diversity comparison by family
The dataset comprised 619 specimens belonging to 170 putative genetic species (= OTUs) (Table S1). Munnopsidae was represented in the whole dataset by 294 specimens (199 in CCZ) belonging to 86 species (71 in CCZ, 20 in DISCOL). Desmosomatidae was represented by 143 specimens (103 in CCZ) belonging to 52 species (42 in CCZ, 11 in DISCOL). Haploniscidae was represented by 88 specimens (53 in CCZ) belonging to 23 species (18 in CCZ, five in DISCOL). Macrostylidae was represented by 94 specimens (70 in CCZ) belonging to only nine species (seven in CCZ, two in DISCOL) (Table 3).
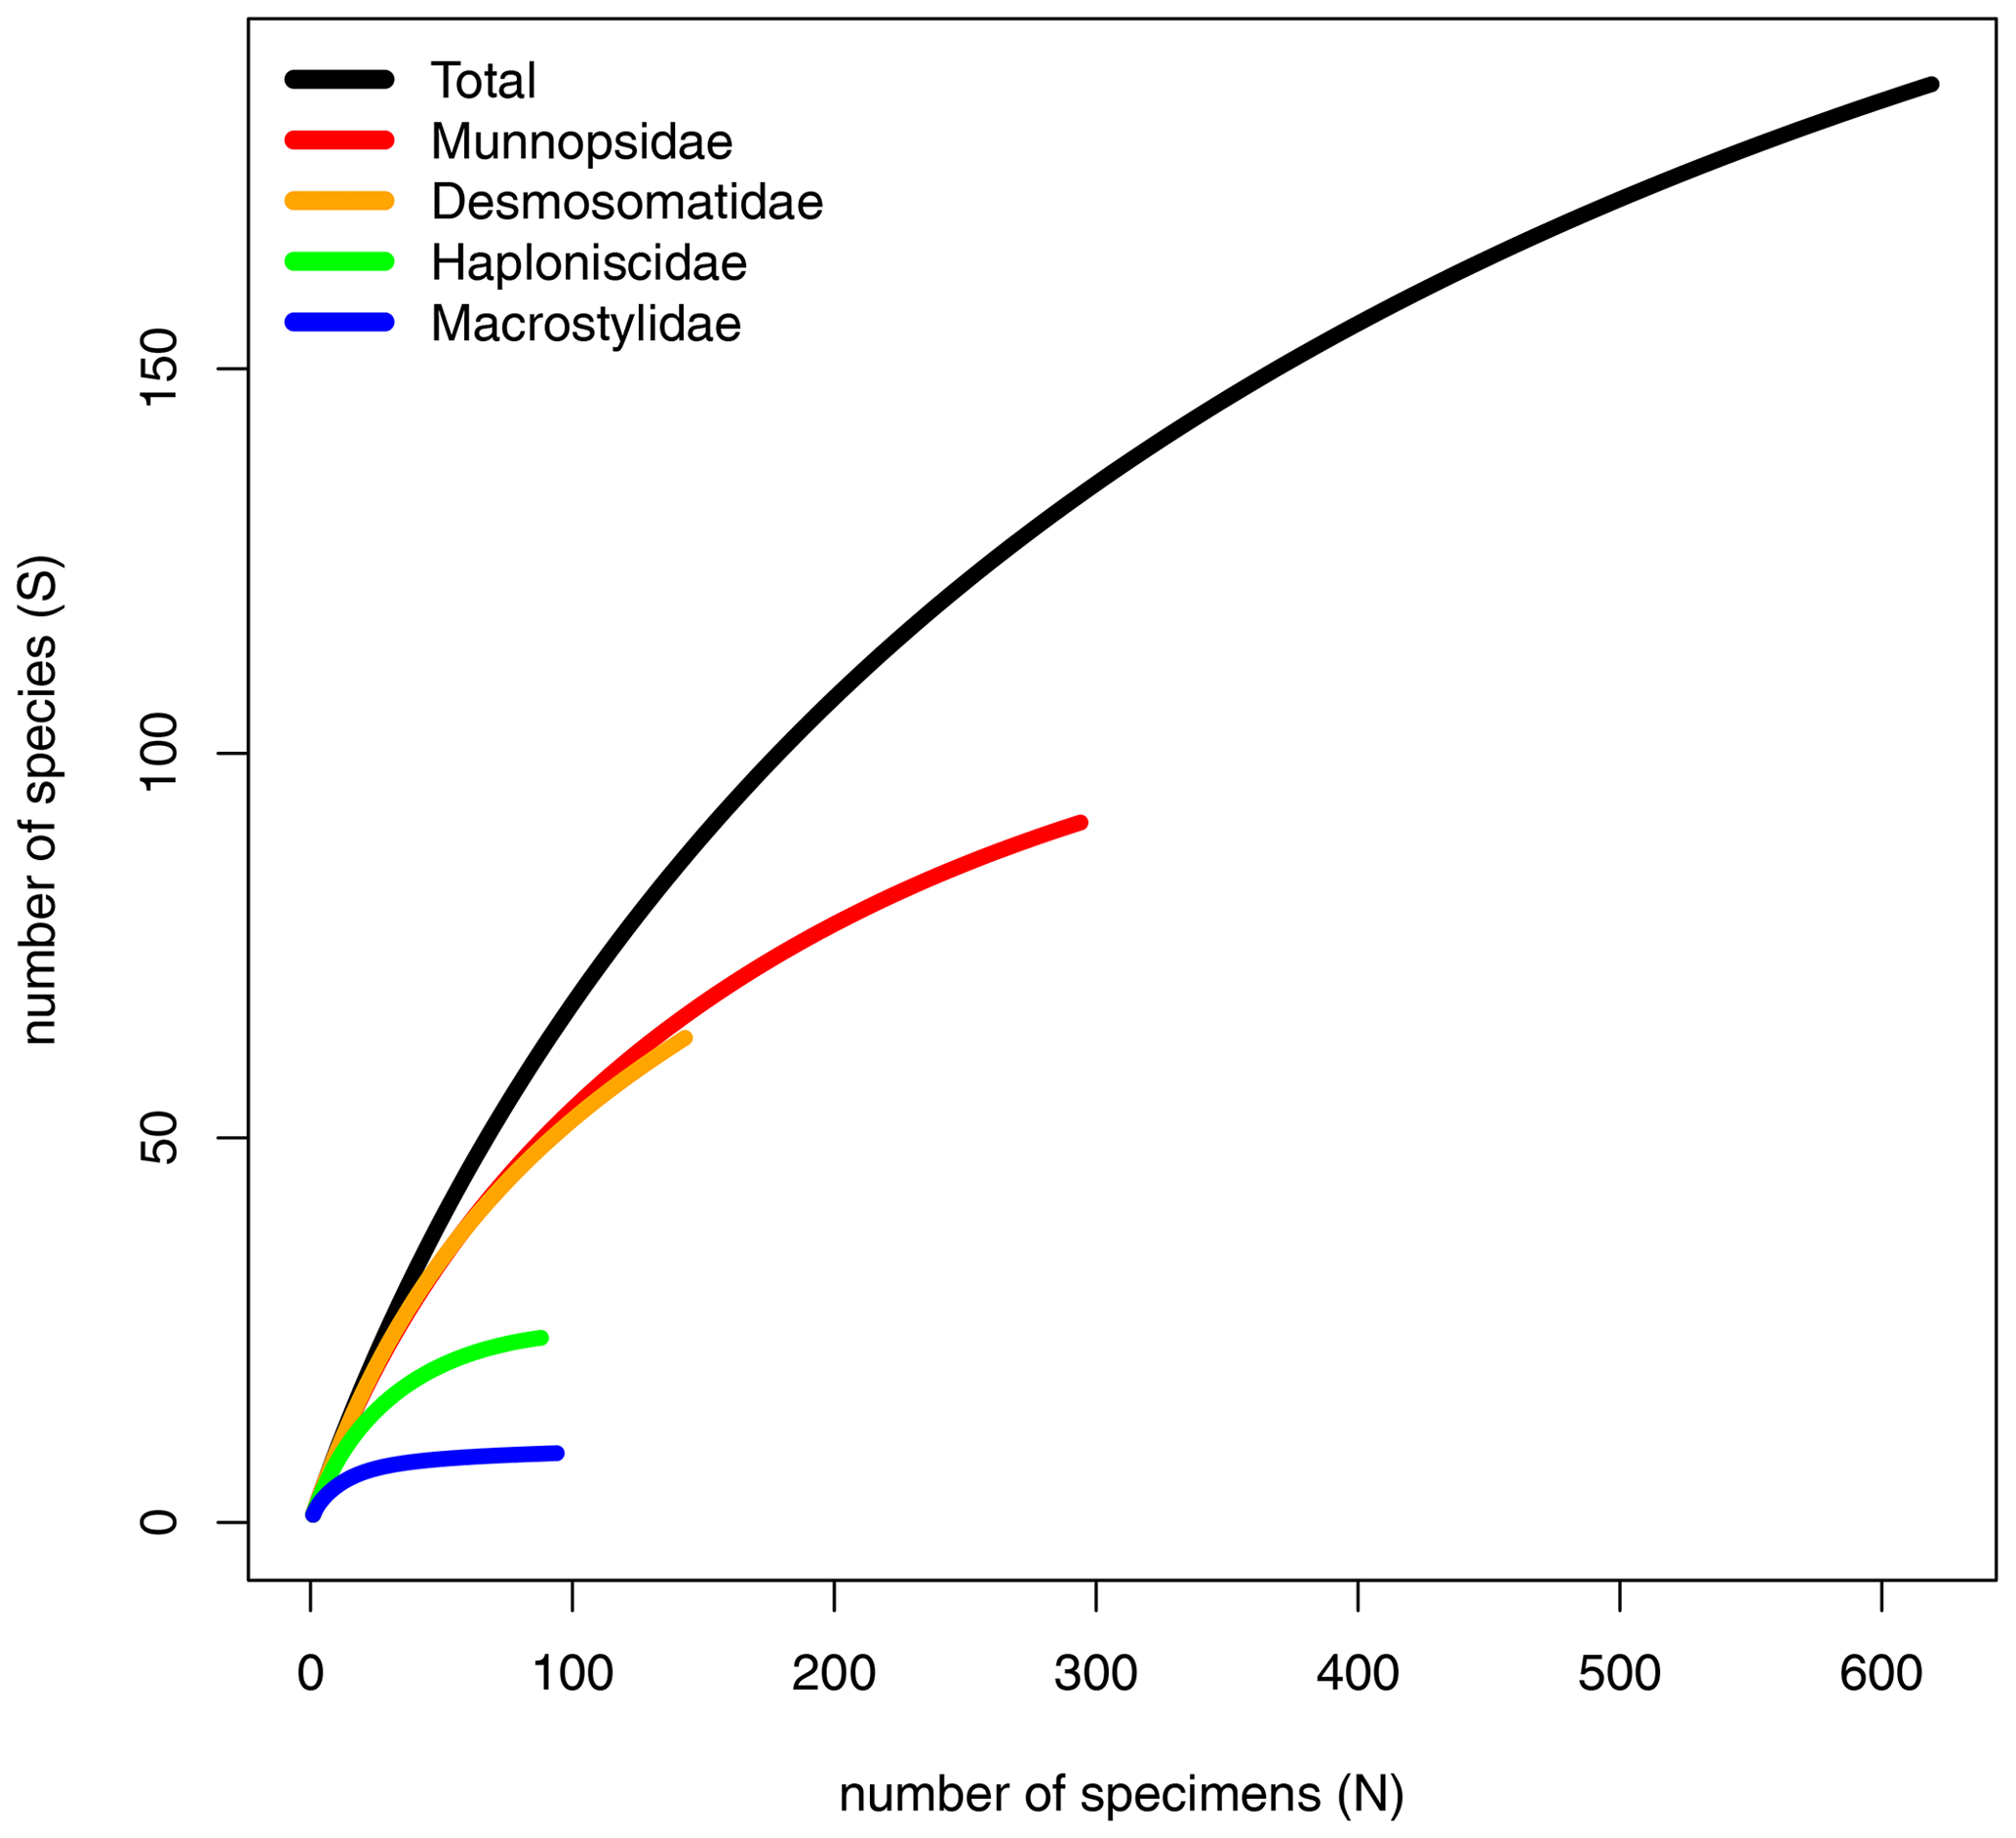
The rarefaction curves of the Munnopsidae and Desmosomatidae showed no signs of saturation (Fig. 7). This is supported by Chao1, which predicted the expected number of Munnopsidae and Desmosomatidae species to be 110 and 98, respectively (Table 3). In contrast, the curves of Haploniscidae and Macrostylidae approached saturation, a state also indicated by the predicted number of species by Chao1, which suggested that no additional (unseen) species of Haploniscidae and Macrostylidae were expected in the present dataset (Fig. 7, Table 3).
Total beta diversity (βSOR) and species turnover (βSIM) increased in this sequence: Munnopsidae (βSOR = 0.873; βSIM = 0.860), Desmosomatidae (βSOR = 0.904; βSIM = 0.895), and Haploniscidae (βSOR = 0.916; βSIM = 0.898; Table 3). This pattern was not evident when comparing sites within the CCZ (Table 3). Macrostylidae had lower beta diversity and species turnover (βSOR = 0.809; βSIM = 0.777) mainly due to a single species that shows a large distribution range (see Discussion).
3.3 Community and diversity comparison by area
In total, we examined 22 EBS deployments taken from six abyssal areas. Sampling effort was uneven between sampling sites with most samples taken in the DISCOL area of the Peru Basin (eight). For all other areas, two to four sites were sampled. None of the 170 species were recorded in all six areas. The most common species was Macrostylis_M05 with 46 specimens and was present in all areas besides DISCOL. Other species (see Supplement 1) with 10 or more specimens were the munnopsids Disconectes_Mu11 (22 specimens), Eurycope_ Mu37, Disconectes_Mu08 (both with 18 specimens), and Munneurycope_Mu67 (13 specimens); the haploniscids Haploniscus_H10 (13 specimens) and Mastigoniscus_H22 (with 12 specimens); the desmosomatid Eugerdella_D39 (with 10 specimens); and the macrostylids Macrostylis_M03 and Macrostylis_M04 (with 10 specimens each). The remaining 177 species had less than 10 specimens, and 68 species were represented by singletons.
The total number of species found was relatively similar between sites, ranging from 38 (GSR) to 50 species (IFREMER). Remarkably the number of species correlates neither with the number of specimens (Pearson correlation 0.34, p=0.49) nor with the number of sampling sites per area (Pearson correlation −0.02, p=0.95). IOM supported the highest number of unique species (species recorded only in one area) with 36 species (90 % of the species present in the area were unique), followed by DISCOL (31 species, 76 % unique) and FC (IFREMER; 34 species 68 % unique). All other areas had less unique species. The extrapolated number of species present per area ranged between 49 (GC: BGR) and 80 (BC: GSR) according to Chao1 and between 53 (GC: BGR) and 80 (FC: IFREMER) according to ACE; Chao1 and ACE predicted between 50 % and 12 % of the species remain unrecorded. Diversity values (Shannon, Simpson, and Jaccard) were similarly high in all areas with the exception of low diversity values from the BGR area (evenness 0.88, Simpson 0.94, and Shannon 3.34).
Half of the EBS deployments (11) were in the core CCZ area (all areas excluding APEI3 and DISCOL), but these accounted for two-thirds of the specimens (425) and two-thirds of the species (117) recorded instead of the half that would be expected. A total of 99 species (84 % of all species) were found exclusively in the CCZ area. Chao1 and ACE predicted 137–146 species for the CCZ and 235–252 species for all areas together. Rarefaction analysis (Fig. 8) shows that all areas are similar in terms of species richness with the lowest curve at BGR (slightly lower diversity) and the highest at IOM. No curves show signs of having reached an asymptote (Fig. 8).
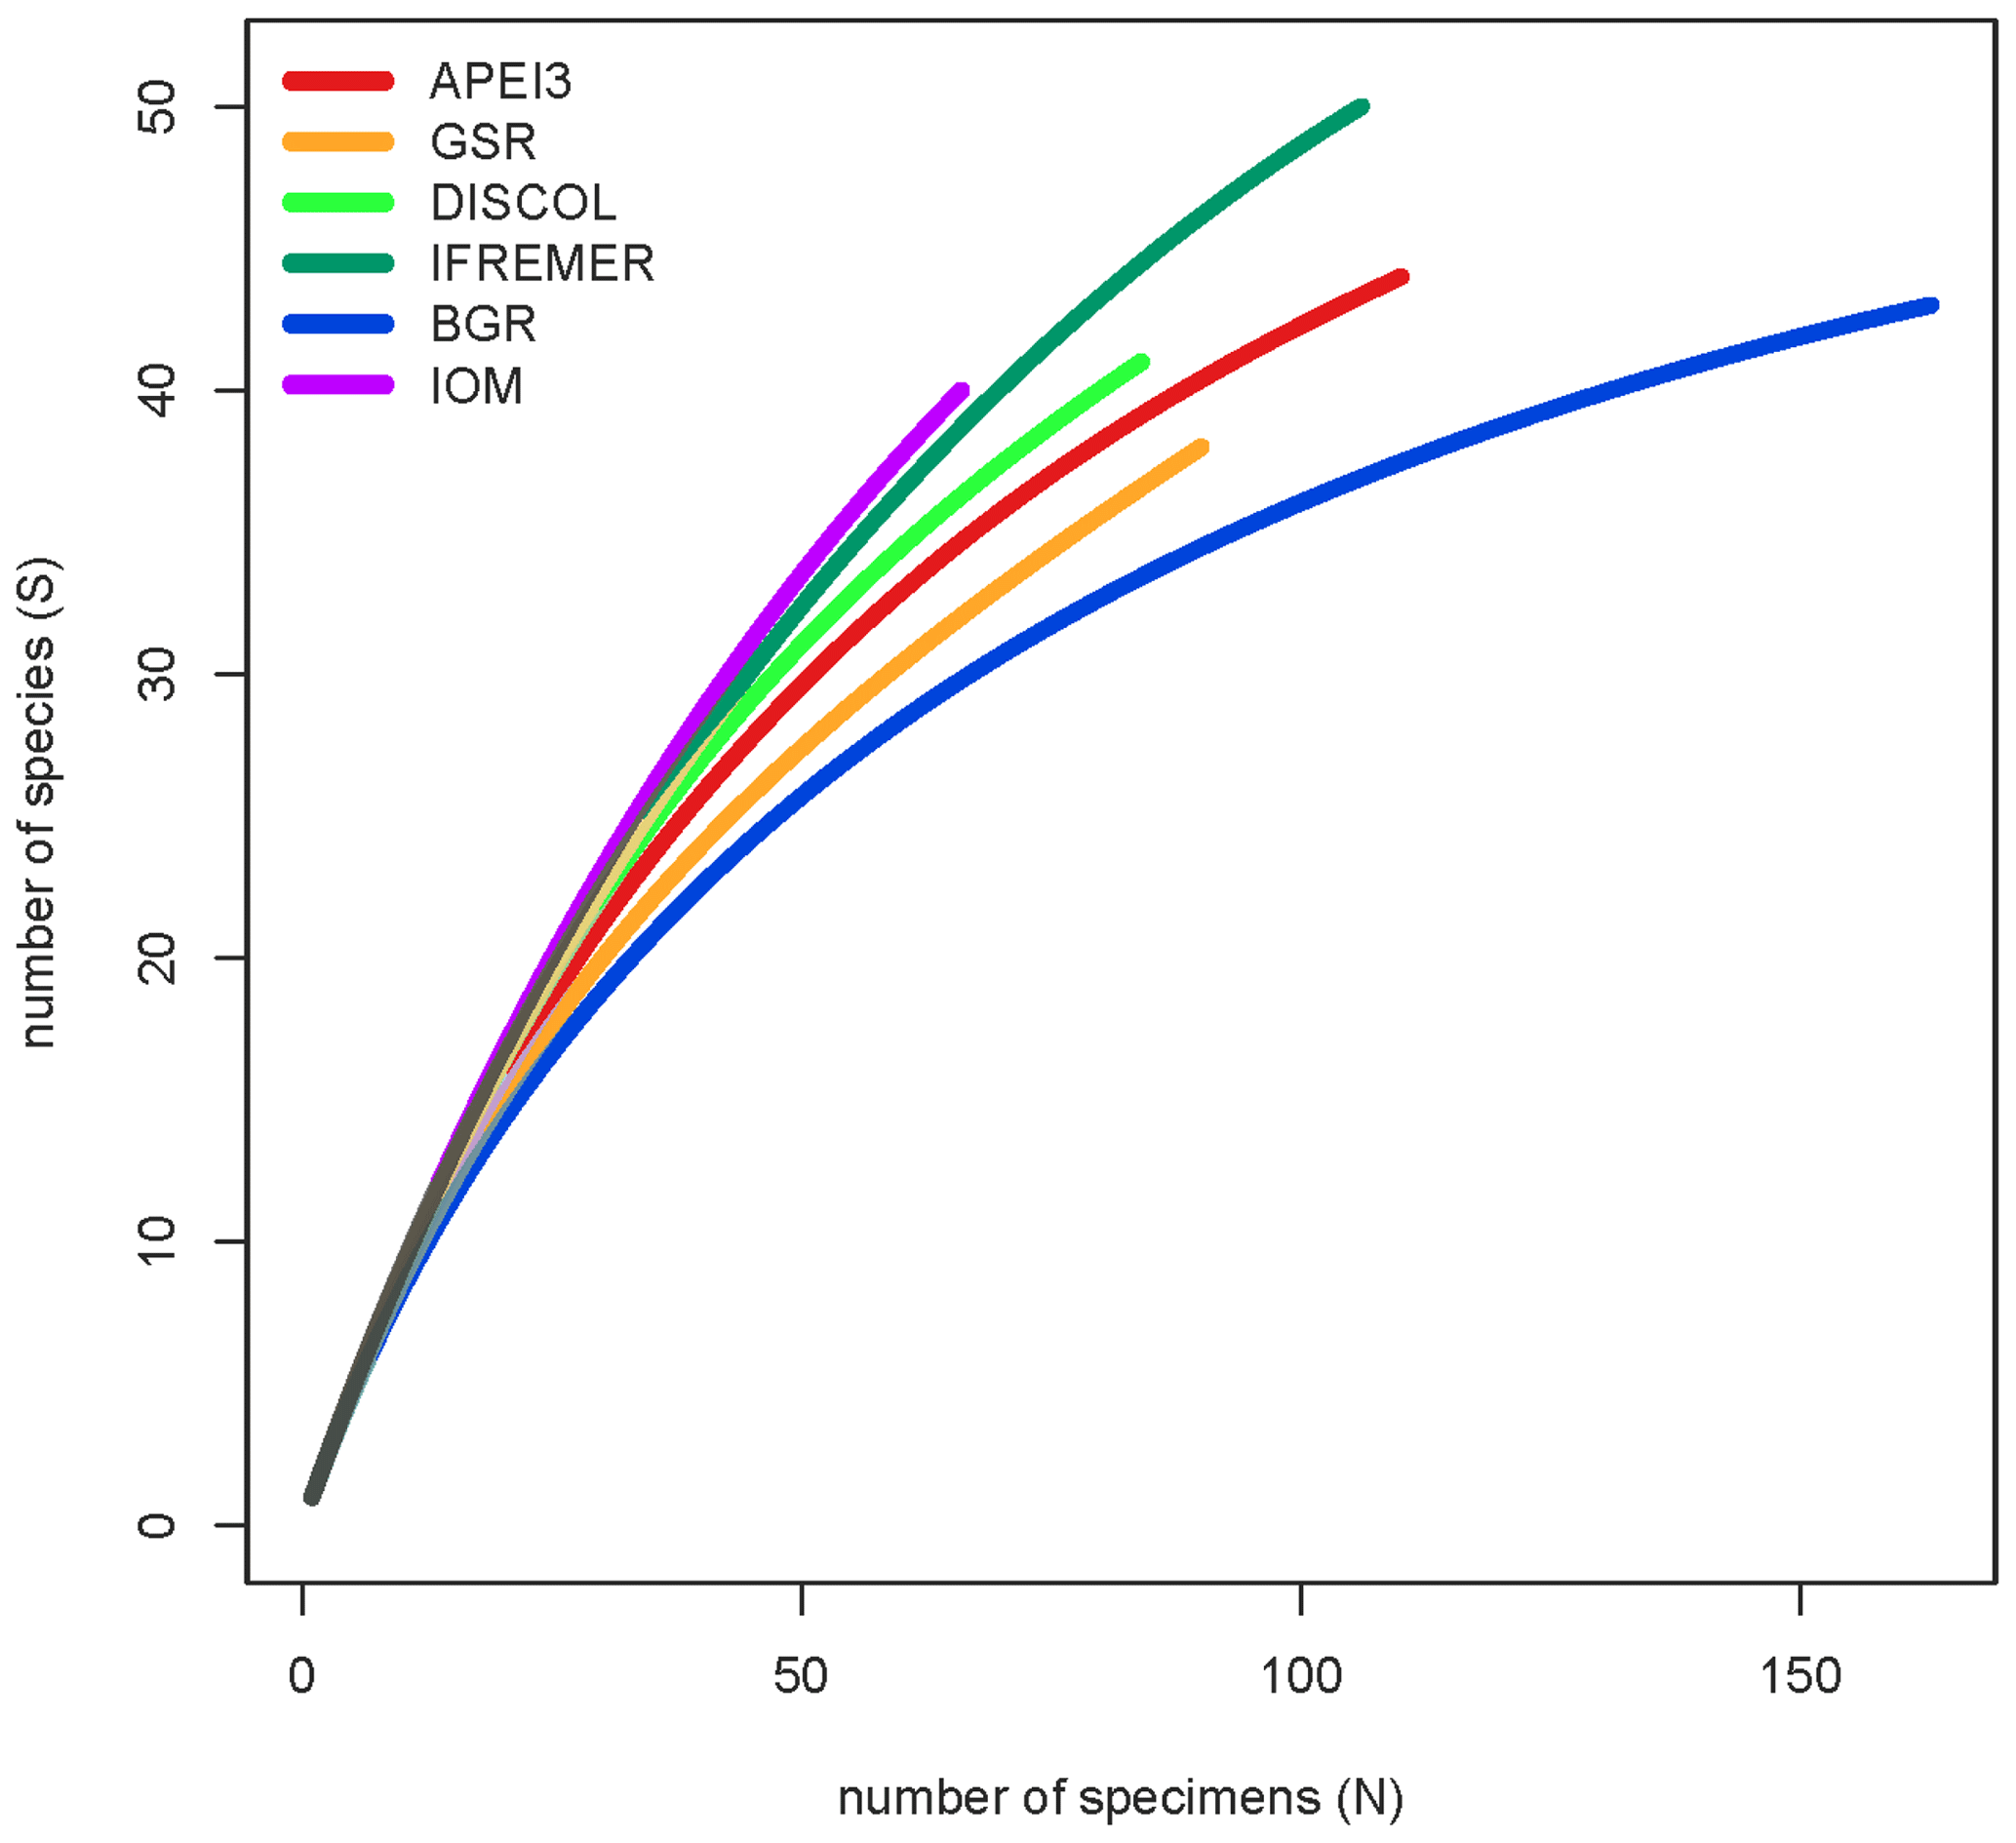
Table 2Faunistic similarity between areas. The number of shared species is in the upper quadrant, and the number of non-shared species is in the lower quadrant. Total number of species per site (bold in diagonal).
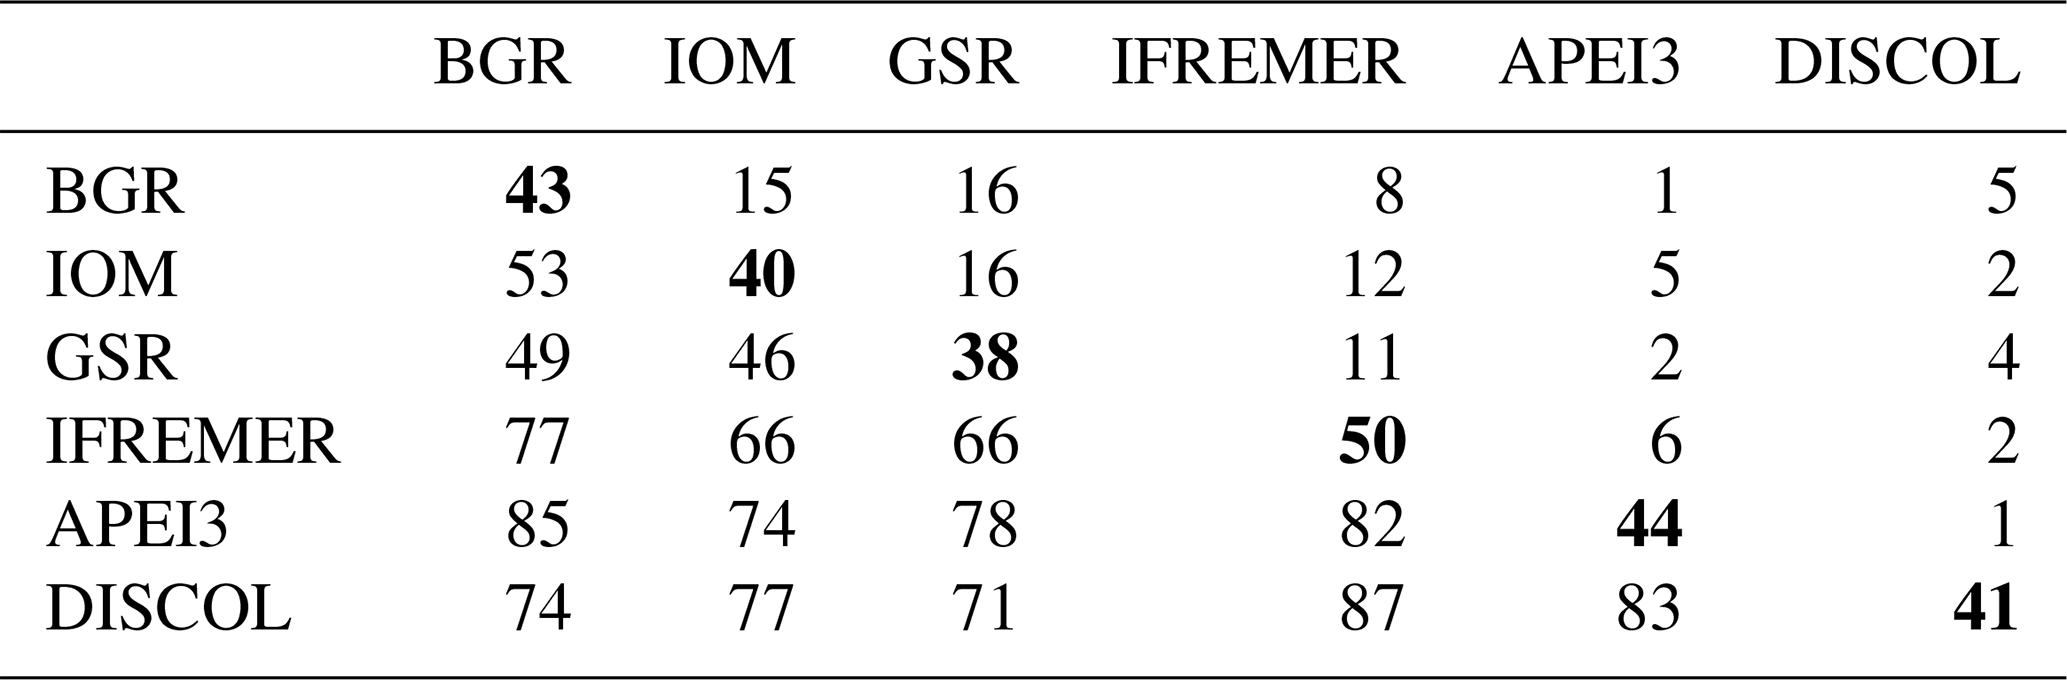
Table 3Beta-diversity decomposition of isopod families. N signifies number of specimens, and S signifies number of species. βSOR, βSIM, and βSNE express multiple-site total beta diversity, multiple-site species turnover, and multiple-site nestedness, respectively. Columns ccz N, ccz S, ccz βSOR, ccz βSIM, and ccz βSNE consider only samples taken within the CCZ (excluding APEI3 and DISCOL).
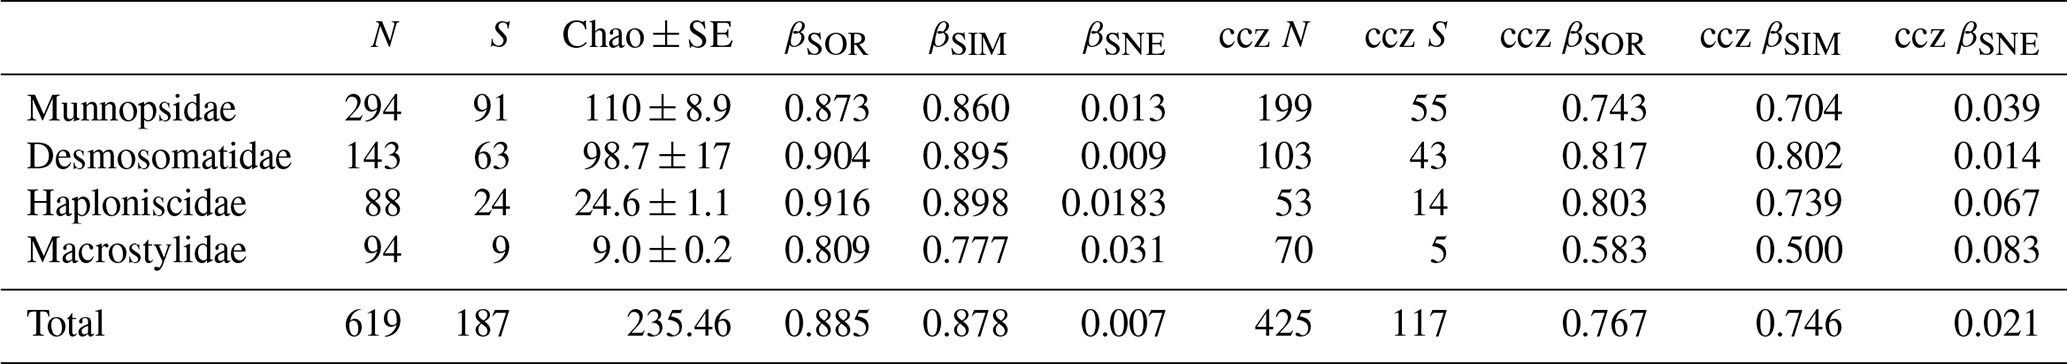
Table 2 shows the faunistic similarity between areas. The greatest number of shared species were between CCZ areas. For instance, GSR shares 16 species with both BGR and IOM areas and 11 species with IFREMER, yet only 4 species with DISCOL and only 2 with APEI3 (Table 2).
The highest number of non-shared species is present in APEI3 (19 species), followed by DISCOL (17 species) and IFREMER (16 species) areas (Fig. 10). The highest numbers of non-shared species (mean 80.4 ± 4.3) are found between APEI3 and any other area, followed by DISCOL (mean 78.4 ± 6.5, Table 2), although the t test shows no significant difference between them (p=0.58). The lower panel of the UpSet plot depicts the connectivity network. Few species are shared between areas; 11 species were shared between two areas, 7 species between three areas, 3 species between four areas, and just 1 species is present in five areas. The least connected site is APEI3, sharing only four species with other areas, followed by DISCOL sharing five species. BGR and GSR were better connected, sharing 13 and 14 species with other areas, respectively.
The UpSet plot (Fig. 12) summarizes the number of shared species between areas considering all taxa together, as well as by taxon. The highest number of non-shared species is present in APEI3 (19 species), followed by DISCOL (17 species) and IFREMER (16 species) areas. The other CCZ contractor areas were more similar to each other having just eight or fewer non-shared species. The lower panel of the UpSet plot depicts the connectivity network. Only a few species are shared between areas; 11 species are shared between two areas, 7 species between three areas, 3 species between four areas, and just 1 species is present in five areas. The least connected site is APEI3, sharing only three species with other areas, followed by DISCOL sharing five species. BGR and GSR are better connected sharing up to 14 species with other areas. Considering the UpSet plot by isopod family, it becomes evident that there are less connections (shared species) between areas the less motile the family is. Munnopsidae and Desmosomatidae show a diverse set of connections, and Haploniscidae and Macrostylidae show less connections (see below).
Total multisite beta diversity was high (total βSOR 0.885; Table 1), meaning that the overall similarity between areas was low. The beta diversity between CCZ-only areas was lower (total βSOR 0.767), revealing slightly higher congruence between areas in the CCZ. In both cases, the highest proportion of beta diversity is due to species turnover (βSIM) with only a small proportion accounting for nestedness (βSNE), but the nestedness proportion is 3 times greater within CCZ areas (βSNE = 0.021) than when considering all areas together (βSNE = 0.007). This is also evidenced by removing the areas one by one and calculating beta diversity with the remaining areas only. The removal of APEI3 and DISCOL results in the highest increase in nestedness (βSNE goes from 0.007 to 0.011), while the removal of any of the CCZ areas either does not change βSNE or decreases it up to βSNE = 0.004.

Community analysis using chord distance was ordinated in an nMDS diagram (Fig. 9) showing the more similar CCZ areas clustering together and the more different DISCOL and APEI3 being distinctly apart from each other and from the CCZ areas. Not so evident is the pattern in the presence/absence ordination (Fig. 10) because of the high dissimilarity between areas. The ordination is highly influenced by the number of unique species, which is highest at IOM and lowest at BGR along the y axis, and other areas spread along the x axis. The box plot (Fig. 11) shows the highest median presence/absence dissimilarity to other areas at APEI3, DISCOL, and IFREMER. The box plot shows that the median chord distance of the area to any other area is greater at APEI3 and DISCOL and smaller at any of the CCZ areas. Remarkably, core CCZ (IFREMER, IOM, GSR, and BGR) and APEI3 and DISCOL areas were more similar within than between themselves despite APEI3 and CCZ being much closer to CCZ than to DISCOL.
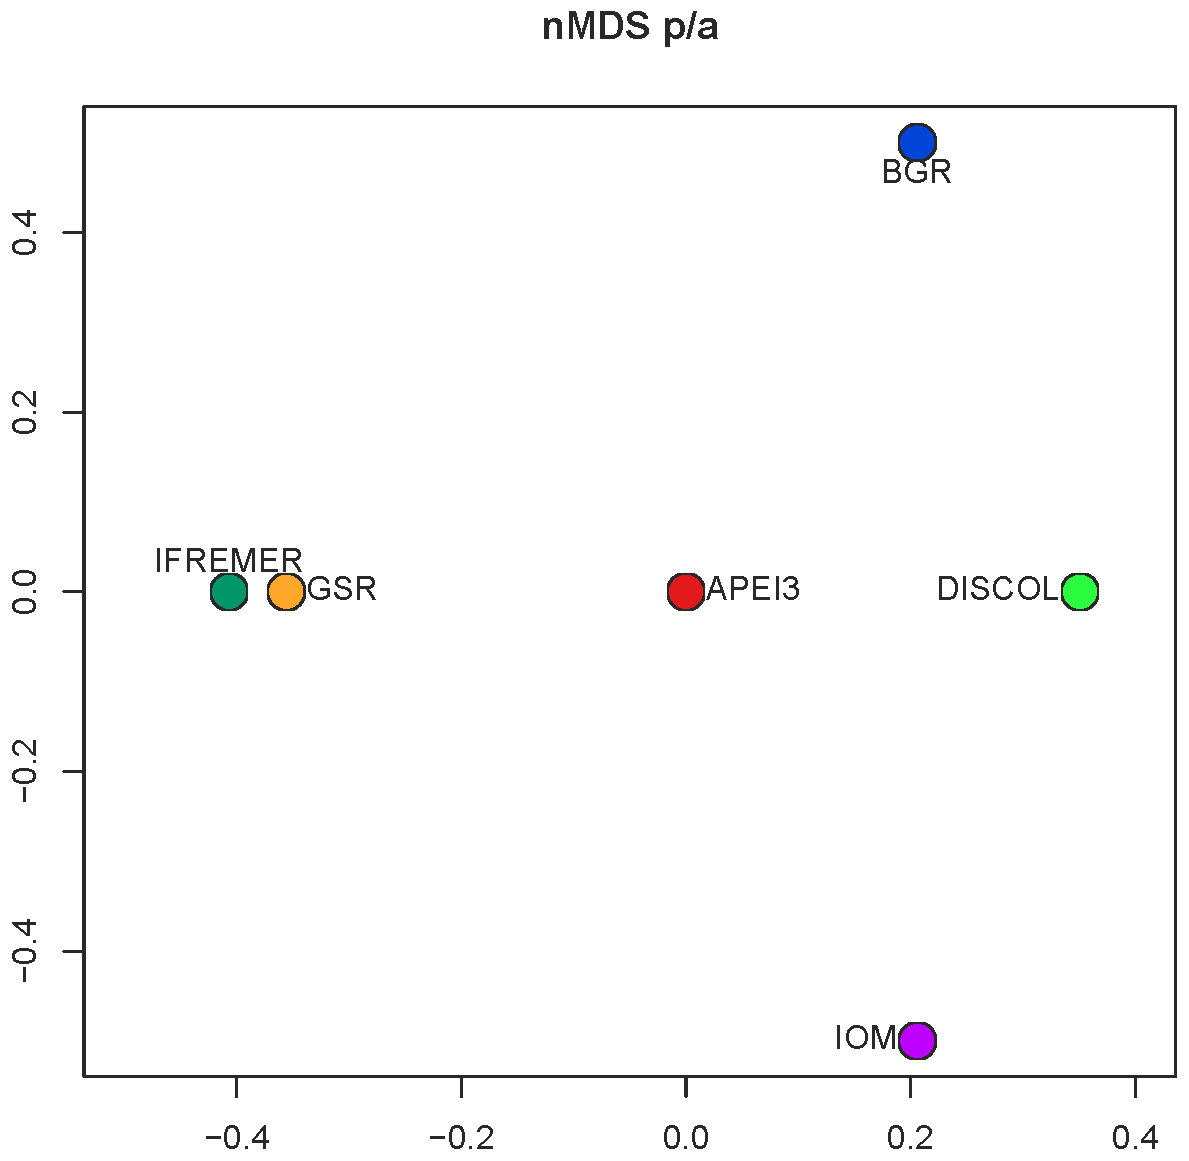
Figure 10The nMDS ordination plot of Euclidean distance between areas of presence–absence transformed data.
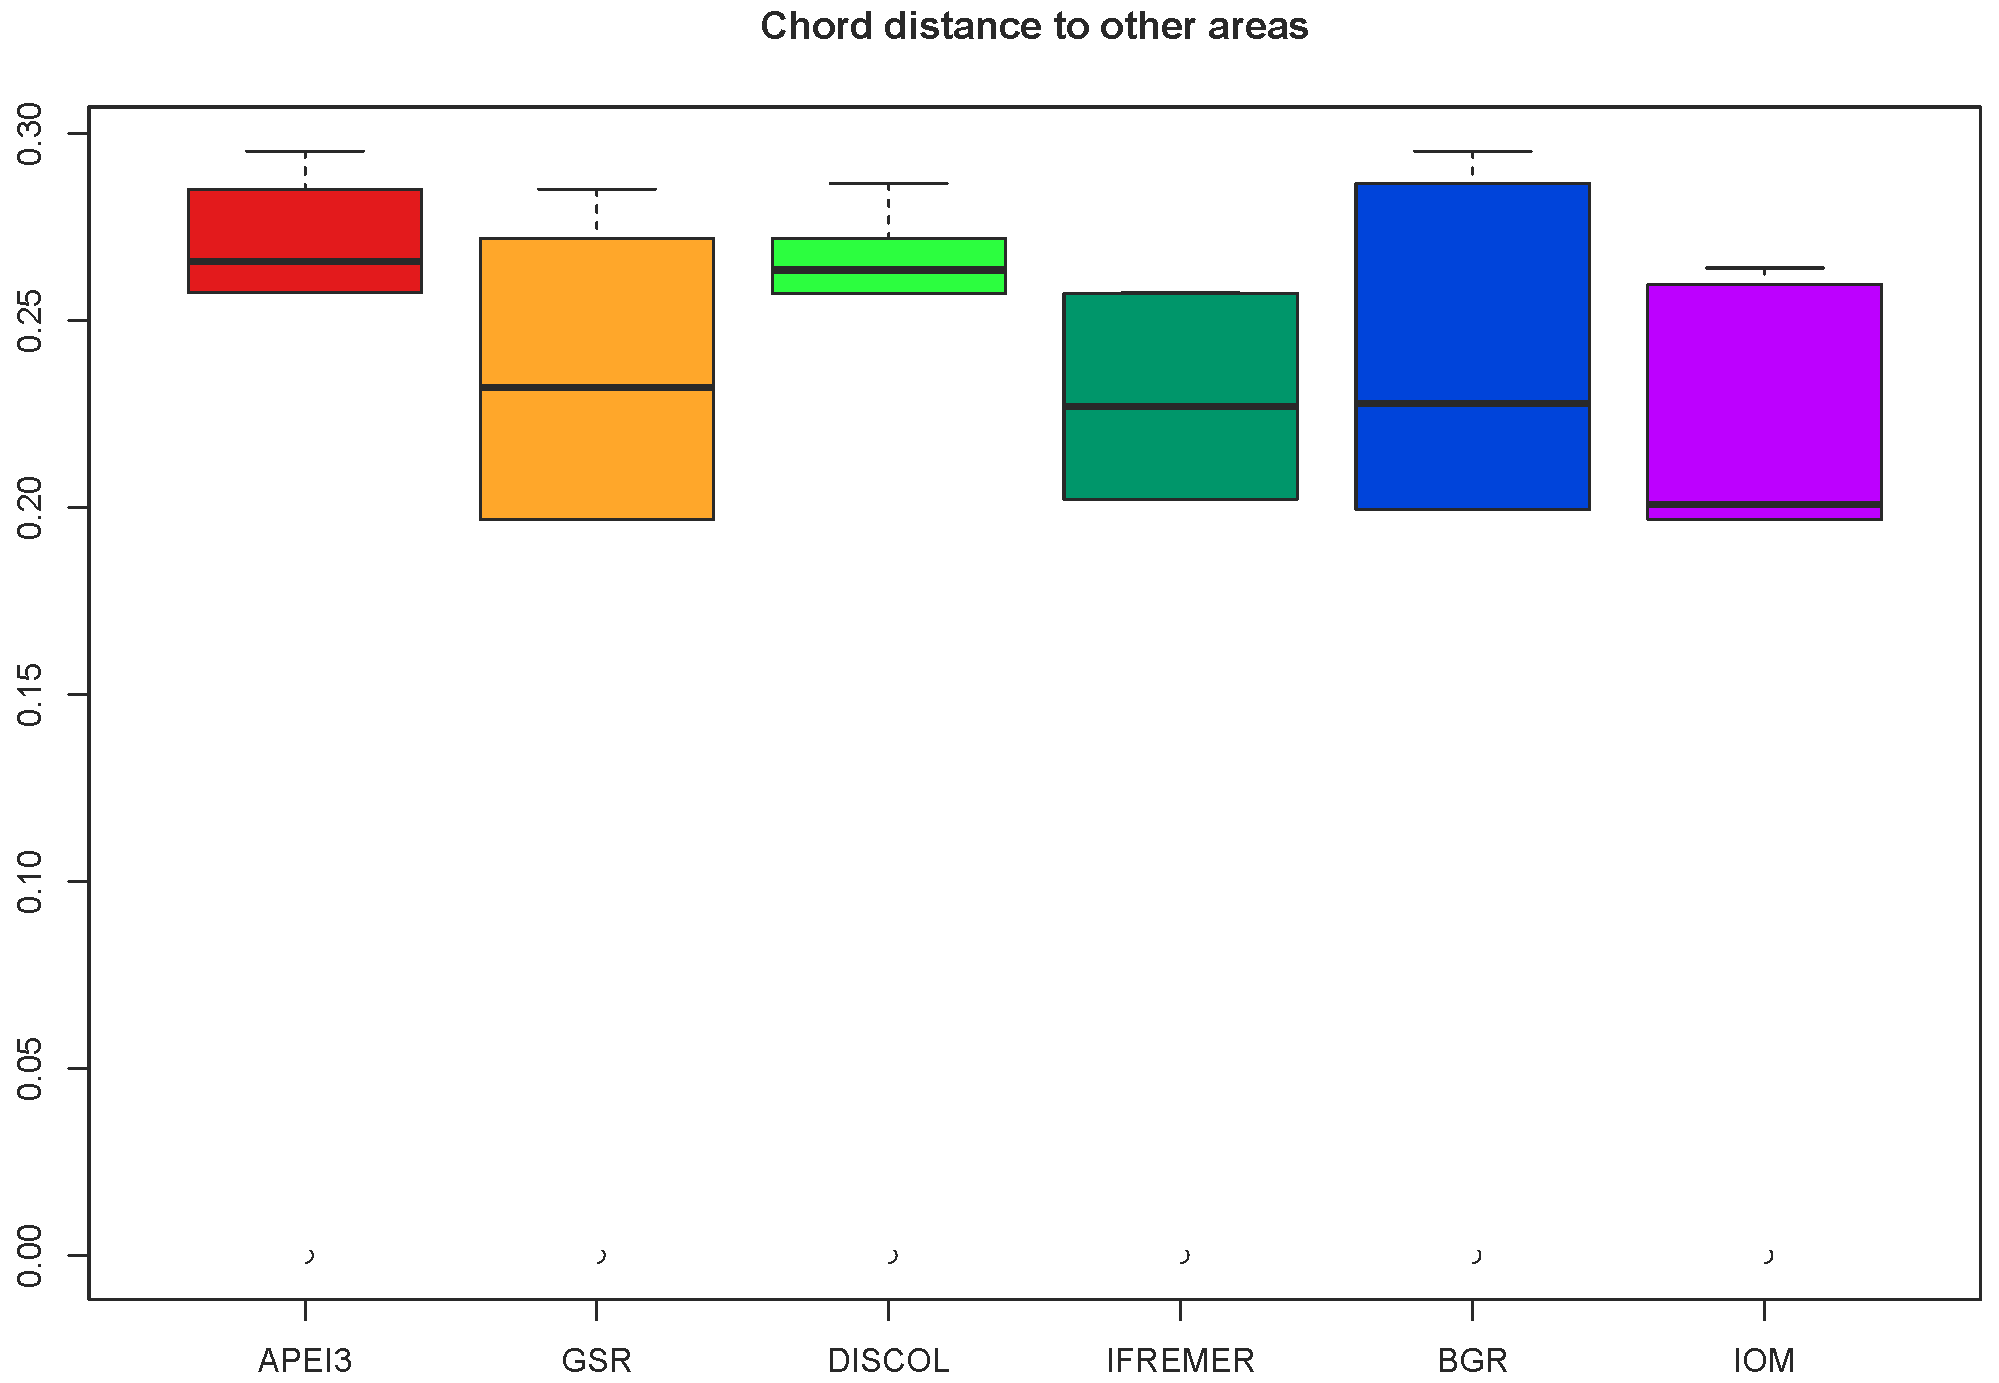
Figure 11Box and whiskers plot showing the median and range of the chord distance of every area to other areas.
3.4 Range size
Connectivity between areas differed between families (Table 4, Fig. 12). No species of any family was present in all six study areas, and only one munnopsid and one macrostylid species were present in five areas (Table 4). In total, 77 % of the species were recorded just in a single area, 13.9 % in two areas, 5.3 % in three areas, 2.6 % in four areas, and 1 % in five areas. A total of six (66.6 %) out of nine species of Macrostylidae were recorded in a single area. The most widely distributed species of Desmosomatidae was present in all four CCZ areas. The proportion of species present in a single area varies between families, and this proportion is the lowest within Munnopsidae, i.e., 75.8 % occurred only in one area, and is higher in Desmosomatidae (77.7 %) and Haploniscidae (83 %). This shows that less motile families tend to have species with more restricted distributions.
The UpSet plots (Fig. 12) illustrate the unique and shared diversity for the total dataset, as well as for each family across sampling locations. The lower part of the plots represents the connectivity network for all species and by family. Each vertical line represents a set of sites with shared species, and the vertical bars represent how many species are shared in each combination. While Macrostylidae and Haploniscidae show only three and four sets of sites with shared species, the connectivity network is more complex for Desmosomatidae and Munnopsidae with 11 and 17 sets, respectively. The complexity of the connectivity network increases with the increasing locomotory ability of the family.
Species ranges by family are summarized in Table 5. Ranges were calculated after excluding singletons. A total of 60 species of munnopsids, 29 of desmosomatids, 19 of haploniscids, and 8 of macrostylids were represented by more than one specimen in the dataset. The maximum distribution range was higher for the natatory families Munnopsidae and Desmosomatidae, 5245 km and 4480 km, respectively. The less motile families Haploniscidae and Macrostylidae had maximum ranges of 1391 and 1440 km, respectively. The minimum ranges per family also correlated with locomotory ability and were for Munnopsidae 253 km, for Desmosomatidae 40 km, for Haploniscidae 1 km, and for Macrostylidae 130 m (Table 5).
4.1 Lifestyle of adults determines species' distributional ranges
Presumed low levels of environmental variability and absence of obvious dispersal barriers led to the assumption that deep-sea species have wider horizontal distributions compared to shallow-water representatives (McClain and Hardy, 2010). However, molecular studies have shown that morphologically similar, but genetically distinct (cryptic), species are common among deep-sea lineages, fundamentally changing our understandings of deep-sea species distributions (e.g., Vrijenhoek et al., 1994; Pfenninger and Schwenk, 2007; Raupach et al., 2007; Havermans et al., 2013; Brix et al., 2014, 2015; Jennings et al., 2018, 2019). Conversely, for some species there is morphological and genetic support for wide geographic distributions even across major topographic barriers (Brix et al., 2011; Menzel et al., 2011; Riehl and Kaiser, 2012; Janssen et al., 2015; Easton and Thistle, 2016; Bober et al., 2018; Brix et al., 2018, Christodoulou et al., 2020). However, biological data on dispersal distances of deep-sea species are still fragmentary due to the low sampling effort compared to the sheer area of deep-sea floor and the scant knowledge of species' taxonomy. The large proportion of new species commonly found in deep-sea environments (Brandt et al., 2007; Brix et al., 2018; Jennings et al., 2019; Kaiser et al., 2017), also seen in our dataset (Figs. 3–6), remains a major impediment to the understanding of large-scale distributional patterns. With our species delimitation analysis accompanied by morphological assessment, however, we provided a stable system for defining a species in the deep sea as the basis for a more detailed ecological examination of the samples.
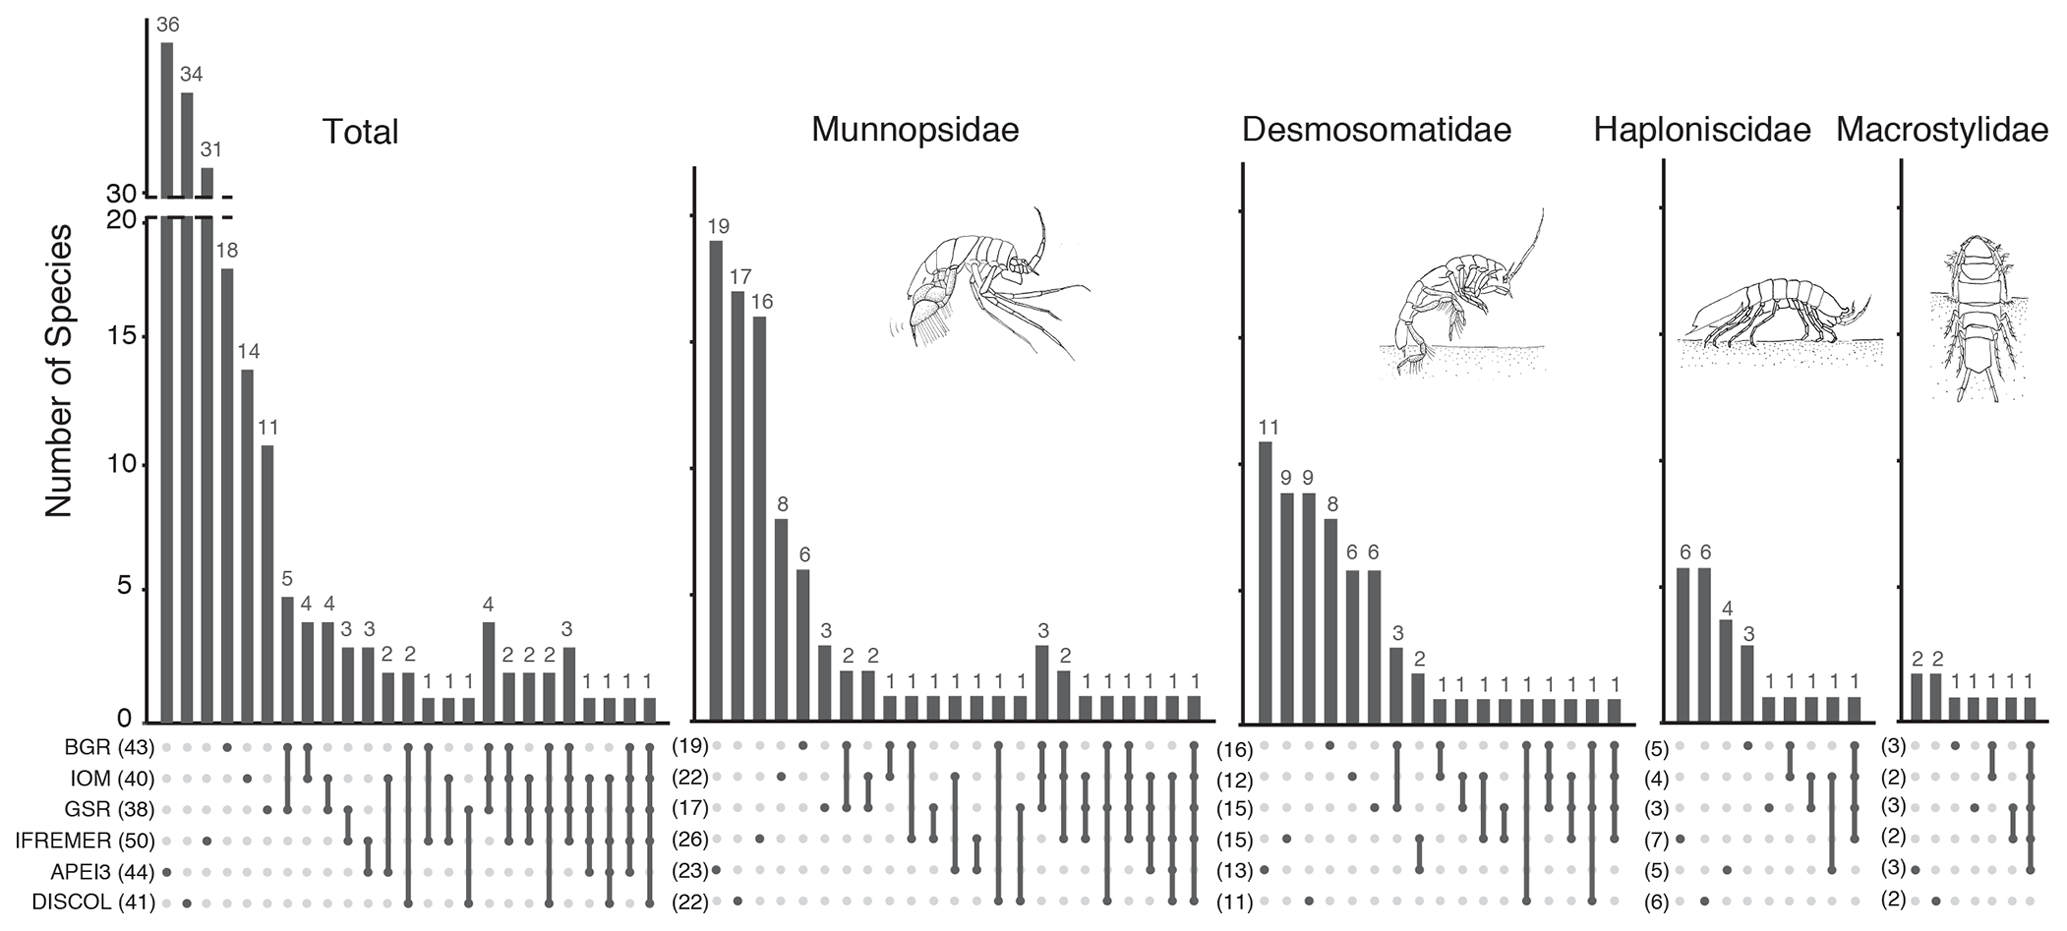
Figure 12UpSet plot showing the number of species shared between sampling sites. The lower panel shows the sets of combination of sites. Sites sharing species are indicated by dots joined by a vertical line. The corresponding bar in the upper panel shows the number species co-occurring in this particular set of stations.
Table 4Number and percentage of species of the studied families present in only one to six areas. “Total” considers all areas together.

Table 5Species distribution range by family. Data show the maximum distribution range of the species of each family excluding singletons.

Our results indicated that lifestyle and more precisely the locomotory (dispersal) capabilities of adult deep-sea asellotes are structuring their biodiversity patterns at medium and large scales. In line with our hypothesis, we found species within the family Munnopsidae exhibited the widest geographic ranges among the four families examined (Table 5). The second most mobile family was the Desmosomatidae, who live on the surface of the sediments but have posterior appendages modified for swimming, though not as pronounced as in the Munnopsidae. In contrast, there is no evidence that Haploniscidae can swim. These asellotes live on or in the sediments and have short walking legs that they use for crawling. Macrostylidae are assumed to likely live in tubes in the sediment, although some males of this family are good swimmers (Riehl et al., 2020).
Brandt et al. (2011) considered the influence of locomotion (mobility types) for the distribution of isopod families, but the study by Bober et al. (2018) is the only other known analysis to assess distributional ranges in abyssal isopods relative to locomotive capacity using molecular markers. Bober et al. (2018) compared distribution ranges of species in four isopod families (Munnopsidae, Desmosomatidae, Nannoniscidae, and Macrostylidae), which were collected along the Vema Fracture Zone and found on both sides of the MAR. Although their study was based on only a few model species, they could see patterns like those in our analysis. For example, Bober et al. (2018) were able to detect the same haplotypes across the MAR in the swimming munnopsid Acanthocope galatheae Wolff, 1962. The comparison of our data with the molecular analysis of A. galatheae samples from the Vema Fracture Zone (Bober et al., 2018) confirmed a pan-oceanic distribution of this species. By contrast, for the non-swimming Macrostylidae and weakly swimming Desmosomatidae and Nannoniscidae, the MAR seemed to be a dispersal barrier (Bober et al., 2018). Notably, in their analysis, two species of Macrostylidae and Desmosomatidae each crossed the MAR, but there was no evidence of genetic exchange. Using data from the same sampling campaign, Brix et al. (2018) showed that even robustly sampled species within Nannoniscidae and Desmosomatidae exhibit “small” ranges of around 500 km, and only three species were distributed in the order of 1000–2500 km, but we need to take into account that species ranges are biased by the sampling design and that there is a higher probability of sampling an abundant species than a widely distributed but rare species.
Although larval dispersal does not apply to isopods since they brood their young, we would like to point out that most of the isopod species reported here are very small, in the range of a few millimeters as adults. In this size range, it is clear that also adult isopods will be transported by bottom currents once they swim just a few centimeters above the bottom. Etter and Bower (2015) tested the distribution distance of planktonic larvae in the North Atlantic Ocean using physical particles as models. Their experiment showed that dispersal over hundreds of kilometers and even through current systems with a strong temperature gradient is possible. Pelagic species and pelagic life stages of many benthic species can drift and swim across and/or between oceans during their lifetime. Fully benthic species, on the other hand, spend most of their life on or in the seabed and thus may be dispersing over much shorter distances (Costello et al., 2017). Actively swimming taxa, such as the Munnopsidae that can swim tens to thousands of meters above the bottom, sometimes show a broad distribution that is less influenced by local water masses (Schnurr et al., 2014, 2018). For other asellote families than in the present dataset, local and regional bottom currents are likely to play a major role in shaping their distribution patterns (Riehl et al., 2018; Kaiser et al., 2020).
Macrostylidae deserves a special mention. Species within this family had a remarkably narrow distribution range, as six out of nine species were found in a single area and two species in two contiguous areas (Table 4). This pattern would have reinforced our hypothesis except that one of the species (“sp. M”, OTU M04-M07; see Table S1, Fig. 6) is present in five areas. In our study, low morphological variation is contrasted by genetic differentiation in Macrostylis sp. M (cf. metallicola) which belongs to at least three different species according to our SD (Fig. 6). If a real identification as M. metallicola can be provided for clade 5, this would follow the wide distribution of this species across the CCZ according to Riehl and De Smet (2020). These authors stated that they found molecular hints of M. metallicola being a complex of more (cryptic) species, and thus the morphologically uniform appearance leads to underestimating biodiversity, or possibly the population is in the early stages of a radiation. Either way, mining would disrupt this evolutionary process and limit the genetic potential of the population and thus cause changes in the radiation and distribution pattern of this species complex. The wide distribution of species M05 would have been easily explained if the males had shown a strong sexual dimorphism, but this was not the case in the individuals collected here.
A change to a more epifaunal or even swimming lifestyle in sexually mature males that mate with likely stationary females was discussed in species descriptions of strongly sexual dimorphic species such as those belonging to the Macrostylidae (Bober et al., 2017; Kniesz et al., 2017). Sex-specific differences in dispersal capacities are known more from Macrostylidae than from Munnopsidae, for which there are no documented dispersal-effecting sexual dimorphisms. In desmosomatid and haploniscids, sexual dimorphism is more pronounced than in munnopsids, in that males show more adaptations to swimming than females in various species. For example, the species delimitation done on the KuramBio II dataset for desmosomatids and nannoniscids (Jennings et al., 2020) revealed that a strong sexual dimorphism, especially in the genus Mirabilicoxa, limits morphological species determination and that only the integrated approach combining genetics and morphology made a clear assignment to species possible.
We found both wide-ranging species and many singletons or species that occurred in a single area, especially within the Munnopsidae (Fig. 3). Rarity like this is a widespread phenomenon in deep-sea ecosystems (Brandt et al., 2007; Connolly et al., 2014). The high number of singletons in our dataset (Table S1) may reflect the always insufficient sampling effort of deep-sea studies (Kaiser et al., 2020; Janssen et al., 2015). This interpretation is further supported by the rarefaction curves that show no asymptote, suggesting incomplete sampling of the isopod biodiversity in the region (Fig. 8). Kaiser et al. (unpublished data) examined the phylogeographic structure in a genus of poorly dispersing nannoniscid isopods from the CCZ and similarly found contrasting distribution patterns. Some species show a wide geographic distribution (> 1400 km), while other species show evidence of restricted distributions or limited species ranges. These authors found that isolation by distance seemed to explain the distribution patterns to some extent, but the degree of habitat heterogeneity and oceanographic currents were equally important.
4.2 APEIs are similar in diversity but not in species composition compared to contractor areas
Mining will fundamentally change the structure and function of resident communities and ecosystems. Thus, the implementation of set-aside areas, which remain untouched, can facilitate the recolonization of impacted seafloor from external source populations (Cuvelier et al., 2018). Initially, a network of APEIs were defined on the basis of large-scale hydrographic and bathymetric features, including nodule densities, carbon flux, and seamount distribution (Wedding et al., 2013). Furthermore, assumed dispersal distances of species were considered to promote population persistence. Until 2015, however, no biological sample was taken from any APEI to assess its suitability as a biodiversity reservoir. Only in the course of the MiningImpact and Abyssline projects were the first samples collected from APEIs nos. 3 and 6 (Amon et al., 2017; Martinez and Haeckel, 2015). Published data on a number of fauna groups based on these samples indicate little resemblance between APEI3 communities and the contractor areas studied (Vanreusel et al., 2016; Jakiel et al., 2019; Bonifacio et al., 2020; Christodoulou et al., 2020). Bonifacio et al. (2020), for instance, investigated polychaete communities from the same sampling campaign as ours and found considerably lower densities, diversity, and similarity in species composition of APEI3 relative to contractor areas. Data on tanaidaceans from APEI3 also showed relatively low densities and species richness (Jakiel et al., 2019; Błażewicz et al., 2019). Further, Jakiel et al. (2019) found that only one-third of CCZ pseudotanaid richness was present in the APEI3. Christodoulou et al. (2020) studied the brittle stars in the CCZ, APEI3, and DISCOL, and, similar to the present study, they showed a greater faunistic similarity between core CCZ contractor areas than to other areas. In addition, the similarity of the core CCZ area was greater to the most distant DISCOL area than to the relatively close APEI3. For isopods in our study, diversity levels perceived from APEI3 were similar to the contractor areas (Table 1), but species composition was different with only a few shared species (Table 2). This supports the idea that distance is not the only factor determining community similarity between areas. Christodoulou et al. (2020) suggest marked differences in particulate organic carbon (POC) flux as a possible structuring factor. The APEI3 is located in an area with very low surface productivity compared to the core CCZ areas and the DISCOL region. Environmental conditions have been shown to differ significantly in the APEI3 compared to areas in the CCZ, notably lower POC fluxes to the seafloor, lower total organic carbon (TOC) content, and lower clay content (Volz et al., 2018). These differences likely explain the observed community differences (Błażewicz et al., 2019; Bonifacio et al., 2020; Christodoulou et al., 2020). In a study of Icelandic isopods (Brix et al., 2018), TOC and mud content were shown to be the main explanatory variables for variation in the distribution of families with different lifestyles (e.g., in- vs. epi- vs. suprafauna) and thus likely differential use of food resources and substrate associations.
The CCZ is delimited to the north by the Clarion Fracture Zone (Hall and Gurnis, 2005). Bonifacio et al. (2020) argue that the latter limits dispersal between peripheral APEIs and CCZ contractor areas, at least for some taxa, similar to what was seen for the MAR (Bober et al., 2018; Guggolz et al., 2018; Riehl et al., 2018). As previously discussed, Bober et al. (2018) found that highly mobile munnopsids were able to cross the MAR, while the distribution of species in more poorly dispersing taxa, such as the Desmosomatidae, Nannoniscidaea, and Macrostylidae, was restricted. Similarly, our study showed the swimming families Munnopsidae and Desmosomatidae have little similarity between APEI3 and contractor areas. Therefore, we believe that other factors, like contrasting food supply rather than physical barriers, shape the standing stocks of these species.
Taboada et al. (2018) investigated microsatellite data of a common demosponge species (Plenaster craigi Lim and Wiklund, 2017) with a limited dispersal capacity from three contractor areas (UK-1A, UK-1B, and OMS) of the CCZ and APEI6. Their data revealed higher connectivity of distant populations (∼ 800 km apart) compared to those only tens of kilometers apart. This unexpected pattern was attributed to hydrodynamic conditions on a small and larger scale, which on the one hand facilitates species dispersal over large distances but locally may interrupt gene flow between populations (Taboada et al., 2018). Although they found evidence of genetic connectivity between UK-1A and APEI6 (which is located close to the UK-1A area) in P. craigi, they concluded that APEI6 alone does not appear to adequately preserve the genetic diversity of P. craigi in the region. At this stage, more data from the remaining APEIs, particularly those situated to the south, are required to further assess the appropriateness of APEIs for conservation purposes, particularly in terms of representative environmental conditions, fauna, and overall size of these reserves. Together, these studies suggest that APEIs are inappropriate or insufficient to capture the biodiversity of the CCZ. The aim should therefore be to reevaluate the suitability of the APEIs for the recolonization of the proposed mining areas (Vanreusel et al., 2016; Błażewicz et al., 2019; Jakiel et al., 2019; Taboada et al., 2018, this study).
4.3 Implications for conservation
Small-sized meio- and macrofaunal invertebrates, such as isopods, make up a large proportion of CCZ diversity. Thus, especially for these small-sized faunal elements, studies on species richness and distribution patterns are needed for the development of management strategies for the preservation of abyssal biodiversity (Błażewicz et al., 2019). The widespread distribution of many munnopsid species suggests that at least some species may be able to recolonize affected areas, provided that the integrity of the habitat is restored. However, some species, like the Macrostylidae and some Haploniscidae, are limited in their distribution, having been found in just one of the contractor areas. Therefore, their local loss may thus become a global loss, but even for widely distributed species, extinction of connecting populations may result in loss of genetic diversity and recovery potential (Riehl and De Smet, 2020). Janssen et al. (2019) stated that in the case of polychaetes with long- and short-distance dispersal capabilities, large populations are continuously distributed over large geographic scales. Although Janssen et al. (2019) suggested a similar pattern in isopods, they showed that spatial genetic structuring of isopod populations did imply weak barriers to gene flow. They concluded that mining-related habitat destruction will most likely impact the continuity of isopod populations more severely than for other groups, such as polychaetes. As a result of this study, we can add that not all isopod families will be equally affected. Less motile families will be more severely affected. This assumes that ecosystem recovery after major impacts is predicted to occur slowly at evolutionary timescales. Haffert et al. (2020) calculated that the recovery of the biochemical fluxes in the upper centimeters of abyssal sediments after mining will take over 200 years.
Most species in our study are new to science or undescribed, and, with increasing species accumulation curves, we are far from knowing how many isopod species live in the CCZ and how widespread they are. Our study of a community where over 94 % of the isopod species are new to science or described within the last 2 years indicates the need for quick assessment tools like molecular species delimitation in the deep-sea environment. Additionally, taxonomic expertise is needed, which can lead to a description of the key species even though it is not possible to describe every single species (Brix et al., 2018). In addition, the exchange of images and sample sketches of species provided by taxonomist would contribute to taxonomic standardization between contractor areas and thus improve and refine biodiversity and biogeographic patterns.
We have been able to show that less motile families of Isopoda have more restricted distribution ranges. This has direct implications for recovery after mining operations. For these families, recolonization will need to start from nearby non-impacted areas. It is unlikely that pristine areas located far away from the mining operations will act as source populations because they will most likely harbor a different set of species. The considerable differences we found between the isopod communities of APEI3 and contractor areas cause doubts of the representativity of APEIs for conserving biodiversity in the CCZ as a whole. However, our study has the obvious limitation that we have sampled only contractor areas located in the eastern CCZ and that we have sampled only one APEI. Therefore, more data from other APEIs are urgently needed to assess the diversity and composition of their communities and the degree of faunal connectivity, which must lead to a new assessment and revision of protected areas for the CCZ. We strongly suggest a declaration of APEIs within the core CCZ region as a clear strategy to protect the fauna that is more similar to the areas that will be affected by mining.
All species determinations are listed in the Supplement and are available via the Barcode of Life Database (Dataset – DS-LOCOM locomotion of adult isopods influences distribution) or via the local database at Senckenberg am Meer on request (contact: Saskia Brix and Pedro Martinez). The materials and methods section of the paper indicated where voucher specimens are deposited (museum storage). No data from a third parties were used. All data are deposited in the repositories indicated in the paper.
No geoscientific samples which are registered as International Geo Sample Number (IGSN) have been used for the paper.
The supplement related to this article is available online at: https://doi.org/10.5194/bg-17-6163-2020-supplement.
SB was responsible for writing the paper, the coordination and management of sequence data (in BoLD), quality check, morphological identification, discussing the species delimitations, preparing the figures, and preparing the voucher specimens for museum storage. KJO was responsible for data quality assessment and control, alignments, supervision of species delimitation analyses, tree/species delimitation figures, portions of the paper, and editing of the original manuscript (native speaker check). SMS was responsible for preparing specimens for genetics and sampling on board, as well as lab work at the Smithsonian producing the raw data and providing preliminary trees. SBT was responsible for performing the species delimitation and phylogenetic analyses and preliminary trees. SK was responsible for writing important parts of the paper, sorting and preparing specimens on board, and helping with the morphological species delimitation. NB was responsible for species determination of DISCOL Isopoda and morphological comparison to the JPIO dataset together with SB. MM was responsible for the identification of the Munnopsidae and linking the paper to the description of a new genus. PMA was responsible for the idea of the paper and statistical analyses, writing important parts of the paper, and preparing statistical figures.
The authors declare that they have no conflict of interest.
This article is part of the special issue “Assessing environmental impacts of deep-sea mining – revisiting decade-old benthic disturbances in Pacific nodule areas”. It is not associated with a conference.
Magdalini Christoudolu is thanked for helping with managing BoLD for the whole Pacific project from which we extracted our dataset. Nele Johanssen and Torben Riehl gave us a first impression on the morphological determination of JPIO haploniscids and macrostylids. Karen Jeskulke not only helped with the lab work at the Smithsonian and the DZMB in Hamburg, she also contributed largely to the databank entries at DZMB HH. This is publication number 72 from Senckenberg am Meer's Metabarcoding and Molecular Laboratory.
This research has been supported by the Narodowa Agencja Wymiany Akademickiej (Poland) under the ULAM program. The cruises SO239 and SO242 were financed by the German Ministry of Education and Science (BMBF) as a contribution to the European project JPI Oceans “Ecological Aspects of Deep-Sea Mining”. The authors acknowledge funding from BMBF under contract 03F0707E.
This paper was edited by Matthias Haeckel and reviewed by two anonymous referees.
Amon, D. J., Hilario, A., Martínez Arbizu, P. M., and Smith, C. R.: Observations of organic falls from the abyssal Clarion-Clipperton Zone in the tropical eastern Pacific Ocean, Mar. Biodiv., 47, 311–321, 2017.
Baco, A. R., Etter, R. J., Ribeiro, P. A., Von der Heyden, S., Beerli, P., and Kinlan, B. P.: A synthesis of genetic connectivity in deep-sea fauna and implications for marine reserve design, Mol. Ecol., 25, 3276–3298, 2016.
Baselga, A.: Partitioning the turnover and nestedness components of beta diversity, Glob. Ecol. Biogeogr., 19, 134–143, https://doi.org/10.1111/j.1466-8238.2009.00490.x, 2010.
Baselga, A. and Orme, C. D. L.: betapart: an R package for the study of beta diversity, Methods. Ecol. Evol., 3, 808–812, https://doi.org/10.1111/j.2041-210X.2012.00224.x, 2012.
Bażewicz, M., Jóźwiak, P., Menot, L., and Pabis, K.: High species richness and unique composition of the tanaidacean communities associated with five areas in the Pacific polymetallic nodule fields, Prog. Oceanogr., 176, 102–141, 2019.
Bober, S., Riehl, T., Henne, S., and Brandt, A.: New Macrostylidae (Isopoda) from the Northwest Pacific Basin decribed by means of integrative taxonomy with reference to geographical barriers in the abyss, Zool. J. Linn. Soc.-Lond., 182, 549–603, https://doi.org/10.1093/zoolinnean/zlx042, 2017.
Bober, S., Brix, S., Riehl, T., Schwentner, M., and Brandt, A.: Does the Mid-Atlantic Ridge affect the distribution of abyssal benthic crustaceans across the Atlantic Ocean?, Deep-Sea Res. Pt. II, 148, 91–104, https://doi.org/10.1016/j.dsr2.2018.02.007, 2018.
Boetius, A.: RV SONNE Fahrtbericht/Cruise Report SO242-2: JPI OCEANS Ecological Aspects of Deep-Sea Mining, DISCOL Revisited, Guayaquil – Guayaquil (Equador), 28.08.-01.10.2015, GEOMAR Report, N. Ser. 027, GEOMAR Helmholtz-Zentrum für Ozeanforschung, Kiel, Germany, 552 pp., https://doi.org/10.3289/GEOMAR_REP_NS_27_2015, 2015.
Bonifácio, P., Martínez Arbizu, P., and Menot, L.: Alpha and beta diversity patterns of polychaete assemblages across the nodule province of the eastern Clarion-Clipperton Fracture Zone (equatorial Pacific), Biogeosciences, 17, 865–886, https://doi.org/10.5194/bg-17-865-2020, 2020.
Brandt, A.: Origin of Antarctic Isopoda (Crustacea, Malacostraca), Mar. Biol., 113, 415, https://doi.org/10.1007/BF00349167, 1992.
Brandt, A., Brix, S., Brökeland, W., Choudhury, M., Kaiser, S., and Malyutina, M.: Deep-sea isopod biodiversity, distribution and endemism in the Atlantic sector of the Southern Ocean – results from the ANDEEP I - III expeditions, Deep.-Sea. Res. II, 54, 1760–1775, 2007.
Brandt, A., Bathmann, U., Brix, S., Cisewski, B., Flores, H., Göcke, C., Janussen, D., Krägefsky, S., Kruse, S., Leach, H., Linse, K., Pakhomov, E., Peeken, I., Riehl, T., Sauter, E., Sachs, O., Schüller, M., Schrödl, M., Schwabe, E., Strass, V., vanFraneker, J. A., and Wilmsen, E.: Maud Rise – a snapshot through the water column, Deep-Sea Res., 58, 1962–1982, https://doi.org/10.1016/j.dsr2.2011.01.008, 2011.
Brandt, A., Bamber, R. N., Mühlenhardt-Siegel, U., Malyutina, M., Kaiser, S., Blazewicz-Paszkowycz, M., De Broyer, C., Havermans, C., and Osborn, K.: Are there widespread peracarid species in the deep sea (Crustacea: Malacostraca)?, Polish Pol. Res., 33, 139–162, 2012.
Brix, S., Riehl, T., and Leese, F.: First genetic data for species of the genus Haploniscus Richardson, 1908 (Isopoda: Asellota: Haploniscidae) from neighbouring deep-sea basins in the South Atlantic, Zootaxa, 2838, 79–84, 2011.
Brix, S., Leese, F., and Svavarsson, J.: A multi-gene analysis reveals multiple highly divergent lineages of the isopod Chelator insignis (Hansen, 1916) south of Iceland, Pol. Pol. Res. 35, 225–242, https://doi.org/10.2478/popore-2014-0015, 2014.
Brix, S., Leese, F., Riehl, T., and Kihara, T. C.: A new genus and new species of Desmosomatidae Sars, 1897 (Isopoda) from the eastern South Atlantic abyss described by means of integrative taxonomy, Mar. Biodiv., 45, 7–61, 2015.
Brix, S., Bober, S., Tschesche, C., Kihara, T. C., Driskell, A., and Jennings, R. M.: Molecular species delimitation and its implications for species descriptions using desmosomatid and nannoniscid isopods from the VEMA fracture zone as example taxa, Deep-Sea Res. Pt. II, 148, 180–207, https://doi.org/10.1016/j.dsr2.2018.02.004, 2018.
Buhay, J. E.: “COI-like” Sequences Are Becoming Problematic in Molecular Systematic and DNA Barcoding Studies, J. Crust. Biol., 29, 96–110, https://doi.org/10.1651/08-3020.1, 2009.
Chao, A.: Non-parametric estimation of the number of classes in a population, Scan. J. Stat., 11, 265–270, 1984.
Chazdon, R. L., Colwell, R. K., Denslow, J. S., and Guariguata, M. R.: Statistical methods for estimating species richness of woody regeneration in primary and secondary rain forests of NE Costa Rica, in: Forest biodiversity research, monitoring and modeling: Conceptual background and Old World case studies, edited by: Dallmeier, F. and Comiskey, J. A., Parthenon Publishing, Paris, France, 285–309, 1998.
Christodoulou, M., O'Hara, T., Hugall, A. F., Khodami, S., Rodrigues, C. F., Hilario, A., Vink, A., and Martinez Arbizu, P.: Unexpected high abyssal ophiuroid diversity in polymetallic nodule fields of the northeast Pacific Ocean and implications for conservation, Biogeosciences, 17, 1845–1876, https://doi.org/10.5194/bg-17-1845-2020, 2020.
Colwell, R. K. and Coddington, J. A.: Estimating terrestrial biodiversity through extrapolation, Phil. Trans. R. Soc. Lond. B, 345, 101–118, https://doi.org/10.1098/rstb.1994.0091, 1994.
Connolly, S. R., MacNeil, M. A., Caley, M. J., Knowlton, N., Cripps, E., Hisano, M., Thibaut, L. M., Bhattacharya, B. D., Benedetti-Cecchi, L., Brainard, R. E., Brandt, A., Bulleri, F., Ellingsen, K. E., Kaiser, S., Kröncke, I., Linse, K., Maggi, E., O'Hara, T. D.,, Plaisance, Poore, G. C. B., Sarkar, S. K., Satpathy, K. K., Schückel, U., Williams, A., and Wilson, R. S.: Commonness and rarity in the marine biosphere, P. Natl. Acad. Sci. USA, 111, 8524–8529, 2014.
Conway, J. R., Lex, A., and Gehlenborg, N.: UpSetR: an R package for the visualization of intersecting sets and their properties, Bioinformatics, 33, 2938–2940, https://doi.org/10.1093/bioinformatics/btx364, 2017.
Costello, M. J., Tsai, P., Wong, P. S., Cheung, A. K. L., Basher, Z., and Chaudhary, C.: Marine biogeographic realms and species endemicity, Nat. Commun., 8, 1–10, 2017.
Cuvelier, D., Gollner, S., Jones, D. O., Kaiser, S., Arbizu, P. M., Menzel, L., Mestre, N. C., Morato, T., Pham, C., Pradillon, F., Purser, A., Raschka, U., Sarrazin, J., Simon-Lledó, E., Stewart, I. M., Stuckas, H., Sweetman, A. K. and Colaço, A.: Potential Mitigation and Restoration Actions in Ecosystems Impacted by Seabed Mining, Front. Mar. Sci., 5, 467, https://doi.org/10.3389/fmars.2018.00467, 2018.
De Smet, B., Pape, E., Riehl, T., Bonifácio, P., Colson, L., and Vanreusel, A.: The Community Structure of Deep-Sea Macrofauna Associated with Polymetallic Nodules in the Eastern Part of the Clarion-Clipperton Fracture Zone, Front. Mar. Sci., 4, 103, https://doi.org/10.3389/fmars.2017.00103, 2017.
Easton, E. E. and Thistle, D.: Do some deep-sea, sediment-dwelling species of harpacticoid copepods have 1000-km-scale range sizes?, Mol. Ecol., 25, 4301–4318, 2016.
Etter, R. J. and Bower, A. S.: Dispersal and population connectivity in the deep North Atlantic estimated from physical transport processes, Deep Sea Res. Pt. I, 104, 159–172, https://doi.org/10.1016/j.dsr.2015.06.009, 2015.
Geller, J., Meyer, C., Parker, M., and Hawk, H.: 2013 Redesign of PCR primers for mitochondrial cytochrome c oxidase subunit I for marine invertebrates and application in all-taxa biotic surveys, Mol. Ecol. Res., 13, 851–861, https://doi.org/10.1111/1755-0998.12138, 2013.
Gollner, S., Kaiser, S., Menzel, L., Jones, D. O., Brown, A., Mestre, N. C., and Cuvelier, D.: Resilience of benthic deep-sea fauna to mining activities, Mar. Env. Res., 129, 76–101, 2017.
Greinert, J.: RV SONNE Fahrtbericht/Cruise Report SO242-1: JPI OCEANS Ecological Aspects of Deep-Sea Mining, DISCOL Revisited, Guayaquil – Guayaquil (Equador), 28.07.–25.08.2015, GEOMAR Report, N. Ser. 026. GEOMAR Helmholtz-Zentrum für Ozeanforschung, Kiel, Germany, 290 pp., https://doi.org/10.3289/GEOMAR_REP_NS_26_2015, 2015.
Guggolz, T., Lins, L., Meißner, K., and Brandt, A.: Biodiversity and distribution of polynoid and spionid polychaetes (Annelida) in the Vema Fracture Zone, tropical North Atlantic, Deep-Sea Res. Pt. II, 148, 54–63, 2018.
Haffert, L., Haeckel, M., de Stigter, H., and Janssen, F.: Assessing the temporal scale of deep-sea mining impacts on sediment biogeochemistry, Biogeosciences, 17, 2767–2789, https://doi.org/10.5194/bg-17-2767-2020, 2020.
Hall, C. E. and Gurnis, M.: Strength of fracture zones from their bathymetric and gravitational evolution, J. Geophys. Res.-Sol. Ea., 110, B01402, https://doi.org/10.1029/2004JB003312, 2005.
Harrison, K.: Are deep-sea asellote isopods infaunal or epifaunal?, Crustaceana, 56, 317–319, 1989.
Hauton, C., Brown, A., Thatje, S., Mestre, N. C., Bebianno, M. J., Martins, I., Bettencourt, R., Canals, M., Sanchez-Vidal, A., Shillito, B., Ravaux, J., Zbinden, M., Duperron, S., Mevenkamp, L., Vanreusel, A., Gambi, C., Dell'Anno, A., Danovaro, R., Gunn, V., and Weaver, P.: Identifying Toxic Impacts of Metals Potentially Released during Deep-Sea Mining – A Synthesis of the Challenges to Quantifying Risk, Front. Mar. Sci., 4, 368, https://doi.org/10.3389/fmars.2017.00368, 2017.
Havermans, C., Sonet, G., d'Acoz, C. U., Nagy, Z. T., Martin, P., Riehl, T., and Brix, S.: Genetic and Morphological Divergences in the Cosmopolitan Deep-Sea Amphipod Eurythenes gryllus reveal a Diverse Abyss and a Bipolar Species, Plos One, e74218, https://doi.org/10.1371/journal.pone.0074218, 2013.
Haye, P. A., Varela, A., and Thiel, M.: Genetic signatures of rafting dispersal in algal-dwelling brooders Limnoria spp. (Isopoda) along the SE Pacific (Chile), Mar. Ecol. Prog. Ser., 455, 111–122, https://doi.org/10.3354/meps09673, 2012.
Hessler, R. R.: The Desmosomatidae (Isopoda, Asellota) of the Gay Head-Bermuda transect, Bull. Scripps. Inst. Oceanogr., 15, 1–185, 1970.
Hessler R. R.: Evolution of Arthropod Locomotion: A Crustacean Model, in: Locomotion and Energetics in Arthropods, edited by: Herreid, C. F. and Fourtner, C. R., Springer, Boston, MA, 1981.
Hessler, R. R. and Strömberg, J.-O.: Behavior of janiroidean isopods (Asellota), with special reference to deep-sea genera, Sarsia, 74, 145–159, https://doi.org/10.1080/00364827.1989.10413424, 1989.
Jakiel, A., Palero, F., and Błażewicz, M.: Deep ocean seascape and pseudotanaidae (crustacea: tanaidacea) diversity at the clarion-clipperton fracture Zone, Sci. Rep.-UK, 9, 1–49, 2019.
Janssen, A., Kaiser, S., Meißner, K., Brenke, N., Menot, L., and Arbizu, P. M.: A reverse taxonomic approach to assess macrofaunal distribution patterns in abyssal Pacific polymetallic nodule fields, Plos One, 10, e0117790, https://doi.org/10.1371/journal.pone.0117790, 2015.
Janssen, A., Stuckas, H., Vink, A., and Arbizu, P. M.: Biogeography and population structure of predominant macrofaunal taxa (Annelida and Isopoda) in abyssal polymetallic nodule fields: implications for conservation and management, Mar. Biodiv., 49, 2641–2658, https://doi.org/10.1007/s12526-019-00997-1, 2019.
Jennings, R. M., Golovan, O., and Brix, S.: Integrative species delimitation of desmosomatid and nannoniscid isopods from the Kuril-Kamchatka trench, with description of a hadal species, Prog. Oceanogr., 182, https://doi.org/10.1016/j.pocean.2019.102236, 2020.
Jennings, R. M., Brix, S., Bober, S., Svavarsson, J., and Driskell, A.: More diverse than expected: distributional patterns of Oecidiobranchus Hessler, 1970 (Isopoda, Asellota) on the Greenland-Iceland-Faeroe Ridge based on molecular markers, Mar. Biodiv., 48, 845–857, https://doi.org/10.1007/s12526-018-0857-x, 2018.
Jennings, R. M., Golovan, O., and Brix, S.: Integrative species delimitation of desmosomatid and nannoniscid isopods from the Kuril-Kamchatka trench, with description of a hadal species, Prog. Ocean, 182, 102236, https://doi.org/10.1016/j.pocean.2019.102236, 2020.
Jones, D. O. B., Kaiser, S., Sweetman, A. K., Smith, C. R., Menot, L., Vink, A., Trueblood, D., Greinert, J., Billett, D. S. M., Martinez Arbizu, P., Radziejewska, T., Singh, R., Ingole, B., Stratmann, T., Simon‐Lledo, E., Durden, J. M., and Clark, M. R.: Biological responses to disturbance from simulated deep-sea polymetallic nodule mining, PLoS One, 12, e0171750, https://doi.org/10.1371/journal.pone.0171750, 2017.
Kaiser, S., Barnes, D. K., and Brandt, A.: Slope and deep-sea abundance across scales: Southern Ocean isopods show how complex the deep sea can be, Deep-Sea Res. Pt. II, 54, 1776–1789, 2007.
Kaiser, S., Kihara, T. C., Brix, S., Mohrbeck, I., Janssen, A., and Jennings, R.: Species boundaries and phylogeographic patterns in new species of Nannoniscus G.O. Sars, 1870 (Janiroidea, Nannoniscidae) from the equatorial Pacific nodule province inferred from mtDNA and morphology, Zool. J. Linn. Soc., in press, 2020.
Kapli, P., Lutteropp, S., Zhang, J., Kobert, K., Pavlidis, P., Stamatakis, A., and Flouri, T.: Multi-rate Poisson tree processes for single-locus species delimitation under maximum likelihood and Markov Chain Monte Carlo, Bioinformatics, 33, 1630–1638, 2017.
Katoh, K. and Standley, D. M.: MAFFT multiple sequence alignment software version 7: improvements in performance and usability, Mol. Biol. Evol., 30, 772–780, 2013.
Kniesz, K., Brandt, A., and Riehl, T.: Peritrich epibionts on the hadal isopod species Macrostylis marionae n. sp. from the Puerto Rico Trench used as indicator for sex-specific behaviour, Deep Sea Res. Pt. II, 148, 105–129, https://doi.org/10.1016/j.dsr2.2017.10.007, 2017.
Legendre, P. and Gallagher, E. D.: Ecologically meaningful transformations for ordination of species data, Oecologia, 129, 271–280, https://doi.org/10.1007/s004420100716, 2001.
Lodge, M., Johnson, D., Le Gurun, G., Wengler, M., Weaver, P., and Gunn, V.: Seabed mining: International Seabed Authority environmental management plan for the Clarion–Clipperton Zone. A partnership approach, Mar. Pol., 49, 66–72, 2014.
Malyutina, M. V.: Description of two new species of munnopsid isopods (Crustacea: Isopoda: Asellota) from manganese nodules area of the Clarion-Clipperton Fracture Zone. Pacific Ocean, Zootaxa, 2783, 1–20, 2011.
Malyutina, M. V. and Wägele, J. W.: Redescription of Storthyngura elegans Vanhöffen, 1914 and description of a new deep-sea species of Storthyngura from the Peru Basin, Mitteilungen aus dem Museum für Naturkunde in Berlin, Zoologische Reihe 77, 277–295, https://doi.org/10.1002/mmnz.20010770212, 2001.
Malyutina, M. V., Frutos, I., and Brandt, A.: Diversity and distribution of the deep-sea Atlantic Acanthocope (Crustacea, Isopoda, Munnopsidae), with description of two new species, Deep Sea Res. Pt. II, 48, 130–150, https://doi.org/10.1016/j.dsr2.2017.11.003, 2018.
Malyutina, M. V., Kihara, T. C., and Brix, S.: A new genus of Munnopsidae Lilljeborg, 1864 (Crustacea, Isopoda), with descriptions of two abyssal new species from the Clarion Clipperton Fracture Zone, north-eastern tropical Pacific, Mar. Biodivers., 50, 42, https://doi.org/10.1007/s12526-020-01061-z, 2020.
Marki, P. Z., Fjeldsa, J., Irestedt, M., and Jonsson, K. A.: Molecular phylogenetics and species limits in a cryptically coloured radiation of Australo-Papuan passerine birds (Pachycephalidae: Collurcincla), Mol. Phylogenet. Evol., 124, 100–105, 2018.
Martínez Arbizu, P. and Haeckel, M.: RV SONNE Fahrtbericht/Cruise Report SO239: EcoResponse Assessing the Ecology, Connectivity and Resilience of Polymetallic Nodule Field Systems, Balboa (Panama) – Manzanillo (Mexico) 11 March–30 April 2015, GEOMAR Report, N. Ser. 025, GEOMAR Helmholtz-Zentrum für Ozeanforschung, Kiel, Germany, 2015.
McClain, C. R. and Mincks Hardy, S.: The dynamics of biogeographic ranges in the deep sea, Proc. R. Soc. B, 277, 3533–3546, https://doi.org/10.1098/rspb.2010.1057, 2010.
Menzel, L., George, K. H., and Arbizu, P. M.: Submarine ridges do not prevent large-scale dispersal of abyssal fauna: a case study of Mesocletodes (Crustacea, Copepoda, Harpacticoida), Deep Sea Res. Pt. I, 58, 839–864, 2011.
Miljutin, D. M., Miljutina, M. A., Arbizu, P. M., and Galéron, J.: Deep-sea nematode assemblage has not recovered 26 years after experimental mining of polymetallic nodules (Clarion-Clipperton Fracture Zone, Tropical Eastern Pacific), Deep Sea Res. Pt. I, 58, 885–897, https://doi.org/10.1016/j.dsr.2011.06.003, 2011.
Oebius, H. U., Becker, H. J., Rolinski, S., and Jankowskic, J. A.: Parametrization and evaluation of marine environmental impacts produced by deep-sea manganese nodule mining, Deep Sea Res. Pt. II, 48, 3453–3467, https://doi.org/10.1016/S0967-0645(01)00052-2, 2001.
Osborn, K. J.: Relationships within the Munnopsidae (Crustacea, Isopoda, Asellota) based on three genes, Zool. Scr., 38, 617–635 https://doi.org/10.1111/j.1463-6409.2009.00394.x, 2009.
Oksanen, J., Kindt, R., Legendre, P., O'Hara, B., Simpson, G. L., Solymos, P., Stevens, M. H. H., and Wagner, H.: The vegan Package, Community ecology package, 10, 631–637, 2008.
Palumbi, S., Martin, A., Romano, S., Stice, L., and Grabowski, G.: The simple fool's guide to PCR, version 2.0. Spec Pub University of Hawaii, Department of Zoology and Kewalo Marine Laboratory, 1991.
Pfenninger, M. and Schwenk, K.: Cryptic animal species are homogeneously distributed among taxa and biogeographical regions, BMC Evol. Biol., 7, 121, https://doi.org/10.1186/1471-2148-7-121, 2007.
Ramirez-Llodra, E., Tyler, P. A., Baker, M. C., Bergstad, O. A., Clark, M. R., Escobar, E., Lisa A. Levin, L. A., Menot, L., Rowden, A. R., Smith, C. R., and Van Dover, C. L.: Man and the Last Great Wilderness: Human Impact on the Deep Sea, Plos One, 6, e22588, https://doi.org/10.1371/journal.pone.0022588, 2011.
Raupach, M. J., Malyutina, M., V., Brandt, A., and Wägele, W.: Molecular data reveal a highly diverse species flock within the munnopsid deep-sea isopod Betamorpha fusiformis (Barnard, 1920) (Crustacea: Isopoda: Asellota) in the Southern Ocean, Deep Sea Res. Pt. II, 54, 1820–1830, https://doi.org/10.1016/j.dsr2.2007.07.009, 2007.
Rex, M. A., Stuart, C. T., Hessler, R. R., Allen, J. A., Sanders, H. L., and Wilson, G. D.: Global-scale latitudinal patterns of species diversity in the deep-sea benthos, Nature, 365, 636–639, 1993.
Riehl, T. and De Smet, B.: Macrostylis metallicola sp. nov.–an isopod with geographically clustered genetic variability from a polymetallic-nodule area in the Clarion-Clipperton Fracture Zone, Peerj, 8, e8621, https://doi.org/10.7717/peerj.8621, 2020.
Riehl, T. and Kaiser, S.: Conquered from the deep sea? A new deep-sea isopod species from the Antarctic shelf shows pattern of recent colonization, Plos One, 7, e49354, https://doi.org/10.1371/journal.pone.0049354, 2012.
Riehl, T., Brenke, N., Brix, S., Driskell, A., Kaiser, S., and Brandt, A.: Field and Laboratory Methods for DNA Studies on Deep-sea Isopod Crustaceans, Pol. Pol. Res., 35, 203–224, 2014.
Riehl, T., Lins, L., and Brandt, A.: The effects of depth, distance, and the Mid-Atlantic Ridge on genetic differentiation of abyssal and hadal isopods (Macrostylidae), Deep Sea Res. Pt. II, 148, 74–90, 2018.
Riehl, T., Golovan, O., and Malyutina, M.: Chapter 19, Isopoda: A review on distribution and species richness patterns along the nw Pacific, in: Biogeographic Atlas of the Deep NW Pacific Fauna, edited by: Saeedi H. and Brandt A., Advanced Books, Sofia, Pensoft, chap. 19, 415–460, https://doi.org/10.3897/ab.e51315, 2020.
Roberts, C. M. and Hawkins, J. P.: Extinction risk in the sea, Trends in Ecol. Evol., 14, 241–246, 1999.
Rognes, T., Flouri, T., Nichols, B., Quince, C., and Mahé F.: VSEARCH: a versatile open source tool for metagenomics, Peerj, 4, e2584, https://doi.org/10.7717/peerj.2584, 2016.
Ronquist, F., Teslenko, M., van der Mark, P., Ayres, D. L. Darling, A., Hohna, S., Larget, B., Liu, L., Schard, M. A., and Huelsenbeck, J. P.: MrBayes 3.2: Efficient Bayesian phylogenetic inference and model choice across a large model space, Syst. Biol., 61, 539–542, 2012.
Schnurr, S., Osborn, K. J., Malyutina, M., Jennings, R., Brix, S., Driskell, A., Svavarsson, J., and Arbizu, P. M.: Hidden diversity in two species complexes of munnopsid isopods (Crustacea) at the transition between the northernmost North Atlantic and the Nordic Seas, Mar. Biodiv., 48, 813–843, 2018.
Simpson, G. G.: Mammals and the nature of continents, Am. J. Sci., 241, 1–31, 1943.
Smith, C. R., Gaines, S., Friedlander, A., Morgan, C., Thurnherr, A., Mincks, S., Les Watling, A. R., Clark, M., Baco-Taylor, A., Bernardino, A., De Leo, F., Dutrieux, P., Rieser, A., Kittinger, J., Padilla-Gamino, J., Prescott, R., and Srsen, P.: Rationale and recommendations for the establishment of preservation reference areas for nodule mining in the Clarion-Clipperton Zone. Fourteenth session, Kingston, Jamaica, 26 May–6 June 2008, available at: https://www.isa.org.jm/files/documents/EN/14Sess/LTC/ISBA-14LTC-2.pdf (last access: 25 November 2020), Legal and Technical Commission, International Seabed Authority, Technical document no. ISBA/14/LTC/2, 2008.
Sørensen, T.: A method of establishing groups of equal amplitude in plant sociology based on similarity of species content and its application to analyses of the vegetation on Danish commons, Biol. Skr. Dan. Vid. Sel., 5, 1–34, 1948.
Stuart, C. T., Rex, M. A., and Etter, R. J.: Large-scale spatial and temporal patterns of deep-sea benthic species diversity, Ecosystems of the World, chap. 10, 295–312, 2003.
Svavarsson, J.: Description of the male of Pseudomesus brevicornis Hansen, 1916 (Isopoda, Asellota, Desmosomatidae) and rejection of the family Pseudomesidae, Sarsia, 69, 37–44, https://doi.org/10.1080/00364827.1984.10420587, 1984.
Taboada, S., Riesgo, A., Wiklund, H., Paterson, G. L., Koutsouveli, V., Santodomingo, N., Dale, A. C., Smith, C. R., Jones, D. O. B., Dahlgren, T. G., and Glover, A. G.: Implications of population connectivity studies for the design of marine protected areas in the deep sea: An example of a demosponge from the Clarion-Clipperton Zone, Mol. Ecol., 27, 4657–4679, 2018.
Thiel, H. and Forschungsverbund Tiefsee-Umweltschutz: Evaluation of the environmental consequences of polymetallic nodule mining based on the results of the TUSCH Research Association, Deep Sea Res. Pt II, 48, 3433–3452, 2001.
Vanreusel, A., Hilario, A., Ribeiro, P. A., Menot, L., and Arbizu, P. M.: Threatened by mining, polymetallic nodules are required to preserve abyssal epifauna, Sci. Rep.-UK, 6, 26808, https://doi.org/10.1038/srep26808, 2016.
Volz, J. B., Mogollón, J. M., Geibert, W., Arbizu, P. M., Koschinsky, A., and Kasten, S.: Natural spatial variability of depositional conditions, biogeochemical processes and element fluxes in sediments of the eastern Clarion-Clipperton Zone, Pacific Ocean, Deep-Sea Res. Pt. I, 140, 159–172, 2018.
Vrijenhoek, R. C., Schutz, S. J., Gustafson, R. G., and Lutz, R. A.: Cryptic species of deep-sea clams (Mollusca: Bivalvia: Vesicomyidae) from hydrothermal vent and cold-water seep environments, Deep Sea Res. Pt. I, 41, 1171–1189, 1994.
Wedding, L. M., Friedlander, A. M., Kittinger, J. N., Watling, L., Gaines, S. D., Bennett, M., Hardy, S. M., and Smith, C. R.: From principles to practice: a spatial approach to systematic conservation planning in the deep sea, Proc. R. Soc. B., 280, 20131684, https://doi.org/10.1098/rspb.2013.1684, 2013.
Wedding, L. M., Reiter, S. M., Smith, C. R., Gjerde, K. M., Kittinger, J. N., Friedlander, A. M., S. D. Gaines, M. R. Clark, A. M., Thurnherr, Hardy, M., and Crowder, L. B.: Managing mining of the deep seabed, Science, 349, 144–145, https://doi.org/10.1126/science.aac6647, 2015.
Wilson, G. D.: Macrofauna abundance, species diversity and turnover at three sites in the Clipperton-Clarion Fracture Zone, Mar. Biodiv., 47, 323–347, 2017.