the Creative Commons Attribution 4.0 License.
the Creative Commons Attribution 4.0 License.
 | 16 Dec 2020
Reduced growth with increased quotas of particulate organic and inorganic carbon in the coccolithophore Emiliania huxleyi under future ocean climate change conditions
Yong Zhang
Sinéad Collins
Effects of ocean acidification and warming on marine primary producers can be modulated by other environmental factors, such as levels of nutrients and light. Here, we investigated the interactive effects of five oceanic environmental drivers (CO2, temperature, light, dissolved inorganic nitrogen and phosphate) on the growth rate, particulate organic carbon (POC) and particulate inorganic carbon (PIC) quotas of the cosmopolitan coccolithophore Emiliania huxleyi. The population growth rate increased with increasing temperature (16 to 20 ∘C) and light intensities (60 to 240 ) but decreased with elevated pCO2 concentrations (370 to 960 µatm) and reduced availability of nitrate (24.3 to 7.8 µmol L−1) and phosphate (1.5 to 0.5 µmol L−1). POC quotas were predominantly enhanced by the combined effects of increased pCO2 and decreased availability of phosphate. PIC quotas increased with decreased availability of nitrate and phosphate. Our results show that concurrent changes in nutrient concentrations and pCO2 levels predominantly affected the growth, photosynthetic carbon fixation and calcification of E. huxleyi and imply that plastic responses to progressive ocean acidification, warming, and decreasing availability of nitrate and phosphate reduce the population growth rate while increasing cellular quotas of particulate organic and inorganic carbon of E. huxleyi, ultimately affecting coccolithophore-related ecological and biogeochemical processes.
- Article
(2694 KB) - Full-text XML
-
Supplement
(1651 KB) - BibTeX
- EndNote


Ocean acidification (OA), due to continuous oceanic absorption of anthropogenic CO2, is occurring alongside ocean warming. This, in turn, leads to shoaling in the upper mixed layer (UML) and a consequent reduction in the upward transport of nutrients into the UML. These ocean changes expose phytoplankton cells within the UML to multiple simultaneous stressors or drivers, and organismal responses to these drivers can affect both the trophic and the biogeochemical roles of phytoplankton (see reviews by Boyd et al., 2015; Gao et al., 2019; and literatures referenced therein). While most studies on the effects of ocean global climate changes on marine primary producers have focused on organismal responses to one, two or three environmental drivers, there is an increasing awareness of the need to measure the combined effects of multiple drivers (see reviews by Riebesell and Gattuso, 2015; Boyd et al., 2018; Gao et al., 2019; Kwiatkowski et al., 2019). For this purpose, several manipulative experimental approaches have been recommended (Boyd et al., 2018). One approach using many unique combinations of different numbers of drivers showed that both short- and long-term growth responses were, on average, explained by the dominant single driver in a multi-driver environment, but this result relies on having many (> 5) drivers with known or measured large-effect single drivers (Brennan and Collins, 2015; Brennan et al., 2017). For experiments with multiple drivers where interactions are likely to preclude making predictions from single drivers, where average responses are not the most informative ones or where logistics preclude using a very large number of multi-driver environments, Boyd et al. (2010) suggested an “environmental cluster” method where key drivers (such as temperature, light intensity, nutrient concentration, CO2 and Fe) are covaried within experiments, allowing the investigation of physiological responses of phytoplankton to concurrent changes in the clustered drivers. This approach examines responses to projected overall environmental shifts rather than pulling apart the biological or statistical interactions between responses to individual drivers. To our knowledge, studies to date have employed such a driver clustering approach to investigate responses of diatoms Fragilariopsis cylindrus, Thalassiosira pseudonana and Skeletonema costatum and the prymnesiophyte Phaeocystis antarctica to combinations of drivers projected for 2100 (K. Xu et al., 2014; J. Xu et al., 2014; Boyd et al., 2016).
An environmental-cluster approach is especially useful when drivers are known to interact in terms of the organismal responses they elicit, as is the case for OA, light levels and key nutrients acting on the population growth rate and carbon fixation (Boyd et al., 2016). For example, in the cosmopolitan coccolithophore Emiliania huxleyi, interactive effects of OA and light have shown that OA increased the population growth rate and photosynthetic carbon fixation under low light, whereas it slightly lowered the population growth rate and photosynthetic carbon fixation under high light (Zondervan et al., 2002; Kottmeier et al., 2016). In addition, photosynthetic carbon fixation was further enhanced by longer light exposure at high pCO2 levels (Zondervan et al., 2002). On the other hand, OA can exacerbate the negative impact of solar UV radiation on photosynthetic carbon fixation and calcification in E. huxleyi under nutrient-replete conditions (Gao et al., 2009) but can increase calcification (coccolith volume) and the particulate organic carbon (POC) quota under phosphate-limited conditions (Leonardos and Geider, 2005; Müller et al., 2017), demonstrating that the effects of OA on calcification are likely nutrient dependent. On the other hand, ocean warming, which occurs alongside OA, is known to increase coccolith length, POC, particulate organic nitrogen (PON) and particulate inorganic carbon (PIC) production rates of several E. huxleyi strains (Rosas-Navarro et al., 2016; Feng et al., 2017). Warming has also been shown to increase the optimal pCO2 levels for growth, POC and PIC production rates (Sett et al., 2014). In one case warming was found to compensate for the negative impact of OA on the growth rate under low light intensity (Feng et al., 2008). Nevertheless, decreased photosynthetic carbon fixation and calcification at a reduced carbonate saturation state (lowered Ca2+ concentrations) were exacerbated by warming treatment (Xu et al., 2011). Overall, there is strong evidence that understanding the plastic responses of this key calcifier to ocean changes requires investigating responses to the overall expected shift in the environment, in addition to the detailed studies to date on individual drivers, due to the sheer number of interactions between individual drivers on traits that affect the trophic and biogeochemical roles of E. huxleyi.
Despite known interactions among two- and three-way combinations of OA, temperature, light, phosphate levels and nitrogen levels, there have been few empirical studies investigating effects of the larger cluster projected for future surface ocean changes. The data to date show that interactions among drivers can affect both the direction and magnitude of trait changes in biogeochemically important taxa. In addition, based on single- or two-driver studies, changes in temperature, pCO2, light, dissolved inorganic nitrogen (DIN) and dissolved inorganic phosphate (DIP) in combination are predicted to affect primary productions (Barton et al., 2016; Monteiro et al., 2016; Boyd et al., 2018; Gao et al., 2019; Kwiatkowski et al., 2019). Understanding the trait-based responses of coccolithophores to future ocean changes is important for projections of changes in the biogeochemical roles of phytoplankton, such as biological carbon pump efficiency (Rost and Riebesell, 2004).
In order to understand the combined effects of pCO2, temperature, light, DIN and DIP on functional traits, we incubated Emiliania huxleyi (Lohmann) under different combinations of environmental conditions that represented subsets of, and eventually the complete set of environments for, this environmental driver cluster. We recently examined the interactive effects of light intensity and the CO2 level on the growth rate and POC and PIC quotas of E. huxleyi under nutrient-replete, low DIN or low DIP concentrations (Zhang et al., 2019). Light, CO2, DIN and DIP levels usually change simultaneously with temperature and temperature-modulated responses of E. huxleyi to other environmental drivers (Gafar and Schulz, 2018; Tong et al., 2019). In addition, warming or cooling can directly influence the activity of enzymes, thus directly modulating metabolic rates (Sett et al., 2014). Because of the overwhelming evidence that temperature can act as a general modulator of organismal responses, we use the present study to examine how the addition of temperature as a key driver in the environmental change cluster can modulate the combined effects of CO2, light and nutrients. We found that future ocean scenario treatments with OA, warming, increased light and reduced availability of nutrients led to a lower growth rate and larger POC and PIC quotas of E. huxleyi.
2.1 Experimental setup
The Emiliania huxleyi strain PML B92/11 was originally isolated from coastal waters off Bergen, Norway, and obtained from the Plymouth algal culture collection, UK. The average levels of pCO2, temperature, light, dissolved inorganic nitrate (DIN) and dissolved inorganic phosphate (DIP) were set up according to recorded data in Norwegian coastal waters during 2000 to 2007 and projected for 2100 in high latitudes (Larsen et al., 2004; Locarnini et al., 2006; Omar et al., 2010; Boyd et al., 2015) (Table S1 in the Supplement). Emiliania huxleyi was cultured with a 12 h/12 h light/dark cycle in thermo-controlled incubators in Aquil medium, which was prepared according to Sunda et al. (2005) with the addition of 2200 µmol L−1 of bicarbonate to achieve the total alkalinity (TA) of 2200 µmol L−1. Initial DIN and DIP concentrations were 24 and 1.5 µmol L−1, respectively, and initial light intensity was 60 . The experiment was conducted in five steps (Fig. 1). Considering ocean acidification and warming as the key drivers for ocean climate changes, we first established four “baseline” treatments where the pCO2 and temperature drivers were combined in a fully factorial way: low pCO2 + low temperature (LCLT), high pCO2 + low temperature (HCLT), low pCO2 + high temperature (LCHT) and high pCO2 + high temperature (HCHT). Since reduced availability of nutrients and increased light exposures are triggered by warming-enhanced stratification, we then added additional single or pairs of drivers to each of these baseline treatments (Fig. S1 in the Supplement). In step 1, low light (LL; 60 ) was supplied; in step 2, high light (HL; 240 ) was exposed. HL was then maintained for the rest of the experiment. In step 3, low nitrogen was supplied and high phosphate levels were maintained (LNHP). In step 4, low phosphate was used and high nitrogen levels were restored (HNLP). In step 5, both nitrogen and phosphate were low (LNLP) (Figs. 1 and S1). In all cases, the cells were acclimated to each unique stressor cluster for at least 14–16 generations before physiological and biochemical parameters were measured. Although this stepwise design introduces a historical effect, physiological traits are generally reported after 10 to 20 generations' acclimation to OA treatment (Perrin et al., 2016; Tong et al., 2016; Li et al., 2017), so the historical effects here are similar to those that would be introduced with standard methods in other physiology studies (Tong et al., 2016; Zhang et al., 2019). Since individually reduced availability of nitrate or phosphate decreased growth, did not change the POC quota, and enhanced the PIC quota under optimal light intensity (HL in this study) in the same E. huxleyi strain (Zhang et al., 2019), we hypothesized that the combination of DIN and DIP limitation would result in a similar trend under the pCO2 and/or temperature combined treatments. Therefore, we added stepwise nitrate and/or phosphate drivers (Fig. 1). Such a stepwise reduction in nutrients levels would be useful for us to analyze the effects of nitrate and phosphate separately and would be expected to have implications for the cells episodically exposed to different levels of nutrients in the sea.
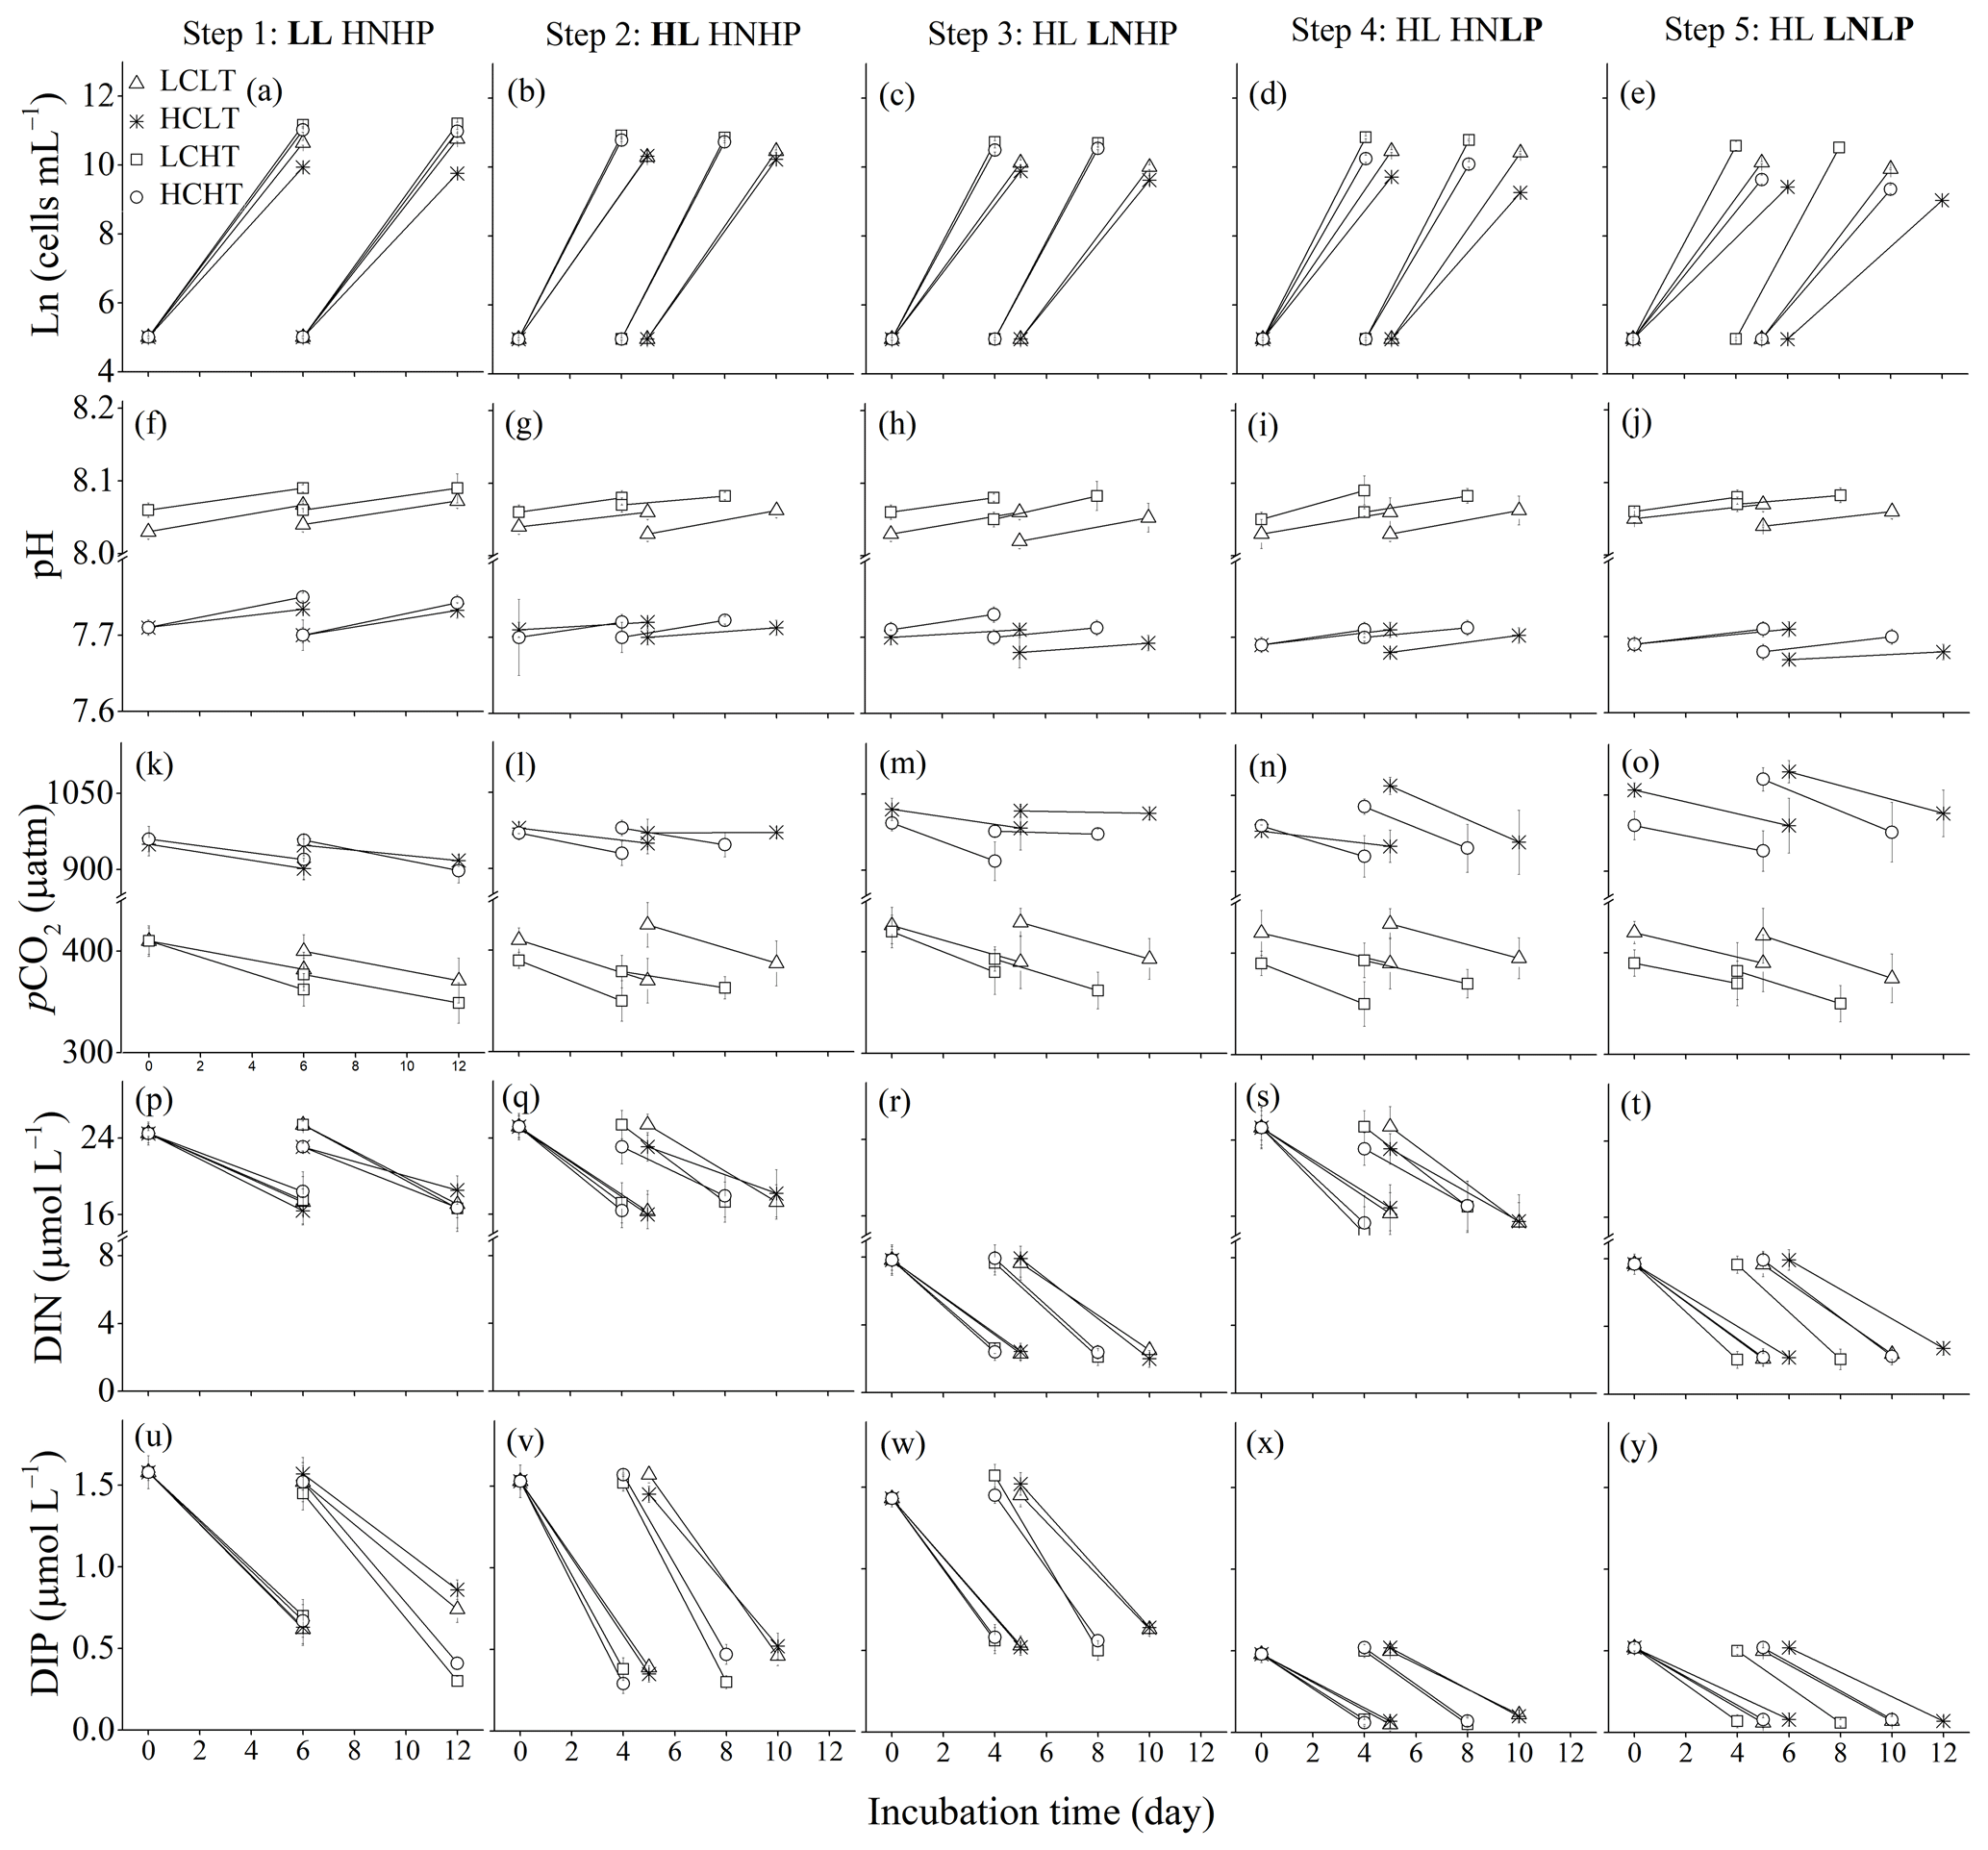
Figure 1Four baseline environments were used where pCO2 and temperature (temp) were combined in all pairwise combinations: low pCO2 + low temp (LCLT, △), high pCO2 + low temp (HCLT, ∗), low pCO2 + high temp (LCHT, □) and high pCO2 + high temp (HCHT, ◦). Additional stressors were then added to each of the four baseline environments. In step 1, low light (LL) was supplied. In step 2, high light (HL) was supplied. HL was then maintained for the rest of the experiment. In step 3, low nitrogen was supplied and high phosphate levels were restored (LNHP). In step 4, low phosphate was supplied and high nitrogen levels were restored (HNLP). In step 5, both nitrogen and phosphate were low (LNLP). Experimental steps were carried out in a consecutive manner. At each step, we measured the cell concentration (a–e), medium pHT value (f–j), medium pCO2 level (k–o), dissolved inorganic nitrogen (DIN) (p–t) and dissolved inorganic phosphate (DIP) (u–y) concentrations in the media in the beginning and at the end of the incubations. Respectively, LC and HC represent pCO2 levels of about 370 and 960 µatm, LT and HT 16 and 20 ∘C, LL and HL 60 and 240 of photosynthetically active radiation (PAR), HN and LN 24.3 and 7.8 at the beginning of the incubation, and HP and LP 1.5 and 0.5 at the beginning of the incubations. The samples were taken on the last day of the cultures in each treatment. The values were indicated as the means ± SD of four replicate populations for each treatment.
For step 1, and were modified to 24 and 1.5 µmol L−1, respectively, which is the HNHP treatment in the synthetic seawater (Sunda et al., 2005) (Fig. S1). The seawater was dispensed into four glass bottles, and two bottles of seawater were placed at 16 ∘C (LT) in an incubator (HP400G-XZ, Ruihua, Wuhan) and aerated for 24 h with filtered (PVDF, 0.22 µm pore size, Haining) air containing 400 µatm (LC) or 1000 µatm of pCO2 (HC). Another two bottles of seawater were maintained at 20 ∘C (HT) in the other chamber and also aerated with LC or HC air as described above. The dry air–CO2 mixture was humidified with deionized water prior to the aeration to minimize evaporation. The LCLT, HCLT, LCHT and HCHT seawater samples (Figs. 1a and S1) were then filtered (0.22 µm pore size, Polycap 75 AS, Whatman) and carefully pumped into autoclaved 250 mL polycarbonate bottles (Nalgene, four replicate flasks each for LCLT, HCLT, LCHT and HCHT, a total of 16 flasks at the beginning of the experiment) with no headspace to minimize gas exchange. The flasks were inoculated at a cell density of about 150 cells mL−1. The volume of the inoculum was calculated (see below), and the same volume of seawater was taken out from the bottles before inoculation. The samples were initially cultured at 60 (LL) of photosynthetically active radiation (PAR) (measured using a PAR detector, PMA 2132 from Solar Light Company) under LCLT, HCLT, LCHT and HCHT conditions for eight generations (6 d), and then the samples were diluted to their initial concentrations and grown for another eight generations (6 d) (Fig. 1a). Samples in culture bottles were mixed twice a day at 09:00 and 17:00 (Beijing Time). At the end of the incubation, sub-samples were taken for measurements of cell concentration, POC and total particulate carbon (TPC) quotas, TA, pH, and nutrient concentrations.
In step 2, samples grown under the previous conditions were transferred at the end of the cultures from 60 (LL) to 240 (HL) of PAR with initial cell concentrations of 150 cells mL−1 and acclimated to the HL for eight generations (5 d in 16 ∘C environment, 4 d in 20 ∘C environment) (Fig. 1b). The cultures were then diluted to achieve the initial cell concentration and incubated under the HL for another eight generations (the fifth day in 16 ∘C environment and the fourth day in 20 ∘C environment) before sub-samples were taken for measurements.
In step 3, step 4 and step 5, and concentrations were set to be 8 and 1.5 µmol L−1 for the LNHP treatment, and 24 and 0.5 µmol L−1 for the HNLP treatment, and 8 and 0.5 µmol L−1 for the LNLP treatment, respectively (Fig. 1c–e). The LCLT, HCLT, LCHT and HCHT conditions were step 1 conditions; now we are into steps 3–5. Under 240 (HL) of PAR, cell samples with an initial concentration of 150 cells mL−1 were transferred from HNHP conditions (step 2) to LNHP conditions (step 3) and acclimated to LNHP conditions for eight generations (5 d in 16 ∘C environment, 4 d in 20 ∘C environment) (Fig. 1c). The cultures were then diluted back to the initial cell concentrations and incubated in the LNHP conditions (step 3) for a further eight generations. On the last day of the incubation (the fifth day in 16 ∘C environment and the fourth day in 20 ∘C environment), sub-samples were taken for measurements of the parameters.
After that, cell samples were transferred stepwise from HNHP conditions (step 2, Fig. 1b) to HNLP conditions (step 4, Fig. 1d) and then from HNLP conditions to LNLP conditions (step 5, Fig. 1e). Cell samples were acclimated for eight generations at HNLP and LNLP conditions, respectively, and followed by another eight generations of incubations for 4 d at HT and 5 d at LT. On the fourth day (for populations in high-temperature environments) or the fifth day (for populations in low-temperature environments), sub-samples were taken for measurements (Fig. 1d and e). At low nutrient concentrations, maximal cell concentrations were limited by nutrients (Rouco et al., 2013; Rokitta et al., 2016). To check whether cells sampled were in the exponential-growth phase at each nutrient level, we examined cell concentrations every day at LCHT or LCLT and high-light conditions (Fig. S2 in the Supplement). We found that cell concentrations were in the exponential growth phase during the first and fifth days in HT conditions and during the first and seventh days in LT conditions. In this study, we took samples on the fourth day in HT conditions and on the fifth day in LT conditions, and thus cells sampled were in the exponential-growth phase of E. huxleyi.
In the previous work (Zhang et al., 2019), we transferred E. huxleyi cells stepwise from 80 to 120 , then to 200, to 320 and to 480 , at both LC and HC levels under HNHP, LNHP or HNLP conditions, respectively. In this study, we transferred the same strain from LL to HL under HNHP conditions, then from HNHP to LNHP or HNLP, and from HNLP to LNLP under HL conditions under four baseline CO2 and temperature treatments, in an effort to elucidate the interactive and combined effects of temperature, CO2, DIN and DIP (Table S2 in the Supplement), in contrast to the previous work carried out under a constant temperature (Zhang et al., 2019).
2.2 Nutrient concentrations and carbonate-chemistry measurements
On the first and last days of the incubations, 20 mL samples for the determination of inorganic nitrogen and phosphate concentrations were taken at the same time using a filtered syringe (0.22 µm pore size, Haining) and measured by using a scanning spectrophotometer (DU 800, Beckman Coulter) according to Hansen and Koroleff (1999). The nitrate was reduced to nitrite by zinc cadmium reduction, and then total nitrite concentration was measured. In parallel, 25 mL samples were taken for the determination of total alkalinity (TA) after being filtered (0.22 µm pore size, syringe filter) under moderate pressure using a pump (GM-0.5A, Jinteng) and stored in the dark at 4 ∘C for less than 7 d. TA was measured at 20 ∘C by potentiometric titration (AS-ALK1+, Apollo SciTech) according to Dickson et al. (2003). Samples for pHT (total scale) determinations were syringe-filtered (0.22 µm pore size), and the bottles were filled from bottom to top with overflow and closed immediately without headspace. The pHT was immediately measured at 20 ∘C by using a pH meter (benchtop pH, Orion 8102BN) which was calibrated with buffers (Tris-HCl, Hanna) at pH 4.01, 7.00 and 10.00. Carbonate-chemistry parameters were calculated from TA, pHT, phosphate (at 1.5 or 0.5 µmol L−1), temperature (at 16 or 20 ∘C) and salinity using the CO2 system calculation in Microsoft Excel software (Pierrot et al., 2006). K1 and K2, the first and second carbonic acid constants, were taken from Roy et al. (1993).
2.3 Cell concentration measurements
On the last day of the incubation, ∼ 25 mL samples (eight samples) were taken at the same time (about 13:00). Cell concentration and cell diameter (D) were measured using a Z2 Coulter particle counter and size analyzer (Beckman Coulter). The diameter of detected particles was set to be 3 to 7 µm in the instrument, which excluded detached coccoliths (Müller et al., 2012). Cell concentration was also measured by microscopy (Zeiss), and the variation in the measured cell concentration between the two methods was ±7.9 % (Zhang et al., 2019). The average growth rate (μ) was calculated for each replicate according to the equation , where N0 was 150 cells mL−1 and N1 was the cell concentration in the last day of the incubation; d was the growth period in days. Emiliania huxleyi cells were spherical, and their cell volumes with coccoliths were calculated according to the equation .
2.4 Total particulate carbon (TPC) and particulate organic carbon (POC) measurements
For the determination of TPC and POC quotas, 100 mL samples were filtered onto GF/F filters (pre-combusted at 450 ∘C for 6 h) at the same time in each treatment. TPC and POC samples were stored in the dark at −20 ∘C. For POC measurements, samples were fumed with HCl for 12 h to remove inorganic carbon, and samples for TPC measurements were not treated with HCl. All samples were dried at 60 ∘C for 12 h and analyzed using a Thermo Scientific FLASH 2000 CHNS/O elemental analyzer (Thermo Fisher, Waltham, MA). The particulate inorganic carbon (PIC) quota was calculated as the difference between the TPC quota and the POC quota. POC and PIC production rates were calculated by multiplying cellular contents with μ (d−1). Variations in measured carbon content between the four replicates were calculated to be 1 %–24 % in this study.
2.5 Data analysis
Firstly, we examined the interactions of temperature, pCO2 and light under nutrient-replete (HNHP) conditions. Here, the effects of temperature, pCO2, light intensity and their interaction on growth rate and POC and PIC quotas were tested using a three-way analysis of variance (ANOVA). Secondly, we examined the effects of nutrient limitation in the different pCO2 and temperature environments under the high light intensity (HL). Here, the effects of temperature, pCO2, dissolved inorganic nitrogen (DIN), dissolved inorganic phosphate (DIP) and their interaction on the growth rate and POC and PIC quotas were tested using a four-way ANOVA. Finally, a one-way ANOVA was used to test the differences in the growth rate and POC and PIC quotas between present (defined as low levels of pCO2, temperature and light along with high levels of DIN and DIP (LC LT LL HN HP)) and future (defined as higher levels of pCO2, temperature and light along with low levels of DIN and DIP (HC HT HL LN LP)) ocean scenarios. A Tukey post hoc test was performed to identify the differences between two temperatures, two pCO2 levels, and two DIN or two DIP treatments. The normality of residuals was conducted with a Shapiro–Wilk test, and a Levene test was conducted graphically to test for homogeneity of variances. A generalized least-squares (GLS) model was used to stabilize heterogeneity if variances were non-homogeneous. All statistical calculations were performed using R Core Team (2018).
In order to quantify the individual effect of nitrate concentration or phosphate concentration on the physiological and biochemical parameters, we calculated the change ratio (R) of physiological rates according to the equation , where MLNHP or HNLP or HNHP represents measured trait values in LNHP or HNLP or HNHP conditions and “∣” denotes the absolute value (Schaum et al., 2013). We then calculated the expected growth rate, POC quota and PIC quota in LNLP conditions based on the measured trait values in HNHP conditions and the change ratios in LNHP and HNLP conditions according to a linear model: for the growth rate and POC quota; for the PIC quota (Brennan and Collins, 2015). We tested the significant differences between the expected trait values (ELNLP) and the measured trait values (MLNLP) in LNLP conditions by a one-way ANOVA (Fig. S3 in the Supplement). We also calculated the extent of synergy between LNHP and HNLP on the growth rate, POC quota and PIC quota according to the equation . Please see the “Discussion” section for more information.
3.1 Carbonate-chemistry parameters and nutrient concentrations
During the incubations, pHT values increased due to organismal activity by, on average, 0.03 ± 0.01 in LCLT, by 0.01 ± 0.01 in HCLT, by 0.02 ± 0.01 in LCHT and by 0.02 ± 0.01 in HCHT conditions (Fig. 1f–j; Table 1). Correspondingly, seawater pCO2 concentrations decreased by 8.8 % ± 1.1 % in LCLT, by 6.1 % ± 4.4 % in HCLT, by 6.6 % ± 1.7 % in LCHT, and by 5.4 % ± 3.6 % in HCHT conditions (Fig. 1k–o; Table 1).
Table 1Carbonate-chemistry parameters at the end of the incubation. The values are means ± SD of four replicate populations. LL and HL represent 60 and 240 of photosynthetically active radiation (PAR), respectively; HN and LN represent 24.3 and 7.8 µmol L−1 of DIN at the beginning of the incubation; HP and LP represent 1.5 and 0.5 µmol L−1 of DIP at the beginning of the incubation, respectively.
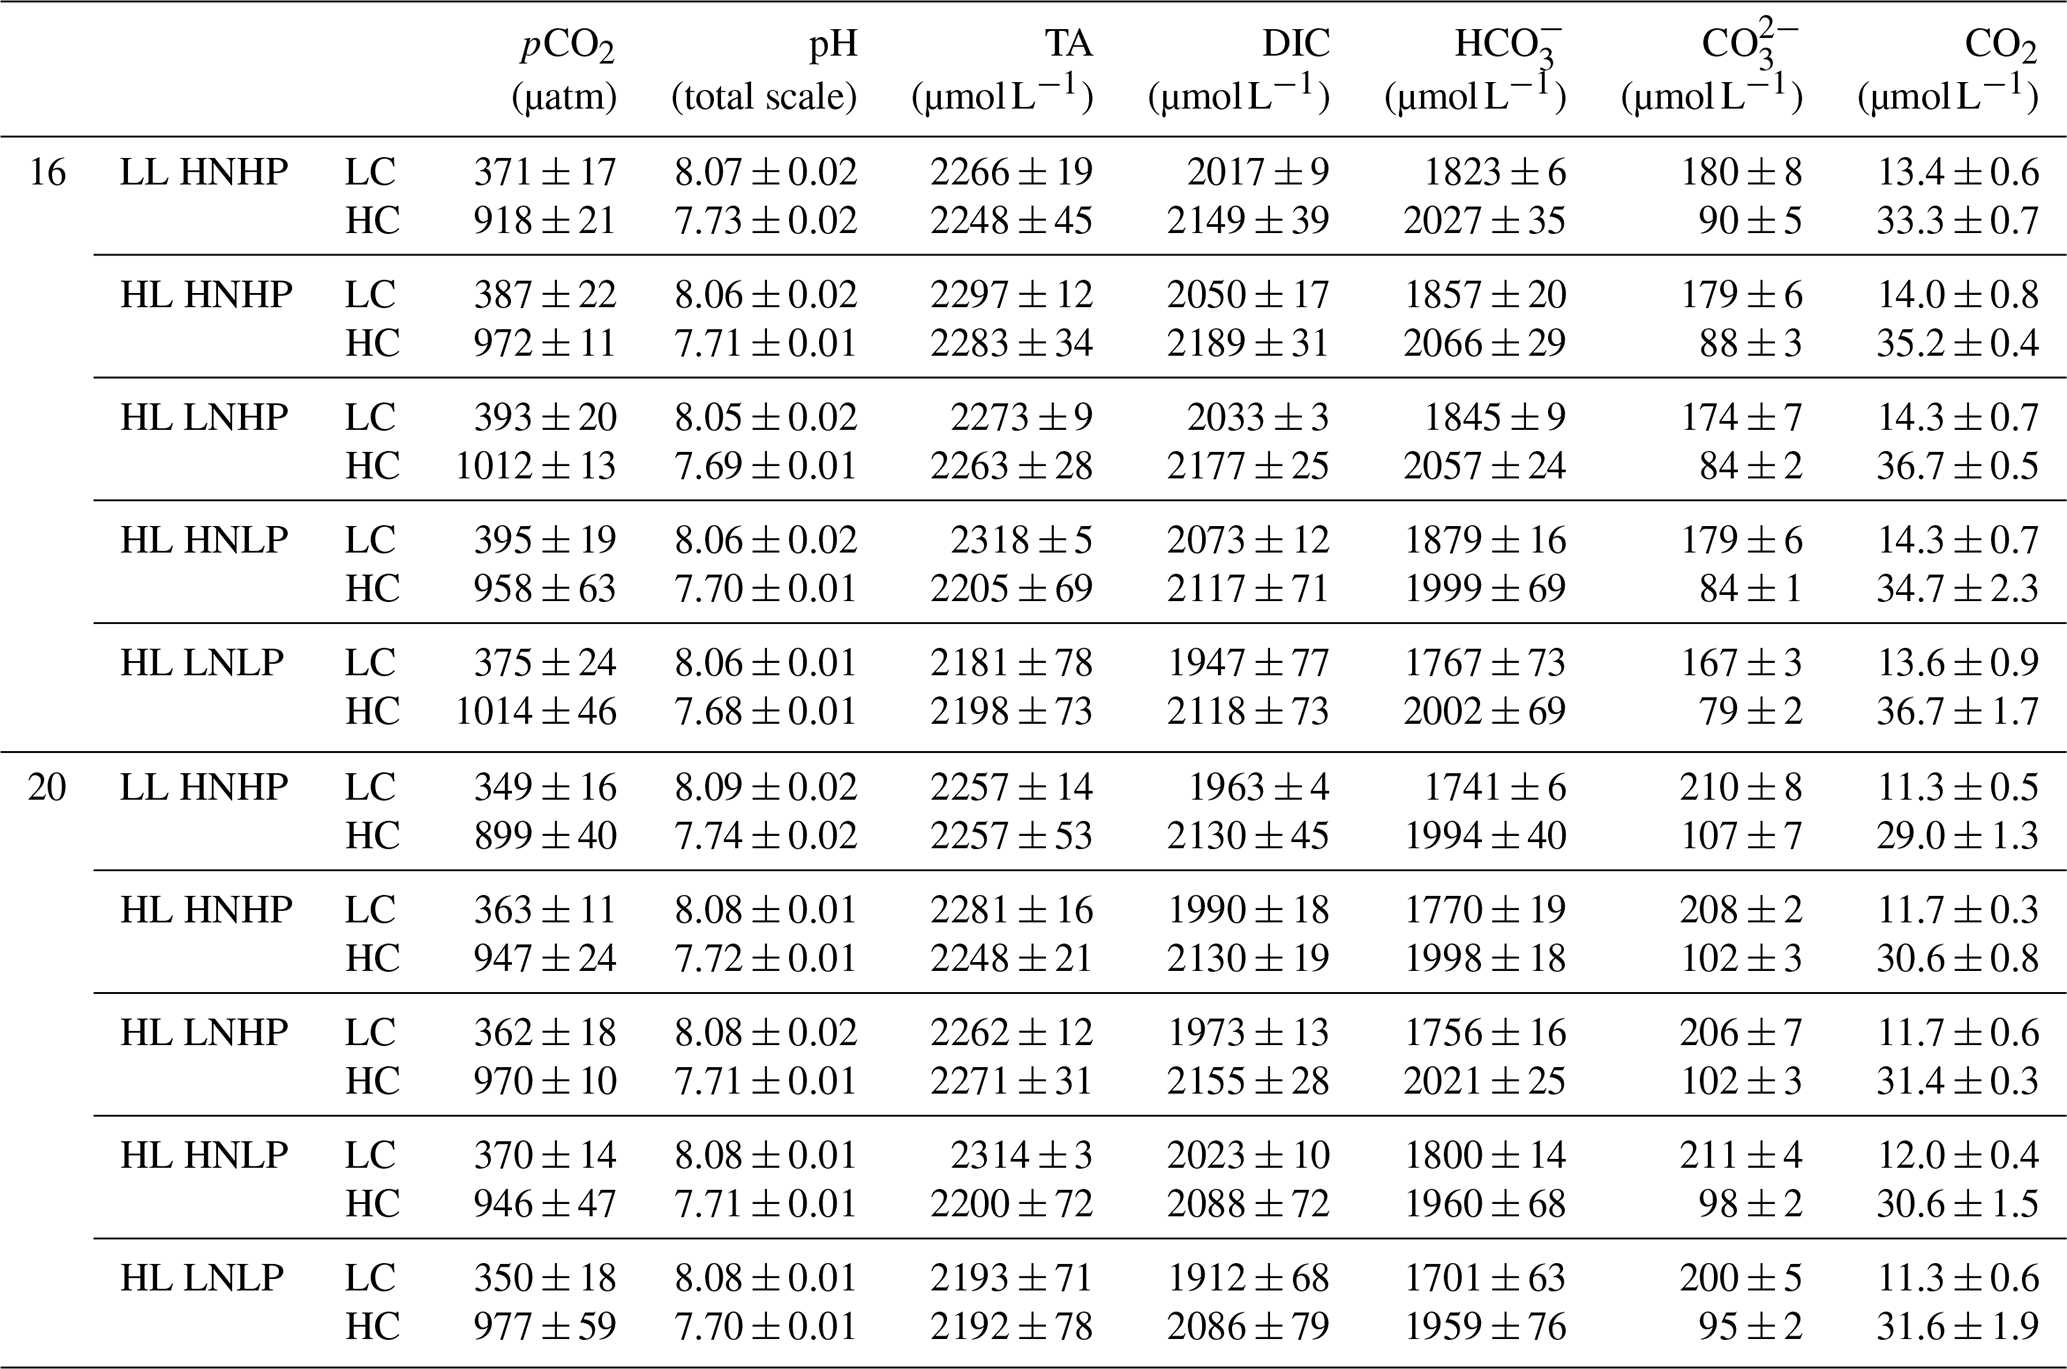
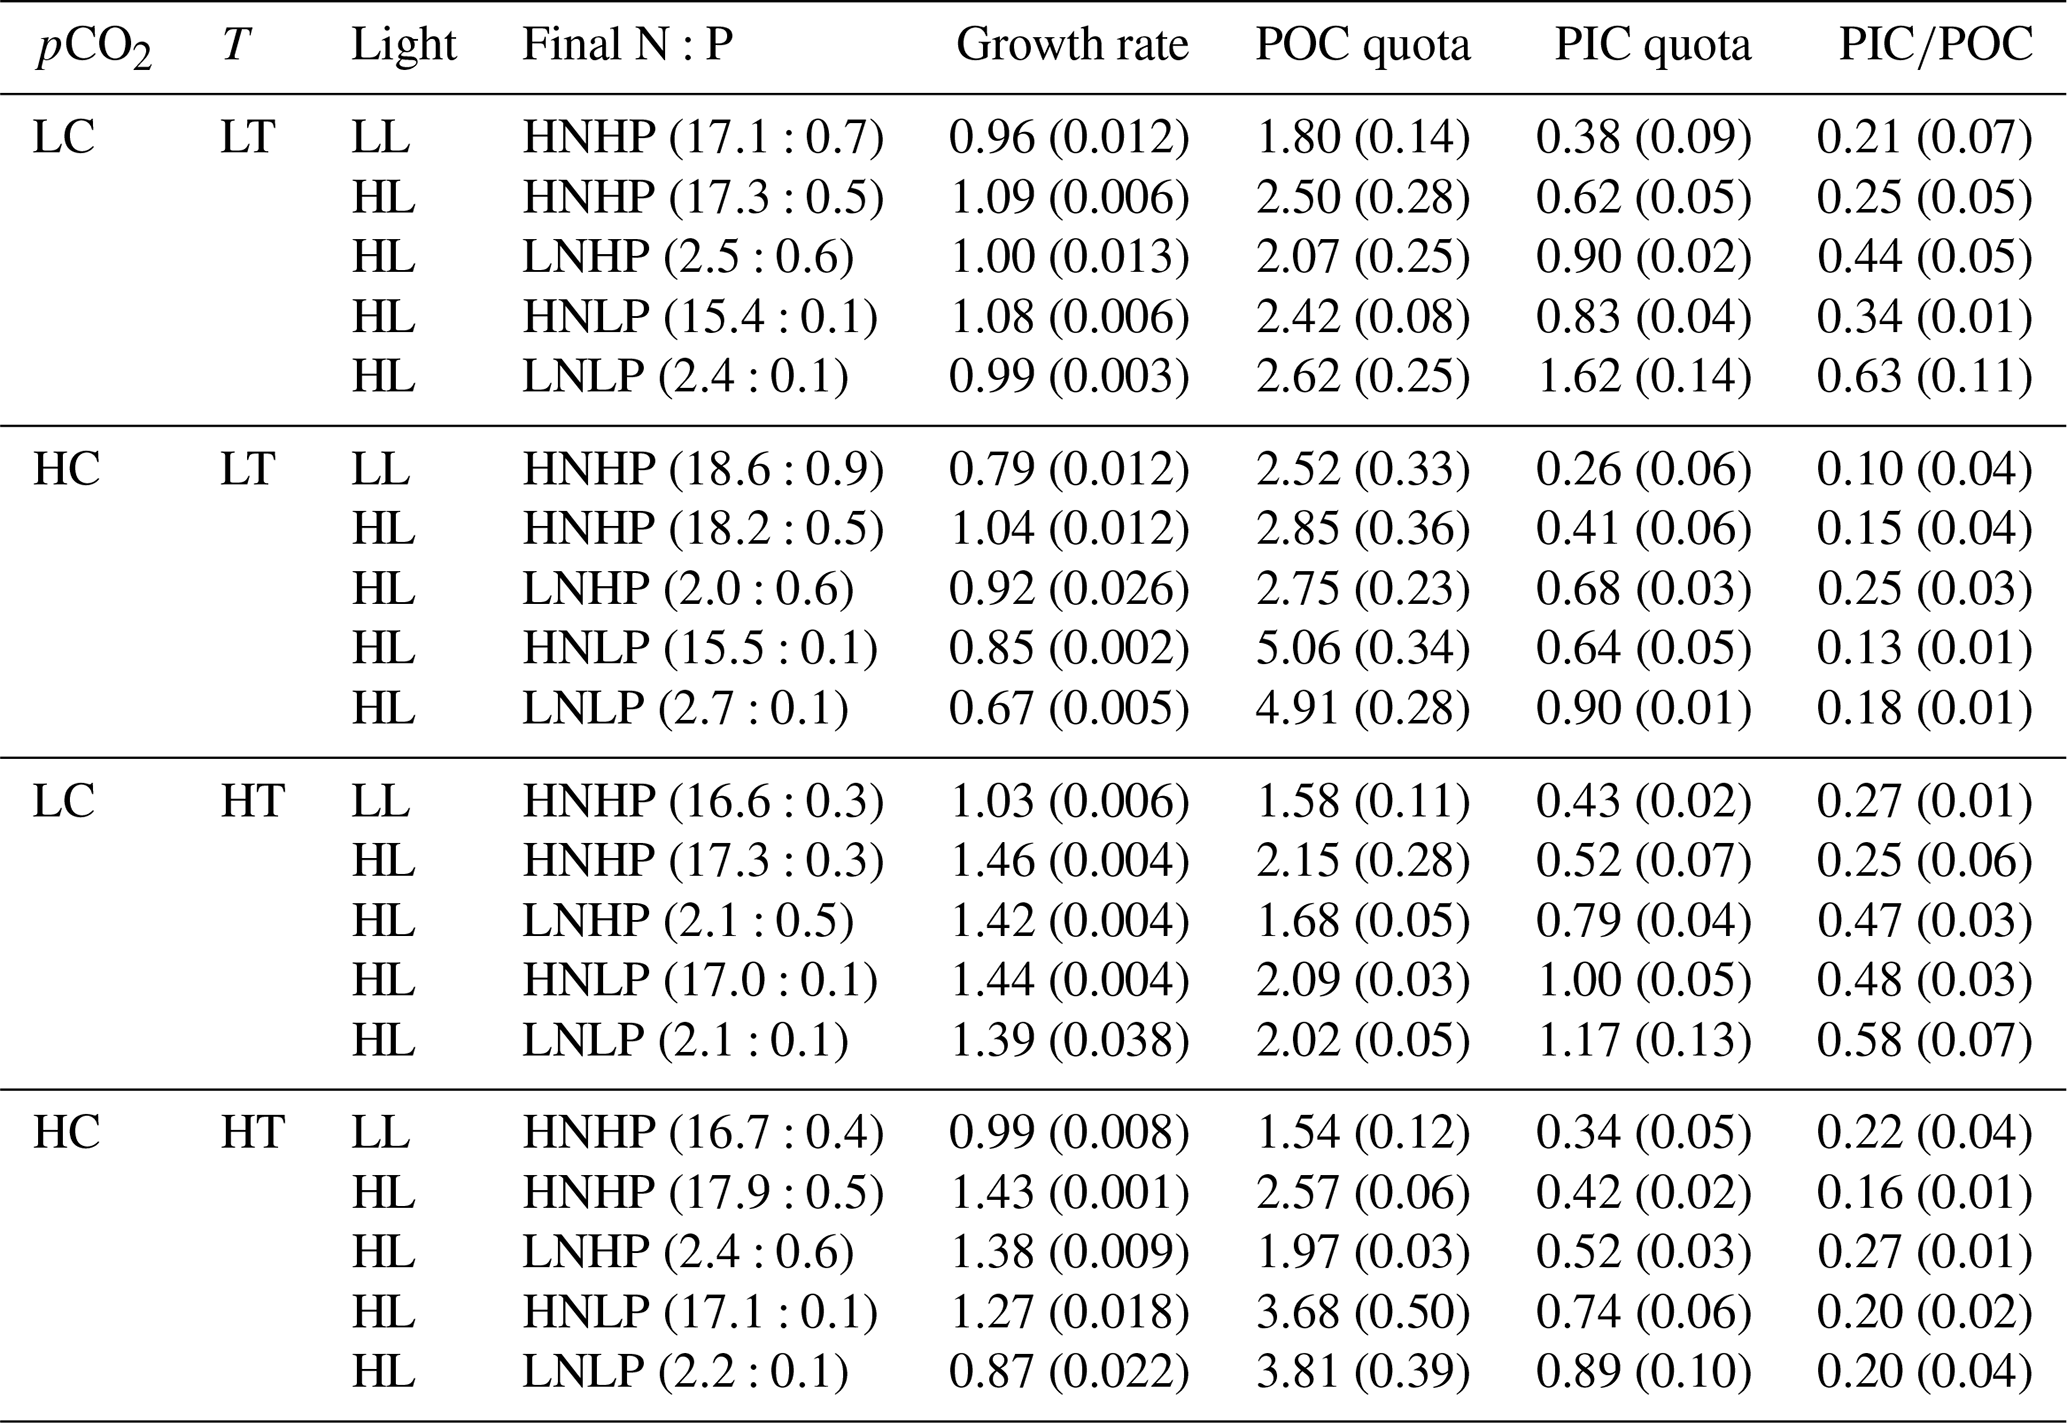
Table 2Final nitrate and phosphate concentrations (N:P, µmol L−1), growth rate (d−1), POC and PIC quotas (pg C cell−1), and PIC∕POC value. Values in the parentheses represent final DIN and DIP concentrations and standard deviation of four replicate populations for the growth rate, POC and PIC quotas, and PIC∕POC value. Detailed information is shown in Table 1.
During the incubations, dissolved inorganic nitrogen (DIN) concentrations decreased by 28.7 % ± 6.7 % in HNHP and LL (Fig. 1p), by 26.8 % ± 5.9 % in HNHP and HL (Fig. 1q), by 71.1 % ± 3.3 % in LNHP (Fig. 1r), by 32.9 % ± 5.6 % in HNLP (Fig. 1s), and by 69.8 % ± 3.2 % in LNLP conditions (Fig. 1t; Table 2). Dissolved inorganic phosphate (DIP) concentrations decreased by 62.2 % ± 16.5 % in HNHP and LL (Fig. 1u), by 71.3 % ± 6.7 % in HNHP and HL (Fig. 1v), by 61.0 % ± 5.2 % in LNHP (Fig. 1w), by 83.8 % ± 5.4 % in HNLP (Fig. 1x), and by 86.3 % ± 1.4 % in LNLP conditions (Fig. 1y; Table 2).
Overall, while organismal activity affected nutrient levels during growth cycles as expected, the high- and low-nutrient treatments remained different at all times (Table 2). Organismal activity had minimal effects on carbonate chemistry (see Fig. 1).
3.2 Population growth rate
The growth rate was significantly lower under the future scenario (HCHT HL LNLP – high levels of pCO2, temperature and light as well as low levels of nutrients) than under the present scenario (LCLT LL HNHP – low levels of pCO2, temperature and light alongside high levels of nutrients) (one-way ANOVA, F = 52.6, p<0.01) (Figs. 2a and 3a and d; Table 2). The effect of increasing pCO2 on growth rate is negative at low light or low nutrient levels, which can be seen by comparing population growth in all of the HC regimes with their paired LC regimes (Figs. 3a, b and e and S4 in the Supplement). The extent of reduction in population growth rate depends on which other stressors are present. Compared to present atmospheric pCO2 levels (LC, Fig. 3a), growth rates under ocean acidification (HC, Fig. 3b) decreased by an average of 17.4 % ± 1.3 % in HNHP and LL, by an average of 4.4 % ± 1.1 % in HNHP and HL (three-way ANOVA, both p<0.01; Tukey post hoc test, both p<0.01) (Fig. 3e; Tables 2 and 3), by 7.6 % ± 2.6 % in LNHP, by 21.4 % ± 0.2 % in HNLP, and by 32.1 % ± 0.5 % in LNLP conditions under the HL (four-way ANOVA, all values of p<0.01; Tukey post hoc test, all values of p<0.01) (Fig. 3a, b and e; Tables 2 and 4).
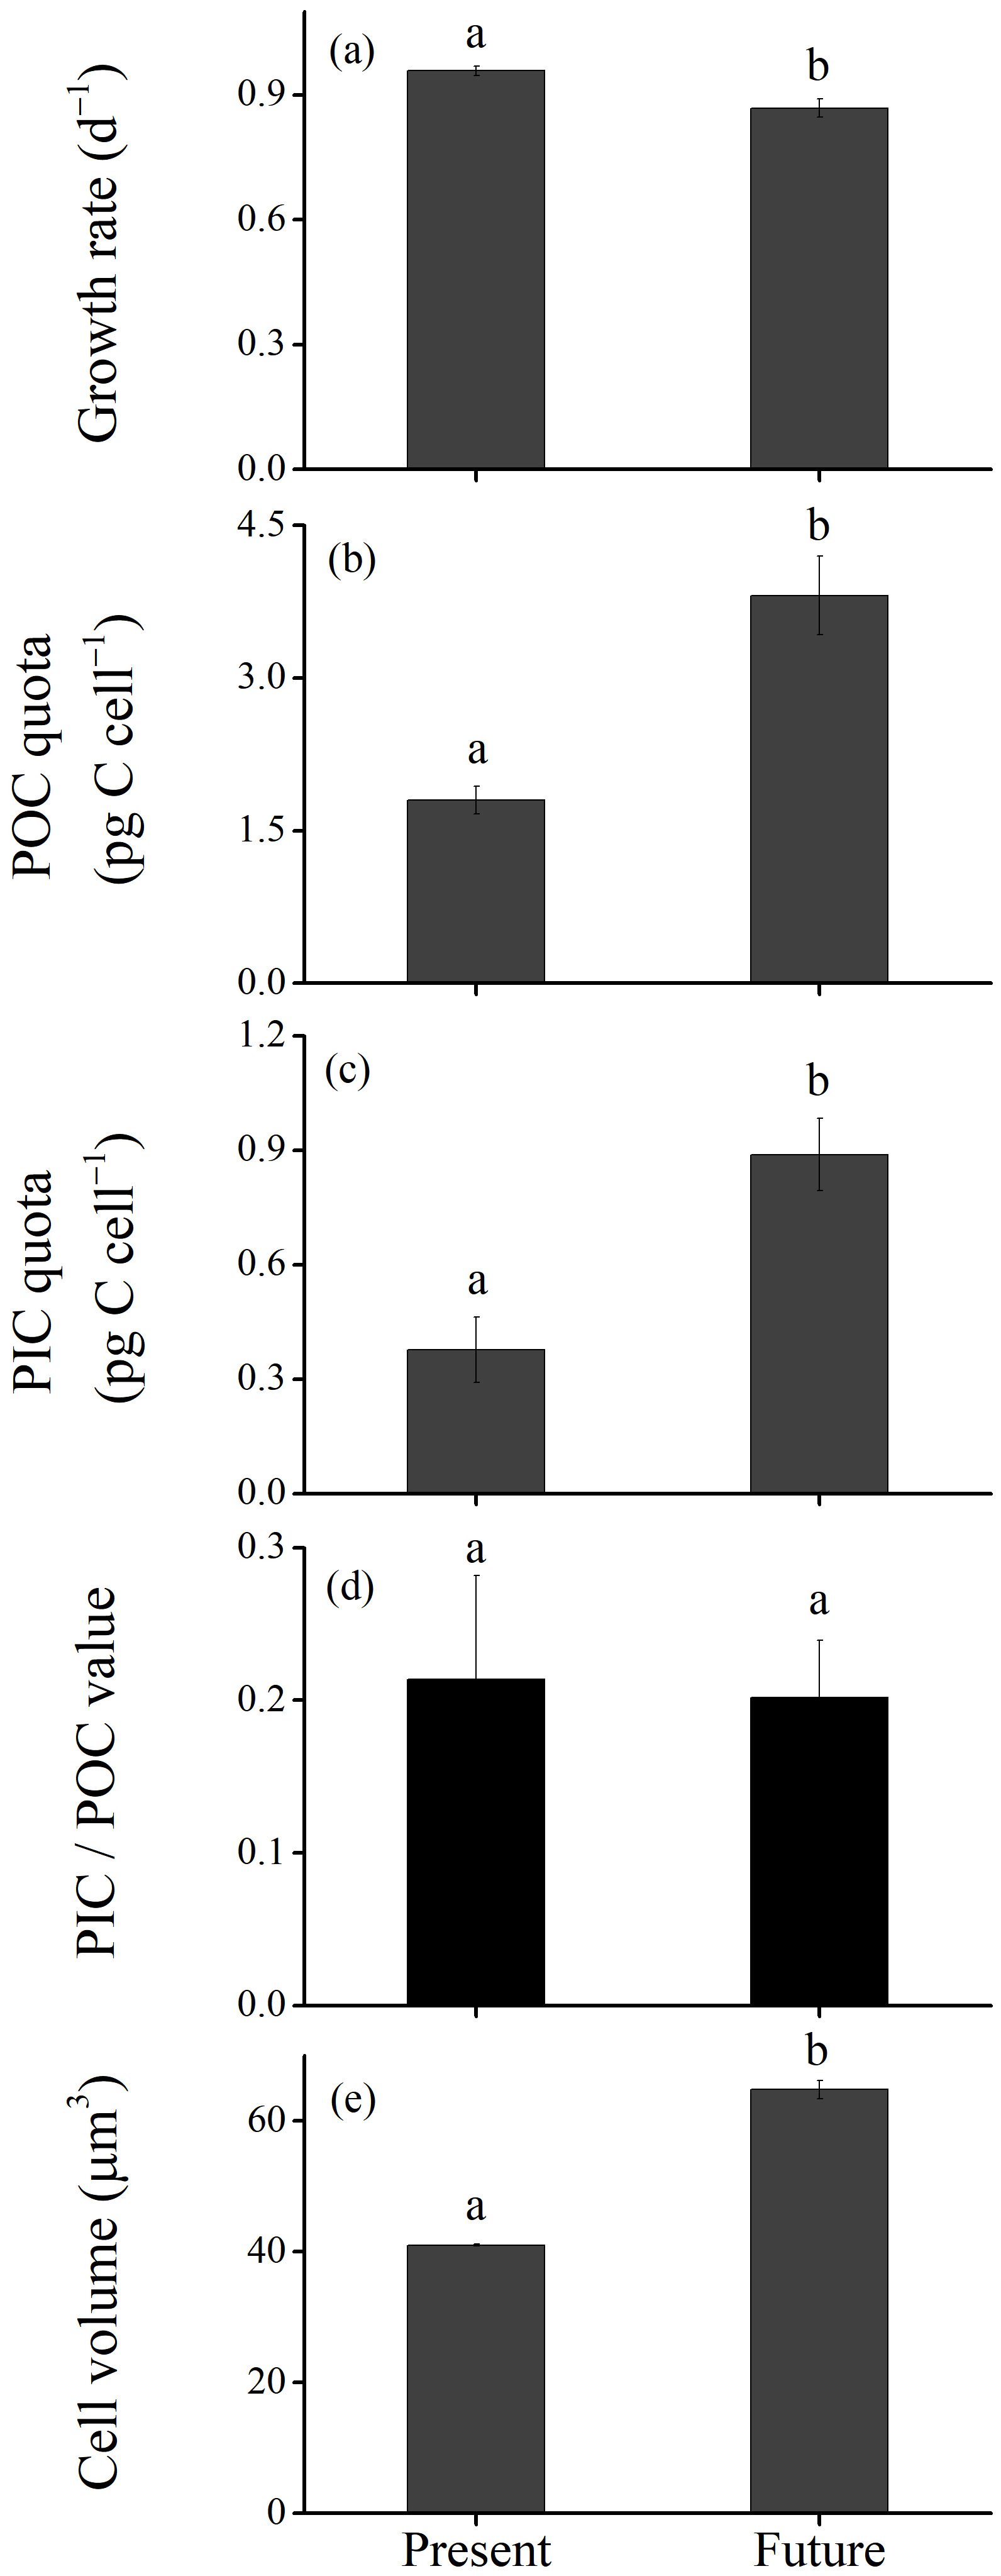
Figure 2Growth rate (a), particulate organic carbon (POC; b) and particulate inorganic carbon (PIC; c) quotas, PIC∕POC value (d) and cell volume (e) of Emiliania huxleyi grown under the present (defined as low levels of pCO2, temperature and light along with high levels of nutrients) and the future (defined as higher levels of pCO2, temperature and light along with low levels of nutrients due to ocean acidification, warming and shoaling of upper mixing layer) scenarios. Data were obtained after cells were acclimated to experimental conditions for 14–16 generations and means ± SD of four replicate populations. The different letters (a, b) in each panel represent significant differences between future and present ocean conditions (Tukey post hoc, p < 0.05).
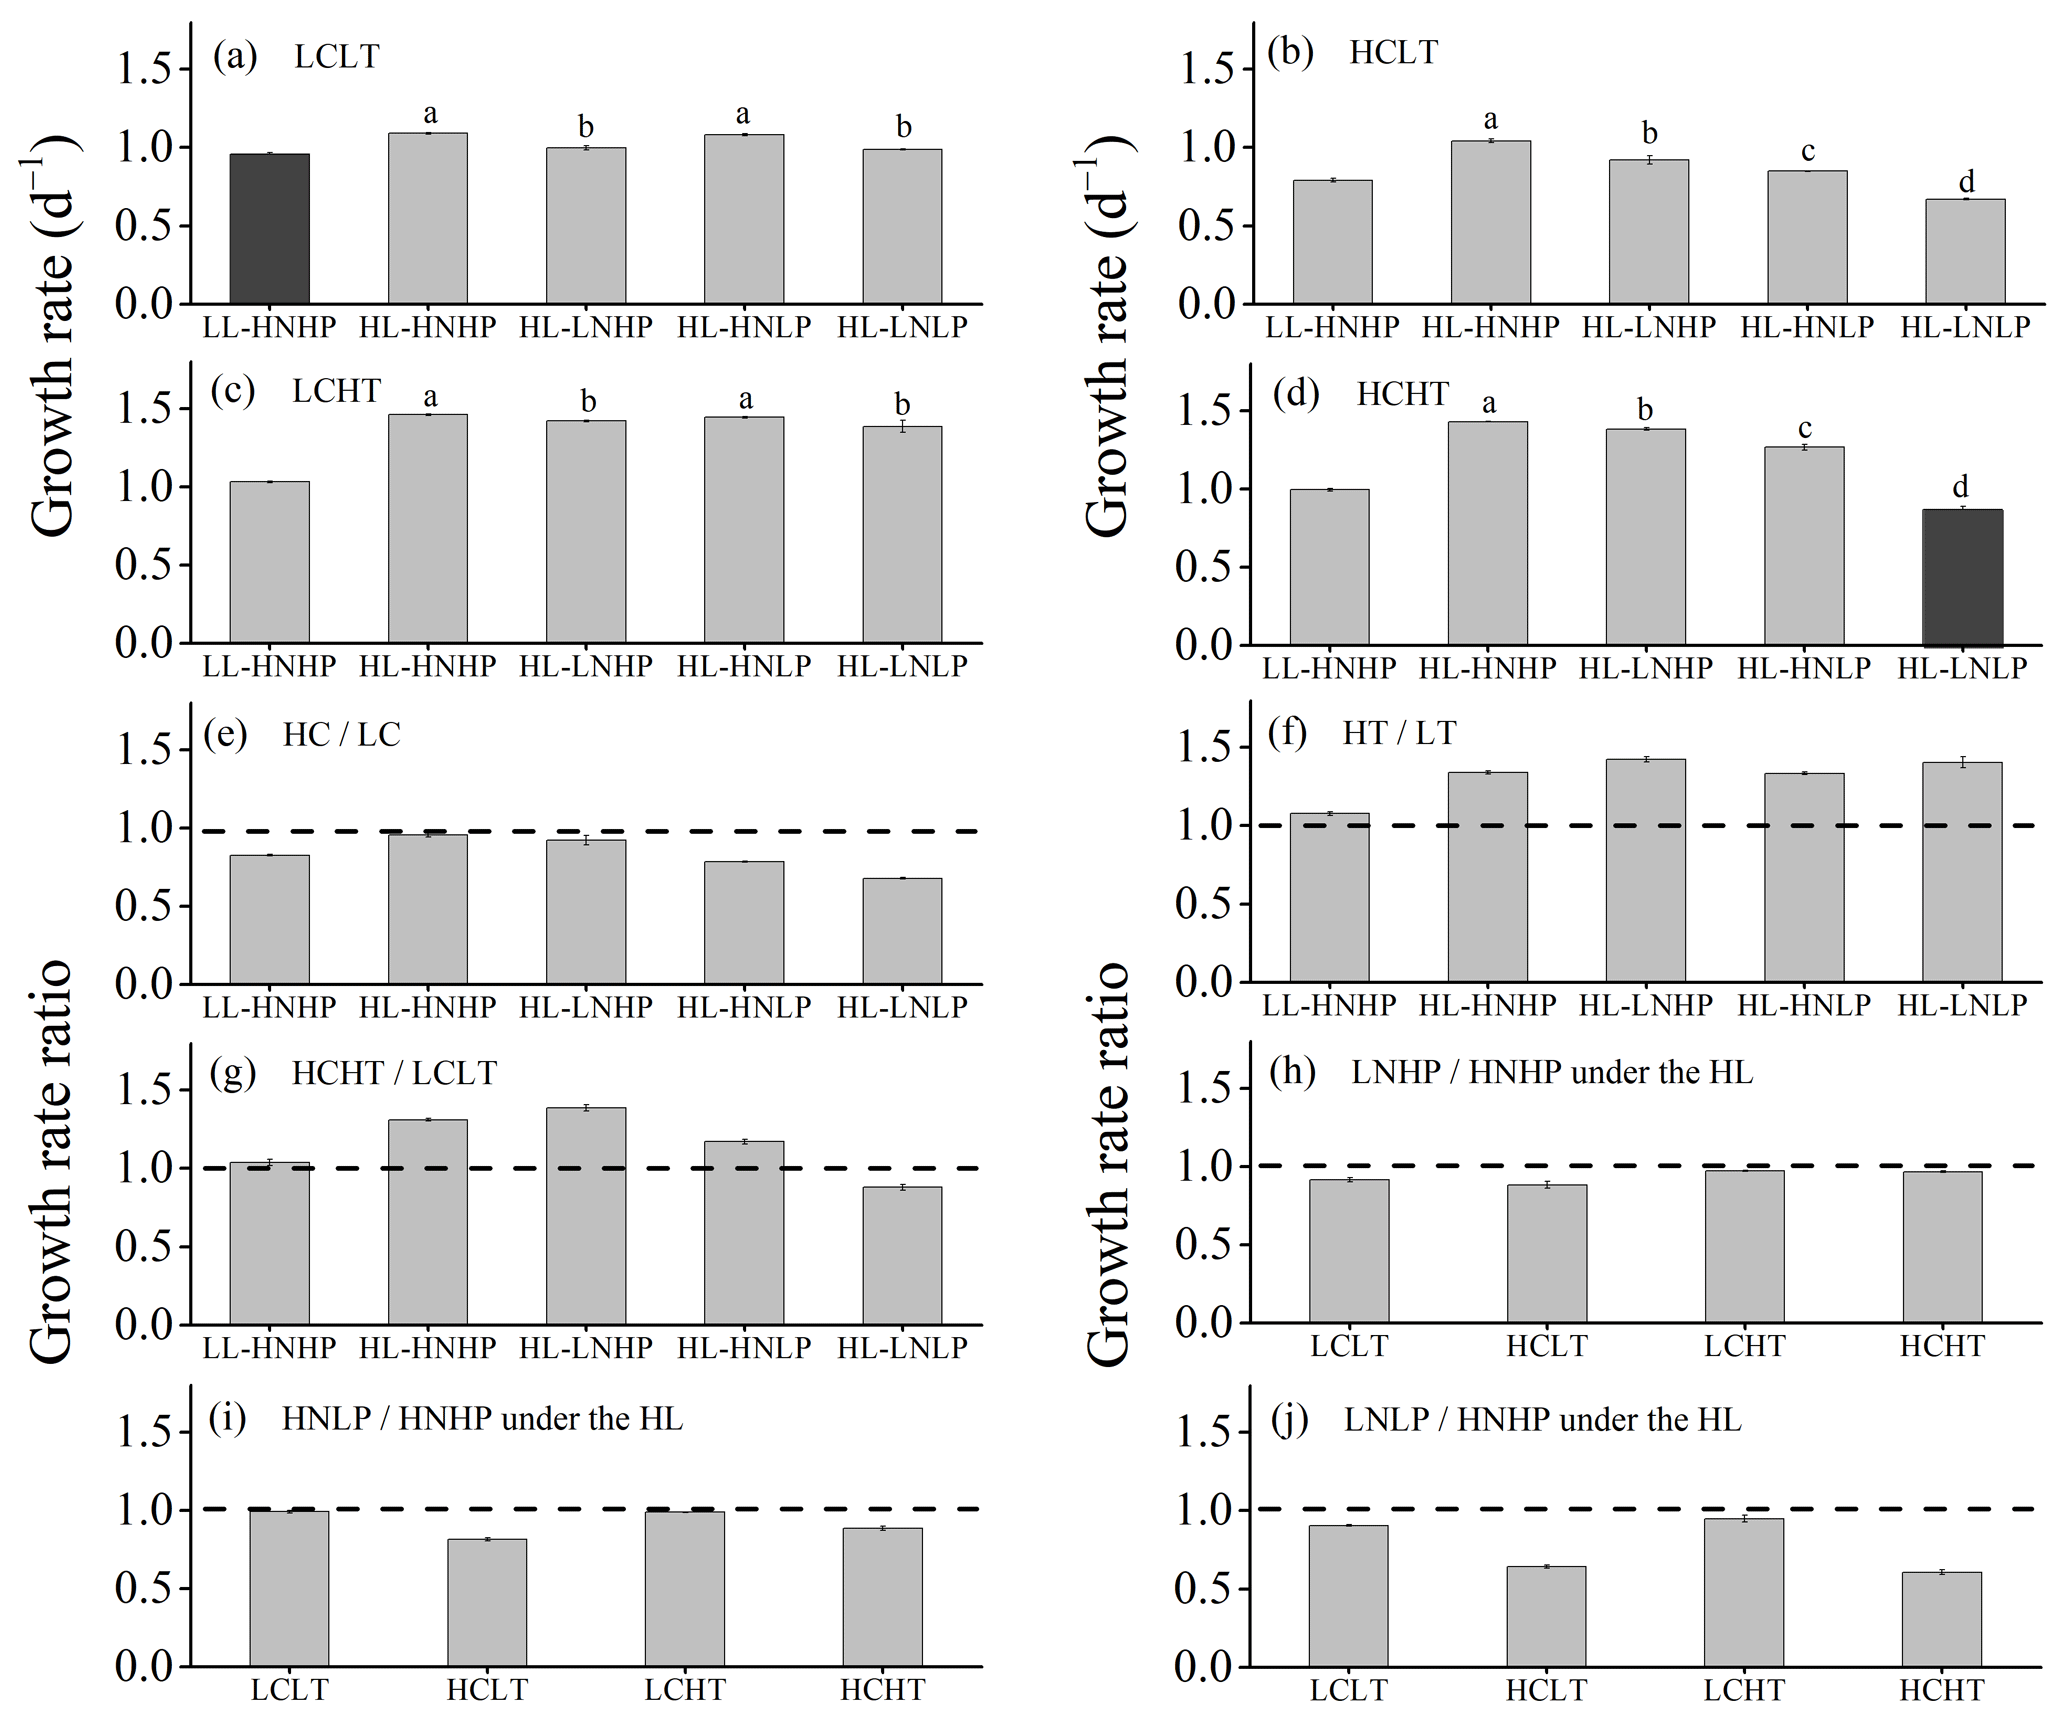
Figure 3Growth rates of E. huxleyi grown in LCLT (a), HCLT (b), LCHT (c) and HCHT (d) conditions and the ratio of growth rate in HC to LC (e), HT to LT (f), HCHT to LCLT (g), LNHP to HNHP (h), HNLP to HNHP (i) and LNLP to HNHP (j) conditions. Data were obtained after cells were acclimated to experimental conditions for 14–16 generations and means ± SD of four replicate populations. Horizontal lines in (e)–(j) show the value of 1. Different letters (a, b, c, d) in (a)–(d) represent significant differences between different nutrient treatments (Tukey post hoc, p < 0.05). The results shown in the black columns were used for the ambient-future comparison in Fig. 2. Detailed experimental conditions are shown in Fig. 1.
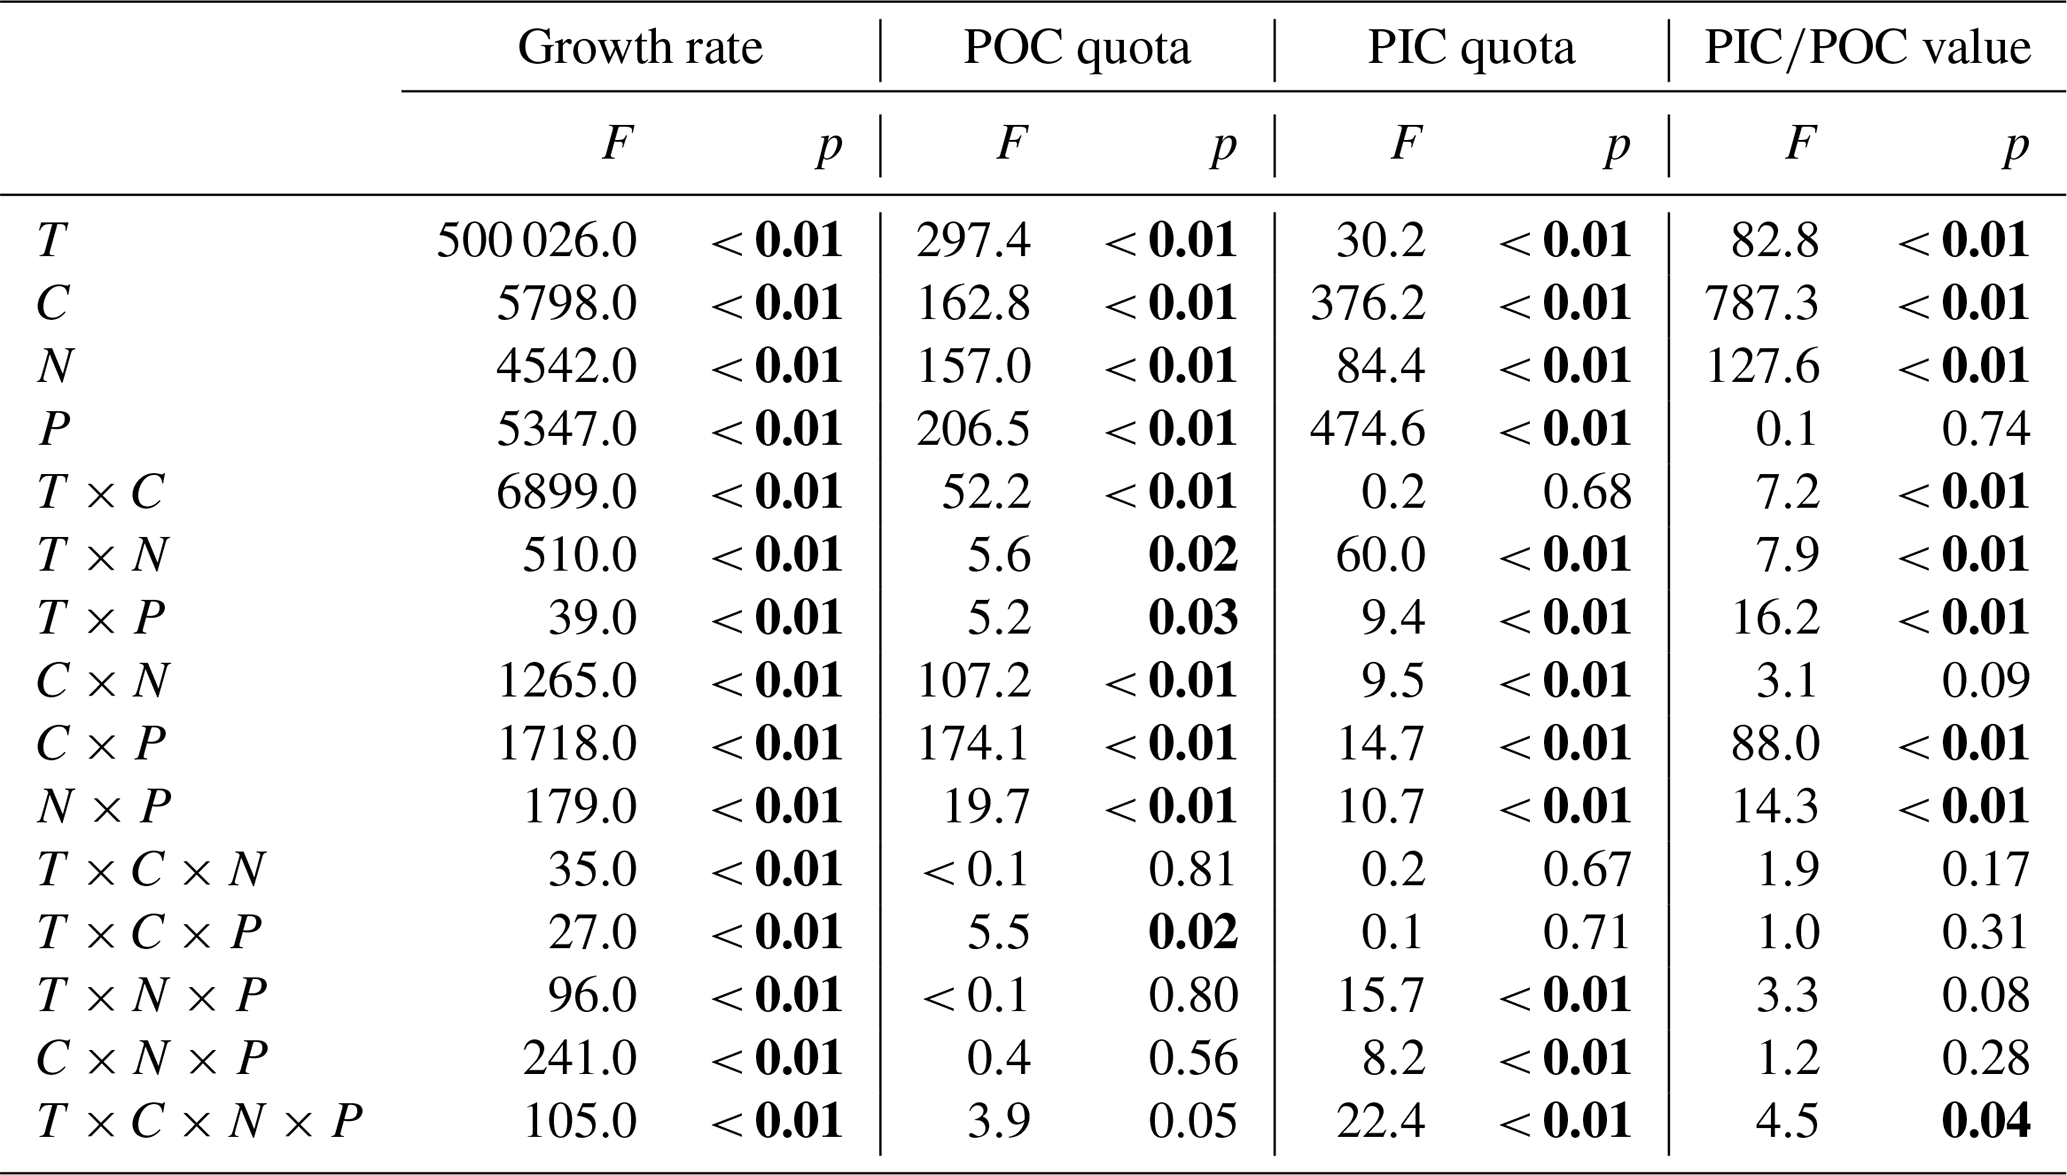
Table 3Results of three-way ANOVAs of the effects of temperature (T), pCO2 (C) and light intensity (L) and their interaction on the growth rate, POC and PIC quotas, and PIC∕POC value. Significant values are marked in bold.
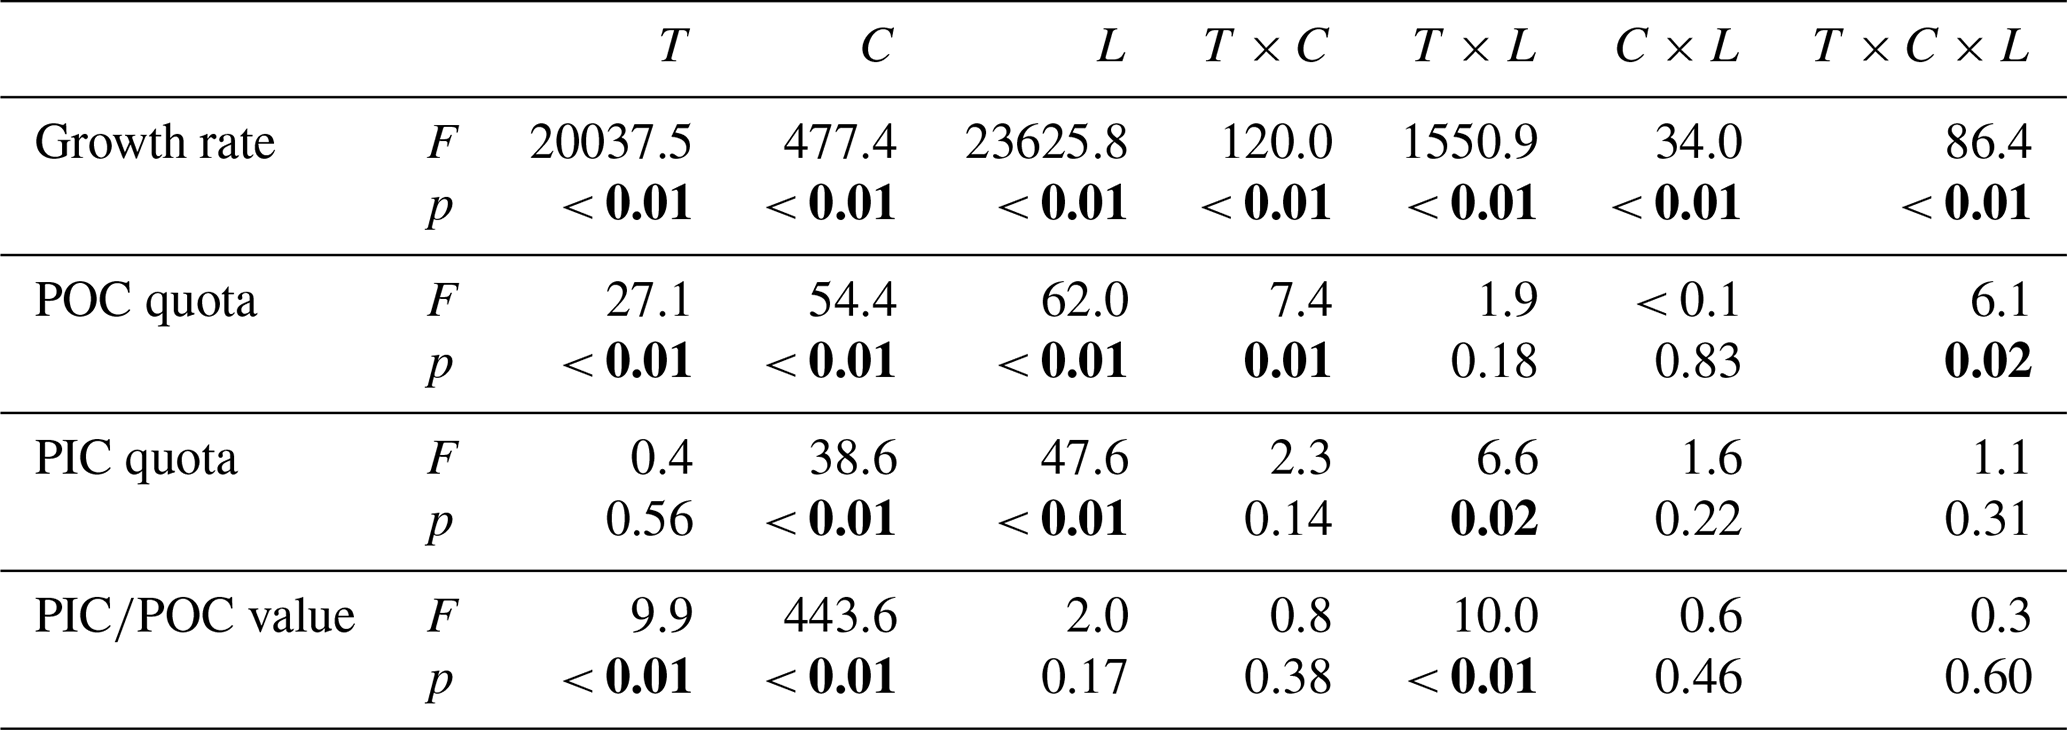
Table 4Results of four-way ANOVAs of the effects of temperature (T), pCO2 (C), dissolved inorganic nitrate (N) and phosphate (P) concentrations and their interaction on the growth rate, POC and PIC quotas, and PIC∕POC value. Significant values are marked in bold.
Across all HT–LT (high temperature–low temperature) regime pairs, the population growth rate is faster in the HT regimes, indicating that increasing the temperature from 16 to 20 ∘C increases the population growth rate in E. huxleyi (Figs. 3a, c and f and S4). Compared to the low temperature (LT, Fig. 3a), growth rates at the high temperature (HT, Fig. 3c) increased by 7.7 % ± 0.7 % in HNHP and LL, by 34.0 % ± 0.4 % in HNHP and HL (three-way ANOVA, bothp < 0.01; Tukey post hoc test, both p<0.01) (Fig. 3a, c and f; Tables 2 and 3), by 42.4 % ± 0.4 % in LNHP, by 33.5 % ± 0.5 % in HNLP, and by 40.4 % ± 3.1 % in LNLP conditions under HL (four-way ANOVA, all values of p<0.01; Tukey post hoc test, all values of p<0.01) (Fig. 3a, c and f; Tables 2 and 4). Compared to low pCO2 and low temperature (LCLT, Fig. 3a), growth rates in high-pCO2 and high-temperature environments (HCHT, Fig. 3d) increased by 3.9 % ± 0.9 % in HNHP and LL, by 31.1 % ± 0.1 % in HNHP and HL (three-way ANOVA, bothp < 0.01; Tukey post hoc test, both p<0.01) (Fig. 3a, d and g; Tables 2 and 3), by 38.6 % ± 0.1 % in LNHP, and by 17.1 % ± 1.7 % in HNLP conditions, whereas the growth rate decreased by 12.1 % ± 2.2 % in LNLP conditions under HL, respectively (four-way ANOVA, all values of p<0.01; Tukey post hoc test, all values of p<0.01) (Fig. 3a, d and g; Tables 2 and 4). These results show that high pCO2, low nitrate and low phosphate concentrations collectively reduced the population growth rate in E. huxleyi, though elevated temperature could counteract this response.
The effects of reduced availability of nutrients on growth are nutrient-specific (Fig. 3). Compared to HNHP and HL conditions, growth rates in LNHP conditions decreased by 3.0 %–12.1 % (all values of p < 0.05 in LCLT, HCLT, LCHT and HCHT conditions) (Fig. 3h; Tables 2 and 4). In contrast, HNLP conditions did not significantly affect growth in LC conditions (p > 0.1 in LCLT and LCHT conditions) (Fig. 3a, c and i) but did lower the population growth rate by 11.3 %–19.2 % in HC conditions (both p<0.01 at HCLT and HCHT conditions) (Fig. 3b, d and i). Unsurprisingly, when both nitrate and phosphate levels were reduced, growth rates always decreased by a larger extent compared to environments where they were reduced individually (Fig. 3h, i and j). Compared to growth rates in HNHP and HL conditions, growth rates in LNLP conditions were 4.8 %–10.2 % lower in LC environments and 34.7 %–40.3 % lower in HC environments (Tukey post hoc test, all values of p<0.01 in LCLT, HCLT, LCHT and HCHT conditions) (Fig. 3a–d,j; Tables 2 and 4). In summary, nitrate and phosphate limitation exacerbated the impacts of OA and warming on the population growth rate.
3.3 POC quota
Cellular POC quotas were 2-fold larger under the future scenario (HCHT HL LNLP) than under the current scenario (LCLT LL HNHP) (one-way ANOVA, F = 96.1, p<0.01, Figs. 2b and 4a and d). The effect of increasing pCO2 on the POC quota is positive, regardless of other drivers present, which can be seen by comparing POC quotas in all of the HC regimes with their paired LC regimes (Figs. 4a, b and e and S4), though the extent of increase in the POC quota depends on which other stressors are present. Compared to current atmospheric pCO2 levels (LC, Fig. 4a), POC quotas under ocean acidification (Fig. 4b) increased by 40.3 % ± 10.1 % in HNHP and LL (Tukey post hoc test, p<0.01), by 13.8 % ± 10.1 % in HNHP and HL (p= 0.47), by 33.2 % ± 11.1 % in LNHP, by 109.4 % ± 14.0 % in HNLP, and by 87.3 % ± 10.8 % in LNLP conditions under HL (four-way ANOVA, all values of p<0.01; Tukey post hoc test, all values of p<0.01) (Fig. 4a, b and e; Tables 2 and 4).
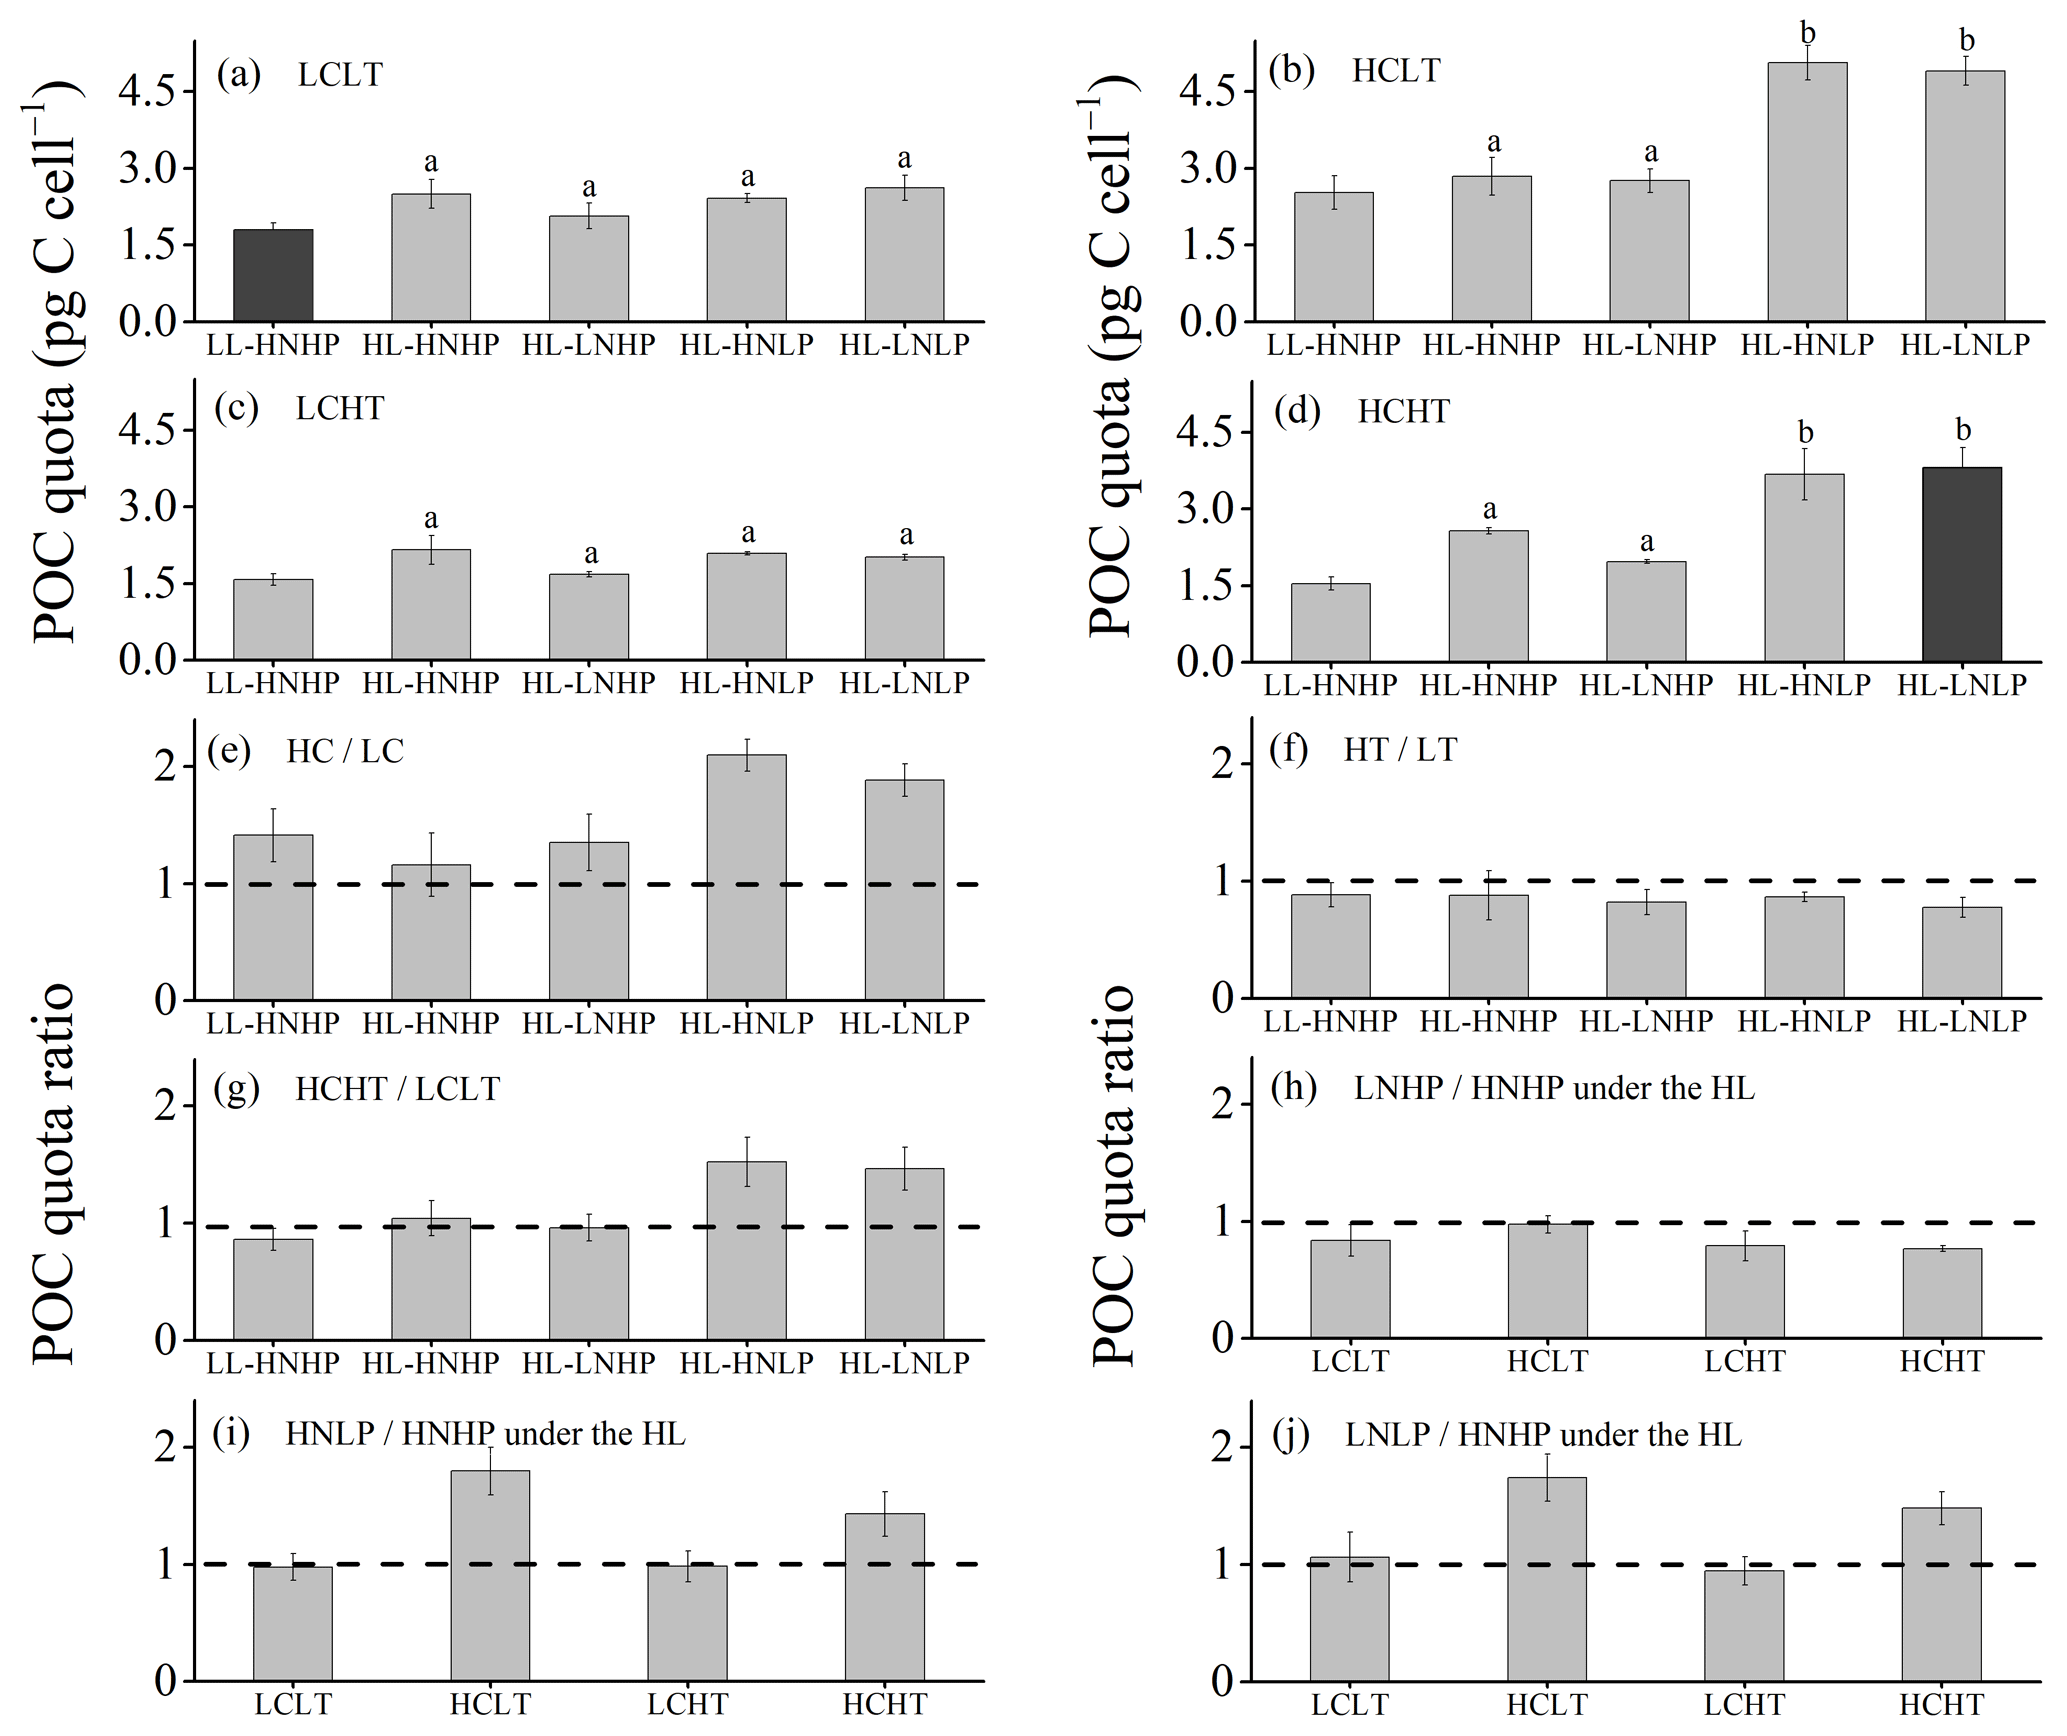
Figure 4POC quota of E. huxleyi grown in LCLT (a), HCLT (b), LCHT (c) and HCHT (d) conditions and the ratio of POC quota in HC to LC (e), HT to LT (f), HCHT to LCLT (g), LNHP to HNHP (h), HNLP to HNHP (i) and LNLP to HNHP (j) conditions. Data were obtained after cells were acclimated to experimental conditions for 14–16 generations and means ± SD of four replicate populations. Horizontal lines in (e)–(j) show the value of 1. Different letters (a, b) in (a)–(d) represent significant differences between different nutrient treatments (Tukey post hoc, p < 0.05). The results shown in the black columns were used for the ambient-future comparison in Fig. 2. Detailed experimental conditions are shown in Fig. 1.
The effect of elevated temperature on the POC quota can be seen by comparing the POC quota in all of the HT regimes with their paired LT regimes (Figs. 4a, c and f and S4). Across all HT–LT regime pairs, POC quotas did not show significant differences between the HT and LT regimes under HNHP and LL, HNHP and HL, LNHP, and HNLP and LNLP conditions under HL (Tukey post hoc test, all values of p > 0.1) (Fig. 4a, c and f). This demonstrated that increasing the temperature within the test range had no significant effect on the POC quota. The combined effects of increasing pCO2 and the temperature on POC quotas were nutrient dependent. Compared to low-pCO2 and low-temperature conditions (LCLT, Fig. 4a), POC quotas at high-pCO2 and high-temperature conditions (HCHT, Fig. 4d) did not show significant differences in HNHP and LL (p=0.79), in HNHP and HL (p=0.99), and in LNHP and HL (p=0.99) conditions but increased by 52.2 % ± 20.6 % in HNLP and by 45.6 % ± 14.8 % in LNLP conditions under HL (Tukey post hoc test, both p<0.01) (Fig. 4a, d and g; Tables 2 and 4). These data showed that high pCO2 and low phosphate concentrations enhanced POC quotas of E. huxleyi and that their combined effects were partly reduced by a rising temperature.
The effects of nutrient reduction on the POC quota are nutrient specific (Fig. 4). Compared to HNHP and HL conditions, POC quotas in LNHP conditions did not show a significant difference (all values of p > 0.1 in LCLT, HCLT, LCHT and HCHT conditions) (Fig. 4a–d and h; Tables 2 and 4). In LC conditions, POC quotas did not significantly differ between HNHP, HNLP and LNLP conditions (Tukey post hoc test, all values of p > 0.1) (Fig. 4a, c, i and j). In contrast, in HC conditions, they were 43.3 %–78.2 % larger in HNLP or LNLP conditions than in HNHP conditions (all values of p<0.01) (Fig. 4b, d, i and j; Table 2).
3.4 PIC quota
Cellular PIC quotas were significantly larger in the future scenario with high levels of pCO2, temperature and light along with low nutrient concentrations than PIC quotas in the present scenario with low levels of pCO2, temperature and light along with relatively high nutrient concentrations (one-way ANOVA, F=63.6, p<0.01) (Figs. 2c and 5a and d). However, the opposite results were found under the elevated-CO2 treatment alone. The effect of increasing pCO2 on the PIC quota is negative, regardless of the presence of other drivers. By comparing the PIC quota in all of the HC regimes with their paired LC regimes (Figs. 5a, b and e and S4), the effects of elevated pCO2 level are clear, though the extent of reduction in the PIC quota depends on which other stressors are present. Compared to present atmospheric pCO2 levels (LC, Fig. 5a), PIC quotas under ocean acidification (Fig. 5b) are reduced by 31.8 % ± 17.1 % in HNHP and LL, by 34.3 % ± 10.0 % in HNHP and HL, by 25.0 % ± 3.8 % in LNHP, by 22.8 % ± 6.3 % in HNLP, and by 44.6 % ± 0.9 % in LNLP conditions under HL, respectively (Tukey post hoc test, all values of p < 0.05) (Fig. 5a, b and e; Tables 2–4). The extent of reduction in the PIC quota is larger under LNLP conditions.

Figure 5PIC quota of E. huxleyi grown in LCLT (a), HCLT (b), LCHT (c) and HCHT (d) conditions and the ratio of the PIC quota in HC to LC (e), HT to LT (f), HCHT to LCLT (g), LNHP to HNHP (h), HNLP to HNHP (i) and LNLP to HNHP (j) conditions. Data were obtained after cells were acclimated to experimental conditions for 14–16 generations and means ± SD of four replicate populations. Horizontal lines in (e)–(j) show the value of 1. Different letters (a, b, c) in (a)–(d) represent significant differences between different nutrient treatments (Tukey post hoc, p < 0.05). The results shown in the black columns were used for the ambient-future comparison in Fig. 2. Detailed experimental conditions are shown in Fig. 1.
The effects of a rising temperature on the PIC quota were nutrient dependent and can be seen by comparing PIC quotas in the HT regimes with those in their paired LT regimes (Figs. 5a, c and f and S4). Compared to low temperature (LT, Fig. 5a), PIC quotas at high temperature (HT, Fig. 5c) did not show significant differences in HNHP and LL, in HNHP and HL, in LNHP, and in HNLP conditions (Tukey post hoc test, all values of p > 0.05), whereas they decreased by 27.9 % ± 8.4 % in LNLP conditions under HL (Tukey post hoc test, p<0.01) (Fig. 5a, c and f; Tables 2–4). The combined effects of rising pCO2 and temperature on the PIC quota are negative, regardless of which other drivers are present (Fig. 5a, d and g). Compared to low-pCO2 and low-temperature conditions (LCLT, Fig. 5a), PIC quotas in high-pCO2 and high-temperature conditions (HCHT, Fig. 5d) declined by 11.1 % ± 10.9 % in HNHP and LL (p= 0.96), by 32.5 % ± 2.4 % in HNHP and HL (p<0.01), by 42.2 % ± 3.2 % in LNHP (p<0.01), by 10.2 % ± 7.7 % in HNLP (p=0.92), and by 45.3 % ± 5.9 % in LNLP conditions under HL, respectively (p<0.01) (Fig. 5a, d and g; Table 2).
The effects of both nitrate and phosphate reduction on PIC quota are positive, regardless of levels of pCO2 and temperature for the range used here (Fig. 5h–j). Compared to HNHP and HL, PIC quotas were larger in LNHP conditions (Tukey post hoc test, p<0.01 in LCLT, HCLT and LCHT conditions; p=0.73 in HCHT conditions) (Fig. 5h), in HNLP and in LNLP conditions (all values of p<0.01 in LCLT, HCLT, LCHT and HCHT conditions) (Fig. 5a–d, i and j; Table 2). In addition, PIC quotas were larger in LNLP than in HNLP conditions (Tukey post hoc test, p<0.01 in LCLT and HCLT conditions; p=0.06 in LCHT conditions; p=0.21 in HCHT conditions) (Fig. 5a–d, i and j). These data showed that low nitrate and phosphate concentrations act synergistically to increase PIC quotas, which were moderated under the high pCO2 levels.
3.5 PIC∕POC value
The ratio of PIC to POC (PIC∕POC value) was not significantly different between the future scenario (HCHT HL LNLP) and the current scenario (LCLT LL HNHP) (one-way ANOVA, F=0.3, p=0.60) (Figs. 2d and 6a and d). The PIC∕POC value followed the same trend as that for PIC quotas described above. The effect of increasing pCO2 on the PIC∕POC value was negative, regardless of which other drivers were present (Figs. 6a, b and e and S4), but the extent of reduction in the PIC∕POC value depended on the presence of other drivers. Compared to current atmospheric pCO2 levels (LC, Fig. 6a), PIC∕POC values under ocean acidification (HC, Fig. 6b) decreased by 50.7 % ± 18.2 % in HNHP and LL, by 41.8 % ± 15.4 % in HNHP and HL, by 43.9 % ± 5.8 % in LNHP, by 63.0 % ± 4.2 % in HNLP, and by 70.7 % ± 2.0 % in LNLP conditions under HL (Tukey post hoc test, all values of p < 0.05) (Fig. 6a, b and e; Table 2).
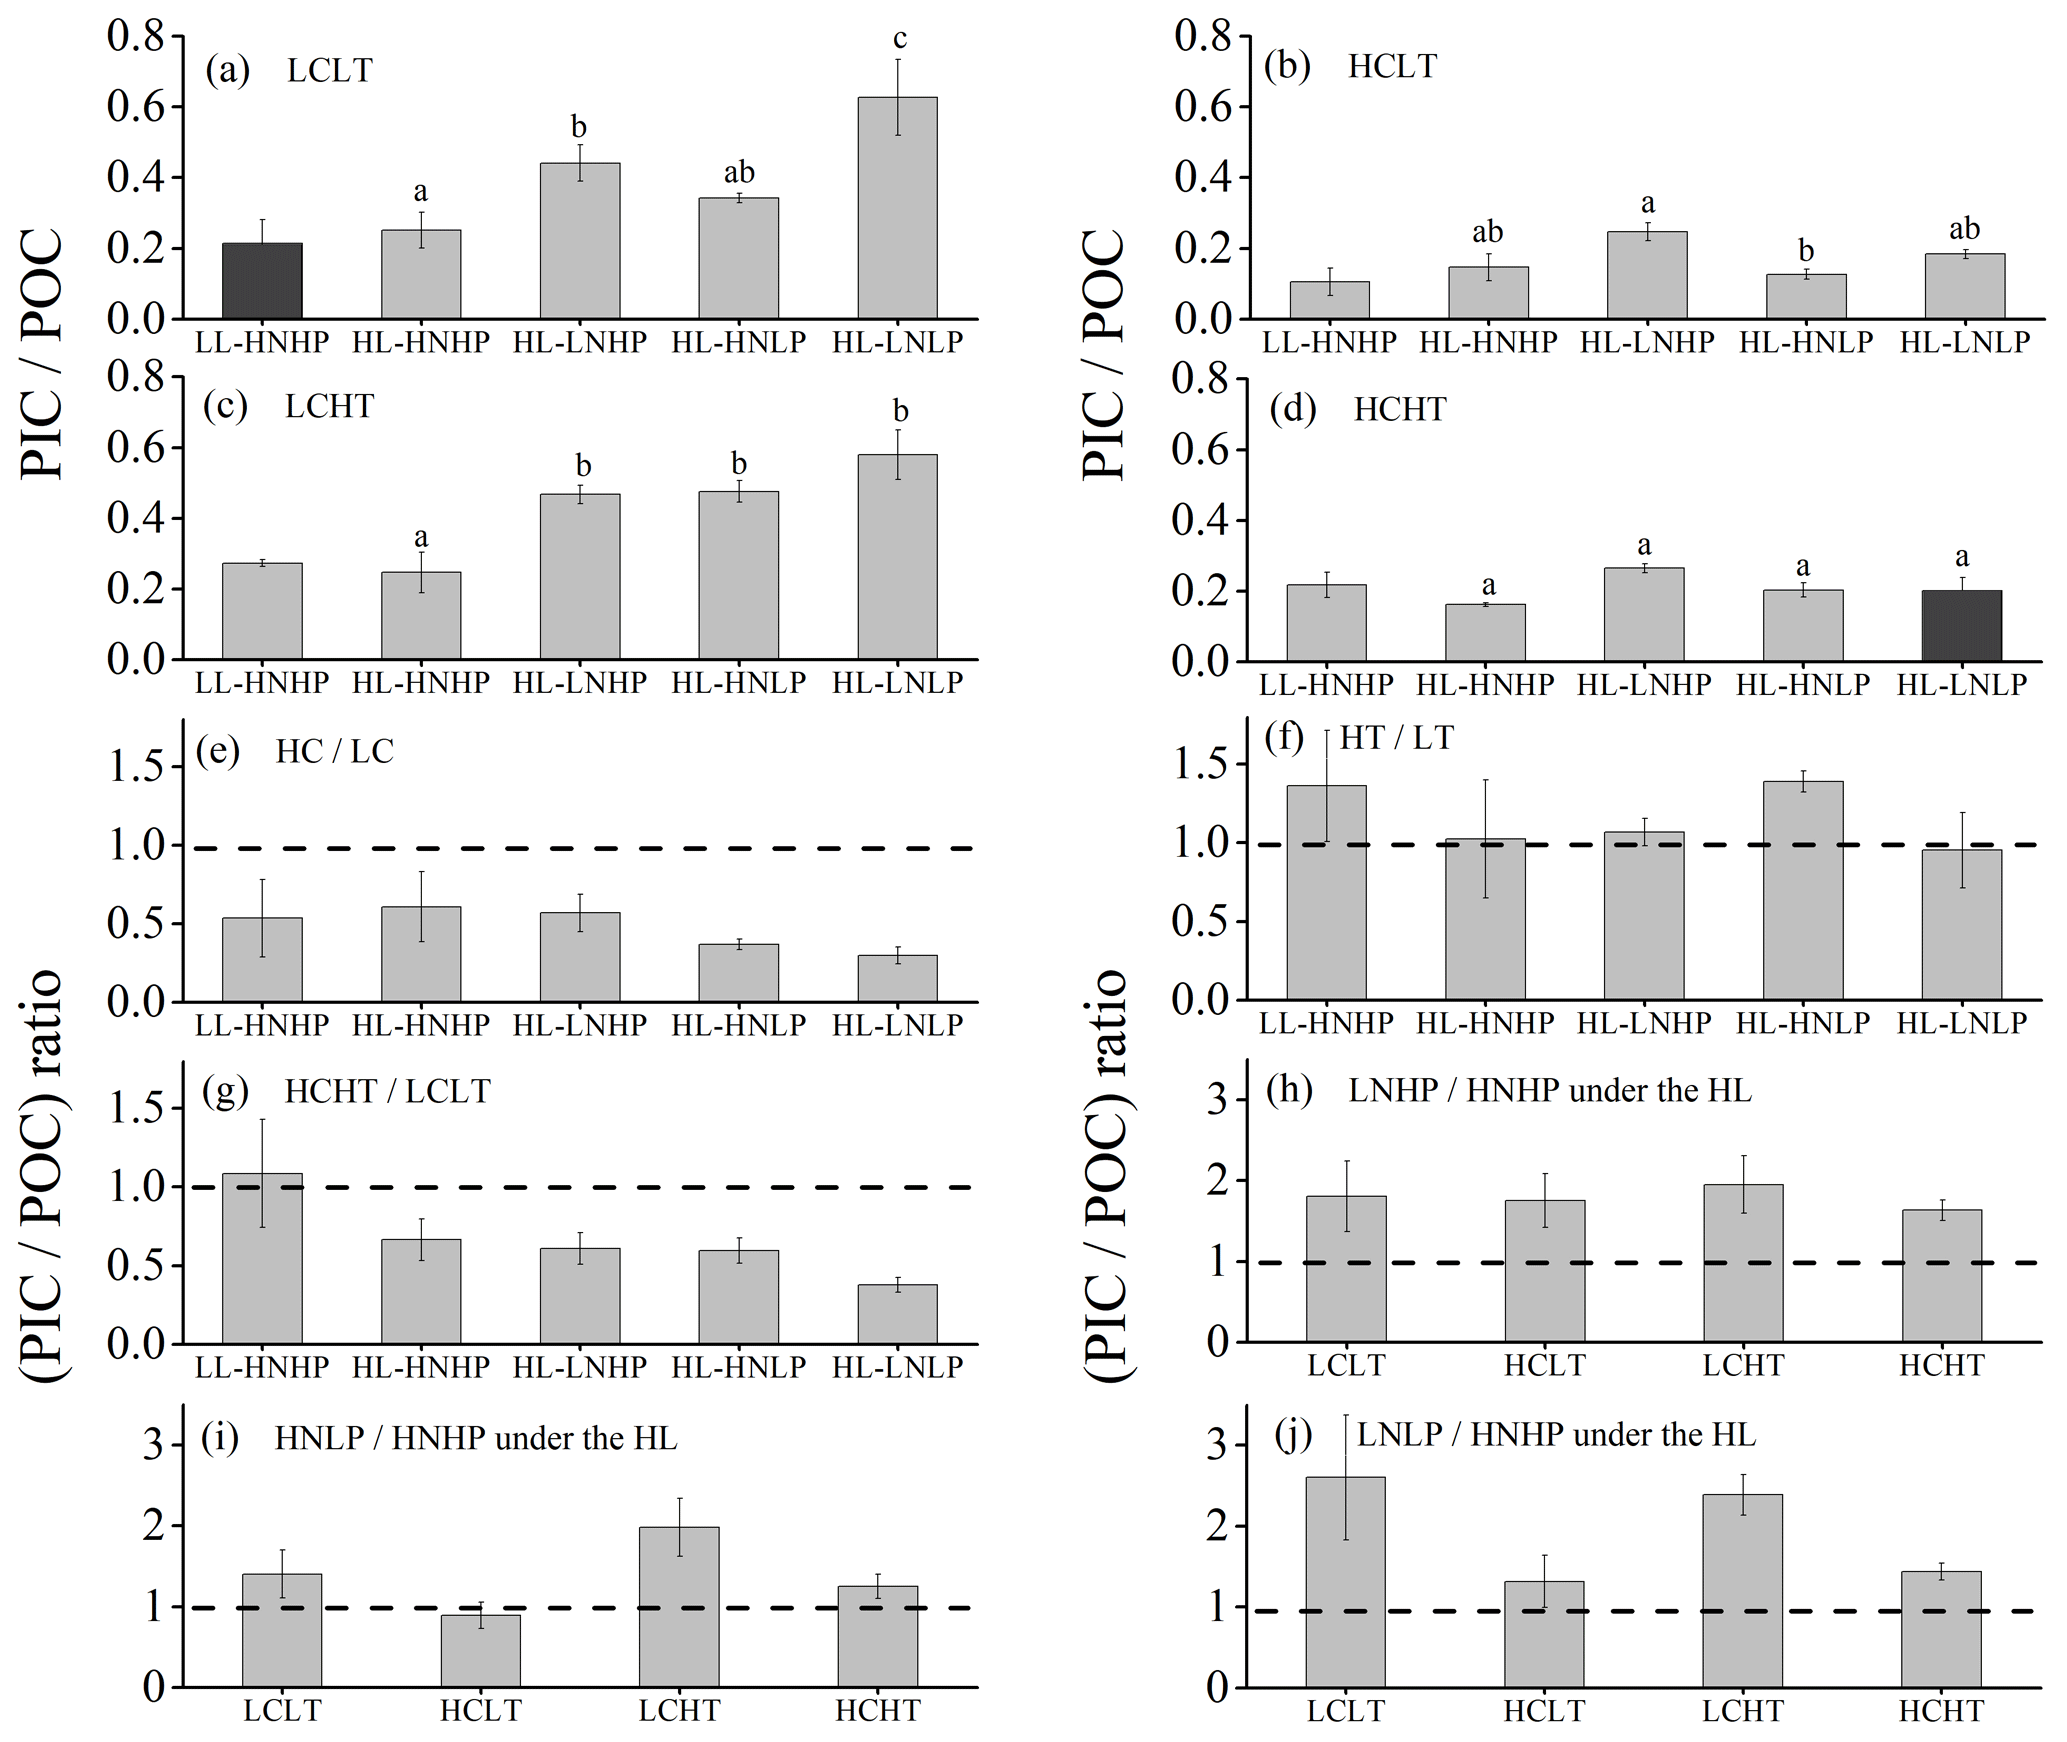
Figure 6PIC∕POC value of E. huxleyi grown in LCLT (a), HCLT (b), LCHT (c) and HCHT (d) conditions and the ratio of (PIC∕POC value) in HC to LC (e), HT to LT (f), HCHT to LCLT (g), LNHP to HNHP (h), HNLP to HNHP (i) and LNLP to HNHP (j) conditions. Data were obtained after cells were acclimated to experimental conditions for 14–16 generations and means ± SD of four replicate populations. Horizontal lines in (e)–(j) show the value of 1. Different letters (a, b, c) in (a)–(d) represent significant differences between different nutrient treatments (Tukey post hoc, p < 0.05). The results shown in the black columns were used for the ambient-future comparison in Fig. 2. Detailed experimental conditions are shown in Fig. 1.
The effect of rising temperature on the PIC∕POC value was nutrient dependent (Figs. 6a, c and f and S4). Compared to at a low temperature (LT, Fig. 6a), PIC∕POC values at a high temperature (HT, Fig. 6c) did not show significant differences in HNHP and LL, in HNHP and HL, in LNHP, and in LNLP conditions (Tukey post hoc test, all values of p > 0.1), whereas they increased by 39.0 % ± 8.9 % in HNLP conditions (Tukey post hoc test, p= 0.006) (Fig. 6a, c and f; Table 2). The combined effects of elevated pCO2 and temperature on PIC∕POC values were negative (Fig. 6a, d and g). Relative to low-pCO2 and low-temperature conditions (LCLT, Fig. 6a), PIC∕POC values in high-pCO2 and high-temperature conditions (HCHT, Fig. 6d) did not show significant differences in HNHP and LL and in HNHP and HL conditions (Tukey post hoc test, both p>0.1), but they decreased by 39.9 % ± 3.0 % in LNHP, by 40.6 % ± 5.8 % in HNLP, and by 67.8 % ± 3.1 % in LNLP conditions under HL (Tukey post hoc test, all values of p<0.01) (Fig. 6a, d and g; Table 2).
Across all LNHP–HNHP (low nitrate–high nitrate) regime pairs, PIC∕POC values were higher in the LNHP regime (Fig. 6h), though the extent of increase in PIC∕POC values depended on pCO2 or temperature levels. Compared to HNHP and HL, PIC∕POC values in LNHP were about 106.0 % ± 13.0 % larger (Tukey post hoc test, p < 0.05 in LCLT and LCHT conditions; p > 0.05 in HCLT and HCHT conditions) (Fig. 6a–d and h; Table 2). The effect of phosphate on PIC∕POC values also depended on pCO2 levels (Fig. 6i). In LC conditions, PIC∕POC values were larger in HNLP conditions than in HNHP conditions (p=0.22 in LCLT conditions; p < 0.05 in LCHT conditions), and in LNLP conditions than in LP conditions (p<0.01 in LCLT conditions; p=0.09 in LCHT conditions) (Fig. 6a and c). In HC conditions, PIC∕POC values did not show significant differences among HNHP, HNLP and LNLP conditions (Tukey post hoc test, all values of p > 0.05 in HCLT and HCHT conditions) (Fig. 6b and d; Table 2).
Understanding the effects of multiple drivers is helpful for improving how coccolithophores are represented in models (Krumhardt et al., 2017). Responses of growth and POC and PIC quotas to ocean acidification have been shown to be modulated by the temperature (Gafar and Schulz, 2018; Tong et al., 2019), light intensity or light period (light–dark cycle) (Jin et al., 2017; Bretherton et al., 2019), DIN or DIP concentrations (Müller et al., 2017), and combinations of light intensity and nutrient availability (Zhang et al., 2019) (Table 5). Following up on our previous study (Zhang et al., 2019), we added temperature as a key driver of five drivers (Table S2) and explored how temperature changes would modulate the combined effects of CO2, light, DIN and DIP that we previously reported. Our data showed that a future ocean climate change cluster (increasing CO2, temperature and light levels along with decreasing DIN and DIP levels) can lower the growth rate with an increased POC and PIC quota per cell (Fig. 2) as a result of plastic responses to the drivers. In contrast, observations of coccolithophore Chl a increased from 1990 to 2014 in the North Atlantic, and rising CO2 and temperature has been associated with accelerated growth of coccolithophores since 1965 in the North Atlantic (Rivero-Calle et al., 2015; Krumhardt et al., 2016). Our results from laboratory experiments with multiple drivers instead predicted a different trend with progressive ocean climate changes. We have to admit that results from laboratory experiments can hardly be extrapolated to natural conditions. Nevertheless, our data provide a mechanistic understanding of the combined effects of ocean climate change drivers, which can be useful in analyzing field observations.
Table 5List of the physiological responses of E. huxleyi to the concurrent changes in multiple drivers investigated by the laboratory incubations in the published studies. “↑” represents increase, “↓” represents decrease, and “n” represents no significant change regarding simultaneous changes in multiple drivers. C, T, L, N, P and μ represent CO2 (µatm), temperature (∘C), light intensity (), dissolved inorganic nitrogen and phosphate (µmol L−1), and growth rate, respectively. Simultaneous changes in multiple drivers are marked in bold.
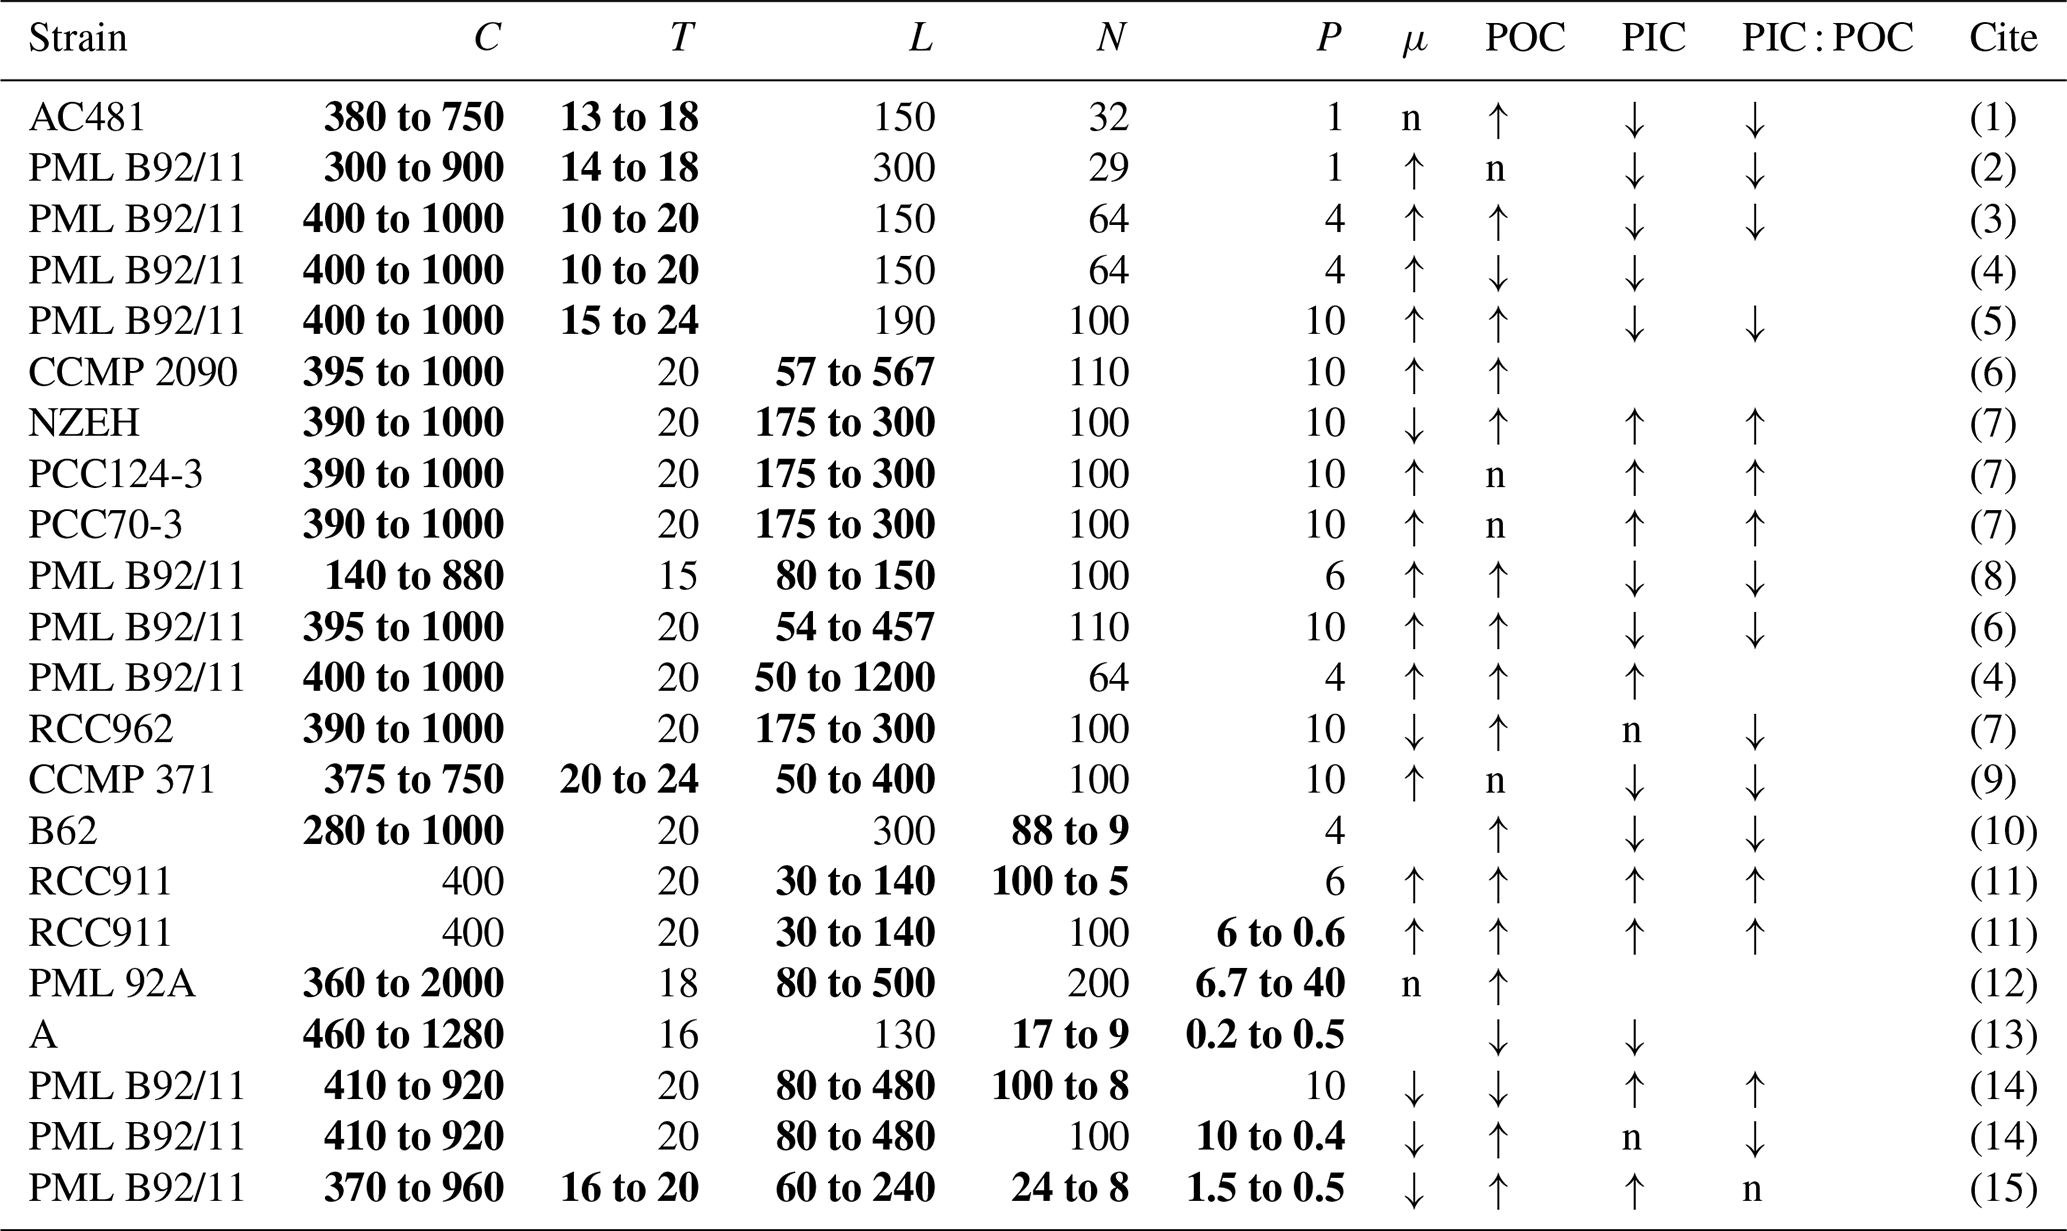
(1) represents De Bodt et al. (2010), (2) Borchard et al. (2011), (3) Sett et al. (2014), (4) Gafar and Schulz (2018), (5) Tong et al. (2019), (6) Jin et al. (2017), (7) Bretherton et al. (2019), (8) Rost et al. (2002), (9) Feng et al. (2008), (10) Müller et al. (2012), (11) Perrin et al. (2016), (12) Leonardos and Geider (2005), (13) Matthiessen et al. (2012), (14) Zhang et al. (2019), and (15) this study.
It should also be noted that regional responses to ocean global changes could differ due to chemical and physical environmental differences and species and strain variability among different oceans or regions (Blanco-Ameijeiras et al., 2016; Gao et al., 2019) and that this could also explain discrepancies between experiments and observations. Different E. huxleyi strains displayed optimal responses to a broad range of temperatures or CO2 levels, and E. huxleyi strains isolated from different regions showed local adaptation to temperature or CO2 level (Zhang et al., 2014, 2018). Strain-specific responses of growth and POC and PIC production rates in E. huxleyi isolated from different regions to changing seawater carbonate chemistry have also been documented (Langer et al., 2009). It has been suggested that inter-strain genetic variability has greater potential to induce larger phenotypic differences than the phenotypic plasticity of a single strain cultured under a broad range of variable environmental conditions (Blanco-Ameijeiras et al., 2016). On the other hand, the genetic adaptation to culture experimental conditions over time may no longer accurately represent the cells in the sea, as reflected in a diatom (Guan and Gao, 2008). Phytoplankton species that had been maintained under laboratory conditions might have lost original traits and display different responses to environmental changes (Lakeman et al., 2009). The strain used in this study has been kept in the laboratory for about 30 years, and the data obtained in this work can hardly reflect a relation to its biogeographic origin.
The decreased availability of nitrate or phosphate individually reduced the growth rate and increased the PIC quota, respectively, in this experiment. Furthermore, under LNLP conditions and high pCO2 levels, measured growth rates were significantly lower than the expected values estimated on the basis of the values in LNHP and HNLP conditions (Fig. S3a). This indicates synergistic negative effects of LN and LP on growth rate, evidence that colimitation of N and P is more severe than that by N or P alone. Here, the extent of synergy between LN and LP on the growth rate was calculated to be 8.6 % ± 2.8 % at a low temperature and to be 40.6 % ± 3.8 % at high temperature (Fig. S3a), suggesting a modulating effect of temperature on the response of the growth rate to nutrient limitations (Thomas et al., 2017). Similarly, in LNLP conditions and at a low pCO2 level, the measured PIC quota was significantly larger than the expected value (Fig. S3c), indicating synergistic positive effects of LN and LP on the PIC quota, with the extent of synergy being 31.4 % ± 3.9 % at a low temperature. LN and LP did not synergistically act to reduce the POC quota.
While there were always interactions among stressors, increased temperature itself sped up population growth to a relatively consistent value in high light, regardless of nutrient limitation, with statistically significant but small differences over the different nutrient regimes (Fig. 3f). A rising pCO2 level not only decreased the absolute values of the growth rate but also reduced the positive effect of a high temperature on growth. In addition, elevated pCO2 levels also altered patterns of growth responses to changes in light and nutrient levels (Fig. 3e–g). In ocean acidification conditions, the negative effect of a low pH on the growth rate of the same E. huxleyi strain PML B92/11 was larger than the positive effect of a high CO2 concentration (Bach et al., 2011). Our data further showed that a low pH inhibited growth to a lesser extent under the high light than under low light (Fig. 3e; Table 2). One possible explanation for this could be that photosynthesis under the high-light regime could generate more energy-conserving compounds (Fernández et al., 1996). This results in faster pCO2 removal and counteracts the negative effects of a low pH. This interaction between a low pH and high light was also observed when E. huxleyi strains PML B92/11 and CCMP 2090 were grown under incident sunlight (Jin et al., 2017).
Increases in temperature reduced PIC quotas under some conditions (high light (HL), HL LNHP and HL LNLP) (Fig. 5f), suggesting that the ratio of N : P is important in modulating calcification under warming. One striking result is the consistent negative effect of high pCO2 levels on growth and the PIC quota, regardless of other stressors. While pCO2 levels affected the absolute PIC values, the combination of high pCO2 levels and warming did not affect the responses to light and nutrients once the direct reduction in the PIC quota due to increased pCO2 was taken into account (Fig. 5g). It has been documented that PIC quotas of E. huxleyi strain PML B92/11 were reduced at high pCO2 levels due to suppressed calcification (Riebesell and Tortell, 2011). This knowledge has been based on experiments under nutrient-replete or constant conditions without consideration of multiple drivers. In this work, the PIC quota of E. huxleyi under OA was raised with increased light intensity and decreased availability of nutrients (Figs. 2 and 5). These results are consistent with other studies (Perrin et al., 2016; Jin et al., 2017), which reported that nutrient limitations enhanced calcification, and high light intensity could cause cells to remove H+ faster and then reduce the negative effect of a low pH on the calcification of E. huxleyi (Jin et al., 2017). Our data also indicate that effects of ocean climate change on the calcification of E. huxleyi are more complex than previously thought (Meyer and Riebesell, 2015). It is worth noting that the observed higher POC and PIC quotas under future ocean climate change scenarios could be attributed to the cell cycle arrest of a portion of the community (Vaulot et al., 1987). Decreased availabilities of nitrate and phosphate can extend the G1 phase where photosynthetic carbon fixation and calcification occur and lead to lower dark respiration which reduces carbon consumption (Vaulot et al., 1987; Müller et al., 2008; Gao et al., 2018).
Synthesis of RNA is a large biochemical sink for phosphate in E. huxleyi and other primary producers (Dyhrman, 2016). In this study, RNA content per cell was verified by a SYBR Green method (Berdalet et al., 2005). Compared to HNHP conditions, HNLP-grown cells had only 7.8 % of the total RNA (Fig. S11 in the Supplement). This indicates that decreased availability of phosphate strongly decreased RNA synthesis, which would consequently extend the interphase of the cell cycle where calcification occurs (Müller et al., 2008). This could explain why PIC quotas were enhanced by decreased phosphate availability (Fig. 5). Similarly, decreased availability of nitrate decreased protein (or PON) synthesis (Fig. S10 in the Supplement), which can also block cells in the interphase of the cell cycle and increase the time available for calcification in E. huxleyi (Vaulot et al., 1987). Consistently with this, lower rates of assimilation or organic matter production in E. huxleyi in LNHP treatments compared to in HNHP treatments are consistent with more energy being reallocated to use for calcification (Nimer and Merrett, 1993; Xu and Gao, 2012).
Low phosphate concentrations can induce high-affinity phosphate uptake in E. huxleyi (Riegman et al., 2000; Dyhrman and Palenik, 2003; McKew et al., 2015). This mechanism enables E. huxleyi to take up phosphate efficiently at low pCO2 concentrations, so no significant difference in growth rate was observed between HNLP and HNHP treatments (Fig. 3a and c). However, at high pCO2 levels, a low phosphate concentration (HNLP) lowered the growth of E. huxleyi relative to HNHP conditions (Fig. 3a–d; Table 2). While the affinity of E. huxleyi for phosphate under different pCO2 levels has not been studied, the extra energetic cost of coping with stress from high pCO2 levels could limit the energy available for the active uptake of phosphate. In addition, the activity of alkaline phosphatase, which might work to reuse released organic P, decreases at a low pH (Rouco et al., 2013). Finally, the enlarged cell volume in HC and HNLP (or LNLP) conditions may further reduce nutrient uptake by cells due to reduced surface-to-volume ratios and lower cell division rates (Fig. S5 in the Supplement) (Finkel, 2001). While substantial evolutionary responses to multiple drivers may help further, our results imply that decreased phosphate availability along with progressive ocean acidification and warming in the surface ocean may reduce the competitive capability of E. huxleyi in oligotrophic waters. Meanwhile, HNLP conditions also affected expressions of genes related to nitrogen metabolism due to the tight stoichiometric coupling of the nitrogen and phosphate metabolism (Rokitta et al., 2016). Decreased availability of nitrate further limited the nitrogen metabolism of E. huxleyi (Rokitta et al., 2014), which lowered the overall biosynthetic activity and reduced cellular PON quotas (Fig. S10). This explains the synergistic inhibitions of a low pH, low phosphate and low nitrate on the growth of E. huxleyi (Fig. 3).
POC quotas and the cell-volume-normalized POC quotas were larger at high pCO2 levels than at low pCO2 levels under all treatments (Figs. 4 and S6 in the Supplement; Table 2), which could be a combined outcome of increased photosynthetic carbon fixation (Zondervan et al., 2002; Hoppe et al., 2011; Tong et al., 2019) and reduced cell division (present work), leading to a pronounced increase in POC quotas in the cells grown under low-phosphate (HNLP) and high-pCO2 conditions (Fig. 4). In HNLP conditions and at high pCO2 levels, photosynthetic carbon fixation proceeds whereas the cell division rate decreases (Figs. 3 and 4), so reallocation of newly produced particulate organic carbon (POC) could be slowed down (Vaulot et al., 1987). In this case, over-synthesis of cellular organic carbon might be released as dissolved organic carbon (DOC), which can coagulate to transparent exopolymer particles (TEPs) and attach to cells (Biermann and Engel, 2010; Engel et al., 2015). When cells were filtered on GF/F filters, any TEPs would not have been separated from the cells and would have contributed to the measured POC quota in this study.
Large PIC quotas of coccolithophores may facilitate the accumulation of calcium carbonate in the deep ocean and increase the contribution of CaCO3 produced by coccolithophores to calcareous ooze in the pelagic ocean (Hay, 2004). Due to CaCO3 being more dense than organic carbon, larger PIC quotas may facilitate the effective transport of POC to deep oceans, leading to vertical DIC or CO2 gradients of seawater (Milliman, 1993; Ziveri et al., 2007). While the effects of global ocean climate changes on physiological processes of phytoplankton can be complex, our results promote our understanding of how a cosmopolitan coccolithophore responds to future ocean environmental changes through plastic trait change.
The data are available upon request to the corresponding author (Kunshan Gao).
The supplement related to this article is available online at: https://doi.org/10.5194/bg-17-6357-2020-supplement.
YZ and KG designed the experiment. YZ performed the experiment. All authors analyzed the data and wrote and improved the manuscript.
The authors declare that they have no conflict of interest.
This research has been supported by the National Natural Science Foundation of China (grant nos. 41720104005, 41806129 and 41721005) and the Joint Project of the National Natural Science Foundation of China and Shandong Province (grant no. U1606404).
This paper was edited by Peter Landschützer and reviewed by two anonymous referees.
Bach, L. T., Riebesell, U., and Schulz, K. G.: Distinguishing between the effects of ocean acidification and ocean carbonation in the coccolithophore Emiliania huxleyi, Limnol. Oceanogr., 56, 2040–2050, https://doi.org/10.4319/lo.2011.56.6.2040, 2011.
Barton, A. D., Irwin, A. J., Finkel, Z. V., and Stock, C. A.: Anthropogenic climate change drives shift and shuffle in North Atlantic phytoplankton communities, P. Natl. Acad. Sci. USA, 113, 2964–2969, https://doi.org/10.1073/pnas.1519080113, 2016.
Berdalet, E., Roldán, C., Olivar, M. P., and Lysnes, K.: Quantifying RNA and DNA in planktonic organisms with SYBR Green II and nucleases. Part A. Optimisation of the assay, Sci. Mar., 69, 1–16, https://doi.org/10.3989/scimar.2005.69n11, 2005.
Biermann, A. and Engel, A.: Effect of CO2 on the properties and sinking velocity of aggregates of the coccolithophore Emiliania huxleyi, Biogeosciences, 7, 1017–1029, https://doi.org/10.5194/bg-7-1017-2010, 2010.
Blanco-Ameijeiras, S., Lebrato, M., Stoll, H. M., Iglesias-Rodriguez, D., Müller, M. N., Méndez-Vicente, A., and Oschlies, A.: Phenotypic variability in the coccolithophore Emiliania huxleyi, Plos ONE, 11, e0157697, https://doi.org/10.1371/journal.pone.0157697, 2016.
Borchard, C., Borges, A. V., Händel, N., and Engel, A.: Biogeochemical response of Emiliania huxleyi (PML B92/11) to elevated CO2 and temperature under phosphorus limitation: A chemostat study, J. Exp. Mar. Biol. Ecol., 410, 61–71, https://doi.org/10.1016/j.jembe.2011.10.004, 2011.
Boyd, P. W., Strzepek, R., Fu, F., and Hutchins, D. A.: Environmental control of open-ocean phytoplankton groups: Now and in the future, Limnol. Oceanogr., 55, 1353–1376, https://doi.org/10.4319/lo.2010.55.3.1353, 2010.
Boyd, P. W., Lennartz, S. T., Glover, D. M., and Doney, S. C.: Biological ramifications of climate-change-mediated oceanic multi-stressors, Nat. Clim. Change, 5, 71–79, https://doi.org/10.1038/nclimate2441, 2015.
Boyd, P. W., Dillingham, P. W., McGraw, C. M., Armstrong, E. A., Cornwall, C. E., Feng, Y., Hurd, C. L., Gault-Ringold, M., Roleda, M. Y., Timmins-Schiffman, E., and Nunn, B. L.: Physiological responses of a Southern Ocean diatom to complex future ocean conditions, Nat. Clim. Change, 6, 207–213, https://doi.org/10.1038/NCLIMATE2811, 2016.
Boyd, P. W., Collins, S., Dupont, S., Fabricius, K., Gattuso, J. P., Havenhand, J., Hutchins, D. A., Riebesell, U., Rintoul, M. S., Vichi, M., Biswas, H., Ciotti, A., Gao, K., Gehlen, M., Hurd, C. L., Kurihara, H., McGraw, C. M., Navarro, J. M., Nilsson, G. E., Passow, U., and Pörtner, H. O.: Experimental strategies to assess the biological ramifications of multiple drivers of global ocean change—A review, Glob. Change Biol., 24, 2239–2261, https://doi.org/10.1111/gcb.14102, 2018.
Brennan, G. and Collins, S.: Growth responses of a green alga to multiple environmental drivers, Nat. Clim. Change, 5, 892–897, https://doi.org/10.1038/nclimate2682, 2015.
Brennan, G., Colegrave, N., and Collins, S.: Evolutionary consequences of multidriver environmental change in an aquatic primary producer, P. Natl. Acad. Sci. USA, 114, 9930–9935, https://doi.org/10.1073/pnas.1703375114, 2017.
Bretherton, L., Poulton, A. J., Lawson, T., Rukminasari, N., Balestreri, C., Schroeder, D., Mark Moore, C., and Suggett, D. J.: Day length as a key factor moderating the response of coccolithophore growth to elevated pCO2, Limnol. Oceanogr., 64, 1284–1296, https://doi.org/10.1002/lno.11115, 2019.
De Bodt, C., Van Oostende, N., Harlay, J., Sabbe, K., and Chou, L.: Individual and interacting effects of pCO2 and temperature on Emiliania huxleyi calcification: study of the calcite production, the coccolith morphology and the coccosphere size, Biogeosciences, 7, 1401–1412, https://doi.org/10.5194/bg-7-1401-2010, 2010.
Dickson, A. G., Afghan, J. D., and Anderson, G. C.: Reference materials for oceanic CO2 analysis: a method for the certification of total alkalinity, Mar. Chem., 80, 185–197, https://doi.org/10.1016/S0304-4203(02)00133-0, 2003.
Dyhrman, S. T.: Nutrients and their acquisition: phosphorus physiology in microalgae, in: The physiology of microalgae, edited by: Borowitzka, M. A., Beardall, J., and Raven, J. A., Springer, Heidelberg, 155–183, https://doi.org/10.1007/978-3-319-24945-2, 2016.
Dyhrman, S. T. and Palenik, B.: Characterization of ectoenzyme activity and phosphate-regulated proteins in the coccolithophorid Emiliania huxleyi, J. Plankton Res., 25, 1215–1225, https://doi.org/10.1093/plankt/fbg086, 2003.
Engel, A., Borchard, C., Loginova, A., Meyer, J., Hauss, H., and Kiko, R.: Effects of varied nitrate and phosphate supply on polysaccharidic and proteinaceous gel particle production during tropical phytoplankton bloom experiments, Biogeosciences, 12, 5647–5665, https://doi.org/10.5194/bg-12-5647-2015, 2015.
Feng, Y., Warner, M. E., Zhang, Y., Sun, J., Fu, F., Rose, J. M., and Hutchins, D. A.: Interactive effects of increased pCO2, temperature and irradiance on the marine coccolithophore Emiliania huxleyi (Prymnesiophyceae), Eur. J. Phycol., 43, 87– 98, https://doi.org/10.1080/09670260701664674, 2008.
Feng, Y., Roleda, M. Y., Armstrong, E., Boyd, P. W., and Hurd, C. L.: Environmental controls on the growth, photosynthetic and calcification rates of a Southern Hemisphere strain of the coccolithophore Emiliania huxleyi, Limnol. Oceanogr., 62, 519–540, https://doi.org/10.1002/lno.10442, 2017.
Fernández, E., Fritz, J. J., and Balch, W. M.: Chemical composition of the coccolithophorid Emiliania huxleyi under light-limited steady state growth. J. Exp. Mar. Biol. Ecol., 207, 149–160. https://doi.org/10.1016/S0022-0981(96)02657-3, 1996.
Finkel, Z. V.: Light absorption and size scaling of light-limited metabolism in marine diatoms, Limnol. Oceanogr., 46, 86–94, https://doi.org/10.4319/lo.2001.46.1.0086, 2001.
Gafar, N. A. and Schulz, K. G.: A three-dimensional niche comparison of Emiliania huxleyi and Gephyrocapsa oceanica: reconciling observations with projections, Biogeosciences, 15, 3541–3560, https://doi.org/10.5194/bg-15-3541-2018, 2018.
Gao, G., Xia, J., Yu, J., and Zeng, X.: Physiological response of a red tide alga (Skeletonema costatum) to nitrate enrichment, with special reference to inorganic carbon acquisition, Mar. Environ. Res., 133, 15–23, https://doi.org/10.1016/j.marenvres.2017.11.003, 2018.
Gao, K., Ruan, Z., Villafañe, V. E., Gattuso, J., and Walter-Helbling, E.: Ocean acidification exacerbates the effect of UV radiation on the calcifying phytoplankton Emiliania huxleyi, Limnol. Oceanogr., 54, 1855–1862, https://doi.org/10.4319/lo.2009.54.6.1855, 2009.
Gao, K., Beardall, J., Häder, D. P., Hall-Spencer, J. M., Gao, G., and Hutchins, D. A.: Effects of ocean acidification on marine photosynthetic organisms under the concurrent influences of warming, UV radiation, and deoxygenation, Front. Mar. Sci., 6, 322, https://doi.org/10.3389/fmars.2019.00322, 2019.
Guan, W. and Gao, K.: Light histories influence the impacts of solar ultraviolet radiation on photosynthesis and growth in a marine diatom, Skeletonema costatum, J. Photoch. Photobio. B, 91, 151–156, https://doi.org/10.1016/j.jphotobiol.2008.03.004, 2008.
Hansen, H. P. and Koroleff, F.: Determination of nutrients, in: Methods of seawater analysis, edited by: Grasshoff, K., Kremling, K., and Ehrhardt, M., WILEY-VCH Publishers, Weinheim, ISBN: 3-527-29589-5, 1999.
Hay, W. W.: Carbonate fluxes and calcareous nannoplankton, in: Coccolithophores: from molecular biology to global impact, edited by: Thierstein, H. R. and Young, J. R., Springer, Berlin, 509–528, 2004.
Hoppe, C. J. M., Langer, G., and Rost, B.: Emiliania huxleyi shows identical responses to elevated pCO2 in TA and DIC manipulations, J. Exp. Mar. Biol. Ecol., 406, 54–62, https://doi.org/10.1016/j.jembe.2011.06.008, 2011.
Jin, P., Ding, J. C., Xing, T., Riebesell, U., and Gao, K. S.: High levels of solar radiation offset impacts of ocean acidification on calcifying and non-calcifying strains of Emiliania huxleyi, Mar. Ecol. Prog. Ser., 568, 47–58, https://doi.org/10.3354/meps12042, 2017.
Kottmeier, D. M., Rokitta, S. D., and Rost, B.: Acidification, not carbonation, is the major regulator of carbon fluxes in the coccolithophore Emiliania huxleyi, New Phytol., 211, 126–137, https://doi.org/10.1111/nph.13885, 2016.
Krumhardt, K. M., Lovenduski, N. S., Freeman, N. M., and Bates, N. R.: Apparent increase in coccolithophore abundance in the subtropical North Atlantic from 1990 to 2014, Biogeosciences, 13, 1163–1177, https://doi.org/10.5194/bg-13-1163-2016, 2016.
Krumhardt, K. M., Lovenduski, N. S., Iglesias-Rodriguez, M. D., and Kleypas, J. A.: Coccolithophore growth and calcification in a changing ocean, Prog. Oceanogr., 171, 276–295, https://doi.org/10.1016/j.pocean.2017.10.007, 2017.
Kwiatkowski, L., Aumont, O., and Bopp, L.: Consistent trophic amplification of marine biomass declines under climate change, Glob. Change Biol., 25, 218–229, https://doi.org/10.1111/gcb.14468, 2019.
Lakeman, M. B., von Dassow, P., and Cattolico, R. A.: The strain concept in phytoplankton ecology, Harmful Algae, 8, 746–758, https://doi.org/10.1016/j.hal.2008.11.011, 2009.
Langer, G., Nehrke, G., Probert, I., Ly, J., and Ziveri, P.: Strain-specific responses of Emiliania huxleyi to changing seawater carbonate chemistry, Biogeosciences, 6, 2637–2646, https://doi.org/10.5194/bg-6-2637-2009, 2009.
Larsen, A., Flaten, G. A. F., Sandaa, R., Castberg, T., Thyrhaug, R., Erga, S. R., Jacquet, S., and Bratbak, G.: Spring phytoplankton bloom dynamics in Norwegian coastal waters: Microbial community succession and diversity, Limnol. Oceanogr., 49, 180–190, https://doi.org/10.4319/lo.2004.49.1.0180, 2004.
Leonardos, N. and Geider, R. J.: Elevated atmospheric carbon dioxide increases organic carbon fixation by Emilinia huxleyi (haptophyta), under nutrient-limited high-light conditions, J. Phycol., 41, 1196–1203, https://doi.org/10.1111/j.1529-8817.2005.00152.x, 2005.
Li, W., Yang, Y., Li, Z., Xu, J., and Gao, K.: Effects of seawater acidification on the growth rates of the diatom Thalassiosira (Conticribra) weissflogii under different nutrient, light and UV radiation regimes, J. Appl. Phycol., 29, 133–142, https://doi.org/10.1007/s10811-016-0944-y, 2017.
Locarnini, R. A., Mishonov, A. V., Antonov, J. I., Boyer, T. P., and Garcia, H. E.: World ocean atlas 2005, V. 1: Temperature, edited by: Levitus, S., NOAA Atlas NESDIS 61, U.S. Government Printing Office, 123–134, 2006.
Matthiessen, B., Eggers, S. L., and Krug, S. A.: High nitrate to phosphorus regime attenuates negative effects of rising pCO2 on total population carbon accumulation, Biogeosciences, 9, 1195–1203, https://doi.org/10.5194/bg-9-1195-2012, 2012.
McKew, B. A., Metodieva, G., Raines, C. A., Metodiev, M. V., and Geider, R. J.: Acclimation of Emiliania huxleyi (1516) to nutrient limitation involves precise modification of the proteome to scavenge alternative sources of N and P, Environ. Microbiol., 17, 1–13, https://doi.org/10.1111/1462-2920.12957, 2015.
Meyer, J. and Riebesell, U.: Reviews and Syntheses: Responses of coccolithophores to ocean acidification: a meta-analysis, Biogeosciences, 12, 1671–1682, https://doi.org/10.5194/bg-12-1671-2015, 2015.
Milliman, J. D.: Production and accumulation of calcium carbonate in the ocean: budget of a nonsteady state, Global Biogeochem. Cy., 7, 927–957, https://doi.org/10.1029/93GB02524, 1993.
Monteiro, F. M., Bach, L. T., Brownlee, C., Bown, P., Rickaby, R. E. M., Poulton, A. J., Tyrrell, T., Beaufort, L., Dutkiewicz, S., Gibbs, S., Gutowska, M. A., Lee, R., Riebesell, U., Young, J., and Ridgwell, A.: Why marine phytoplankton calcify, Sci. Adv., 2, 1–14, https://doi.org/10.1126/sciadv.1501822, 2016.
Müller, M. N., Antia, A. N., and LaRoche, J.: Influence of cell cycle phase on calcification in the coccolithophore Emiliania huxleyi, Limnol. Oceanogr., 53, 506–512, https://doi.org/10.4319/lo.2008.53.2.0506, 2008.
Müller, M. N., Beaufort, L., Bernard, O., Pedrotti, M. L., Talec, A., and Sciandra, A.: Influence of CO2 and nitrogen limitation on the coccolith volume of Emiliania huxleyi (Haptophyta), Biogeosciences, 9, 4155–4167, https://doi.org/10.5194/bg-9-4155-2012, 2012.
Müller, M. N., Trull, T. W., and Hallegraeff, G. M.: Independence of nutrient limitation and carbon dioxide impacts on the Southern Ocean coccolithophore Emiliania huxleyi, ISME J., 11, 1777–1787, https://doi.org/10.1038/ismej.2017.53, 2017.
Nimer, N. A. and Merrett, M. J.: Calcification rate in Emiliania huxleyi Lohmann in response to light, nitrate and availability of inorganic carbon, New Phytol., 123, 673–677, https://doi.org/10.1111/j.1469-8137.1993.tb03776.x, 1993.
Omar, A. M., Olsen, A., Johannessen, T., Hoppema, M., Thomas, H., and Borges, A. V.: Spatiotemporal variations of fCO2 in the North Sea, Ocean Sci., 6, 77–89, https://doi.org/10.5194/os-6-77-2010, 2010.
Perrin, L., Probert, I., Langer, G., and Aloisi, G.: Growth of the coccolithophore Emiliania huxleyi in light- and nutrient-limited batch reactors: relevance for the BIOSOPE deep ecological niche of coccolithophores, Biogeosciences, 13, 5983–6001, https://doi.org/10.5194/bg-13-5983-2016, 2016.
Pierrot, D., Lewis, E., and Wallace, D. W. R.: MS Excel program developed for CO2 system calculations, ORNL/CDIAC-105, Carbon Dioxide Information Analysis Centre, Oak Ridge National Laboratory, U.S. Department of Energy, https://doi.org/10.3334/CDIAC/otg.CO2SYS_XLS_CDIAC105a, 2006.
R Core Team: The R foundation for statistical computing platform: x86_64-w64-mingw32/x64, available at: https://cran.r-project.org/bin/windows/base/old/3.5.0/ (28 February 2020), 2018.
Riebesell, U. and Gattuso, J. P.: Lessons learned from ocean acidification research, Nat. Clim. Change, 5, 12–14, https://doi.org/10.1038/nclimate2456, 2015.
Riebesell, U. and Tortell, P. D.: Effects of ocean acidification on pelagic organisms and ecosystems, in: Ocean acidification, edited by: Gattuso, J. P. and Hansson, L., Oxford University Press, Oxford, 99–121, 2011.
Riegman, R., Stolte, W., Noordeloos, A. A. M., and Slezak, D.: Nutrient uptake and alkaline phosphatase (EC 3:1:3:1) activity of Emiliania huxleyi (Prymnesiophyceae) during growth under N and P limitation in continuous cultures, J. Phycol., 36, 87–96, https://doi.org/10.1046/j.1529-8817.2000.99023.x, 2000.
Rivero-Calle, S., Gnanadesikan, A., Del Castillo, C. E., Balch, W. M., and Guikema, S. D.: Multidecadal increase in North Atlantic coccolithophores and the potential role of rising CO2, Science, 350, 1533–1537, https://doi.org/10.1126/science.aaa8026, 2015.
Rokitta, S. D., von Dassow, P., Rost, B., and John, U.: Emiliania huxleyi endures N-limitation with an efficient metabolic budgeting and effective ATP synthesis, BMC Genomics, 15, 1051–1064, https://doi.org/10.1186/1471-2164-15-1051, 2014.
Rokitta, S. D., von Dassow, P., Rost, B., and John, U.: P- and N-depletion trigger similar cellular responses to promote senescence in eukaryotic phytoplankton, Front. Mar. Sci., 3, 109, https://doi.org/10.3389/fmars.2016.00109, 2016.
Rosas-Navarro, A., Langer, G., and Ziveri, P.: Temperature affects the morphology and calcification of Emiliania huxleyi strains, Biogeosciences, 13, 2913–2926, https://doi.org/10.5194/bg-13-2913-2016, 2016.
Rost, B. and Riebesell, U.: Coccolithophores and the biological pump: responses to environmental changes, in: Coccolithophores: from molecular biology to global impact, edited by: Thierstein, H. R. and Young, J. R., Springer, Berlin, 99–125, 2004.
Rost, B., Zondervan, I., and Riebesell, U.: Light-dependent carbon isotope fractionation in the coccolithophorid Emiliania huxleyi, Limnol. Oceanogr., 47, 120–128, https://doi.org/10.4319/lo.2002.47.1.0120, 2002
Rouco, M., Branson, O., Lebrato, M., and Iglesias-Rodríguez, M.: The effect of nitrate and phosphate availability on Emiliania huxleyi (NZEH) physiology under different CO2 scenarios, Front. Microbiol., 4, 1–11, https://doi.org/10.3389/fmicb.2013.00155, 2013.
Roy, R. N., Roy, L. N., Vogel, K. M., Porter-Moore, C., Pearson, T., Good, C. E., Millero, F. J., and Campbell, D. C.: Thermodynamics of the dissociation of boric acid in seawater at S=35 from 0 to 55 degreeC, Mar. Chem., 44, 243–248, https://doi.org/10.1016/0304-4203(93)90206-4, 1993.
Schaum, E., Rost, B., Millar, A. J., and Collins, S.: Variation in plastic responses of a globally distributed picoplankton species to ocean acidification, Nat. Clim. Change, 3, 298–302, https://doi.org/10.1038/NCLIMATE1774, 2013.
Sett, S., Bach, L. T., Schulz, K. S., Koch-Klavsen, S., Lebrato, M., and Riebesell, U.: Temperature modulates coccolithophorid sensitivity of growth, photosynthesis and calcification to increasing seawater pCO2, PLoS One, 9, e88308, https://doi.org/10.1371/journal.pone.0088308, 2014.
Sunda, W. G., Price, N. M., and Morel, F. M. M.: Trace metal ion buffers and their use in culture studies, in: Algal culturing techniques, edited by: Andersen, R. A., Elsevier Academic Press, San Diego, 53–59, 2005.
Thomas, M. K., Aranguren-Gassis, M., Kremer, C. T., Gould, M. R., Anderson, K., Klausmeier, C. A., Litchman, E.: Temperature-nutrient interactions exacerbate sensitivity to warming in phytoplankton, Glob. Change Biol., 23, 3269–3280, https://doi.org/10.1111/gcb.13641, 2017.
Tong, S., Hutchins, D., Fu, F., and Gao, K.: Effects of varying growth irradiance and nitrogen sources on calcification and physiological performance of the coccolithophore Gephyrocapsa oceanica grown under nitrogen limitation, Limnol. Oceanogr., 61, 2234–2242, https://doi.org/10.1002/lno.10371, 2016.
Tong, S., Hutchins, D. A., and Gao, K.: Physiological and biochemical responses of Emiliania huxleyi to ocean acidification and warming are modulated by UV radiation, Biogeosciences, 16, 561–572, https://doi.org/10.5194/bg-16-561-2019, 2019.
Vaulot, D., Olson, R. J., Merkel, S., and Chisholm, S. E.: Cell-cycle response to nutrient starvation in two phytoplankton species, Thalassiosira weissflogii and Hymenomonas carterae, Mar. Biol., 95, 625–630, https://doi.org/10.1007/BF00393106, 1987.
Xu, J., Gao, K., Li, Y., and Hutchins, D. A.: Physiological and biochemical responses of diatoms to projected ocean changes, Mar. Ecol. Prog. Ser., 515, 73–81, https://doi.org/10.3354/meps11026, 2014.
Xu, K. and Gao, K.: Reduced calcification decreases photoprotective capability in the coccolithophorid Emiliania huxleyi, Plant Cell Physiol., 53, 1267–1274, https://doi.org/10.1093/pcp/pcs066, 2012.
Xu, K., Gao, K., Villafañe, V. E., and Helbling, E. W.: Photosynthetic responses of Emiliania huxleyi to UV radiation and elevated temperature: roles of calcified coccoliths, Biogeosciences, 8, 1441–1452, https://doi.org/10.5194/bg-8-1441-2011, 2011.
Xu, K., Fu, F., and Hutchins, D. A.: Comparative responses of two dominant Antarctic phytoplankton taxa to interactions between ocean acidification, warming, irradiance, and iron availability, Limnol. Oceanogr., 59, 1919–1931, https://doi.org/10.4319/lo.2014.59.6.1919, 2014.
Zhang, Y., Klapper, R., Lohbeck, K. T., Bach, L. T., Schulz, K. G., Reusch, T. B. H., and Riebesell, U.: Between- and within-population variations in thermal reaction norms of the coccolithophore Emiliania huxleyi, Limnol. Oceanogr., 59, 1570–1580, https://doi.org/10.4319/lo.2014.59.5.1570, 2014.
Zhang, Y., Bach, L. T., Lohbeck, K. T., Schulz, K. G., Listmann, L., Klapper, R., and Riebesell, U.: Population-specific responses in physiological rates of Emiliania huxleyi to a broad CO2 range, Biogeosciences, 15, 3691–3701, https://doi.org/10.5194/bg-15-3691-2018, 2018.
Zhang, Y., Fu, F., Hutchins, D. A., and Gao. K.: Combined effects of CO2 level, light intensity and nutrient availability on the coccolithophore Emiliania huxleyi, Hydrobiologia, 842, 127–141, https://doi.org/10.1007/s10750-019-04031-0, 2019.
Ziveri, P., deBernardi, B., Baumann, K., Stoll, H. M., and Mortyn, P. G.: Sinking of coccolith carbonate and potential contribution to organic carbon ballasting in the deep ocean, Deep-Sea Res., 54, 659–675, https://doi.org/10.1016/j.dsr2.2007.01.006, 2007.
Zondervan, I., Rost, B., and Riebesell, U.: Effect of CO2 concentration on the PIC∕POC ratio in the coccolithophore Emiliania huxleyi grown under light-limiting conditions and different daylengths, J. Exp. Mar. Biol. Ecol., 272, 55–70, https://doi.org/10.1016/s0022-0981(02)00037-0, 2002.