the Creative Commons Attribution 4.0 License.
the Creative Commons Attribution 4.0 License.
 | 24 Feb 2020
Isotopic evidence for alteration of nitrous oxide emissions and producing pathways' contribution under nitrifying conditions
Mathieu Sébilo
Justine Fiat
Longqi Lang
Ahlem Filali
Véronique Vaury
Mathieu Spérandio
Anniet M. Laverman
Nitrous oxide (N2O) emissions from a nitrifying biofilm reactor were investigated with N2O isotopocules. The nitrogen isotopomer site preference of N2O (15N-SP) indicated the contribution of producing and consuming pathways in response to changes in oxygenation level (from 0 % to 21 % O2 in the gas mix), temperature (from 13.5 to 22.3 ∘C) and ammonium concentrations (from 6.2 to 62.1 mg N L−1). Nitrite reduction, either nitrifier denitrification or heterotrophic denitrification, was the main N2O-producing pathway under the tested conditions. Difference between oxidative and reductive rates of nitrite consumption was discussed in relation to concentrations and N2O emissions. Hence, nitrite oxidation rates seem to decrease as compared to ammonium oxidation rates at temperatures above 20 ∘C and under oxygen-depleted atmosphere, increasing N2O production by the nitrite reduction pathway. Below 20 ∘C, a difference in temperature sensitivity between hydroxylamine and ammonium oxidation rates is most likely responsible for an increase in N2O production via the hydroxylamine oxidation pathway (nitrification). A negative correlation between the reaction kinetics and the apparent isotope fractionation was additionally shown from the variations of δ15N and δ18O values of N2O produced from ammonium. The approach and results obtained here, for a nitrifying biofilm reactor under variable environmental conditions, should allow for application and extrapolation of N2O emissions from other systems such as lakes, soils and sediments.
- Article
(1674 KB) - Full-text XML
-
Supplement
(383 KB) - BibTeX
- EndNote


Nitrogen (N) cycling relies on numerous biological processes exploited and altered by anthropic activities (Bothe et al., 2007). One of the major issues related to N cycle alteration is the production of nitrous oxide (N2O), a potent ozone-depleting and greenhouse gas whose emissions exponentially increased during the industrial era (Crutzen et al., 1979; IPCC, 2014; Ravishankara et al., 2009). Wastewater resource recovery facilities (WRRFs) contribute to about 3 % of annual global anthropogenic N2O sources (ca. 6.7±1.3 Tg N-N2O in 2011; IPCC, 2014), with 0 % to 25 % of the influent nitrogen loads emitted as N2O (Law et al., 2012b). The challenges to mitigating these emissions are linked with the understanding of N2O-producing processes and their controls.
Two microbial processes are responsible for the production of N2O (nitrification and heterotrophic denitrification), with only one of these capable of consuming it (denitrification; Fig. 1a; Kampschreur et al., 2009). Nitrification is the oxidation of ammonium to nitrite () via the intermediate hydroxylamine (NH2OH) conducted by ammonia oxidizers, and the subsequent oxidation of to nitrate () by nitrite oxidizers. During nitrification, N2O can be produced as a reaction side-product from hydroxylamine oxidation by biotic, abiotic or hybrid processes (Caranto et al., 2016; Heil et al., 2015; Terada et al., 2017). Heterotrophic denitrification and nitrifier denitrification produce N2O from nitrite reduction conducted by denitrifiers and ammonium oxidizers, respectively.
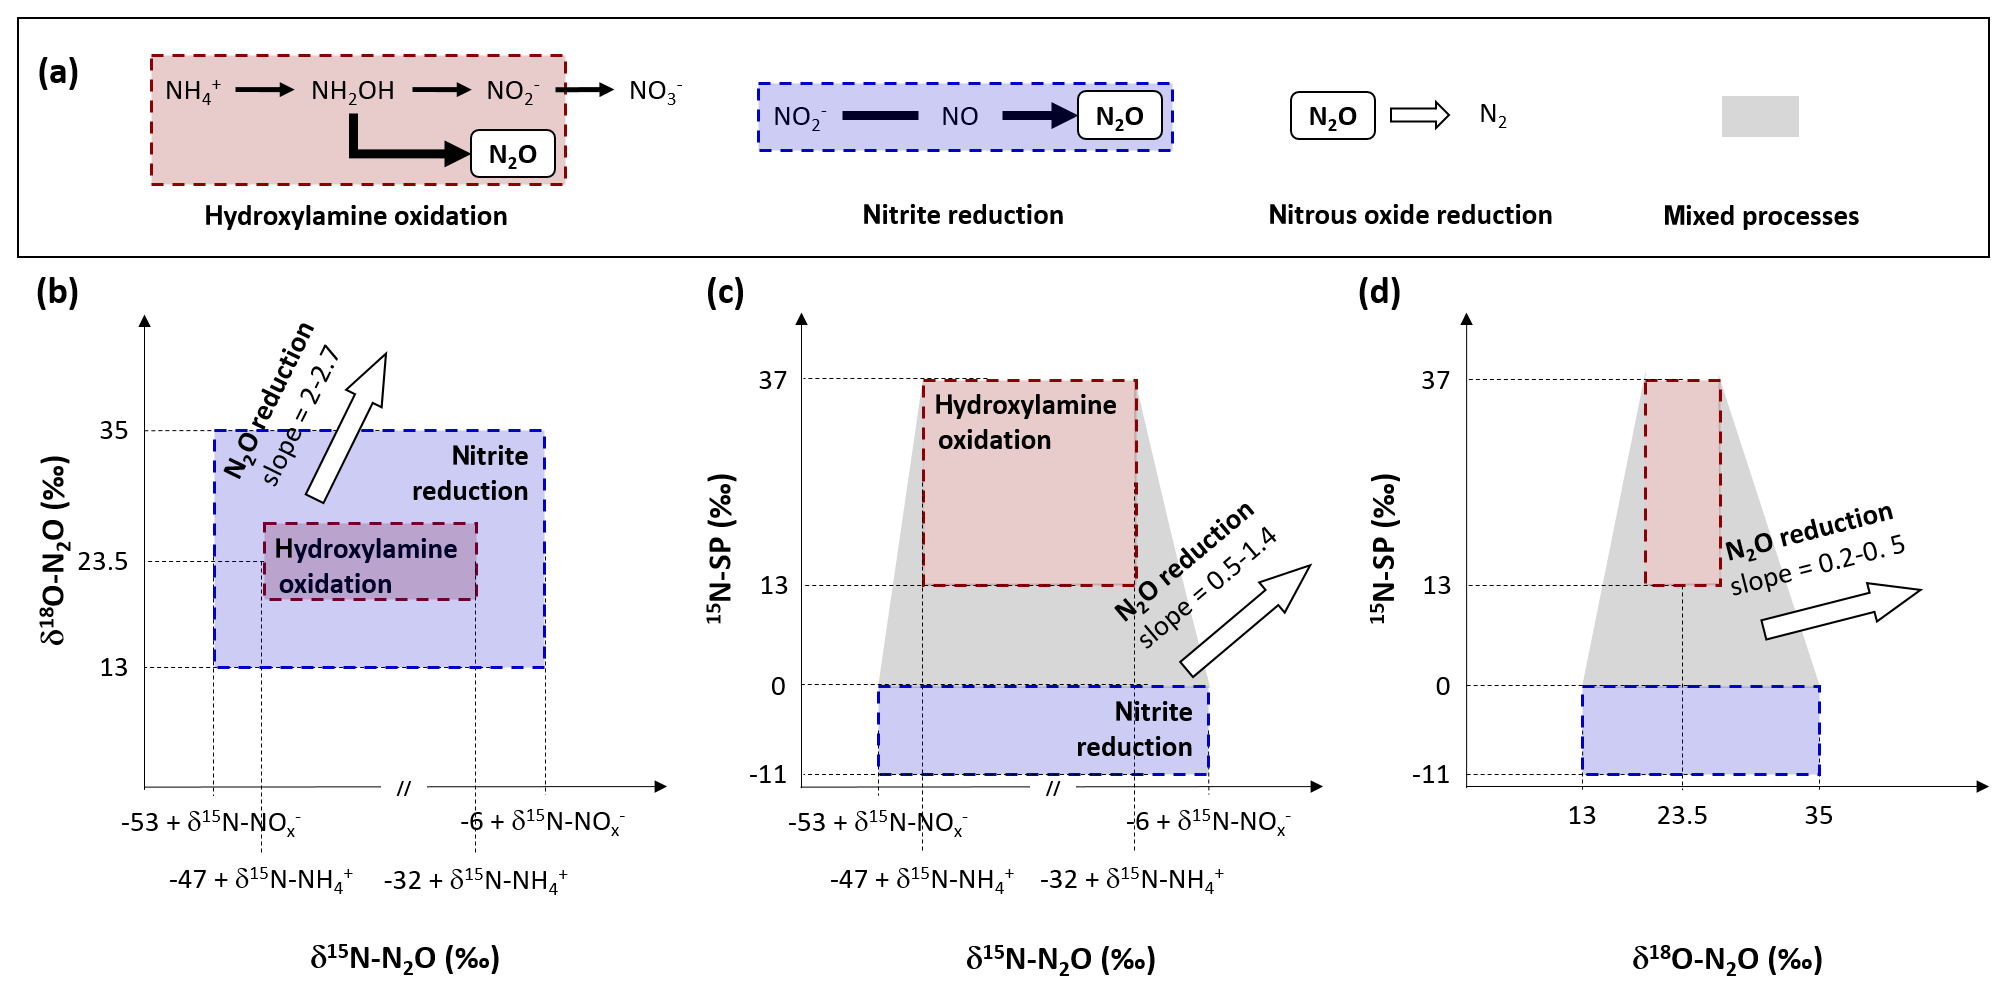
Figure 1N2O-producing and N2O-consuming pathways at play during nitrification and heterotrophic denitrification. Substrate isotope composition, isotope effects and 15N-SP values from the literature were used to propose the ranges of 15N (Lewicka-Szczebak et al., 2014; Sutka et al., 2006, 2008; Yamazaki et al., 2014), 18O (Andersson and Hooper, 1983; Hollocher et al., 1981; Kool et al., 2007; Kroopnick and Craig, 1972; Snider et al., 2012) and 15N-SP (Frame and Casciotti, 2010; Jung et al., 2014; Sutka et al., 2006; Yamazaki et al., 2014), as well the slopes relating them with each other during N2O reduction to N2 (Jinuntuya-Nortman et al., 2008; Webster and Hopkins, 1996; Yamagishi et al., 2007). The assumptions made and the calculations performed are detailed in the text.
Temperature, and electron donor and acceptor concentrations have been identified to control N2O emissions from WRRFs (Bollon et al., 2016; Kampschreur et al., 2009; Tumendelger et al., 2014, 2016; Wunderlin et al., 2012). These variables may induce N2O accumulation due to inhibition or disturbance of enzyme activity (Betlach and Tiedje, 1981; Kim et al., 2008; Otte et al., 1996). In addition to this, the different N2O-producing processes, nitrification, nitrifier denitrification or heterotrophic denitrification, are rarely observed independently from each other in heterogeneous environments like wastewater, natural waters, soils or sediments. However, the understanding of the influence that environmental conditions have on the balance between these processes and N2O-producing pathways remain to a large extent unexplored.
In order to decipher N2O-producing and N2O-consuming pathways, the analysis of N2O isotopocules, molecules that only differ in either the number or position of isotopic substitutions, has been applied (Koba et al., 2009; Sutka et al., 2006; Fig. 1b–d). The isotope composition of substrates and fractionation mechanisms influence both nitrogen and oxygen isotope ratios of N2O (reported as δ15N and δ18O, respectively; Fig. 1b). Basically, the oxygen atom in the N2O molecule produced by hydroxylamine oxidation originates from atmospheric dissolved oxygen with a δ18O value of 23.5 ‰ (Andersson and Hooper, 1983; Hollocher et al., 1981; Kroopnick and Craig, 1972), while the oxygen atom in N2O produced by nitrite reduction originates from nitrite that has undergone oxygen exchange with water (Kool et al., 2007; Snider et al., 2012). Nonetheless, δ18O-N2O resulting from the nitrite reduction conducted by the nitrifiers ranges from 13 ‰ to 35 ‰ (Snider et al., 2012). In contrast, the N2O produced by the heterotrophic denitrifiers through the nitrite reduction pathway has a δ18O value of over 35 ‰ (Snider et al., 2013). However, the oxygen exchange between the N2O precursors and water can decrease it to values below 35 ‰ (Snider et al., 2015). Therefore, δ18O alone does not enable differentiation between the N2O-producing pathways.
In combination with δ18O, δ15N-N2O allows us to identify the N2O-producing pathways (Fig. 1b). However, the isotope fractionations (or isotope effects) largely influence δ15N-N2O due to wide variations between and within the reactions involved in the nitrogen cycle (Denk et al., 2017). The isotopic fractionation results from the difference in equilibrium constant or reaction rate observed between the heavier and lighter isotopes in both abiotic and biotic processes. The net isotope effects (Δ) approximated from the difference between δ15N of product and substrate characterize the production of compounds resulting from sequential or branched reactions and have been recently reviewed (Denk et al., 2017; Toyoda et al., 2017). So far, only two estimates of the net isotope effect of N2O production by ammonium oxidation via hydroxylamine of −46.5 ‰ and −32.9 ‰ have been proposed (Sutka et al., 2006; Yamazaki et al., 2014). These values are imbricated between −52.8 ‰ and −6 ‰, the range of net isotope effects related to the N2O production through nitrite reduction performed by nitrifiers or heterotrophic denitrifiers (Lewicka-Szczebak et al., 2014; Sutka et al., 2008).
Similarly to isotope ratios, the nitrogen isotopomer site preference (15N-SP), the difference between the relative abundances of N2O molecules enriched in 15N at the central (Nα) position and terminal (Nβ) position differ according to N2O-producing pathway (Fig. 1c and d). During heterotrophic or nitrifier denitrification the 15N-SP of N2O produced from nitrate or nitrite ranges from −10.7 ‰ to 0.1 ‰, while ranging from 13.1 ‰ to 36.6 ‰ when N2O results from hydroxylamine oxidation (Frame and Casciotti, 2010; Jung et al., 2014; Sutka et al., 2006; Yamazaki et al., 2014). Finally, N2O reduction to N2 by heterotrophic denitrifiers increases the values of δ15N, δ18O and 15N-SP of residual N2O with specific pairwise ratios (Jinuntuya-Nortman et al., 2008; Webster and Hopkins, 1996; Yamagishi et al., 2007).
Nitrogen and oxygen isotope ratios of N2O have lower potential for N2O source identification as compared to 15N-SP. However, we believe that the use of both isotope approaches should strengthen the conclusions from 15N-SP and reveal additional isotope effects (Fig. 1).
The aim of the current study is to improve our understanding regarding the effects of key environmental variables (oxygenation, temperature, concentrations) on N2O production and emission rates. More specifically using nitrogen and oxygen isotope ratios as well as 15N-SP of N2O should allow for deciphering the different producing and consuming pathways under these different conditions. In order to achieve this, the nitrifying biomass of a submerged fixed-bed biofilm reactor was investigated. Among wastewater treatment systems, the biofilm systems are adapted to large urban areas owing to their compactness, flexibility and reliability. An increase in their development is expected in response to the additional 2.5 billion humans predicted in urban areas by 2050 (United Nations, 2019). However, biofilm systems have received much less attention than suspended biomass systems, and the relations between the N2O-producing and N2O-consuming pathways and controls remain largely unknown (Sabba et al., 2018; Todt and Dörsch, 2016). Although applied here to the nitrifying biomass of a WRRF, the research questions addressed consider a diversity of environments including natural waters, soils and sediments: (i) does the nitrifying biomass emit N2O and what are the producing pathways at play? (ii) Do oxygenation, temperature and concentration alter N2O emissions, and what are the involved processes? We hypothesize that the isotope signature of N2O allows identification of the N2O origins and the assessment of the pathway contribution to N2O emissions. The results of this study should improve the mechanistic understanding as well as improved prediction of N2O emissions from WRRFs, currently suffering from high uncertainty.
2.1 Experimental setup for nitrifying experiments
Experiments were carried out with colonized polystyrene beads (diameter 4 mm) sampled from the nitrification biologically active filters (BAFs) of a domestic WRRF (Seine Centre, France). In this WRRF, wastewater (240 000 m3 d−1) passes through a pre-treatment stage, followed by physicochemical decantation and tertiary biological treatment. The latter is composed of three biofiltration processes: (i) carbon elimination (24 Biofor®), (ii) nitrification (29 Biostyr®) and (iii) denitrification (12 Biofor®). Nitrifying Biostyrs® are submerged fixed-bed biofilm reactors with a unitary section of 111 m2 and a filter bed of 3 m high. This unit is operated to receive a nominal load of 0.7 kg -N m−3 d−1.
A lab-scale reactor with a working volume of 9.9 L (colonized Biostyrene® beads and interstitial volume) and a headspace of 1.4 L was operated in continuous down-flow counter-current mode for 7 weeks (i.e., solution was down-flowing, while air was up-flowing; Fig. S1 in the Supplement). Mass flow meters (F-201CV, Bronkhorst, France) sustained the inflow gas rate at 0.5 L min−1. A peristaltic pump (R3425H12B, Sirem, France) pumped feeding solution from a feeding tank into the reactor at 0.2 L min−1, in order to maintain a hydraulic retention time (HRT) of 27.8±0.6 min. A water jacket monitored by a cryogenic regulator (WK 500, Lauda, Germany) controlled the reactor temperature. The feeding solution consisted of ammonium chloride (NH4Cl) as substrate, monobasic potassium phosphate (KH2PO4) as phosphorus source for bacterial growth, and sodium hydrogen carbonate (NaHCO3) as pH buffer and inorganic carbon source in 100 or 150 L of tap water (average 0.2±0.4, 2.4±1.1, and 2.5±1.3 mg N L−1 of , and sum of both molecules, respectively).
The influence of environmental conditions on the ammonium oxidation rates and the N2O emissions from various combinations of oxygenation levels, temperatures and ammonium concentrations were tested in 24 experiments (Table 1). Note that two of them were used twice: as oxygenation tests and as concentration tests. The oxygenation tests were carried out by mixing compressed air and pure nitrogen gas to reach 0 % to 21 % O2 in the gas mixture (Fig. S2a). The tests were performed at five substrate concentrations and at a temperature between 19.2 and 20.6 ∘C. The temperature tests were carried out by cooling the feeding solution directly in the feeding tank (22.3 to 13.5 ∘C), with an inflow ammonium concentration close to the nominal load that received the nitrifying biomass, i.e., 20.3–21.1 mg -N L−1. The ammonium concentration tests were run at an increase (6.2, 28.6 and 62.1 mg -N L1) and a decrease (56.1, 42.9, 42.7 and 20.2 mg -N L−1) of concentrations in the feeding solution, at temperatures ranging from 19.0 to 19.8 ∘C. The atmospheric oxygenation level (i.e., 21 % O2 in the gas mixture) was imposed for both tests (Fig. S2b and c). This gas mixture using compressed air with 21 % O2 was considered hereafter as optimal as compared to the oxygen-depleted atmosphere used during the oxygenation tests. Noticeably, the atmospheric oxygenation level is the condition that represents the most optimal conditions of oxygenation applied in nitrification BAFs of domestic WRRF.
Table 1Detailed average conditions (± standard deviation) of oxygenation, temperature and concentration tests.
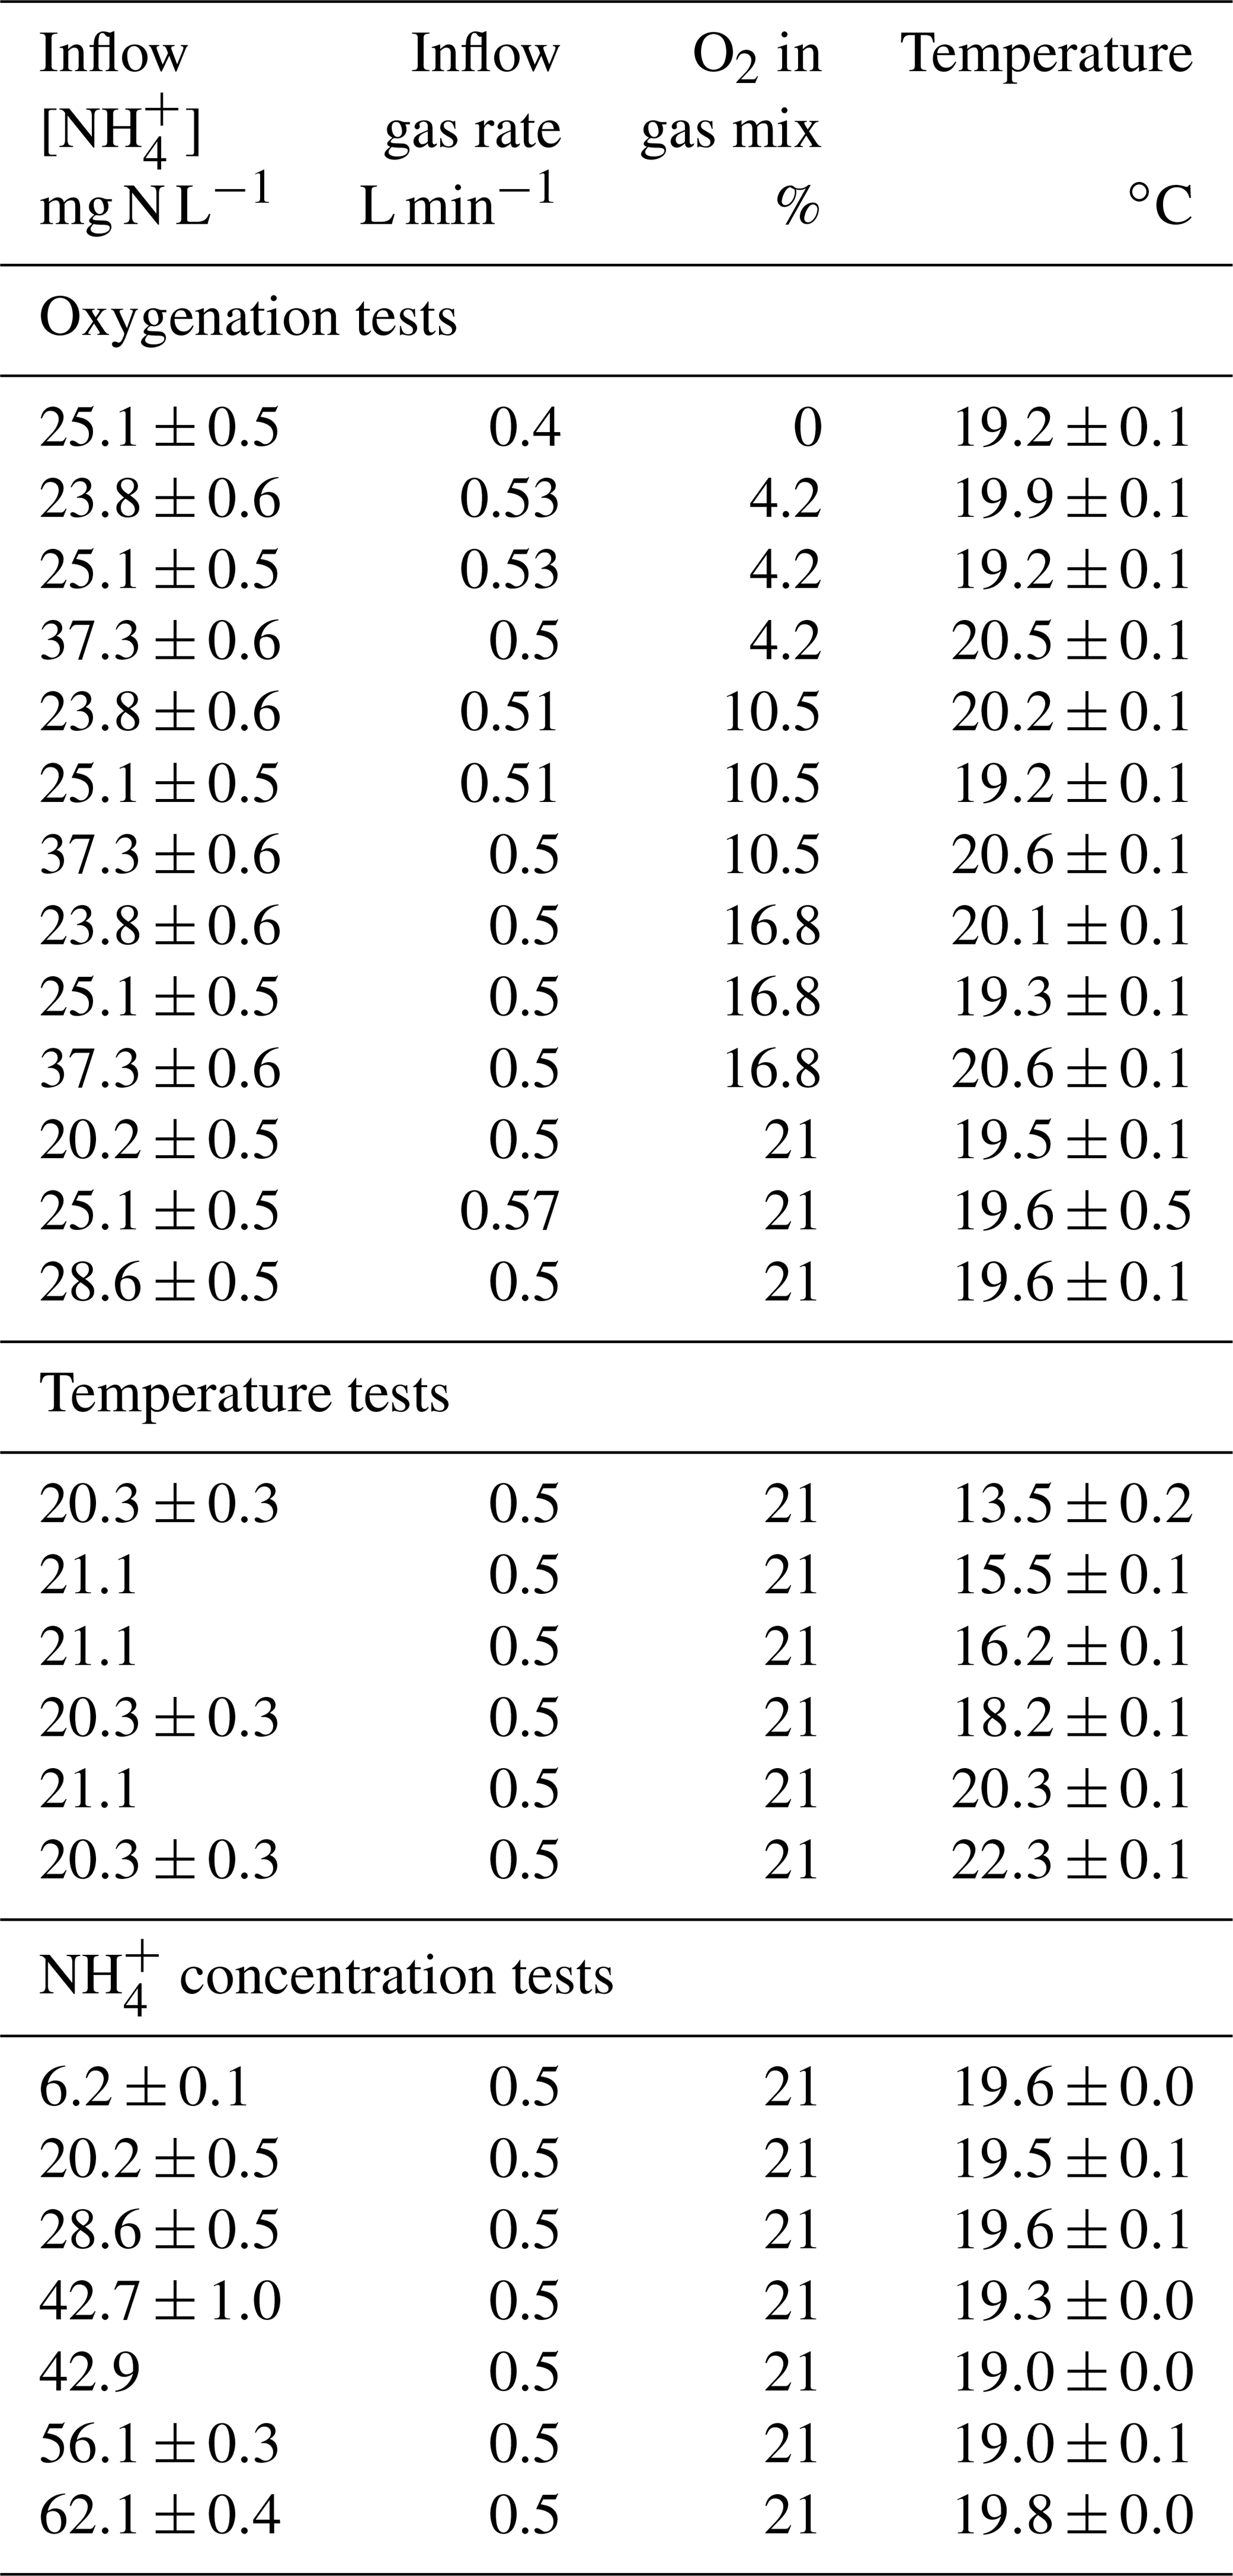
Note that two experiments tested both oxygenation and ammonium concentration.
2.2 Reactor monitoring, sampling and concentrations analysis
Dissolved oxygen, temperature (Visiferm DO Arc 120, Hamilton, Switzerland) and pH (H8481 HD, SI Analytics, France) were continuously measured at the top of the reactor and data were recorded at 10 s intervals. The N2O concentration was continuously analyzed by an infrared photometer (Rosemount™ X-STREAM X2GP, Emerson, Germany) in outflow reactor gas after drying through a condenser and a hydrophobic gas filter (0.2 µm). Minute averages are used for monitored data hereafter. Gas samples were taken for N2O isotopic signature determination by an outlet gas pipe derivation into a sealed glass vial of 20 mL. The vial was first flushed with the sampling gas for >45 s prior to 1–5 min sampling. Gas samples were then stored in the dark at room temperature until analysis. Note that gas sampling was lacking for 5 of the 13 oxygenation tests.
The feeding solutions were characterized of one to five replicate samples collected in the feeding tank. For each tested condition, the outflow was characterized within 5 d of 1 to 14 replicate samples immediately filtered through a 0.2 µm syringe filter and stored at 4 ∘C. Outflow sampling started after at least one hydraulic retention time (28±1 min). Ammonium was analyzed using the Nessler colorimetric method, according to AFNOR NF T90-015 (DR 2800, Hach, Germany). Nitrite and nitrate were measured by ionic chromatography (IC25, Dionex, USA).
2.3 Stable isotope measurements
Atmospheric N2 and Vienna Standard Mean Ocean Water (VSMOW) are the references used for the nitrogen and oxygen isotopes ratios, respectively, expressed in conventional δ notation, in per mil (‰). Nitrogen and oxygen isotope ratios of nitrate and nitrite were determined separately following a modified protocol of McIlvin and Altabet (McIlvin and Altabet, 2005; Semaoune et al., 2012). Nitrogen isotope ratios of ammonium were determined following the protocol of Zhang et al. (2007). These methods consist in the conversion of the substrate (ammonium or nitrite or nitrate) into dissolved N2O. δ15N and δ18O for ammonium, nitrite and nitrate were hence determined from a calibration curve created with a combination of nitrate or ammonium standards that underwent the same chemical conversion as the samples (USGS-32, δ15N- = 180 ‰, δ18O- = 25.7 ‰; USGS-34, δ15N- = −1.8 ‰, δ18O- = −27.9 ‰ and USGS-35 δ15N- = 2.7 ‰, δ18O- = 57.5 ‰; IAEA-N1, δ15N- = 0.4 ‰, IAEA-305A, δ15N- = 39.8 ‰, USGS-25, δ15N- = −30.4 ‰). The quality of calibration was controlled with additional international standards (IAEA-NO-3, δ15N- = 4.7 ‰, δ18O- = 25.6 ‰; IAEA-N2, δ15N- = 20.3 ‰). Basically, an analytical sequence was comprised of triplicate standards for calibration, and quality controls and duplicate samples. The average of the analytical replicates was then used for calibration, for quality control and as a result.
Since no international standards were available for N2O isotopes, these were determined the same day as nitrate or ammonium standard analysis ensuring correct functioning of the method and analysis. In addition to this, the internal N2O standards were previously calibrated by exchange with the laboratory of Naohiro Yoshida and Sakae Toyoda at the Tokyo Institute of Technology. All isotope measurements were determined using an isotope ratio mass spectrometer (IRMS, DeltaVplus; Thermo Scientific) in continuous flow with a purge and trap system coupled with a Finnigan GasBench II system (Thermo Scientific). The precision was 0.8 ‰, 1.5 ‰ and 2.5 ‰ for δ15N, δ18O and 15N-SP, respectively.
2.4 Data processing and statistics
The effects of environmental conditions on nitrification were assessed from four indices. The ammonium oxidation rate (AOR) was estimated in each experiment for time ≥1 HRT from the difference between influent and effluent concentrations multiplied by the liquid flow rate (kg -N d−1). The nitrification efficiency was defined as the ratio between AOR and influent ammonium load. The N2O emission rate (N2O-ER) was calculated by multiplying the measured N2O concentration by the gas flow rate (mg N2O-N min−1). The N2O emission factor (N2O-EF) was defined as the ratio between N2O-ER and AOR (% of oxidized -N). The measurements related to liquid or gas samples were averaged by experiment, i.e., the average of data obtained from the samples collected after one hydraulic retention time.
Statistical analysis were performed using the R software (R Development Core Team, 2014). The value of 0.05 was used as significance level for Spearman correlations (cor.test function) and linear regressions (lm function). Adjusted r2 was provided as r2 for the latter.
2.5 Estimation of ranges of nitrogen isotope ratio in biologically produced N2O
As shown in Fig. 1, the pairwise relationships between δ15N, δ18O and 15N-SP assist the determination of the producing and consuming pathways at play. The N atoms that compose the N2O molecule originate from molecules when produced by hydroxylamine oxidation, while originating from the N atoms of or molecules when produced by nitrite reduction ( molecules). However, the nitrogen isotope ratio of N2O does not equal those of its substrates as it depends on isotope effects associated to each reaction step of N2O-producing process. The isotope effect of the reaction step can be determined from the isotope composition of substrates or products. Although performed on a few tests here, the obtained value can only be applied to a limited number of environmental conditions. The use of estimates from the literature seems therefore suitable.
Several equations enable us to approximate the isotope effect and its effect on the isotope ratios of substrate and product pools involved in a reaction. These equations vary according to the assumptions made on the system boundaries (Denk et al., 2017).
The nitrifying reactor used in this study can be described as an open system continuously supplied by an infinite substrate pool with constant isotopic composition (,in). A small amount of the infinite substrate pool is transformed into a product pool (,p) or a residual substrate pool (,res) when flowing through the system. The equations describing the input, output and processes considered here are presented in Fig. 2 after Fry (2006). Note that the definitions of f and Δ are inverse to the cited literature and that Δ1 and Δ4 are null because no fractionation alter the residual substrate exiting the reaction (Fry, 2006).
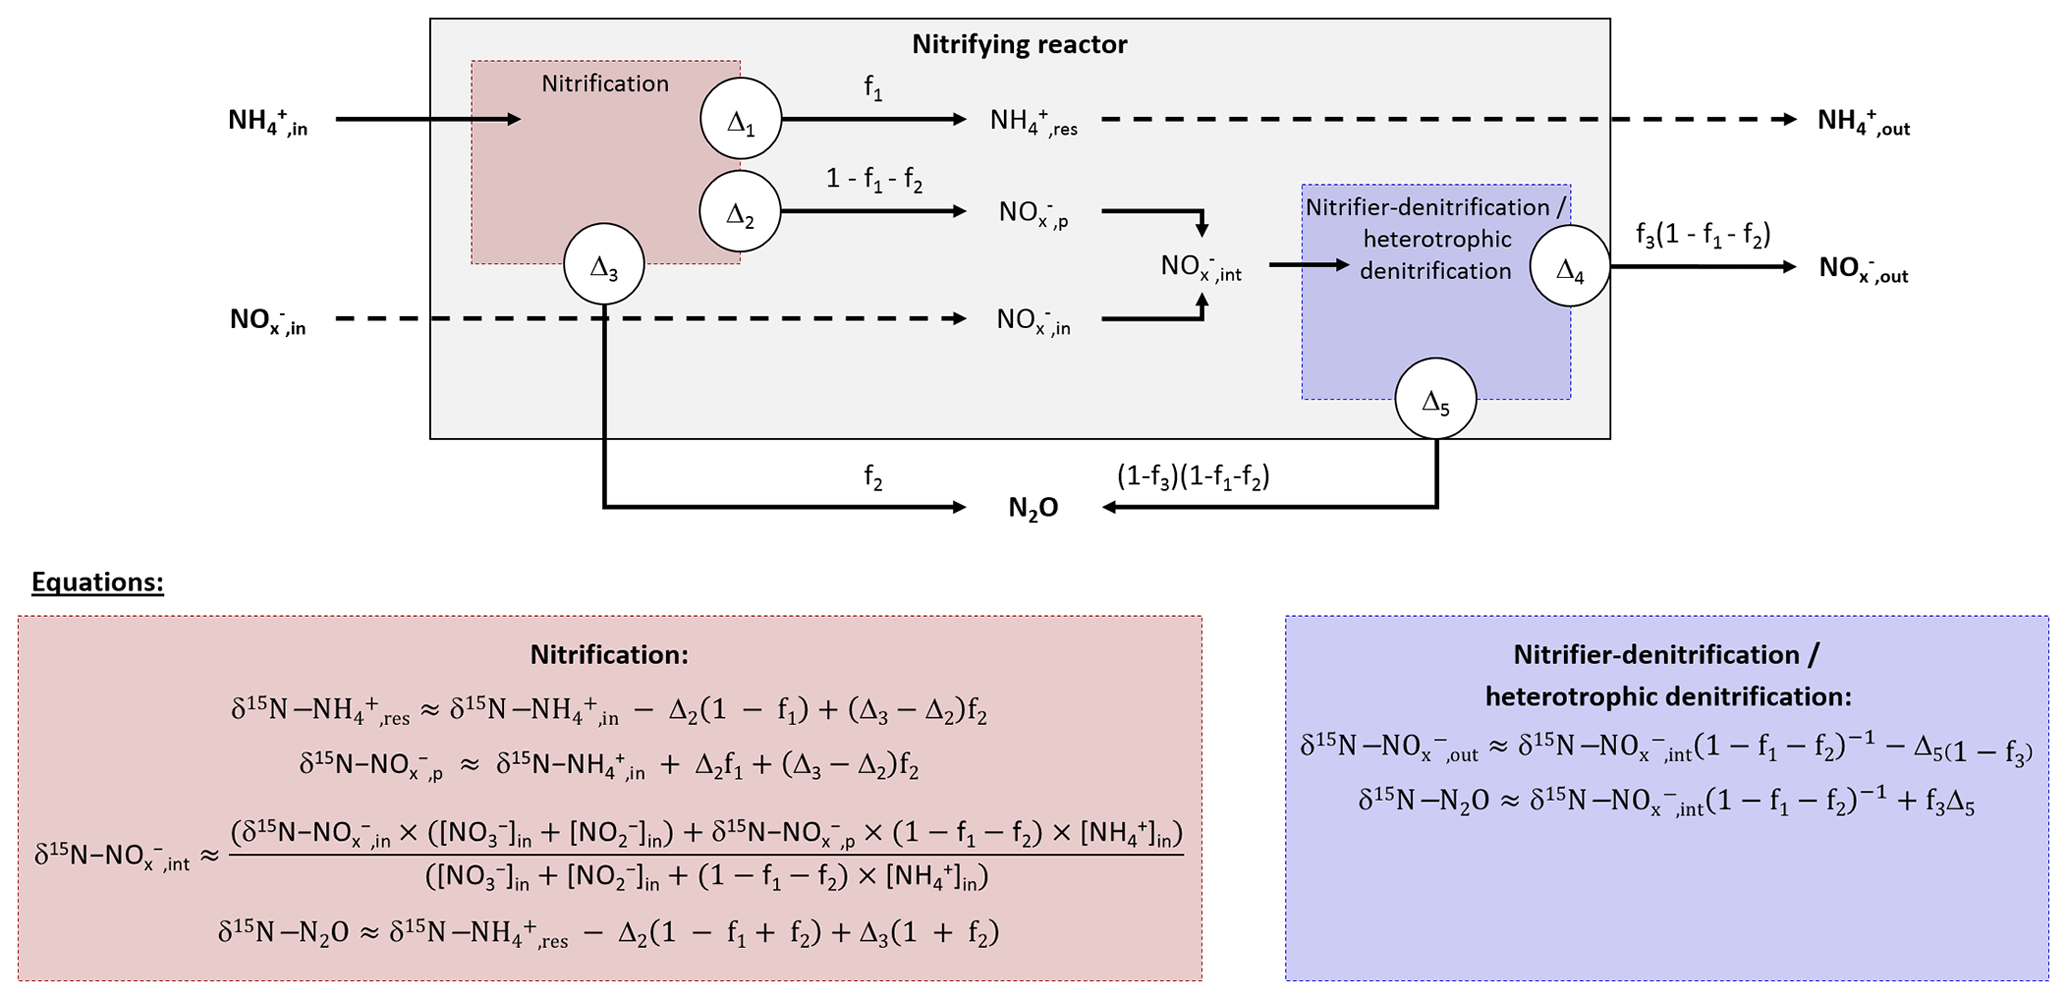
Figure 2Diagram and equations of the nitrifying reactor after Fry (2006). It is considered as a sequence of two reactor boxes. (i) The nitrification of inflow ammonium (,in) to a pool of nitrite and nitrate (,p), residual ammonium (,res) and nitrous oxide (N2O) through the hydroxylamine oxidation pathway. (ii) The subsequent reduction of intermediate ,int: mixing of inflow ,in and formed ,p to nitrous oxide (N2O) through the nitrite reduction pathway, and residual that exits the reactor (,out). Note that residual substrates and formed products exit the reactor without further isotope fractionation (Δ1 and Δ4 are null). See text for details.
The balance between input and output of each reactional step allows us to propose equations for calculation of the nitrogen isotope ratio of compounds in the inflow and outflow of the system (Denk et al., 2017; Fry, 2006). These equations can be simplified under the assumption that a limited amount of N compounds are transformed into N2O, i.e., f2 close to 0 and f3 close to 1. Therefore, the N isotope ratios of the residual substrate pool can be approximated from Eq. (1).
where f1 is the remaining substrate fraction leaving the reactor (i.e., remaining fraction of ammonium), ranging from 0 to 1 (0 % to 100 %), and Δ2 is the N isotope enrichment factor associated with ammonium oxidation. In their review, Denk et al. (2017) reported a mean value of ‰ for Δ2. Therefore, δ15N is higher for residual than the initial substrate pool (δ15N--,res). Consequently, the pool of product is depleted in heavier isotope (i.e., nitrite and nitrate hereafter defined as pool; δ15N--,int). It is estimated from Eqs. (2)–(4):
Where δ15N-,p is the nitrogen isotope ratio of the product pool produced by nitrification. The nitrogen isotope ratio of the overall intermediate exiting this process results from mixing between initial and produced pools (δ15N-,int) and can be estimated from Eqs. (3) and (4):
Note that δ15N-,out equals δ15N-,int when f3 is close to 1, which means that nitrifier denitrification and heterotrophic denitrification are negligible. Finally, two options must be considered to approximate the nitrogen isotope ratio of N2O that exits the reactor. On the one hand, δ15N-N2O can be estimated from Eq. (5), when hydroxylamine oxidation is the producing process of N2O:
In addition to the influence of the nitrogen isotope composition of the substrate, δ15N-N2O depends therefore on the difference between the isotope effects related to the oxidation of to and the oxidation of NH2OH to N2O for complete nitrification (f1=0), while depending only on the latter for limited nitrification (f1=1). On the other hand, δ15N-N2O can be estimated from Eq. (6), when the nitrite reduction is the producing process of N2O:
In addition to the influence of the nitrogen isotope composition of the substrate, when negligible amounts of N2O are produced by nitrite reduction during nitrifier denitrification or heterotrophic denitrification, its nitrogen isotope ratio depends on isotope effect related to this process (Δ5).
Changes in pH, ammonium, nitrite and nitrate concentrations confirmed nitrifying activity in the reactor system (Table S1 in the Supplement, Fig. S3). During the ammonium concentration tests, decreases in ammonium concentrations ([]), increases in nitrite and nitrate concentrations ([] and [], respectively) were observed, while pH remaining below 8 prevented any relevant loss of ammonium by volatilization. For example, [] decreased from 6.2 to 1.1, from 28.6 to 17 and from 62.1 to 49.1 mg N L−1 by flowing through the nitrifying biomass. At the same time, [] and [] increased from 0 to 0.2–0.3 mg N L−1 and from 1.4–1.8 to 5–10 mg N L−1, respectively. Over the range of tested conditions, the ratio between ammonium oxidation rate and influent ammonium load ranged from 10 % to 82 %, never exceeding 40 % for suboptimal nitrifying conditions imposed during oxygenation and temperature tests (i.e., oxygenation levels <21 % O2 and temperatures <20 ∘C). The ammonium concentration, oxygenation level and temperature affected the ammonium oxidation rates, as well N2O emission rates and factors.
3.1 Isotope composition ranges of N2O produced by hydroxylamine oxidation and nitrite reduction
Ranges of δ15N for N2O produced by different processes were hypothesized from Eqs. (1)–(5) for pairwise relationships with reviewed data of δ18O and 15N-SP. To this aim, measurements of isotope ratios of the different nitrogen species were required. The δ15N values of inflow ammonium, nitrite and nitrate were ‰ (n=3), ‰ (n=2) and 6.9±0.3 ‰ (n=3), respectively, during ammonium concentration experiments (Fig. S3 and Table S2). The δ15N of residual and intermediate were estimated from Eqs. (1)–(4) with f1=0.1 or 0.9 (Fig. S2d–f), ‰, the highest []in (62.1 mg N L−1) and the lowest []in (1.4 mg N L−1). They ranged from −3 ‰ to 27 ‰ and from −32 ‰ to 7 ‰, respectively, which encompasses a few isotope compositions measured in the outflow during ammonium concentration tests (Fig. S3 and Table S2).
Prior to pairwise comparisons with δ18O and 15N-SP, ranges of δ15N values for N2O produced by the hydroxylamine oxidation and nitrite reduction pathways were estimated from Eq. (5). The net isotope effect of N2O production by ammonium oxidation via hydroxylamine can be estimated by combining the isotope effects of ammonium oxidation and hydroxylamine oxidation to N2O. The net isotope effect associated with ammonium oxidation to nitrite ranges from −38.2 ‰ to −14.2 ‰ (Casciotti et al., 2003) and can approximate the nitrogen isotope ratio of hydroxylamine transitory produced. The isotope effect related to hydroxylamine oxidation to N2O ranging from −26.0 ‰ to 5.7 ‰ from data in Sutka et al. (2003, 2004, 2006); the net isotope effect of N2O production by ammonium oxidation via hydroxylamine (Δ3) can range from −64.2 ‰ () to −8.5 ‰ (). Considering the range of the nitrogen isotope ratio of residual ammonium, this method provided a broad range of δ15N values, from −65 ‰ (δ15N- ‰, ‰, f1=0.9 and ‰) to 46 ‰ (δ15N- ‰ , ‰, f1=0.1 and ‰), for N2O produced from ammonium by hydroxylamine oxidation, according to Eq. (5). These values encompassed the values proposed by others (−46.5 ‰ and −32.9 ‰; Sutka et al., 2006; Yamazaki et al., 2014).
A higher range of the net nitrogen isotope effect for nitrite reduction than hydroxylamine oxidation pathway was estimated for N2O production (Fig. 3a and b). Prior to being reduced to N2O through the nitrite reduction pathway, was mainly derived from ammonium oxidation in the nitrifying system (Eqs. 1–4); the resulting intermediate δ15N- ranges from −32 ‰ to 7 ‰. In addition to this, the net isotope effects related to the N2O production through nitrite reduction performed by nitrifiers or heterotrophic denitrifiers (Δ5) ranges from −52.8 ‰ to −6 ‰ (Lewicka-Szczebak et al., 2014; Sutka et al., 2008). Consequently, the δ15N of N2O produced by nitrite reduction ranged from −89 ‰ (δ15N- ‰, f1=0.1 and ‰) to 64 ‰ (δ15N- ‰, f1=0.9 and ‰) , according to Eq. (6). This is consistent with previous findings reporting δ15N-N2O between −112 ‰ and −48 ‰ for nitrifier denitrifying systems (Mandernack et al., 2009; Pérez et al., 2006; Yamazaki et al., 2014; Yoshida, 1988). However, a similar range of nitrite-derived δ15N-N2O is suggested for nitrifiers and heterotrophic denitrifiers, because ammonium oxidation influences both processes in the system used in this study where there is a low initial amount of and .
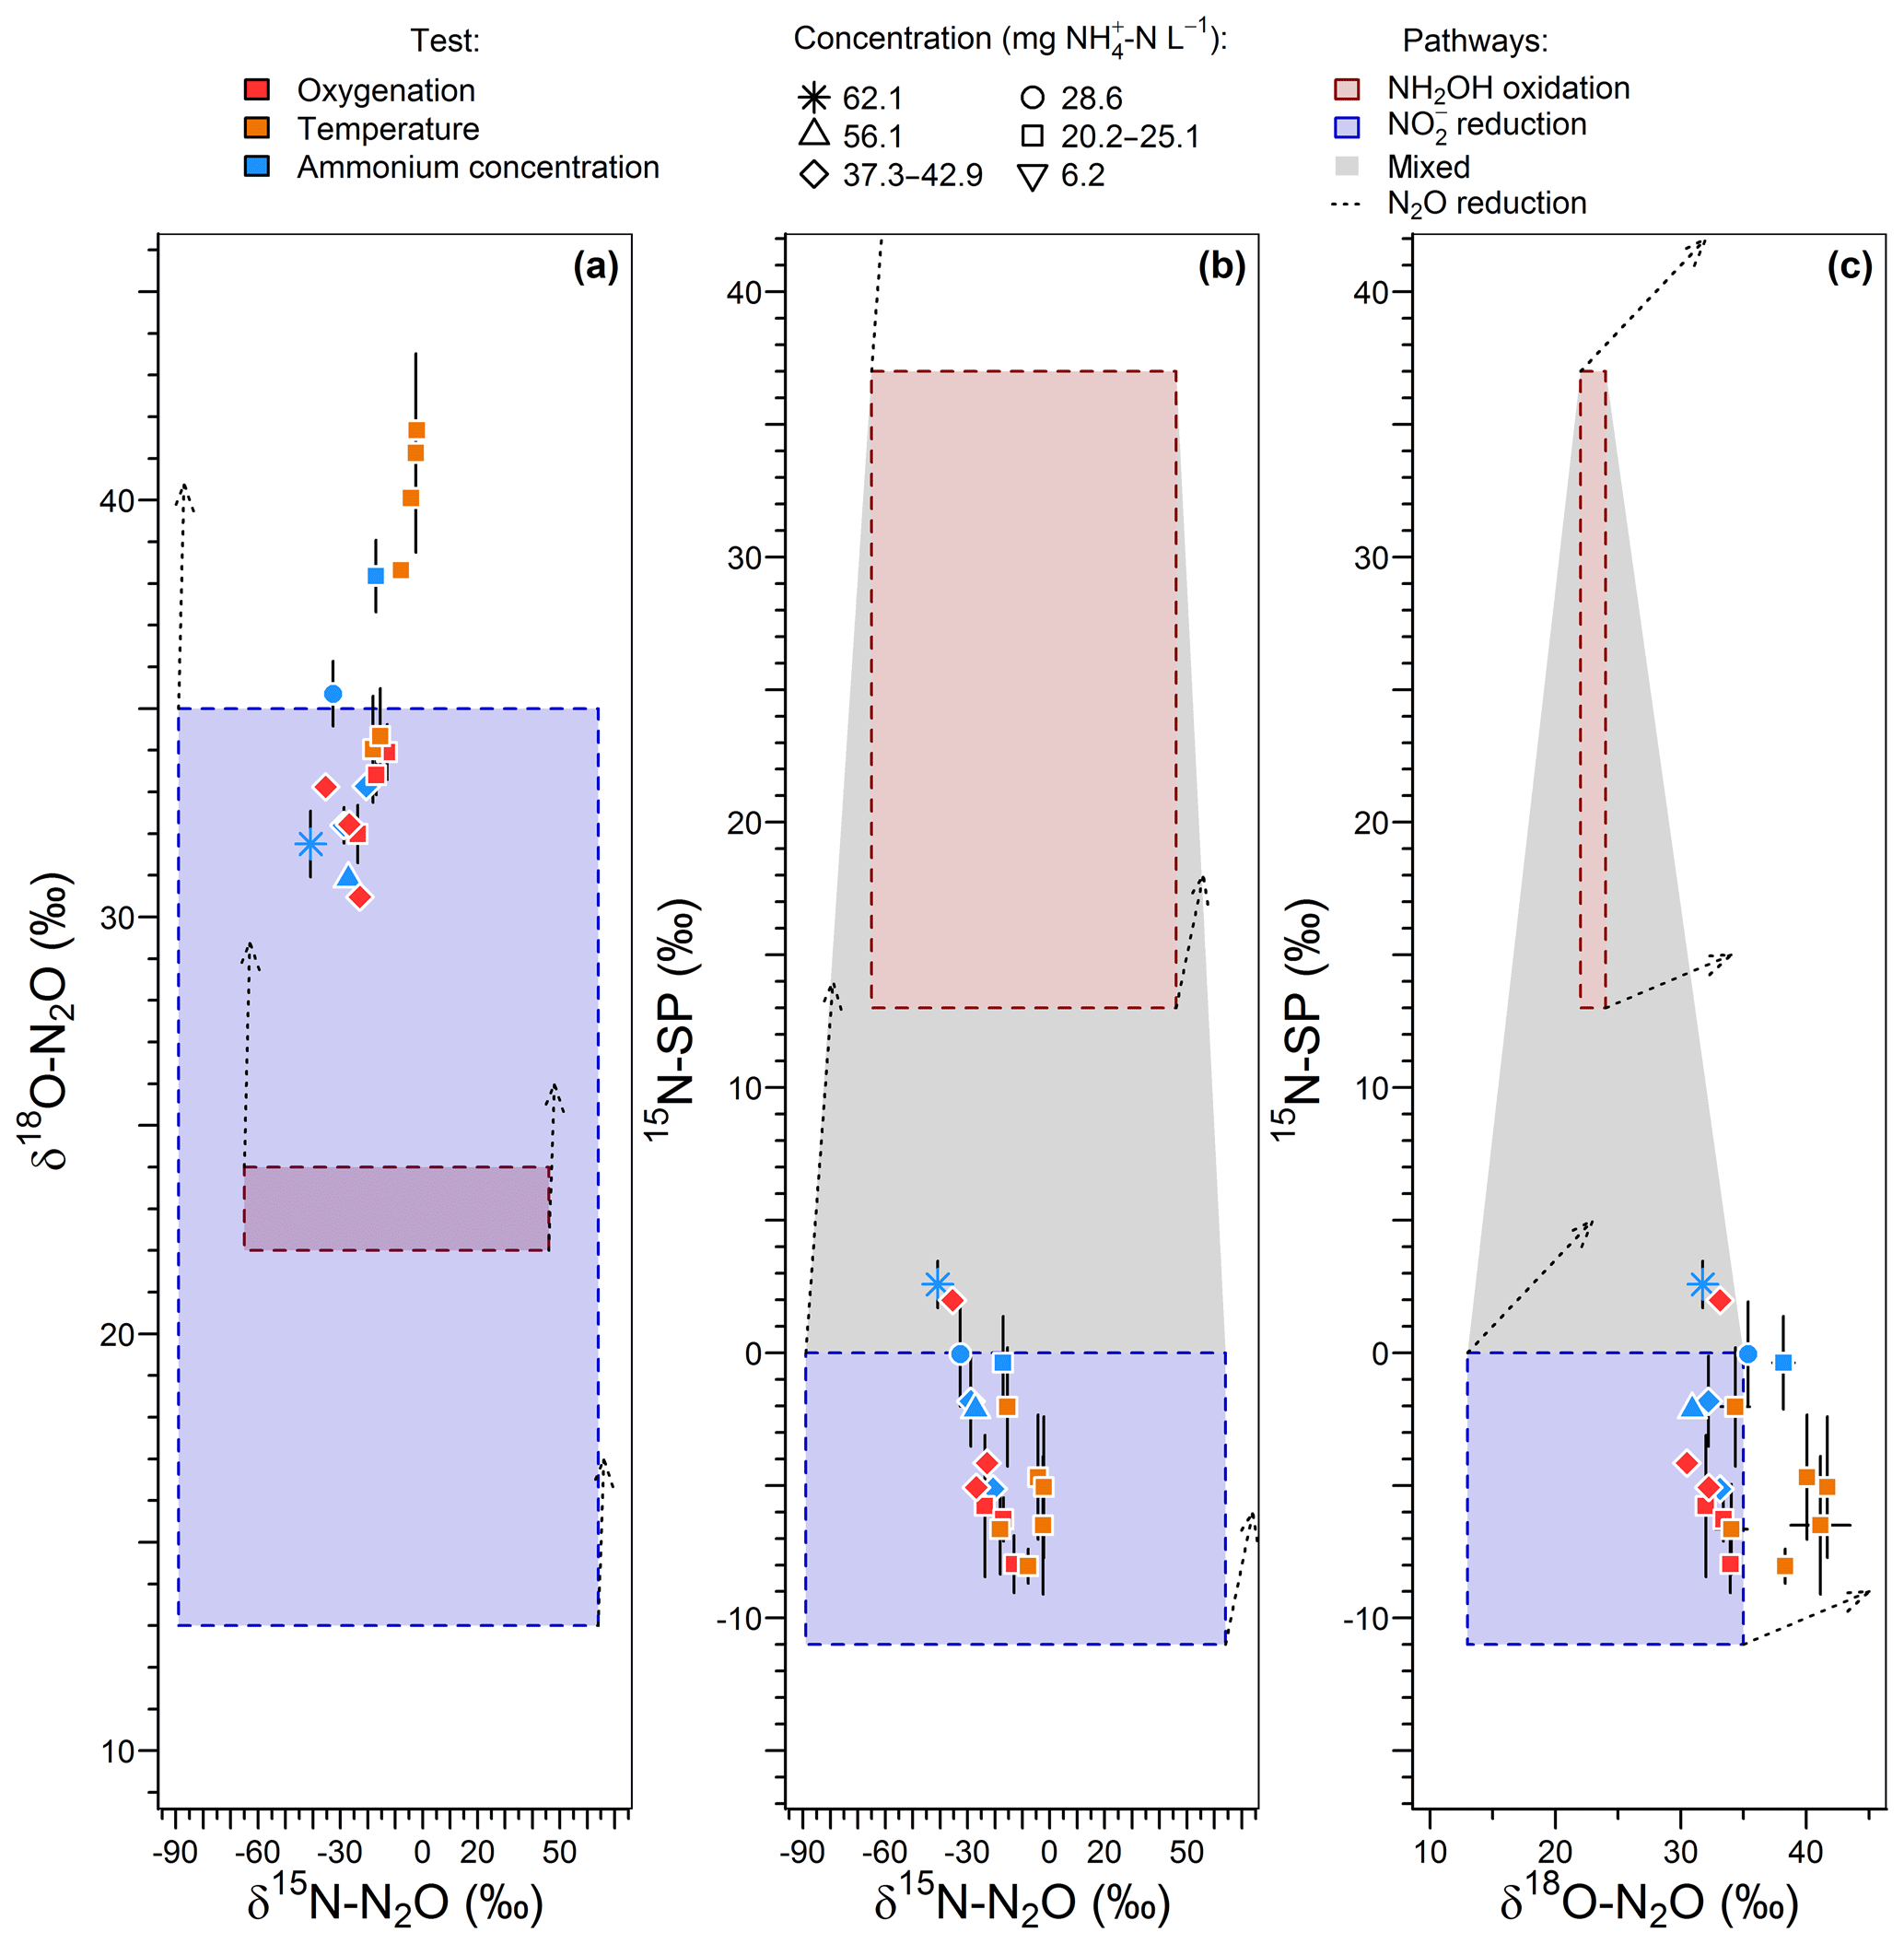
Figure 3Interpretation maps of the isotope signature of N2O. Schematic maps of (a) δ15N-δ18O, (b) δ15N-15N-SP and (c) δ18O-15N-SP. The red and blue squares show the range of the data for N2O produced by “hydroxylamine oxidation” and “nitrite reduction”, respectively. The shaded area represents mixing of N2O produced by these pathways. The N2O reduction increases δ15N, δ18O and 15N-SP with slopes characterizing the pairwise relationships.
Pairwise comparisons of δ15N, δ18O and 15N-SP estimates of the different experiments are presented in Fig. 3. These comparisons provided ranges of plausible isotope compositions for N2O produced by nitrifying or heterotrophic denitrifying bacteria through the hydroxylamine oxidation and nitrite reduction pathways (red and blue boxes, respectively). The measured N2O isotope compositions were compared to these estimates to identify the N2O-producing and N2O-consuming pathways likely at play in oxygenation, temperature and ammonium concentration tests.
This approach suggests that the nitrite reduction pathway was the main contributor to N2O emissions. Heterotrophic denitrification likely influenced N2O emissions, as shown by oxygen isotope ratios higher than 35 ‰ (Snider et al., 2013; Fig. 3a and c). However, this conclusion depends highly on δ18O-N2O ranges. Furthermore, the application of atmospheric oxygen δ18O (23.5 ‰; Kroopnick and Craig, 1972) to estimate the oxygen isotope ratio of N2O produced by hydroxylamine oxidation remains uncertain since respiratory activity and air stripping might drive isotopic fractionations and increase δ18O of residual dissolved oxygen (Nakayama et al., 2007). To date, the oxygen isotope fractionation related to air stripping has not been investigated. Note that this estimate relies on the assumption that there is no accumulation of NH2OH and that its oxidation to N2O occurs before or independently of its oxidation to .
3.2 The effect of oxygen limitation on the N2O-producing pathways
Ammonium concentrations decreased from 20.2–37.3 to 11.4–31.1 mg N L−1, with 45 % to 89 % of the inflow ammonium remaining in the outflow during the oxygenation tests (Fig. S2d). When measured, the cumulated concentrations of and ([]) increased from 2.4–4.1 to 4.7–11 mg N L−1 between inflow and outflow and were composed by at least 74 % and 82 % of , respectively. The mass balance between N compounds that enter and exit the reactor evidenced a default of up to 5 mg N and impacted each test. No significant amounts of NO were detected during any tests (data not shown), whereas NH2OH, N2 and N mineralization/assimilation in the biofilm were not quantified. The accumulation of such amounts of NH2OH is unlikely. Heterotrophic denitrification, i.e., the reduction of and more particularly of N2O to N2, may explain the incomplete N mass balance. However, the measurement of small N2 variations in the gas mixture exiting the reactor and comprising at least 79 % N2 was not performed.
The oxygenation level had contrasting effects on ammonium oxidation rates, and N2O emission rates and factors (Fig. 4a–c). Between an oxygenation of 0 % to 10.5 % O2 in the gas mixture, no clear trend in ammonium oxidation rates was observed although it was rather low (1.1±0.5 mg -N min−1). In the same oxygenation level interval, the N2O emission rate increased for two of three inflows [] tested. It increased from to mg N min−1 between 0 % and 10.5 % O2 at 25.3 mg -N L−1, and from to mg N min−1 between 4.2 % and 10.5 % O2 at 23.8 mg -N L−1; it decreased from to mg N min−1 between 4.2 % and 10.5 % O2 at 37.3 mg -N L−1. Finally, the N2O emission factor globally increased from 0.05 % to 0.16 % in the 0 %–10.5 % O2 interval. At oxygenation levels from 10.5 % to 21 % O2, the ammonium oxidation rates increased from 0.9±0.2 to 2.1±0.4 mg N min−1, with N2O emission rates remaining stable at mg N min−1 and the emission factors decreasing from 0.15±0.03 % to 0.06±0.03 %.
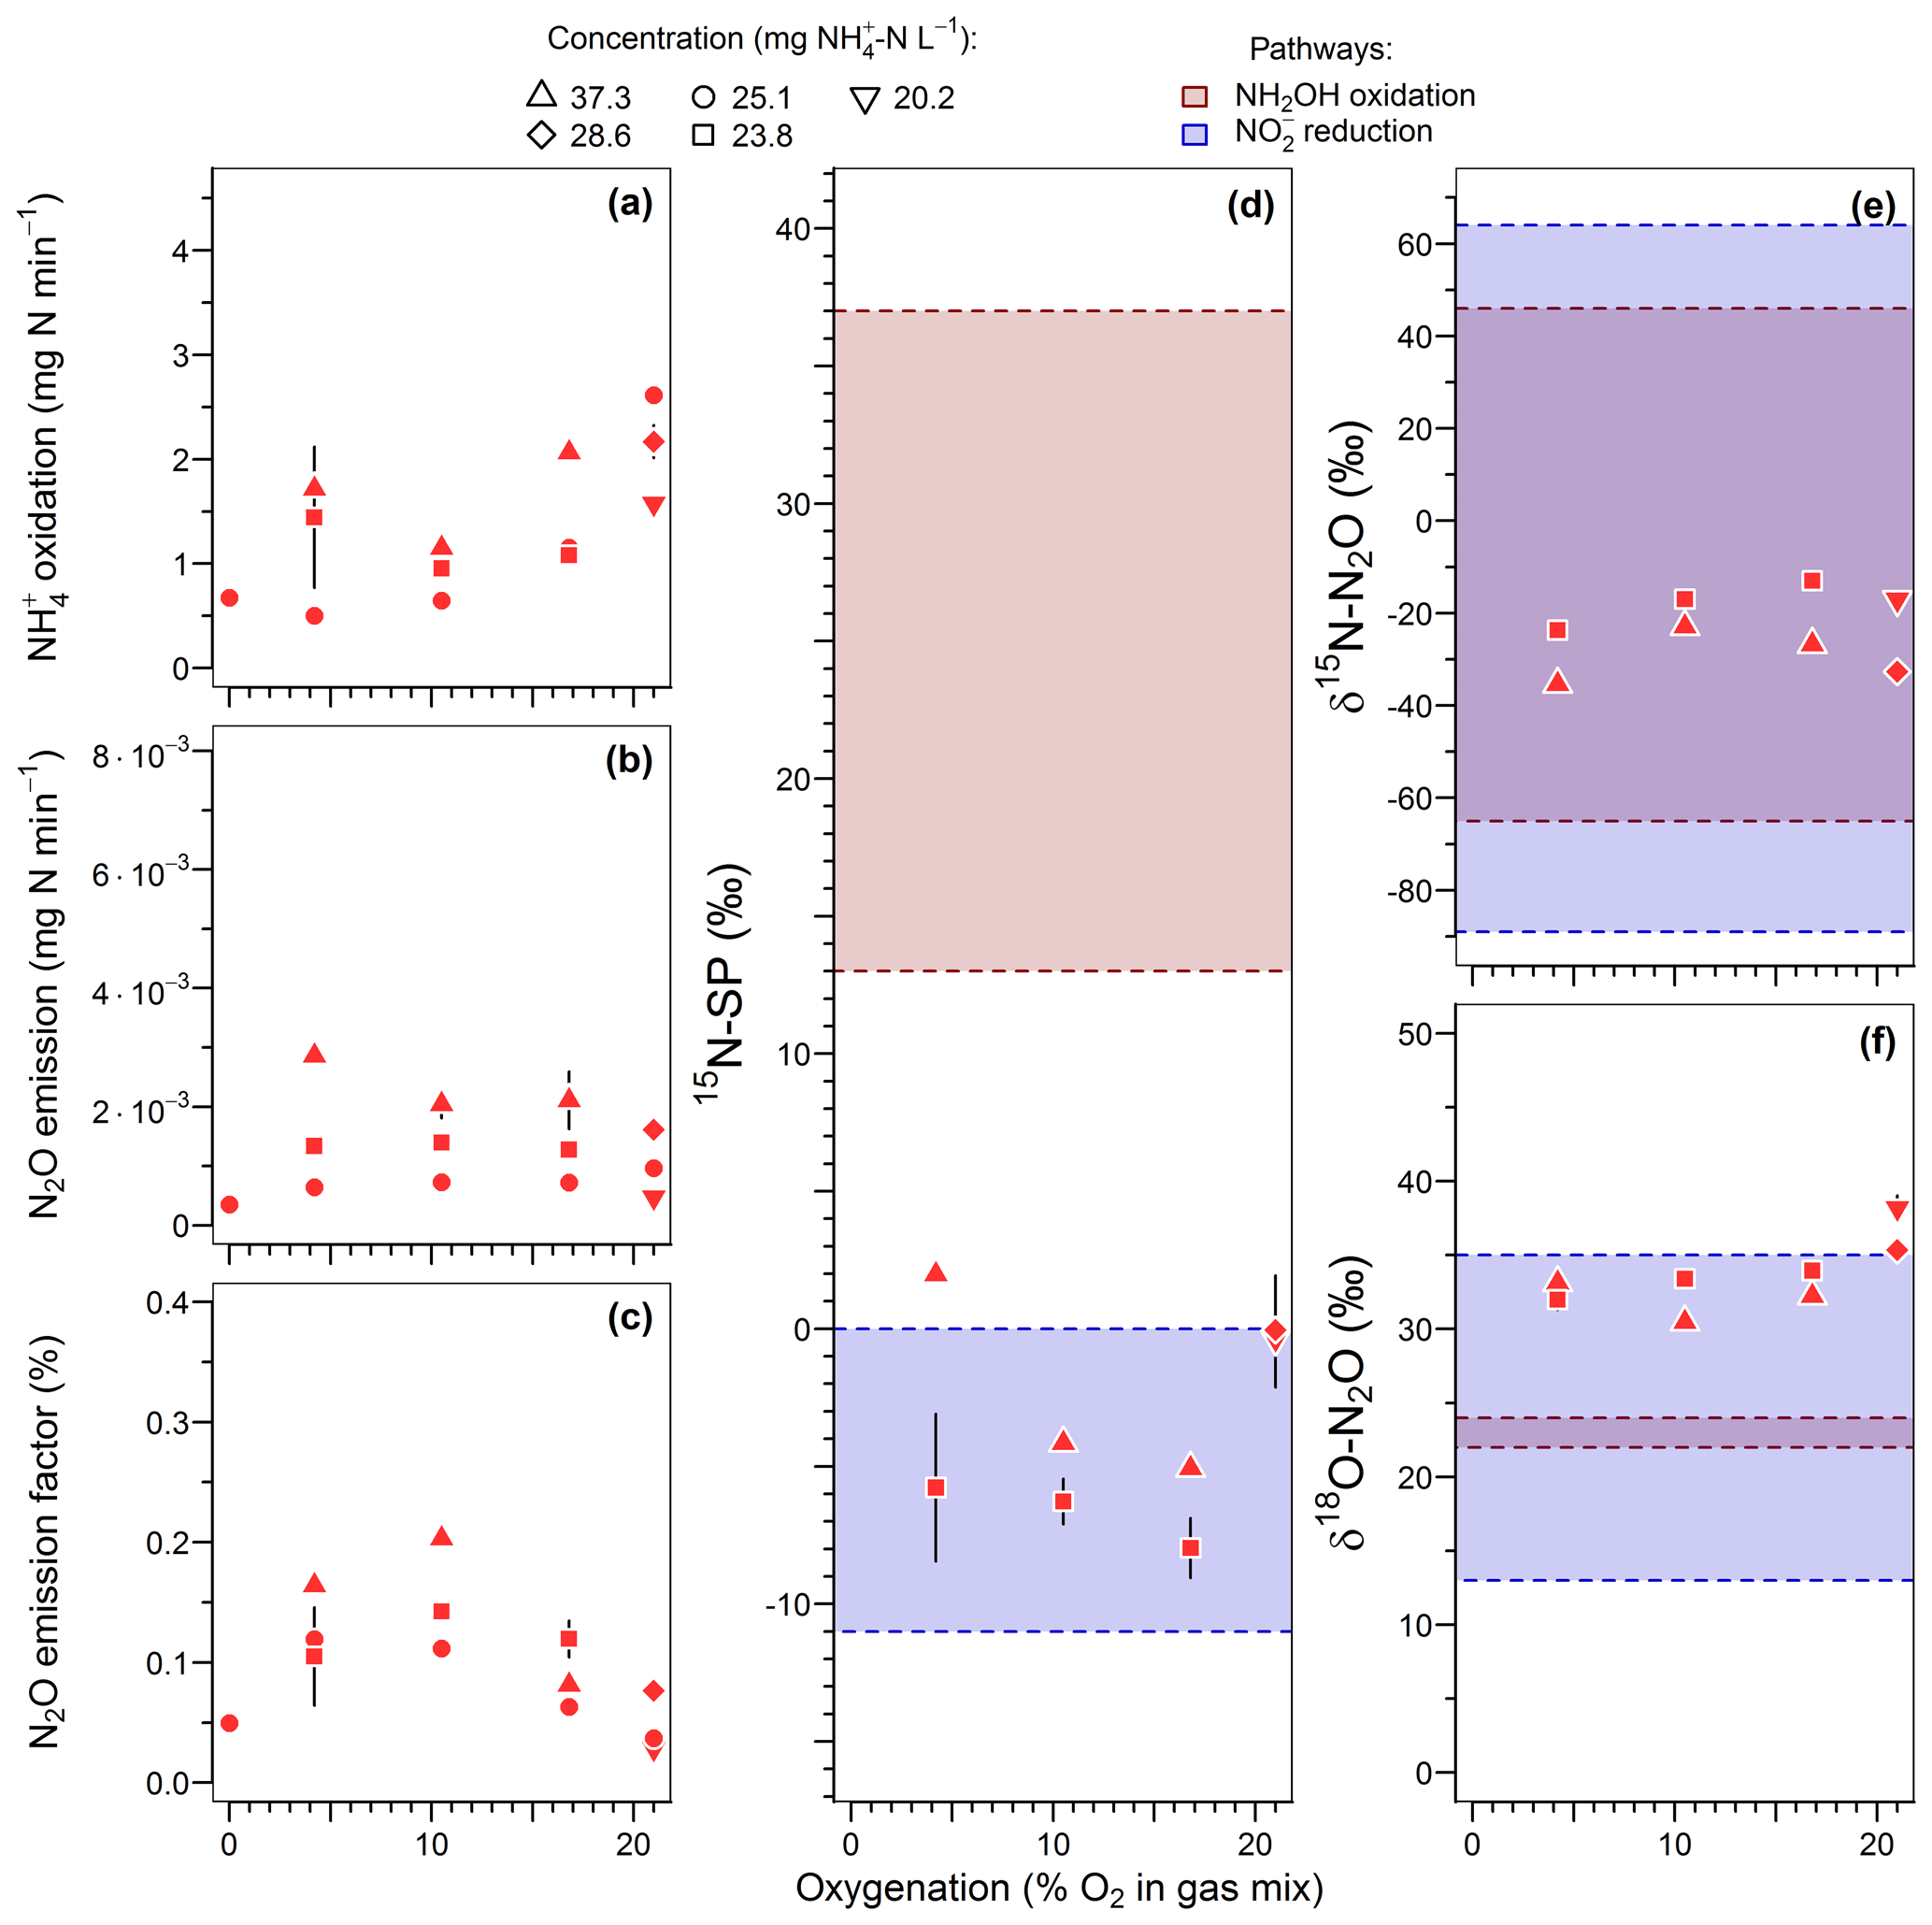
Figure 4Effect of oxygenation level on (a) the ammonium oxidation rate, (b) the nitrous oxide emission rate, (c) the N2O emission factor, and (d) the nitrogen isotopomer site preference, (e) the nitrogen isotope ratio and (f) the oxygen isotope ratio of N2O. Average and standard deviation (error bars) are calculated for steady-state conditions. Note that gas sampling for isotope analysis was lacking for 5 of the 13 oxygenation tests.
15N-SP varied between −9 ‰ to 2 ‰ over the range of imposed oxygenation levels, with a marked increase when oxygenation increased from 16.8 % to 21 % O2 (Fig. 4d). A similar marked change in nitrogen and oxygen isotope ratios of N2O (decrease and increase, respectively) was observed when oxygenation increased from 16.8 % to 21 % O2 (Fig. 4e and f). Note that to observe the latter variations the effect of ammonium concentration was not included. One way to do so is to compare the isotope composition average at 21 % O2 with the isotope composition measured for 23.8 -N L−1 at 16.8 % O2. The 15N-SP values were close to the range of −11 ‰ to 0 ‰ reported for N2O produced by nitrifying or denitrifying bacteria through nitrifier denitrification and heterotrophic denitrification (Toyoda et al., 2017; Yamazaki et al., 2014). Additional suggestions can be made from the 15N-SP dynamics between and variations within the oxygenation levels. If an increase in the hydroxylamine oxidation contribution to the N2O emission might explain the higher 15N-SP observed at 21 % O2 as compared to lower oxygenation levels, an additional mechanism can explain the variations observed for the experiments with oxygen-depleted atmosphere. The 15N-SP dynamics suggest a higher amount of N2O was reduced to N2 at 4.2 % than 16.8 % O2. The reduction of N2O to N2 can increase the 15N-SP of residual N2O (Mothet et al., 2013). In heterotrophic denitrifying bacteria however, the nitrous oxide reductase involved in this reaction is highly sensitive to inhibition by oxygen (Betlach and Tiedje, 1981; Otte et al., 1996). This might explain the decrease in 15N-SP from ‰ to ‰ when O2 increased from 4.2 % to 16.8 %. This is also consistent with a possible onset of anoxic microsites within the reactor biomass more likely at 4.2 % than 16.8 % O2. The dissolved oxygen (DO) concentration never decreased below 1.5 mg O2 L−1 in the bulk solution at the top of the reactor (Fig. S2). However, DO decreased from the bulk reactor solution toward the deeper layers of biofilm due to the activity of ammonium oxidizers (Sabba et al., 2018). This is further exacerbated by heterogeneous and varying distribution of air circulation within the static bed. Therefore, oxygen depletion can be assumed within the biofilm. Finally, the N2O reduction to N2 likely explains the overall decrease in N2O emission between 16.8 % and 0 % O2 (Fig. 4b).
In general the N2O reduction to N2 is accompanied by an increase in nitrogen and oxygen isotope ratios of N2O (Ostrom et al., 2007; Vieten et al., 2007). However, our results show a decrease in δ15N-N2O, and δ18O-N2O remained stable between 30.5 ‰ and 34.7 ‰, when the N2O reduction is thought to increasingly constraint the N2O isotopocules with decreasing O2 from 16.8 % to 4.2 % (Fig. 4e and f). The independence of samples taken during the oxygenation test can explain this. The N2O sampled at 4.2 % O2 is not a residual fraction of N2O produced at 16.8 % O2 that would have undergone a partial reduction. The oxygenation level can alter the isotope fractionation factors through the control of reaction rates, as evidenced for the reduction of N2O to N2 by Vieten et al. (2007). These authors reported lower reaction rates and increased isotope fractionation factors with increasing oxygenation levels. In our case, a similar phenomenon might have influenced both oxidative and reductive processes leading to the production of N2O and occurring before its ultimate reduction to N2. However, knowledge regarding controls, such as the oxygenation level, on the net isotope effect related to a sequence of non-exclusive oxidative and reductive processes is still lacking and requires further investigations. Additionally, with δ18O below 35 ‰ for all but one experiment the oxygenation tests did not provide evidence for the heterotrophic denitrifier contribution to N2O emissions, likely due to oxygen exchange with water (Snider et al., 2015, 2012, 2013).
3.3 Difference in temperature dependency of hydroxylamine and ammonium oxidizers as driver of hydroxylamine oxidation contribution to N2O emissions
Ammonium concentrations decreased from 6.2–62.1 to 0.9–54.1 mg N L−1 and from 18 % to 79 % of the inflow ammonium remaining in the outflow during the temperature and ammonium concentration tests (Fig. S2e and f). This remaining fraction was positively correlated to ammonium concentrations (r=0.96) and negatively correlated to temperature within a lower range of values (61 %–67 %; ). In the ammonium tests, the cumulated concentrations of and ([]) increased from 1.4–6.1 to 5.1–19.6 mg N L−1 between inflow and outflow and were composed by at least 74 % and 91 % of , respectively. Noticeably, the nitrite concentrations in the outflow linearly increased with temperature (r2=0.95; Fig. S2h).
An increase in temperature and inflow ammonium concentrations both positively influenced the rates of oxidation and N2O emissions and the emission factor (Fig. 5). The oxidation rate linearly increased from 1.3 to 1.5 mg -N min−1 with temperature (r=0.89; Fig. 5a) and increased from 0.97 to 3.49 mg -N min−1 with a 10-fold increase in the inflow ammonium concentration (r=0.82; Fig. 5b). These positive correlations are well known in the temperature range investigated here and are likely due to enhanced enzymatic activity and Michaelis–Menten kinetics, respectively (Groeneweg et al., 1994; Kim et al., 2008; Raimonet et al., 2017). Similarly, the N2O emission rates increased from to mg N2O-N min−1, and from to mg N2O-N min−1 upon changes in temperature and the ammonium concentrations, respectively. These results are in agreement with positive correlations between N2O emissions with temperature and ammonium concentration observed from modeling and experimental studies on partial nitrification and activated sludge systems (Guo and Vanrolleghem, 2014; Law et al., 2012a; Reino et al., 2017). Altogether this confirms a correlation between the N2O emission rates and the ammonium oxidation rates. Interestingly, the increase in the N2O emission factor indicates a stronger effect of temperature and ammonium concentration on the N2O emission rate than on oxidation. The N2O emission factor increased from 0.07 % to 0.16 %, and from 0.01 % to 0.29 % with temperature and inflow ammonium concentration, respectively (r>0.94; Fig. 5e and f). Both experiments suggest that the increase in N2O emissions results from the increasing production of N2O by hydroxylamine oxidation or nitrite reduction in combination with a slow rate or the absence of N2O reduction to N2. Furthermore, no nitrite accumulation was observed with increasing ammonium oxidation rate (Fig. S2i). Therefore, if N2O emission results mainly from the nitrite reduction pathway, this suggests that the nitrite reduction pathway is more responsive to the increasing ammonium oxidation rate than the nitrite oxidation pathway; the latter remains the main pathway of nitrite consumption.
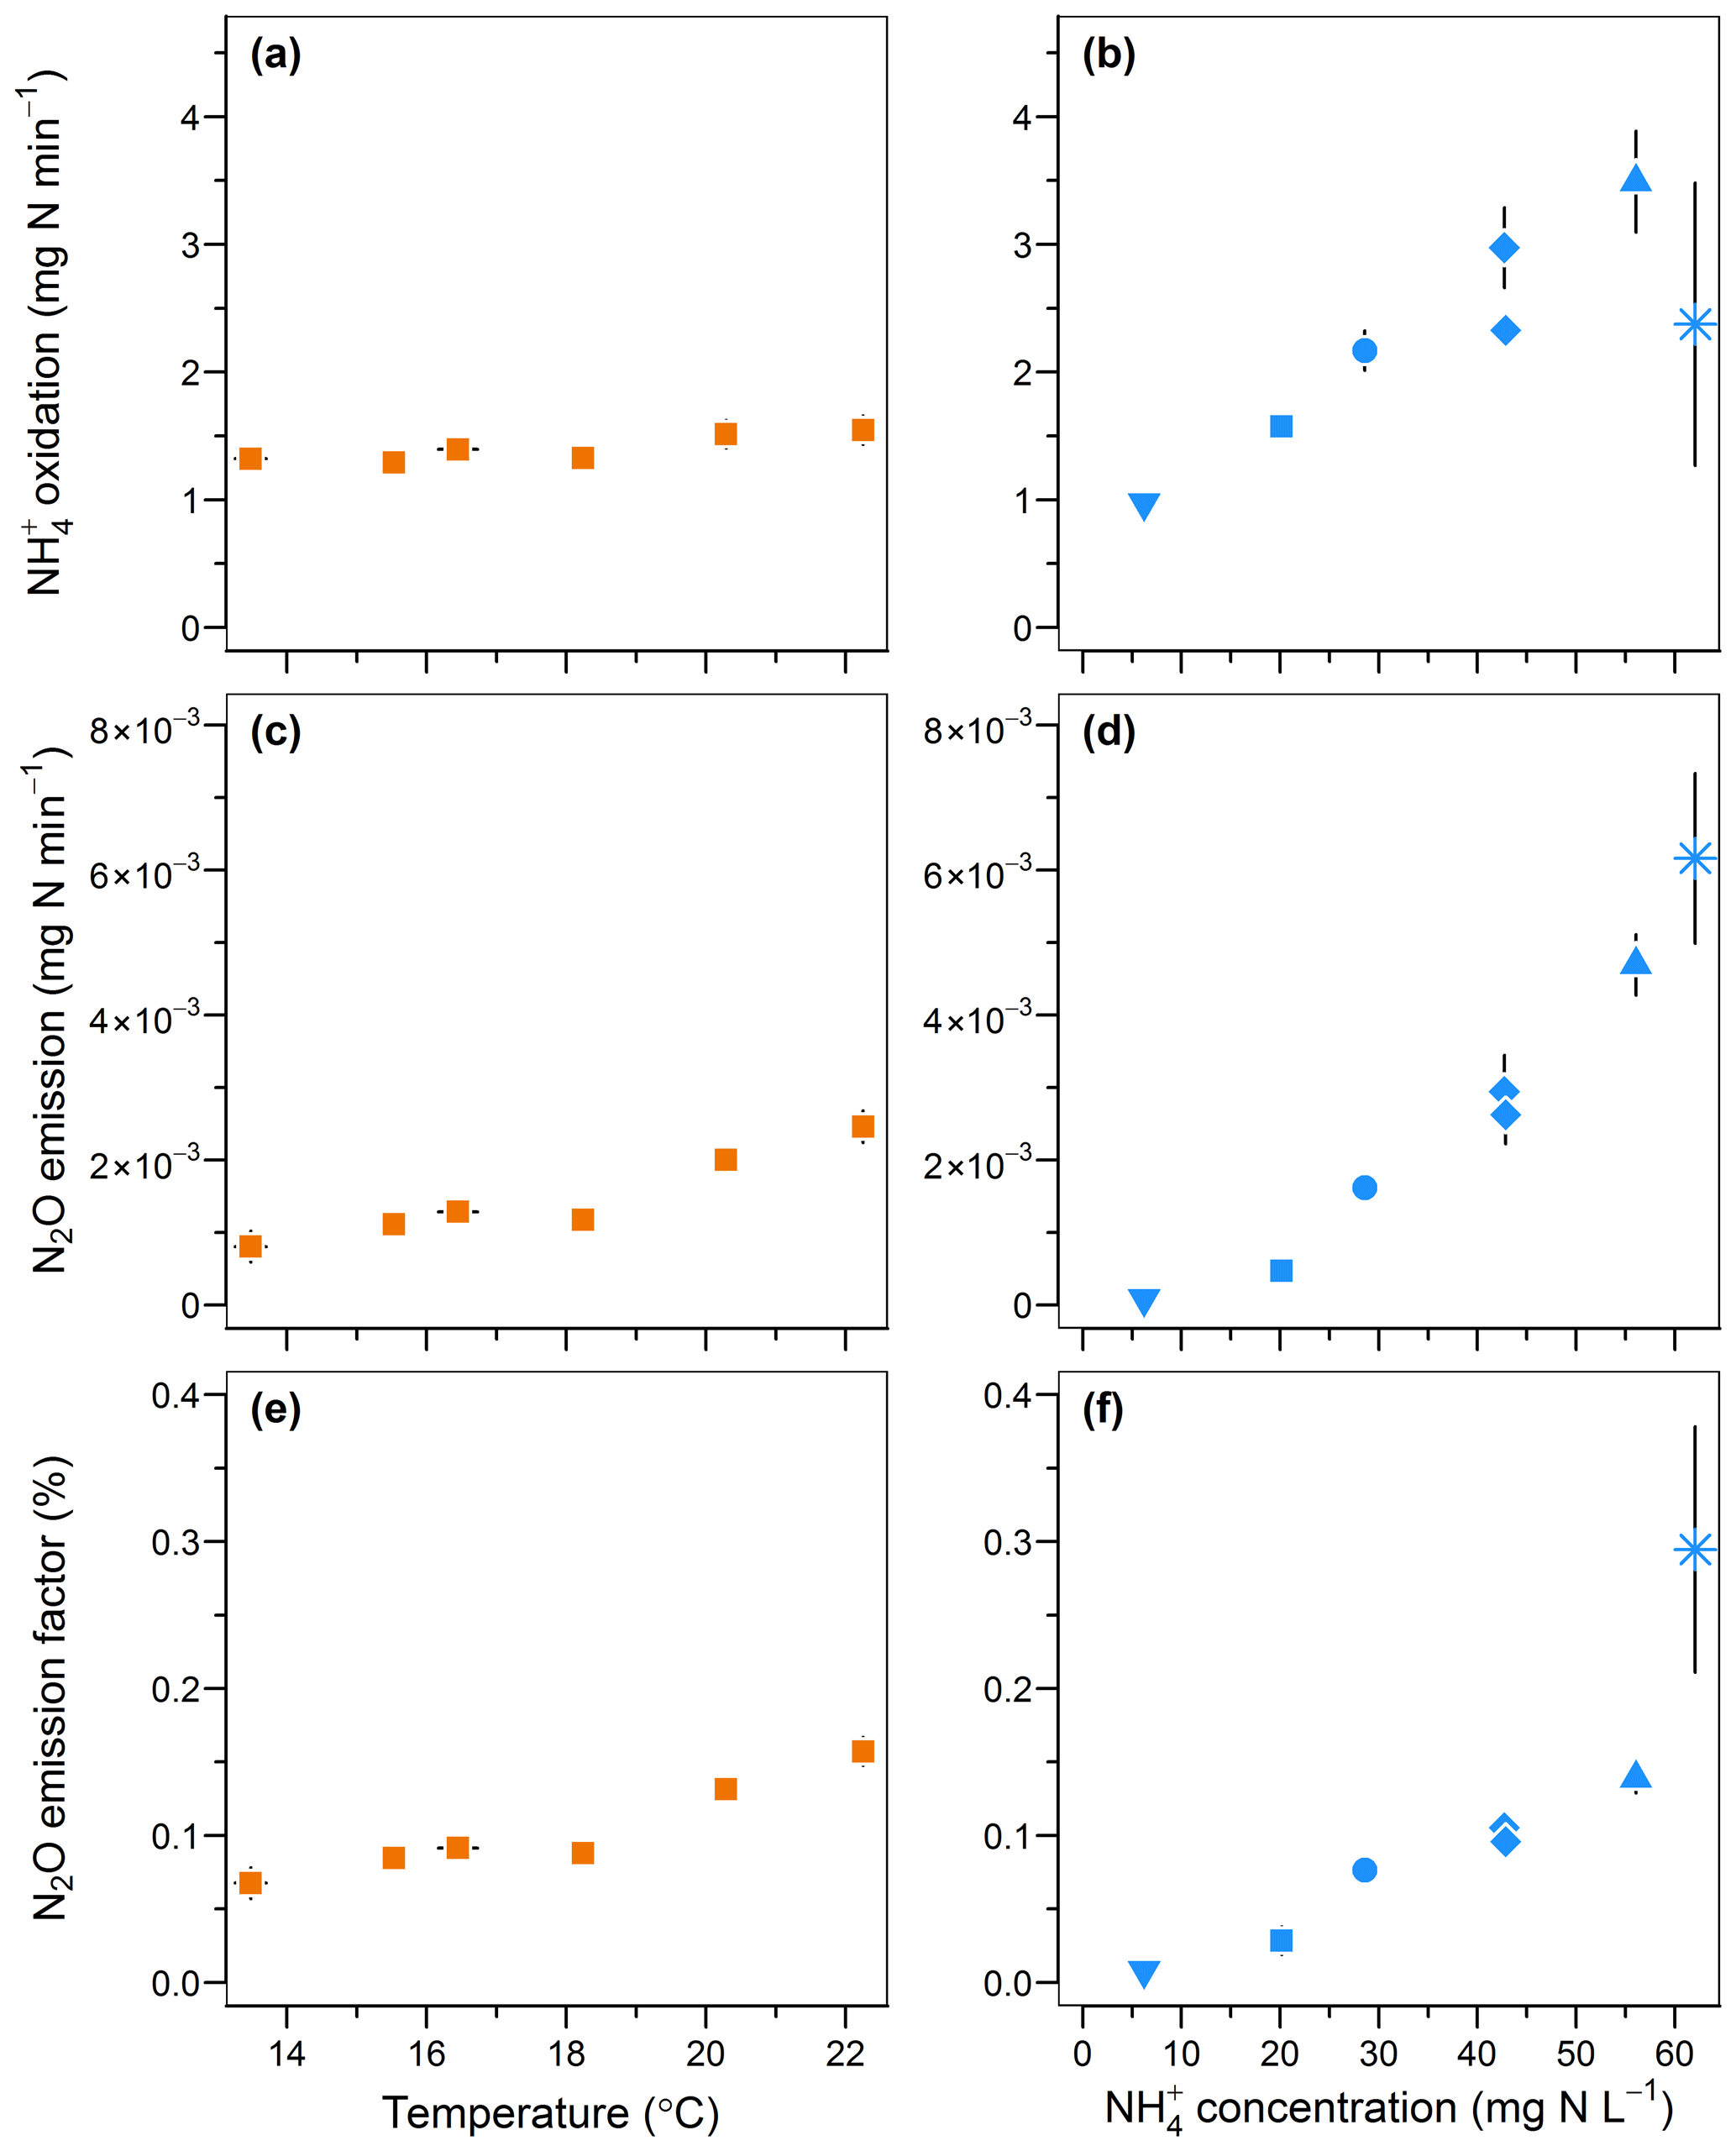
Figure 5Effect of temperature and inflow ammonium concentration on (a, b) the ammonium oxidation rate, (c, d) the nitrous oxide emission rate and (e, f) the N2O emission factor.
The range of nitrogen isotopomer site preference observed during the temperature and concentration tests (from −8 ‰ to 2.6 ‰) was similar to those measured during the oxygenation tests, confirming the high contribution of the nitrite reduction pathway to N2O emissions (Fig. 6a). This is consistent with previous findings based on the 15N-SP of N2O emitted from aerobic activated sludge (Toyoda et al., 2011; Tumendelger et al., 2016; Wunderlin et al., 2013), although authors reported 15N-SP as high as 10 ‰. This can suggest a higher oxygen limitation being favorable to the contribution of the nitrite reduction to N2O production in the nitrifying reactor studied here. Hydroxylamine oxidation can even be the main N2O-producing pathway, as evidenced by Tumendelger et al. (2014) in an aerated tank.
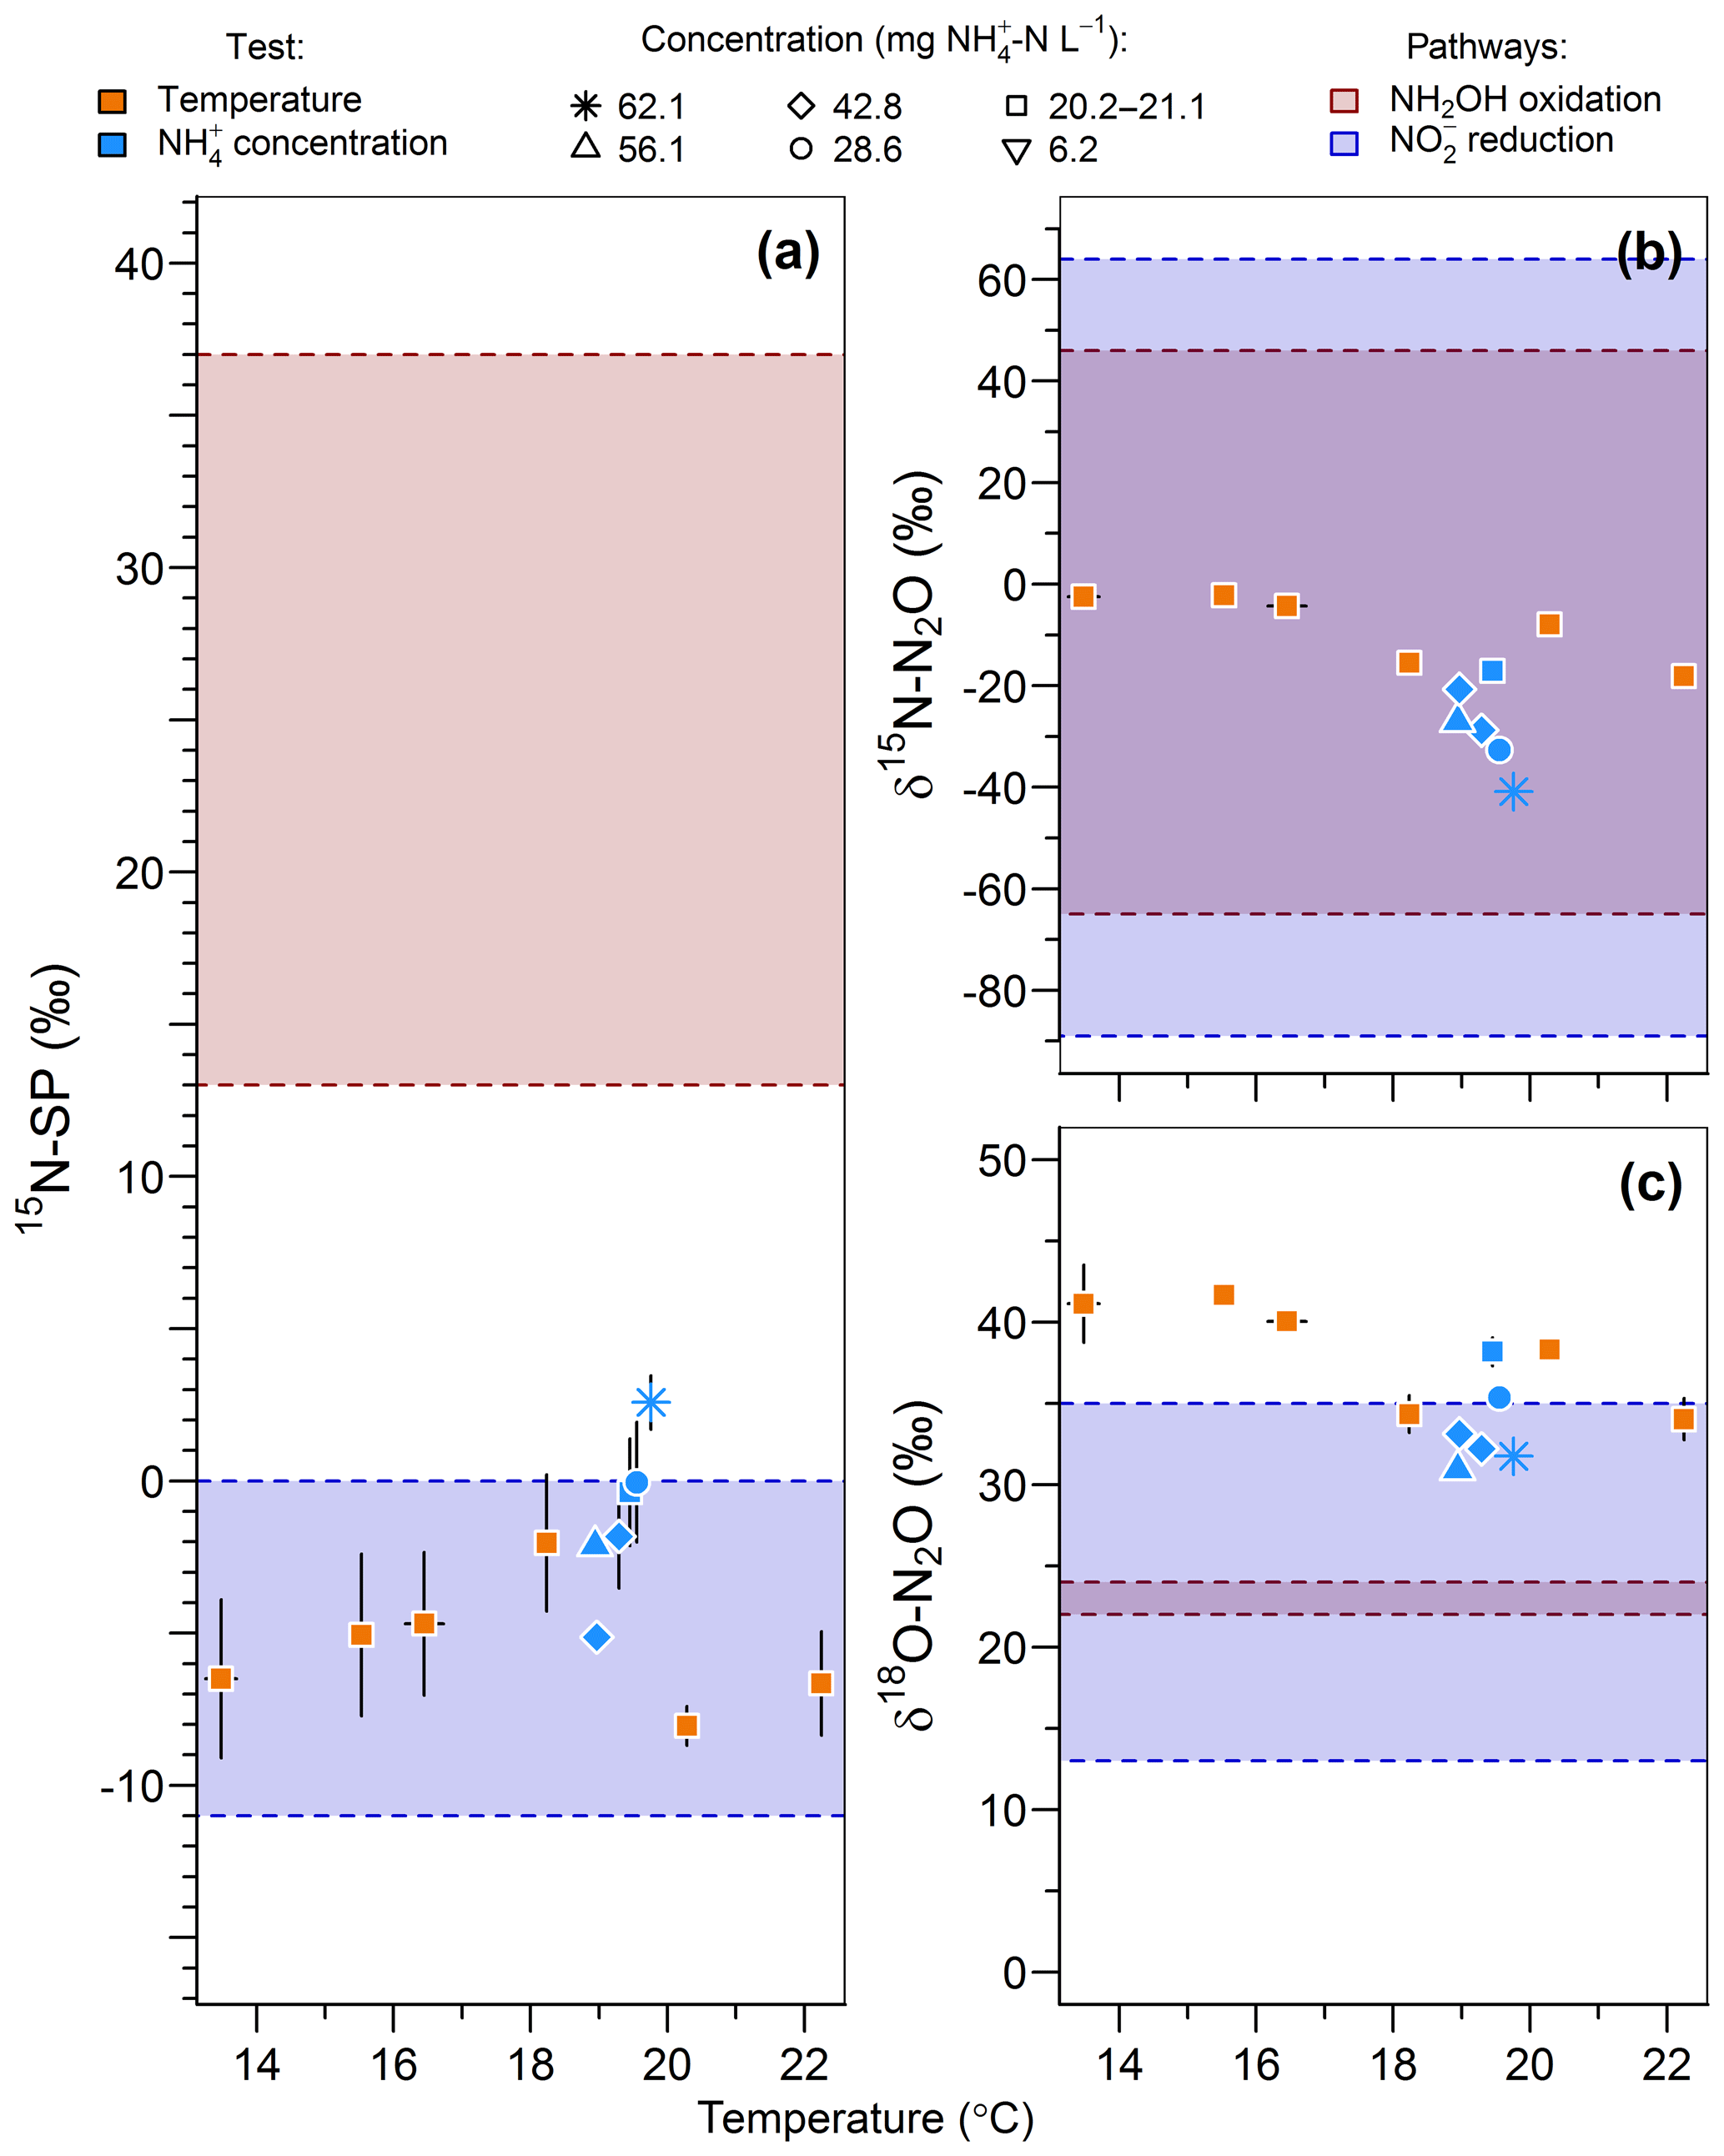
Figure 6Effect of temperature (orange symbols) and inflow ammonium concentration (blue symbols) on (a) the nitrogen isotopomer site preference, (b) the nitrogen isotope ratio and (c) the oxygen isotope ratio of N2O. Average and standard deviation (error bars) are calculated for the samples taken after one hydraulic retention time. Note that the isotopic measurements of gas samples taken at inflow ammonium concentration of 42.7 and 42.9 mg N L−1 were both recorded as 42.8 mg N L−1 in the legend.
Furthermore, 15N-SP increased with temperature between 13.5 and 19.8 ∘C. Our data suggest that temperature was the main control on the change in N2O-producing pathways within this temperature range (Fig. 6a). This could explain higher SP obtained with a 28.6 mg N L−1 inflow ammonium concentration than with 42.8. The temperature control seems to mitigate here the effect that ammonium concentration can have on the N2O-producing pathways evidenced elsewhere. Wunderlin et al. (2012, 2013) observed an increase in 15N-SP from −1.2 ‰ to 1.1 ‰ when inflow [] increased from 9 to 15 mg N L−1. They also observed 3 ‰–6 ‰ decreases in 15N-SP over the course of ammonium oxidation experiments and suggested that the NH2OH oxidation contribution to N2O production increased when conditions of excess, low concentrations and high nitrogen oxidation rate occur simultaneously. Our findings are consistent with the observation of Groeneweg et al. (1994) showing that temperature rather than ammonium concentration influenced the ammonium oxidation rate.
15N-SP increased from −6.5 ‰ to 2.6 ‰ with increasing temperature from 13.5 to 19.8 ∘C (Fig. 6a). This 15N-SP increase may either result from an increase in the N2O production by the hydroxylamine oxidation pathway or the N2O reduction to N2. Since an optimal oxygenation level was imposed and increased emissions were observed, the increasing 15N-SP is more likely due to N2O production by the hydroxylamine oxidation pathway. Reino et al. (2017) also observed an increase of N2O emissions for temperatures above 15 ∘C in a granular sludge airlift reactor performing partial nitritation. The authors suggested two hypothesis to explain their results: (i) the difference in the kinetic dependency with temperature of enzymes involved in ammonium and hydroxylamine oxidation; (ii) the temperature dependency of the acid–base equilibrium ammonium–ammonia. The changes in 15N-SP observed here are consistent with the former hypotheses. Hydroxylamine oxidation likely becomes the limiting step at temperatures above 15 ∘C, while being faster than ammonium oxidation at lower temperatures (Fig. 7). At temperatures above 15 ∘C, hydroxylamine therefore accumulates and leads to a higher contribution of the hydroxylamine oxidation pathway to N2O emissions. It would thus be interesting to determine the temperature dependency of the hydroxylamine oxidase.
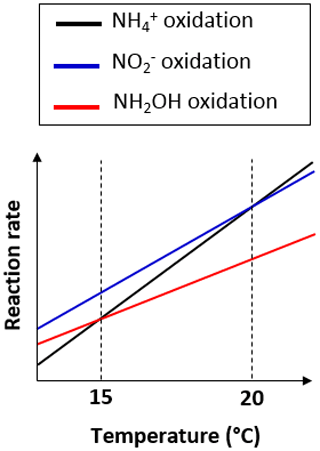
Figure 7Graph of the difference in temperature dependency of the reactions involved in nitrification.
The change in nitrous oxide-producing and nitrous oxide-consuming pathways had contrasting effects on the nitrogen and oxygen isotope ratios of nitrous oxide (Fig. 6b and c). δ15N-N2O decreased from −2.5 ‰ to −40.9 ‰ with an increasing contribution of hydroxylamine oxidation to the N2O emissions, i.e., when temperature increased from 13.5 to 19.8 ∘C. This is in contrast with the expected net lower isotope effect for N2O produced by hydroxylamine oxidation than nitrite reduction, and points out that further investigations are needed (Snider et al., 2015; Yamazaki et al., 2014). The changes in δ18O-N2O were less straightforward, likely influenced by changes in the reaction rates in addition to changes in the contribution of N2O-producing pathways. The values decreased from 41.1 ‰ to 34.3 ‰ with an increasing contribution of hydroxylamine oxidation to the N2O emissions when temperature increased from 13.5 to 18.2 ∘C. It decreased linearly from 38.2 ‰ to 31.8 ‰ with increasing reaction rate when inflow ammonium concentration increased from 20.2 to 62.1 mg -N L−1 (r2=0.83).
3.4 Difference in oxidation and reduction rates of nitrite as driver of nitrite reduction contribution to N2O emissions
The oxygenation, temperature and ammonium concentration tests revealed a strong control of nitrite-oxidizing activity and the contribution of the nitrite reduction pathway to N2O production. No relationship was observed between concentrations and oxygenation (Fig. S2g). In addition to this, higher 15N-SP at 21 % compared to the 10.5 %–16.8 % O2 was observed while the temperature remained below 20 ∘C (Fig. 4d). This is most likely due to higher nitrite oxidation than nitrite reduction rates in response to increasing oxygenation levels to 21 % O2, which is consistent with the nitrite oxidation step sensitivity to oxygen limitation (Pollice et al., 2002; Tanaka and Dunn, 1982). Additionally, 15N-SP close to 0 ‰ observed at the highest oxygenation level indicates a decreasing contribution to N2O production of nitrite reduction over hydroxylamine oxidation pathway. The highest oxygenation level thus limits the reduction pathways (i.e., reduction to N2O and N2O reduction to N2) while favoring the ammonium and nitrite oxidation pathways.
During the temperature and ammonium concentration tests, the contribution of the hydroxylamine oxidation pathway to N2O emissions increased with a temperature between 13.5 and 19.8 ∘C (Sect. 3.3) and decreased in favor of the nitrite reduction pathway when the temperature exceeded 20 ∘C (Fig. 6a). 15N-SP was low when the temperature exceeded 20 ∘C ( ‰), while being higher than −5 ‰ ( ‰) when the temperature ranged from 18.2 to 19.8 ∘C. At temperatures above 20 ∘C, ammonium oxidation rates exceed nitrite oxidation rates (Fig. 7; Kim et al., 2008; Raimonet et al., 2017). This most likely explains the increased contribution of the nitrite reduction pathway to N2O emission, as more nitrite becomes available for nitrifier denitrification and/or heterotrophic denitrification. As little nitrite accumulated (Fig. S2h), lower rates of nitrite-consuming processes than nitrite-producing processes can be inferred (nitrite reduction and oxidation vs. ammonium oxidation). Additionally, values of δ18O>35 ‰ measured during these tests suggest a significant contribution of heterotrophic denitrifiers to N2O emissions (Snider et al., 2013). This seems to occur at the lowest hydroxylamine oxidation contribution to N2O production below 18 ∘C and at 20.3 ∘C. Furthermore, the denitrifiers were impacted to a larger extent by temperature than ammonium concentration.
Our results demonstrated that whatever the imposed conditions, the nitrifying biomass produced N2O and nitrite reduction remained the main N2O-producing pathway. The N2O emissions were sensitive to oxygenation, temperature and concentration likely due to the control of enzymatic activities. The use of N2O isotopocules confirmed the processes that control N2O emissions under oxygenation constrain and improved knowledge of processes that control N2O under temperature constraints. Among the environmental variables tested, temperature appears to be the main control on N2O-producing pathways under nitrifying conditions, due to its dissimilar effects on ammonium-oxidizing and nitrite-oxidizing activities. Ranges of optimal temperature for nitrification and limited N2O emissions can be recommended. The combination of low N2O emissions and high nitrification rates may occur close to 15 ∘C. From 15 to 20 ∘C, an increasing nitrification rate increases N2O emissions via the hydroxylamine oxidation pathway. Above 20 ∘C, an increasing nitrification rate increases the N2O emissions via the nitrite reduction pathway.
We studied the impact of environmental variables on N2O-producing pathways based on the isotope analysis of a limited sample number of dissolved N compounds. The approach and conclusions based on the impact of these variables on N2O emissions most likely apply to nitrification and denitrification in soils, sediments, lakes and other natural waters. These systems are subject to dynamic environmental conditions, among which are ammonium concentrations, oxygenation and temperature. The comparison of the N2O isotopocules measured and those hypothesized from the literature provides a useful tool to discuss the N2O-producing and N2O-consuming process, as well the underlying control mechanisms at play. Ultimately, this can result in mitigation solutions of N2O emissions by constraining trough space and time the contribution of N2O-producing and N2O-consuming pathways. However, it appears that additional efforts are still needed to reduce, if possible, the ranges of N2O isotope signatures related to each producing and consuming processes.
All data included in this study are available upon request by contacting the corresponding author.
Additional information about the nitrifying activity of the biomass, the experimental conditions and the time series of ammonium oxidation experiments can be found in the Supplement. The supplement related to this article is available online at: https://doi.org/10.5194/bg-17-979-2020-supplement.
JF, AF and MSp designed the experiments with contributions from GH, MSe and AML. GH, JF and LL carried out the experiments. GH performed the stable isotope measurements with a contribution from VV and interpreted them with contribution from MSe. GH and JF processed the data. GH, JF and AML prepared the manuscript with contributions from all co-authors.
The authors declare that they have no conflict of interest.
The authors are grateful to Sam Azimi and the “Direction Innovation Environment” of SIAAP for providing the media colonized by the nitrifying biomass, Mansour Bounouba and Simon Dubos for their assistance in chemical analyses and in setup and development of the nitrifying reactor.
This research has been supported by the French National Research Agency (grant no. ANR-15-CE04-0014-02).
This paper was edited by Perran Cook and reviewed by two anonymous referees.
Andersson, K. K. and Hooper, A. B.: O2 and H2O are each the source of one O in produced from NH3 by Nitrosomonas: 15N-NMR evidence, FEBS Lett., 164, 236–240, https://doi.org/10.1016/0014-5793(83)80292-0, 1983.
Betlach, M. R. and Tiedje, J. M.: Kinetic explanation for accumulation of nitrite, nitric oxide, and nitrous oxide during bacterial denitrification, Appl. Environ. Microb., 42, 1074–1084, 1981.
Bollon, J., Filali, A., Fayolle, Y., Guerin, S., Rocher, V., and Gillot, S.: N2O emissions from full-scale nitrifying biofilters, Water Res., 102, 41–51, https://doi.org/10.1016/j.watres.2016.05.091, 2016.
Bothe, H., Ferguson, S. J., and Newton, W. E.: Biology of the nitrogen cycle, https://doi.org/10.1016/B978-0-444-52857-5.X5000-0, Elsevier, Amsterdam, the Netherlands, 2007.
Caranto, J. D., Vilbert, A. C., and Lancaster, K. M.: Nitrosomonas europaea cytochrome P460 is a direct link between nitrification and nitrous oxide emission, P. Natl. Acad. Sci. USA, 113, 14704–14709, https://doi.org/10.1073/pnas.1611051113, 2016.
Casciotti, K. L., Sigman, D. M., and Ward, B. B.: Linking diversity and stable isotope fractionation in ammonia-oxidizing bacteria, Geomicrobiol. J., 20, 335–353, https://doi.org/10.1080/01490450303895, 2003.
Crutzen, P. J., Heidt, L. E., Krasnec, J. P., Pollock, W. H., and Seiler, W.: Biomass burning as a source of atmospheric gases CO, H2, N2O, NO, CH3Cl and COS, Nature, 282, 253–256, https://doi.org/10.1038/282253a0, 1979.
Denk, T. R. A., Mohn, J., Decock, C., Lewicka-Szczebak, D., Harris, E., Butterbach-Bahl, K., Kiese, R., and Wolf, B.: The nitrogen cycle: A review of isotope effects and isotope modeling approaches, Soil Biol. Biochem., 105, 121–137, https://doi.org/10.1016/j.soilbio.2016.11.015, 2017.
Frame, C. H. and Casciotti, K. L.: Biogeochemical controls and isotopic signatures of nitrous oxide production by a marine ammonia-oxidizing bacterium, Biogeosciences, 7, 2695–2709, https://doi.org/10.5194/bg-7-2695-2010, 2010.
Fry, B.: Stable Isotope Ecology, Springer-Verlag, New York, 2006.
Groeneweg, J., Sellner, B., and Tappe, W.: Ammonia oxidation in nitrosomonas at NH3 concentrations near km: Effects of pH and temperature, Water Resour., 28, 2561–2566, https://doi.org/10.1016/0043-1354(94)90074-4, 1994.
Guo, L. and Vanrolleghem, P. A.: Calibration and validation of an activated sludge model for greenhouse gases no. 1 (ASMG1): prediction of temperature-dependent N2O emission dynamics, Bioproc. Biosyst. Eng., 37, 151–163, https://doi.org/10.1007/s00449-013-0978-3, 2014.
Heil, J., Liu, S., Vereecken, H., and Brüggemann, N.: Abiotic nitrous oxide production from hydroxylamine in soils and their dependence on soil properties, Soil Biol. Biochem., 84, 107–115, https://doi.org/10.1016/J.SOILBIO.2015.02.022, 2015.
Hollocher, T. C., Tate, M. E., and Nicholas, D. J.: Oxidation of ammonia by Nitrosomonas europaea. Definite 18O-tracer evidence that hydroxylamine formation involves a monooxygenase, J. Biol. Chem., 256, 10834–10836, 1981.
IPCC: Climate Change 2014: Impacts, Adaptation, and Vulnerability. Part A: Global and Sectoral Aspects. Contribution of Working Group II to the Fifth Assessment Report of the Intergovernmental Panel on Climate Change, edited by: Field, C. B., Barros, V. R., Dokken, D. J., Mach, K. J., Mastrandrea, M. D., Bilir, T. E., Chatterjee, M., Ebi, K. L., Estrada, Y. O., Genova, R. C., Girma, B., Kissel, E. S., Levy, A. N., MacCracken, S., Mastrandrea, P. R., and White, L. L., Cambridge University Press, Cambridge, UK and New York, NY, USA, 1132 pp., 2014.
Jinuntuya-Nortman, M., Sutka, R. L., Ostrom, P. H., Gandhi, H., and Ostrom, N. E.: Isotopologue fractionation during microbial reduction of N2O within soil mesocosms as a function of water-filled pore space, Soil Biol. Biochem., 40, 2273–2280, https://doi.org/10.1016/j.soilbio.2008.05.016, 2008.
Jung, M.-Y., Well, R., Min, D., Giesemann, A., Park, S.-J., Kim, J.-G., Kim, S.-J., and Rhee, S.-K.: Isotopic signatures of N2O produced by ammonia-oxidizing archaea from soils, ISME J., 8, 1115–1125, https://doi.org/10.1038/ismej.2013.205, 2014.
Kampschreur, M. J., Temmink, H., Kleerebezem, R., Jetten, M. S. M., and van Loosdrecht, M. C. M.: Nitrous oxide emission during wastewater treatment, Water Res., 43, 4093–4103, https://doi.org/10.1016/j.watres.2009.03.001, 2009.
Kim, J.-H., Guo, X., and Park, H.-S.: Comparison study of the effects of temperature and free ammonia concentration on nitrification and nitrite accumulation, Process Biochem., 43, 154–160, https://doi.org/10.1016/J.PROCBIO.2007.11.005, 2008.
Koba, K., Osaka, K., Tobari, Y., Toyoda, S., Ohte, N., Katsuyama, M., Suzuki, N., Itoh, M., Yamagishi, H., Kawasaki, M., Kim, S. J., Yoshida, N., and Nakajima, T.: Biogeochemistry of nitrous oxide in groundwater in a forested ecosystem elucidated by nitrous oxide isotopomer measurements, Geochim. Cosmochim. Ac., 73, 3115–3133, https://doi.org/10.1016/j.gca.2009.03.022, 2009.
Kool, D. M., Wrage, N., Oenema, O., Dolfing, J., and Van Groenigen, J. W.: Oxygen exchange between (de)nitrification intermediates and H2O and its implications for source determination of and N2O: a review, Rapid Commun. Mass Sp., 21, 3569–3578, https://doi.org/10.1002/rcm.3249, 2007.
Kroopnick, P. and Craig, H.: Atmospheric oxygen: isotopic composition and solubility fractionation, Science, 175, 54–55, https://doi.org/10.1126/science.175.4017.54, 1972.
Law, Y., Ni, B.-J., Lant, P., and Yuan, Z.: N2O production rate of an enriched ammonia-oxidising bacteria culture exponentially correlates to its ammonia oxidation rate, Water Res., 46, 3409–3419, https://doi.org/10.1016/j.watres.2012.03.043, 2012a.
Law, Y., Ye, L., Pan, Y., and Yuan, Z.: Nitrous oxide emissions from wastewater treatment processes, Philos. T. R. Soc. Lon. B, 367, 1265–1277, https://doi.org/10.1098/rstb.2011.0317, 2012b.
Lewicka-Szczebak, D., Well, R., Köster, J. R., Fuß, R., Senbayram, M., Dittert, K., and Flessa, H.: Experimental determinations of isotopic fractionation factors associated with N2O production and reduction during denitrification in soils, Geochim. Cosmochim. Ac., 134, 55–73, https://doi.org/10.1016/j.gca.2014.03.010, 2014.
Mandernack, K. W., Mills, C. T., Johnson, C. A., Rahn, T., and Kinney, C.: The δ15N and δ18O values of N2O produced during the co-oxidation of ammonia by methanotrophic bacteria, Chem. Geol., 267, 96–107, https://doi.org/10.1016/J.CHEMGEO.2009.06.008, 2009.
McIlvin, M. R. and Altabet, M. A.: Chemical conversion of nitrate and nitrite to nitrous oxide for nitrogen and oxygen isotopic analysis in freshwater and seawater, Anal. Chem., 77, 5589–5595, https://doi.org/10.1021/ac050528s, 2005.
Mothet, A., Sebilo, M., Laverman, A. M., Vaury, V., and Mariotti, A.: Is site preference of N2O a tool to identify benthic denitrifier N2O?, Environ. Chem., 10, 281–284, https://doi.org/10.1071/EN13021, 2013.
Nakayama, N., Obata, H., and Gamo, T.: Consumption of dissolved oxygen in the deep Japan Sea, giving a precise isotopic fractionation factor, Geophys. Res. Lett., 34, L20604, https://doi.org/10.1029/2007GL029917, 2007.
Ostrom, N. E., Pitt, A., Sutka, R., Ostrom, P. H., Grandy, A. S., Huizinga, K. M., and Robertson, G. P.: Isotopologue effects during N2O reduction in soils and in pure cultures of denitrifiers, J. Geophys. Res., 112, G02005, https://doi.org/10.1029/2006JG000287, 2007.
Otte, S., Grobben, N. G., Robertson, L. A., Jetten, M. S., and Kuenen, J. G.: Nitrous oxide production by Alcaligenes faecalis under transient and dynamic aerobic and anaerobic conditions, Appl. Environ. Microb., 62, 2421–2426, 1996.
Pérez, T., Garcia-Montiel, D., Trumbore, S., Tyler, S., de Camargo, P., Moreira, M., Piccolo, M., and Cerri, C.: Nitrous oxide nitrification and denitrification 15N enrichment factors from Amazon forest soils, Ecol. Appl., 16, 2153–2167, https://doi.org/10.1890/1051-0761(2006)016[2153:nonadn]2.0.co;2, 2006.
Pollice, A., Tandoi, V., and Lestingi, C.: Influence of aeration and sludge retention time on ammonium oxidation to nitrite and nitrate, Water Res., 36, 2541–2546, https://doi.org/10.1016/S0043-1354(01)00468-7, 2002.
Raimonet, M., Cazier, T., Rocher, V., and Laverman, A. M.: Nitrifying kinetics and the persistence of nitrite in the Seine river, France, J. Environ. Qual., 46, 585–595, https://doi.org/10.2134/jeq2016.06.0242, 2017.
Ravishankara, A. R., Daniel, J. S., and Portmann, R. W.: Nitrous oxide (N2O): the dominant ozone-depleting substance emitted in the 21st century, Science, 326, 123–125, https://doi.org/10.1126/science.1176985, 2009.
R Development Core Team: R: A Language and Environment for Statistical Computing, R foundation for Statistical Computing Vienna, Vienna, Austria, 2014.
Reino, C., van Loosdrecht, M. C. M., Carrera, J., and Pérez, J.: Effect of temperature on N2O emissions from a highly enriched nitrifying granular sludge performing partial nitritation of a low-strength wastewater, Chemosphere, 185, 336–343, https://doi.org/10.1016/j.chemosphere.2017.07.017, 2017.
Sabba, F., Terada, A., Wells, G., Smets, B. F., and Nerenberg, R.: Nitrous oxide emissions from biofilm processes for wastewater treatment, Appl. Microbiol. Biot., 102, 9815–9829, https://doi.org/10.1007/s00253-018-9332-7, 2018.
Semaoune, P., Sebilo, M., Templier, J., and Derenne, S.: Is there any isotopic fractionation of nitrate associated with diffusion and advection?, Environ. Chem., 9, 158–162, https://doi.org/10.1071/EN11143, 2012.
Snider, D., Thompson, K., Wagner-Riddle, C., Spoelstra, J., and Dunfield, K.: Molecular techniques and stable isotope ratios at natural abundance give complementary inferences about N2O production pathways in an agricultural soil following a rainfall event, Soil Biol. Biochem., 88, 197–213, https://doi.org/10.1016/j.soilbio.2015.05.021, 2015.
Snider, D. M., Venkiteswaran, J. J., Schiff, S. L., and Spoelstra, J.: Deciphering the oxygen isotope composition of nitrous oxide produced by nitrification, Glob. Change Biol., 18, 356–370, https://doi.org/10.1111/j.1365-2486.2011.02547.x, 2012.
Snider, D. M., Venkiteswaran, J. J., Schiff, S. L., and Spoelstra, J.: A new mechanistic model of δ18O-N2O formation by denitrification, Geochim. Cosmochim. Ac., 112, 102–115, https://doi.org/10.1016/j.gca.2013.03.003, 2013.
Sutka, R. L., Ostrom, N. E., Ostrom, P. H., Gandhi, H., and Breznak, J. A.: Nitrogen isotopomer site preference of N2O produced by Nitrosomonas europaea and Methylococcus capsulatus Bath, Rapid Commun. Mass Sp., 17, 738–745, https://doi.org/10.1002/rcm.968, 2003.
Sutka, R. L., Ostrom, N. E., Ostrom, P. H., Gandhi, H., and Breznak, J. A.: Nitrogen isotopomer site preference of N2O produced by Nitrosomonas europaea and Methylococcus capsulatus Bath, Rapid Commun. Mass Sp., 18, 1411–1412, https://doi.org/10.1002/rcm.1482, 2004.
Sutka, R. L., Ostrom, N. E., Ostrom, P. H., Breznak, J. A., Pitt, A. J., Li, F., and Gandhi, H.: Distinguishing nitrous oxide production from nitrification and denitrification on the basis of isotopomer abundances, Appl. Environ. Microb., 72, 638–644, https://doi.org/10.1128/AEM.72.1.638-644.2006, 2006.
Sutka, R. L., Adams, G. C., Ostrom, N. E., and Ostrom, P. H.: Isotopologue fractionation during N2O production by fungal denitrification, Rapid Commun. Mass Sp., 22, 3989–3996, https://doi.org/10.1002/rcm.3820, 2008.
Tanaka, H. and Dunn, I. J.: Kinetics of biofilm nitrification, Biotechnol. Bioeng., 24, 669–689, https://doi.org/10.1002/bit.260240311, 1982.
Terada, A., Sugawara, S., Hojo, K., Takeuchi, Y., Riya, S., Harper, W. F., Yamamoto, T., Kuroiwa, M., Isobe, K., Katsuyama, C., Suwa, Y., Koba, K., and Hosomi, M.: Hybrid nitrous oxide production from a partial nitrifying bioreactor: hydroxylamine interactions with nitrite, Environ. Sci. Technol., 51, 2748–2756, https://doi.org/10.1021/acs.est.6b05521, 2017.
Todt, D. and Dörsch, P.: Mechanism leading to N2O production in wastewater treating biofilm systems, Rev. Environ. Sci. Bio., 15, 355–378, https://doi.org/10.1007/s11157-016-9401-2, 2016.
Toyoda, S., Suzuki, Y., Hattori, S., Yamada, K., Fujii, A., Yoshida, N., Kouno, R., Murayama, K., and Shiomi, H.: Isotopomer analysis of production and consumption mechanisms of N2O and CH4 in an advanced wastewater treatment system, Environ. Sci. Technol., 45, 917–922, https://doi.org/10.1021/es102985u, 2011.
Toyoda, S., Yoshida, N., and Koba, K.: Isotopocule analysis of biologically produced nitrous oxide in various environments, Mass Spectrom. Rev., 36, 135–160, https://doi.org/10.1002/mas.21459, 2017.
Tumendelger, A., Toyoda, S., and Yoshida, N.: Isotopic analysis of N2O produced in a conventional wastewater treatment system operated under different aeration conditions, Rapid Commun. Mass Sp., 28, 1883–1892, https://doi.org/10.1002/rcm.6973, 2014.
Tumendelger, A., Toyoda, S., Yoshida, N., Shiomi, H., and Kouno, R.: Isotopocule characterization of N2O dynamics during simulated wastewater treatment under oxic and anoxic conditions, Geochem. J., 50, 105–121, https://doi.org/10.2343/geochemj.2.0390, 2016.
United Nations, Department of Economic and Social Affairs, Population Division: World Urbanization Prospects 2018: Highlights (ST/ESA/SER.A/421), New York, https://doi.org/10.18356/6255ead2-en, 2019.
Vieten, B., Blunier, T., Neftel, A., Alewell, C., and Conen, F.: Fractionation factors for stable isotopes of N and O during N2O reduction in soil depend on reaction rate constant, Rapid Commun. Mass Sp., 21, 846–850, https://doi.org/10.1002/rcm.2915, 2007.
Webster, E. A. and Hopkins, D. W.: Nitrogen and oxygen isotope ratios of nitrous oxide emitted from soil and produced by nitrifying and denitrifying bacteria, Biol. Fert. Soils, 22, 326–330, https://doi.org/10.1007/BF00334577, 1996.
Wunderlin, P., Mohn, J., Joss, A., Emmenegger, L., and Siegrist, H.: Mechanisms of N2O production in biological wastewater treatment under nitrifying and denitrifying conditions, Water Resour., 46, 1027–1037, https://doi.org/10.1016/j.watres.2011.11.080, 2012.
Wunderlin, P., Lehmann, M. F., Siegrist, H., Tuzson, B., Joss, A., Emmenegger, L., and Mohn, J.: Isotope signatures of N2O in a mixed microbial population system: Constraints on N2O producing pathways in wastewater treatment, Environ. Sci. Technol., 47, 1339–1348, https://doi.org/10.1021/es303174x, 2013.
Yamagishi, H., Westley, M. B., Popp, B. N., Toyoda, S., Yoshida, N., Watanabe, S., Koba, K., and Yamanaka, Y.: Role of nitrification and denitrification on the nitrous oxide cycle in the eastern tropical North Pacific and Gulf of California, J. Geophys. Res., 112, G02015, https://doi.org/10.1029/2006JG000227, 2007.
Yamazaki, T., Hozuki, T., Arai, K., Toyoda, S., Koba, K., Fujiwara, T., and Yoshida, N.: Isotopomeric characterization of nitrous oxide produced by reaction of enzymes extracted from nitrifying and denitrifying bacteria, Biogeosciences, 11, 2679–2689, https://doi.org/10.5194/bg-11-2679-2014, 2014.
Yoshida, N.: 15N-depleted N2O as a product of nitrification, Nature, 335, 528–529, https://doi.org/10.1038/335528a0, 1988.
Zhang, L., Altabet, M. A., Wu, T. X., and Hadas, O.: Sensitive measurement of () at natural abundance levels in fresh and saltwaters, Anal. Chem., 79, 5297–5303, https://doi.org/10.1021/Ac070106d, 2007.