the Creative Commons Attribution 4.0 License.
the Creative Commons Attribution 4.0 License.
 | 16 Feb 2021
The seasonal phases of an Arctic lagoon reveal the discontinuities of pH variability and CO2 flux at the air–sea interface
Christina Bonsell
Nathan D. McTigue
Amanda L. Kelley
The western Arctic Ocean, including its shelves and coastal habitats, has become a focus in ocean acidification research over the past decade as the colder waters of the region and the reduction of sea ice appear to promote the uptake of excess atmospheric CO2. Due to seasonal sea ice coverage, high-frequency monitoring of pH or other carbonate chemistry parameters is typically limited to infrequent ship-based transects during ice-free summers. This approach has failed to capture year-round nearshore carbonate chemistry dynamics which is modulated by biological metabolism in response to abundant allochthonous organic matter to the narrow shelf of the Beaufort Sea and adjacent regions. The coastline of the Beaufort Sea comprises a series of lagoons that account for > 50 % of the land–sea interface. The lagoon ecosystems are novel features that cycle between “open” and “closed” phases (i.e., ice-free and ice-covered, respectively). In this study, we collected high-frequency pH, salinity, temperature, and photosynthetically active radiation (PAR) measurements in association with the Beaufort Lagoon Ecosystems – Long Term Ecological Research program – for an entire calendar year in Kaktovik Lagoon, Alaska, USA, capturing two open-water phases and one closed phase. Hourly pH variability during the open-water phases are some of the fastest rates reported, exceeding 0.4 units. Baseline pH varied substantially between the open phase in 2018 and open phase in 2019 from ∼ 7.85 to 8.05, respectively, despite similar hourly rates of change. Salinity–pH relationships were mixed during all three phases, displaying no correlation in the 2018 open phase, a negative correlation in the 2018/19 closed phase, and a positive correlation during the 2019 open phase. The high frequency of pH variability could partially be explained by photosynthesis–respiration cycles as correlation coefficients between daily average pH and PAR were 0.46 and 0.64 for 2018 and 2019 open phases, respectively. The estimated annual daily average CO2 efflux (from sea to atmosphere) was 5.9 ± 19.3 , which is converse to the negative influx of CO2 estimated for the coastal Beaufort Sea despite exhibiting extreme variability. Considering the geomorphic differences such as depth and enclosure in Beaufort Sea lagoons, further investigation is needed to assess whether there are periods of the open phase in which lagoons are sources of carbon to the atmosphere, potentially offsetting the predicted sink capacity of the greater Beaufort Sea.
- Article
(5025 KB) - Full-text XML
-
Supplement
(2398 KB) - BibTeX
- EndNote


Acidification of the Arctic Ocean is predicted to proceed at a faster rate than in lower-latitude regions due to the increased solubility of CO2 in colder waters, intrinsically lower carbonate ion concentration, and specific water mass mixing patterns with deep Pacific water and surface freshwater (Fabry et al., 2009; Mathis et al., 2015). The acidification phenomenon which increases the ratio of dissolved inorganic carbon to alkalinity reduces the natural buffering capacity of the carbonate system via a reduction in carbonate ion concentration. These processes result in a decrease in calcium carbonate saturation state and sea surface pH. It is estimated that the Canadian Basin, Beaufort Sea, and Chukchi Sea in the Arctic have experienced a 2.7 % shoaling of low-aragonite-saturation state (Ωarg < 1.25) waters from 0–250 m over the past 2 decades (Qi et al., 2017; Zhang et al., 2020). Future projections anticipate a continuation of this trend with sustained, perennial undersaturation of calcium carbonate (Ωarg < 1) in the Beaufort and Chukchi seas by the year 2040, which will reduce the capacity of these waters to continually take up atmospheric CO2 (Mathis et al., 2015). The rate at which this happens will have significant implications on the current estimates of CO2 uptake by the coastal Chukchi and Beaufort seas (Evans et al., 2015a). Acidification of offshore Arctic waters appears to be a consequence of increasing Pacific Winter Water intrusion due to globally warming waters and an influx of excess atmospheric CO2 caused by the disequilibrium between air and seawater pCO2 (Qi et al., 2017). Along the nearshore regions of the Beaufort Sea, however, coastal processes predominately drive acidification such as riverine flux of freshwater, biological metabolism, sea ice melt from warming waters, and upwelling of the Polar Marine Layer, which is an important water source for Arctic lagoons (Miller et al., 2014; Wynn et al., 2016; Harris et al., 2017; Carstensen and Duarte, 2019; Woosley and Millero, 2020).
The coastal margin of the Beaufort Sea consists of biologically complex, shallow (< 6 m), discontinuous, estuarine lagoons that depict ∼ 50 % of the coast from Nuvuk (Pt. Barrow) to Demarcation Bay, Alaska, USA (Lissauer et al., 1984; Dunton et al., 2006, 2012; Harris et al., 2017). The North Slope region is predominately tundra, where the annual terrestrial thaw comprises the majority of the freshwater outflow to the Beaufort Sea. Canada's Mackenzie River is the largest source of freshwater flowing into the Beaufort Sea, ∼ 300 km3 yr−1 (Stein and Macdonald, 2004; McClelland et al., 2006); however, many smaller rivers and streams link the terrestrial hydrography with the marine lagoon ecosystem characterized as geomorphic transition zones (Dunton et al., 2006, 2012). Barrier islands partially obstruct Beaufort Sea coastal water exchange with the lagoons, which in part are hydrographically influenced by the seasonal shifts in terrestrial freshwater flux that results in highly dynamic chemical conditions (Mouillot et al., 2007). Flow channels between the land, Arctic lagoons, and the ocean are ephemeral, causing the flow of water in and out of a lagoon to be intermittent, varying on short- and long-term timescales (Kraus et al., 2008; Dunton et al., 2012). These physical flow attributes result in highly variable salinity and temperature that range from fresh to hypersaline (0 to > 45) and −2 to 14 ∘C, respectively (Dunton and Schonberg, 2006; Harris et al., 2017). This variability in temperature and freshwater delivery can have a dramatic effect on carbonate chemistry thermodynamics and modify alkalinity and dissolved inorganic carbon (DIC). The seasonality of these shallow lagoons is distinguished by two principal phase states corresponding to sea ice prevalence – open and closed. The closed period during winter ice cover exhibits a non-quantifiable amount of air–sea exchange due to the physical sea ice barrier. Conversely, the open, ice-free summer period from late spring to early fall is marked by spring river discharge, air–sea exchange, and storm activity (McClelland et al., 2012, 2014). Episodic fluctuations in lagoon hydrography during periods of open water add to the complexity of physicochemical variability as wind-driven upwelling events coupled with tidal flux can precipitate rapid changes in these semi-isolated bodies of water (Lissauer et al., 1984).
Despite extreme variability in temperature and salinity, Arctic lagoons are home to diverse fish assemblages that include diadromous, freshwater, and marine species (Robards, 2014; Harris et al., 2017; Tibbles, 2018), many of which serve as important subsistence fisheries for Arctic communities (Griffiths et al., 1977; Craig, 1989). Arctic lagoons have relatively high diversity and abundance of benthic community invertebrates, ranging from 654 to 5353 individuals per square meter with trophic linkages to birds and marine mammals (Griffiths et al., 1977, Johnson et al., 2010; Dunton et al., 2012). The benthic food web relies on both autochthonous microalgal production and allochthonous terrestrial organic matter (OM) inputs as carbon subsidies (Harris et al., 2018). The deposition of these carbon subsidies may have implications on the chemical conditions of lagoon ecosystems via enhanced remineralization during the open and closed phases. To date, hydrographic physicochemical measurements have been mostly limited to the open (summer) season with few exceptions (Kinney et al., 1971; Mathews and Stringer, 1984; Dunton and Schonberg, 2006; Robards, 2014). To our knowledge, only a single high-frequency year-round measurement of Beaufort Sea lagoon temperature and salinity exists (Harris et al., 2017), which is insufficient for understanding how these factors including biological metabolism may impact carbonate system dynamics.
This study is the first to incorporate a high-frequency time series of salinity, temperature, photosynthetically active radiation (PAR), and pH for an entire calendar year capturing both open and closed phases of an Arctic lagoon. Kaktovik Lagoon located adjacent to Barter Island and the city of Kaktovik was selected for sensor package deployment. The data collected in this study were processed in part with those available from the Beaufort Lagoon Ecosystems (BLE) Long Term Ecological Research (LTER) program and the NOAA Earth Systems Research Laboratory (ESRL). Salinity, temperature, and pH were analyzed in the time and frequency domains alongside ancillary solar radiation and water depth in order to examine potential modifiers of pH. This included estimates of carbon flux at the land–sea interface, utilizing atmospheric CO2 measurements and comparing those with derived seawater pCO2 estimates. The findings of this study are presented in the context of seasonal variability of oceanographic processes in an ecosystem that is part of the western coastal Arctic that is experiencing climate change.
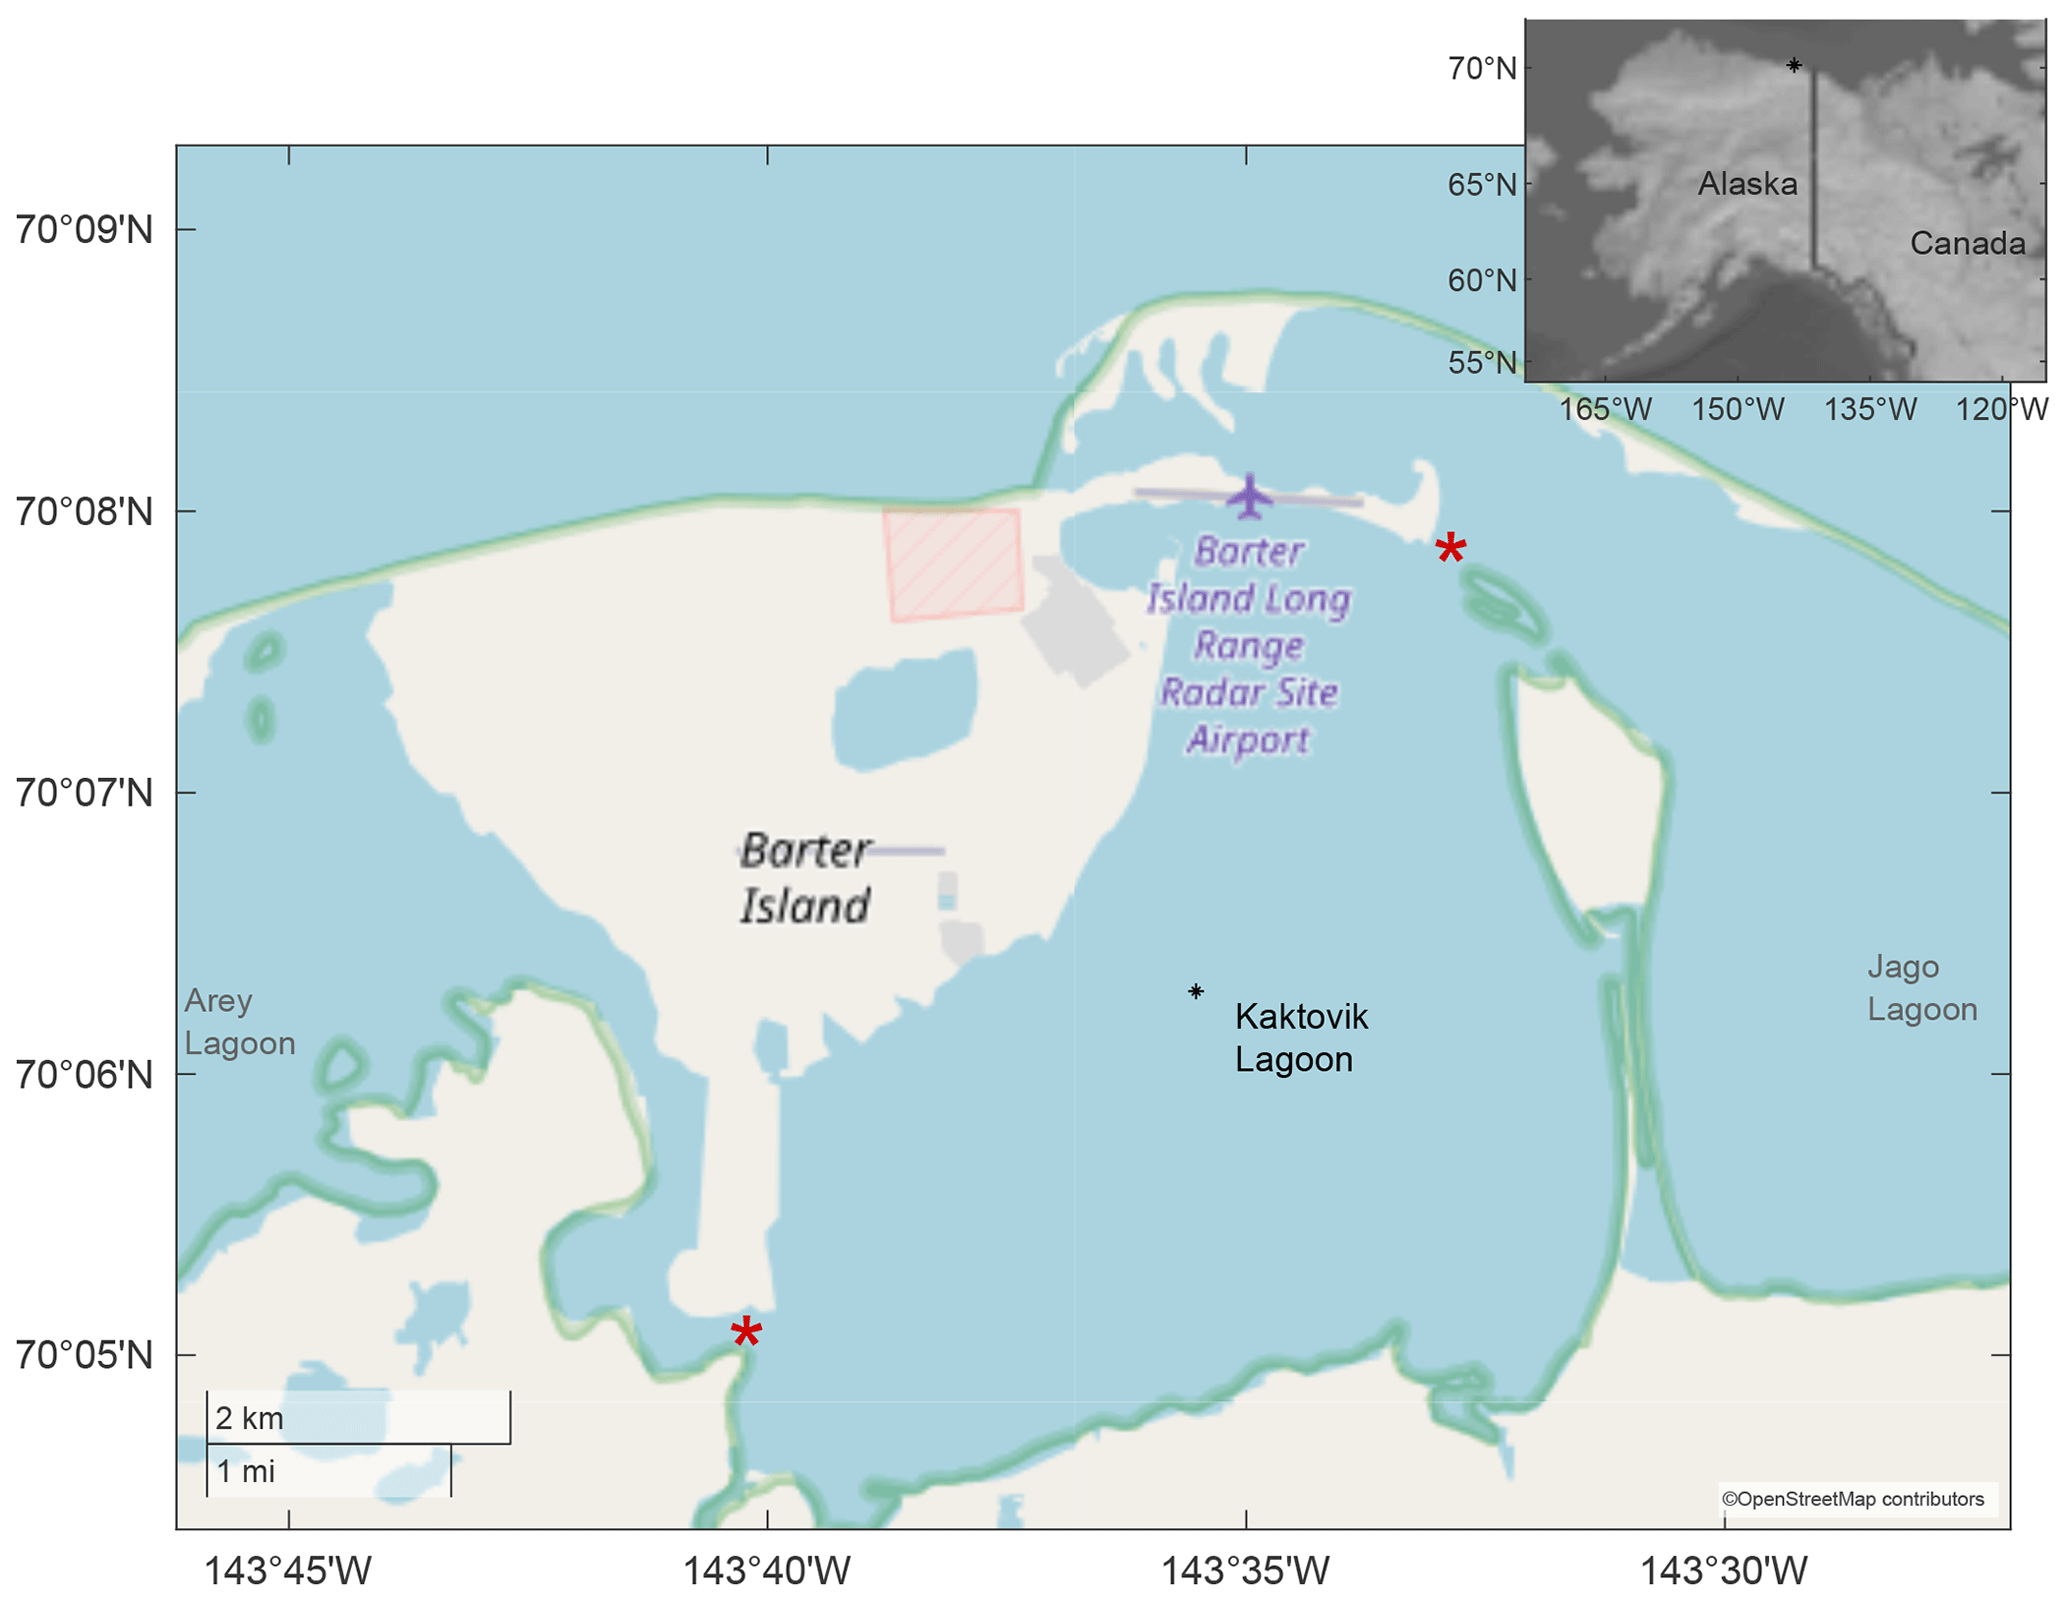
Figure 1Study site at Kaktovik Lagoon along the Beaufort Sea Coastline. Red stars denote the main exchange pathways between adjacent lagoons and the greater Beaufort Sea. The black star in inset map is the location of Kaktovik Lagoon.
2.1 Kaktovik Lagoon ecosystem
Kaktovik Lagoon, Alaska (70∘6′3′′ N, 143∘34′52′′ W), serves as one of the study sites for the National Science Foundation's Beaufort Lagoon Ecosystems LTER program. It is one of a series of coastal lagoons that fringe the Arctic National Wildlife Refuge and borders the east side of Barter Island. With a maximum depth of approximately 4.4 m, Kaktovik Lagoon has two narrow exchange pathways with adjacent water bodies (Dunton et al., 2012). One of the pathways connects to Arey Lagoon; the other links to Jago Lagoon and to the Beaufort Sea via a channel > 25 m long and < 2.5 m deep (Fig. 1). Surface freshwater inputs are limited to small tundra streams, although narrow inlets provide some exchange to adjacent Arey and Jago lagoons, which receive terrestrial inputs from the Hulahula–Okpilak and Jago rivers, respectively. The timing of sea ice formation varies by year but occurs between late September and October, becoming landfast (fastened to the coastline) in the shallow lagoons until breakup in May or June (Dunton et al., 2006).
2.2 Oceanographic sampling
A benthic mooring outfitted with a Sea-Bird SeaFET V2 and RBR Concerto CTD was deployed 8 August 2018 to 11 August 2019, with sensors roughly 10 cm from the bottom in Kaktovik Lagoon (Fig. 1). Hourly measurements of pH, salinity, and temperature (from SeaFET thermistor) were recorded (UTC) throughout the deployment period. A separate, adjacent mooring consisting of a LI-COR spherical quantum sensor in line with a LI-1000 data logger recorded photosynthetically active radiation (PAR ; 400–700 nm) ∼ 30 cm from the bottom. Average PAR was integrated over 3 h time periods and recorded. In August 2018, April 2019, and June 2019, the site was sampled for dissolved nutrients and physicochemical (i.e., temperature and conductivity) parameters within 30 cm of water surface and within 30 cm of the bottom. Physicochemical parameters were recorded with a YSI ProDSS calibrated daily before excursions. Nutrient samples were collected with a peristaltic pump fitted with Masterflex C-Flex tubing, filtered through a Geotech 0.45 µm high-capacity polyethersulfone (PES) capsule filter connected with Masterflex C-Flex tubing, and frozen at −20 ∘C until analysis. Sediment was retrieved from the seafloor by a 0.1 m2 van Veen grab, sampled with 50 mL push core and frozen at −20 ∘C until analysis. Porewater was extracted by centrifugation of defrosted sediment and then analyzed immediately. Dissolved nutrients in water and porewater (ammonia (NH3), nitrate + nitrite (NOx), orthophosphate (), and silica (SiO2)) were measured at the Core Facilities Laboratory at The University of Texas Marine Science Institute in Port Aransas, Texas, on a continuous-flow analyzer Lachat Quick Chem 8500.
Table 1Calibration and reference bottle data for SeaFET. Propagated uncertainty, for each bottle, and the calculated total pH uncertainty value as overall average (in bold).
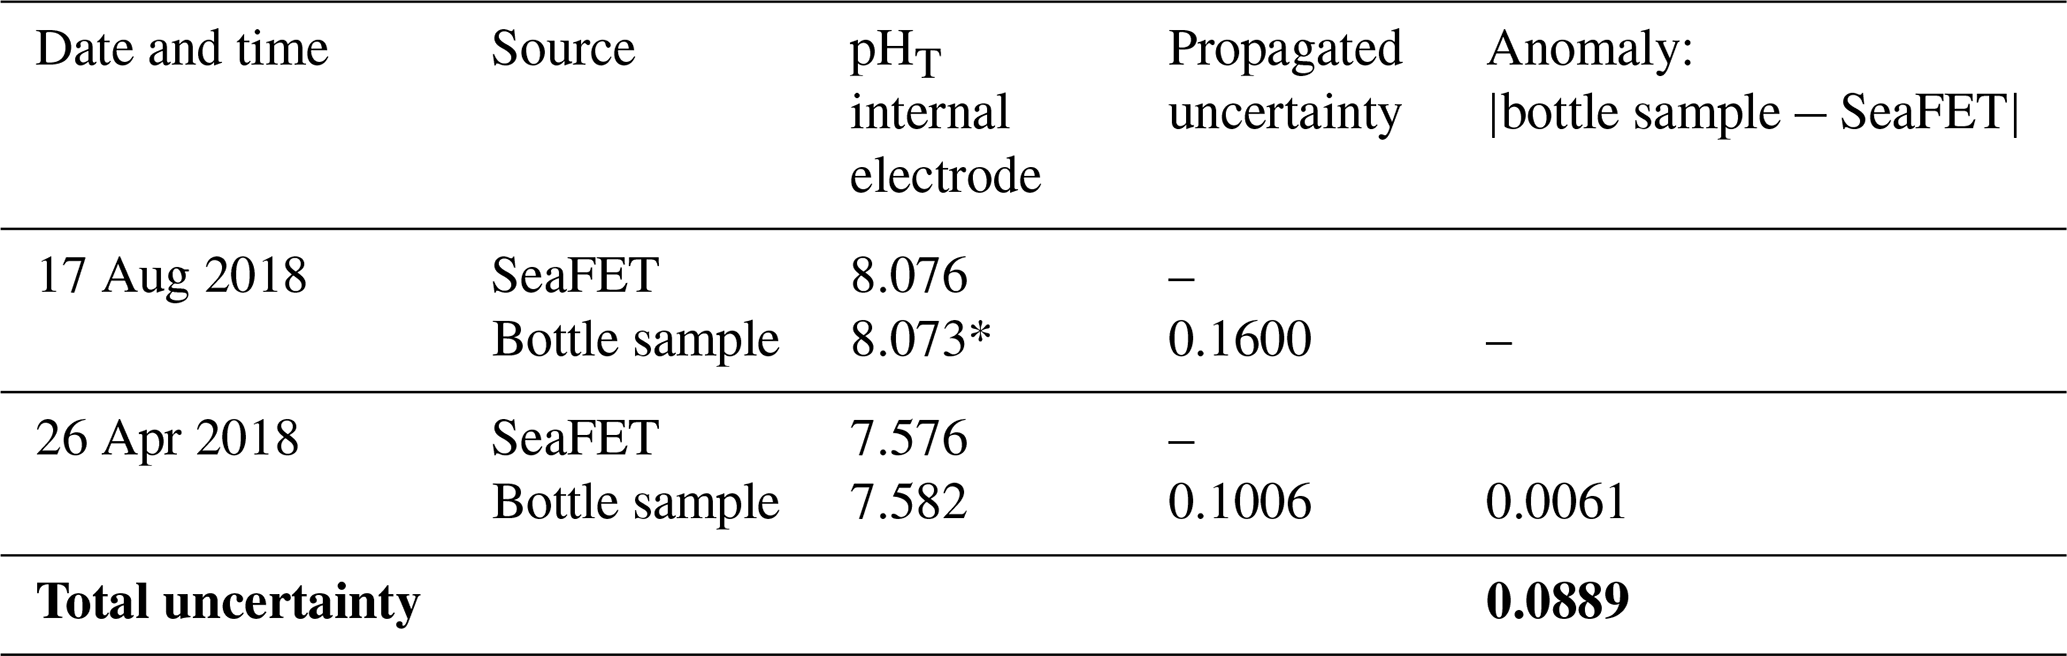
Value marked with * indicates the calibration bottle sample.
2.3 Seawater chemistry and pH sensor calibration
Discrete bottle samples were taken approximately 10 cm off the bottom proximal to the sensor on 17 August 2018 for SeaFET calibration and 26 April 2019 for reference. Bottle samples were collected in duplicate and processed for total alkalinity (AT) and pHT (total scale). An additional AT sample was collected on 21 June 2019. The August 2018 sample was gathered by Van Dorn bottle, where a single sampling was used to fill duplicate bottle replicates. April 2019 duplicate samples were directly collected from depth by a peristaltic pump fitted with Masterflex C-Flex tubing. All seawater samples were placed in 500 mL borosilicate bottles and fixed with 200 µL saturated mercuric chloride and held at 4 ∘C until laboratory analysis.
AT was measured with an open-cell titrator using 0.1 M hydrochloric acid titrant on a Metrohm Titrino 848 (Dickson et al., 2007: SOP 3b). Spectrophotometric pHT measurements were made in duplicate using a Shimadzu 1800 outfitted with a cuvette temperature controller stabilizing temperature at 25 ∘C. The spectrophotometric pHT was determined using m-cresol purple (Acros, batch no. 30AXM-QN), following SOP 6b from Dickson et al. (2007). An impurity correction factor of the m-cresol reagent was used to adjust the final measured pHT value (Douglas and Byrne, 2017). All benchtop salinity measurements were conducted with a YSI 3100 conductivity meter. Certified Reference Material of seawater (CRM: Batch 172, A.G., Dickson, Scripps Institute of Oceanography) was used to calculate the AT and m-cresol dye uncertainty. Calibration and reference in situ pHT samples were derived using the MATLAB version of CO2SYS (van Heuven et al., 2011) with input parameters salinity, temperature (from thermistor), pHT, and AT using carbonic acid dissociation constants from Lueker et al. (2000), the bisulfate dissociation constant of Dickson et al. (1990), and the boron constant from Uppström (1974). Given the broad spectrum of salinity values and low temperatures in this study, potential uncertainties may be present and difficult to quantify. Dinauer and Mucci (2017) found that dissociation constants derived by Cai and Wang (1998) were best applied to low-salinity waters when estimating pCO2, whereas Lueker constants overestimated values by 40 µatm. Conversely, Sulpis et al. (2020) found that at low temperatures (< 10 ∘C) Lueker constants underestimated and constants, resulting in pCO2 values ∼ 20 µatm lower. Given the mostly compensatory nature of salinity and temperature, the Lueker constants provide a medium estimate for the purposes of this study when calibrating across the entire time series.
A SeaFET conditioning period of 9 d was conceded from deployment on 8 August 2018 to 17 August 2018 when the calibration sample was collected. A single-point calibration was applied following previously established best practices (Bresnahan et al., 2014; Miller et al., 2018). New calibration coefficients for the SeaFET were then applied and used to calculate pHT from the internal ISFET electrode for the entire dataset (Martz et al., 2010). The single reference sample taken on 26 April 2019 was used to compare against SeaFET-measured pHT as a check for sensor drift and robustness of calibration.
2.3.1 Uncertainty estimate
The reliability and accuracy of SeaFET sensors are dependent on estimating the total uncertainty attributable to an individual sensor's behavior and operator usage (Bresnahan et al., 2014; Rivest et al., 2016; McLaughlin et al., 2017; Gonski et al., 2018; Miller et al., 2018). A previous method for calculating the total uncertainty associated with SeaFET function has been previously proposed and was applied to this study (Miller and Kelley, 2021). Briefly, a propagated uncertainty (Eq. 1) was derived by adding in quadrate the SD of analytical replicates measuring CRM pHT spectrophotometrically, a titrator uncertainty comparing measured and known AT from CRM, the SD of discrete pHT bottle replicates, and the uncertainty associated with CO2SYS dissociation constants using the MATLAB errors function described in Orr et al. (2018). An additional salinity uncertainty not described in Miller and Kelley (2021) was added to account for the discrepancy between benchtop salinity measurements and in situ readings found in this study (Table S1 in the Supplement). The final equation reads
where Q is the propagated uncertainty, AN is the anomaly between measured and known AT, and σ is the SD of all uncertainty input parameters in pH units (see Miller and Kelley, 2021). From this point, the total uncertainty was calculated by taking the average of the propagated uncertainties for the calibration sample, reference sample, and bottle anomaly (Table 1). This propagated uncertainty was then applied to the entire pHT time series.
2.4 Ancillary data acquisition
The Beaufort Lagoon Ecosystems LTER data on current velocity, water depth, and underwater PAR were accessed through the Environmental Data Initiative portal. Current velocity was used as a proxy to determine the open and closed (i.e., ice-covered or ice-free) seasons for the lagoon. A velocity consistently below 2 cm s−1 for a period > 10 h was designated as a threshold for the two phases (Fig. S1 in the Supplement). Water depth derived from the pressure sensor was interpreted as tidal variation, where consistent frequencies in depth changes were applied for analysis (see Sect. 2.5). Instantaneous PAR measurements were used to determine daily average values for time series analysis.
2.5 Frequency analysis
A power spectral density (PSD) analysis of pHT, temperature, salinity, and tide was performed using the pwelch function in MATLAB (v2020a) to determine the magnitude of variation at a given frequency during each phase: open in 2018, closed in 2018/19, and open in 2019. This function processes data as samples per second; so for 24 measurements in a day, a sampling rate of 2.78 × 10⁻⁴ was applied. A Hamming window was used for side lobe attenuation (i.e., adjusting width of main peak) of the analyses, and the mean value for each parameter was subtracted in order to examine only the variation around the mean. Residual noise around a frequency of zero was muted by applying a Butterworth high-pass filter with an order of 3 and cutoff frequency at 1.0 × 10⁻⁵. If two of the analyzed variables exhibit the same predominant frequency, then their variation is assumed to be correlated regardless of direction and magnitude. Previous PSD analyses with similar parameters have been shown to be considerably noisy below ∼ 50 dB Hz−1, thus making this value a cutoff threshold for the purposes of this study (Miller and Kelley, 2021). Frequency peaks corresponding to 1 and 2 d−1 are likely a response to the semidiurnal tidal cycle, while a frequency of 3 d−1 corresponds to daily changes in PAR.
2.6 AT, pCO2, and flux calculations
Salinity recorded by the RBR Concerto CTD was filtered for invalid measurements taken over the year-long time series. Erroneous data (below the freezing point of water as defined by the temperature–salinity relationship) were removed, and a linear interpolation was performed to replace the missing values (Fig. S2). Two linear regression analyses were performed to estimate AT, one with measured in situ salinity and the other with benchtop recorded values. Each analysis was constructed with the three discrete AT samples collected on 17 August 2018, 26 April 2019, and 21 June 2019 (Table S1), where AT is the dependent variable and salinity the independent variable. Benchtop values were considered to be more robust as the YSI 3100 conductivity meter was calibrated to the manufacturer's specification, while the CTD was factory calibrated. For this reason, the regression from the benchtop salinity measurements was considered to be the primary hourly AT value; however, both AT estimates from benchtop (slope = 59.71, R2 = 0.968) and in situ (slope = 48.38, R2 = 0.998) salinity were used as input parameters along with measured pHT to calculate hourly pCO2 values (Fig. S3) using CO2SYS (see above for constants applied).
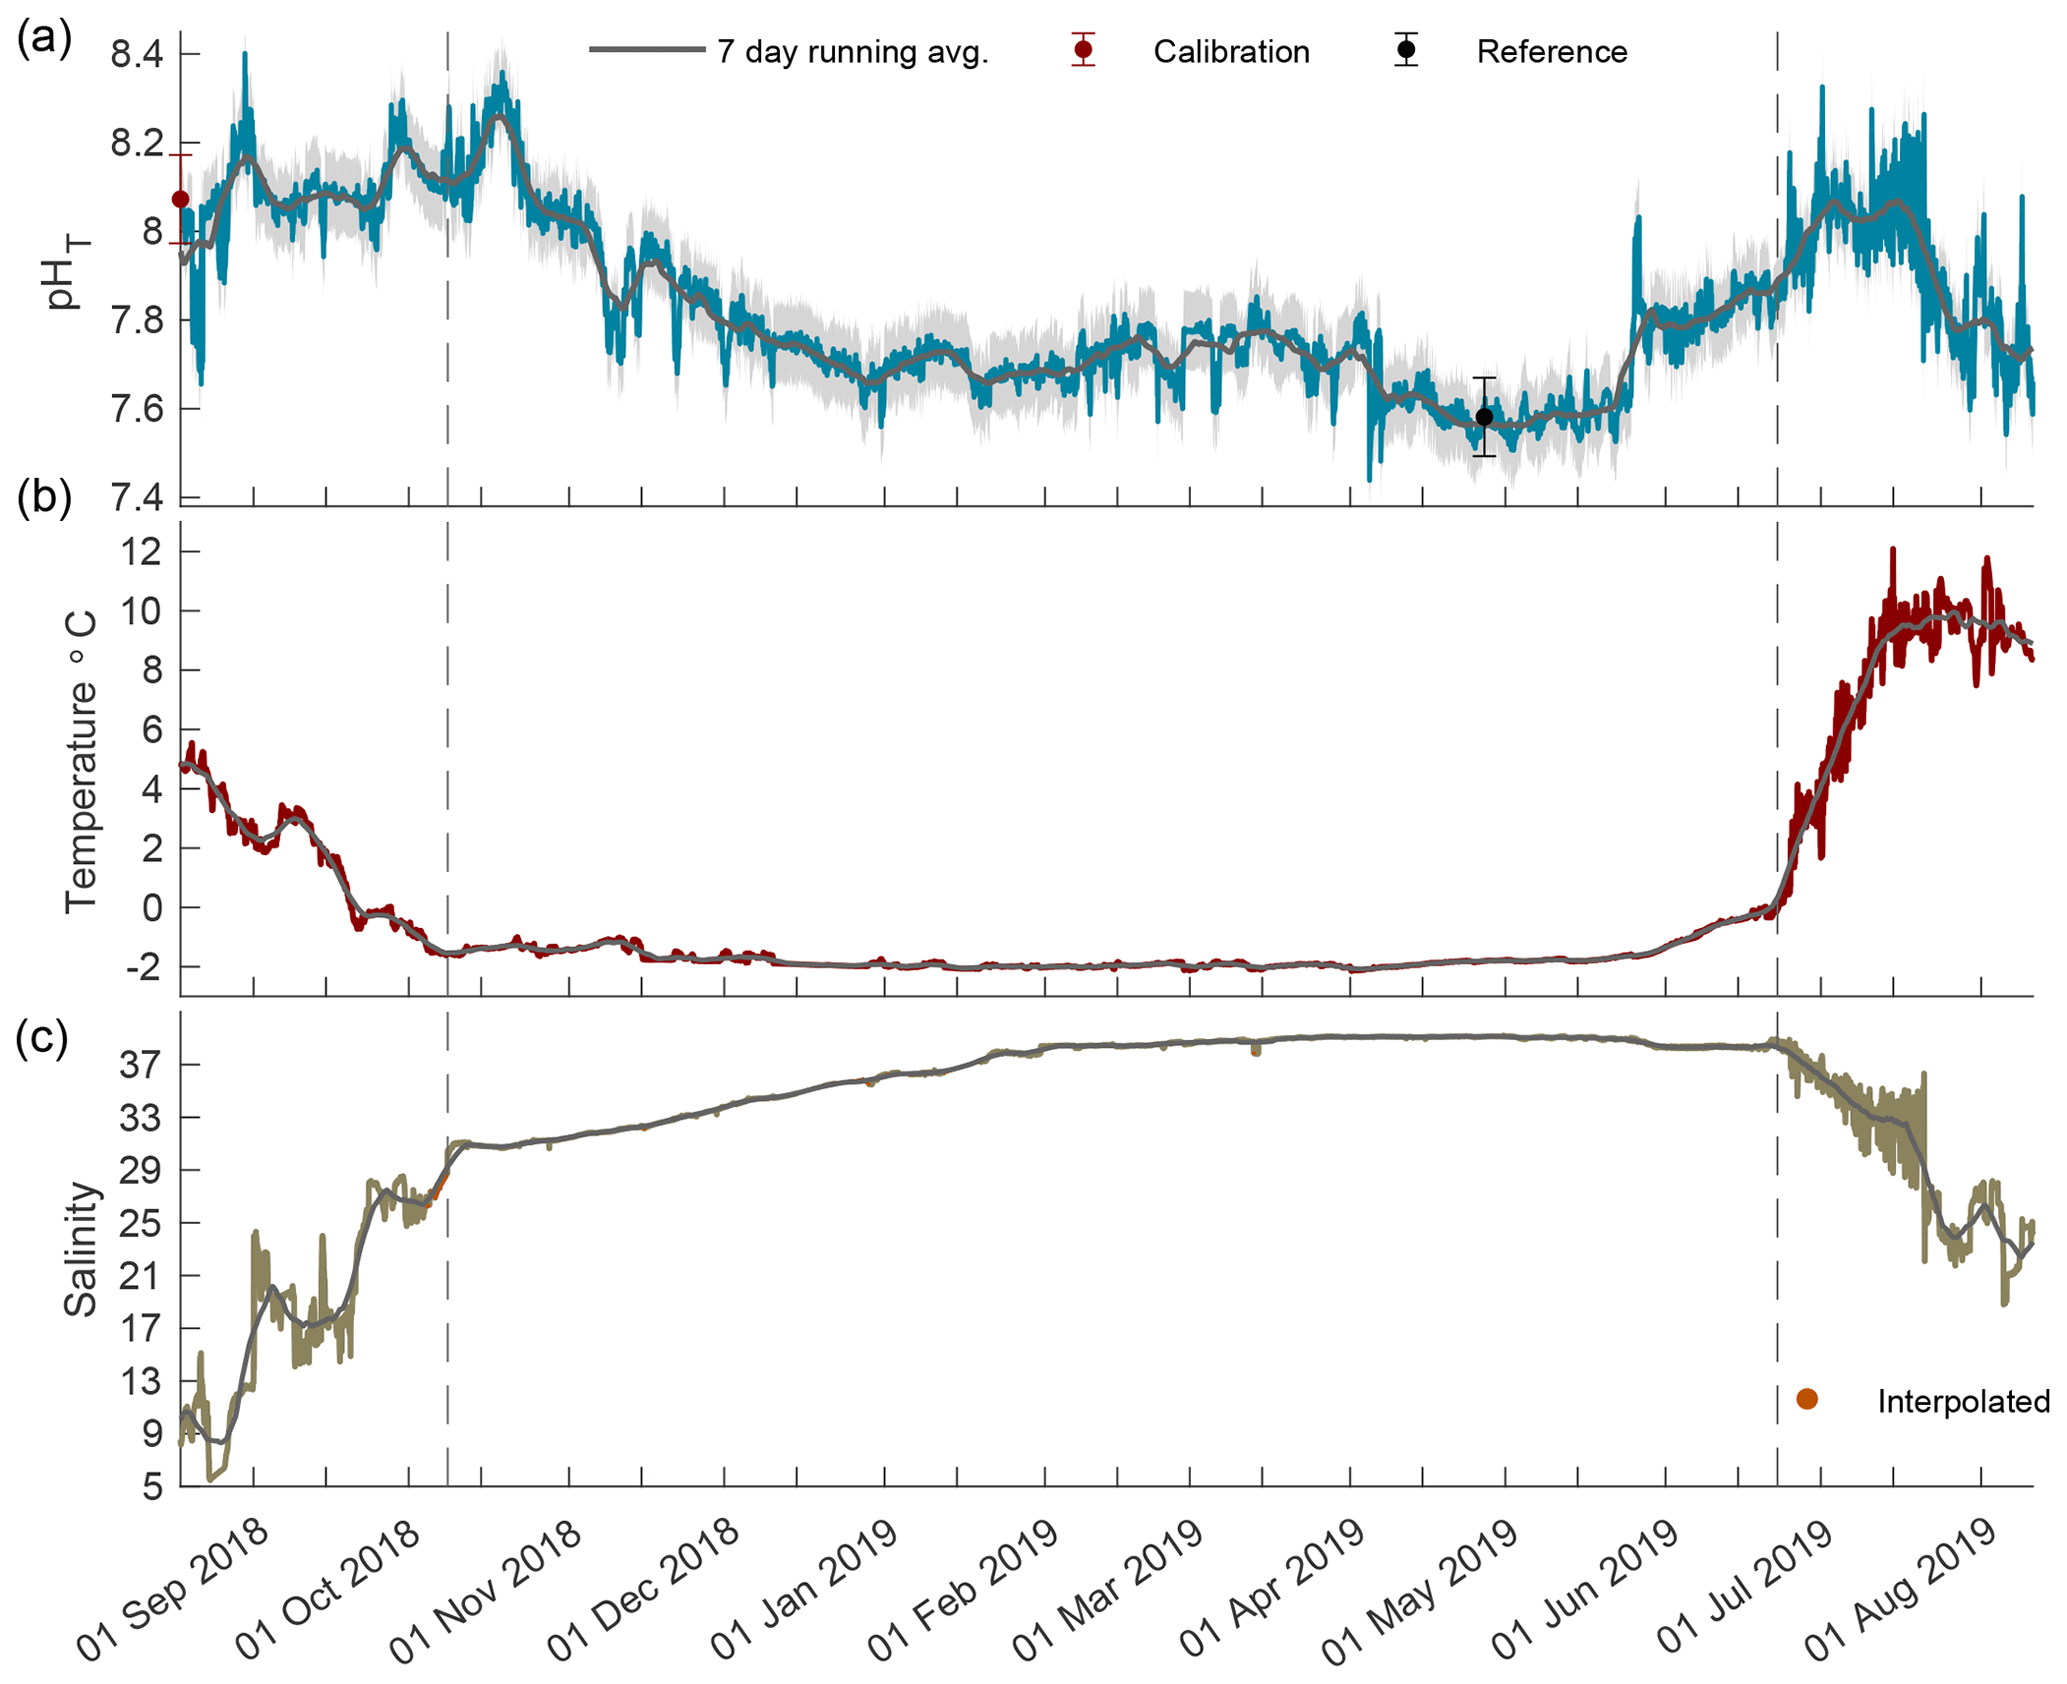
Figure 2Times series of pHT (a), temperature (b), and salinity (c) in Kaktovik Lagoon for the entire deployment period from 17 August 2018 to 11 August 2019. The first section to the left of the dashed line is the 2018 open phase, the middle section is the 2018/19 closed phase, and the last section to the right of the second dashed line is the 2019 open phase.
Atmospheric hourly pCO2 averages were collected from the NOAA ESRL station at Utqiaġvik (formerly known as Barrow), Alaska, USA (Thoning et al., 2020), and wind speed was acquired from automated airport weather observations from the Barter Island Airport. Using these data, a CO2 air–sea flux for the 2018 and 2019 open phases was calculated following the bulk transfer method with a gas transfer velocity constant k as modified by the Schmidt number (i.e., ratio of kinematic viscosity of water to gas diffusivity), which is a function of temperature and salinity. The bulk flux equation in Wanninkhof (2014) was used for the estimate:
where U is wind speed in m s−1, is the Schmidt number calculated using the coefficients from the fourth-order polynomial in Wanninkhof (2014: Table 1), K0 is temperature- and salinity-dependent solubility of CO2 in calculated following the model presented in Wanninkhof (2014: Table 2), and pCO2 is the partial pressure of CO2 in water (w) and air (a) in atm. The uncertainty applied to the flux estimates is defined as the flux potential given the broad spectrum of salinity and how it affects the gas transfer velocity and the AT estimates derived from the in situ and benchtop measured salinity values. The flux potential uncertainty was chosen because the values estimated were equal to or more extreme than those identified from the total uncertainty of the pH measurements, if the total pH uncertainty was applied as a proportion to the AT-derived values. Since the Schmidt number is a function of temperature and salinity, a freshwater value was derived using the fw coefficients presented in Wanninkhof (2014). This estimate provided a more conservative flux and was, therefore, presented as the lower-bound uncertainty in the estimate. The upper-bound uncertainty of the flux estimate was calculated by applying the pCO2 values to Eq. (2) derived from the salinityin situ–AT regression. These values resulted in a larger flux estimate, which is why they were set as the upper bound. Both the lower and upper bounds were then applied as the estimated total uncertainty flux potential.
2.7 Statistical methods and data manipulation of pH covariates
Relationships between pHT and salinity were correlated by applying a second-order polynomial fit for the 2018/19 closed phase and 2019 open phase with salinity as the explanatory variable. This included detrending pHT and reexamining relationships with salinity for the 2018 open phase where no correlation was found. Linear regression between temperature and pHT was performed for each phase of the time series. pHT and PAR hourly variations were collapsed by calculating the daily averages for both parameters. The average daily values for pHT open 2018 and 2019 were then detrended to remove correlations with salinity and any potential covariates not captured in this study. A Pearson's correlation coefficient was than derived between the detrended pHT daily averages and PAR daily averages for the 2018 and 2019 open phases.
3.1 Time series
The year-long time series of pHT, temperature, and salinity was recorded from 17 August 2018 to 11 August 2019 (Fig. 2). Based on the current velocity threshold of 2 cm s−1 as a proxy for sea ice cover, the 2018 open phase transitioned to a closed phase on 8 October 2018, which terminated on 22 June 2019 as the 2019 open phase began (Fig. S1). Both calibration and reference samples that were collected in duplicate have a fairly high SD at 0.099 and 0.088, respectively. The large deviation between duplicate samples was the greatest source of uncertainty (see Eq. 1) for the entire pHT time series, which shows the total uncertainty shaded in gray (Fig. 2a) and found in Table 1. Invalid salinity values were ∼ 6 % of the entire time series, with the greatest proportion of interpolated values concentrated in the closed phase (Fig. 2c).
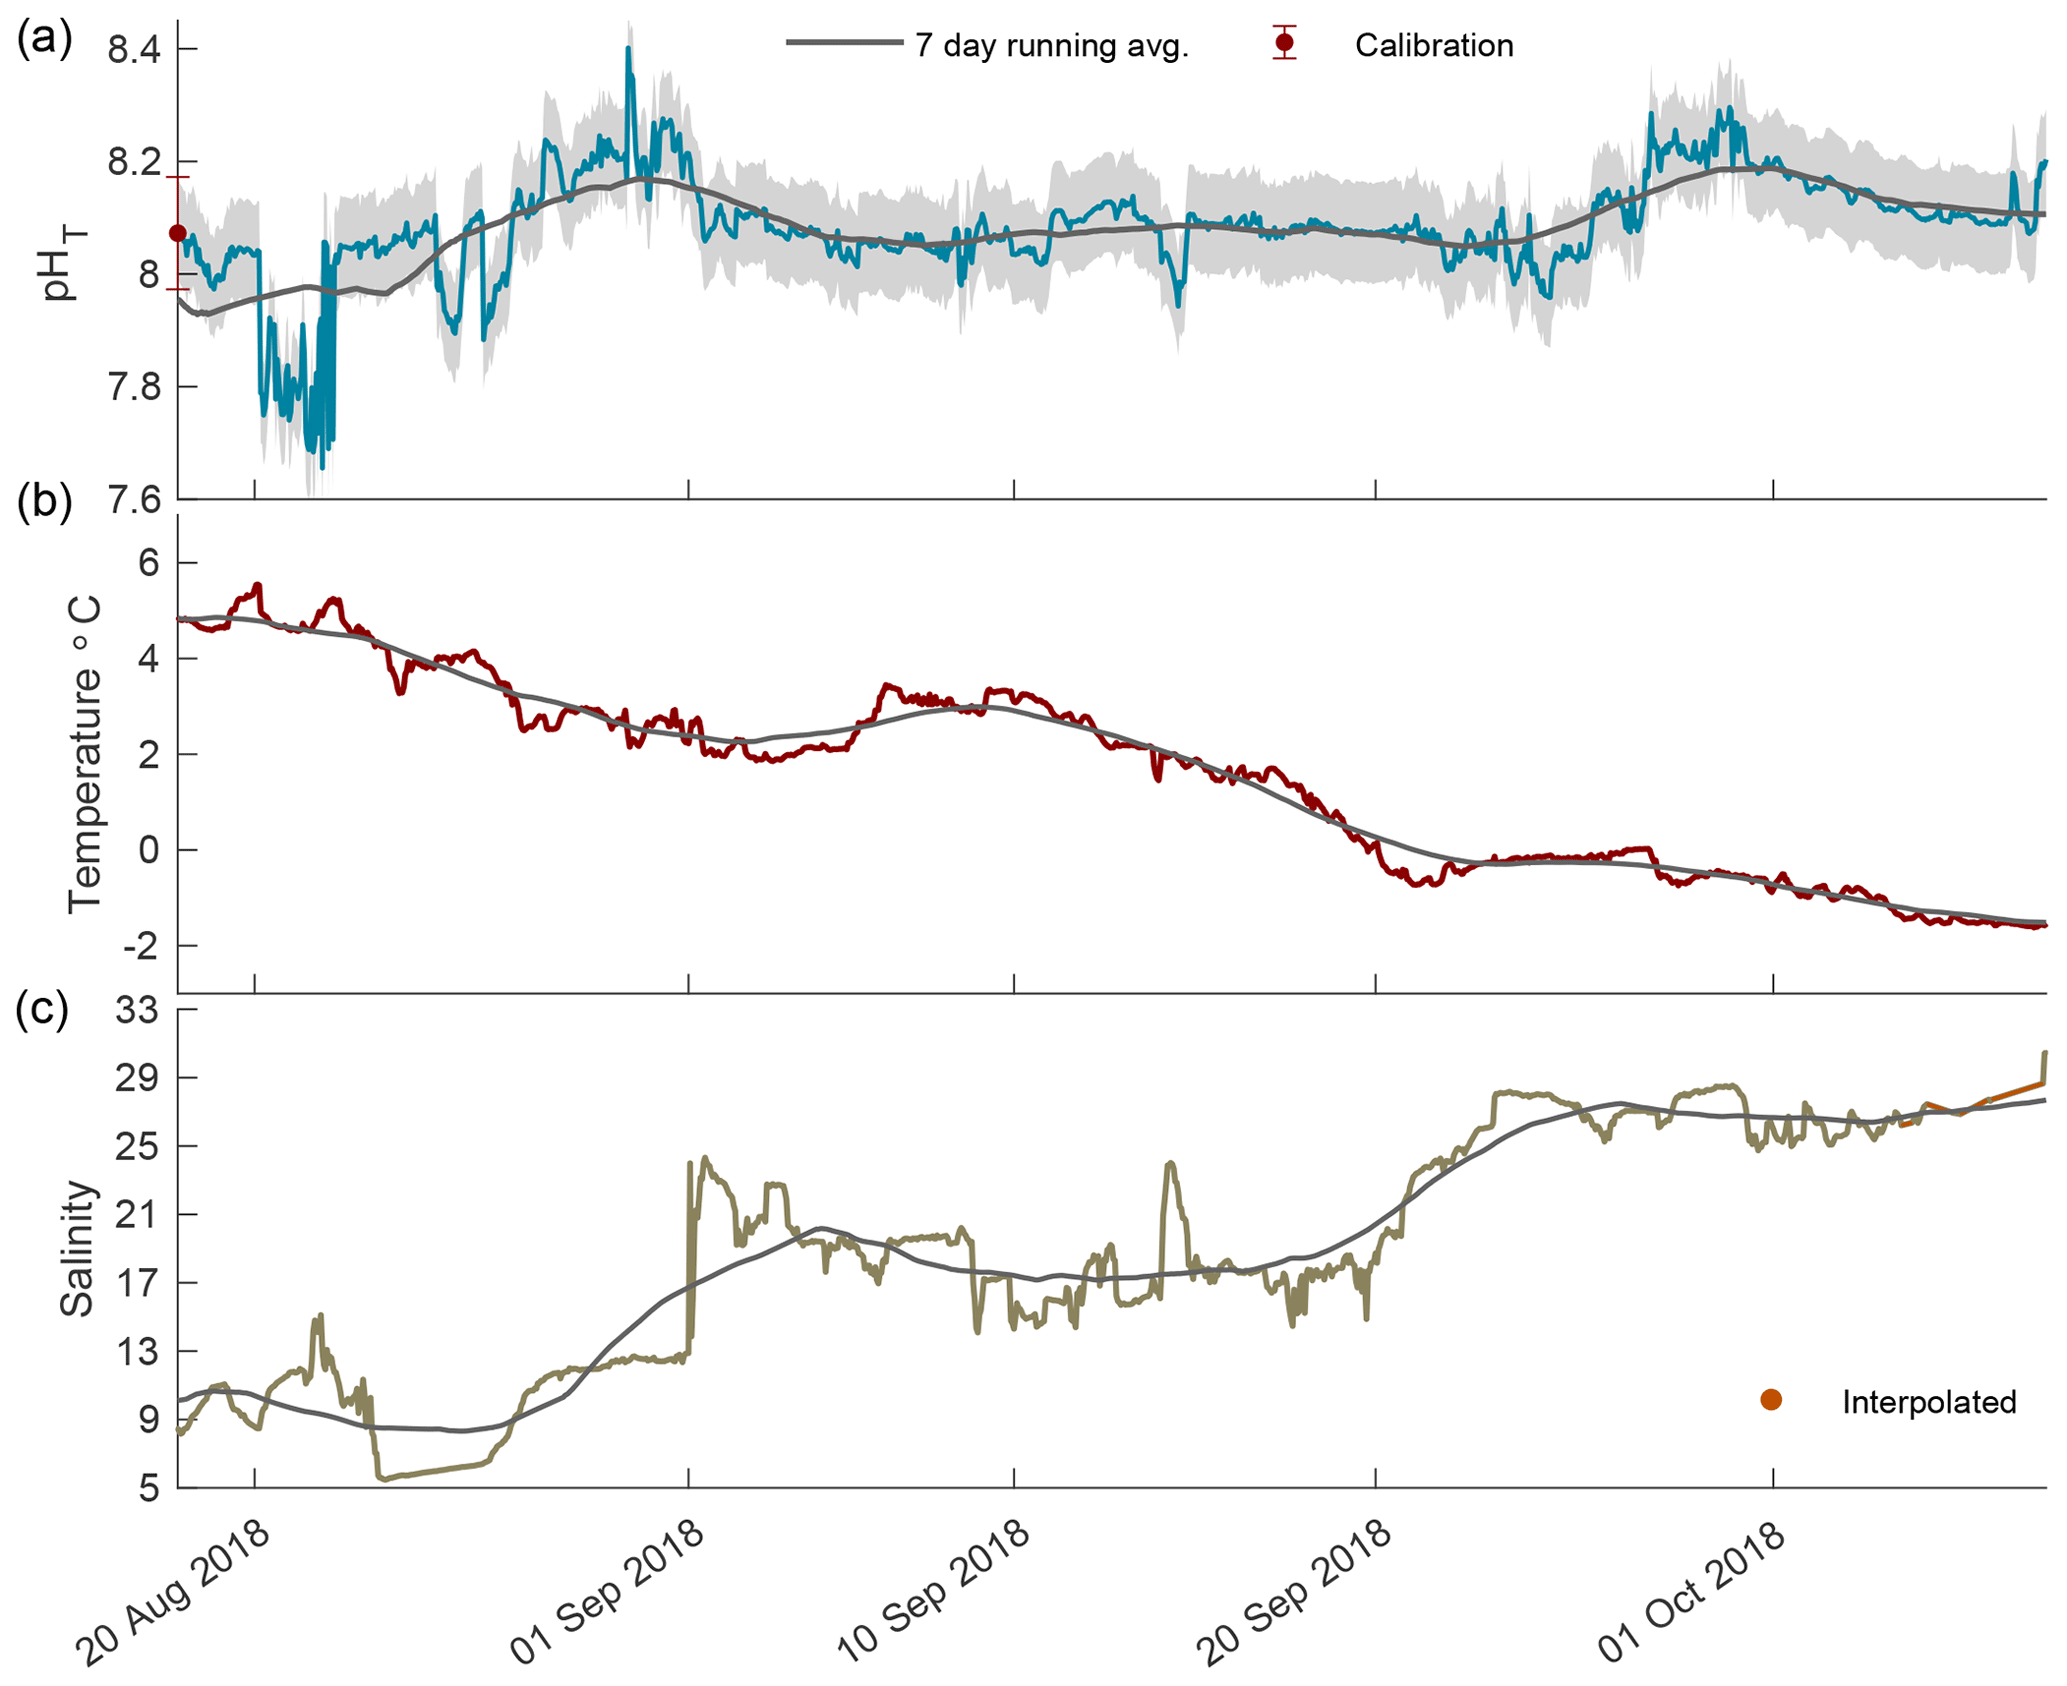
Figure 3The 2018 open-phase time series of pHT (a), temperature (b), and salinity (c) in Kaktovik Lagoon.
In the open phase of 2018 pHT values were highly variable in August, ranging from 7.66 to 8.40, which was the highest pHT recorded for the entire calendar year (Fig. 3a). An upward trend in pHT began on 21 August and steadily increased, indicating a continued accuracy of the internal ISFET at low salinity. The low-episodic-salinity event when values were < 9 occurred from 23 August to 27 August 2018, which was after the sporadic variability in pHT days earlier (Fig. 3). From September until freeze-up on 8 October, pHT variability was low, with the 7 d running average staying at ∼ 8.10 and fluctuating between 8.07 and 8.18. Temperature followed a steady decrease with a negative slope of 0.12 (Fig. 3b). Salinity rose steadily, although instances of large episodic events were present, and in one instance on 1 September, salinity increased from 12.9 to 23.1 in an 8 h period (Fig. 3c).
Figure 4The 2018/19 closed-phase time series of pHT (a), temperature (b), and salinity (c) in Kaktovik Lagoon.
During the closed phase when Kaktovik Lagoon first became ice-covered, pHT continued to remain somewhat invariant around ∼ 8.10 as it did during the previous two open-water months (Fig. 4a). Approximately 2 weeks into the closed phase, pHT began to steadily decrease until stabilizing in the beginning of January at ∼ 7.71. pHT varied between 7.55 and 7.85 from this point until April when another negative trend culminated at a low of 7.48. Late May saw pHT levels increase until phase transition on 22 June 2019. Temperature stayed below −1 ∘C until late May when it began to increase concomitantly with pHT approaching 0 ∘C (Fig. 4b). Salinity values increased from 31 at the start of ice cover, reaching a maximum of 39.2 in April (Fig. 4c).
Figure 5The 2019 open-phase time series of pHT (a), temperature (b), and salinity (c) in Kaktovik Lagoon.
The 2019 open phase saw extreme pHT variability from 21 June to 11 August 2019 with the rate of hourly change reaching as high as 0.467 units from 7.78 to 8.26 in mid-July (Fig. 5a). During the first portion of this phase, the pHT running average was consistent at ∼ 8.05 with minimal variability. Episodic fluctuations caused pHT values to reach as high as 8.33. A negative trend began in late July, shifting the running average to ∼ 7.79, which was lower than the 7.94 running average in August 2018. Temperature increased rapidly during the first 2 weeks following breakup and then remained stable around 10 ∘C (Fig. 5b). Salinity decreased steadily for the first month after breakup followed by large episodic freshening events in late July (Fig. 5c); these were similar to the events seen in the open phase of 2018.
Figure 6pHT–salinity correlations for 2018 open (a), 2018/19 closed (b), and 2019 open (c) phases. Quadratic fits are applied to 2019 iced and open phases only. Temperature is represented in color for all correlations.
Correlations between salinity and pHT were inconsistent and varied by phase. The 2018 open-phase pHT was not correlated with salinity, which ranged from 5 to 30, while pHT was predominantly steady, shifting only ± 0.1 units around 8.0 (Fig. 6a). A weak negative correlation between temperature and pHT existed (R2 = 0.19); however removing this trend did not result in changes between salinity and pHT. The maximum range of pHT during this period was confined to salinity values between 11.5 and 12.5. During the closed phase, pHT correlated well with salinity, which ranged from ∼ 30 to 40 (Fig. 6b). An inverse relationship between salinity and pHT was present during this phase with an R2 of 0.69. The opposite pattern was observed during the 2019 open phase, however, where salinity and pHT were positively correlated with an R2 of 0.66 (Fig. 6c). Overall, the temperature relationships with salinity were due to seasonal timing rather than intrusion of water mass or mixing. Smoothed data such as 7 d running averages between pHT and temperature and pHT and salinity did not reveal any significant correlations.
Figure 7Power spectral density (PSD) plots for pHT (a–c), temperature (d–f), and salinity (g–i) at each phase of the time series: 2018 open (a, d, g), 2018/19 closed (b, e, h), and 2019 open (c, f, i).
3.2 Frequency of pH variability
The PSD of pHT during the 2018 open phase and 2018/19 closed phase was weak, with the majority of peaks around any given frequency falling under 50 dB Hz−1 (Fig. 7a and b). Peaks of pHT during the 2018 open phase did not correspond with any regular frequencies across temperature, salinity (Fig. 7), or tide (Fig. S4), which only displayed regular peaks at a frequency of 1 and 2 d−1. Consistent variability of pHT during the closed phase was negligible but had a maximum magnitude at a frequency of 0.39 which corresponded to a peak observed with temperature (Fig. 7b and e). The 2019 open phase had a multitude of peaks with frequencies ranging from 0.5 to 7.5 d−1; however most fell under 50 dB Hz−1 (Fig. 7c). The highest magnitude of pHT corresponded well with tide at ∼ 1 d−1 (Figs. 7c and S4c). Salinity also displayed a strong peak at 1 d−1 (Fig. 7i), sharing this frequency of variability with pHT and tide.
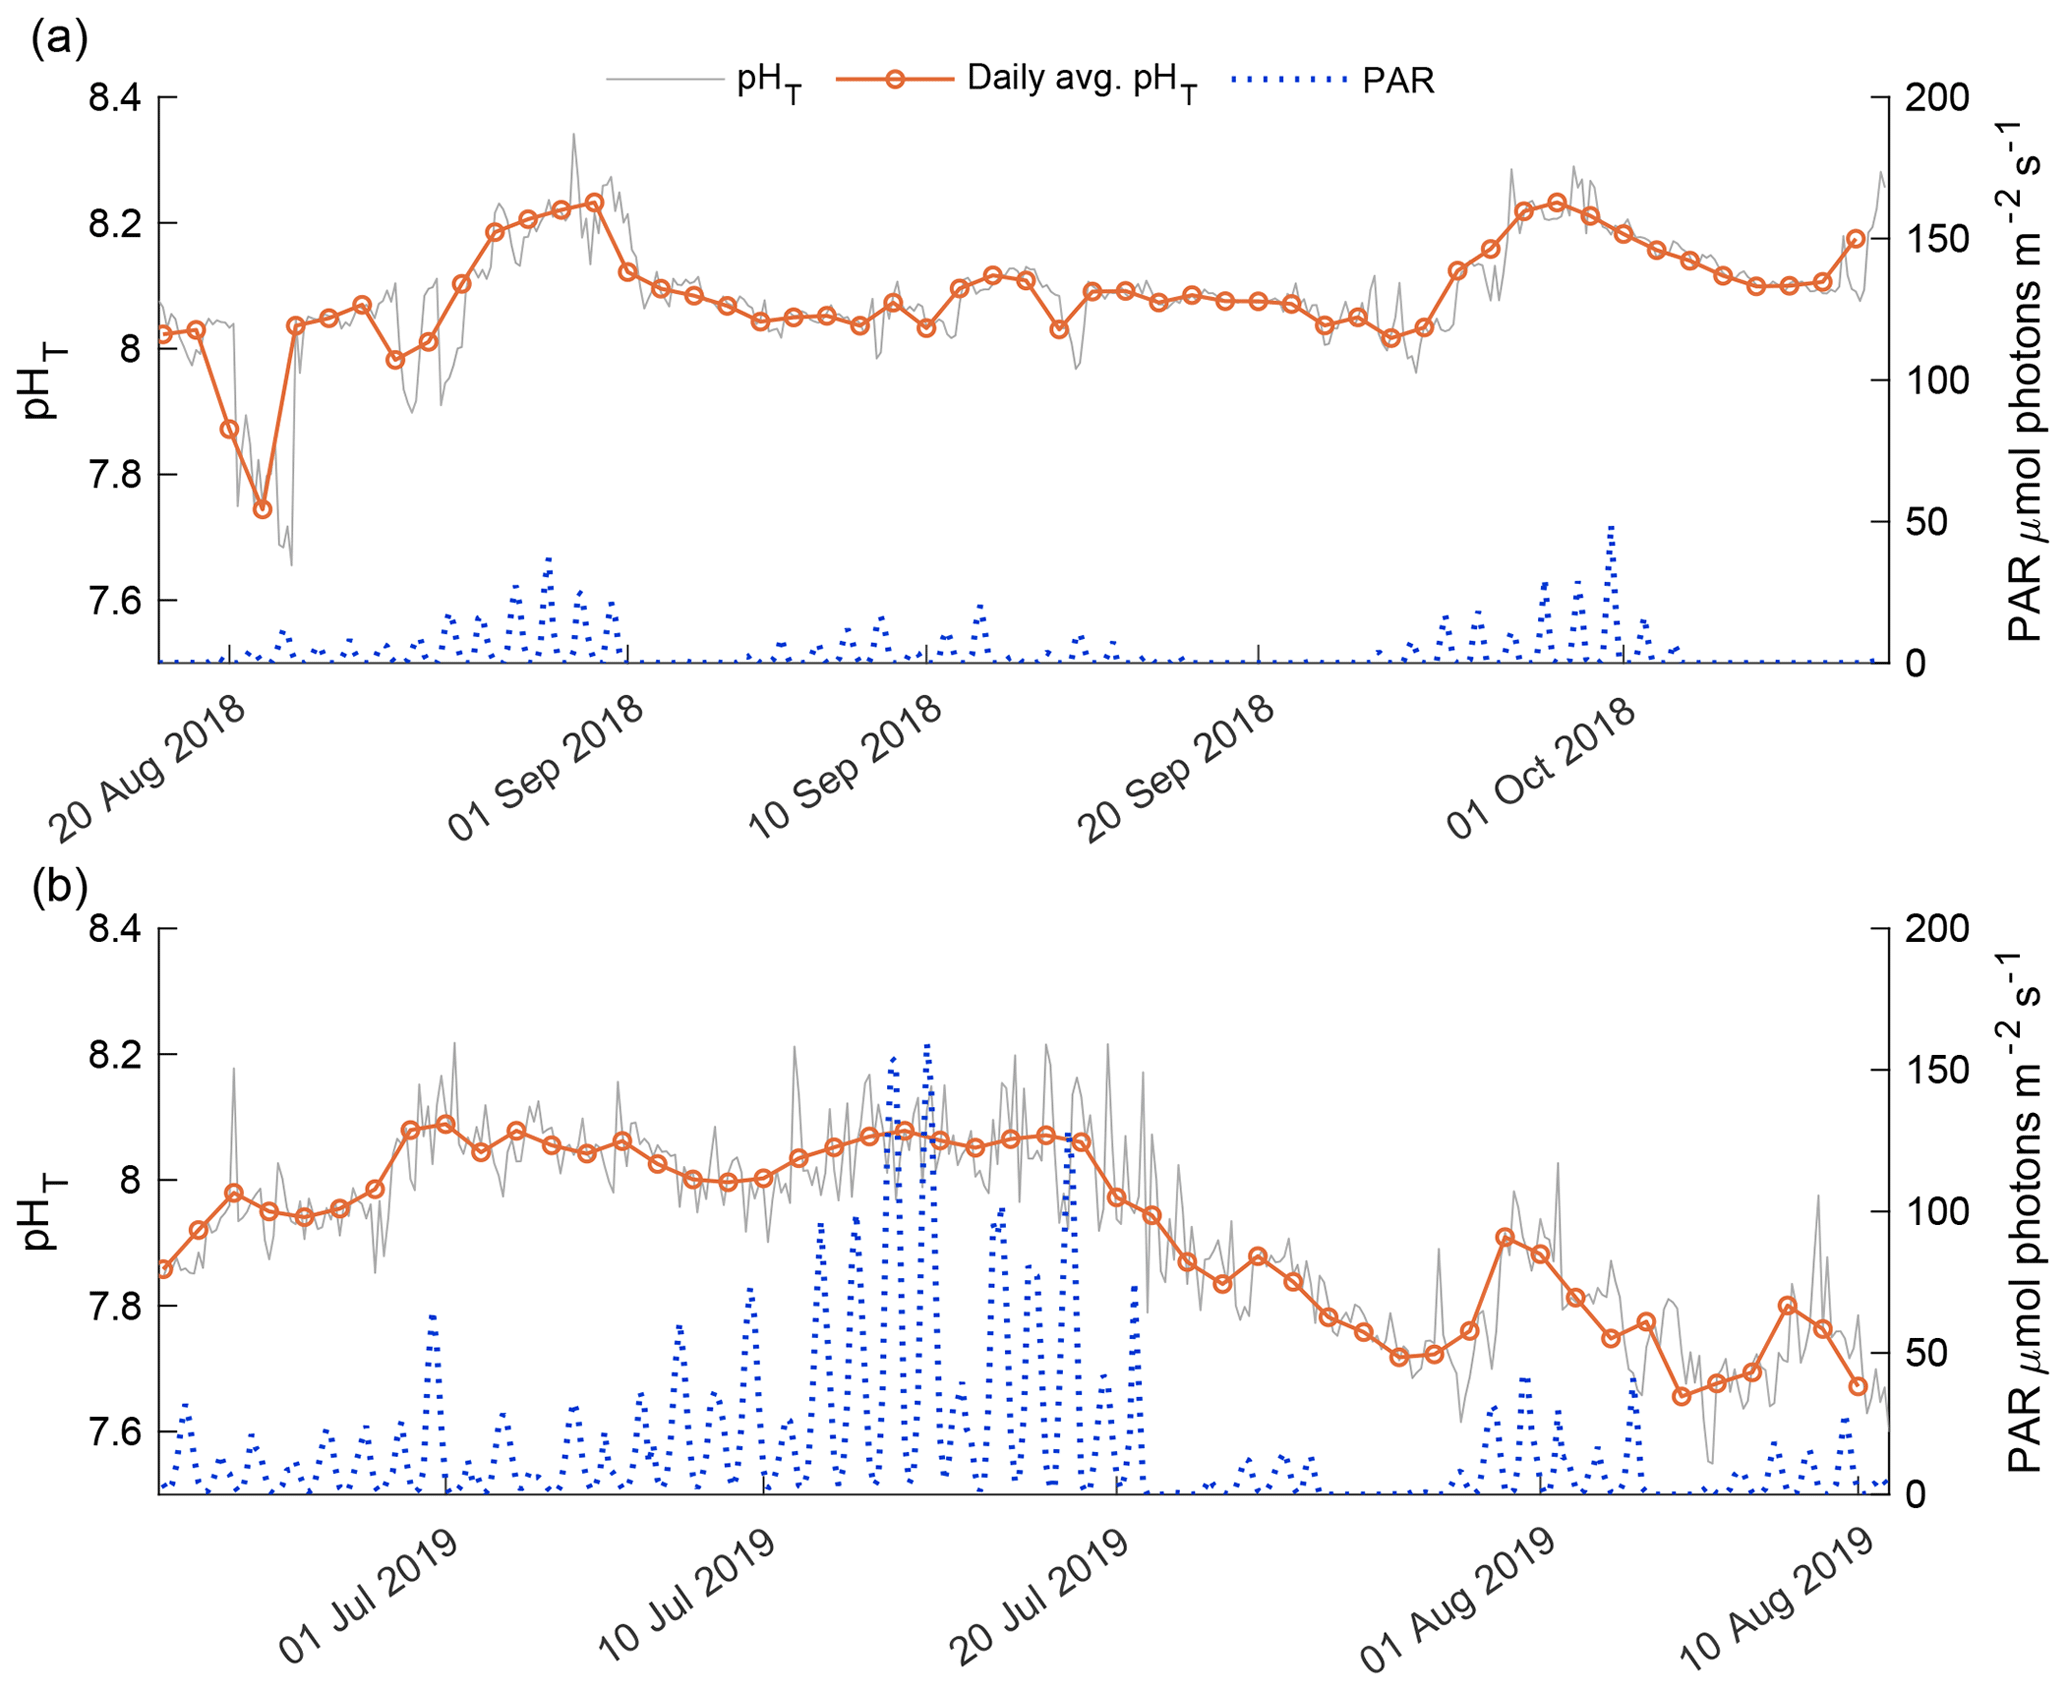
Figure 8Detrended pHT (gray line) and PAR (blue dots) for the 2018 open phase (a) and 2019 open phase (b). Daily average pHT (orange line) is displayed over the hourly variability.
3.3 pH response to PAR
The 2018 and 2019 open-phase daily average pHT was compared against instantaneous underwater PAR levels recorded for both phases (Fig. 8). The 2018 open-phase PAR levels were consistently lower compared to the 2019 open phase as a result of the time of year at which the two phases were observed (Fig. 8). The detrended daily average pHT correlated well with daily average PAR, with a Pearson's correlation coefficient of 0.469 (p value = 0.005). In early August 2018, PAR levels > 5 were not representative of high daily average pHT. This was a deviation from the general trend of the 2018 open phase in which daily average pHT was positively correlated with instantaneous PAR (Fig. 8a). In late August and September, high values of daily average pHT > 8.20 coincided with spikes in instantaneous PAR that exceeded 10 (Fig. 8a).
The 2019 open-phase daily average pHT was overall more variable than the 2018 open phase, with values from 7.66 in early August to 8.09 in late June (Fig.8b). The detrended daily average pHT had a more robust correlation with daily average underwater PAR than in 2018 with a Pearson's correlation of 0.643 (p value < 0.001). The highest PAR values were recorded in mid-July; however, this did not correlate with the highest daily average pHT which was observed in late June. Consistent high values of PAR in mid-July corresponded to relatively flat daily average pHT (Fig. 8b). A reduction in instantaneous PAR to values below 15 in late July was linked with a gradual decrease in daily average pHT. During this 11 d period, daily average pHT dropped from 8.06 to 7.71 and only began to increase again when instantaneous PAR exceeded 25 for consecutive days.
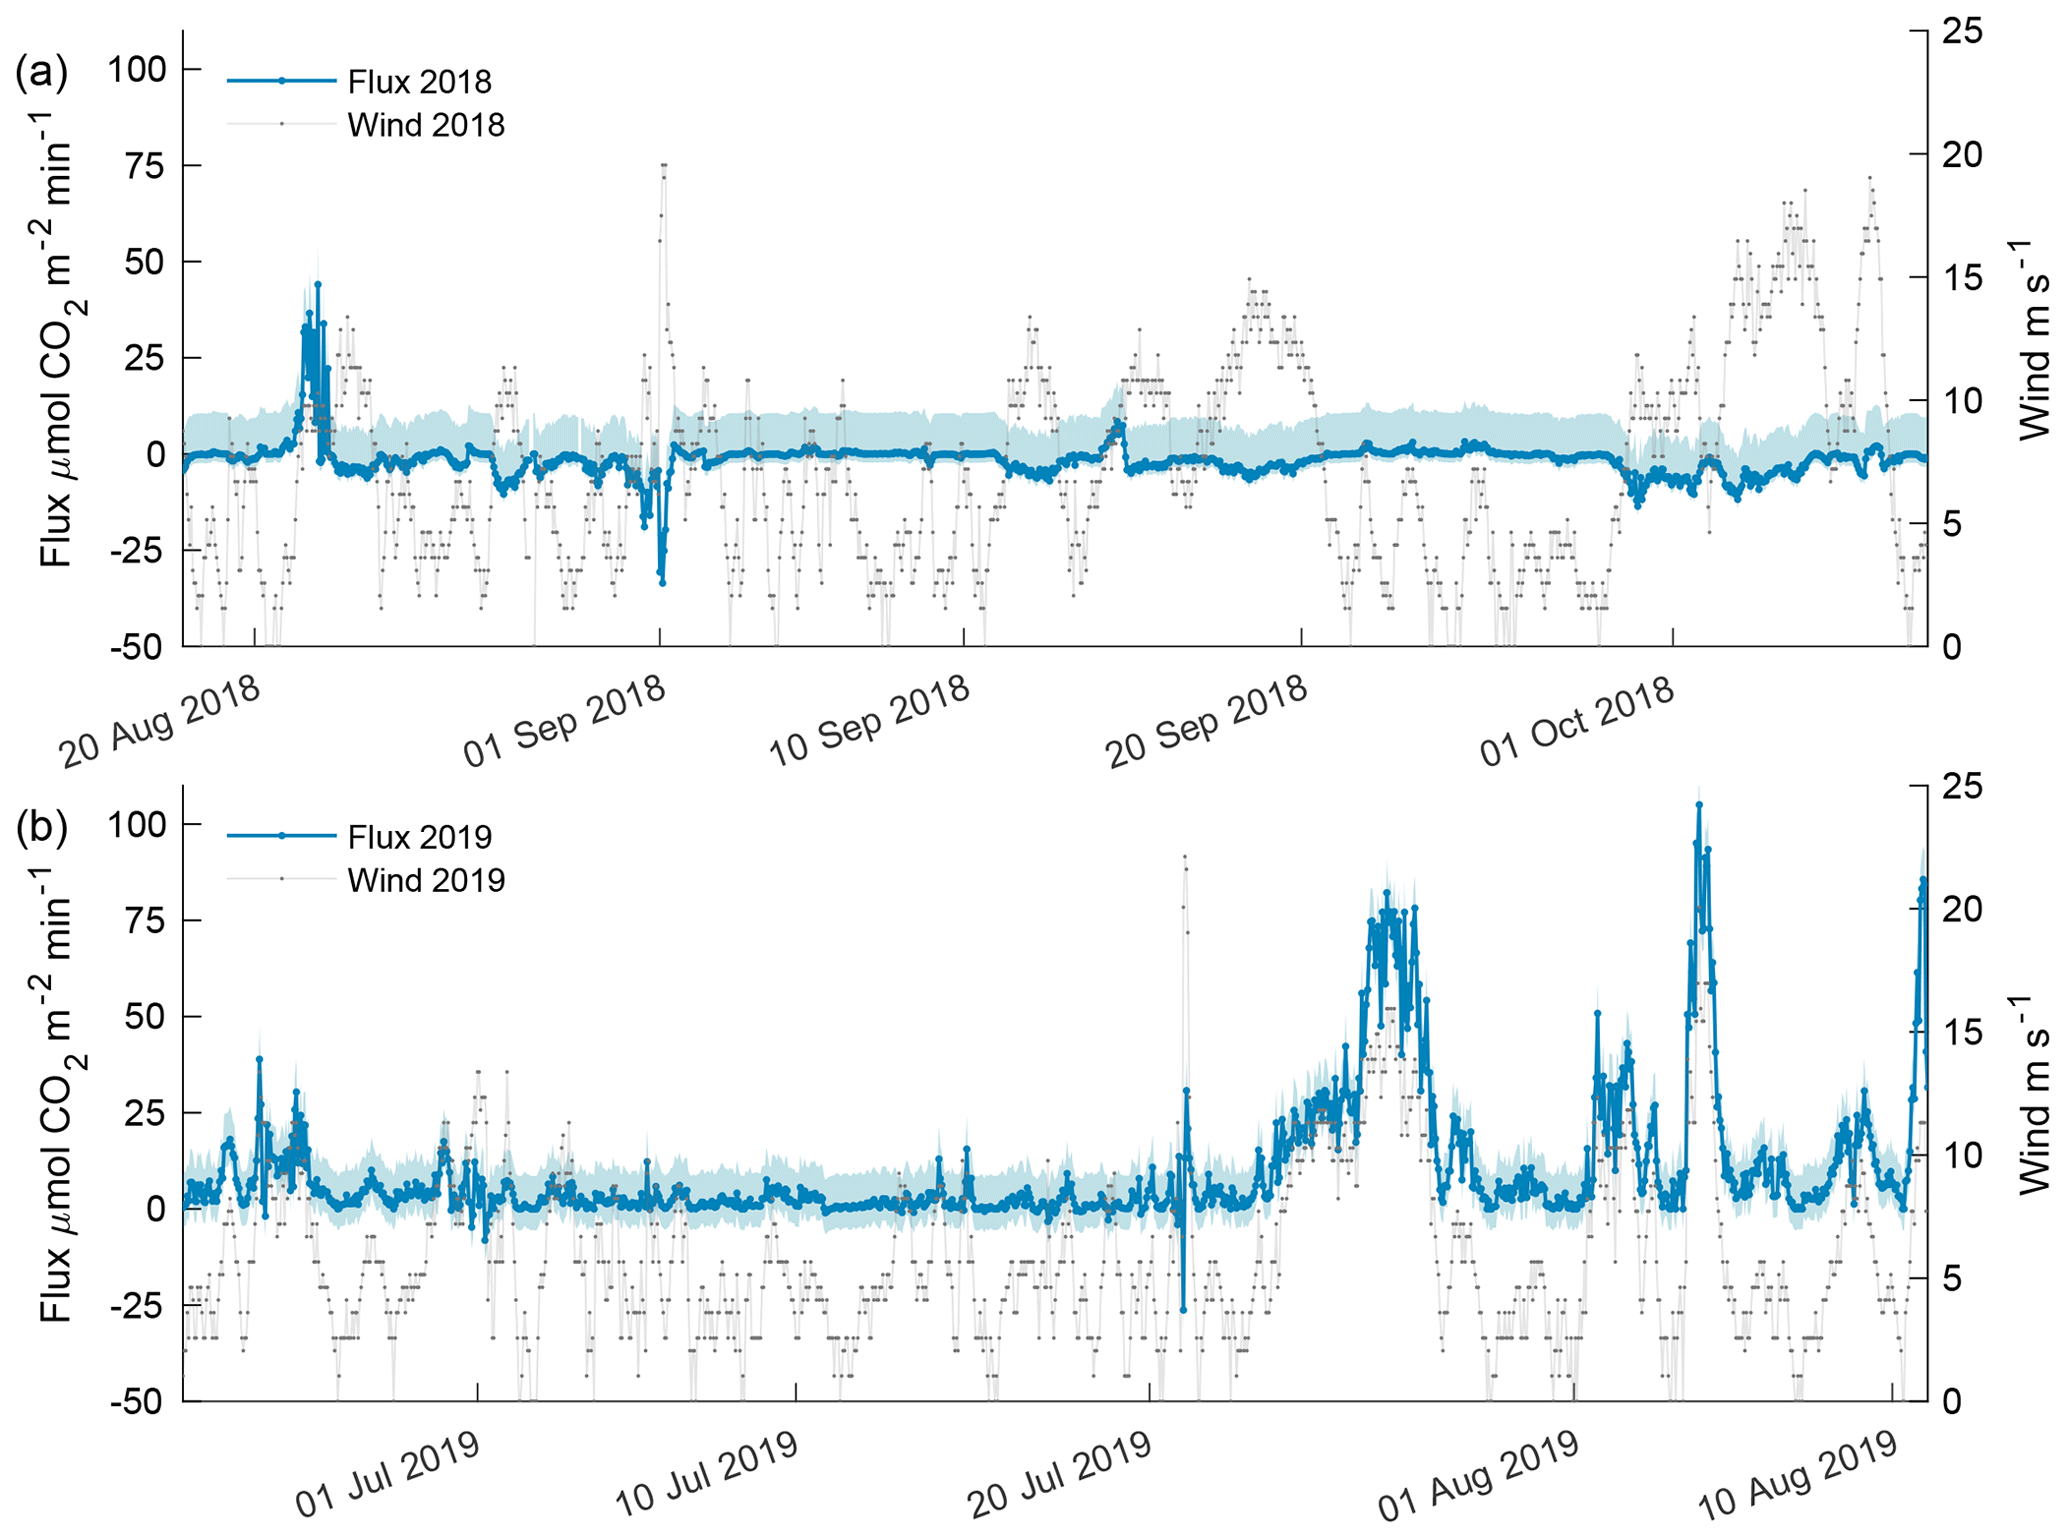
Figure 9Estimated carbon flux (orange) and wind speed (gray) for the 2018 open phase (a) and 2019 open phase (b). Estimated flux potential is shaded in blue where the upper bound is associated with the difference in pCO2 from the AT–salinityin situ regression, and the lower bound is associated with freshwater Schmidt number. The upper and lower bounds for the 2018 open phase were 10.67 and 2.23 while 2019 open-phase upper and lower bounds were 8.56 and 5.52 , respectively.
3.4 Flux estimation
Carbon flux estimates for the 2018 open phase and 2019 open phase showed dramatically different results with 13 instances exceeding a flux > 10 compared to 302 instances in the 2019 open phase (Fig. 9) – where 10 ≈ 2 , which is the equivalent magnitude, but opposite of the estimated annual mean sea–air flux for the coastal Beaufort Sea, −2 (Evans et al., 2015a). The episodic events of flux from the atmosphere into seawater was greater in 2018 with 21 instances < −10 compared to a single instance in 2019. The maximum lower-bound flux potential for the 2018 open phase was estimated at 2.23 , whereas the upper bound was 10.67 (Fig. 9a). Overall, wind speed correlated poorly with CO2 flux in 2018 (R2 = 0.13). The highest frequency of robust wind speeds occurred in October but resulted in only a minor atmospheric flux into seawater as the majority of values were between 2 and −5 (Fig. 9a).
The 2019 open phase had an estimated CO2 flux as high as 105 , which occurred in early August (Fig. 9b). Over a 5.6 d period in late July, CO2 flux was > 10 for more than 90 % of the time, reaching a high of 78 . The maximum lower-bound potential flux estimate for the 2019 open phase was 5.5 with an upper bound of 8.56 . Wind speed was found to be significantly correlated with CO2 flux (p value < 0.0001, R2 = 0.53) in 2019 and, thus, cogently different from the 2018 open phase.
Kaktovik Lagoon was an ideal location for a year-long deployment to capture the three phases (i.e., 2018 open, 2018/19 closed, and 2019 open) of environmental conditions in the coastal Arctic. The study site displayed annual pH variability in the context of a unique lagoon where geographical and physical features of this site represent a semi-closed system with narrow passages to the sea and only small tundra stream inputs. The stochastic events of pH captured in this system are some of the most dramatic hourly pH rates of change recorded to date (Hofmann et al., 2011; Kapsenberg et al., 2015; Takeshita et al., 2015; Kapsenberg and Hofmann, 2016; Cyronak et al., 2020). These findings represent a system that is often in tenuous equilibrium, resulting in dramatic fluctuations of CO2 outgassing and differing magnitudes of pH sensitivity to temperature and salinity. The extreme nature of these habitats displays the resilience of the micro- and macrofaunal communities that undoubtedly modify seawater pH via biological processes. While this study was able to capture physical and chemical conditions of the lagoon, future work should be directed toward understanding how community organization in the lagoon ecosystem affects pH variability.
4.1 Kaktovik Lagoon and pH–salinity relationship
A crucial finding from this year-long time series was the disparity between the pHT–salinity relationship during the 2018 open, 2018/19 closed, and 2019 open phases. Sequentially through the time series, the pHT–salinity relationship was non-existent, negatively correlated, and positively correlated, indicating that multiple processes drive pH variability at differing magnitudes at a seasonal-phase resolution. Given the myriad processes such as temperature–salinity relationships with carbonate chemistry, current- and wind-driven flux between the sediment–water interface and the air–sea interface, and photosynthesis and respiration cycles (Zeebe and Wolf-Gladrow, 2001; Hagens et al., 2014; Carstensen and Duarte, 2019; Rassmann et al., 2020), it is unsurprising that salinity was observed as only a moderate and intermittent driver of pHT variability in Kaktovik Lagoon. This is despite the multitude of salinity changes that shift in time due to the discharge from rivers and tundra streams, seasonal ice-formation and breakup, and water column stratification, all of which would be expected to fluctuate pH predictably. The features intrinsic to Kaktovik Lagoon are likely important factors responsible for the degree of pHT–salinity interdependence and provide a lens that elucidates pHT-altering processes that are less germane to physical oceanographic open-ocean mechanisms such as temperature and salinity.
The characteristics of the Beaufort Sea lagoon ecosystems are unique features of the coastline and exist as an interface between terrestrial inputs and seawater, with each lagoon varying in its connectivity to the Beaufort and freshwater sources. These lagoons temporarily trap large amounts of allochthonous particulate organic carbon – which is expected to increase with warming temperatures – and sediment as river and stream discharge are temporarily mismatched between spring freshet and ice-covered margins (Dunton et al., 2006; Schreiner et al., 2013). The lagoons adjacent to Kaktovik (Arey and Jago) are likely to be more exogenously influenced due to greater connectivity to the Beaufort Sea and the Okpilak, Hulahula, and Jago rivers. Thus, the modification of pHT within Kaktovik Lagoon provides a baseline that is likely dissimilar to adjacent lagoons, providing an in-depth examination of the internal processes of a “closed system” such as biological metabolism and sediment flux that can drive seasonal pH variability and explain the annual shifts in moderate salinity dependence.
In the open phase of 2018, instances of pHT values and the 7 d running average were observed to be > 8.05 despite the striking range of salinity from 5 to 30. This included an event that modulated salinity from 13 to 23 over an 8 h period, which was correlated with high NW winds at ∼ 20 m s−1. This suggests that higher salinity waters from the adjacent Arey Lagoon connecting the Beaufort Sea may have mixed into the bottom waters where the pH sensor was located. The stability of salinity toward the new higher values indicates the validity of these data. The 2019 open phase had a narrower range of salinity which correlated robustly with pHT as values above 8.0 were only observed when salinity was > 25. While the interdependence between pHT and salinity can be variable in nearshore systems (Carstensen and Duarte, 2019), the degree to which pHT remained stable across a range of salinity in the 2018 open phase is notable. Similarly, a recent study in Stefansson Sound (∼ 160 km west of Kaktovik Lagoon) found that salinity-dependent nearshore pHT varied by year; however, the range of salinity was more attenuated than in Kaktovik (Muth et al., 2021). The difference in season between the 2018 open phase (fall) and 2019 open phase (summer) could explain some relational trends between pHT and salinity. In the fall, storm activity and an abating thermocline can lead to greater vertical mixing; however, the wind data suggest that the incongruity between years was modest. Conversely, the summer breakup is associated with warm temperatures and enhanced freshwater input from ice melt that can decrease pH. While these factors should be addressed in future studies, the pH trends presented here suggest that in the beginning of August both phases appear to have diverging patterns, indicating yearly differences rather than predictable seasonal shifts.
The disparity between the salinity–pHT correlation between the 2018 and 2019 open phases was observable in the frequency response of variability. In the 2018 open phase, the PSD of pHT was low and mostly incongruent with the frequency response of salinity. This was not the case in the 2019 open phase where the highest PSD was recorded at the same frequency (1.03 d−1) as salinity, which was slightly offset from the PSD peak in tidal frequency at 0.98 d−1. These associations suggest that events driving low salinity such as stream runoff were likely too irregular, or had too low of flux, relative to the weak but consistent tidal signal driving open-ocean exchange. This also corresponds to the lower range of salinity observed in the 2019 open phase than in the 2018 open phase.
4.2 High-frequency pH in Arctic and sub-Arctic
Interannual variability of pHT between the 2018 open phase and 2019 open phase is not dependent on a single driving factor, including time of season. In the 2018 open phase pHT was consistently high during a period when day length was shortening and temperatures were falling. The increasing trend of consistently high pHT continued into the closed phase. Conversely, August 2019 pHT had a running average that was ∼ 0.2 units lower than that in 2018 and continued a downward trend until the end of the time series. Similar findings have shown significantly different interannual variability in pH along the Arctic coast that exceeded the running average difference of ∼ 0.2 observed in Kaktovik Lagoon by double (Muth et al., 2021). This seasonally shifting dependence of pHT on salinity has implications for carbonate chemistry dynamics and how pHT is modified. Freshwater input from rivers has been shown to increase dissolved inorganic carbon and lower AT, which can decouple the linear relationships between calcium carbonate saturation state, pCO2, and pH (Salisbury et al., 2008; Cai, 2011; Hales et al., 2016). Glacial ice melt in sub-Arctic waters, however, is unique in that its profile is low in pCO2 and AT (Evans et al., 2014). Both modes of freshwater carbonate chemistry decoupling may be present in Kaktovik, but evidence here suggests that salinity is a non-reliable indicator of these decoupling mechanisms as pHT values can exist across a wide range of salinity and even lack a relationship during open phases.
The 2019 open phase displayed highly variable pHT relative to the 2018 open phase with an inconsistent frequency of variability. In the subarctic waters off Alaska's south-central coast, Jakolof Bay had a consistent seasonal trend in pHT variability with hourly rates of change as high as 0.18 from ∼ 7.801 to 7.981 (Miller and Kelley, 2021). While these rates of hourly change are considered high (Hofmann et al., 2011), both open phases in Kaktovik were more than double that (0.401 and 0.467 from 7.655–8.056 and 7.789–8.255, respectively) of Jakolof Bay. These extreme rates of change in Kaktovik can be partially explained by the photosynthetic and respiratory activity within the lagoon.
4.3 PAR and pH
This study found robust correlations between underwater PAR and daily average pHT. The episodic nature of pHT variability in Kaktovik Lagoon was more prevalent during periods of high underwater PAR indicative of coupled diurnal photosynthesis–respiration cycles. Consistent levels of PAR appeared to be associated with sustained daily average pHT while drops in PAR lowered the overall baseline pHT. The rapid response of baseline pHT to PAR highlights the tenuous balance between the biological processes that drive pHT modification. This phenomenon runs counter to what was observed in the subarctic macroalgal-dominated waters of Jakolof Bay where the system maintained net autotrophy for a period > 60 d (Miller and Kelley, 2021). Possible explanations for the precarity of a dominant autotrophic or heterotrophic system may be due to the shallow nature of the lagoon and frequent homogeneity of the water column. In the shallow waters of the lagoon, high winds easily resuspend organic material, enhance respiration, and increase light attenuation (Capuzzo et al., 2015; Moriarty et al., 2018). Thus, small decreases in underwater PAR can lead to net heterotrophy. This supports the sediment “food bank” hypothesis as continuous primary production is not needed to sustain heterotrophic activity, since stored, labile, benthic OM can accumulate in shallow environments, fueling respiration (Mincks et al., 2005; Harris et al., 2018). A “bank” of OM could explain why high levels of PAR led to a sustained pHT, and any instantaneous drop in PAR was immediately followed by a decrease in daily average pHT. This would suggest that high levels of PAR are only able to offset high rates of heterotrophy which are sustained by the seasonal accumulation of carbon subsidies from autochthonous ice algae, phytoplankton, and influx of OM from terrestrial sources – which are likely to vary annually.
4.4 Sea ice effects on carbonate chemistry
A unique feature of ice-covered Arctic coastal waters is the negative relationship between pHT and salinity, which was observed here and in previous studies (Nomura et al., 2006; Miller et al., 2011; Fransson et al., 2013; Muth et al., 2021). In the open ocean, salinity is positively correlated with AT as higher salinity increases the difference between conservative cations to anions. Furthermore, AT positively correlates with pH, and a higher AT is associated with a higher buffering capacity. The formation of sea ice, however, induces cryoconcentration of DIC and AT via active rejection of during freezing and exclusion of other ions, lowering pH and creating high-salinity brine drainage (Miller et al., 2011; Fransson et al., 2013; Hare et al., 2013). The immediate effect of high DIC concentration can lead to the precipitation of CaCO3 in the form of ikaite (a polymorph of CaCO3 ⋅ 6H2O) along the bottom of bulk ice formation, generating CO2 as a product of the reaction and leading to greater decreases in pH (Rysgaard et al., 2012; Fransson et al., 2013; Hare et al., 2013). In addition, the extreme salinity and temperature in winter affect carbonate chemistry by modulating solubility, where an increase in salinity decreases CO2 solubility, and colder temperatures increase CO2 solubility. These salinity and temperature conditions result in a volatile thermodynamic stability of CO2 where salinity effects outweigh temperature effects and can facilitate a degassing of CO2 (Papadimitriou et al., 2004).
The continually decreasing pHT observed in this study suggests that these carbon-concentrating corollaries of sea ice formation may be in effect and contribute to the negative relationship observed between pHT and salinity. That is, if there is no outgassing of CO2, the relative increase in DIC and concomitant decrease in pH will be equal to that of salinity. During ice coverage, the running average of pHT decreased from 7.93 in the beginning of November to 7.56 in late April and mirrors the under-ice salinity trend. This decrease is nearly identical to the 0.4 pH drop (∼ 8.15 to 7.75) observed in the upper 2 m below the ice in Amundsen Gulf from November to April (Fransson et al., 2013). While this phenomenon could partially explain the general decreasing trend between pHT and salinity, it would be remiss to state that this negative correlation is entirely driven by cryoconcentration and ikaite formation. Assuming the AT–salinity regression calculated here is similar to a DIC–salinity correlation from cryoconcentration, the decrease in pHT would not be great enough to explain the observations in the lagoon. While ikaite formation may be present, and further decreasing pH, the driving factor to bring the AT : DIC ratio below 1 (which would be needed to see pH ∼ 7.55) is likely the accumulation of respired CO2 occurring tangentially with salinity decrease. Following a general stoichiometric relationship between N and C that is 16:106, and assuming trivial efflux of N from the sediment, the change in surface from August 2018 to April 2019 would be equal to a 130 µmol kg−1 increase in DIC over this period (Table S1), sufficiently decreasing the AT : DIC ratio below 1. We note that the PO values are a bit anomalous, but these concentrations depend on the N : P ratio in the remineralized OM and flux of solutes from the sediment.
4.5 Under ice variability in pH
The frequency of pHT variability under ice cover was inconsistent. The PSD was weak overall during the closed phase but had a peak at 0.39 d−1, which corresponded to a peak in temperature around the same frequency of 0.36 d−1. The temperature range of 1.9 ∘C during the closed phase can affect carbonate chemistry thermodynamics potential, modulating pH by ∼ 0.036; however, this is less than the derived pHT uncertainty. The other factor driving pHT variability is biological respiration. Datasonde measurements of dissolved oxygen recorded in late April showed bottom waters reaching lows of 156.3 µmol L−1 (43 % saturation) compared to surface levels of 359.5 µmol L−1 (94 % saturation) (Table S1). The stratification of oxygen in this case can likely be associated with burgeoning PAR levels in April. Previous studies have shown increases in pH are associated with photosynthesis during ice cover, which is more prevalent proximal to bulk ice, resulting in higher pH at the surface compared to the bottom (Matson et al., 2014). Other factors driving pH variability could be due to the competition between anaerobic and aerobic metabolism in low-oxygenated water and the transfer of reduced metabolites from bioirrigation (Aller, 1982, 2001; Zakem et al., 2020). Efflux of reduced metabolites from the sediment can lead to high concentrations of reduced inorganic nitrogen if oxygen concentrations are low and oxidation processes slow (Aller, 2001; Middelburg and Levin, 2009). Discrete samples taken in April found high concentrations of reduced nitrogen in the bottom waters (Table S1). If oxygen levels begin to increase in late spring due to photosynthesis, the subsequent oxidation of nitrogen and other accumulated reduced metabolites could decrease pH as was seen from mid-April to mid-May. Due to limited under-ice sampling, however, there is no way to determine the trajectory of oxygen decrease or exact timing of under-ice photosynthesis. The only other mechanism potentially supplying oxygen to the lagoon would be associated with water mass exchange via tide. According to the frequency analysis, there is limited evidence showing a correlated frequency peak between pHT and tide, indicating that tidal exchange may be restricted or not a modulator of pHT during the closed phase. Without measuring dissolved oxygen, however, it remains unclear whether oxygen is the determinant factor driving pHT modification during the closed phase.
4.6 Arctic lagoons as carbon source to atmosphere
The estimates of CO2 flux during the open phases of 2018 and 2019 were an a posteriori method to examine the drivers of pH variability in Kaktovik Lagoon. Following this approach, comparisons between pHT rate of change and estimated CO2 flux did not correlate, suggesting that outgassing rates were not significant enough to raise in situ pH. Rather, the analysis showed that the estimated lagoon CO2 flux varied substantially by year and appears at times to be a source of CO2 to the atmosphere. This runs counter to other studies that measured carbon flux at a lagoon in the far western Beaufort Sea (Elson Lagoon), where this site was categorized as a carbon sink; however, these lagoons differ in size, residence time, and connectivity to adjacent water bodies (Lougheed et al., 2020). Overall, the western Arctic Ocean is thought to be a carbon sink (Laruelle et al., 2014; Evans et al., 2015a); although Mathis et al. (2012) described occasional storm-induced upwelling events across the Beaufort Sea shelf that cause CO2 efflux to the atmosphere. In this study, the variability in estimated flux from the lagoon appeared to be a function of baseline pHT more than wind-driven stress. The 2018 open phase had a higher baseline pHT (8.01–8.18) than the 2019 open phase (8.04–7.72), and despite wind speeds comparable to the 2019 open phase resulted in a lower estimated CO2 efflux to the atmosphere. Conversely, the 2019 open phase maintained a lower baseline pHT which promoted favorable disequilibrium (i.e., difference between pCO2sw and pCO2a) conditions that only needed wind stress as a catalyst. Since flux preceded low pHT values, and outgassing did not decrease hourly pHT, the mechanisms driving low pH and pCO2 – likely biological respiration – transcend the counterbalance of outgassing. Similar conclusions were found in a boreal lake where wind-driven stress reduced the thermocline and induced CO2 upwelling that counterbalanced CO2 loss from surface waters to the atmosphere (Åberg et al., 2010). In relation to this study, it would be logical to conclude that the reason wind speed was correlated to the 2019 open-phase flux and not 2018 open-phase flux was due to a lower baseline pH and pCO2 at the surface as a result of enhanced CO2 upwelling from benthic respiration in the early portion of the open phase. Since 2018 open-phase measurements were taken in the latter portion of the season, benthic fluxes of CO2 may have been exhausted as terrestrial OM abundance diminished with time.
The flux estimates in this study suggest that the novel characteristics of coastal lagoons should be considered anomalous compared to the greater across-shelf Arctic coast, defined as waters north of 70∘ N and west of 100∘ W (Bakker et al., 2014). The current classification of the coastal Arctic does not account for lagoons as specific ecosystems. Thus, the western Arctic coastal ocean is defined as a relatively homogenous area 1.2 × 10¹² m2 along the Chukchi and Beaufort seas extending 400 km offshore (Evans et al., 2015a). The coastal Beaufort Sea under this definition is estimated to have an annual mean carbon uptake of 8.5 Tg C yr−1 without ice and a daily annual mean flux of −2.1 (Evans et al., 2015a). Recent evidence, however, has shown that previous estimates of the carbon sink capacity of the Arctic Ocean have been overestimated, suggesting that current and increasing riverine discharge will cause a reduction in AT, ultimately decreasing its potential to absorb CO2 (Woosley and Millero, 2020). While the lagoon ecosystems comprise a small proportion of the greater Beaufort Sea shelf, they encompass > 50 % of its coastline with significant freshwater inputs that can lower the carbon sink capacity (Dunton et al., 2006; Woosley and Millero, 2020). It is suggested here that certain lagoons, including Kaktovik, are likely episodic sources of CO2 to the atmosphere during open phases. The net daily average (± SD) CO2 flux for Kaktovik Lagoon during the 2018 and 2019 open phases was −2.2 ± 6.5 and 14.6 ± 23.9 , respectively. Over the entire calendar year that encompasses both open phases during which sensors were deployed, the annual daily average flux was 5.9 ± 19.3 . If integrated over the entire open phase (51.58 d in 2018 and 49.38 d in 2019), and the area of Kaktovik Lagoon, estimates suggest a net carbon flux of −2.68 × 10⁻⁵ in the 2018 open phase and 1.67 × 10⁻⁴ in the 2019 open phase. Over an entire calendar year this equates to 1.40 × 10⁻⁴ Tg C yr−1.
It is noted that these estimates are for incomplete open phases as the data presented here do not comprise the entirety of each season due the scheduling of SeaFET deployment and recovery. If incorporating all the lagoons along the coast, it is plausible that the source of CO2 from the lagoon ecosystems would partially offset the carbon sink capacity previously established, particularly when considering that the estimated daily annual average flux is at times substantially greater (5.9 ± 19.3 ) and opposite of current estimates (−2.1 ) (Evans et al., 2015a; Mathis et al., 2015). Further studies that can capture high-frequency carbonate chemistry variability are needed though to determine the degree and frequency of the Beaufort lagoon ecosystems' air–sea carbon exchange.
There is a fair amount of confidence in these estimates because the AT–salinity correlation was robust (R2 = 0.968), and the regression coefficients were proximal to other AT–salinity regressions for the Gulf of Alaska and the western coastal Arctic, despite being derived from only three discrete samples (Yamamoto-Kawai et al., 2005; Shadwick et al., 2011; Evans et al., 2015b). Processes such as terrestrial runoff of organic alkalinity and ice melt can increase uncertainties in the AT–salinity relationship; however, ice-melt-induced deviations appeared negligible in the Gulf of Alaska (Cai et al., 1998; Evans et al., 2014). Further, the overall uncertainty calculated as a flux potential was low. The main source of deviation was associated with higher pCO2 values calculated from the AT–salinityin situ regression. This made up the upper bound; thus, the conclusions drawn here are from the more conservative flux estimates. The effect of freshwater on the gas transfer velocity comprised the lower bound and was negligible overall. For the flux estimates presented here, a homogenous water column with respect to pH was assumed, given that discrete sonde measurements only showed pH stratification during the closed phase (Table S1). This is not to suggest that salinity- and temperature-driven stratification does not exist but rather that the evidence here suggests pHT water column homogeneity. For example, pHT during the 2018 open phase did not correlate with salinity as values > 8.01 were present across a salinity range of 25. In cases where pHT positively correlated with salinity as seen during the 2019 open phase, a freshwater stratification would suggest that low salinity at the surface would be associated with lower pHT and likely increase the CO2 flux as there would be a greater disequilibrium between the lagoon and the air. According to the quadratic fit between pHT and salinity, lower pHT at the surface associated with freshwater stratification would outweigh the AT estimates based on salinity by an order of magnitude if there was a salinity difference of 10 between the surface and bottom waters. Thus, freshwater stratification at the surface would likely exceed our upper-bound potential flux estimate and increase efflux rates. Further, any modulation of flux by temperature on the gas transfer velocity is less than the estimated upper bound and considered negligible.
This study presents the first high-frequency pH time series for the open-ice and under-ice phases in the coastal Arctic lagoon system. Uncertainty estimates for pHT were higher than desired but describe general trends and relative rates of change that are informative for understanding pH variability. The extremely low anomaly between the reference pHT sample and the SeaFET suggest that the uncertainty is likely lower than estimated. pH can vary dramatically by year for the open phases and is likely a function of PAR availability and the amount of OM delivered from terrestrial sources as the balance between system autotrophy and heterotrophy was tenuous. This resulted in hourly pHT rates of change > 0.4 units (∼ 7.7–8.1). Under ice pH variability exhibited complexities, and we postulate that multiple drivers of pH variability such as carbonate chemistry thermodynamics, accumulation of respired CO2, ikaite precipitation, and sediment efflux were all contributing mechanisms. It is apparent that further studies of carbonate chemistry dynamics at the sediment–water interface are needed to help elucidate porewater effects on bottom water pH variability during the closed, ice-covered phase, as well as continuous oxygen measurements. Estimated CO2 outgassing during the open phase was not a significant factor driving pHT variability due to the collinearity of wind stress and the infrequent convergence between disequilibrium and wind speed. However, carbon flux estimates suggest that the Beaufort lagoon ecosystems may be a substantial source of carbon to the atmosphere, which runs counter to previous studies predicting coastal Arctic waters as a CO2 sink. This may have further implications meaning that periods of CO2 efflux from the lagoon system may increase as the extent of ice-fee days increases in the coming decades with warmer temperatures. These results highlight the need for further investigation of the Beaufort lagoon ecosystems in the context of carbonate chemistry dynamics, as these processes can affect the diverse biological communities that are present here and aid in understanding western coastal Arctic biogeochemical dynamics.
All data accessed from the Beaufort Lagoon Ecosystems LTER are available on the Environmental Data initiative:
-
Beaufort Lagoon Ecosystems LTER and Kasper (2020, https://doi.org/10.6073/pasta/3475cdbb160a9f844aa5ede627c5f6fe),
-
Beaufort Lagoon Ecosystems LTER, Core Program (2020a, https://doi.org/10.6073/pasta/ced2cedd430d430d9149b9d7f1919729),
-
Beaufort Lagoon Ecosystems LTER, Core Program (2020b, https://doi.org/10.6073/pasta/e0e71c2d59bf7b08928061f546be6a9a),
-
Beaufort Lagoon Ecosystems LTER, Core Program (2020c, https://doi.org/10.6073/pasta/9305328d0f1ed28fbb2d7cf56c686786).
The supplement related to this article is available online at: https://doi.org/10.5194/bg-18-1203-2021-supplement.
CAM, NDM, CB, and ALK conceptualized the paper thesis. CAM performed all data analysis and data visualization. ALK performed initial data QA–QC for pH data. ALK, NDM, and CB performed lab analyses. CAM wrote the original manuscript draft with minor contributions in the introduction from ALK and CB in the methods. ALK, CB, and NDM reviewed and edited the manuscript.
The authors declare that they have no conflict of interest.
We thank R/V Proteus captains Ted Dunton and John Dunton for expert mooring deployment and recovery. We additionally thank Kenneth Dunton, Stephanie Jump, and Jeremy Kasper for logistical and field assistance. This work took place in the traditional and current homeland of the Kaktovikmuit.
This material is based upon work supported by the National Science Foundation under award no. 1656026.
This paper was edited by Jean-Pierre Gattuso and reviewed by two anonymous referees.
Åberg, J., Jansson, M., and Jonsson, A.: Importance of water temperature and thermal stratification dynamics for temporal variation of surface water CO2 in a boreal lake, J. Geophys. Res.-Biogeo., 115, G02024, https://doi.org/10.1029/2009JG001085, 2010.
Aller, R.: Carbonate Dissolution in Nearshore Terrigenous Muds – the Role of Physical and Biological Reworking, J. Geol., 90, 79–95, 1982.
Aller, R. C.: Transport and reactions in the bioirrigated zone, in: The Benthic Boundary Layer: Transport Processes and Biogeochemistry, edited by: Boudreau, B. P. and Jorgensen, B. B., Oxford University Press, New York, 269–301, 2001.
Bakker, D. C. E., Pfeil, B., Smith, K., Hankin, S., Olsen, A., Alin, S. R., Cosca, C., Harasawa, S., Kozyr, A., Nojiri, Y., O'Brien, K. M., Schuster, U., Telszewski, M., Tilbrook, B., Wada, C., Akl, J., Barbero, L., Bates, N. R., Boutin, J., Bozec, Y., Cai, W.-J., Castle, R. D., Chavez, F. P., Chen, L., Chierici, M., Currie, K., de Baar, H. J. W., Evans, W., Feely, R. A., Fransson, A., Gao, Z., Hales, B., Hardman-Mountford, N. J., Hoppema, M., Huang, W.-J., Hunt, C. W., Huss, B., Ichikawa, T., Johannessen, T., Jones, E. M., Jones, S. D., Jutterström, S., Kitidis, V., Körtzinger, A., Landschützer, P., Lauvset, S. K., Lefèvre, N., Manke, A. B., Mathis, J. T., Merlivat, L., Metzl, N., Murata, A., Newberger, T., Omar, A. M., Ono, T., Park, G.-H., Paterson, K., Pierrot, D., Ríos, A. F., Sabine, C. L., Saito, S., Salisbury, J., Sarma, V. V. S. S., Schlitzer, R., Sieger, R., Skjelvan, I., Steinhoff, T., Sullivan, K. F., Sun, H., Sutton, A. J., Suzuki, T., Sweeney, C., Takahashi, T., Tjiputra, J., Tsurushima, N., van Heuven, S. M. A. C., Vandemark, D., Vlahos, P., Wallace, D. W. R., Wanninkhof, R., and Watson, A. J.: An update to the Surface Ocean CO2 Atlas (SOCAT version 2), Earth Syst. Sci. Data, 6, 69–90, https://doi.org/10.5194/essd-6-69-2014, 2014.
Beaufort Lagoon Ecosystems LTER and Kasper, J.: Circulation dynamics: currents, waves, temperature measurements from moorings in lagoon sites along the Alaska Beaufort Sea coast, 2018-ongoing ver 2, Environmental Data Initiative, https://doi.org/10.6073/pasta/3475cdbb160a9f844aa5ede627c5f6fe, 2020.
Beaufort Lagoon Ecosystems LTER, Core Program: Photosynthetically active radiation (PAR) time series from lagoon sites along the Alaska Beaufort Sea coast, 2018-ongoing ver 1, Environmental Data Initiative, https://doi.org/10.6073/pasta/ced2cedd430d430d9149b9d7f1919729, 2020a.
Beaufort Lagoon Ecosystems LTER, Core Program: physicochemical water column parameters and hydrographic time series from river, lagoon, and open ocean sites along the Alaska Beaufort Sea coast, 2018-ongoing ver 1, Environmental Data Initiative, https://doi.org/10.6073/pasta/e0e71c2d59bf7b08928061f546be6a9a, 2020b.
Beaufort Lagoon Ecosystems LTER, Core Program: Time series of water column pH from lagoon sites along the Alaska Beaufort Sea coast, 2018-ongoing ver 1, Environmental Data Initiative, https://doi.org/10.6073/pasta/9305328d0f1ed28fbb2d7cf56c686786, 2020c.
Bresnahan, P. J., Martz, T. R., Takeshita, Y., Johnson, K. S., and LaShomb, M.: Best practices for autonomous measurement of seawater pH with the Honeywell Durafet, Methods Oceanogr., 9, 44–60, https://doi.org/10.1016/j.mio.2014.08.003, 2014.
Cai, W.-J.: Estuarine and Coastal Ocean Carbon Paradox: CO2 Sinks or Sites of Terrestrial Carbon Incineration?, in: Annual Review of Marine Science, vol. 3, edited by: Carlson, C. A. and Giovannoni, S. J., Annual Reviews, Palo Alto, 123–145, , 2011.
Cai, W.-J. and Wang, Y.: The chemistry, fluxes, and sources of carbon dioxide in the estuarine waters of the Satilla and Altamaha Rivers, Georgia, Limnol. Oceanogr., 43, 657–668, https://doi.org/10.4319/lo.1998.43.4.0657, 1998.
Cai, W.-J., Wang, Y., and Hodson, R. E.: Acid-Base Properties of Dissolved Organic Matter in the Estuarine Waters of Georgia, USA, Geochim. Cosmochim. Ac., 62, 473–483, https://doi.org/10.1016/S0016-7037(97)00363-3, 1998.
Capuzzo, E., Stephens, D., Silva, T., Barry, J., and Forster, R. M.: Decrease in water clarity of the southern and central North Sea during the 20th century, Glob. Change Biol., 21, 2206–2214, https://doi.org/10.1111/gcb.12854, 2015.
Carstensen, J. and Duarte, C. M.: Drivers of pH Variability in Coastal Ecosystems, Environ. Sci. Technol., 53, 4020–4029, https://doi.org/10.1021/acs.est.8b03655, 2019.
Craig, P. C.: Subsistence fisheries at coastal villages in the Alaskan Arctic, 1970–1986, Biological Papers of the University of Alaska, 24, 131–152, 1989.
Cyronak, T., Takeshita, Y., Courtney, T. A., DeCarlo, E. H., Eyre, B. D., Kline, D. I., Martz, T., Page, H., Price, N. N., Smith, J., Stoltenberg, L., Tresguerres, M., and Andersson, A. J.: Diel temperature and pH variability scale with depth across diverse coral reef habitats, Limnol. Oceanogr. Lett., 5, 193–203, https://doi.org/10.1002/lol2.10129, 2020.
Dickson, A. G., Wesolowski, D. J., Palmer, D. A., and Mesmer, R. E.: Dissociation constant of bisulfate ion in aqueous sodium chloride solutions to 250 ∘C, J. Phys. Chem., 94, 7978–7985, https://doi.org/10.1021/j100383a042, 1990.
Dickson A. G., Sabine C. L., and Christian J. R.: Guide to best practices for ocean CO2 measurements, in: PICES Special Publication, edited by: Dickson, A. G., Sabine, C. L., and Christian, J. R., North Pacific Marine Science Organization Sidney, British Columbia, Canada, 2007.
Dinauer, A. and Mucci, A.: Spatial variability in surface-water pCO2 and gas exchange in the world's largest semi-enclosed estuarine system: St. Lawrence Estuary (Canada), Biogeosciences, 14, 3221–3237, https://doi.org/10.5194/bg-14-3221-2017, 2017.
Douglas, N. K. and Byrne, R. H.: Achieving accurate spectrophotometric pH measurements using unpurified meta-cresol purple, Mar. Chem., 190, 66–72, https://doi.org/10.1016/j.marchem.2017.02.004, 2017.
Dunton, K. H. and Schonberg, S. V.: Barter Island to Demarcation Bay: A preliminary benthic survey of Arctic coastal lagoons, Final Report to USF&WS, Arctic Refuge, Fairbanks, 2006.
Dunton, K. H., Weingartner, T., and Carmack, E. C.: The nearshore western Beaufort Sea ecosystem: Circulation and importance of terrestrial carbon in arctic coastal food webs, Prog. Oceanogr., 71, 362–378, https://doi.org/10.1016/j.pocean.2006.09.011, 2006.
Dunton, K. H., Schonberg, S. V., and Cooper, L. W.: Food Web Structure of the Alaskan Nearshore Shelf and Estuarine Lagoons of the Beaufort Sea, Estuar. Coast., 35, 416–435, https://doi.org/10.1007/s12237-012-9475-1, 2012.
Evans, W., Mathis, J. T., and Cross, J. N.: Calcium carbonate corrosivity in an Alaskan inland sea, Biogeosciences, 11, 365–379, https://doi.org/10.5194/bg-11-365-2014, 2014.
Evans, W., Mathis, J. T., Cross, J. N., Bates, N. R., Frey, K. E., Else, B. G. T., Papkyriakou, T. N., DeGrandpre, M. D., Islam, F., Cai, W.-J., Chen, B., Yamamoto-Kawai, M., Carmack, E., Williams, W. J., and Takahashi, T.: Sea–air CO2 exchange in the western Arctic coastal ocean, Glob. Biogeochem. Cy., 29, 1190–1209, https://doi.org/10.1002/2015GB005153, 2015a.
Evans W., Mathis, J. T., Ramsey, J., and Hetrick J.: On the frontline: Tracking ocean acidification in an Alaskan shellfish hatchery, PloS One, 10, e0130384, https://doi.org/10.1371/journal.pone.0130384, 2015b.
Fabry, V., McClintock, J., Mathis, J., and Grebmeier, J.: Ocean Acidification at High Latitudes: The Bellwether, Oceanography, 22, 160–171, https://doi.org/10.5670/oceanog.2009.105, 2009.
Fransson, A., Chierici, M., Miller, L. A., Carnat, G., Shadwick, E., Thomas, H., Pineault, S., and Papakyriakou, T. N.: Impact of sea-ice processes on the carbonate system and ocean acidification at the ice-water interface of the Amundsen Gulf, Arctic Ocean, J. Geophys. Res.-Oceans, 118, 7001–7023, https://doi.org/10.1002/2013JC009164, 2013.
Gonski, S. F., Cai, W.-J., Ullman, W. J., Joesoef, A., Main, C. R., Pettay, D. T., and Martz, T. R.: Assessment of the suitability of Durafet-based sensors for pH measurement in dynamic estuarine environments, Estuar. Coast. Shelf S., 200, 152–168, https://doi.org/10.1016/j.ecss.2017.10.020, 2018.
Griffiths, W. B., Den Beste, J. K., and Craig, P.: Fisheries investigations in a coastal lagoon region of the Beaufort Sea (Kaktovik Lagoon, Alaska), Arctic Gas Biol. Report Ser., 40, 1–190, 1977.
Hagens, M., Hunter, K. A., Liss, P. S., and Middelburg, J. J.: Biogeochemical context impacts seawater pH changes resulting from atmospheric sulfur and nitrogen deposition, Geophys. Res. Lett., 41, 935–941, https://doi.org/10.1002/2013GL058796, 2014.
Hales, B., Suhrbier, A., Waldbusser, G. G., Feely, R. A., and Newton, J. A.: The Carbonate Chemistry of the “Fattening Line,” Willapa Bay, 2011–2014, Estuar. Coast., 1–14, https://doi.org/10.1007/s12237-016-0136-7, 2016.
Hare, A. A., Wang, F., Barber, D., Geilfus, N.-X., Galley, R. J., and Rysgaard, S.: pH evolution in sea ice grown at an outdoor experimental facility, Mar. Chem., 154, 46–54, https://doi.org/10.1016/j.marchem.2013.04.007, 2013.
Harris, C. M., McClelland, J. W., Connelly, T. L., Crump, B. C., and Dunton, K. H.: Salinity and Temperature Regimes in Eastern Alaskan Beaufort Sea Lagoons in Relation to Source Water Contributions, Estuar. Coast., 40, 50–62, https://doi.org/10.1007/s12237-016-0123-z, 2017.
Harris, C. M., McTigue, N. D., McClelland, J. W., and Dunton, K. H.: Do high Arctic coastal food webs rely on a terrestrial carbon subsidy?, Food Webs, 15, e00081, https://doi.org/10.1016/j.fooweb.2018.e00081, 2018.
Hofmann, G. E., Smith, J. E., Johnson, K. S., Send, U., Levin, L. A., Micheli, F., Paytan, A., Price, N. N., Peterson, B., Takeshita, Y., Matson, P. G., Crook, E. D., Kroeker, K. J., Gambi, M. C., Rivest, E. B., Frieder, C. A., Yu, P. C., and Martz, T. R.: High-Frequency Dynamics of Ocean pH: A Multi-Ecosystem Comparison, Plos One, 6, e28983, https://doi.org/10.1371/journal.pone.0028983, 2011.
Johnson, S. W., Thedinga, J. F., Neff, A. D., and Hoffman, C. A.: Fish fauna in nearshore waters of a barrier island in the western Beaufort Sea, Alaska, U.S. Dep. Commer., NOAA Tech. Memo. NMFS-AFSC-210, 28 pp., 2010.
Kapsenberg, L. and Hofmann, G. E.: Ocean pH time-series and drivers of variability along the northern Channel Islands, California, USA, Limnol. Oceanogr., 61, 953–968, https://doi.org/10.1002/lno.10264, 2016.
Kapsenberg, L., Kelley, A. L., Shaw, E. C., Martz, T. R., and Hofmann, G. E.: Near-shore Antarctic pH variability has implications for the design of ocean acidification experiments, Sci. Rep.-UK, 5, 9638, https://doi.org/10.1038/srep09638, 2015.
Kinney, P., Schell, D., Dygas, J., Nenahlo, R., and Hall, G.: Nearshore Currents, in: Baseline data study of the Alaskan Arctic aquatic environment, edited by: Kinney, P., Schell, D., Alexander, V., Burrell, D., Cooney, R., and Naidu, A. S., Univ. Alaska, Inst. Mar. Sci., Rep. R-72-3, 1971.
Kraus, N. C., Patsch, K., and Munger, S.: Barrier Beach Breaching from the Lagoon Side, With Reference to Northern California, U.S. Army Engineer Research and Development Center, Coast and Hydraulics Laboratory, 2008.
Laruelle, G. G., Lauerwald, R., Pfeil, B., and Regnier, P.: Regionalized global budget of the CO2 exchange at the air–water interface in continental shelf seas, Global Biogeochem. Cy., 28, 1199–1214, https://doi.org/10.1002/2014GB004832, 2014.
Lissauer, I. M., Hachmeister, L. E., Morson, B. J.: Atlas of the Beaufort Sea, U.S. Dep. of Trans., U.S. Coast Guard, Office of Res. and Dev., 1984.
Lougheed, V. L., Tweedie, C. E., Andresen, C. G., Armendariz, A. M., Escarzaga, S. M., and Tarin, G.: Patterns and drivers of carbon dioxide concentration sin aquatic ecosystems of the Arctic coastal tundra, Global Biogeochem. Cy., 34, e2020GB006552, https://doi.org/10.1029/2020GB006552, 2020.
Lueker, T. J., Dickson, A. G., and Keeling, C. D.: Ocean pCO2 calculated from dissolved inorganic carbon, alkalinity, and equations for K1 and K2: Validation based on laboratory measurements of CO2 in gas and seawater at equilibrium, Mar. Chem., 70, 105–119, https://doi.org/10.1016/S0304-4203(00)00022-0, 2000.
Martz, T. R., Connery, J. G., and Johnson, K. S.: Testing the Honeywell Durafet® for seawater pH applications, Limnol. Oceanogr.-Meth., 8, 172–184, https://doi.org/10.4319/lom.2010.8.172, 2010.
Mathis, J. T., Pickart, R. S., Byrne, R. H., McNeil, C. L., Moore, G. W. K., Juranek, L. W., Liu, X., Ma, J., Easley, R. A., Elliot, M. M., Cross, J. N., Reisdorph, S. C., Bahr, F., Morison, J., Lichendorf, T., and Feely, R. A.: Storm-induced upwelling of high pCO2 waters onto the continental shelf of the western Arctic Ocean and implications for carbonate mineral saturation states, Geophys. Res. Lett., 39, L07606, https://doi.org/10.1029/2012GL051574, 2012.
Mathis, J. T., Cross, J. N., Evans, W., and Doney, S. C.: Ocean Acidification in the Surface Waters of the Pacific-Arctic Boundary Regions, Oceanography, 28, 122–135, https://doi.org/10.5670/oceanog.2015.36, 2015.
Matson, P. G., Washburn, L., Martz, T. R., and Hofmann, G. E.: Abiotic versus Biotic Drivers of Ocean pH Variation under Fast Sea Ice in McMurdo Sound, Antarctica, PloS One, 9, e107239, https://doi.org/10.1371/journal.pone.0107239, 2014.
Matthews, J. B. and Stringer, W. J.: Spring breakup and flushing of an Arctic lagoon estuary, J. Geophys. Res.-Oceans, 89, 2073–2079, https://doi.org/10.1029/JC089iC02p02073, 1984.
McClelland, J. W., Déry, S. J., Peterson, B. J., Holmes, R. M., and Wood, E. F.: A pan-arctic evaluation of changes in river discharge during the latter half of the 20th century, Geophys. Res. Lett., 33, L06715, https://doi.org/10.1029/2006GL025753, 2006.
McClelland, J. W., Holmes, R. M., Dunton, K. H., and Macdonald, R. W.: The Arctic Ocean Estuary, Estuar. Coast., 35, 353–368, https://doi.org/10.1007/s12237-010-9357-3, 2012.
McClelland, J. W., Townsend-Small, A., Holmes, R. M., Pan, F., Stieglitz, M., Khosh, M., and Peterson, B. J.: River export of nutrients and organic matter from the North Slope of Alaska to the Beaufort Sea, Water Resour. Res., 50, 1823–1839, https://doi.org/10.1002/2013WR014722, 2014.
McLaughlin, K., Dickson, A., Weisberg, S. B., Coale, K., Elrod, V., Hunter, C., Johnson, K. S., Kram, S., Kudela, R., Martz, T., Negrey, K., Passow, U., Shaughnessy, F., Smith, J. E., Tadesse, D., Washburn, L., and Weis, K. R.: An evaluation of ISFET sensors for coastal pH monitoring applications, Reg. Stud. Mar. Sci., 12, 11–18, https://doi.org/10.1016/j.rsma.2017.02.008, 2017.
Middelburg, J. J. and Levin, L. A.: Coastal hypoxia and sediment biogeochemistry, Biogeosciences, 6, 1273–1293, https://doi.org/10.5194/bg-6-1273-2009, 2009.
Miller, C. A. and Kelley A. K.: Seasonality and biological forcing the diel frequency of nearshore pH extremes in a sub-arctic Alaskan estuary, Limnol. Oceanogr., https://doi.org/10.1002/lno.11698, in press, 2021.
Miller, C. A., Pocock, K., Evans, W., and Kelley, A. L.: An evaluation of the performance of Sea-Bird Scientific's SeaFET™ autonomous pH sensor: considerations for the broader oceanographic community, Ocean Sci., 14, 751–768, https://doi.org/10.5194/os-14-751-2018, 2018.
Miller, L. A., Carnat, G., Else, B. G. T., Sutherland, N., and Papakyriakou, T. N.: Carbonate system evolution at the Arctic Ocean surface during autumn freeze-up, J. Geophys. Res.-Oceans, 116, C00G04, https://doi.org/10.1029/2011JC007143, 2011.
Miller, L. A., Macdonald, R. W., McLaughlin, F., Mucci, A., Yamamoto-Kawai, M., Giesbrecht, K. E., and Williams, W. J.: Changes in the marine carbonate system of the western Arctic: patterns in a rescued data set, Polar Res., 33, 20577, https://doi.org/10.3402/polar.v33.20577, 2014.
Mincks, S. L., Smith, C. R., and DeMaster, D. J.: Persistence of labile organic matter and microbial biomass in Antarctic shelf sediments: evidence of a sediment “food bank”, Mar. Ecol.-Prog. Ser., 300, 3–19, 2005.
Moriarty, J. M., Harris, C. K., Friedrichs, M. A. M., Fennel, K., and Xu, K.: Impact of Seabed Resuspension on Oxygen and Nitrogen Dynamics in the Northern Gulf of Mexico: A Numerical Modeling Study, J. Geophys. Res.-Oceans, 123, 7237–7263, https://doi.org/10.1029/2018JC013950, 2018.
Mouillot, D., Dumay, O., and Tomasini, J. A.: Limiting similarity, niche filtering and functional diversity in coastal lagoon fish communities, Estuar. Coast. Shelf S., 71, 443–456, https://doi.org/10.1016/j.ecss.2006.08.022, 2007.
Muth, A., Kelley, A. K., and Dunton, K.: High-Frequency pH Time-Series Reveals Pronounced Seasonality in Arctic Coastal Waters, Limnol. Oceanogr., in review, 2021.
Nomura, D., Yoshikawa-Inoue, H., and Toyota, T.: The effect of sea-ice growth on air–sea CO2 flux in a tank experiment, Tellus B, 58, 418–426, https://doi.org/10.1111/j.1600-0889.2006.00204.x, 2006.
Orr, J. C., Epitalon, J.-M., Dickson, A. G., and Gattuso, J.-P.: Routine uncertainty propagation for the marine carbon dioxide system, Mar. Chem., 207, 84–107, https://doi.org/10.1016/j.marchem.2018.10.006, 2018.
Papadimitriou, S., Kennedy, H., Kattner, G., Dieckmann, G. S., and Thomas, D. N.: Experimental evidence for carbonate precipitation and CO2 degassing during sea ice formation, Geochim. Cosmochim. Ac., 68, 1749–1761, https://doi.org/10.1016/j.gca.2003.07.004, 2004.
Qi, D., Chen, L., Chen, B., Gao, Z., Zhong, W., Feely, R. A., Anderson, L. G., Sun, H., Chen, J., Chen, M., Zhan, L., Zhang, Y., and Cai, W.-J.: Increase in acidifying water in the western Arctic Ocean, Nat. Clim. Change, 7, 195–199, https://doi.org/10.1038/nclimate3228, 2017.
Rassmann, J., Eitel, E. M., Lansard, B., Cathalot, C., Brandily, C., Taillefert, M., and Rabouille, C.: Benthic alkalinity and dissolved inorganic carbon fluxes in the Rhône River prodelta generated by decoupled aerobic and anaerobic processes, Biogeosciences, 17, 13–33, https://doi.org/10.5194/bg-17-13-2020, 2020.
Rivest, E. B., O'Brien, M., Kapsenberg, L., Gotschalk, C. C., Blanchette, C. A., Hoshijima, U., and Hofmann, G. E.: Beyond the benchtop and the benthos: Dataset management planning and design for time series of ocean carbonate chemistry associated with Durafet®-based pH sensors, Ecol. Inform., 36, 209–220, https://doi.org/10.1016/j.ecoinf.2016.08.005, 2016.
Robards, M. D.: Coastal lagoon community and ecological monitoring in the Southern Chukchi Sea National Park Unit over five decades – Status and 2012 field sampling report, National Park Service, Fairbanks, AK, 2014.
Rysgaard, S., Glud, R. N., Lennert, K., Cooper, M., Halden, N., Leakey, R. J. G., Hawthorne, F. C., and Barber, D.: Ikaite crystals in melting sea ice – implications for pCO2 and pH levels in Arctic surface waters, The Cryosphere, 6, 901–908, https://doi.org/10.5194/tc-6-901-2012, 2012.
Salisbury, J. E., Vandemark, D., Hunt, C. W., Campbell, J. W., McGillis, W. R., and McDowell, W. H.: Seasonal observations of surface waters in two Gulf of Maine estuary-plume systems: Relationships between watershed attributes, optical measurements and surface pCO2, Estuar. Coast. Shelf S., 77, 245–252, https://doi.org/10.1016/j.ecss.2007.09.033, 2008.
Schreiner, K. M., Bianchi, T. S., Eglinton, T. I., Allison, M. A., and Hanna, A. J. M.: Sources of terrigenous inputs to surface sediments of the Colville River Delta and Simpson's Lagoon, Beaufort Sea, Alaska, J. Geophys. Res.-Biogeo., 118, 808–824, https://doi.org/10.1002/jgrg.20065, 2013.
Shadwick, E. H., Thomas, H., Chierici, M., Else, B., Fransson, A., Michael, C., Miller, L. A., Mucci, A., Niemi, A., Papakyriakou, T. N., and Tremblay, J.-E.: Seasonal variability of the inorganic carbon system in the Amundsen Gulf region of the southeastern Beaufort Sea, Limnol. Oceanogr., 56, 303–322, https://doi.org/10.4319/lo.2011.56.1.0303, 2011.
Stein, R. and Macdonald, R. W.: Organic carbon budget: Arctic Ocean vs. Global Ocean, in: The organic carbon cycle in the Arctic Ocean, edited by: Stein, R. and Macdonald, R. W., Springer, Berlin, 315–322, 2004.
Sulpis, O., Lauvset, S. K., and Hagens, M.: Current estimates of and appear inconsistent with measured CO2 system parameters in cold oceanic regions, Ocean Sci., 16, 847–862, https://doi.org/10.5194/os-16-847-2020, 2020.
Takeshita, Y., Frieder, C. A., Martz, T. R., Ballard, J. R., Feely, R. A., Kram, S., Nam, S., Navarro, M. O., Price, N. N., and Smith, J. E.: Including high-frequency variability in coastal ocean acidification projections, Biogeosciences, 12, 5853–5870, https://doi.org/10.5194/bg-12-5853-2015, 2015.
Thoning, K. W., Crotwell, A. M., and Mund, J. W.: Atmospheric Carbon Dioxide Dry Air Mole Fractions from continuous measurements at Mauna Loa, Hawaii, Barrow, Alaska, American Samoa, and South Pole. 1973–2019, Version 2020-08, National Oceanic and Atmospheric Administration (NOAA), Global Monitoring Laboratory (GML), Boulder, Colorado, USA, https://doi.org/10.15138/yaf1-bk21, available at FTP at: ftp://aftp.cmdl.noaa.gov/data/greenhouse_gases/co2/in-situ/surface/ (last access: 7 July 2020), 2020.
Tibbles, M.: The seasonal dynamics of coastal Arctic lagoons in Northwest Alaska, M.Sc. thesis, December, College of Fisheries and Ocean Sciences, University of Alaska Fairbanks, 2018.
Uppström, L. R.: The boron/chlorinity ratio of deep-sea water from the Pacific Ocean, Deep Sea Res. Oceanogr. Abstr., 21, 161–162, https://doi.org/10.1016/0011-7471(74)90074-6, 1974.
van Heuven, S., Pierrot, D., Rae, J. W. B., Lewis, E., and Wallace, D. W. R.: MATLAB Program Developed for CO2 System Calculations, Department of Energy, Oak Ridge, Tennessee, 2011.
Wanninkhof, R.: Relationship between wind speed and gas exchange over the ocean revisited, Limnol. Oceanogr.-Meth., 12, 351–362, https://doi.org/10.4319/lom.2014.12.351, 2014.
Woosley, R. J. and Millero, F. J.: Freshening of the western Arctic negates anthropogenic carbon uptake potential, Limnol. Oceanogr., 65, 1834–1846, https://doi.org/10.1002/lno.11421, 2020.
Wynn, J. G., Robbins, L. L., and Anderson, L. G.: Processes of multibathyal aragonite undersaturation in the Arctic Ocean, J. Geophys. Res.-Oceans, 121, 8248–8267, https://doi.org/10.1002/2016JC011696, 2016.
Yamamoto-Kawai, M., Tanaka, N., and Pivovarov, S.: Freshwater and brine behaviors in the Arctic Ocean deduced from historical data of δO18 and alkalinity (1922–2022 A.D.), J. Geophys. Res.-Oceans, 110, C10003, https://doi.org/10.1029/2004JC002793, 2005.
Zakem, E. J., Mahadevan, A., Lauderdale, J. M., and Follows, M. J.: Stable aerobic and anaerobic coexistence in anoxic marine zones, ISME J., 14, 288–301, https://doi.org/10.1038/s41396-019-0523-8, 2020.
Zeebe, R. E. and Wolf-Gladrow, D. A.: CO2 in seawater equilibrium, kinetics, isotopes, Elsevier, Amsterdam, New York, 2001.
Zhang, Y., Yamamoto-Kawai, M., and Williams, W. J.: Two Decades of Ocean Acidification in the Surface Waters of the Beaufort Gyre, Arctic Ocean: Effects of Sea Ice Melt and Retreat From 1997–2016, Geophys. Res. Lett., 47, e60119, https://doi.org/10.1029/2019GL086421, 2020.