the Creative Commons Attribution 4.0 License.
the Creative Commons Attribution 4.0 License.
 | 04 Mar 2021
Comparison of greenhouse gas fluxes from tropical forests and oil palm plantations on mineral soil
Melissa M. Leduning
Robert I. Griffiths
Tim Goodall
Peter E. Levy
Nicholas Cowan
Edward Comynn-Platt
Garry Hayman
Justin Sentian
Noreen Majalap
Ute M. Skiba
In Southeast Asia, oil palm (OP) plantations have largely replaced tropical forests. The impact of this shift in land use on greenhouse gas (GHG) fluxes remains highly uncertain, mainly due to a relatively small pool of available data. The aim of this study is to quantify differences of nitrous oxide (N2O) and methane (CH4) fluxes as well as soil carbon dioxide (CO2) respiration rates from logged forests, oil palm plantations of different ages, and an adjacent small riparian area. Nitrous oxide fluxes are the focus of this study, as these emissions are expected to increase significantly due to the nitrogen (N) fertilizer application in the plantations. This study was conducted in the SAFE (Stability of Altered Forest Ecosystems) landscape in Malaysian Borneo (Sabah) with measurements every 2 months over a 2-year period. GHG fluxes were measured by static chambers together with key soil physicochemical parameters and microbial biodiversity. At all sites, N2O fluxes were spatially and temporally highly variable. On average the largest fluxes (incl. 95 % CI) were measured from OP plantations (45.1 (24.0–78.5) µg m−2 h−1 N2O-N), slightly smaller fluxes from the riparian area (29.4 (2.8–84.7) µg m−2 h−1 N2O-N), and the smallest fluxes from logged forests (16.0 (4.0–36.3) µg m−2 h−1 N2O-N). Methane fluxes were generally small (mean ± SD): −2.6 ± 17.2 µg CH4-C m−2 h−1 for OP and 1.3 ± 12.6 µg CH4-C m−2 h−1 for riparian, with the range of measured CH4 fluxes being largest in logged forests (2.2 ± 48.3 µg CH4-C m−2 h−1). Soil respiration rates were larger from riparian areas (157.7 ± 106 mg m−2 h−1 CO2-C) and logged forests (137.4 ± 95 mg m−2 h−1 CO2-C) than OP plantations (93.3 ± 70 mg m−2 h−1 CO2-C) as a result of larger amounts of decomposing leaf litter. Microbial communities were distinctly different between the different land-use types and sites. Bacterial communities were linked to soil pH, and fungal and eukaryotic communities were linked to land use. Despite measuring a large number of environmental parameters, mixed models could only explain up to 17 % of the variance of measured fluxes for N2O, 3 % of CH4, and 25 % of soil respiration. Scaling up measured N2O fluxes to Sabah using land areas for forest and OP resulted in emissions increasing from 7.6 Mt (95 % confidence interval, −3.0–22.3 Mt) yr−1 in 1973 to 11.4 Mt (0.2–28.6 Mt) yr−1 in 2015 due to the increasing area of forest converted to OP plantations over the last ∼ 40 years.
Please read the corrigendum first before continuing.
-
Notice on corrigendum
The requested paper has a corresponding corrigendum published. Please read the corrigendum first before downloading the article.
-
Article
(834 KB)
- Corrigendum
-
Supplement
(281 KB)
-
The requested paper has a corresponding corrigendum published. Please read the corrigendum first before downloading the article.
- Article
(834 KB) - Full-text XML
- Corrigendum
-
Supplement
(281 KB) - BibTeX
- EndNote


Deforestation in Southeast Asia is so intense that up to three-quarters of its forests may be lost by the end of the 21st century (Sodhi et al., 2004) and most of the degradation happens because of conversion of forest to croplands and plantations (Wilcove et al., 2013). In Malaysia and Indonesia, more than 16 million hectares of land, mainly from tropical forests but also to a lesser extent other non-profitable agricultural land such as rubber plantations, was cleared for oil palm (OP) (Yan, 2017). Many of the remaining forests are degraded forests, as they have been partially logged to remove specific tree species, and logging activity has caused an increase in forest openings (Houghton, 2012). In 20 % of the world's tropical forests, selective logging occurs, and it is estimated that this accounts for at least half of the anthropogenic greenhouse gas (GHG) emissions from forest degradation (Pearson et al., 2017). Consequently, forest degradation has been recognized as a source of GHG emissions, but little is known of the emissions from the resulting secondary forests, especially from mineral soils in Malaysian Borneo, Sabah. Due to deforestation, fragments of forest remain isolated from each other, which can have consequences for biodiversity and ecosystem function (Ewers et al., 2011).
OP plantations are one of the main causes of deforestation and forest degradation in Southeast Asia (Lee-Cruz et al., 2013; Wilcove et al., 2013), with some disputes about the extent to which industrial plantations are responsible for the loss of old growth and selectively logged forests in Borneo (Gaveau et al., 2016). OP generates the highest yield per hectare of land of any vegetable oil crop. It is used in food products, detergents, soaps, cosmetics, animal feed, and bioenergy and was hence praised as a wonder crop (Sayer et al., 2012). However, OP agriculture is now known to be responsible for soil degradation, loss of soil carbon (C), and reduced soil fertility due to the conversion and management methods (Guillaume et al., 2015; Lee-Cruz et al., 2013). To create an OP plantation, complete deforestation followed by terracing of the land is often the chosen method and not only in hilly terrain. Terracing can result in poor drainage, reduced soil fertility, and increased soil erosion. Conversion of tropical forests also leads to changes in the short- and long-term nutrient status of the converted land-use systems. It is important to understand impacts of these land-use changes in order to identify more environmentally friendly and sustainable management practices (Jackson et al., 2019).
OP plantations are assessed for their GHG emissions, but rarely have emissions from forests and plantations from the same region been reported together, despite the science community calling for flux measurements from forest and converted land simultaneously (van Lent et al., 2015). Much of the focus has been on GHG emissions from tropical forests on peatland and peatland drained for plantations rather than from tropical mineral soils, because of the serious carbon losses when draining the peatlands for crop production. In addition, more attention has been given to carbon fluxes and storage (Germer and Sauerborn, 2008; Hassler et al., 2015) than emissions from the non-CO2 GHG methane (CH4) and nitrous oxide (N2O). Meijide et al. (2020) identified the need to study all three GHGs together in order to assess total emissions from OP plantations. Even though CH4 and N2O are not emitted at the quantity of CO2, their global warming potentials (GWPs) per molecule are 28 and 34 (without and with climate–carbon feedback) and 265 and 298 times higher than CO2 on a 100-year time horizon respectively, which highlights their importance in the climate change debate (Myhre et al., 2013). Due to the serious environmental issues arising from conversion of peatlands to OP plantations, the focus will increasingly shift to mineral soil for conversion to plantations, especially in Malaysia (Shanmugam et al., 2018). However, there are too few measurements reported of N2O emissions from mineral soils in the tropics to draw firm conclusions about the increase in N2O emissions after land-use change from secondary forest to OP (Shanmugam et al., 2018).
Limited measurement and modelling studies have been carried out on N2O emissions from OP plantations (Pardon et al., 2016a, b, 2017), and not in the context of comparing them with other land uses on the same or similar soil type. Similarly, reported CH4 emissions from mineral soils in the tropics (other than from paddy soils) are lacking. Most studies relating land-use change to trace gas emissions have been conducted in South America and not Southeast Asia (Hassler et al., 2015; Veldkamp et al., 2013). An additional caveat of published studies is that most have only been conducted over short periods of time (Hassler et al., 2015). The lack of reliable long-term and multi-year datasets on GHG balances has been recognized (Corre et al., 2014; Courtois et al., 2019). Studies are often associated with high uncertainties (Henders et al., 2015). Nitrogen availability and soil moisture and texture are the main drivers of N2O fluxes in tropical forests and other soil ecosystems (Davidson et al., 2000). As well as agricultural soils, tropical forest soils have been identified as a major source of N2O (Werner et al., 2007), and soil type influences N2O fluxes in the tropics (Dutaur and Verchot, 2007; Sakata et al., 2015). A recent meta-analysis concluded that globally tropical forests emit on average 2 kg N2O-N ha−1 yr−1, and emission rates will significantly increase after land-use change (van Lent et al., 2015). Tropical forest soils are estimated to contribute 28 % to the global CH4 uptake; hence large changes to this sink could alter the accumulation of CH4 in the atmosphere substantially (Dutaur and Verchot, 2007). However, uncertainties are large due to data scarcity. Only one study from Peninsular Malaysia reported that selectively logged forests may be weaker sinks of CH4 and larger sources of N2O than undisturbed tropical rainforest, at least for a short period, because of the increased soil nitrogen availability and soil compaction due to disturbance by heavy machinery (Yashiro et al., 2008).
Forest conversion to OP has shown differences not only in the chemical and physical soil properties, but also in the soil microbial community composition and functional gene diversity (Tripathi et al., 2016). The diversity and abundance of plant communities fundamentally affect the soil microbial community and their function (Eisenhauer, 2016; Tripathi et al., 2016). As of yet, it remains uncertain how conversion from forest to OP impacts microbial communities and their influence on N2O and CH4 fluxes (Kaupper et al., 2019; Tin et al., 2018). Transformation of tropical forest to, for example, OP plantations reduces bacterial abundance initially and alters the community composition but once established may not necessarily result in reduced bacterial richness in the OP soil (Lee-Cruz et al., 2013; Tripathi et al., 2016).
Although the focus of this paper lies on the comparison of soil GHG flux rates (especially for N2O) and their soil chemical and physical properties, we have taken the opportunity to understand the differences in microbial community composition between forests and OP in situ. A previous study has investigated environmental drivers and microbial pathways leading to GHG emissions under controlled laboratory incubations using soils from a subset of the field locations discussed here (Drewer et al., 2020). The aim here was to broadly characterize the microbial communities at the different sites in the different land uses and use the information alongside other measured abiotic factors in mixed models in an attempt to explain the measured fluxes.
The objectives of this study were
-
to compare GHG emission rates from different land uses,
-
to investigate whether management practices and land use will have a larger effect on GHG fluxes than other measured abiotic and biotic parameters, and
-
to broadly upscale our measurements to the Sabah scale.
The following specific hypotheses are included:
-
N2O fluxes will be larger from OP plantations due to N fertilizer addition compared to tropical forest.
-
Land use determines microbial diversity and thereby influences N2O flux rates.
In light of countries committing to reduce and mitigate GHG emissions, e.g. 2015 Paris Agreement (UNFCCC, 2015), it is important to constrain each country's current emission rates, by providing data from measurements rather than relying on model estimates. In this study, we present much needed data of N2O and CH4 fluxes from logged tropical forests and OP plantations on mineral soil as well as their biochemical characteristics and temporal and spatial variability.
2.1 Site description
The present study was carried out within the Stability of Altered Forest Ecosystems (SAFE) project in Malaysian Borneo (4∘49′ N, 116∘54′ E) in 2015 and 2016. The SAFE project was set up in Sabah in 2011 in a secondary forest, designated by the Sabah government for conversion to OP plantations. SAFE is a long-term landscape-scale experiment designed to study the effects of anthropogenic activities related to deforestation and OP agriculture on the ecosystem as a whole (Ewers et al., 2011). The main aim of the SAFE project is to study how habitat fragmentation affects the forest ecosystem, mainly its biodiversity. The design comprises forest fragments of 1, 10, and 100 ha. Larger areas of forests, designated as continuous logged forests, and not part of the conversion plan, were selected as controls. All forest sites had been selectively logged for dipterocarps, first in the 1970s and then again between 2000 and 2008, such that the logged forest and forest fragments have a similar land-use history (Ewers et al., 2011). We had the opportunity to investigate GHG fluxes within this experimental site. To be consistent with previous and future SAFE publications, we use the site labelling as per the SAFE convention, detailed below. As our sampling took place when forest conversion to OP was still ongoing (i.e. designated fragments were not fragmented yet), we classify sampling locations in fragments and logged forest both as logged forest. We selected a young OP plantation, around 2 years old at the time we started measurements (OP2), and a medium-aged OP plantation, around 7 years old at the start of the project (OP7). The riparian reserve area (RR), draining into a small shallow stream, is adjacent and downslope from OP7. In addition, we selected a slightly older plantation, around 12 years of age at the start of the project (OP12). All OP plantations in this study were terraced. Logged forest sites are the 10 ha plots of the logged forest (and future fragments) LF, B, and E of the SAFE design.
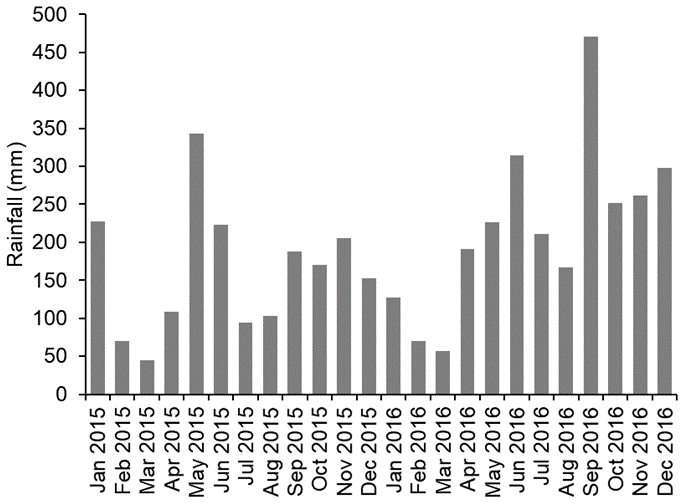
The climate in the study area is wet tropical with a wet season typically from October to February and a dry season typically from March to September with average monthly temperatures of 32.5 ∘C (irrespective of season) and average monthly rainfall of 164.1 mm (https://en.climate-data.org/, last access: 6 March 2020). At SAFE, the mean monthly rainfall over the 2-year study period (2015 and 2016) was 190 mm, ranging from 45 mm during the driest month (March 2015) to 470 mm during the wettest month (September 2016; Rory Walsh, Fig. 1). Annual rainfall was 1927 mm in 2015 and 2644 mm in 2016 with 2015 being drier than usual. The soils at SAFE are classed as orthic Acrisols or Ultisols (Riutta et al., 2018).
2.2 Field measurements
In order to measure fluxes of N2O and CH4 from the chosen logged forests and OP plantations, a total of 56 static chambers were installed in the SAFE landscape (total area 8000 ha). Eight chambers were placed in the 10 ha plots in logged forests LF, B, and E. In the OP plantations, 8 chambers were placed in a ∼ 2-year-old plantation (OP2), 8 in a ∼ 12-year-old plantation (OP12), 12 in the ∼ 7-year-old OP plantation (OP7), and 4 in an adjacent riparian reserve area (RR). These were the plantation ages when soil sampling and flux measurements started in 2015; hence, the sites are labelled OP2, OP7, and OP12. For exact GPS locations, see the published dataset (Drewer et al., 2019). Fluxes were measured from all 56 chambers every 2 months over a 2-year period, from January 2015 to November 2016, resulting in 12 measurement occasions for each of the chambers and a total of 672 individual flux measurements.
We only received basic fertilizer information from the estate managers at the beginning of our study. The OP2 and OP7 plantations were managed by the same estate. Fertilizer was applied as slow-release (over 4–6 months) bags (500 g) of the brand “PlantSafe®” (N as ammonium sulfate). For palms 0–5 years of age, PlantSafe® 12-8-16-1.5+trace elements (diammonium phosphate ((NH4)2PO4), muriate of potash (KCl), ammonium sulfate ((NH4)2SO4), magnesium sulfate (MgSO4)+ borax pentahydrate) were used, and for palms >5 years of age, PlantSafe® 8-8-27-15 was applied as a 2 kg bag per plant, three times per year. Planting density was approximately 9 m × 9 m spacing between palms. In addition to the mineral fertilizer, empty fruit bunches (EFBs) were spread; however, there appeared to be no obvious pattern of application, and most EFBs were piled up along the main roads, rather than distributed evenly throughout the plantations. The OP12 plantation was managed by a different estate. Distance between the palms and planting density here was 8 m × 8 m. Application of fertilizer also occurred as PlantSafe® bags with two applications per year and rates of 3–4 kg per palm each time, totalling about 8 kg N ha−1 yr−1. EFBs were not returned to this plantation, and glyphosate was applied three times per year around each palm stem to control weeds. We assume glyphosate was also applied to the OP2 and OP7 plantations in the other estate as well. Generally, fertilizer management was carried out according to recommendations by the Malaysian Palm Oil Board (MPOB). Because of the slow-release nature of the fertilizer, we did not expect large peaks following fertilization, and we sampled every 2 months over 2 years to capture the long-term differences.
2.2.1 Soil nitrous oxide (N2O) and methane (CH4) fluxes
The static chamber method was used for N2O and CH4 flux measurements as described in previous studies (Drewer et al., 2017a, b). Round static collars (diameter = 40, height 10 cm) fitted with a 5 cm wide flange at the top end were inserted into the ground to a depth of approximately 5 cm for the entire 2-year study period. For flux measurements, chambers (diameter = 40, height 25 cm) fitted with a flange at the bottom of the chamber were fastened onto the bases using four strong clips, only during the 45 min measurement periods. The collars, chamber, and flanges consisted of opaque polypropylene. A strip of commercially available draft excluder glued onto the flange of the lid provided a gas-tight seal between chamber and lid. The lids were fitted with a pressure compensation plug to maintain ambient pressure in the chambers during and after sample removal. Gas samples were taken at regular intervals (0, 15, 30, 45 min) from each chamber. A three-way tap was used for gas sample removal using a 100 mL syringe. The 20 mL glass vials were filled with a double-needle system to flush the vials with 5 times their volume and remained at ambient pressure rather than being over-pressurized. The sample vials were sent to UKCEH Edinburgh for analysis usually between 4–7 weeks after sampling. A specifically conducted storage test confirmed no significant loss of concentration during that time period. Samples and three sets of four certified standard concentrations (N2O, CH4 in N2 with 20 % O2) were analysed using a gas chromatograph (Agilent GC7890B with headspace autosampler 7697A; Agilent, Santa Clara, California) with a micro-electron capture detector (µECD) for N2O analysis and flame ionization detector (FID) for CH4 analysis. These detectors were set up in parallel, allowing the analysis of the two GHGs at the same time. Limit of detection was 5 ppb for N2O and 40 ppb for CH4. Peak integration was carried out with OpenLab© Software Suite (Agilent, Santa Clara, California).
The flux F (µg m−2 s−1) for each sequence of gas samples from the different chambers was calculated according to Eq. (1):
where dC dt is the concentration (C, µmol mol−1) change over time (t, in s), which was calculated by linear regression, is the number of molecules in the enclosure volume-to-ground surface ratio, where ρ is the density of air (mol m−3), V (m3) is the air volume in the chamber, and A (m2) is the surface area in the chamber (Levy et al., 2012).
Fluxes were quality checked and checked for linearity, and no saturation occurred during the time sampled (2 min for CO2 and 45 min for N2O and CH4), so linear was the best fit for all fluxes presented here. Applying the analytical limit of detection to the flux calculation, the resulting detection limits and therefore uncertainties associated with the flux measurements are 1.6 µg N m−2 h−1 for N2O and 5 µg C m2 h−1 for CH4 in the units used in the Results section.
2.2.2 Soil respiration (CO2) fluxes
In addition, soil CO2 respiration rates were measured close to each chamber location using a dynamic chamber (volume: 0.001171 m3) covering 0.0078 m2 of soil for 120 s with an EGM-4 infrared gas analyser (IRGA: infrared gas analyser; PP Systems; Hitchin, Hertfordshire, England). To do so, cut drainpipes of 7 cm height matching the diameter of the IRGA chamber were inserted into the ground to a depth of about 5 cm for the duration of the study to allow for a good seal with the soil surface. All vegetation and litter were removed from the surface at the beginning of the measurement period to guarantee soil-only respiration measurements. Taking into account the time of measurement and the soil temperature, fluxes were calculated based on the linear increase in CO2 concentrations. Soil respiration was measured every time N2O and CH4 fluxes were measured, resulting in 12 measurement occasions for each of the 56 locations and 672 individual measurements.
2.2.3 Auxiliary physical and chemical soil measurements
Other environmental parameters were measured during time of chamber enclosure as possible explanatory variables for correlation with recorded GHG fluxes. Soil and air temperatures were measured using a handheld Omega HH370 temperature probe (Omega Engineering UK Ltd., Manchester, UK) at each chamber location at a soil depth of 10 cm and by holding the temperature sensor 30 cm above the soil surface at chamber height. Volumetric soil moisture content (VMC) was measured at a depth of 7 cm using with a portable probe (HydroSense II; Campbell Scientific, Loughborough, UK). For determining KCl-extractable soil nitrogen (N) in the field, soil samples were collected to a depth of 10 cm around each of the chamber locations on each of the chamber measurement days, using a gouge auger. Extractions were carried out in the field laboratory on the same day. Soil samples were mixed well, stones were removed, and subsamples of ca. 6 g soil (fresh weight) were transferred into 50 mL falcon tubes containing 25 mL 1 M KCl solution. The samples were shaken for 1 min every 15 min for 1 h and then filtered through Whatman 42© filter paper (GE Healthcare, Chicago, USA) and kept in the fridge after addition of a drop of 75 % H2SO4 as a preservative. Analysis for ammonium (NH) and nitrate (NO) concentrations was carried out at Forest Research Centre in Sandakan (Sabah, Malaysia) using a colorimetric method (Astoria 2 analyser (Astoria-Pacific Inc., USA)).
The following parameters were measured less frequently. Soil pH was measured on three occasions from the top 0–10 cm, close to each chamber at the start of the measurement period and 2 months later, and inside the chambers after the last flux measurements at the end of the experiment. For pH measurements, 10 g of fresh soil was mixed with deionized H2O (ratio 1:2), and after 1 h it was analysed on a MP 220 pH meter (Mettler Toledo GmbH, Schwerzenbach, Switzerland). Soil samples for bulk density were collected from inside each chamber after the final flux measurement at the end of this study. Galvanized iron rings (98.17 cm3) with a sharp edge were inserted in the upper soil layer with a hammer to 5 cm depth without compaction. Samples were oven-dried at 105 ∘C until constant weight (usually 48 h) and bulk density (g cm−3) were calculated based on the dry weight occupying the volume of the ring. Total C and N in soil and litter were measured once on the last sampling occasion. Soil samples were taken from the top 0–10 cm inside the chambers. The samples were air-dried in the field laboratory, and a subsample of each was dried at 105 ∘C to constant weight in the laboratory to convert the results to oven-dried weight. The samples were then ground and analysed at the Forest Research Centre in Sandakan on an elemental analyser (vario MAX CN elemental analyser (Elementar Analysensysteme, Germany). Litter was collected from the surface area of each chamber, air-dried at 30 ∘C, and analysed for total C and N as described above.
2.2.4 Soil microbial community composition
Soil samples for microbial analysis were taken on two occasions from all 56 flux chamber locations in March 2016 and November 2016 (the last sampling occasion). On the first sampling date, soil was taken close to each chamber in order not to disturb the soil inside the chamber. In November 2016, soil was taken from inside each chamber, as this was the experimental end date. Approximately 5 g of soil was taken from the top 3 cm and stored in ziplock bags at ambient air temperature until posting to UKCEH Wallingford for analysis. The soil samples had to be sent as “fresh” samples as there were no freezers operating continuously at the field station; therefore it was not possible to keep the soil frozen during storage and transport. The samples were frozen at −80 ∘C once they reached UKCEH Wallingford until analyses.
For sequencing analyses of bacterial and fungal and soil eukaryotic communities, DNA was extracted from 0.2 g of soil using the PowerSoil-htp 96 Well DNA Isolation kit (Qiagen Ltd, Manchester, UK) according to manufacturer's protocols. The dual indexing protocol of Kozich et al. (2013) was used for Illumina MiSeq sequencing (Kozich et al., 2013), with each primer consisting of the appropriate Illumina adapter, 8 nt index sequence, a 10 nt pad sequence, a 2 nt linker, and the amplicon-specific primer. The V3–V4 hypervariable regions of the bacterial 16S rRNA gene were amplified using primers 341F (Muyzer et al., 1993) and 806R (Yu et al., 2005) and CCTACGGGAGGCAGCAG and GCTATTGGAGCTGGAATTAC respectively. The ITS2 region for fungi was amplified using primers ITS7f (GTGARTCATCGAATCTTTG) and ITS4r (TCCTCCGCTTATTGATATGC) (Ihrmark et al., 2012), and for eukaryotes the 18S rRNA amplicon primers from Baldwin et al. (2005) were used (AACCTGGTTGATCCTGCCAGT and GCTATTGGAGCTGGAATTAC). After an initial denaturation at 95 ∘C for 2 min, polymerase chain reaction (PCR) conditions were denaturation at 95 ∘C for 15 s; annealing at temperatures 55, 52, and 57 ∘C for 16S, ITS, and 18S reactions respectively; annealing times were 30 s with extension at 72 ∘C for 30 s; cycle numbers were 30; and a final extension of 10 min at 72 ∘C was included. Amplicon concentrations were normalized using SequalPrep Normalization Plate Kit (Thermo Fisher Scientific Ltd, Altrincham, UK) prior to sequencing each amplicon library separately on the Illumina MiSeq using V3 chemistry using V3 600 cycle reagents at concentrations of 8 pM with a 5 % Illumina PhiX Control library (Illumina Ltd, Cambridge, UK).
Illumina demultiplexed sequences were processed in the R software package, version 3.6.1 (R Core Team, 2017) using DADA2 (Callahan et al., 2016) to quality filter, merge, denoise, and construct sequence tables as follows: amplicon reads were trimmed to 270 and 220 bases, forward and reverse respectively for ITS, and forward reads were trimmed to 250 and 280 bases for 16S and 18S respectively. Filtering settings were maximum number of Ns (maxN) = 0 and maximum number of expected errors (maxEE) = (1, 1). Sequences were dereplicated, and the DADA2 core sequence variant inference algorithms were applied. Forward and reverse reads were merged using the mergePairs function as appropriate. Sequence tables were constructed from the resultant actual sequence variants, and chimeric sequences were removed using removeBimeraDenovo default settings.
2.3 Data analysis
Environmental data, especially soil N2O fluxes, are typically highly variable in space and time, which makes their statistical analysis challenging. Much of the variation cannot be explained by co-variates, as the driving microbial processes are not directly observed. They are also usually strongly left skewed (containing a high number of very small fluxes) and are expected to approximate a lognormal distribution. Against this background, trying to detect effects of land use (or experimental treatments) is difficult. The calculation of a confidence interval on the mean of a lognormal distribution is problematic when variability is high and sample size is small (e.g. Finney, 1941), as is generally the case with flux measurements.
Here we applied a Bayesian methodology to address this problem, using a model similar to that described by Levy et al. (2017). This accounts for the lognormal distribution of observations, while including hierarchical effects of land use and effects of sites within land-use types as well as the repeated measures. In the current statistical terminology, this is a generalized linear mixed-effect model (GLMM) with a lognormal response and identity link function. The model consists of a fixed effect of land use (forest, oil palm, or riparian), with a random effect representing the variation among sites within a land-use type. The parameters were estimated by the Markov chain Monte Carlo (MCMC) method, using Gibbs sampling as implemented in Just Another Gibbs Sampler (JAGS) (https://cran.r-project.org/web/packages/rjags/index.html, last access: 6 March 2020) and described in more detail by Levy et al. (2017). The model can cope with the slight imbalance in the design and propagates the uncertainty associated with the relatively small sample sizes appropriately.
All other statistical analyses were conducted using the R software package, version 3.4.3 (R Core Team, 2017) using the lme4 package for linear mixed-effect models (Bates et al., 2015) and ordinary multiple regression. Model selection was examined by sequentially dropping terms and assessing the Akaike information criterion (AIC) and similar criteria using the MuMIn package (Bartoń, 2013). For N2O and CH4, where negative values occurred, the minimum was added to all data points (−30 and −115 µg m−2 h−1 respectively) so that a lognormal distribution could be fitted.
For microbial community composition, samples within each sampling point were assessed in R for sequencing depth. Samples with fewer than 4000 reads were deemed as containing insufficient data and discarded. The package vegan was used to rarefy each sampling occasion's samples to the minimum read number. Vegan functions specnumber, diversity, and metaMDS were used to generate the statistics for richness, Shannon's diversity, and nonmetric multidimensional scaling respectively. Analysis of similarities (ANOSIM) was used to test statistically whether there was a significant difference between two or more groups of parameters in relation to the microbial communities.
2.4 Upscaling of N2O fluxes to Sabah scale
In an attempt to broadly upscale our findings, we calculated the annual soil N2O emission for the Sabah state based on the data from this study (Table 2), together with land cover areas estimates (Gaveau et al., 2016) of forests, pulpwood, and OP plantations for 1973 and six 5-yearly intervals from 1990–2015. We included the pulpwood plantation area in the total forest area, as to our knowledge there are no data of N2O emissions from this sector. We used mean emissions and the 95 % confidence interval calculated by the GLMM and posterior probability to account for variability and associated uncertainties.
3.1 Soil parameters
Results are presented by site (B, E, LF, OP2, OP7, OP12, RR) or land use (logged forest (B, E, LF), oil palm (OP2, OP7, OP12), riparian (RR)). Soil pH was acidic from the logged forest site B (pH 3.65 ± 0.44) compared to forest E and LF, which were closer to neutral (pH 6.38 ± 0.67 and 6.14 ± 0.5), and the OP plantations were more acidic (pH 4.5–4.7 ± 0.2) compared to the riparian area (pH 5.8 ± 0.55) (Table 1). Bulk density was lower at the forest sites (∼ 0.81 g cm−3) compared to the OP plantations (∼ 1.26 g cm−3) mainly due to a higher amount or organic matter and litter in the forest sites (B, E, LF) and a combination of compaction due to land management and lower organic matter content in the OP plantations and riparian area (OP2, OP7, OP12, RR) (Table 1). Total carbon (C) and nitrogen (N) in soil were higher in the logged forest sites (∼ 3 % C–7 % C and ∼ 0.25 % N–0.4 % N, albeit with a very high variability) than the OP plantations (<1 % C and <0.1 % N) (Table 1) due to a larger amount of litter present. The riparian reserve had higher content of C and N in the soil (1.2 % C, 0.15 % N) than the OP plantations but not as high as the logged forests. Variability even within one site was large for the forest sites, which is also reflected in the ratios (Table 1). Litter was present in all of the forest and riparian reserve chambers and only in a few of the OP chambers. The average litter weight in the forest chambers was between 50 and 150 g dry weight with a very high variability, about 15 g in the riparian area, and hardly any litter in the OP chambers, with no litter in OP12, only in one of the OP7 chambers and an average amount of 50 g of litter in the young OP2, again with a very high variability (Table 1). The total C and N content in litter was similar in logged forest and OP (∼ 35 % C–40 % C and ∼ 1.5 % N–1.8 % N); the main difference was the presence or absence of litter and the amount present. For all these measured parameters the variability within each site was high apart from pH in OP, which was most likely regulated by plantation management operations. Because of the large temporal and spatial variabilities, none of the soil physicochemical parameters were significantly different for the different land uses or sites apart from pH from site B.
Table 1Soil physicochemical parameters: pH (mean of three sampling occasions and replicate chambers at each site), bulk density (mean of replicate chambers at each site from one sampling occasion), and total C and total N in soil from the top 1–10 cm and leaf litter in the chambers (from replicate chambers on one sampling occasion), from the different sites (LF (n=8), B (n=8), E (n=8): logged forest; OP2 (n=8), OP7 (n=12), OP12 (n=8): oil palm; RR (n=4): riparian reserve).

∗ Only one of the OP7 chambers had litter present. n/a: not applicable.
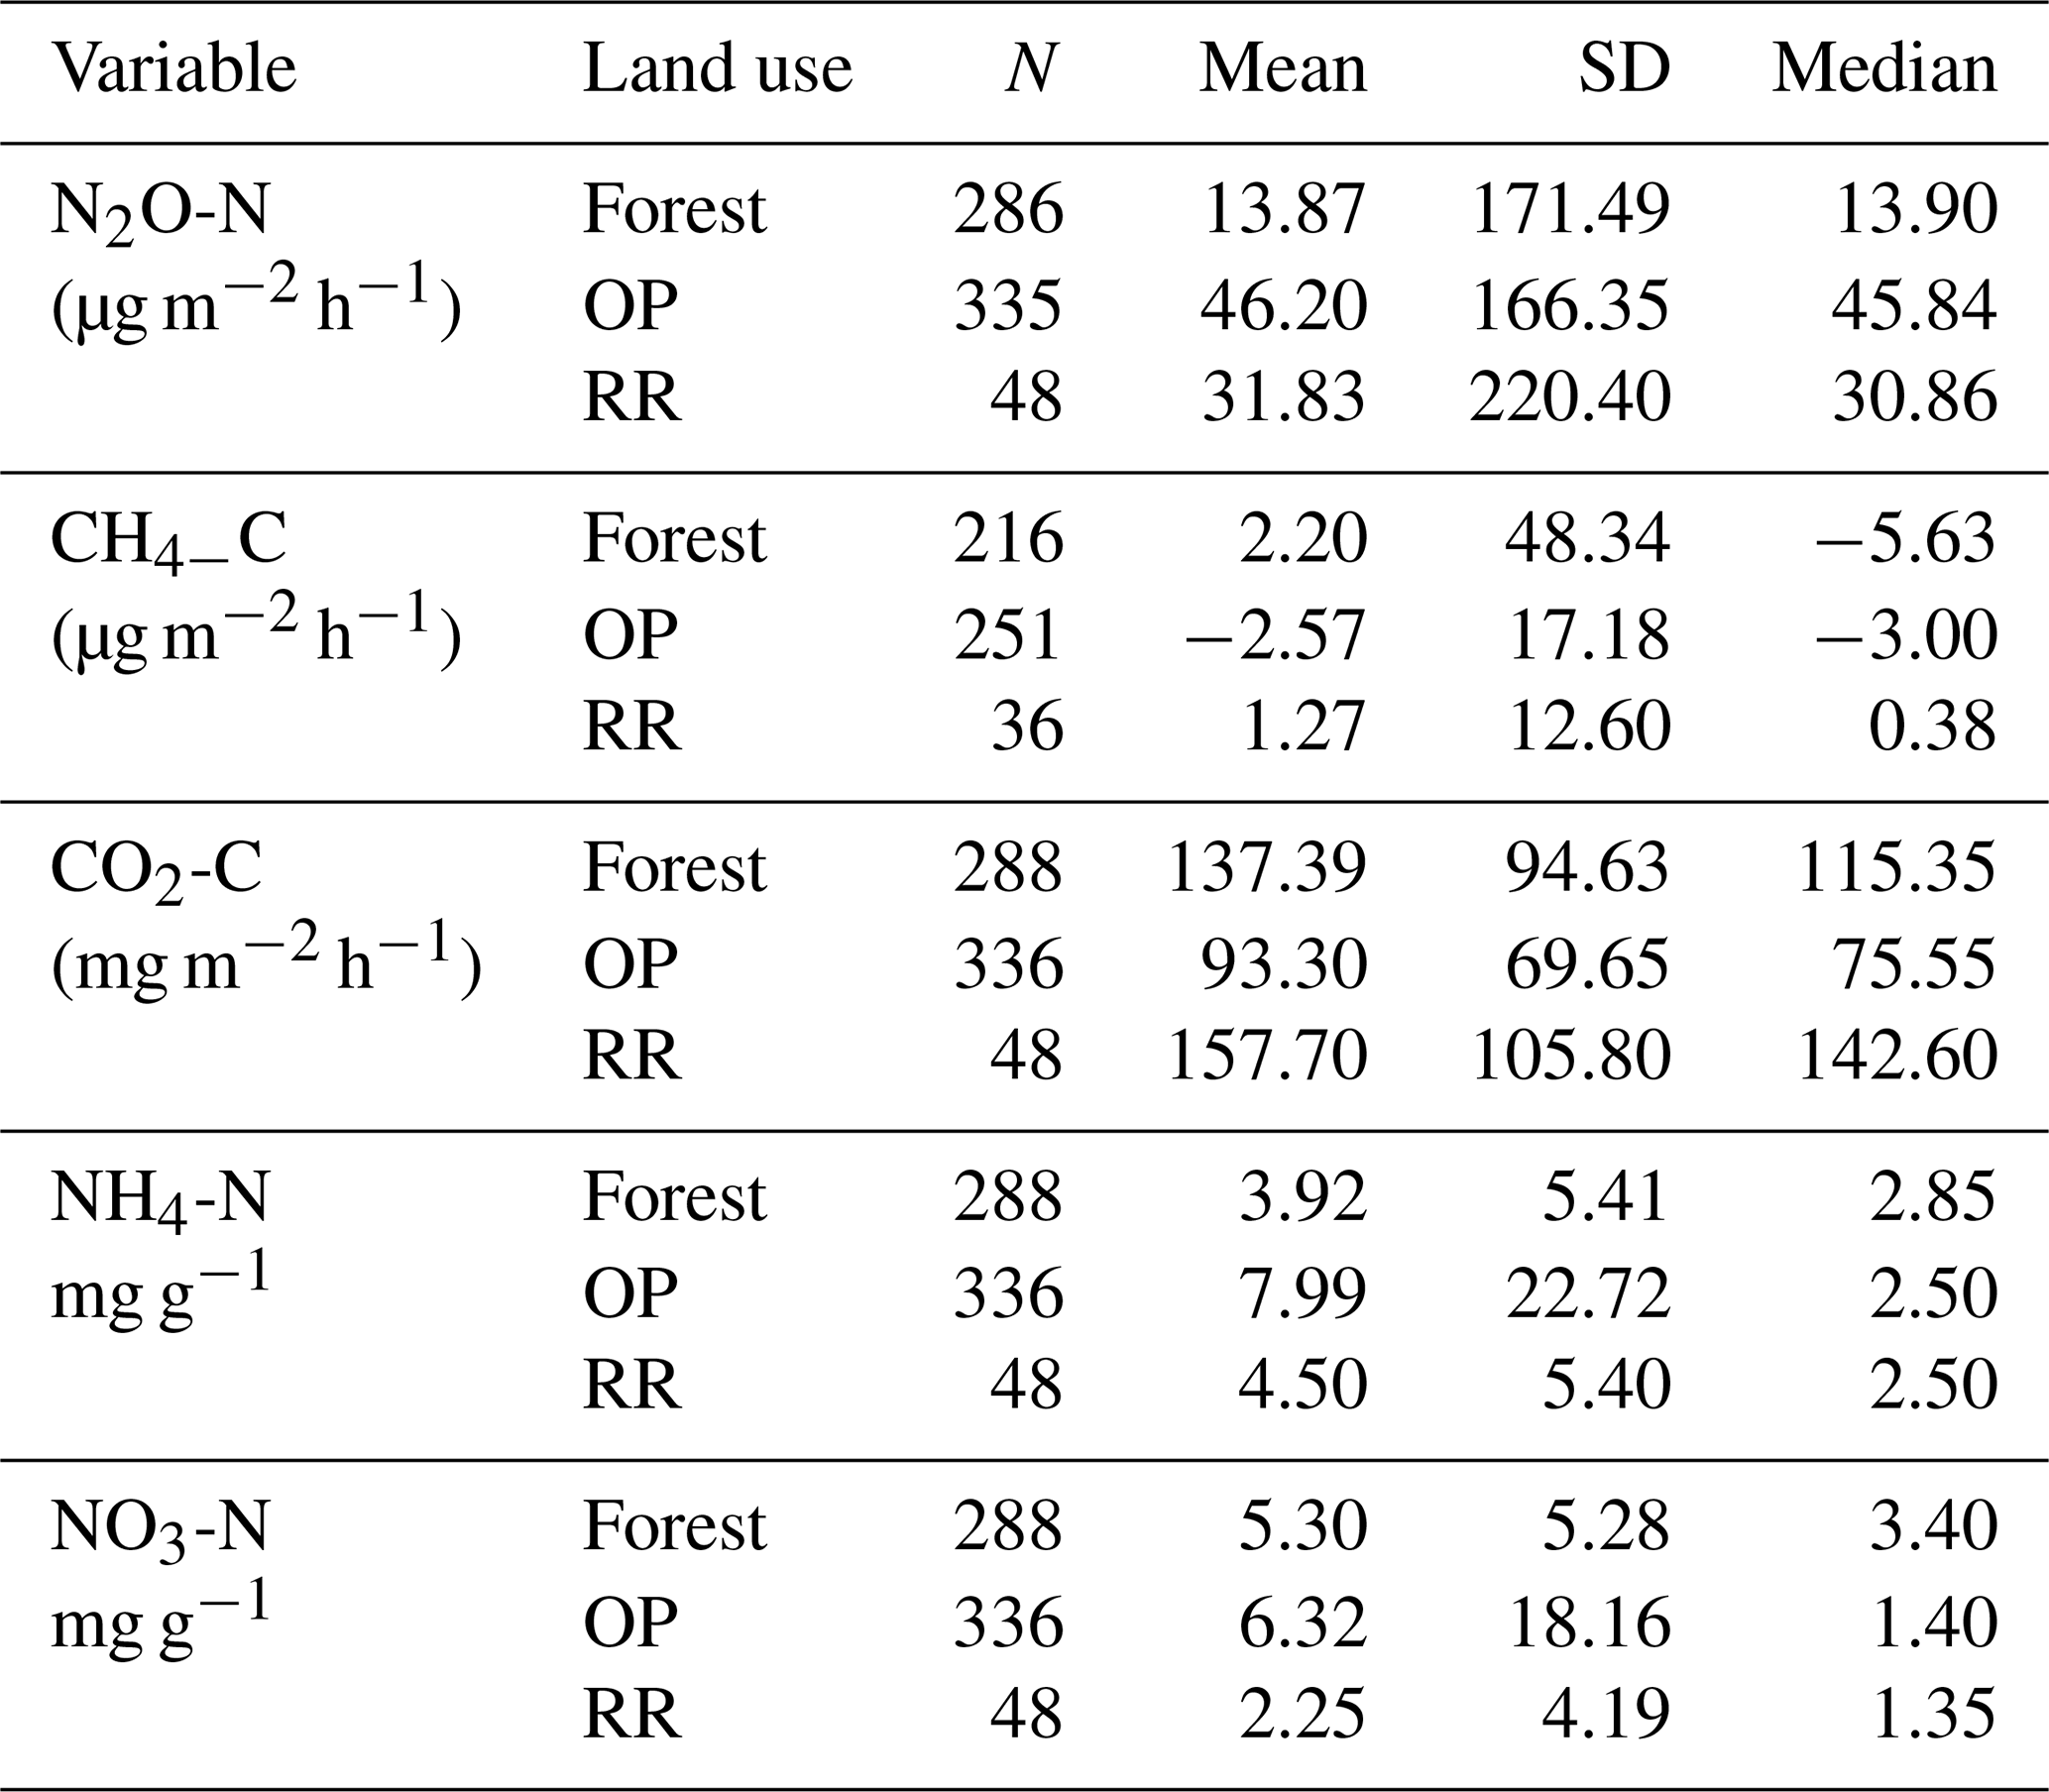
Table 2Greenhouse gas fluxes (N2O-N, CH4-C, soil respiration CO2-C) and soil mineral nitrogen (NH4-N and NO3-N) averaged over the entire measurement period (January 2015–November 2016) by land use. N: number of individual data points; SD: standard deviation; forest: logged forest; OP: oil palm; RR: riparian reserve.
Soil moisture had high variability both spatially and temporally, with a large range for all land uses (Fig. 2a) and no discernable temporal trend. The riparian reserve tended to have slightly higher soil moisture than the adjacent OP plantation due to proximity to a little stream and ground cover vegetation. The highest soil temperatures were measured in the young OP, which had no canopy closure or shaded areas (Fig. 2b). Soil temperature was slightly higher in the riparian reserve than the adjacent OP7, likely due to trees with much less canopy cover compared to the 7-year-old OP plantation. In summary, there was no discernible temporal trend of soil moisture or temperature over the 2-year measurement period and no apparent difference between wet and dry seasons.
Soil extractable mineral N (both NH and NO) was highly variable across the OP plantations with mean values of 8 ± 23 and 6.3 ± 18 mg N g−1 respectively; 4.5 ± 5 and 2.3 ± 4 mg N g−1 in riparian; and 3.9 ± 5 and 5.3 ± 5 mg N g−1 in the forests (Fig. 3, Table 2). We measured the lowest average NH and NO concentrations in the 12-year-old plantation (OP12) and the highest in the youngest OP plantation (OP2) with maxima of >150 mg g−1, however with a very high spatial variability (Fig. 3, Table 2). It is not possible to correlate soil mineral N concentrations with individual fertilizer events due to the low frequency of soil and flux sampling (every 2 months) and the lack of knowledge of the fertilization dates and release rates from the fertilizer bags. NH and NO concentrations of the logged forest sites, older OP plantation, and riparian reserve were very similar.
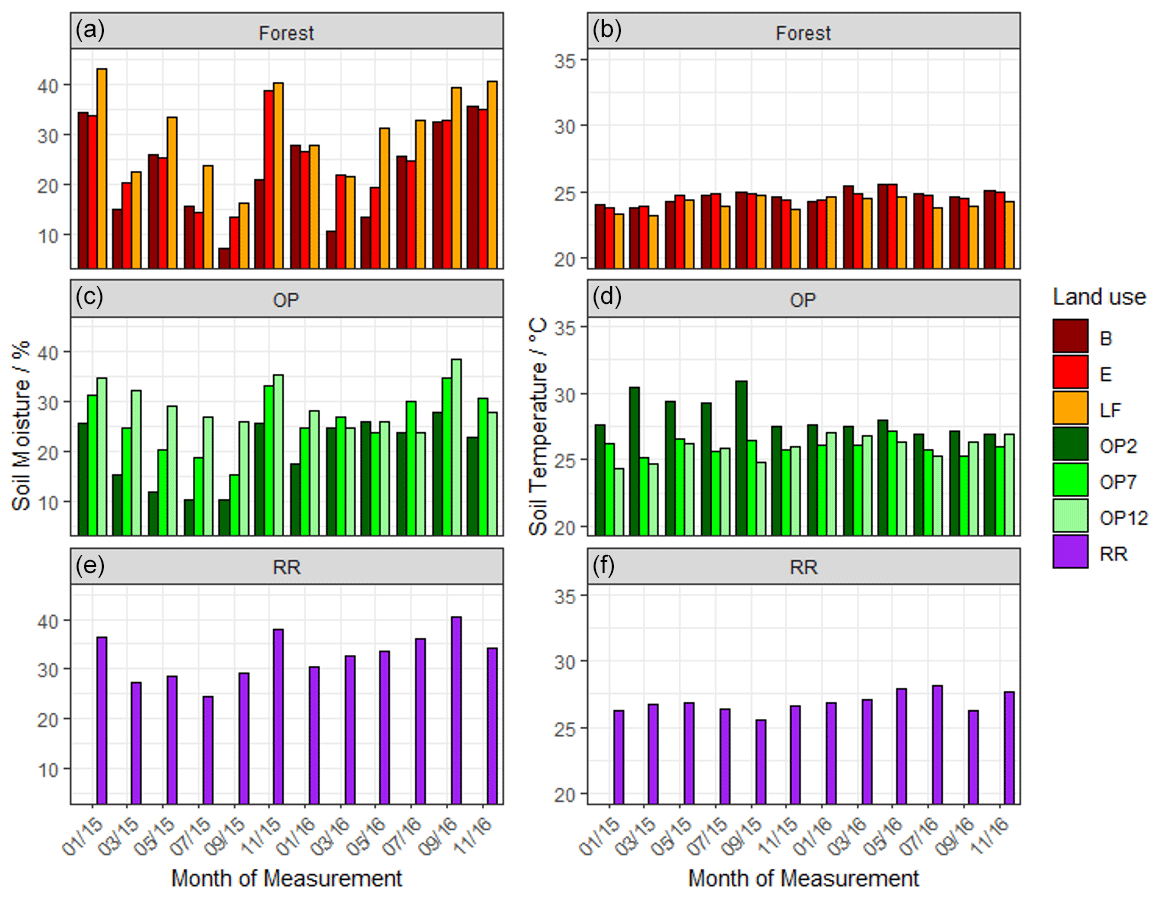
Figure 2Mean volumetric soil moisture (a) and mean soil temperature (b) from January 2015–November 2016, every 2 months: (a, b B, E, LF: logged forests; c, d OP2, OP7, OP12: oil palm plantations; e, f RR: riparian reserve).
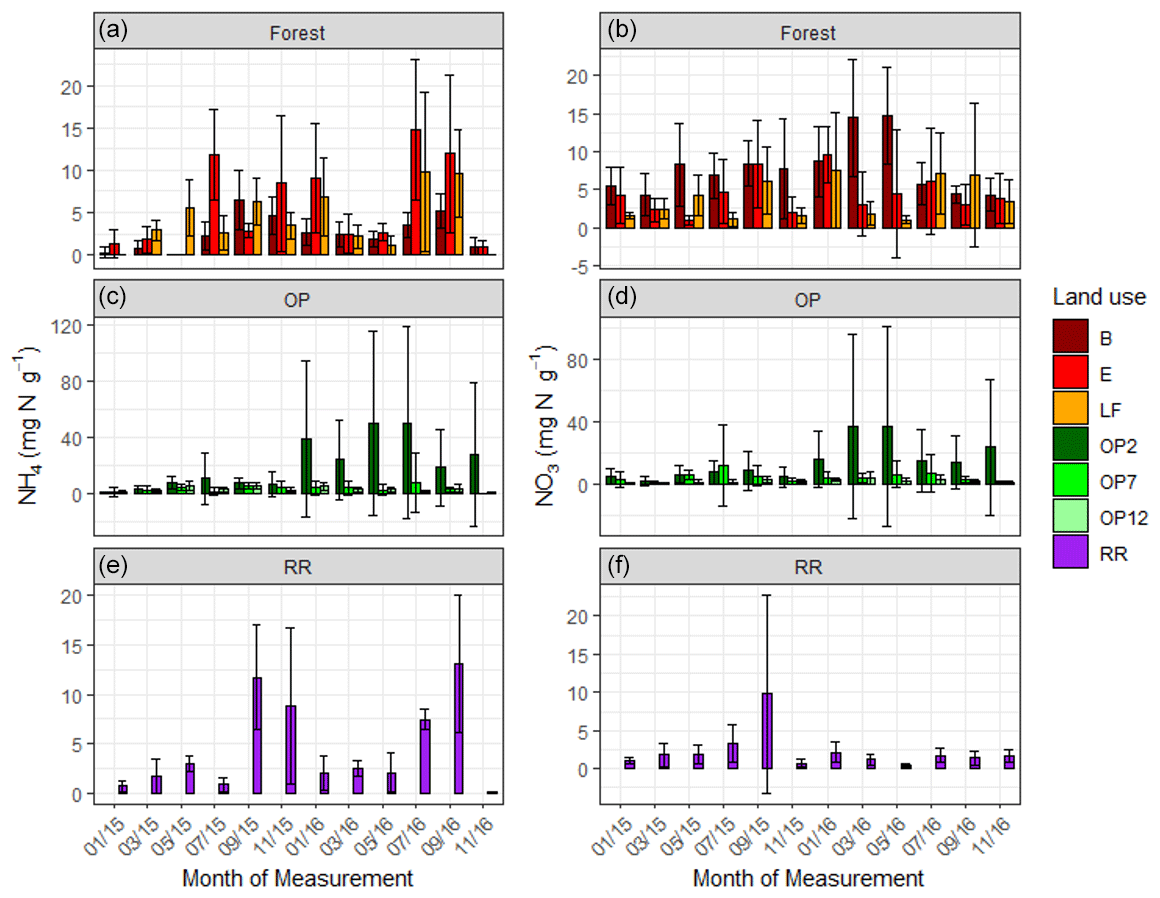
Figure 3Mean mineral N as KCl-extractable NH (a) and NO (b) from January 2015–November 2016, every 2 months (a, b B, E, LF: logged forests; c, d OP2, OP7, OP12: oil palm plantations; e, f RR: riparian reserve). Error bars represent standard deviation of the samples around the mean. Please note the different y-axis scale for OP.
3.2 Greenhouse gases
3.2.1 Nitrous oxide (N2O)
There were no temporal trends of nitrous oxide (N2O-N) fluxes and no distinct differences between wet (usually October to February) and dry (March to September) seasons (Fig. 4a). Variability in N2O-N fluxes for all sites was high, and the largest range was measured in the OP plantations (Fig. 4a, Table 2, Supplement Fig. S1). On a given day, very large as well as very small fluxes were measured in the OP plantations. The largest fluxes were observed from the young (OP2) and old (OP12) oil palm plantations and exceeded 1500 µg m−2 h−1 N2O-N for individual chambers. In the logged forest, the largest fluxes were ∼ 400 µg m−2 h1 for individual chambers at site B. For each land use, standard deviation was a lot larger than the mean (Table 2): logged forest 13.9 ± 171 µg m−2 h−1 N2O-N, OP 46.2 ± 166 µg m−2 h−1 N2O-N, and riparian area 31.8 ± 220 µg m−2 h−1 N2O-N. By fitting the GLMM to the data, we estimated the posterior probability density of the effect of land use on N2O flux: mean fluxes are 13.9 (95 % CI: −6.3 to 41.5) µg m−2 h−1 for logged forests, 46.2 (18.4 to 97.5) µg m−2 h−1 for OP, and 31.8 (−6.3 to 130.0) µg m−2 h−1 for the riparian area (Fig. 4b, Table 2). The output using the Bayesian approach can be interpreted as follows. The area of the OP curve does not overlap with the area of the forest curve, which means that the probability is higher that the flux from OP plantation is higher than the flux from logged forest, with the riparian area being intermediate. To investigate effects of additional variables, we used the automated model selection algorithm in the MuMIn R package, which uses all possible combinations of fixed-effect terms and ranks them by AIC (Bartoń, 2013). Possible terms included land use, pH, soil moisture, NH, NO, bulk density, soil and air temperature, and the microbial non-metric multidimensional scaling (NMDS) axes. This procedure found the inclusion of NH and NO, soil moisture, and soil temperature, in addition to land use, to provide the optimal model. However, whilst land use (including the site-level effects) explained 13 % of the variance (expressed as conditional R2; Bartoń, 2013), the additional four terms increased this by only 4 %. The microbial NMDS axes did not improve the model fit, as measured by AIC.
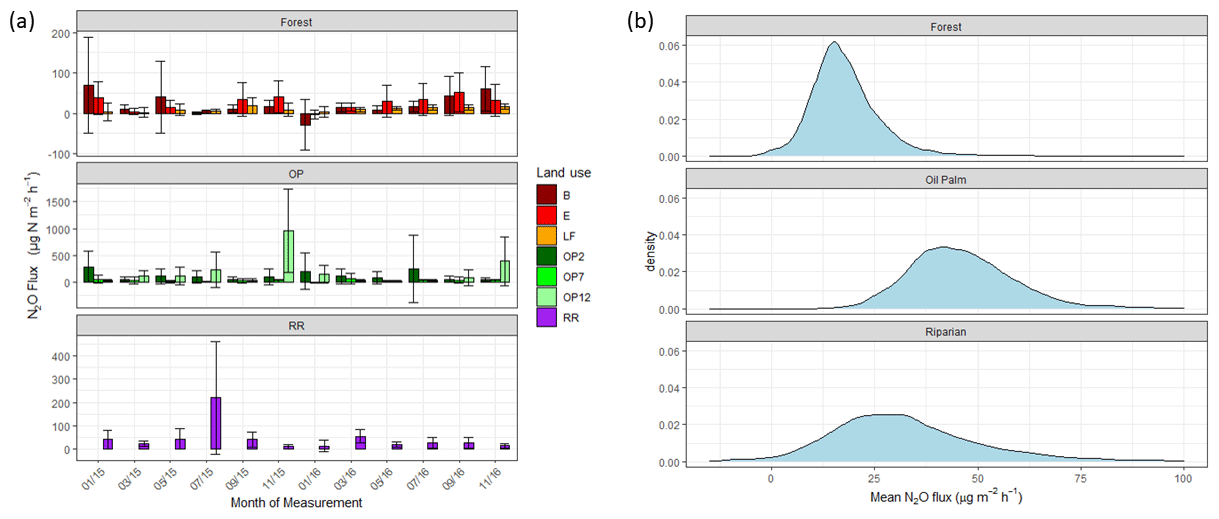
Figure 4(a) Nitrous oxide (N2O-N) fluxes in µg m−2 h−1 from January 2015–November 2016, every 2 months (upper panel – B, E, LF: logged forests; middle panel – OP2, OP7, OP12: oil palm plantations; bottom panel – RR: riparian reserve). Bars are the mean for each site, and error bars are the standard deviation of number of chambers per site. Please note different y-axis scales for each land use. (b) Posterior probability density of the mean nitrous oxide flux from each land use, estimated by the Bayesian GLMM described in the text.
3.2.2 Methane (CH4)
For methane, both negative fluxes (= net CH4 oxidation) and positive fluxes (net CH4 emission) were measured at all sites throughout the measurement period (Fig. 5, Supplement Fig. S2). The highest emission and uptake rates were measured in the logged forest sites, with emissions reaching almost 300 µg m−2 h−1 CH4-C at site E and uptake rates of up to 85 µg m−2 h−1 CH4-C at sites LF and B. In the OP plantations the highest emissions were measured at OP7 (∼ 100 µg m−2 h−1 CH4-C), and uptake rates were <50 µg m−2 h−1 CH4-C. Overall, CH4 flux ranges were larger in the logged forests than OP plantations. Grouping fluxes by land use, mean fluxes were about 2.2 ± 48.3 µg CH4-C m−2 h−1 for logged forest, −2.6 ± 17.2 µg CH4-C m−2 h−1 for OP, and 1.3 ± 12.6 µg CH4-C m−2 h−1 for riparian reserve (Table 2). The magnitudes of CH4-C fluxes in the riparian reserve were more similar to the logged forest sites than the OP plantations. Standard deviations again were large but not as large as for N2O.
As for N2O, possible drivers of CH4 fluxes were investigated using linear mixed-effect models and the same model selection methods. However, no correlations with co-variates could be established, even with land use. For example, a model including terms for land use, pH, soil moisture, NO3, NH4, bulk density, and soil and air temperature could explain only 3 % of the variance. Land use was clearly not a strong determinant of CH4 flux, and the posterior distributions are not shown.
3.2.3 Soil respiration (CO2)
Soil respiration CO2-C rates were also spatially highly variable (Fig. 6, Supplement Fig. S3). There was a trend of slightly higher respiration rates at logged forest sites than OP plantations. Grouping fluxes by land use gave mean respiration rates of 137.4 ± 95 mg m−2 h−1 for logged forests, 93.3 ± 70 mg m−2 h−1 for OP plantations, and 157.7 ± 106 mg m−2 h−1 for the riparian area (Table 2). Soil respiration rates in the measured riparian reserves were therefore within the range of the soil respiration rate of logged forest, which was higher than from the OP sites. Data were log-transformed before statistical analysis. A linear mixed-effect model including all terms could explain 25 % of the variance, and land use alone explained 7 % of the variance.
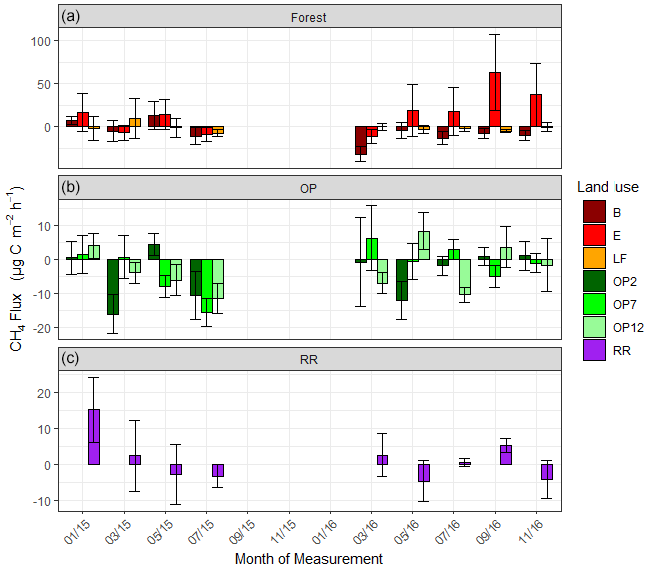
Figure 5Methane (CH4-C) fluxes in µg m−2 h−1 from January 2015–November 2016, every 2 months (a B, E, LF: logged forests; b OP2, OP7, OP12: oil palm plantations; c RR: riparian reserve). Bars are the mean for each site, and error bars are the standard deviation of number of chambers per site. Please note the different y-axis scales for each land use. Due to technical issues data are missing for 15 September to 16 January.
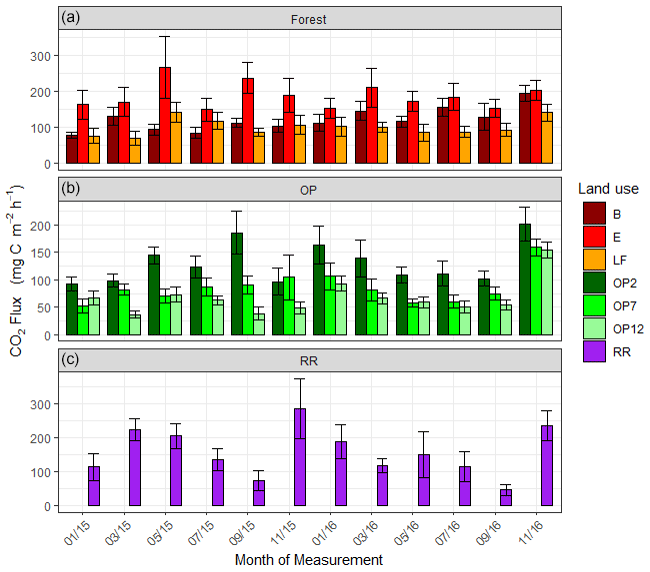
Figure 6Soil respiration (CO2-C) rates in mg m−2 h−1 from January 2015–November 2016, every 2 months (a B, E, LF: logged forests; b OP2, OP7, OP12: oil palm plantations; c RR: riparian reserve). Bars are the mean for each site, and error bars are the standard deviation of number of chambers per site. Please note the different y-axis scale for OP.
3.3 Soil biodiversity
Soil samples for analysis of microbial biodiversity were collected in the low-rainfall month, March 2016 (∼ 50 mm), and the high-rainfall month, November 2016 (∼ 250 mm, Fig. 1), in order to quantify broad differences in communities due to land use and provide additional biodiversity variables for modelling fluxes using the GLMM in addition to using abiotic soil parameters such as pH and bulk density. Three different amplicon sequencing assays were performed on extracted DNA, targeting bacteria (16S rRNA gene), fungi (ITS region), and broad groups of soil eukaryotic taxa (18S rRNA gene, including principally fungi, protists, and algae). The ordinations and multivariate permutation effects of land use were generally consistent across the two sampling points irrespective of seasonal climatic differences (Fig. 7). Fitting environmental vectors to the ordination axis scores (see Supplement Table S1) revealed that the bacterial communities were highly related to soil pH (r2=0.85 and 0.84, p<0.001, for the two sample dates respectively), with acid soils (pH 3.6) at site B, compared to a near-neutral pH of 6.1 and 6.4 at sites LF and E (Table 1). Weaker relationships with the land-use factors (r2= 0.23 and 0.11, p<0.05) were observed, though logged forests E and LF had very similar bacterial communities, which were distinct from the three OP sites and also the riparian site. In contrast, fungal and eukaryotic communities were not as strongly related to soil pH (fungal r2=0.67 and 0.72, and eukaryotic r2=0.73 and 0.79 for the two sample dates respectively, p<0.001) and were more strongly related to above-ground land use than bacterial communities (fungal r2=0.52 and 0.57, and eukaryotic r2=0.50 and 0.42, p<0.001). As can be seen in the fungal ordinations particularly, the forested sites formed a distinct cluster separate from the OP sites, despite the large differences in soil acidity.

Figure 7The 2D nonmetric multidimensional scaling ordination plots of bacteria, fungal, and eukaryotic communities from two sample dates in March 2016 (a, b, c, t1) and November 2016 (d, e, f, t2). Coloured points designate replicates from each site (B, E, LF: logged forests; OP2, OP7, OP12: oil palm plantations; RIP: riparian reserve), as indicated in the legend with additional site centroids denoted on the plots. In addition, hulls indicate broad land-use categories as indicated in the legend.
3.4 Upscaling of N2O fluxes to Sabah scale
In an attempt to broadly upscale our findings, we calculated the annual soil N2O emission for the Sabah state based on the data from this study (Table 2), together with land cover area estimates (Gaveau et al., 2016). Nitrous oxide emissions calculated for the Sabah region showed a strong dependence on the conversion of forest to OP plantations from 1973 to present day. By 2015, the total estimated N2O emissions from OP plantations were roughly 40 % of total emissions, with 60 % of the emissions from forested areas, despite the OP area being less than 40 % of the forest area. The Sabah scale median N2O emission estimate had increased from 7.6 Mt (95 % confidence interval, −3.0–22.3 Mt) yr−1 in 1973 to 11.4 Mt (0.2–28.6 Mt) yr−1 in 2015. As the measured CH4 fluxes were fluctuating around zero, the changes in land use also resulted in small changes of CH4 flux rates over the 42-year period. Our median results suggest that Sabah is a sink for CH4 (4 Mt yr−1) throughout the time period presented.
This study focussed on comparing GHG fluxes from different land-use types in the tropics. Our data, although not high-frequency measurements, provide a comprehensive insight into the potential impact of converting logged forests to OP plantations on GHG fluxes. The emphasis of this study is on N2O, with auxiliary measurements of CH4 and soil respiration. To date, only four studies published data of N2O emissions from OP plantations on mineral soil in Southeast Asia using the chamber method that included measurements from a time period of longer than 6 months (Skiba et al., 2020). Only one of these studies included measurements in Malaysia (Sakata et al., 2015). Globally tropical forests are the largest natural source of N2O (Werner et al., 2007). Therefore, the question is whether the N input to OP plantations with lower organic matter (TC TN) content compared to tropical forests will lead to larger N2O emissions than from forests. Although it has been recognized that N2O emissions are induced by N-fertilizer application in OP, when considering annual or long-term emissions from mineral soil, these fertilization patterns may not have a pronounced or clear effect (Kaupper et al., 2019). For example, N-fertilizer-induced N2O fluxes comprised only 6 %–21 % of the annual soil N2O fluxes in OP plantations in Sumatra, Indonesia (Hassler et al., 2017); the rest was due to other natural processes occurring in the soil. Therefore, our study can be considered representative, particularly as measurements were carried out over 2 years. All three land-use types (logged forest, oil palm, and riparian) showed positive N2O fluxes, albeit with a high variability.
On some occasions, our measured fluxes exceeded the range reported by Ishizuka et al. (2005) of N2O emissions from OP plantations on mineral soil in Indonesia, ranging from ∼ 1–29 µg m−2 h−1, by an order of magnitude (maximum measured at 350 µg m−2 h−1). The highest values reported by Ishizuka et al. (2005) were from young plantations, while the lowest fluxes were reported from older plantations. They suggested the low N uptake of young plantations after fertilizer application and the fixation of N by the legume cover crop could be the reason for the high emissions. On the other hand, low emissions from older plantations could result from higher N uptake by the OP and the absence of legume cover. In their study, N2O emissions were mainly determined by soil moisture (Ishizuka et al., 2005), which was not the case here. Mean N2O fluxes from a sandy soil in Malaysia were reported to range from 0.80–3.81 and 1.63–5.34 µg N m−2 h−1 in the wet and dry seasons respectively (Sakata et al., 2015). This was lower than from a sandy loam soil in Indonesia (27.4–89.7 and 6.27–19.1 µg N m−2 h−1 in the wet and dry seasons respectively) (Sakata et al., 2015), indicating the importance of soil texture, provided that management is the same.
Despite the limited number of measurements in OP plantations on mineral soils and the high variability of results, emissions seem to generally be higher in younger OP plantations (Pardon et al., 2016a). This conclusion is not reflected in our data, as OP2 (young) and OP12 (older) plantations showed larger fluxes than the OP7 (medium age) site; although with a lifespan of up to 30 years, all plantations measured in this study can still be regarded as immature. As in our study, Aini et al. (2015) also found no differences in N2O fluxes in the wet and dry months with fluxes ranging from 0.08–53 µg N m−2 h−1. The range of our measured fluxes exceeded those of these previously published studies. However, it is difficult to generalize, as variability appeared to be high in all studies.
Our measured N2O fluxes from the riparian area were similar to those measured in the OP plantation, as soil properties such as bulk density were more similar to OP than logged forest. There is currently a knowledge gap on GHG emissions from riparian areas (Luke et al., 2019), and more studies are needed to evaluate the effectiveness in terms of nutrient retention and potential GHG mitigation of such buffers. A previously published study from Peninsular Malaysia reported mean N2O emission rates from logged tropical forest sites ranging from 17.7–92.0 µg m−2 h−1 N2O-N, which was significantly larger than from their measured unlogged sites (Yashiro et al., 2008). Even though the range of our measured fluxes from logged forest sites was wider, they are broadly of the same order of magnitude (13.9 ± 171 µg m−2 h−1 N2O-N).
As often the case with GHG studies, the variation in the measured GHG fluxes could not be explained with certainty by any of the measured soil parameters. Our sampling frequency was not high enough to investigate, for example, emission rates after fertilizer application in the OP plantations, and besides, this was not the aim of our study. The wide ranges measured for soil mineral N concentrations and N2O fluxes were likely due to the spatial and temporal variability of the fertilizer application, as the slow-release fertilizer bags were randomly placed around the trees, and with time, the fertilizer release rate slowed down. Apart from no strong correlations with single environmental factors, multiple regression and mixed models were only able to explain around 17 % of the variance including multiple measured parameters. However, applying the Bayesian method, the posterior probability density of the effect of land use on N2O flux confirmed that fluxes from the OP plantations were evidently higher than those from the forests (the area of the OP curve does not overlap with the forest curve), with the riparian area being intermediate (mean fluxes 13.9 (95 % CI: −6.3–41.5) µg m−2 h−1 for logged forests, 46.2 (18.4–97.5) µg m−2 h−1 for OP, and 31.8 (−6.3–130.0) µg m−2 h−1 for the riparian area). We therefore confirm our first hypothesis that N2O fluxes are higher from OP than tropical forests.
Agricultural mineral soils such as OP plantation soils can be methane sinks, with uptake rates usually lower than from forest soils (Hassler et al., 2015), which could also be seen in our data with logged forest showing higher uptake rates but at the same time also showing the highest emission rates. However, we did not see the seasonal cycle reported in Hassler et al. (2015) from Indonesia for any of the three land-use types (logged forest, oil palm, and riparian). The lack of seasonal variability seen in our study might be due to the fact that dry and wet seasons are not as pronounced in Sabah as in other tropical regions (Kerdraon et al., 2020) and that temperature is fairly constant throughout the year.
High soil respiration rates (sum of heterotrophic and autotrophic respiration) are considered to be a sign of good soil health, as it reflects the capacity of soil to support soil life including microorganisms and crops. Heterotrophic soil respiration defines the level of microbial activity, soil organic matter content, and its decomposition whilst autotrophic respiration is the metabolism of organic matter by plants. In a recently published study investigating litter decomposition, soil respiration fluxes in Sabah (also in the SAFE area) were higher from forests than OP plantations (Kerdraon et al., 2020). This was also the general trend in our study despite the high variability of all measured fluxes. Litter input in our plots was larger in the logged forest plots and riparian reserve than the OP. Litter decomposition experiments, conducted in Borneo and Panama, revealed that litter input was more important than litter type. This observation stresses the importance of the amount of above-ground litter for soil processes in general, especially in disturbed habitats or forest converted to plantations (Kerdraon et al., 2020).
To further characterize the different land uses and sites within each land use, analyses of soil microbial communities with different assays targeting different microbial components revealed strong influences of soil properties such as pH but also highlighted that fungal and eukaryotic communities were more affected by management and land use than bacteria. Soil pH is known to have an impact on soil microbial community in the tropics (Kaupper et al., 2019; Tripathi et al., 2012), which may explain the very different bacterial communities in logged forest B with the lowest measured pH of all our sites.
Typically, C and N availability and generally soil fertility are known to decrease after deforestation (Allen et al., 2015; Hassler et al., 2015, 2017; Kaupper et al., 2019). This is also reflected in our data (Table 1), where total C and N values in all OP plantations were lower than from forest soils. Nutrient input through litter is higher in the forest than OP plantations and continuously replenished (Guillaume et al., 2015). Therefore, for microorganisms, OP plantations represent a nutrient-deprived environment (Kaupper et al., 2019). Low total C input can also limit the methanotrophic population size and hence limit CH4 uptake (Krause et al., 2012). Lower soil N concentrations in OP soil have also been shown to limit CH4 uptake when compared with forest soil (Hassler et al., 2015). Exactly how shifts in C and N after converting forest to OP may affect microbial processes involved in N2O and CH4 fluxes remains highly uncertain (Kaupper et al., 2019).
Kaupper et al. (2019) have suggested that microbial biodiversity loss occurs soon after clearance and that bacterial diversity may either be resilient to the change or changes cannot be detected after a sufficient recovery period (>8 years) after deforestation. This conclusion is supported by Tin et al. (2018), who reported that the diversity of the bacterial community in a natural forest in the Maliau Basin in Sabah was comparable or even slightly higher in an OP plantation. Conversely, our study implies distinct differences in bacterial, fungal, and eukaryotic community structures between OP plantations and forests. To what extent these differences impact on microbial processes leading to GHG fluxes is hardly known (Kaupper et al., 2019). Despite our data showing effects of land use and soil properties on components of the microbial communities (fungal and eukaryote), including of microbial community, metrics in the GLMM did not help to explain variability in N2O fluxes. Hence, we partially prove our hypothesis that microbial diversity is determined by land use but have to disprove the latter part of the second hypothesis.
It is possible that a more specific focus on relevant functional gene abundances would yield greater predictive ability. Our parallel laboratory investigation, using soils collected from the field study sites reported here, provides a small piece of information on this matter. We concluded that the main contribution to N2O emissions from the logged forests and OP plantations was driven by proteobacterial nirS and AniA-nirK genes from denitrifier and archaeal ammonia oxidizer communities (Drewer et al., 2020). Providing the combined information of soil biochemical reactions with microbial biodiversity may in the future enable better predictions of GHG fluxes. It is vital to understand underlying longer-term processes that ultimately might regulate GHG fluxes to be able to develop GHG mitigation strategies. The conversion of forest to monoculture plantations is a big threat to ecosystem functioning (Tripathi et al., 2016), yet we are still missing data on microbial communities to make accurate predictions of their fate and function.
In an attempt to broadly upscale our findings, we calculated annual soil N2O emission for the Sabah state based on the data from this study (Table 2), together with land cover area estimates (Gaveau et al., 2016). The Sabah scale median N2O emission estimate had increased from 7.6 Mt yr−1 in 1973 to 11.4 Mt yr−1 in 2015. However, this change is small considering the associated uncertainties, demonstrated by the 95 % CI, −3.0–22.3 Mt yr−1 in 1973 and 0.2–28.6 Mt yr−1 in 2015. The changes in land use resulted in small changes of CH4 flux rates over the 42-year period. Median results suggest that Sabah is a sink for CH4 (4 Mt yr−1) throughout the time period presented. There was a slight decrease to the range of our estimate, suggesting that the sink strength will decrease as more land is converted from forest to OP plantations. These estimates, although highly uncertain, highlight the point that the GHG burden of Sabah is likely to increase as a result of land use change from forest to OP plantations and management.
This 2-year field study of bi-monthly measurements demonstrated that N2O emission rates from mineral soils in Sabah were largest from OP plantations, intermediate from a riparian area, and smallest from logged forests. Very large spatial and temporal variability of fluxes and soil chemical and physical properties were encountered at all sites. Mean CH4 fluxes were low with very high variability and showed no clear trend, and the highest range of fluxes was measured in logged forests. Fungal and eukaryotic communities were related to management whilst bacterial community structures were strongly affected by soil pH, which might have masked any management impacts. Mixed models and multiple regression analysis could only explain 17 % of the variation in the measured N2O fluxes, 3 % of the CH4 fluxes, and 25 % of soil respiration, despite the large number of measured abiotic and biotic parameters. This is not uncommon for GHG fluxes but demonstrates that many more studies, ideally at high temporal and spatial resolution, are required to inform on the impact of land use and climate change on GHG fluxes. Scaling up measured N2O and CH4 fluxes to Sabah using land areas for forest and OP implies that since 1973 N2O emissions have increased and CH4 uptake declined, in line with the proportion of OP plantations replacing forest areas. Using the range of measured fluxes with mean and 95 % CI highlights the large uncertainties still associated with these emission estimates, despite having almost 700 individual data points over 2 years. For CH4, the picture is even more uncertain. More studies on N2O and CH4 fluxes from tropical forests and OP plantations on mineral soil are needed to reduce the uncertainty of their emission rates, and especially for experiments deriving N2O emission factors. Furthermore, the impact of current management systems and future potentially more environmentally friendly plantation management needs to be investigated in order to predict how to maintain ecosystem function and biodiversity, which could have a positive impact on reducing GHG emissions.
The data set used in this paper can be found on Zenodo https://doi.org/10.5281/zenodo.3258117 (Drewer et al., 2019).
The supplement related to this article is available online at: https://doi.org/10.5194/bg-18-1559-2021-supplement.
JD and UMS designed the project, and ML carried out field measurements with the help of JD, UMS, and JS as local collaborators. RIG and TG carried out microbial analysis. PEL carried out statistical analysis. NC assisted with data analysis. ECP and GH carried out upscaling, NM supervised soil parameter analysis. JD wrote the manuscript with contributions from all co-authors.
The authors declare that they have no conflict of interest.
Special thanks to the (LOMBOK) RAs (“Noy” Arnold James, and “Loly” Lawlina Mansul) at SAFE for help with the field sampling, Fifilyana Abdulkarim for laboratory analysis, and Jake Bicknell for discussions about upscaling. This project was funded as LOMBOK (Land-use Options for Maintaining BiOdiversity and eKosystem functions) by the NERC Human Modified Tropical Forest (HMTF) research programme (NE/K016091/1).
This research has been supported by the Natural Environment Research Council (grant no. NE/K016091/1).
This paper was edited by Andreas Ibrom and reviewed by two anonymous referees.
Aini, F. K., Hergoualch, K., Smith, J. U., and Verchot, L.: Nitrous oxide emissions along a gradient of tropical forest disturbance on mineral soils in Sumatra, Agr. Ecosyst. Environ., 214, 107–117, https://doi.org/10.1016/j.agee.2015.08.022, 2015.
Allen, K., Corre, M. D., Tjoa, A., and Veldkamp, E.: Soil nitrogen-cycling responses to conversion of lowland forests to oil palm and rubber plantations in sumatra, indonesia, PLOS ONE, 10, e0133325, https://doi.org/10.1371/journal.pone.0133325, 2015.
Baldwin, A. J, Moss, J. A., Pakulski, J., Catala, P., Joux, F., and Jeffrey, W.: Microbial diversity in a pacific ocean transect from the arctic to antarctic circles, Aquat. Microb. Ecol., 41, 91–102, https://doi.org/10.3354/ame041091, 2005.
Bartoń, K.: Mumin: Multi-model inference, 2013.
Bates, D., Mächler, M., Bolker, B., and Walker, S.: Fitting linear mixed-effects models using lme4, J. Stat. Softw., 67, 48, https://doi.org/10.18637/jss.v067.i01, 2015.
Callahan, B. J., McMurdie, P. J., Rosen, M. J., Han, A. W., Johnson, A. J. A., and Holmes, S. P.: Dada2: High-resolution sample inference from illumina amplicon data, Nat. Methods, 13, 581–583, https://doi.org/10.1038/nmeth.3869, 2016.
Corre, M. D., Sueta, J. P., and Veldkamp, E.: Nitrogen-oxide emissions from tropical forest soils exposed to elevated nitrogen input strongly interact with rainfall quantity and seasonality, Biogeochemistry, 118, 103–120, https://doi.org/10.1007/s10533-013-9908-3, 2014.
Courtois, E. A., Stahl, C., Burban, B., Van den Berge, J., Berveiller, D., Bréchet, L., Soong, J. L., Arriga, N., Peñuelas, J., and Janssens, I. A.: Automatic high-frequency measurements of full soil greenhouse gas fluxes in a tropical forest, Biogeosciences, 16, 785–796, https://doi.org/10.5194/bg-16-785-2019, 2019.
Davidson, E. A., Keller, M., Erickson, H. E., Verchot, L. V., and Veldkamp, E.: Testing a conceptual model of soil emissions of nitrous and nitric oxides: Using two functions based on soil nitrogen availability and soil water content, the hole-in-the-pipe model characterizes a large fraction of the observed variation of nitric oxide and nitrous oxide emissions from soils, BioScience, 50, 667–680, https://doi.org/10.1641/0006-3568(2000)050[0667:Tacmos]2.0.Co;2, 2000.
Drewer, J., Anderson, M., Levy, P. E., Scholtes, B., Helfter, C., Parker, J., Rees, R. M., and Skiba, U. M.: The impact of ploughing intensively managed temperate grasslands on N2O, CH4 and CO2 fluxes, Plant Soil, 411, 193–208, https://doi.org/10.1007/s11104-016-3023-x, 2017a.
Drewer, J., Yamulki, S., Leeson, S. R., Anderson, M., Perks, M. P., Skiba, U. M., and McNamara, N. P.: Difference in soil methane (CH4) and nitrous oxide (N2O) fluxes from bioenergy crops src willow and srf scots pine compared with adjacent arable and fallow in a temperate climate, Bioenerg. Res., 10, 575–582, https://doi.org/10.1007/s12155-017-9824-9, 2017b.
Drewer, J., Leduning, M., Sentian, J., and Skiba, U.: Soil greenhouse gas fluxes and associated parameters from forest and oil palm in the SAFE landscape, Zenodo, https://doi.org/10.5281/zenodo.3258117, 2019.
Drewer, J., Zhao, J., Leduning, M. M., Levy, P. E., Sentian, J., Gubry-Rangin, C., and Skiba, U.: Linking nitrous oxide and nitric oxide fluxes to microbial communities in tropical forest soils and oil palm plantations in malaysia in laboratory incubations, Frontiers in Forests and Global Change, 3, 4, 2020.
Dutaur, L. and Verchot, L. V.: A global inventory of the soil CH4 sink, Global Biogeochem. Cy., 21, https://doi.org/10.1029/2006gb002734, 2007.
Eisenhauer, N.: Plant diversity effects on soil microorganisms: Spatial and temporal heterogeneity of plant inputs increase soil biodiversity, Pedobiologia, 59, 175–177, https://doi.org/10.1016/j.pedobi.2016.04.004, 2016.
Ewers, R. M., Didham, R. K., Fahrig, L., Ferraz, Gonçalo, Hector, Andy, Holt, Robert, D., Kapos, Valerie, Reynolds, Glen, Sinun, Waidi, Snaddon, Jake, L., Turner, E., C.: A large-scale forest fragmentation experiment: The stability of altered forest ecosystems project, Philos. T. R. Soc. B, 366, 3292–3302, https://doi.org/10.1098/rstb.2011.0049, 2011.
Gaveau, D. L. A., Sheil, D., Husnayaen Salim, M. A., Arjasakusuma, S., Ancrenaz, M., Pacheco, P., and Meijaard, E.: Rapid conversions and avoided deforestation: Examining four decades of industrial plantation expansion in borneo, Sci. Rep., 6, 32017, https://doi.org/10.1038/srep32017, 2016.
Germer, J. and Sauerborn, J.: Estimation of the impact of oil palm plantation establishment on greenhouse gas balance, Environment, Development and Sustainability, 10, 697–716, https://doi.org/10.1007/s10668-006-9080-1, 2008.
Guillaume, T., Damris, M., and Kuzyakov, Y.: Losses of soil carbon by converting tropical forest to plantations: Erosion and decomposition estimated by δ13C, Glob. Change Biol., 21, 3548–3560, https://doi.org/10.1111/gcb.12907, 2015.
Hassler, E., Corre, M. D., Tjoa, A., Damris, M., Utami, S. R., and Veldkamp, E.: Soil fertility controls soil–atmosphere carbon dioxide and methane fluxes in a tropical landscape converted from lowland forest to rubber and oil palm plantations, Biogeosciences, 12, 5831–5852, https://doi.org/10.5194/bg-12-5831-2015, 2015.
Hassler, E., Corre, M. D., Kurniawan, S., and Veldkamp, E.: Soil nitrogen oxide fluxes from lowland forests converted to smallholder rubber and oil palm plantations in Sumatra, Indonesia, Biogeosciences, 14, 2781–2798, https://doi.org/10.5194/bg-14-2781-2017, 2017.
Henders, S., Persson, U. M., and Kastner, T.: Trading forests: Land-use change and carbon emissions embodied in production and exports of forest-risk commodities, Environ. Res. Lett., 10, 125012, https://doi.org/10.1088/1748-9326/10/12/125012, 2015.
Houghton, R. A.: Carbon emissions and the drivers of deforestation and forest degradation in the tropics, Curr. Opin. Env. Sust., 4, 597–603, https://doi.org/10.1016/j.cosust.2012.06.006, 2012.
Ihrmark, K., Bödeker, I. T. M., Cruz-Martinez, K., Friberg, H., Kubartova, A., Schenck, J., Strid, Y., Stenlid, J., Brandström-Durling, M., Clemmensen, K. E., and Lindahl, B. D.: New primers to amplify the fungal its2 region – evaluation by 454-sequencing of artificial and natural communities, FEMS Microbiol. Ecol., 82, 666–677, https://doi.org/10.1111/j.1574-6941.2012.01437.x, 2012.
Ishizuka, S., Iswandi, A., Nakajima, Y., Yonemura, S., Sudo, S., Tsuruta, H., and Murdiyarso, D.: The variation of greenhouse gas emissions from soils of various land-use/cover types in jambi province, indonesia, Nutr. Cycl. Agroecosys., 71, 17–32, https://doi.org/10.1007/s10705-004-0382-0, 2005.
Jackson, T. A., Crawford, J. W., Traeholt, C., and Sanders, T. A. B.: Learning to love the world's most hated crop, J. Oil Palm Res., 31, 331–347, https://doi.org/10.21894/jopr.2019.0046, 2019.
Kaupper, T., Hetz, S., Kolb, S., Yoon, S., Horn, M. A., and Ho, A.: Deforestation for oil palm: Impact on microbially mediated methane and nitrous oxide emissions, and soil bacterial communities, Biol. Fert. Soils, 56, 287–298, https://doi.org/10.1007/s00374-019-01421-3, 2019.
Kerdraon, D., Drewer, J., Chung, A. Y. C., Majalap, N., Slade, E. M., Bréchet, L., Wallwork, A., Castro-Trujillo, B., and Sayer, E. J.: Litter inputs, but not litter diversity, maintain soil processes in degraded tropical forests – a cross-continental comparison, Frontiers in Forests and Global Change, 2, https://doi.org/10.3389/ffgc.2019.00090, 2020.
Kozich, J. J., Westcott, S. L., Baxter, N. T., Highlander, S. K., and Schloss, P. D.: Development of a dual-index sequencing strategy and curation pipeline for analyzing amplicon sequence data on the miseq illumina sequencing platform, Appl. Environ. Microbiol., 79, 5112–5120, https://doi.org/10.1128/aem.01043-13, 2013.
Krause, S., Lüke, C., and Frenzel, P.: Methane source strength and energy flow shape methanotrophic communities in oxygen-methane counter-gradients, Environ. Microbiol. Rep., 4, 203–208, https://doi.org/10.1111/j.1758-2229.2011.00322.x, 2012.
Lee-Cruz, L., Edwards, D. P., Tripathi, B. M., and Adams, J. M.: Impact of logging and forest conversion to oil palm plantations on soil bacterial communities in borneo, Appl. Environ. Microbiol., 79, 7290–7297, https://doi.org/10.1128/aem.02541-13, 2013.
Levy, P. E., Burden, A., Cooper, M. D. A., Dinsmore, K. J., Drewer, J., Evans, C., Fowler, D., Gaiawyn, J., Gray, A., Jones, S. K., Jones, T., McNamara, N. P., Mills, R., Ostle, N., Sheppard, L. J., Skiba, U., Sowerby, A., Ward, S. E., and Zielinski, P.: Methane emissions from soils: Synthesis and analysis of a large uk data set, Glob. Change Biol., 18, 1657–1669, https://doi.org/10.1111/j.1365-2486.2011.02616.x, 2012.
Levy, P. E., Cowan, N., van Oijen, M., Famulari, D., Drewer, J., and Skiba, U.: Estimation of cumulative fluxes of nitrous oxide: Uncertainty in temporal upscaling and emission factors, Eur. J. Soil Sci., 68, 400–411, https://doi.org/10.1111/ejss.12432, 2017.
Luke, S. H., Slade, E. M., Gray, C. L., Annammala, K. V., Drewer, J., Williamson, J., Agama, A. L., Ationg, M., Mitchell, S. L., Vairappan, C. S., and Struebig, M. J.: Riparian buffers in tropical agriculture: Scientific support, effectiveness and directions for policy, J. Appl. Ecol., 56, 85–92, https://doi.org/10.1111/1365-2664.13280, 2019.
Meijide, A., de la Rua, C., Guillaume, T., Röll, A., Hassler, E., Stiegler, C., Tjoa, A., June, T., Corre, M. D., Veldkamp, E., and Knohl, A.: Measured greenhouse gas budgets challenge emission savings from palm-oil biodiesel, Nat. Commun., 11, 1089, https://doi.org/10.1038/s41467-020-14852-6, 2020.
Muyzer, G., de Waal, E. C., and Uitterlinden, A. G.: Profiling of complex microbial populations by denaturing gradient gel electrophoresis analysis of polymerase chain reaction-amplified genes coding for 16s rrna, Appl. Environ. Microbiol., 59, 695–700, 1993.
Myhre, G., Shindell, D., Bréon, F.-M., Collins, W., Fuglestvedt, J., Huang, J., Koch, D., Lamarque, J.-F., Lee, D., Mendoza, B., Nakajima, T., Robock, A., Stephens, G., Takemura, T., and and Zhang, H.: Anthropogenic and natural radiative forcing, in: Climate change 2013: The physical science basis, Contribution of working group i to the fifth assessment report of the intergovernmental panel on climate change, edited by: Stocker, T. F., Qin, D., Plattner, G.-K., Tignor, M., Allen, S. K., Boschung, J., Nauels, A., Xia, Y., Bex, V., and Midgley, P. M., Cambridge University Press, Cambridge, United Kingdom and New York, USA, 2013.
Pardon, L., Bessou, C., Nelson, P. N., Dubos, B., Ollivier, J., Marichal, R., Caliman, J.-P., and Gabrielle, B.: Key unknowns in nitrogen budget for oil palm plantations. A review, Agron. Sustain. Dev., 36, 20, https://doi.org/10.1007/s13593-016-0353-2, 2016a.
Pardon, L., Bessou, C., Saint-Geours, N., Gabrielle, B., Khasanah, N., Caliman, J.-P., and Nelson, P. N.: Quantifying nitrogen losses in oil palm plantations: models and challenges, Biogeosciences, 13, 5433–5452, https://doi.org/10.5194/bg-13-5433-2016, 2016b.
Pardon, L., Huth, N. I., Nelson, P. N., Banabas, M., Gabrielle, B., and Bessou, C.: Yield and nitrogen losses in oil palm plantations: Main drivers and management trade-offs determined using simulation, Field Crop. Res., 210, 20–32, https://doi.org/10.1016/j.fcr.2017.05.016, 2017.
Pearson, T. R. H., Brown, S., Murray, L., and Sidman, G.: Greenhouse gas emissions from tropical forest degradation: An underestimated source, Carbon Balance and Management, 12, 3, https://doi.org/10.1186/s13021-017-0072-2, 2017.
R Core Team: R: A language and environment for statistical computing, in: R Foundation for Statistical Computing, edited by: Team, R. C., Vienna, Austria, 2017.
Riutta, T., Malhi, Y., Kho, L. K., Marthews, T. R., Huaraca Huasco, W., Khoo, M., Tan, S., Turner, E., Reynolds, G., Both, S., Burslem, D. F. R. P., Teh, Y. A., Vairappan, C. S., Majalap, N., and Ewers, R. M.: Logging disturbance shifts net primary productivity and its allocation in bornean tropical forests, Glob. Change Biol., 24, 2913–2928, https://doi.org/10.1111/gcb.14068, 2018.
Sakata, R., Shimada, S., Arai, H., Yoshioka, N., Yoshioka, R., Aoki, H., Kimoto, N., Sakamoto, A., Melling, L., and Inubushi, K.: Effect of soil types and nitrogen fertilizer on nitrous oxide and carbon dioxide emissions in oil palm plantations, Soil Sci. Plant Nutr., 61, 48–60, https://doi.org/10.1080/00380768.2014.960355, 2015.
Sayer, J., Ghazoul, J., Nelson, P., and Klintuni Boedhihartono, A.: Oil palm expansion transforms tropical landscapes and livelihoods, Glob. Food Secur., 1, 114–119, https://doi.org/10.1016/j.gfs.2012.10.003, 2012.
Shanmugam, S., Dalal, R. C., Joosten, H., Raison, R. J., and Joo, G. K.: Soc stock changes and greenhouse gas emissions following tropical land use conversions to plantation crops on mineral soils, with a special focus on oil palm and rubber plantations, Agriculture, 8, 133, 2018.
Skiba, U., Hergoualch, K., Drewer, J., Meijide, A., and Knohl, A.: Oil palm plantations are large sources of nitrous oxide, but where are the data to quantify the impact on global warming?, Curr. Opin. Env. Sust., 47, 81–88, https://doi.org/10.1016/j.cosust.2020.08.019, 2020.
Sodhi, N. S., Koh, L. P., Brook, B. W., and Ng, P. K. L.: Southeast asian biodiversity: An impending disaster, Trends Ecol. Evol., 19, 654–660, https://doi.org/10.1016/j.tree.2004.09.006, 2004.
Tin, H. S., Palaniveloo, K., Anilik, J., Vickneswaran, M., Tashiro, Y., Vairappan, C. S., and Sakai, K.: Impact of land-use change on vertical soil bacterial communities in sabah, Microb. Ecol., 75, 459–467, https://doi.org/10.1007/s00248-017-1043-6, 2018.
Tripathi, B. M., Kim, M., Singh, D., Lee-Cruz, L., Lai-Hoe, A., Ainuddin, A. N., Go, R., Rahim, R. A., Husni, M. H. A., Chun, J., and Adams, J. M.: Tropical soil bacterial communities in malaysia: Ph dominates in the equatorial tropics too, Microb. Ecol., 64, 474–484, https://doi.org/10.1007/s00248-012-0028-8, 2012.
Tripathi, B. M., Edwards, D. P., Mendes, L. W., Kim, M., Dong, K., Kim, H., and Adams, J. M.: The impact of tropical forest logging and oil palm agriculture on the soil microbiome, Mol. Ecol., 25, 2244–2257, https://doi.org/10.1111/mec.13620, 2016.
UNFCCC: Adoption of the paris agreement, fccc/cp/2015/l.9/rev. 1, 2015.
van Lent, J., Hergoualc'h, K., and Verchot, L. V.: Reviews and syntheses: Soil N2O and NO emissions from land use and land-use change in the tropics and subtropics: a meta-analysis, Biogeosciences, 12, 7299–7313, https://doi.org/10.5194/bg-12-7299-2015, 2015.
Veldkamp, E., Koehler, B., and Corre, M. D.: Indications of nitrogen-limited methane uptake in tropical forest soils, Biogeosciences, 10, 5367–5379, https://doi.org/10.5194/bg-10-5367-2013, 2013.
Werner, C., Butterbach-Bahl, K., Haas, E., Hickler, T., and Kiese, R.: A global inventory of N2O emissions from tropical rainforest soils using a detailed biogeochemical model, Global Biogeochem. Cy., 21, Gb3010, https://doi.org/10.1029/2006gb002909, 2007.
Wilcove, D. S., Giam, X., Edwards, D. P., Fisher, B., and Koh, L. P.: Navjot's nightmare revisited: Logging, agriculture, and biodiversity in southeast asia, Trends Ecol. Evol., 28, 531–540, https://doi.org/10.1016/j.tree.2013.04.005, 2013.
Yan, W.: A makeover for the world's most hated crop, Nature, 543, 306–308, https://doi.org/10.1038/543306a, 2017.
Yashiro, Y., Kadir, W. R., Okuda, T., and Koizumi, H.: The effects of logging on soil greenhouse gas (CO2, CH4, N2O) flux in a tropical rain forest, peninsular malaysia, Agr. Forest Meteorol., 148, 799–806, https://doi.org/10.1016/j.agrformet.2008.01.010, 2008.
Yu, Y., Lee, C., Kim, J., and Hwang, S.: Group-specific primer and probe sets to detect methanogenic communities using quantitative real-time polymerase chain reaction, Biotechnol. Bioeng., 89, 670–679, https://doi.org/10.1002/bit.20347, 2005.
The requested paper has a corresponding corrigendum published. Please read the corrigendum first before downloading the article.
- Article
(834 KB) - Full-text XML
- Corrigendum
-
Supplement
(281 KB) - BibTeX
- EndNote