the Creative Commons Attribution 4.0 License.
the Creative Commons Attribution 4.0 License.
 | 09 Mar 2021
Geochemical zones and environmental gradients for soils from the central Transantarctic Mountains, Antarctica
Christopher B. Gardner
Susan A. Welch
W. Andrew Jackson
Byron J. Adams
Diana H. Wall
Ian D. Hogg
Noah Fierer
W. Berry Lyons
Previous studies have established links between biodiversity and soil geochemistry in the McMurdo Dry Valleys, Antarctica, where environmental gradients are important determinants of soil biodiversity. However, these gradients are not well established in the central Transantarctic Mountains, which are thought to represent some of the least hospitable Antarctic soils. We analyzed 220 samples from 11 ice-free areas along the Shackleton Glacier (∼ 85∘ S), a major outlet glacier of the East Antarctic Ice Sheet. We established three zones of distinct geochemical gradients near the head of the glacier (upper), its central part (middle), and at the mouth (lower). The upper zone had the highest water-soluble salt concentrations with total salt concentrations exceeding 80 000 µg g−1, while the lower zone had the lowest water-soluble N:P ratios, suggesting that, in addition to other parameters (such as proximity to water and/or ice), the lower zone likely represents the most favorable ecological habitats. Given the strong dependence of geochemistry on geographic parameters, we developed multiple linear regression and random forest models to predict soil geochemical trends given latitude, longitude, elevation, distance from the coast, distance from the glacier, and soil moisture (variables which can be inferred from remote measurements). Confidence in our random forest model predictions was moderately high with R2 values for total water-soluble salts, water-soluble N:P, ClO, and ClO of 0.81, 0.88, 0.78, and 0.74, respectively. These modeling results can be used to predict geochemical gradients and estimate salt concentrations for other Transantarctic Mountain soils, information that can ultimately be used to better predict distributions of soil biota in this remote region.
- Article
(11064 KB) - Full-text XML
-
Supplement
(887 KB) - BibTeX
- EndNote


The least biologically diverse terrestrial systems are those found in extreme physical and chemical environments. The abundance and diversity of life in soils are dependent on a number of environmental variables, including temperature, precipitation, organic matter content, and nutrient availability (Wall et al., 2012). Hot deserts are typically viewed as one of the least biologically diverse environments, but cold deserts can often be even less diverse (Freckman and Virginia, 1998). Soils in Antarctica typically serve as end-members for low habitat suitability due to their high salt concentrations, low organic carbon, low soil moisture, and low mean annual temperatures (Courtright et al., 2001).
In the McMurdo Dry Valleys (MDV), organic matter and salt concentrations influence soil communities, where soils with higher amounts of organic carbon, lower water-soluble N:P ratios, and lower total water-soluble salt concentrations generally harbor the greatest biomass and biodiversity (Barrett et al., 2006; Bottos et al., 2020; Caruso et al., 2019; Magalhães et al., 2012). These Antarctic ecosystems are relatively simple and are among the few known soil systems where nematodes and microarthropods (Collembola, Acari) are at the top of the food chain (Freckman and Virginia, 1998; Hogg and Wall, 2012). Studies of soils in the MDV and Transantarctic Mountains (TAM) have been key to understanding ecosystem structure and function in extreme terrestrial environments (e.g., Caruso et al., 2019; Collins et al., 2019, 2020; Convey and McInnes, 2005; Freckman and Virginia, 1998; Hodgson et al., 2010).
Biological processes in Antarctic soils are largely dependent on the availability, duration, and proximity of soils to liquid water (Barrett et al., 2006). Due to the seasonality of thawing events, liquid water acts as a pulse to the ecosystem, providing water for organisms but also wetting surface soils and dissolving soluble salts (Webster-Brown et al., 2010; Zeglin et al., 2009). Experiments of salt thresholds on Antarctic nematodes found that no individuals survived in highly saline soils over ∼ 2600 mg L−1 total dissolved solids (TDS) (Nkem et al., 2006). Concentrations of soluble salts exist at these concentrations or higher at high elevation and inland locations in the TAM (Bockheim, 2008; Lyons et al., 2016). Additionally, studies on TAM soils have found that increased salt concentrations lead to a decrease in soil biodiversity in older soils compared to younger soils (Magalhães et al., 2012). Yet, despite these inhospitable conditions (e.g., high salt concentrations and glacial advance and retreat), some organisms are postulated to have found suitable refugia in TAM soils and persisted in isolation for millions of years and through glacial cycles (Beet et al., 2016; Collins et al., 2019, 2020; Stevens et al., 2006; Stevens and Hogg, 2003).
It is generally accepted that habitat suitability for invertebrate species in Antarctic soils is driven by a combination of geochemical, geographic, hydrologic, and geomorphic variables (Bottos et al., 2020; Courtright et al., 2001; Freckman and Virginia, 1998; Magalhães et al., 2012). Geographic variables, such as elevation, can be measured with advanced mapping tools and satellite imagery; however, surface exposure ages, soil geochemistry and nutrient content require extensive logistical support and resource allocation for sample collection and analysis. A better understanding of the relationship between geographic variables and on-the-ground measurements is needed to aid in our ability to understand and predict habitat suitability for invertebrates throughout the TAM.
With this study, we determined and evaluated geochemical patterns and gradients of water-soluble ions in soils collected from 11 ice-free areas along the Shackleton Glacier, central Transantarctic Mountains (CTAM). Particular attention was given to total water-soluble salt concentrations, N:P ratios, and ClO and ClO concentrations based on their influence on biodiversity as determined in previous studies (e.g., Ball et al., 2018; Barrett et al., 2006; Courtright et al., 2001; Dragone et al., 2020; Nkem et al., 2006). The geochemical data were compared to geographic parameters to understand how the physical environment influences the observed geochemical variability. Our results show that water-soluble ion concentrations and distributions are driven largely by soil geography and surface exposure age. Finally, we implemented statistical and machine learning techniques to interpolate and predict the soil geochemistry across the region using geographic variables. Our multiple linear regression and random forest models show that latitude, longitude, elevation, distance from the coast, distance from the glacier, and soil moisture (all variables currently or soon to be remotely measurable using maps and satellites) are moderately effective at estimating spatial patterns in TAM soil geochemistry with R2 values as high as 0.87. These data will be particularly useful for ecologists seeking to understand refugia and habitat suitability in Antarctica and similarly harsh desert environments.
The Shackleton Glacier (∼ 84.5 to 86.4∘ S; ∼ 130 km long and ∼ 10 km wide) is a south–north trending outlet glacier of the East Antarctic Ice Sheet (EAIS) located to the west of the Beardmore Glacier, and it flows through the Queen Maud Mountains (CTAM) into the Ross Sea (Fig. 1). The elevations of exposed soils range from ∼ 150 to >3500 m a.s.l. (above sea level) from the coast towards the Polar Plateau. Long-term climate data are not yet available, but the Shackleton Glacier region is a polar desert regime, similar to the Beardmore Glacier region, with average annual temperatures well below freezing and little precipitation (LaPrade, 1984).
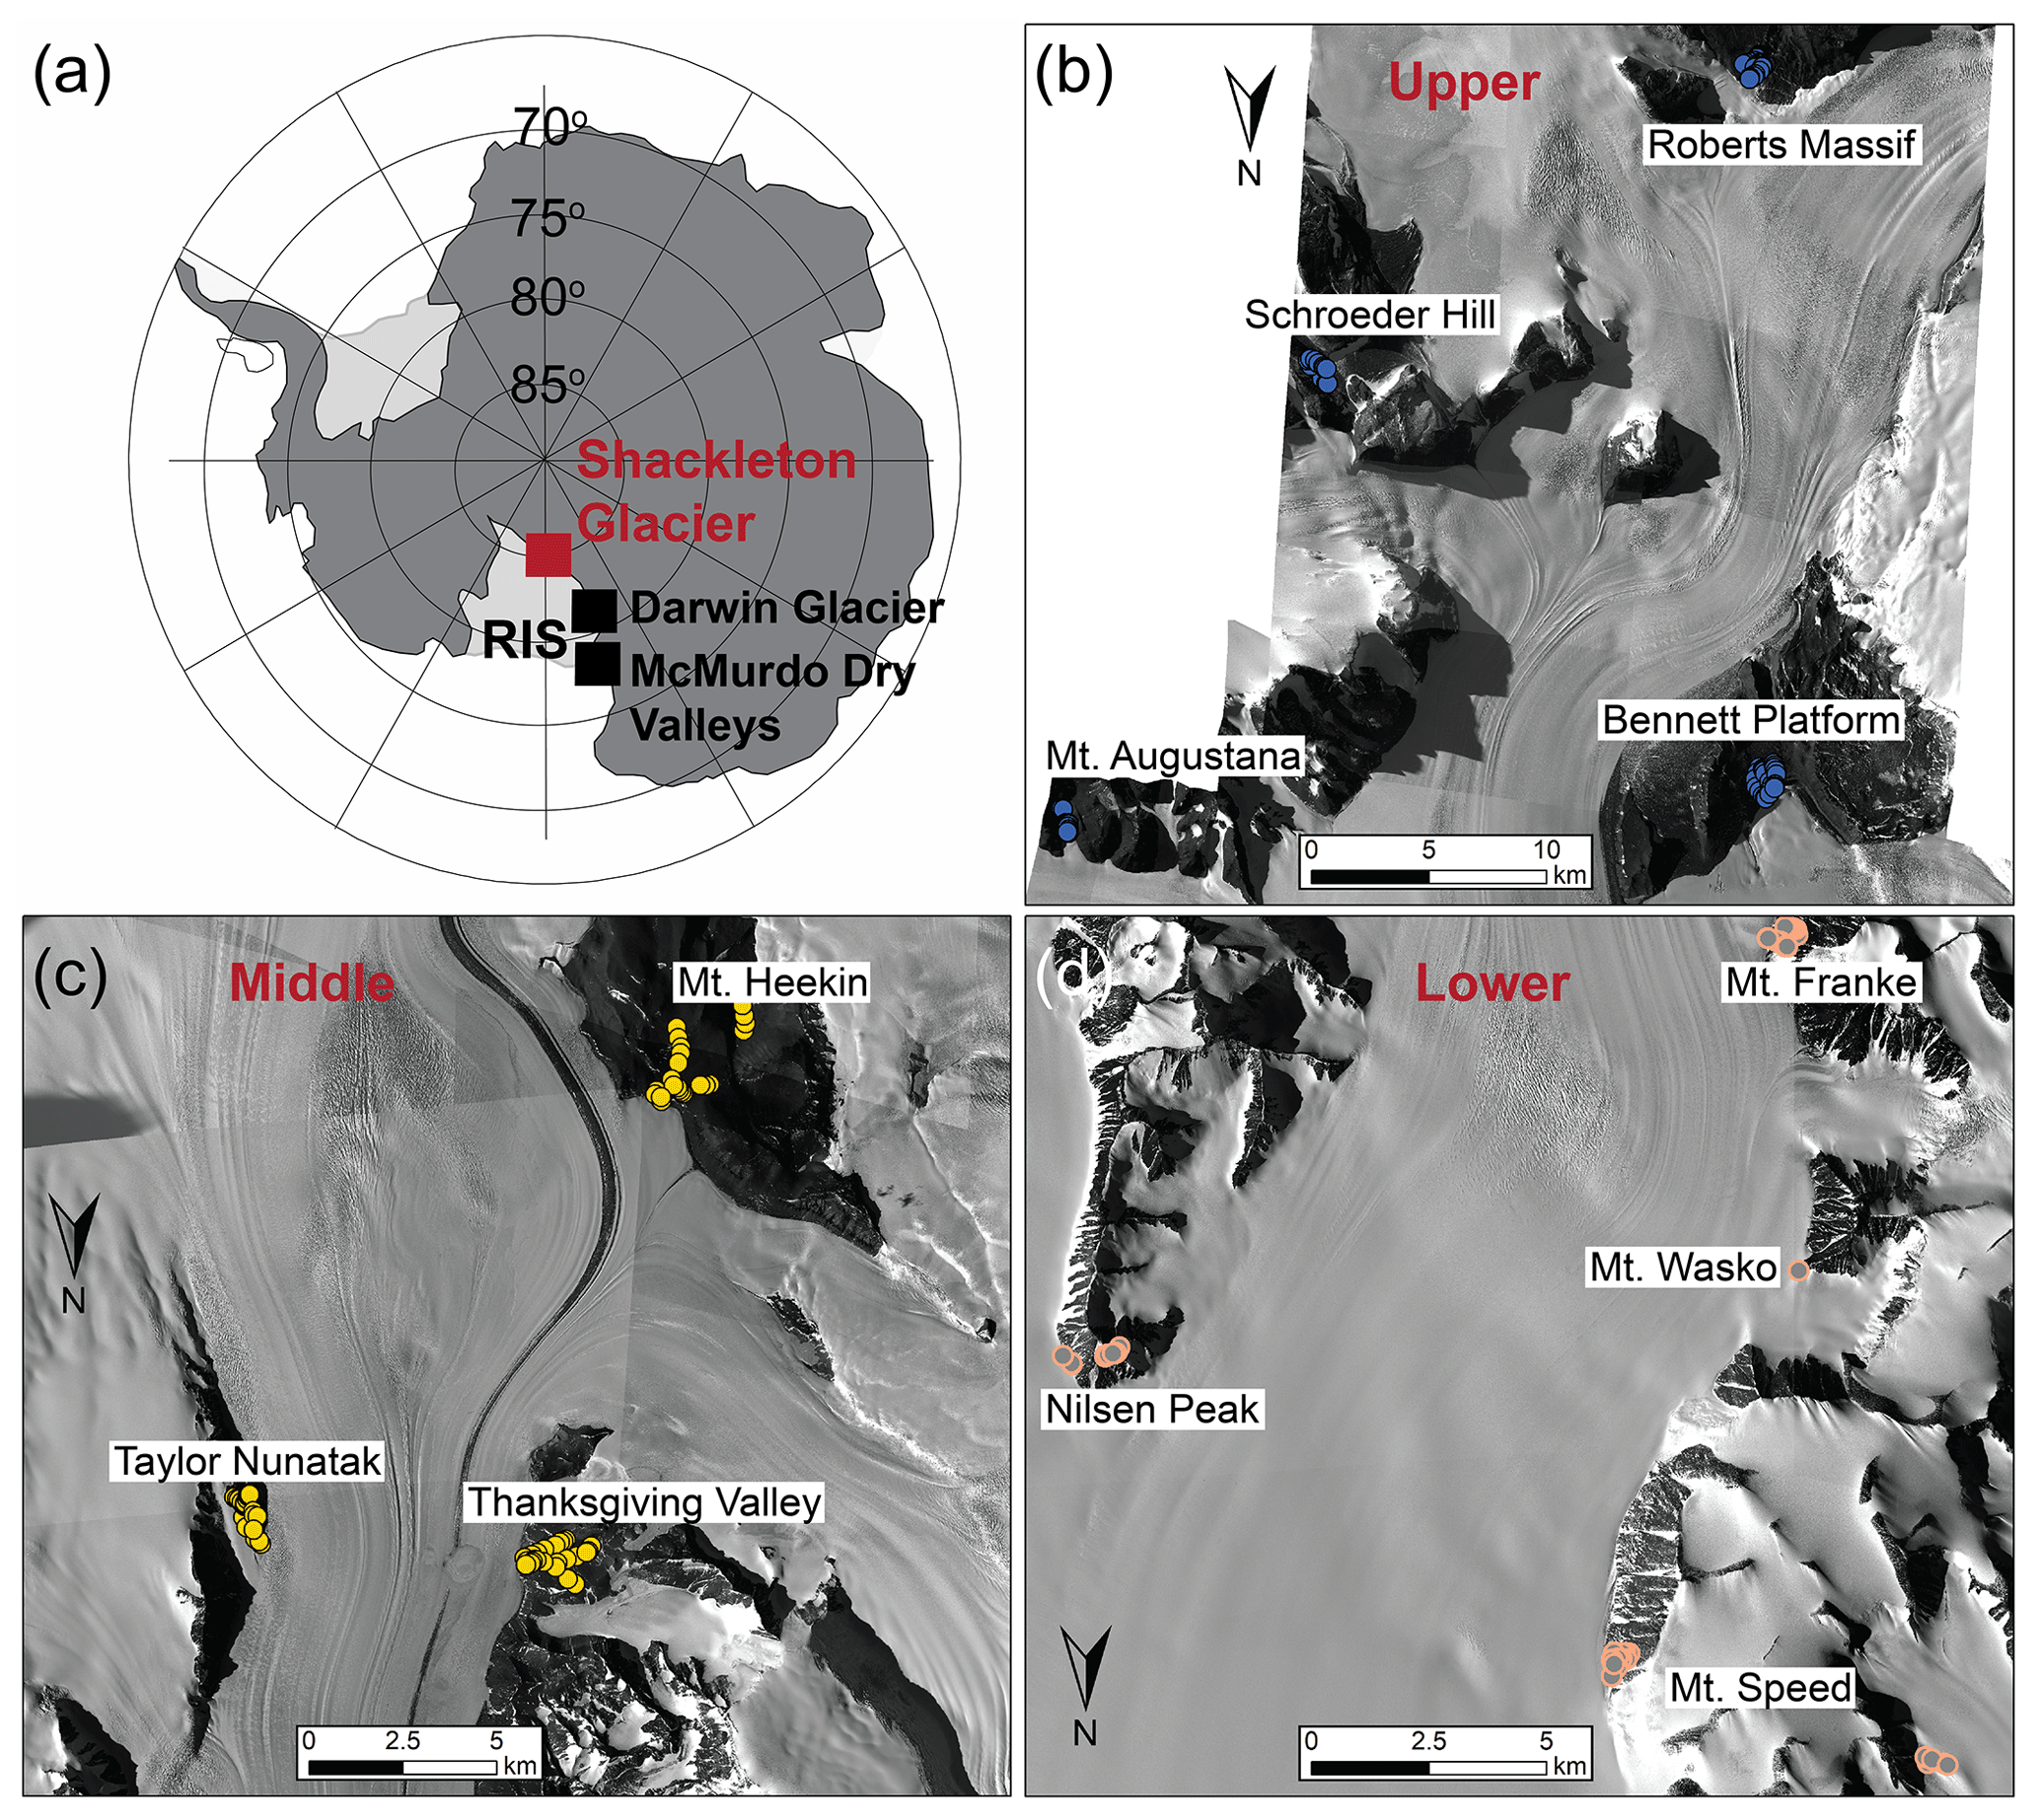
Figure 1Samples were collected and analyzed from the exposed soils along the Shackleton Glacier, a major outlet glacier of the EAIS (a), in three zones. The upper zone (b) was located at the head of Shackleton Glacier, the middle zone (c) was the central portion, and the lower zone (d) was at the terminus of the glacier where it drains into the Ross Sea. Satellite images were provided courtesy of the Polar Geospatial Center (PGC). The Ross Ice Shelf (RIS) is indicated in panel (a).
During the Last Glacial Maximum (LGM) and glacial periods throughout the Pleistocene, the size and thickness of the EAIS was likely greater than current levels (Golledge et al., 2013; Nakada and Lambeck, 1988; Talarico et al., 2012; Wilson et al., 2018). Outlet glaciers, such as the Shackleton Glacier, may have had the greatest increases in extent, especially at the glacier terminus (Golledge et al., 2012; Golledge and Levy, 2011). The behavior of local alpine and tributary glaciers is not well-constrained, but these glaciers are also believed to have advanced and retreated over the last 2 million years (Diaz et al., 2020a; Jackson et al., 2018). As a result, currently exposed soils were overlain and reworked by fluctuations of the Shackleton Glacier and other tributary and alpine glaciers in the region. Exposure ages range from the early Holocene to the Miocene, and they generally increase with distance from the coast and distance from the glacier (Balter-Kennedy et al., 2020; Diaz et al., 2020a).
The soils contain a range of water-soluble salts derived primarily from atmospheric deposition and chemical weathering (Claridge and Campbell, 1968; Diaz et al., 2020b). The major salts are typically nitrate and sulfate salts, especially at higher elevations and further inland from the coast of the Ross Sea (Diaz et al., 2020b). The solubilities of the salts vary, but nitrate salts are highly soluble, and their occurrence at high elevation and inland locations suggests that those soils have maintained persistent arid conditions.
3.1 Sample collection and preparation
During the 2017–2018 austral summer, 220 surface soil samples (∼ top 5 cm) were collected from 11 distinct ice-free areas (Roberts Massif, Schroeder Hill, Mt. Augustana, Bennett Platform, Mt. Heekin, Thanksgiving Valley, Taylor Nunatak, Mt. Franke, Mt. Wasko, Nilsen Peak, and Mt. Speed) along the Shackleton Glacier, including a subset of 27 samples previously analyzed for S, N, and O isotopes in nitrate and sulfate (Diaz et al., 2020b). At each area, we collected samples in transects (ranging from ∼ 200 to ∼ 2000 m in length) to maximize the geochemical variability. Our transects were also designed to capture the LGM transition, with some soils exposed throughout the LGM and others exposed following glacier retreat. GPS coordinates and elevations were recorded with each sample and later used to estimate the distance from the coast and distance from the glacier (defined as linear distance from the nearest glacier – Shackleton, tributary, or alpine). Once collected, the samples were stored and shipped frozen (−20∘) to the Ohio State University.
Prior to geochemical analysis, the samples were dried at 50∘C for at least 72 h, with the loss in mass attributed to soil moisture content. The dried soils were leached at a 1:5 soil to deionized water (DI) ratio, and the leachate was filtered through 0.4 µm Nucleopore membrane filters (Diaz et al., 2018, 2020b; Nkem et al., 2006). Due to the low sediment to water ratio, this leaching technique only dissolves the more water-soluble salts (Toner et al., 2013). These include salts with ClO, NO, Cl−, SO, ClO, and CO + HCO. Process blanks were generated and analyzed to account for any contamination from the leaching process.
3.2 Analytical analysis of water-soluble anions, cations, and nutrients
The analytical techniques used here are similar to those reported by Diaz et al. (2020b). In brief, the analytes included anions (F−, Cl−, Br−, and SO) which were measured on a Dionex ICS-2100 ion chromatograph, cations (K+, Na+, Ca2+, Mg2+, and Sr2+) which were measured on a PerkinElmer Optima 8300 inductively coupled plasma optical emission spectrometer (ICP-OES), and nutrients (NO NO, PO, H4SiO4, and NH3) which were measured on a Skalar San automated wet chemistry analyzer at the Ohio State University. Perchlorate (ClO) and chlorate (ClO) were measured using an ion chromatograph–tandem mass spectrometry technique (IC-MS/MS) at Texas Tech University (Jackson et al., 2012, 2015). All analytes are reported as listed. Total water-soluble salt concentration was calculated as the sum of all measured cations and anions. The precision of replicated check standards and samples was typically better than 10 % for all major anions, cations, and nutrients and better than 20 % for perchlorate and chlorate. Accuracy was typically better than 5 % for all major anions, cations, and nutrients, as determined by the NIST 1643e external reference standard and the 2015 United States Geological Survey (USGS) interlaboratory calibration standard (M-216), and better than 10 % for perchlorate and chlorate, as determined by spike recoveries. Precision and accuracy for individual analytes are located in Table S1. Detection limits for the analytes have been previous reported (Diaz et al., 2018; Jackson et al., 2012).
3.3 Data interpolation and machine learning
Inverse distance weighted (IDW) interpolations were performed for Bennett Platform, Thanksgiving Valley, and Roberts Massif using the Geostatistical Analyst tool in ArcMap 10.3. Since IDW is a deterministic method where unknown values are predicted based on proximity to known values, we chose those three sites as they had the most defined transects and relatively higher sample density. The interpolation parameters were constant with a power of 4, maximum neighbors of 15, minimum neighbors of 5, 4 sectors, and a variable search radius. These parameters were chosen such that they optimize for the lowest mean absolute error (MAE).
Multiple linear regressions were generated for all geochemical analytes except H4SiO4 (total of 15 dependent variables) with latitude, longitude, elevation, distance from the coast, distance from the glacier, and soil moisture as independent variables using built-in functions in R 3.6.3 (R Core Team, 2020). Random forest regression models were similarly generated using the RandomForest library. The random forest model is a machine learning algorithm that utilizes supervised learning algorithms to predict values given input predictor variables (Breiman, 2001). Multiple decision trees are run in parallel with a randomized subset of predictor variables, and the aggregate result of each tree is used to generate a predicted outcome. Since each tree is generated using a random sample and random predictor variables, the random forest model is effective at minimizing overfitting and handling outliers (Breiman, 2001). For both models, all geochemical data were log-transformed to ensure the data were normally distributed (verified using a Jarque–Bera normality test). Missing values were input as NA (not available).
Machine learning algorithms are widely used in a variety of disciplines from finance (Patel et al., 2015) to ecology (Davidson et al., 2009; Peters et al., 2007; Prasad et al., 2006) for both data prediction (regression) and classification. Recently, these techniques have been used for earth science applications, including geologic mapping (Heung et al., 2014; Kirkwood et al., 2016), air quality monitoring (Stafoggia et al., 2019), and water contaminant tracing (Tesoriero et al., 2017). We developed a novel application of machine learning to predict concentrations and gradients of water-soluble salts in Antarctic soils given set geographic parameters, similar to the approaches developed for stock market and real estate predictions (Antipov and Pokryshevskaya, 2012; Patel et al., 2015).
For our random forest models, any sparse missing values in Table S2 were estimated by averaging the geochemistry of the samples collected immediately before and after in the same transect. The new imputed dataset was split into a training set representing 86 % of the data (n = 189; Table S3) and a testing set representing the remaining 14 % (n = 31; Table S4) based on ideal model parameters described by Breiman (2001). The training dataset was used to generate the random forest models for each analyte. Each of the models was run with 2000 decision trees (ntree = 2000) to minimize the mean squared error. The number of random variables used for each node split in the decision trees was set to the recommended regression default of one third of the total number of variables to optimize the model randomness, which in our case was 2 (mtry = 2), following parameters described previously (Breiman, 2001). The scripts developed for both the multiple linear regression and random forest models are included in the Supplement.
4.1 Geochemistry of upper, middle, and lower zones
The maximum, minimum, mean, standard deviation, and coefficient of variation are reported in Table 1 for the measured geographic and geochemical data. Concentrations of water-soluble ions span up to 5 orders of magnitude and are variable across the region. Elevation, distance from the coast, distance from the glacier, and soil moisture are also variable and span up to 3 orders of magnitude. The highest elevation samples (>2000 m a.s.l.) were collected from Schroeder Hill, and the greatest soil moisture content is from Mt. Wasko at 12.3 % with a mean of 2.1 % for all samples.
Table 1Overview of geography, soil moisture, and water-soluble ions from the Shackleton Glacier region. The minimum values reported are those within the detection limits. Individual sample concentrations are detailed in Table S2.
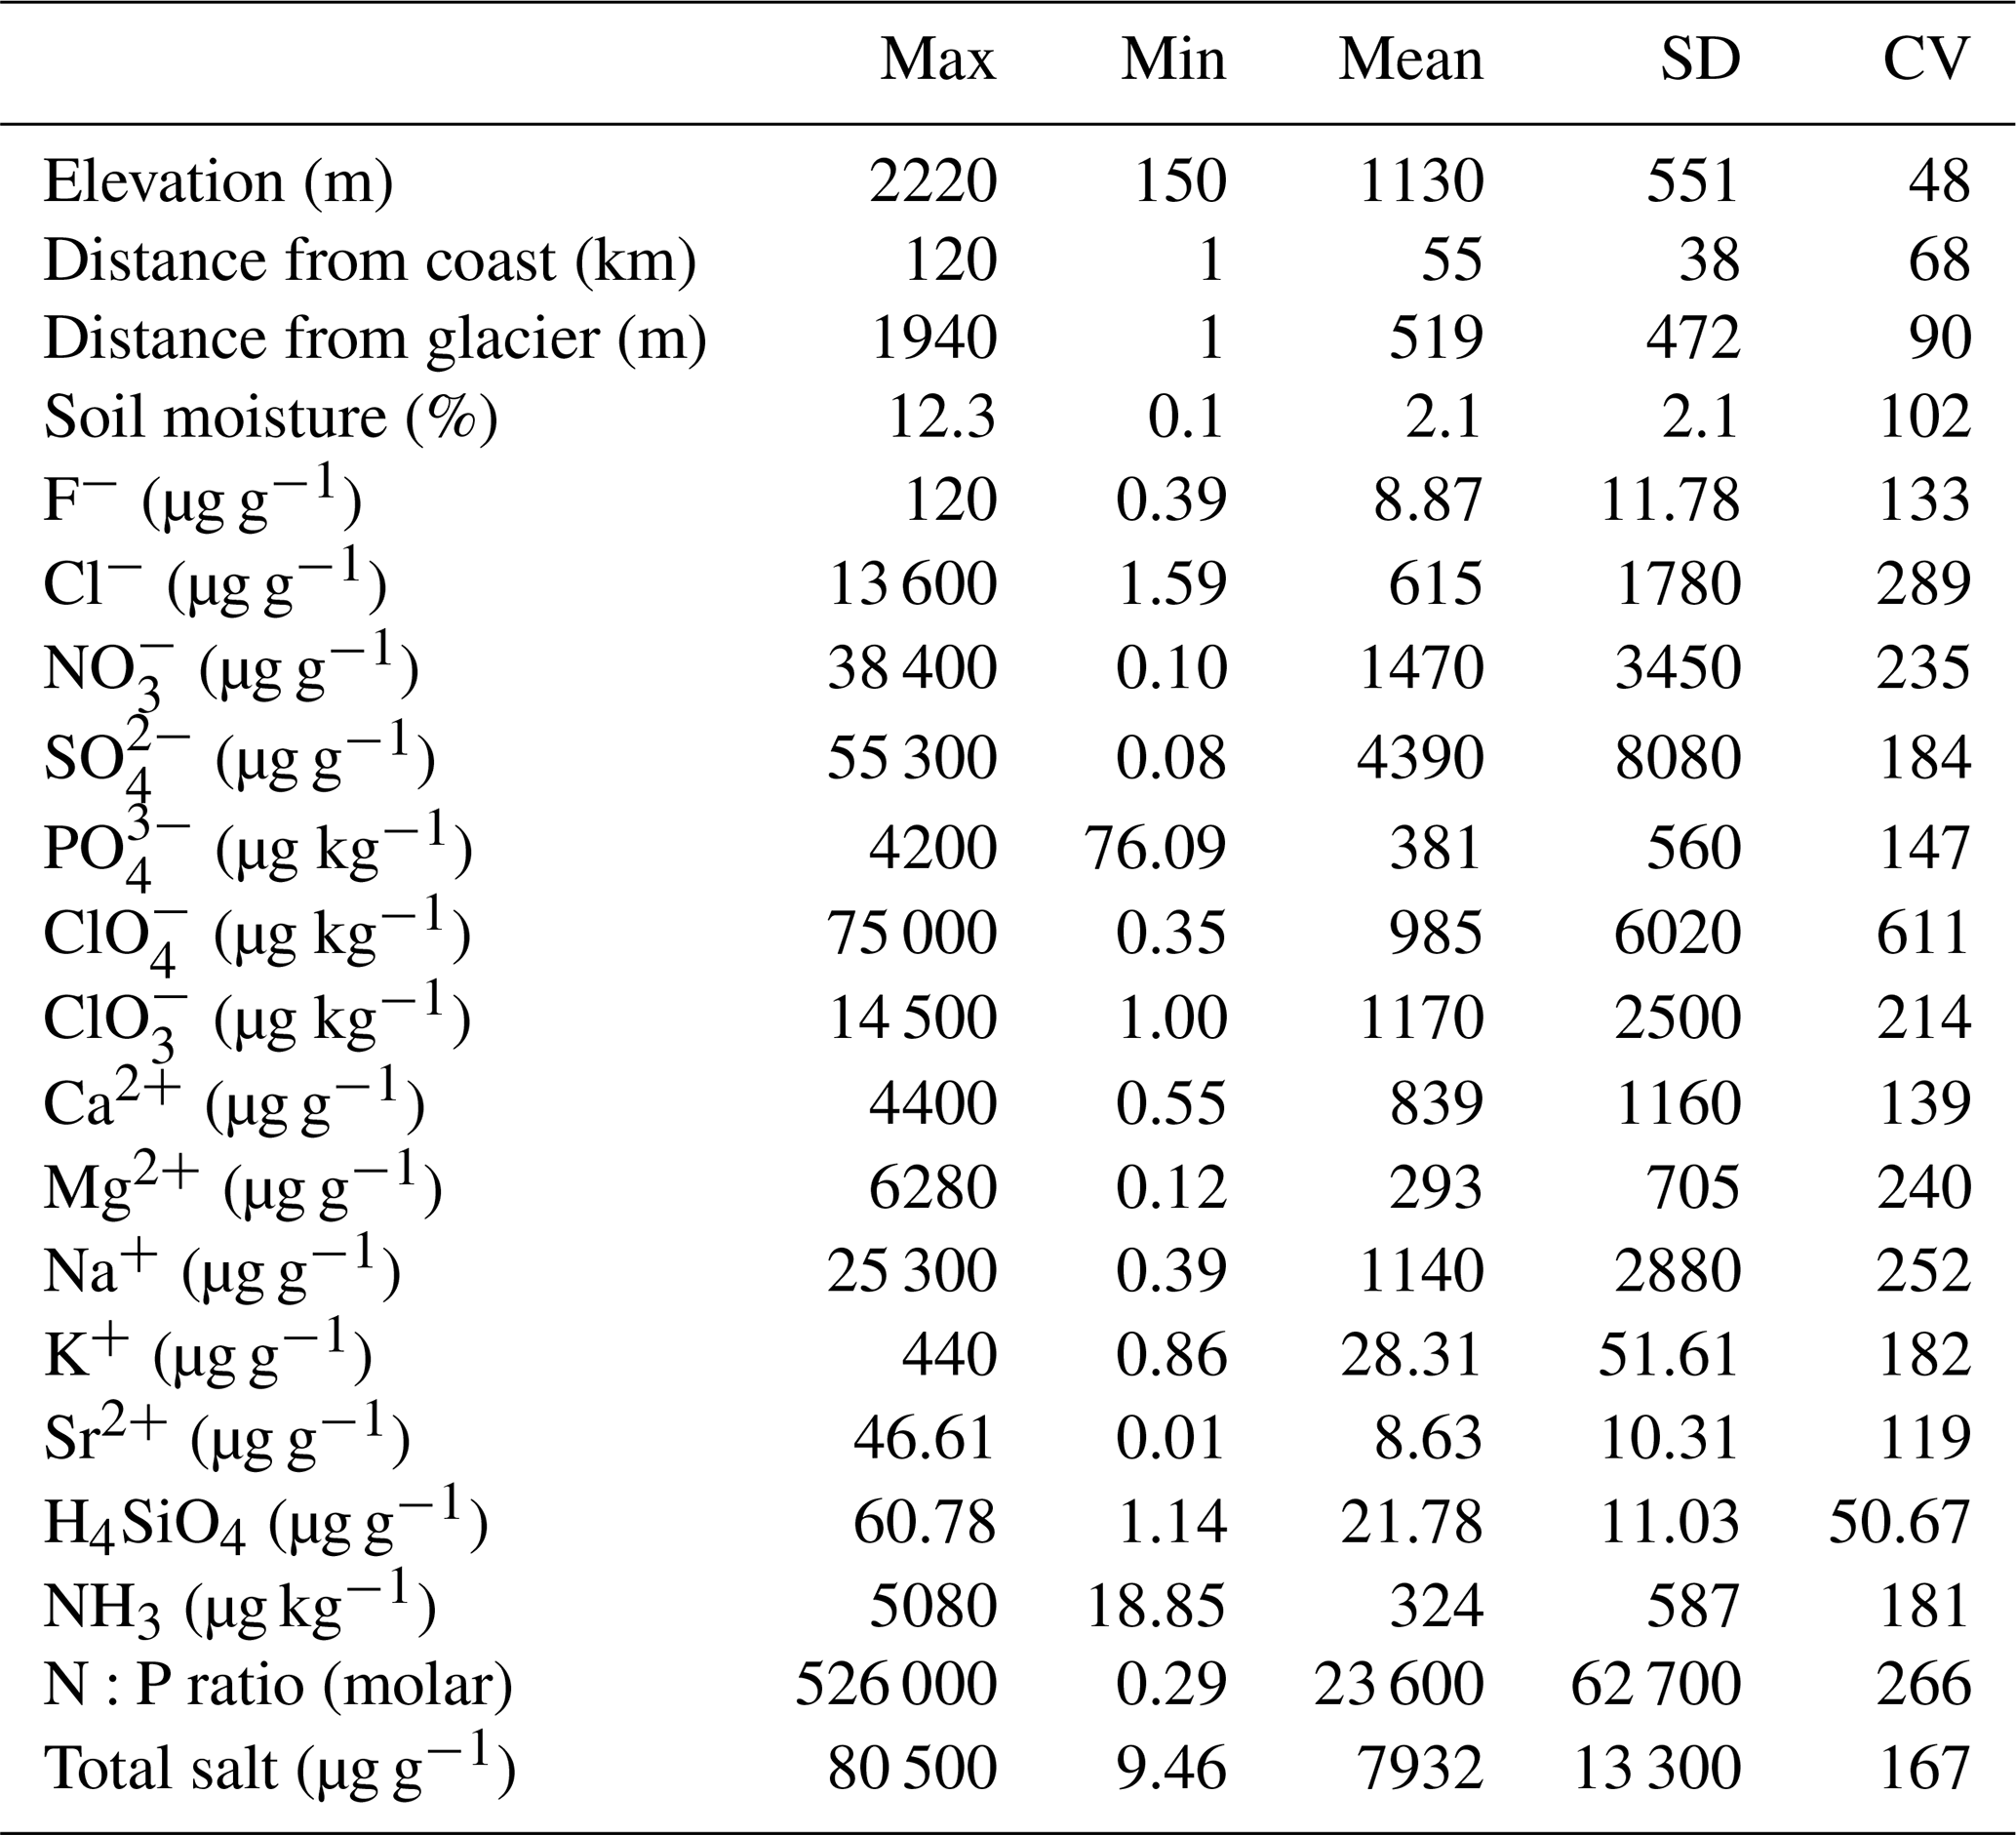
SD: standard deviation, CV: coefficient of variation.
Shackleton Glacier region surface soils can be separated into three zones based on their water-soluble geochemistry: an upper zone near the Polar Plateau, a middle zone near the center of the glacier, and a lower zone where the glacier flows into the Ross Sea (Figs. 1, 2). The upper zone samples are characterized by the highest total water-soluble salt concentrations, with the highest values greater than 80 000 µg g−1 at Schroeder Hill, while the lower zone samples have the lowest total salt concentrations, with the lowest values near 10 µg g−1 at Mt. Wasko (Fig. 2a–c). The middle zone has intermediate values. Water-soluble N:P molar ratios generally follow a similar trend (Fig. 2d–f). The lowest N:P ratios are in the lower zone soils, while the middle and upper zones have more variable values. Concentrations of ClO and ClO follow similar trends as the total salts with less distinction between the middle and upper zones, though most concentrations in the lower zone are below the detection limit (Fig. 2g–l; Table S2).

Figure 2Total water-soluble salts, water-soluble N:P molar ratio, and ClO and ClO concentrations (log scale) were compared to elevation, distance from the coast, and distance from the glacier for samples from the three geographic zones (blue for upper, yellow for middle, gray for lower zones). Linear regression lines are plotted, for which dashed lines represent regressions where p>0.05 with a Bonferroni correction, and R2 values are reported for each relationship. The horizontal orange lines represent nematode salt tolerance of ∼ 2600 (Nkem et al., 2006), and the green lines represent the Redfield ratio, N:P = 16, for phytoplankton in the ocean.
Observed trends between the zones appear to be driven, at least partially, by geography. Regressions of total water-soluble salt concentration, water-soluble N:P ratio, and ClO concentration with elevation, distance from the coast, and distance from the glacier are all positive (Fig. 2). The strongest relationships are between total salts and elevation, and N:P ratio and elevation with R2 values of 0.59 and 0.52, respectively, and p values <0.001 with a Bonferroni correction which was applied to minimize the Familywise Type 1 error rate associated with multiple comparisons (Fig. 2a, d). The weakest relationships are between ClO and distance from the coast and ClO and distance from the glacier with R2 values of 0.11 and 0.06, respectively (Fig. 2h, i). Distance from the glacier varies widely between individual zones with frequent overlaps, but there appears to be a moderate relationship with N:P ratio and total salts (Fig. 2c, f). Overall, total salt concentration has the strongest relationship with geography and ClO has the weakest relationships.
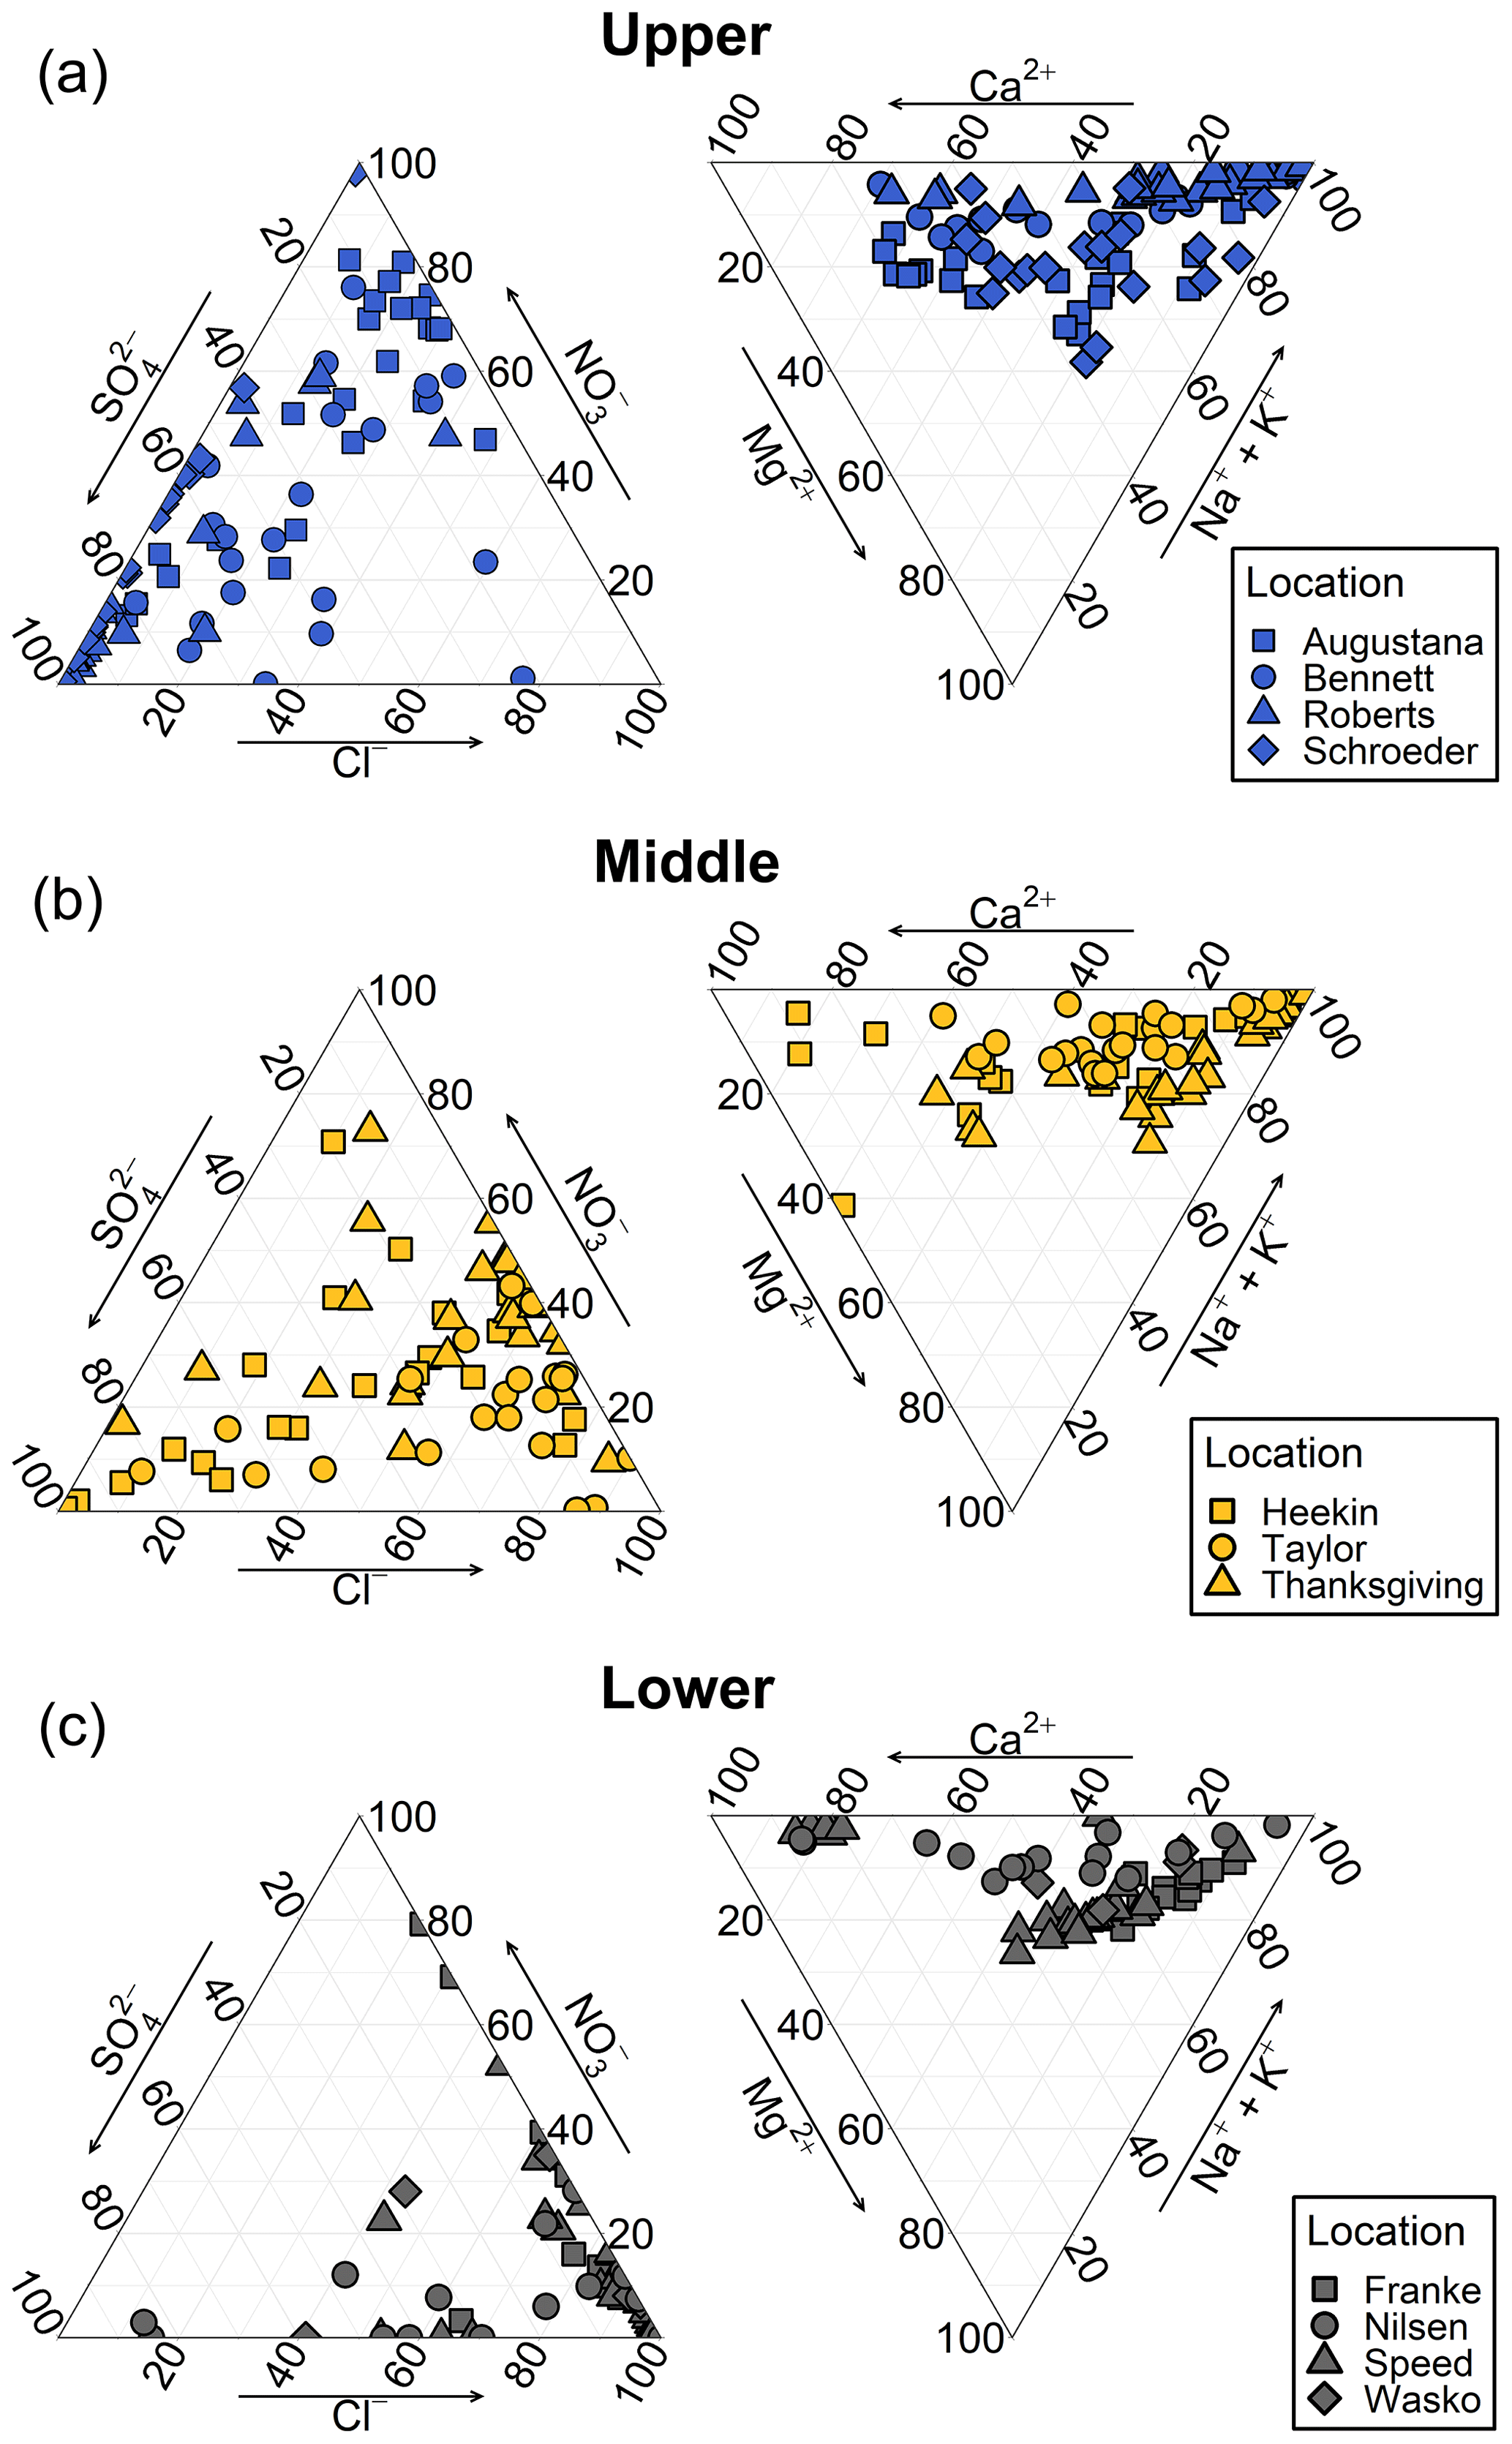
Ternary diagrams highlight the specific geochemical gradients within and between the zones (Fig. 3). The anion ternary diagram only includes SO, NO, and Cl−, which are the major water-soluble salts in the region (Claridge and Campbell, 1968; Diaz et al., 2020b). Though carbonate and bicarbonate salts have been identified in both lacustrine sediments and soils in Antarctica, previously measured concentrations in the Shackleton Glacier region were low, ranging from 0.07 % to 2.5 %, and bicarbonate salts were not identified in the highest elevation and furthest inland soils (Claridge and Campbell, 1968; Diaz et al., 2020b; Lyons et al., 2016). The most abundant anion for the upper zone is SO, which is greater than 99 % of the total anion budget in some Schroeder Hill and Roberts Massif samples, though other locations are dominated by NO (Fig. 3). The anions are more evenly distributed in the middle zone, though the majority of samples are most abundant in NO and Cl−. The lower zone has much lower SO fractions than the upper zone, and the dominant anion is generally Cl−. The cation distribution is very similar for all three zones (Fig. 3). Na K+ is the most abundant cation pair representing over 90 % of the total cations for many upper and middle zone samples, while Ca2+ is the second most abundant. In general, Mg2+ is the least abundant cation across all sampling locations.
4.2 Statistical geochemical variability
A principal component analysis (PCA) using the correlation matrix (i.e., scale = TRUE) was performed in R (using factoextra; Kassambara and Mundt, 2017) and built in R software libraries to determine which geochemical variables most strongly differ across the samples. For the PCA, the first two principal components (PC1 and PC2) account for over 50 % of the total dataset variability at 44.2 % and 11.6 %, respectively. The different zones are correlated with different principal components (Fig. 4). The samples from the middle zone are positively correlated with PC1 and PC2. In the biplot, they plot in the upper-right quadrant with high concentrations of Cl−, NO, water-soluble N:P ratio, and Ca2+ and with a minor influence from soil moisture and H4SiO4. The upper zone samples generally plot along PC1 and are most associated with Sr2+, SO, Mg2+, Na+, K+, F−, ClO, and ClO. The samples from the lower, more coastal zone are negatively correlated with PC1 and are distinguished by their higher PO concentrations. Most samples from all locations plot within the 95 % confidence interval ellipses. However, there are two strong outliers from Schroeder Hill and Mt. Heekin.
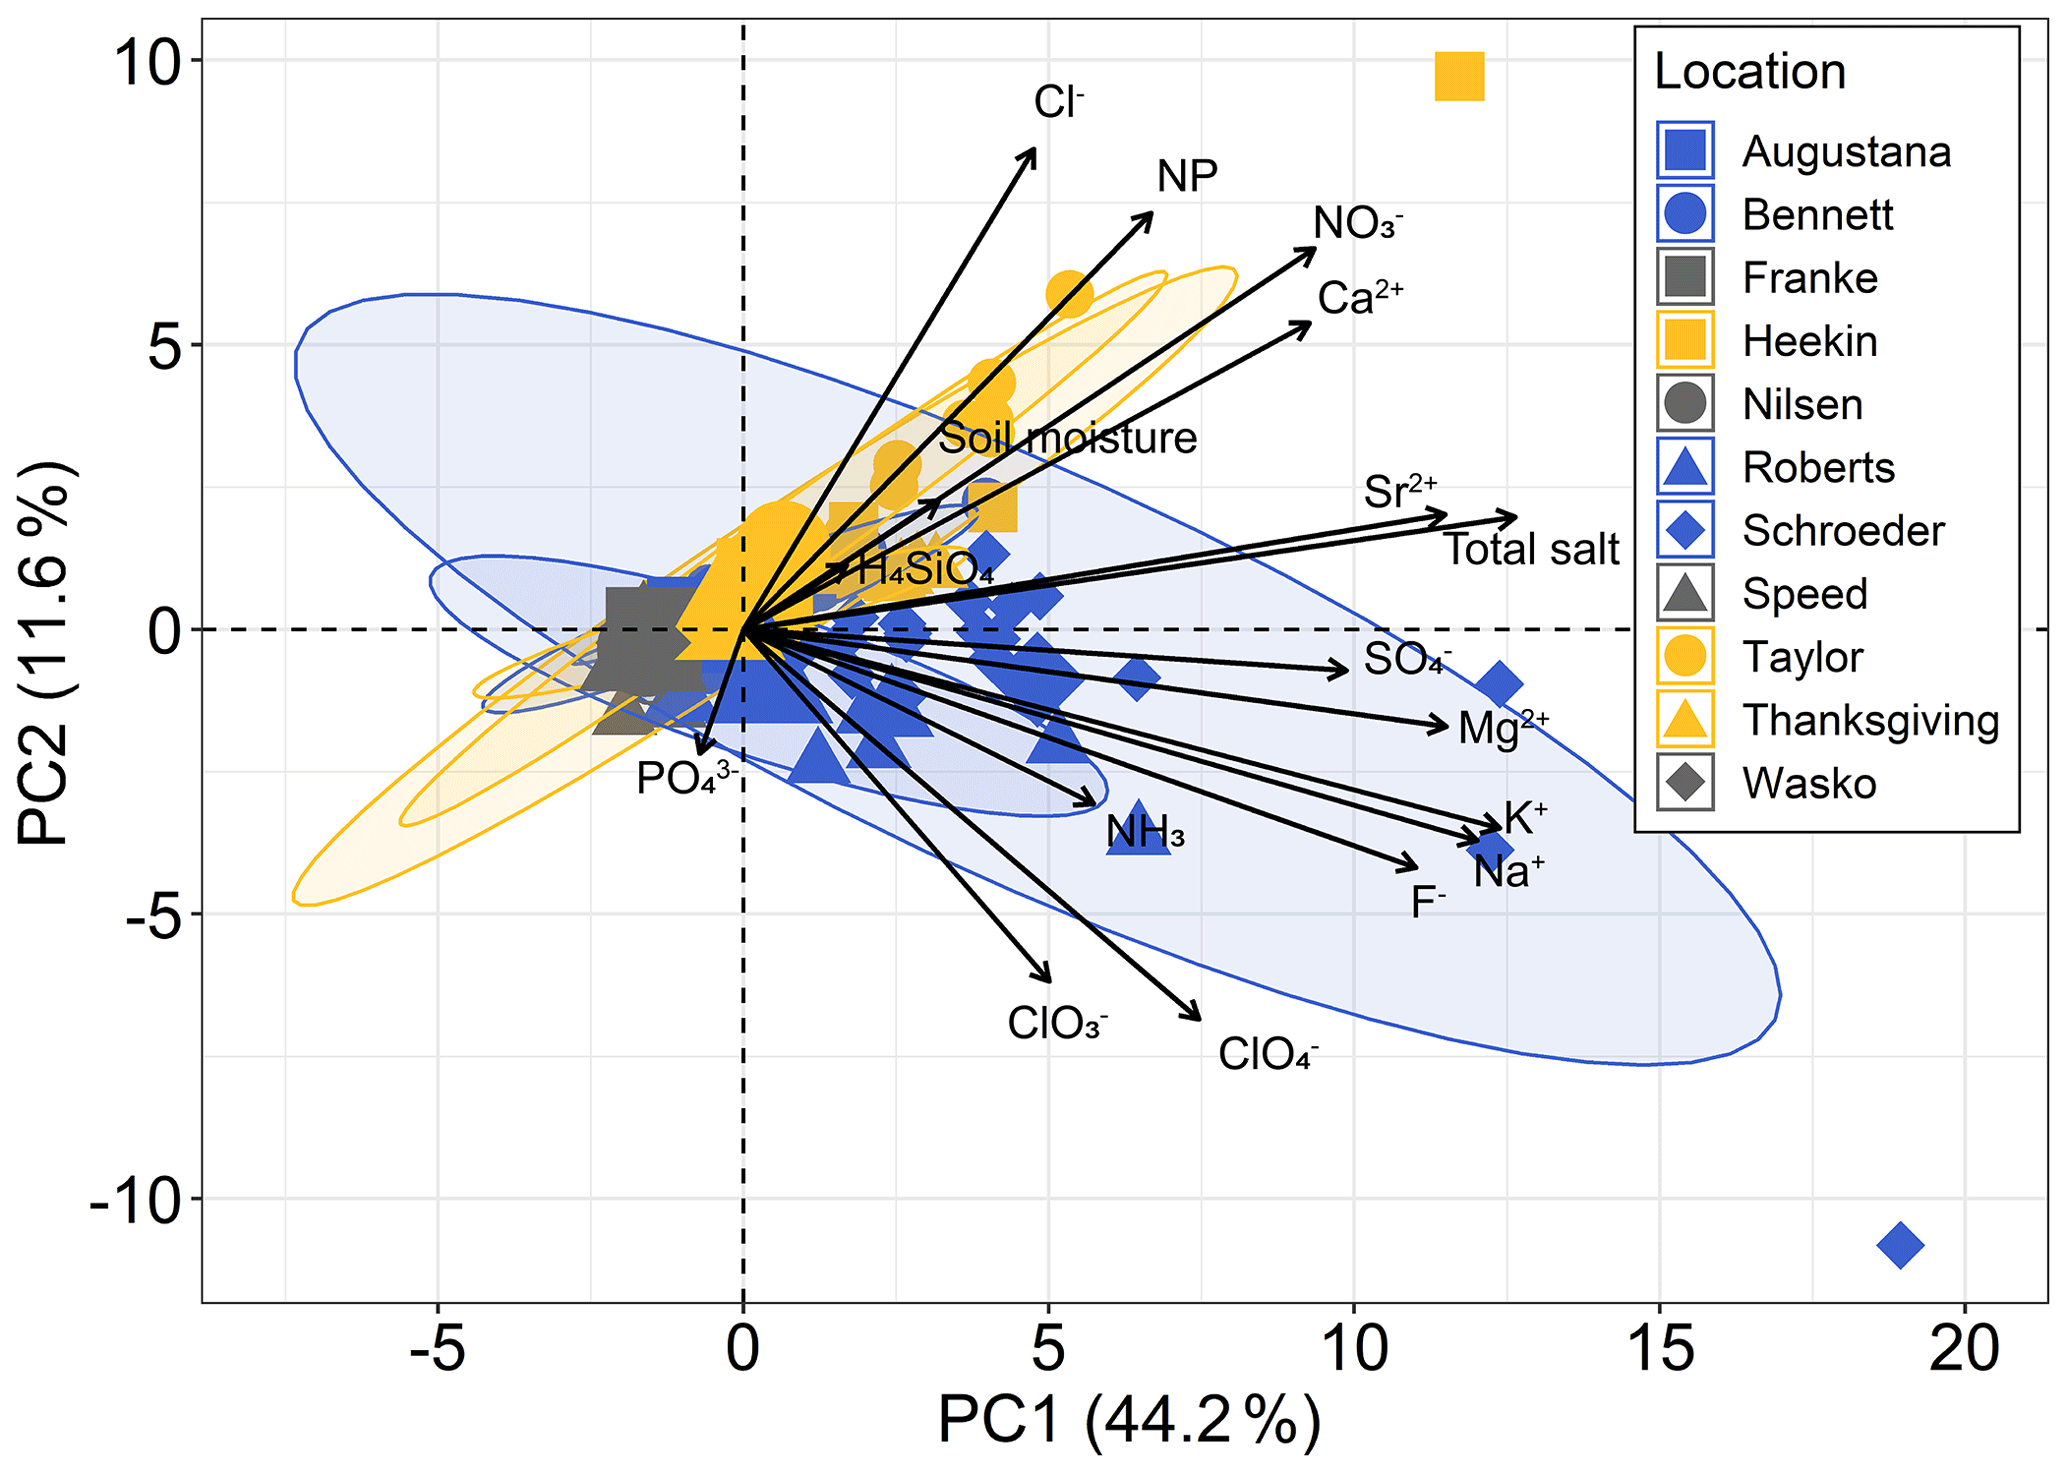
Figure 4Principal component analysis (PCA) biplot generated in R using factoextra and built in R software libraries with all anions, cations, nutrients, and soil moisture for the three geographic zones. The PCA is based on the correlation matrix (i.e., scale = TRUE). Principal component 1 and principal component 2 are plotted on the x and y axes, respectively. Shaded ellipses represent 95 % confidence intervals.
Similar to the PCA, we performed a simple Spearman's rank correlation for the entire dataset to visualize the statistical dependence between all variables. Since a goal of this study is to relate water-soluble ion concentrations to geography, we focused on latitude, longitude, distance from the coast, distance from the glacier, and soil moisture. The strongest correlation coefficients are between Cl− and latitude, elevation, and distance from the coast and Sr2+ and soil moisture (Fig. 5). Most other correlations are moderate to weak, though there appear to be notably stronger correlations between ClO and latitude and distance from the coast, Ca2+ and longitude, elevation, and distance from the coast, NO and latitude, and SO and distance from the glacier. Longitude, elevation, and distance from the coast have the greatest number of strong and moderate correlations with the geochemistry data. Outside of the geographic parameters, Na+ is highly correlated with total water-soluble salts, likely representative of the high Na K+ percentages (Fig. 3), and Sr2+ is highly correlated with K+, likely reflecting a common ion source.
4.3 Spatial interpolation and machine learning model performance
The total salt concentrations of individual samples at Bennett Platform produce the most defined interpolation gradient from the glacier front to further inland compared to Roberts Massif and Thanksgiving Valley (Fig. 6). Bennett Platform also has the smoothest salt concentration contours suggesting that the interpolation model is the strongest and most robust at this location. The second strongest interpolation is Thanksgiving Valley. Contrary to the measurements at Bennett Platform, Thanksgiving Valley has the highest salt concentrations in the center of the valley with lower concentrations to both the east and west. The lowest concentration contours are closest to the glacier for both Bennett Platform and Thanksgiving Valley, which is likely related to glacial history since the soils near the glacier are relatively younger than those further inland based on meteoric 10Be data (Diaz et al., 2020a). The interpolation from Roberts Massif does not have a distinguishable spatial trend.
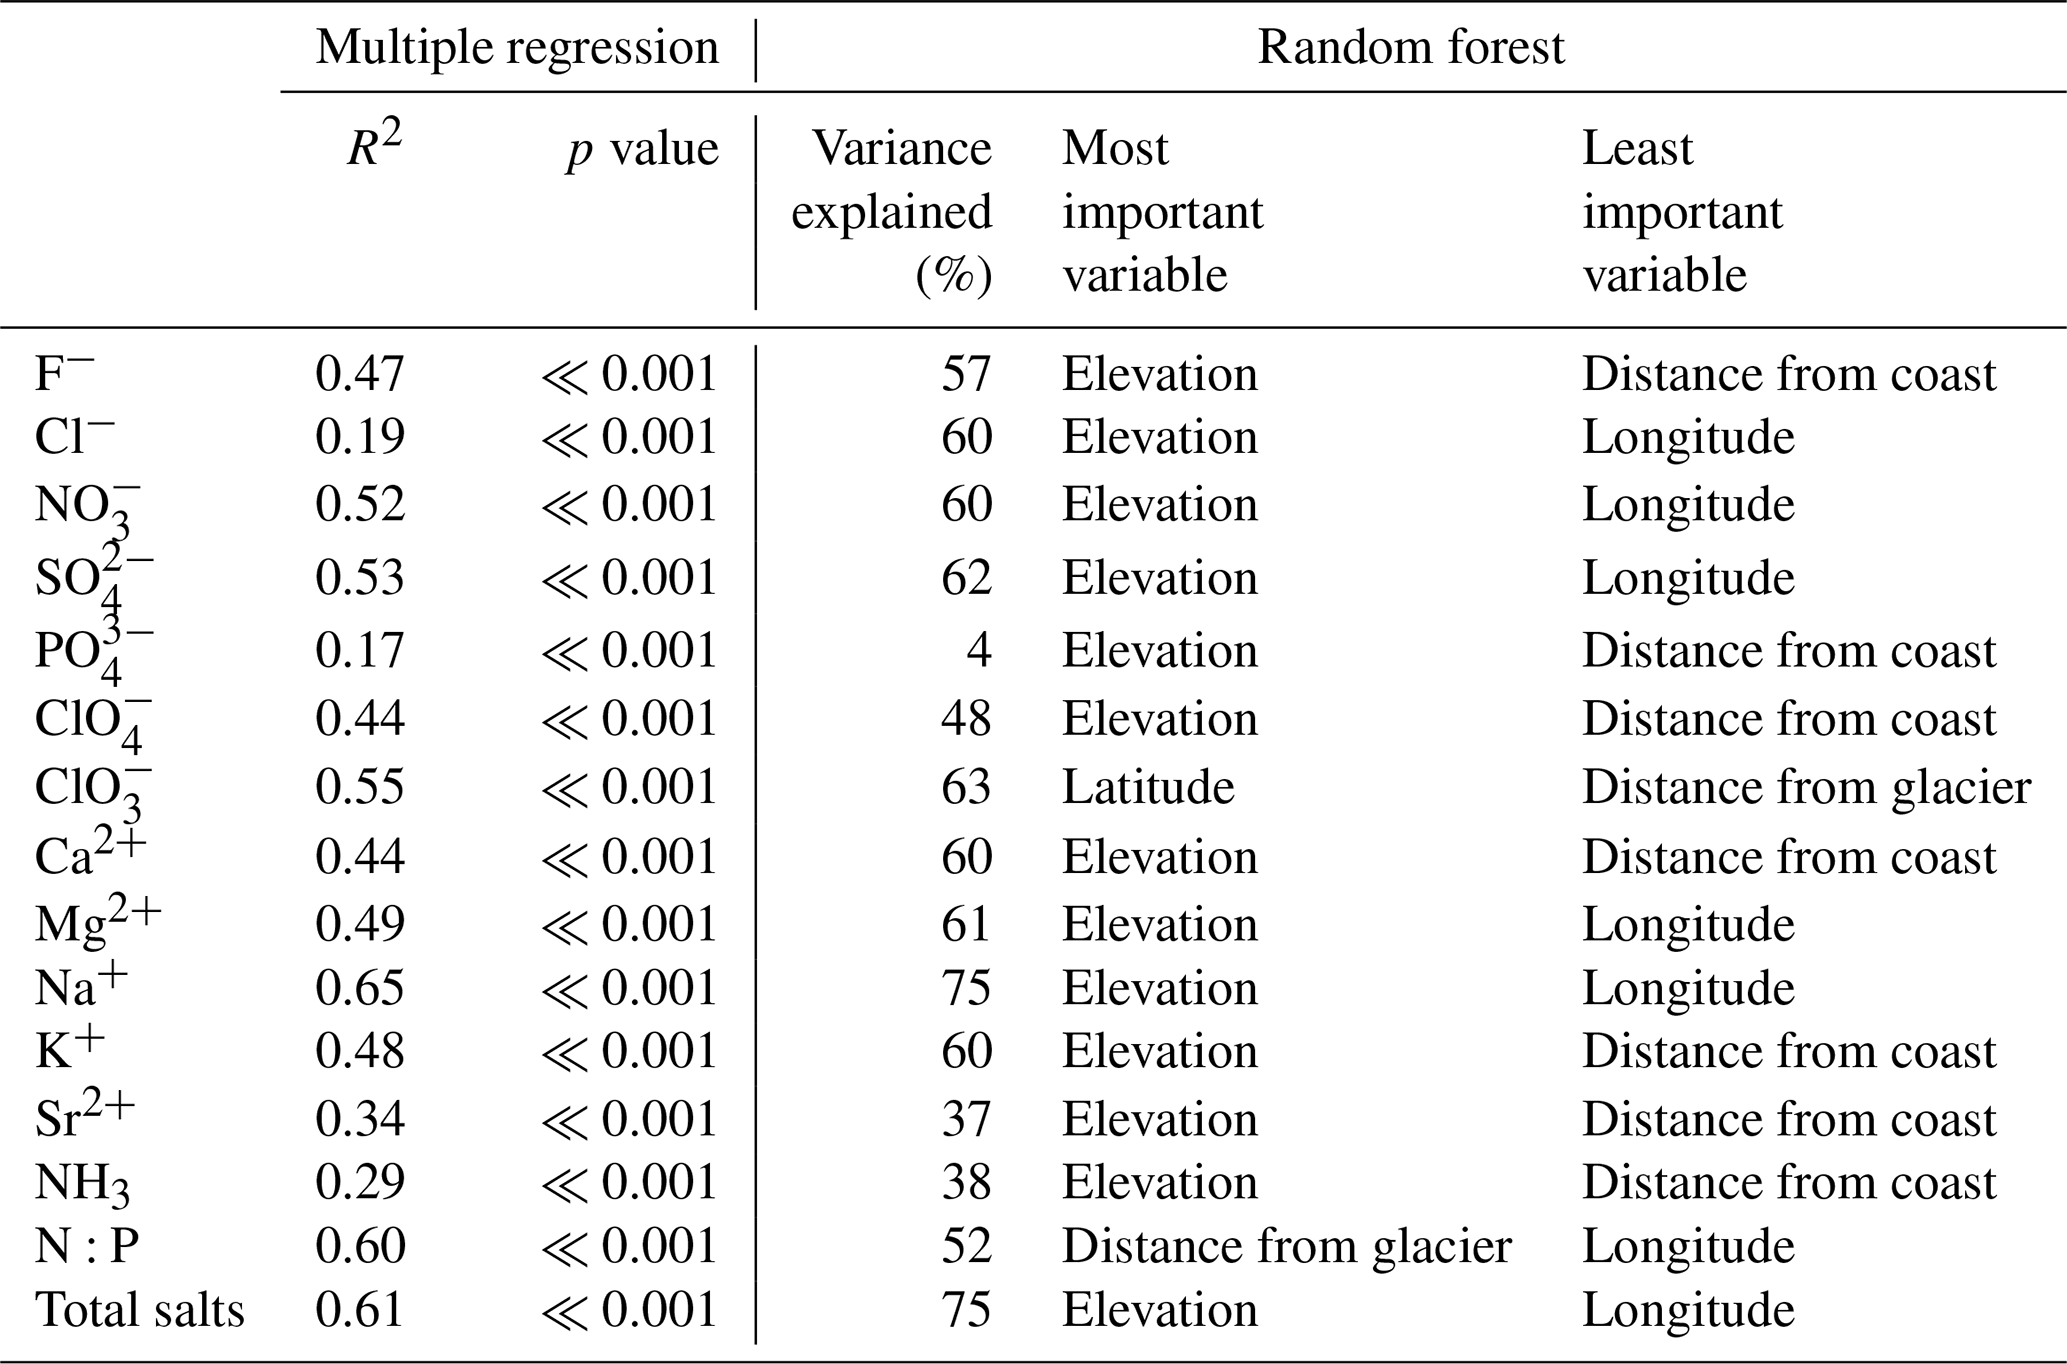
The multiple linear regression and random forest models vary in their strength for the individual analytes. The highest R2 value from the linear regression is 0.65 for Na+, while total water-soluble salts, water-soluble N:P ratio, ClO, and ClO have values of 0.61, 0.60, 0.44, and 0.55, respectively (Table 2). The lowest R2 value is for PO at 0.17. The p values for all analytes are ≪0.001 even with a Bonferroni correction. The highest out-of-the-box explained variance values from the random forest models are for total salts and ClO at 75 % and 63 %, respectively. The lowest explained variance is for Sr2+ at 37 %. The values of N:P ratio and ClO are 52 % and 48 %, respectively. We also evaluated the most important and least important variables in the random forest models based on node purity. The most important variable for the majority of analytes is elevation, while distance from the glacier is most important for N:P ratio and latitude for ClO (Table 2). The least important variables are distance from the coast and latitude for every analyte except ClO, for which distance from the glacier is least important.
Table 2Out-of-the-box multiple linear regression and random forest model statistics generated in R. All geochemical data were log-transformed.
5.1 Implications for ecological habitat suitability
By establishing geochemical zones for the Shackleton Glacier region, we can better understand the relationship between geochemistry and geography and ultimately biogeography. As stated in the introduction, we focused particularly on total water-soluble salt concentrations, water-soluble N:P ratios, and ClO and ClO concentrations.
5.1.1 Elevation and moisture controls on total water-soluble salt gradients
The elevational trends of total salt concentrations at the Shackleton Glacier are similar to those previously described in the TAM, where soils from higher elevation sites typically have higher salt concentrations (Bottos et al., 2020; Lyons et al., 2016; Magalhães et al., 2012). Our results are also consistent with those from Scarrow et al. (2014) who found that salt concentrations typically decreased with distance from the glacier in the Beardmore and Lennox-King glacial regions. Our total water-soluble salt interpolation maps highlight the spatial variability in Shackleton Glacier region soils (Fig. 6). The most spatially variable location is Robert Massif, which does not appear to follow local elevational, latitudinal, and/or distance inland gradients. This heterogeneity is not necessarily due to currently active soil leaching as the soil moisture values are not drastically different between the samples (Table S2). Though the variability in cation concentrations is likely due to the weathering of tills, scree, and bedrock (Claridge and Campbell, 1968), recent work on the isotopic composition of water-soluble nitrate and sulfate, the major anions in the upper zone, suggests a common, atmospheric source (Diaz et al., 2020b).
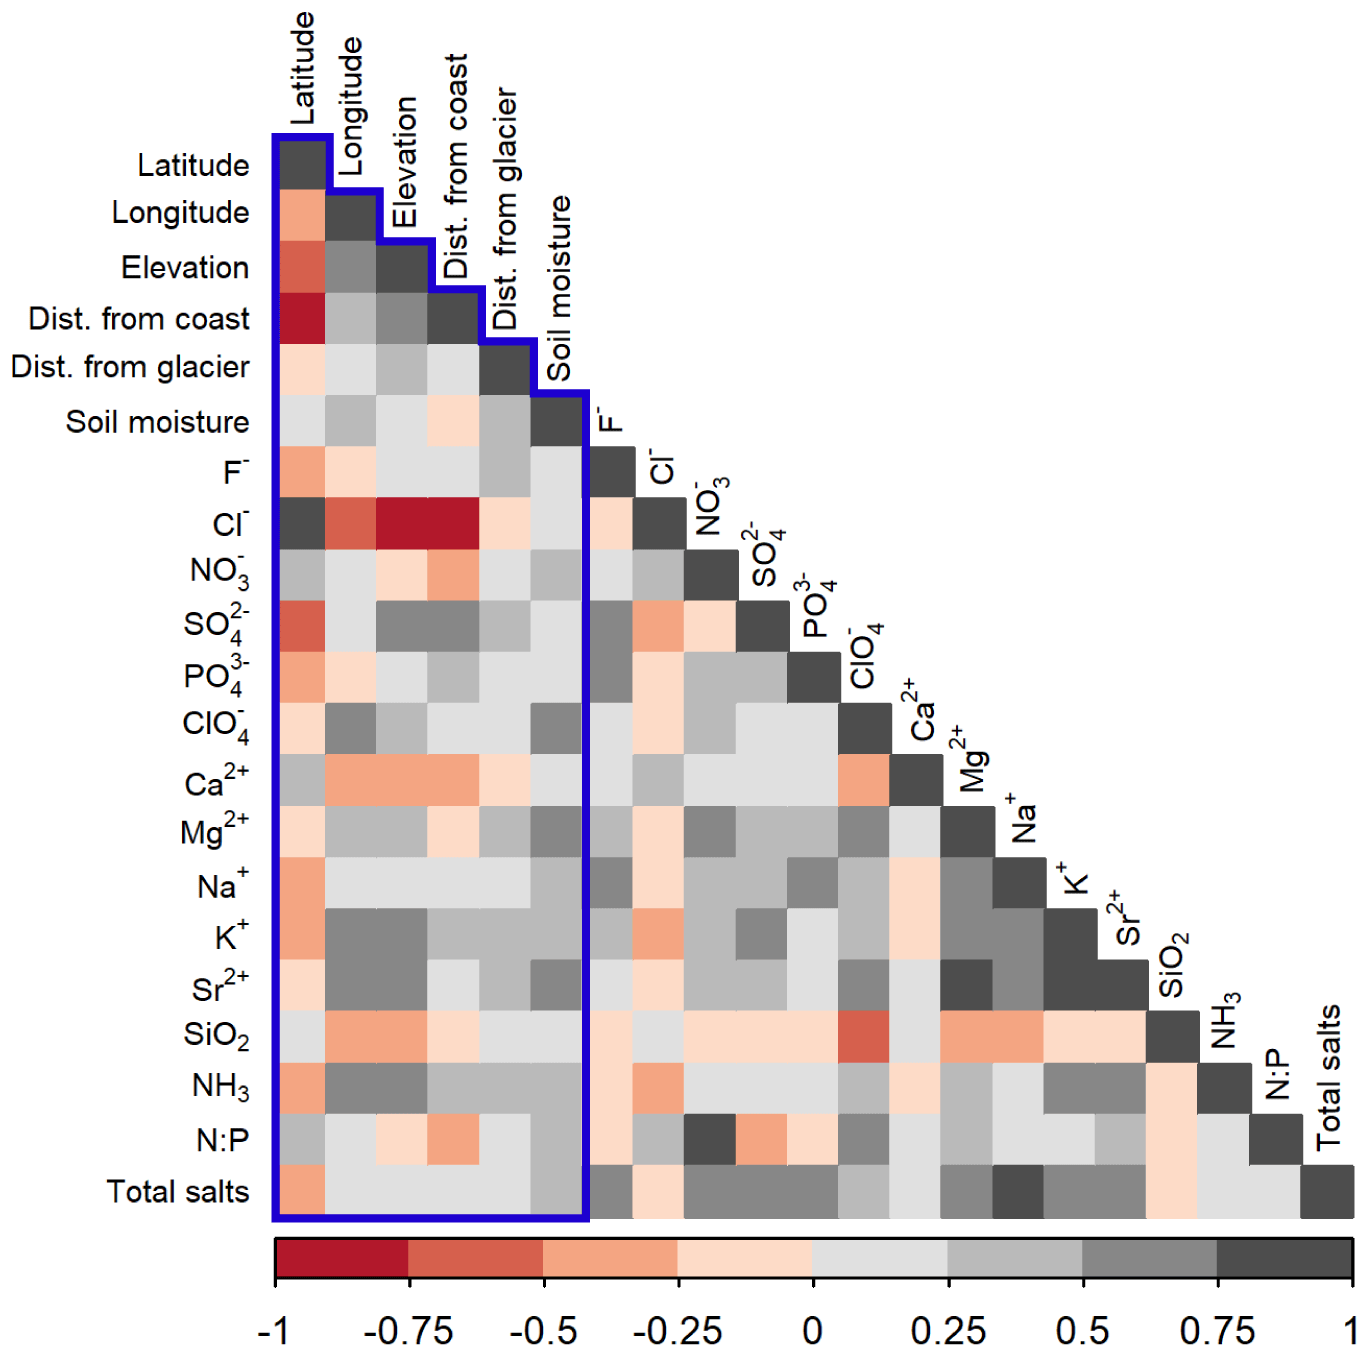
Figure 5Spearman's rank correlation matrix generated in r using the corrplot library. The colors represent correlation coefficients, indicating the strength and magnitude of the correlation. The blue box indicates the geographic variables and soil moisture, which were variables used in the multiple linear regression and random forest models. Familywise Type 1 error corrections were not applied in this analysis.
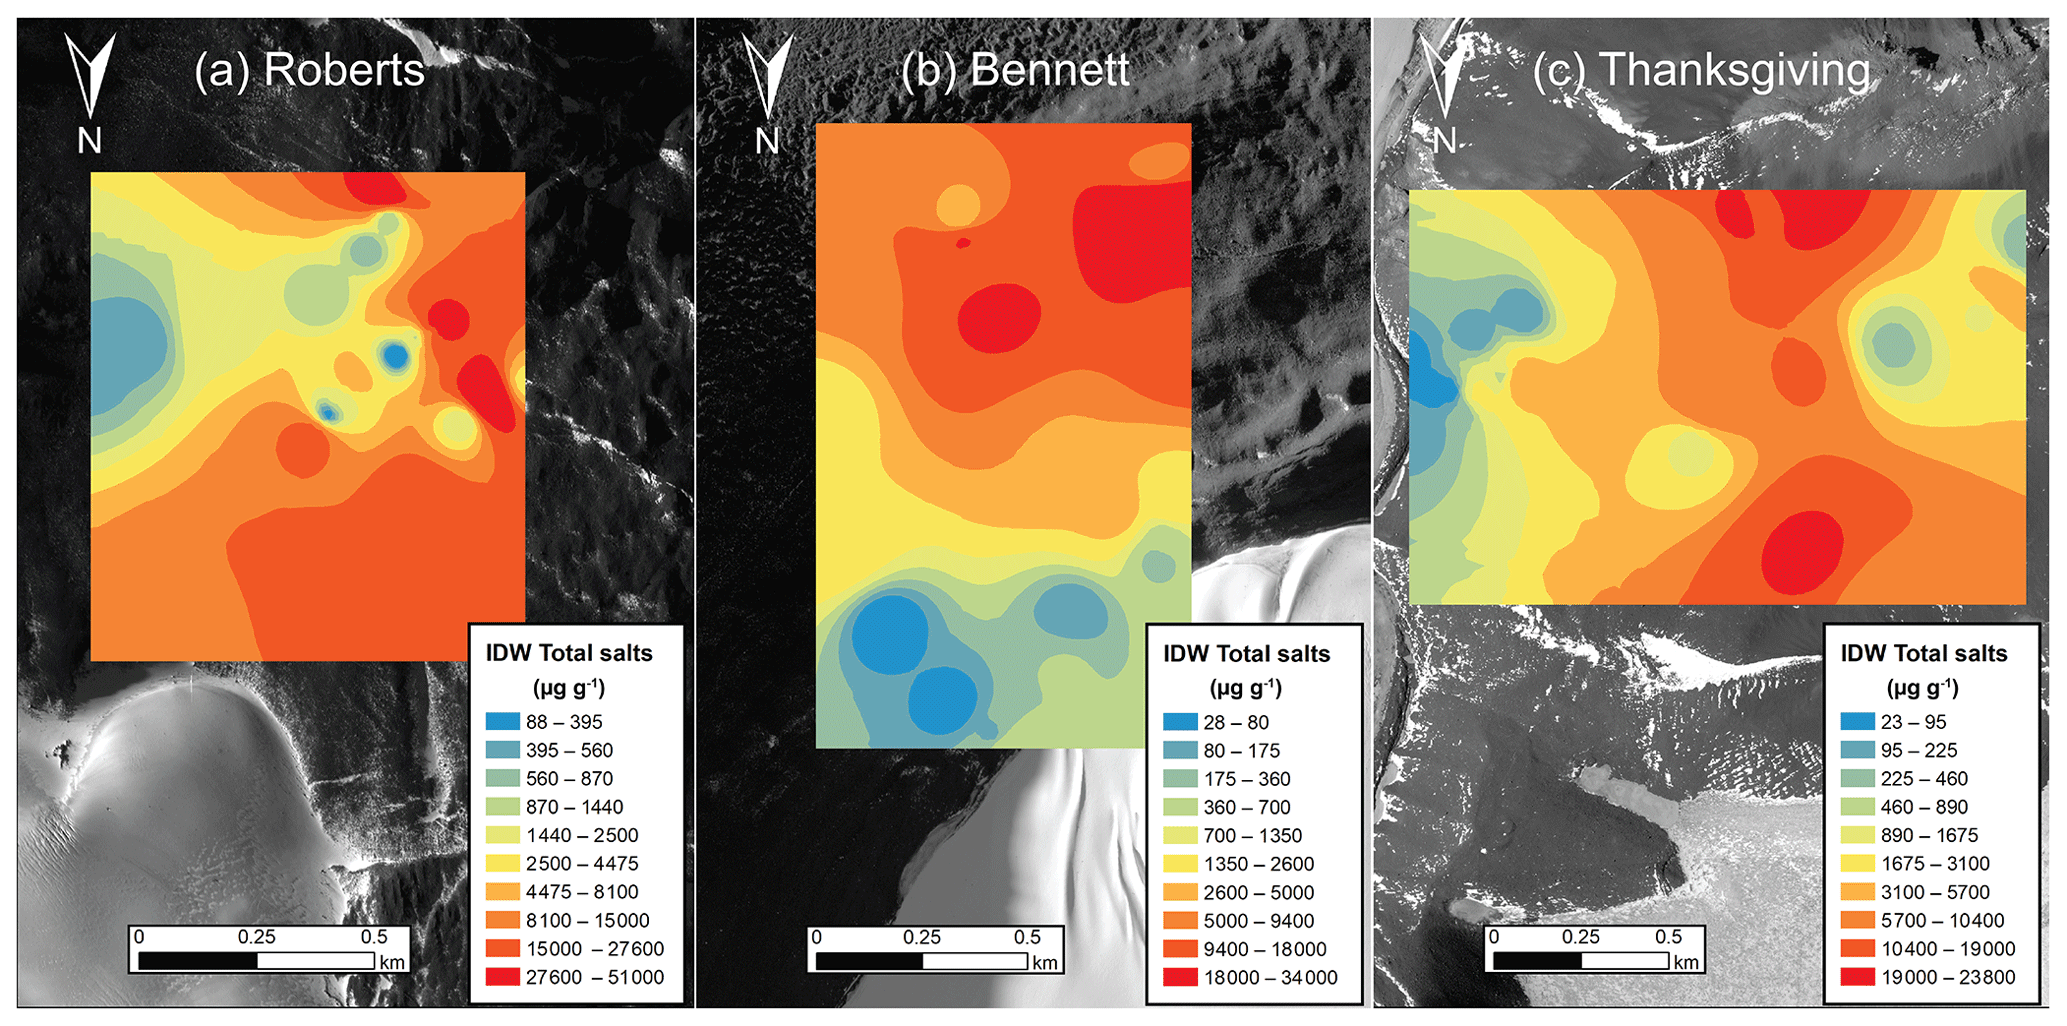
Figure 6Inverse distance weighted (IDW) interpolations of total salt concentration for Roberts Massif (a), Bennett Platform (b), and Thanksgiving Valley (c). The color scale represents the 10 natural breaks in the data. Interpolations were created and mapped using the Geostatistical Analyst tool in ArcMap 10.3.
We argue that the heterogeneity in the total salt concentrations at Roberts Massif (Figs. 2, 6) is probably related to different and complex wetting history, in which seasonal snow patch melt may pool in local depressions, transporting water-soluble salts from slightly higher elevations and/or from saline wet patches (Levy et al., 2012). This is demonstrated on a larger scale at Thanksgiving Valley, a glacially carved valley where the higher concentrations of salts in the center of the valley are likely due to the transport of salts from nearby higher elevation slopes during melting events. This is further evidenced by the presence of two small, closed-basin ponds in the center of the valley which likely formed from glacial melt and may have been larger in size in the recent past (Diaz et al., 2020). Similarly, streams and meltwater tracks in the MDV leach soils and carry salts into closed-basin, brackish to hyper-saline lakes where salts are cryoconcentrated over time (Lyons et al., 1998). Our results suggest that elevation and wetting history are important contributors to total salt gradients in the Shackleton Glacier region as they influence the accumulation of salts and subsequent leaching from soils.
5.1.2 Influence of glacial history on water-soluble N:P ratios
Stoichiometric dependencies have been identified for Antarctic terrestrial organisms, in which nutrient concentrations, in addition to soil aridity, limit ecosystem development (Nkem et al., 2006). Since nitrate is primarily derived from atmospheric deposition and phosphorus is primarily liberated from minerals by chemical weathering in the CTAM, many inland and higher elevation soils have accumulated high concentrations of NO, resulting in stoichiometric imbalance with soluble PO (Ball et al., 2018; Barrett et al., 2007; Diaz et al., 2020b; Lyons et al., 2016; Nkem et al., 2006). As in the MDV, younger and coastal soils at lower elevations in the Shackleton Glacier region have the lowest water-soluble N:P ratios driven by relatively low concentrations of NO and high concentrations of PO due to an increase in moisture content and chemical weathering (Heindel et al., 2017) (Figs. 2, 4). It is not surprising that life was conspicuous in these soils with thick lichen growth on several rocks and the presence of both Collembola and mites at Mt. Speed and Mt. Wasko (Fig. S1). However, despite overall elevational and latitudinal gradients, some inland locations in the middle and upper zones have water-soluble N:P ratios near those from the lower zone (Fig. 2).
The interpolation model from Bennett Platform shows that some locations near the glacier have lower total water-soluble salt concentrations (Fig. 6), similar to soils surveyed in the MDV (Bockheim, 2002). However, the samples near the glacier at Bennett Platform not only have lower total salt concentrations, they also have lower N:P ratios than samples collected further inland. This is also the case for the middle zone locations (Fig. 2f). We argue that this is due to differences in glacial history between the locations. Our previous work showed that soils near the glacier are younger than soils further inland in the Shackleton Glacier region (Diaz et al., 2020a). These soils are shielded from nitrate accumulation during glacial periods, and the recently exposed rocks likely serve as fresh mineral weathering material for PO mobilization (Heindel et al., 2017). Recently exposed and relatively nutrient-rich soils might be important refugia for invertebrates. Previous hypotheses have suggested that organisms may have persisted at higher elevations during glacial periods (Bennett et al., 2016; Stevens and Hogg, 2003). However, abiotic gradients in the Beardmore Glacier region suggest that higher elevation soils have salt concentrations that would classify them as unsuitable habitats (Lyons et al., 2016). If few organisms survived glaciations, the near-glacier, relatively P-rich soils may be important in helping communities recover and restructure post-glaciation.
5.1.3 High and variable ClO and ClO concentrations
Our ClO and ClO concentrations include the highest measured in Antarctica to date and are comparable to concentrations from the Atacama and Mojave deserts (Jackson et al., 2015). Though not a strong correlation, the highest elevation samples (upper zone) have the highest ClO and ClO concentrations (Fig. 2g, j). Similar to NO, ClO and ClO are derived from atmospheric deposition, and, because of their high solubilities, their accumulations are related to wetting and glacial histories (Jackson et al., 2016, 2015). Therefore, soils which have been exposed for long periods of time and have not experienced snow or ice melt, such as those from Schroeder Hill and Roberts Massif, are able to accumulate high concentrations of ClO and ClO. Interestingly, our ClO concentrations are lower – maximum of ∼ 1.9 g L−1 – than the highest recorded tolerance – 1.1 M (∼ 130 g L−1) NaClO4 – for the extremotolerant bacteria Planococcus halocryophilus, yet a recent study shows no detectable biomass for Schroeder Hill samples (Dragone et al., 2020). (Per)chlorates are strong oxidizers and are well established as toxic; thus the concentrations of ClO and ClO might be additional, crucial indicators of habitat suitability. However, the concentrations are highly heterogenous across our sampled locations (Fig. 2k–l), and unlike ClO, neither the multiple linear regression nor random forest models were able to adequately capture the variability in ClO concentrations (Table 2).
Table 3Multiple linear regression and random forest statistics between predicted and measured concentrations from the Shackleton and Darwin Glacier regions. R2 and p values are reported for the correlations between measured and predicted concentrations. Regression slopes and test statistic values (t) were calculated using the smatr library (Warton et al., 2012) in R to evaluate the null hypothesis (H0) of slope = 1. Higher test statistic values (closer to 1) indicate that we reject the null hypothesis. All geochemical data were log-transformed.
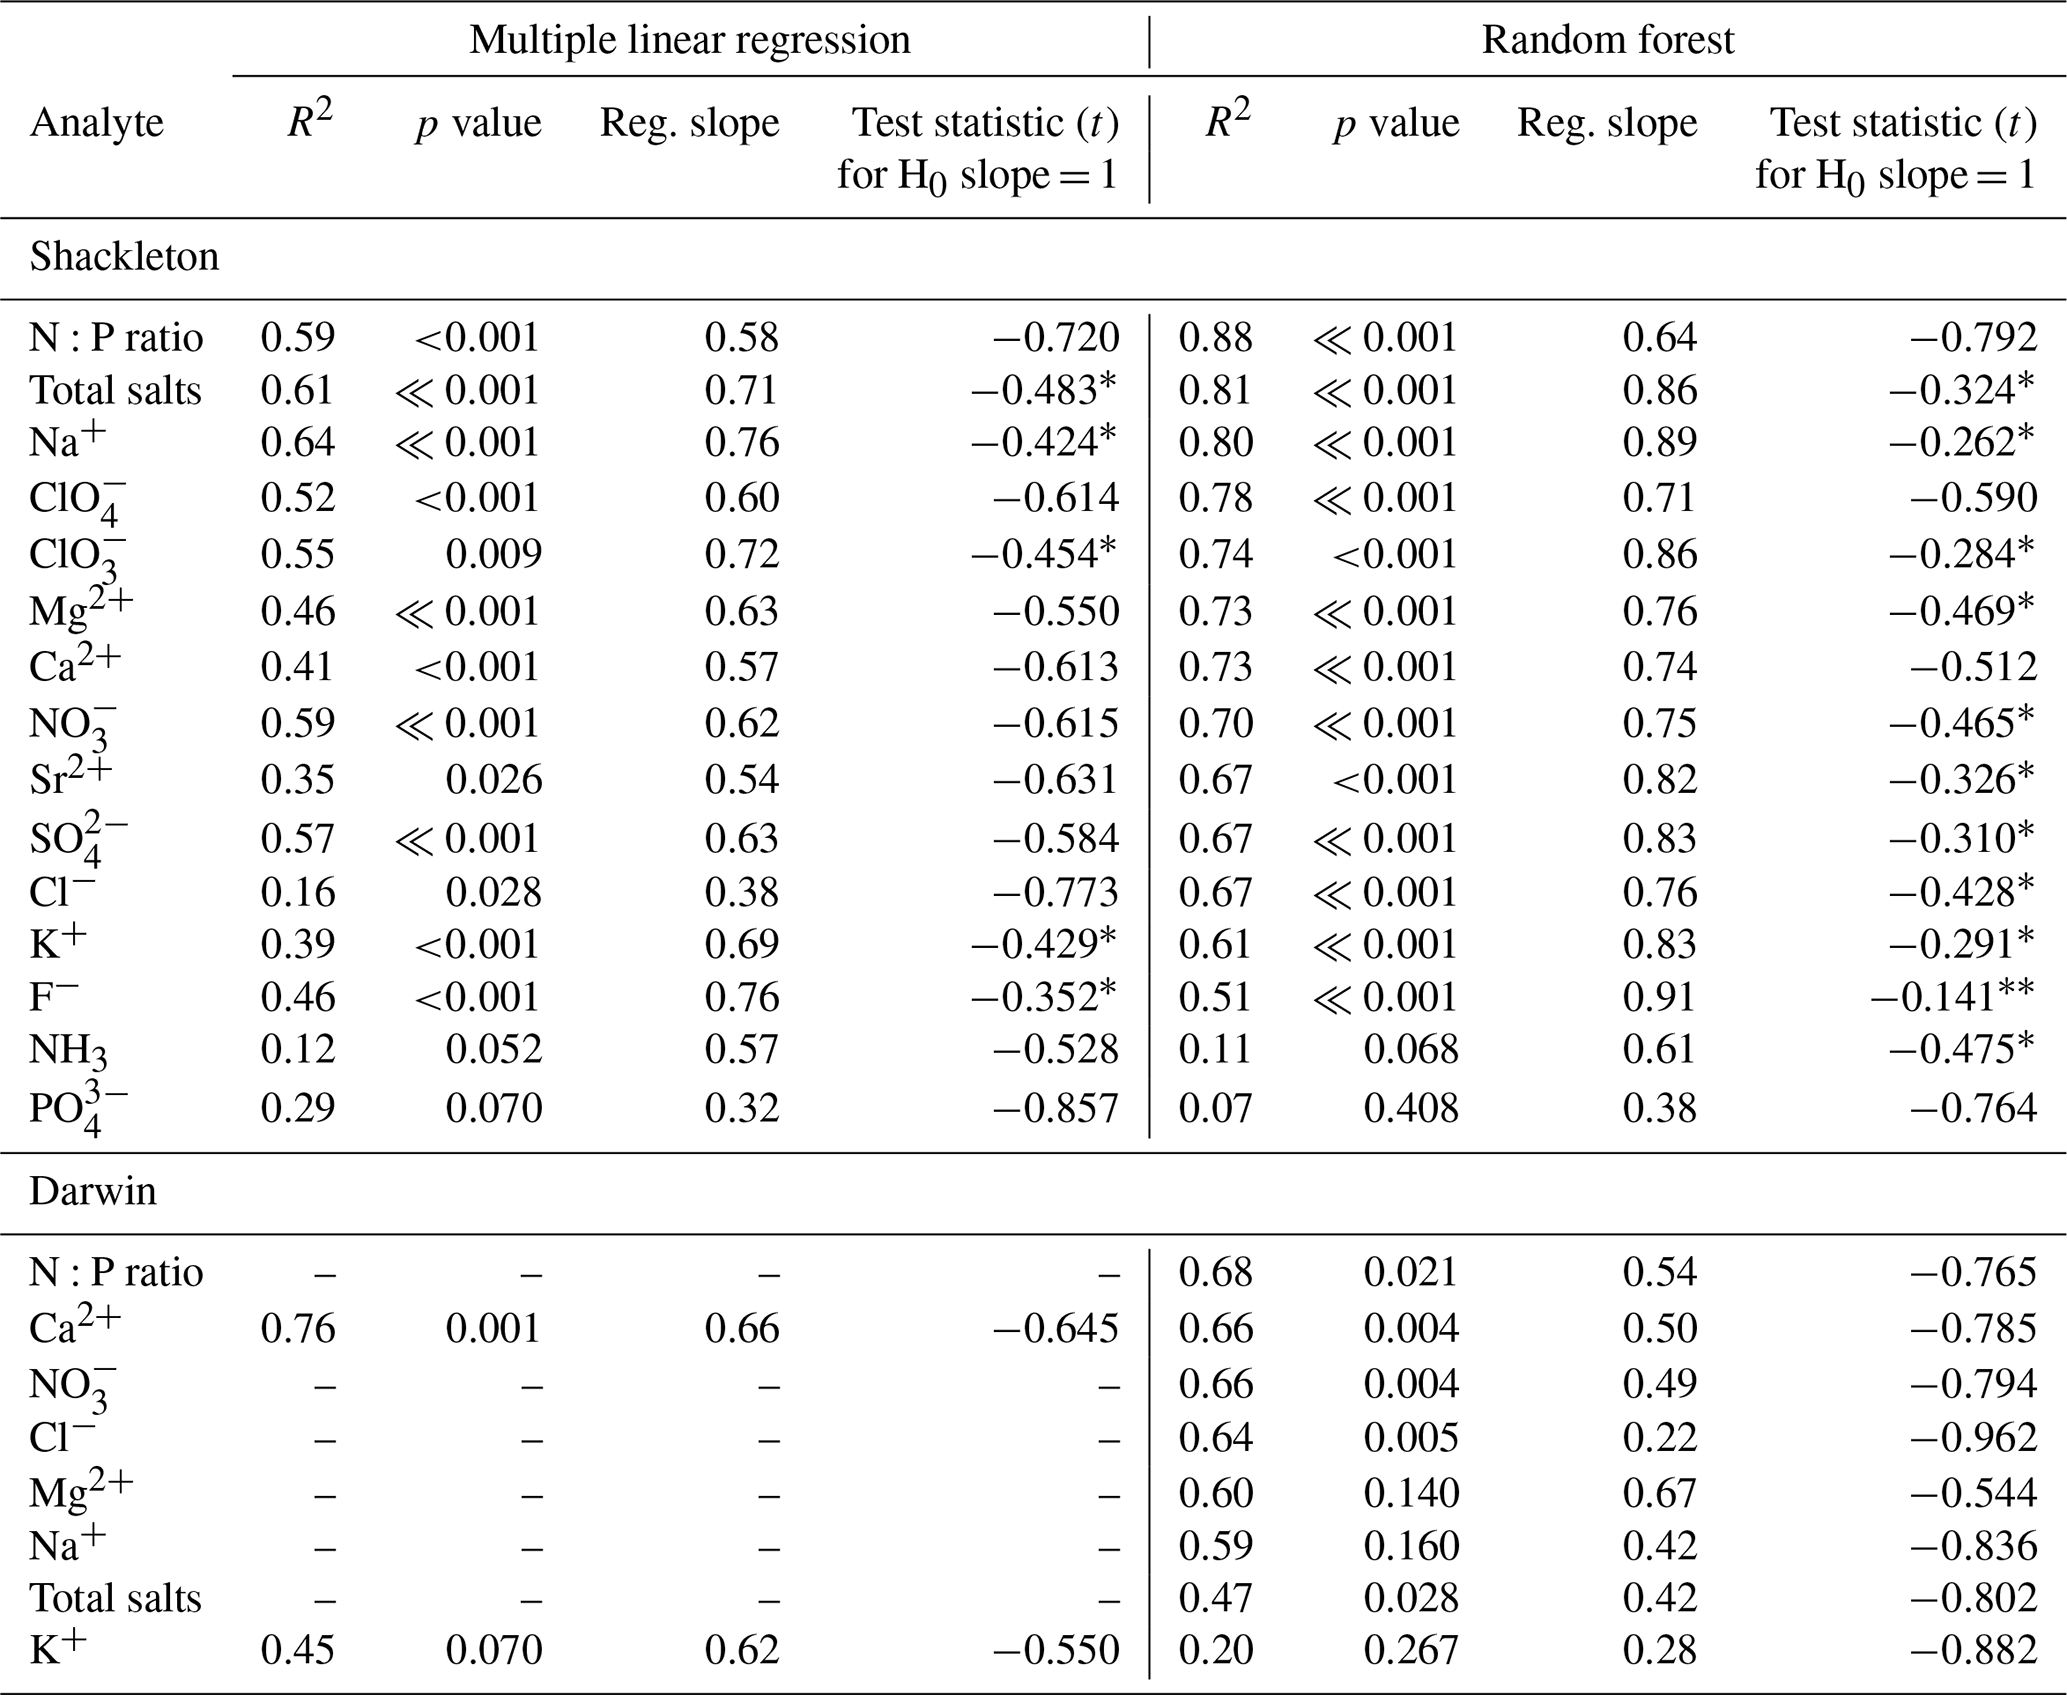
* t<0.5; t<0.20.
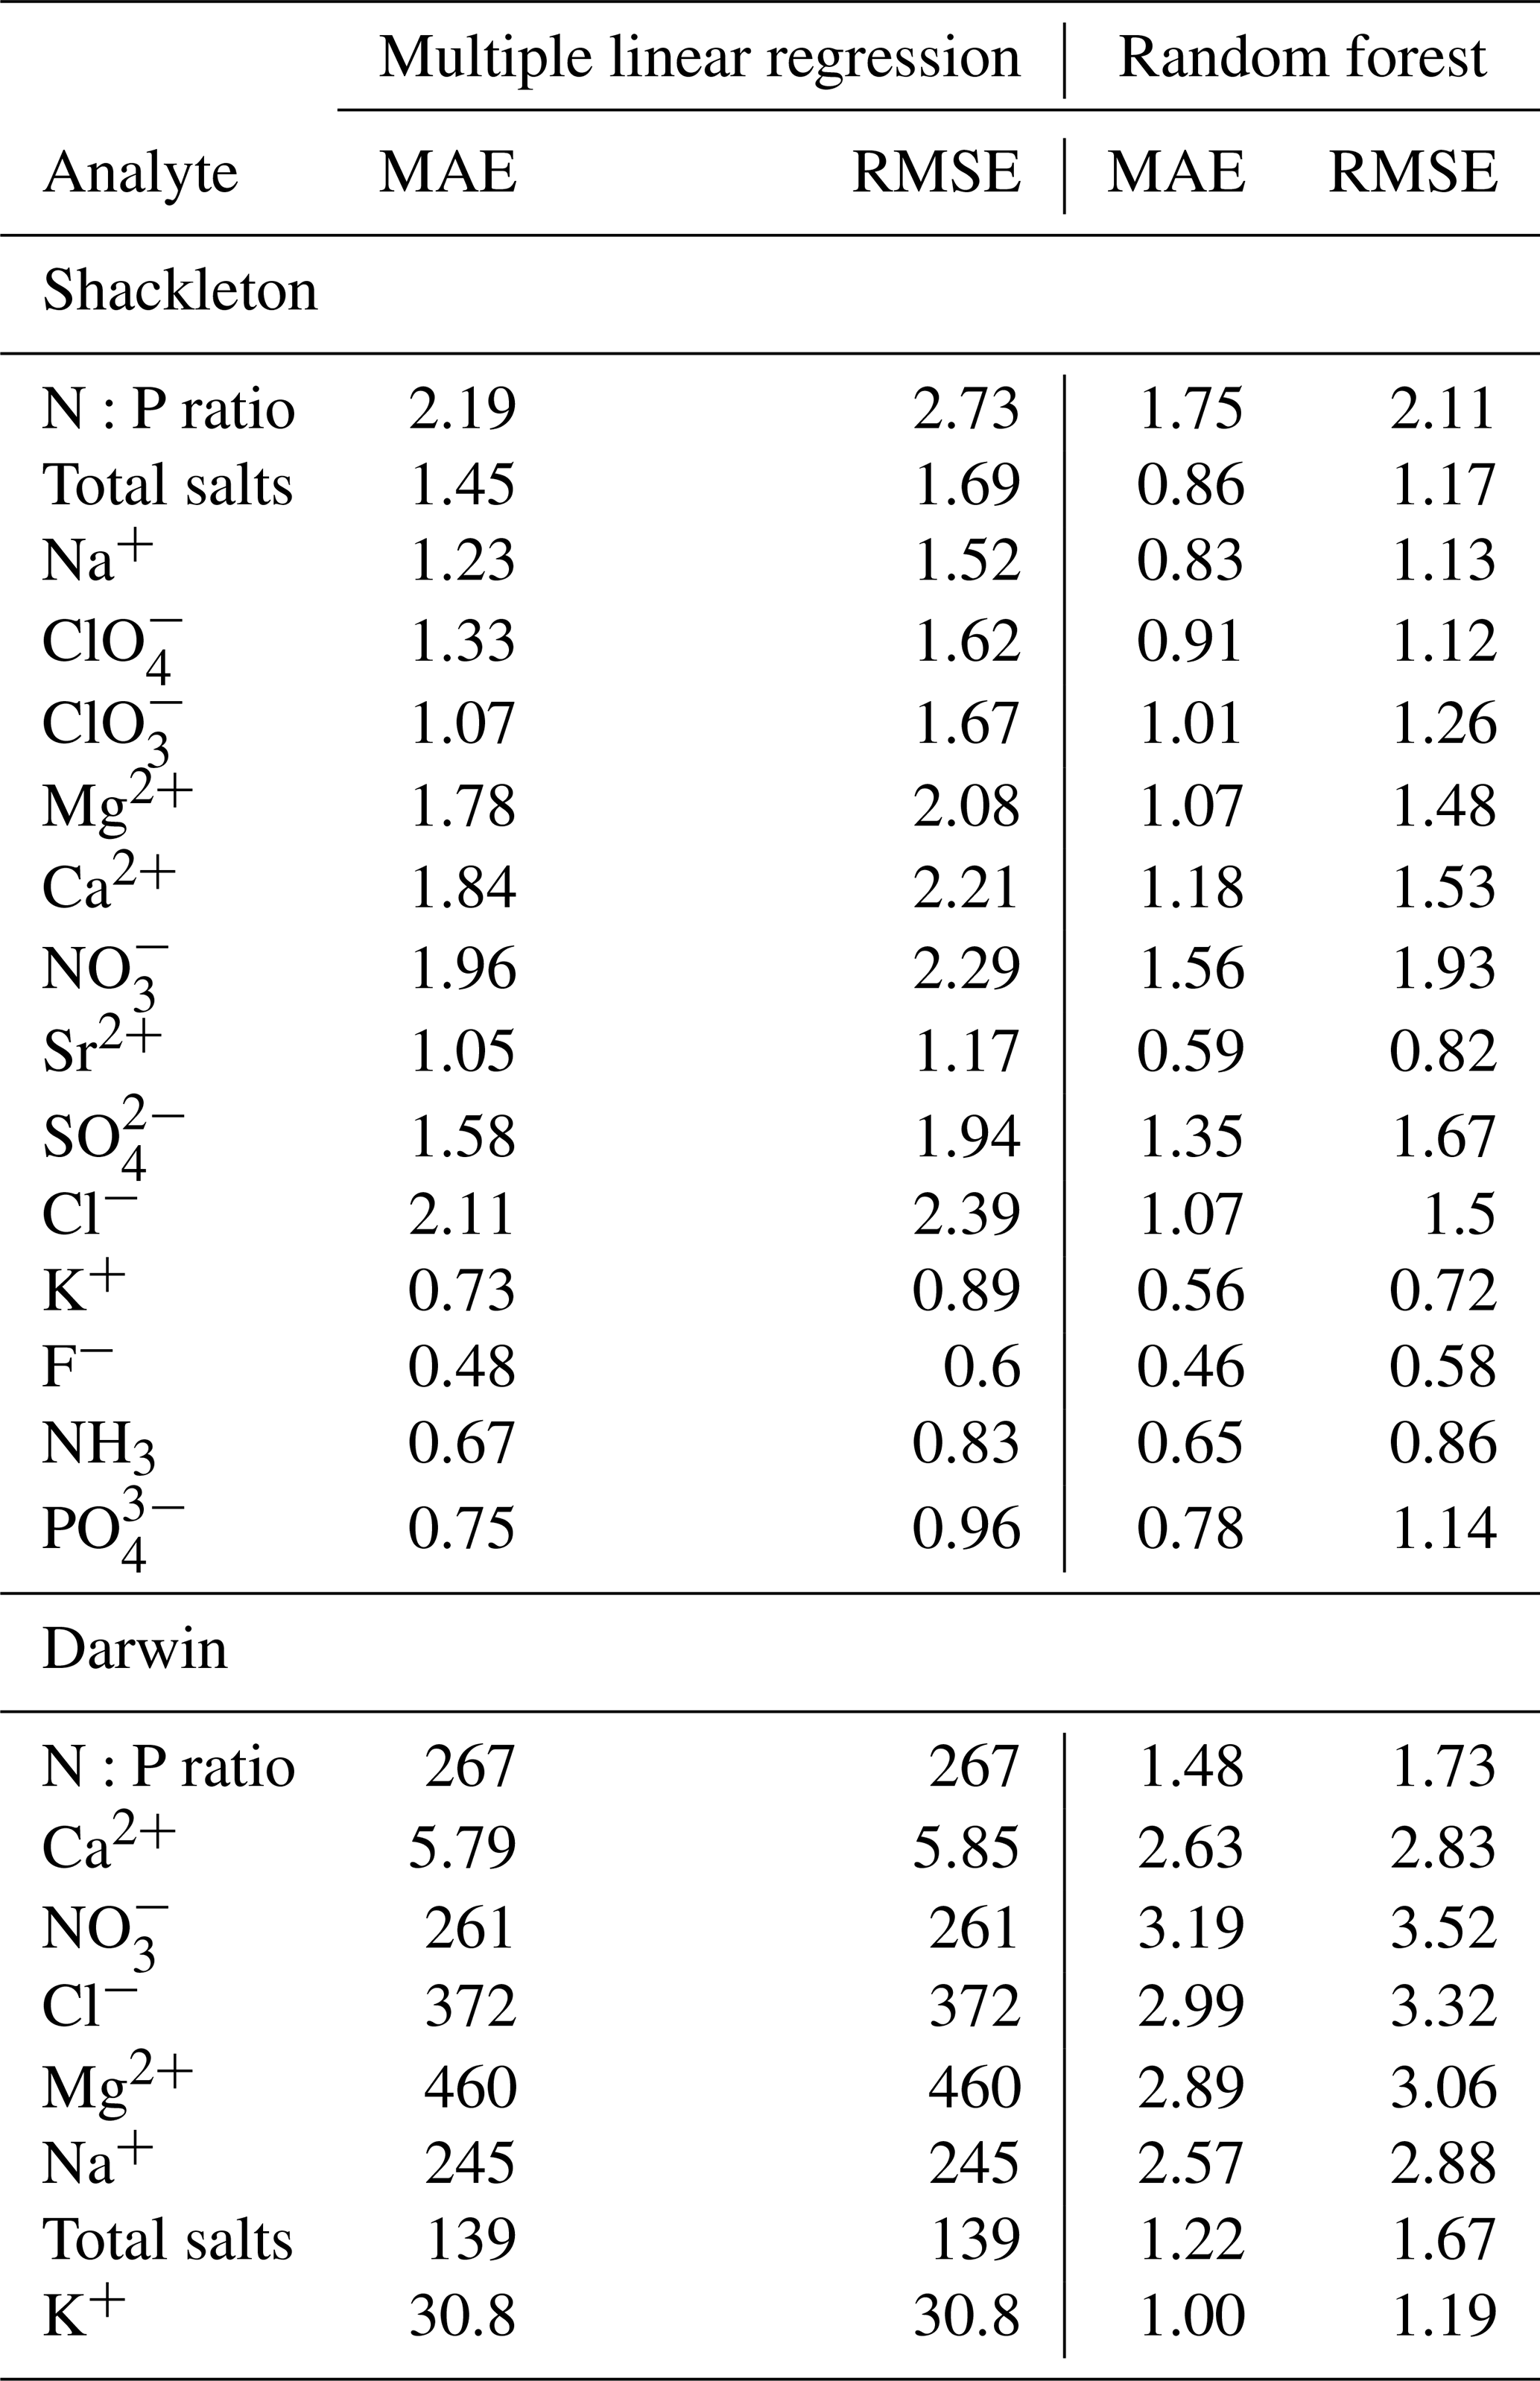
Table 4Multiple linear regression and random forest mean absolute error (MAE) and root mean squared error (RMSE). All geochemical data were log-transformed for the analysis.
5.2 Machine learning as a tool to predict soil geochemical trends
We sought to evaluate our multiple linear regression and random forest models using a testing dataset from the Shackleton Glacier region (n = 31) and a second dataset from the Darwin Mountains (∼ 80∘ S) (n = 10) (Magalhães et al., 2012). Few published/available TAM datasets include sample GPS coordinates, soil moisture, and water-soluble ion geochemistry. As stated in Sect. 3.3, the Shackleton Glacier region test data were not included in the random forest model generation so we could evaluate our models with an independent dataset. For the Darwin dataset, distance from the glacier, distance from the coast, and elevation were determined using the Reference Elevation Model of Antarctica (REMA), while location, soil moisture, and geochemistry were retrieved from the literature (Howat et al., 2019; Magalhães et al., 2012). We evaluated all 15 analytes from the original models with the Shackleton dataset and, due to a lack of data, only evaluated seven analytes from the Darwin soils (Fig. 7).

Figure 7R2 values for the multiple linear regression and random forest predicted and measured values for the different analytes (Table 3). Test datasets include the Shackleton Glacier region (n=31) and the Darwin Glacier region (n = 10) (Magalhães et al., 2012). Analytes with slopes near 1, indicating good agreement between measured and predicted values, are indicated (* t<0.5; t<0.20).
Both the multiple linear regression and random forest model outputs are moderately well-correlated for the Shackleton dataset, as determined by Pearson correlations between the measured and predicted values (Fig. 7a; Table 3). The random forest models outperform the linear regression models for nearly every analyte with the exception of Sr2+, NH3, and PO, and nearly all p values are <0.001. For Cl−, in particular, the random forest model significantly outperforms the multiple linear regression model with R2 values of 0.67 and 0.16, respectively. N:P molar ratio is the most accurately predicted analyte with R2 values of 0.88 and 0.59 for the random forest and linear regression models, respectively. However, the highest R2 value for the multiple linear regression model is for Na+ at 0.64 (Table 3). In terms of our analytes of interest regarding habitat suitability, total salts have the second strongest correlation (following N:P ratio) with the random forest model (R2=0.81), followed by ClO (R2=0.78) and ClO (R2=0.74). MAE and root mean squared error (RMSE) values indicate that the random forest models also have a smaller error compared to the multiple linear regression models (Table 4). MAE values are lower than RMSE values for both models, indicating the strong influence of outliers in the testing dataset. This is unsurprising as the standard deviation and coefficient of variation values for the entire dataset are relatively large for all analytes. Additionally, the outliers are likely one reason why the random forest models are stronger than the multiple linear regression models.
Similar to the model performance in the Shackleton Glacier region, the water-soluble ion predictions for the Darwin Glacier region are more strongly correlated with measured values in the random forest models compared to the multiple linear regressions (Fig. 7b). In fact, the linear regression models fail for nearly all the Darwin samples, and most concentration outputs are negative, which is likely due to overfitting during model generation. Here, Ca2+ and K+ are exceptions, and the multiple linear regression models outperform the random forest models in both cases. MAE and RMSE values for both models are higher than those for the Shackleton dataset (Table 4). On the other hand, the random forest models perform particularly well for some analytes. Though a small sample size, the R2 values for N:P molar ratio and Ca2+ are 0.68 and 0.66, respectively, with p values ≪0.001. Total salts is moderately correlated (R2=0.47). It is unclear why some analytes, such as N:P molar ratio, are the most accurately predicted, though we suspect that this is due to (1) weathering trends of local lithology across the TAM since chemical weathering is probably the major source of these ions and (2) deposition and accumulation of atmospherically derived ions at higher elevations (Diaz et al., 2020b).
It should be noted that the R2 values simply measure the strength of the correlations between the measured and predicted values. We performed slope tests by fitting bivariate lines using the standardized major axis (SMA) to further understand the relationship between the two values using the smatr library in R (Warton et al., 2012). For this test, we specifically evaluated the null hypothesis (H0) in which slope = 1, which would indicate whether an ideal, direct 1:1 relationship exists between the measured and predicted values. Test statistic values (t) were used to measure the sample correlation between the residuals and fitted values (Warton et al., 2012). Test statistic values near 1 indicate that we reject the null hypothesis. In other words, higher absolute test statistic values indicate a slope other than 1. Of the 15 analytes in the Shackleton dataset, 5 analytes have slopes near 1 for the multiple linear regression models and 11 for the random forest, as indicated by test statistic values less than 0.5. For the Darwin, no analytes have test statistic values less than 0.5 (Fig. 7; Table 3).
These data indicate that while some analytes have high correlations between measured and predicted values, the models perform best with the Shackleton Glacier region soils. Additionally, though the relationship may not be 1:1, the random forest models are effective at predicting the measured geochemical gradients. For example, similar to our data, the Darwin Glacier samples generally have greater water-soluble N:P ratios and total water-soluble salt concentrations further from the glacier and at higher elevations (Magalhães et al., 2012), a trend that is reflected by our model results despite offset values. Additionally, corrections for the offset of the model from a slope = 1 (i.e., multiplying the model output value by the regression slope) can be made to better estimate specific concentrations, though the difference between modeled and measured values can still be up to 2 times greater. Our sample size for building the multiple linear regression and random forest models is small. We anticipate that as more data are collected throughout the CTAM, these data can be added to the model training dataset, expanding our prediction capabilities and increasing model reliability.
The soil ecosystems found in the Transantarctic Mountains are among the least diverse on Earth, and their structure is influenced by environmental variables. We characterized environmental and geochemical gradients in the Shackleton Glacier region, which will aid in our understanding of the abiotic properties in soils governing biodiversity and biogeography. The 220 samples we analyzed represent a wide range of soil environments: those with different elevation, latitude, longitude, glacial history, and geochemistry. We determined three soil zones: an upper zone near the head of the glacier which is characterized by high total water-soluble salt concentrations, high water-soluble N:P ratios, and high ClO and ClO concentrations, a lower zone with low total salt concentrations and higher PO concentrations, and a middle zone with intermediate values. The zones help elucidate the geographic influences on soil geochemistry. In addition, our total water-soluble salt interpolations at Roberts Massif, Bennett Platform, and Thanksgiving Valley reflect the local small-scale variability in salt concentrations and possible influences from soil age and wetting history.
Similar to previous studies, our results suggest that high elevation and inland soils, such as those from the upper zone, were likely unsuitable candidates for refugia during the Last Glacial Maximum. However, glacial advance and retreat and climate shifts may leach soils, lowering otherwise toxic total water-soluble salt concentrations and N:P ratios. These more recently exposed soils may be particularly important in maintaining and reviving contemporary and past biological communities.
Five geographic variables (latitude, longitude, elevation, distance from the coast, and distance from the glacier) and soil moisture were correlated with soil geochemistry. We used these variables to develop multiple linear regression and random forest models to predict ion concentrations and geochemical gradients. The model results generally reflected the measured geochemical variability across the region. Test datasets from the Shackleton and Darwin Glacier regions showed that the random forest models typically outperformed the multiple linear regression models when correlating measured and predicted values, especially for the Darwin region. Though most correlations did not exhibit a 1:1 relationship and had varying slopes, the random forest models were able to adequately predict geochemical gradients, as demonstrated by moderate to high R2 values between measured and model predicted concentrations. As terrestrial Antarctic geochemical databases expand and are included in the random forest model training dataset, we anticipate the model's predictive capabilities will expand and improve as well. While these results are currently most applicable for central Transantarctic Mountain soils, similar techniques can be applied to other hyper-arid environments (e.g., Namib and Atacama deserts, Mars) to inform patterns of biodiversity and biogeography.
The datasets generated for this study are included in the article or Supplement.
The supplement related to this article is available online at: https://doi.org/10.5194/bg-18-1629-2021-supplement.
The project was designed and funded by BJA, DHW, IDH, NF, and WBL. Fieldwork was conducted by BJA, DHW, IDH, NF, and MAD. CBG, SAW, and MAD prepared and analyzed the samples for water-soluble ion and nutrient analyses. WAJ prepared and analyzed the samples for ClO and ClO. MAD generated the scripts and performed the analyses for the IDW interpolations and multiple linear regression and random forest models. MAD wrote the article with contributions and edits from all authors.
The authors declare that they have no conflict of interest.
We thank the United States Antarctic Program (USAP), Antarctic Science Contractors (ASC), Petroleum Helicopters Inc. (PHI), and Marci Shaver-Adams for logistical and field support. Additionally, we thank Daniel Gilbert for help with initial laboratory analyses at the Ohio State University. We are grateful to Peter Convey and Natasja van Gestel for thoughtful reviews which strengthened our results and broader implications. Geospatial support for this work was provided by the Polar Geospatial Center under NSF OPP grants 1043681 and 1559691.
This research has been supported by the National Science Foundation (grant nos. OPP 1341631, GRFP 60041697, OPP 1341618, OPP 1341629, and OPP 1341736).
This paper was edited by Kees Jan van Groenigen and reviewed by Peter Convey and Natasja van Gestel.
Antipov, E. A. and Pokryshevskaya, E. B.: Mass appraisal of residential apartments: An application of Random forest for valuation and a CART-based approach for model diagnostics, Expert. Syst. Appl., 39, 1772–1778, https://doi.org/10.1016/j.eswa.2011.08.077, 2012.
Ball, B. A., Adams, B. J., Barrett, J. E., Wall, D. H., and Virginia, R. A.: Soil biological responses to C, N and P fertilization in a polar desert of Antarctica, Soil Biol. Biochem., 122, 7–18, https://doi.org/10.1016/J.SOILBIO.2018.03.025, 2018.
Balter-Kennedy, A., Bromley, G., Balco, G., Thomas, H., and Jackson, M. S.: A 14.5-million-year record of East Antarctic Ice Sheet fluctuations from the central Transantarctic Mountains, constrained with cosmogenic 3He, 10Be, 21Ne, and 26Al, The Cryosphere, 14, 2647–2672, https://doi.org/10.5194/tc-14-2647-2020, 2020.
Barrett, J. E., Virginia, R. A., Wall, D. H., Cary, S. C., Adams, B. J., Hacker, A. L., and Aislabie, J. M.: Co-variation in soil biodiversity and biogeochemistry in northern and southern Victoria Land, Antarctica, Antarct. Sci., 18, 535–548, https://doi.org/10.1017/S0954102006000587, 2006.
Barrett, J. E., Virginia, R. A., Lyons, W. B., McKnight, D. M., Priscu, J. C., Doran, P. T., Fountain, A. G., Wall, D. H., and Moorhead, D. L.: Biogeochemical stoichiometry of Antarctic Dry Valley ecosystems, J. Geophys. Res., 112, G01010, https://doi.org/10.1029/2005JG000141, 2007.
Beet, C. R., Hogg, I. D., Collins, G. E., Cowan, D. A., Wall, D. H., and Adams, B. J.: Genetic diversity among populations of Antarctic springtails (Collembola) within the Mackay Glacier ecotone, Genome, 59, 762–770, https://doi.org/10.1139/gen-2015-0194, 2016.
Bennett, K. R., Hogg, I. D., Adams, B. J., and Hebert, P. D. N.: High levels of intraspecific genetic divergences revealed for Antarctic springtails: evidence for small-scale isolation during Pleistocene glaciation, Biol. J. Linn. Soc., 119, 166–178, https://doi.org/10.1111/bij.12796, 2016.
Bockheim, J. G.: Landform and Soil Development in the McMurdo Dry Valleys, Antarctica: A Regional Synthesis, Arctic. Antarct. Alp. Res., 34, 308–317, https://doi.org/10.1080/15230430.2002.12003499, 2002.
Bockheim, J. G.: Functional diversity of soils along environmental gradients in the Ross Sea region, Antarctica, Geoderma, 144, 32–42, https://doi.org/10.1016/j.geoderma.2007.10.014, 2008.
Bottos, E. M., Laughlin, D. C., Herbold, C. W., Lee, C. K., McDonald, I. R., and Cary, S. C.: Abiotic factors influence patterns of bacterial diversity and community composition in the Dry Valleys of Antarctica, FEMS Microbiol. Ecol., 96, 42, https://doi.org/10.1093/femsec/fiaa042, 2020.
Breiman, L.: Random forests, Mach. Learn., 45, 5–32, https://doi.org/10.1023/A:1010933404324, 2001.
Caruso, T., Hogg, I. D., Nielsen, U. N., Bottos, E. M., Lee, C. K., Hopkins, D. W., Cary, S. C., Barrett, J. E., Green, T. G. A., Storey, B. C., Wall, D. H., and Adams, B. J.: Nematodes in a polar desert reveal the relative role of biotic interactions in the coexistence of soil animals, Commun. Biol., 2, 63, https://doi.org/10.1038/s42003-018-0260-y, 2019.
Claridge, G. G. C. and Campbell, I. B.: Soils of the Shackleton glacier region, Queen Maud Range, Antarctica, New Zeal. J. Sci., 11, 171–218, 1968.
Collins, G. E., Hogg, I. D., Convey, P., Barnes, A. D., and McDonald, I. R.: Spatial and temporal scales matter when assessing the species and genetic diversity of springtails (Collembola) in Antarctica, Front. Ecol. Evol., 7, 76, https://doi.org/10.3389/fevo.2019.00076, 2019.
Collins, G. E., Hogg, I. D., Convey, P., Sancho, L. G., Cowan, D. A., Lyons, W. B., Adams, B. J., Wall, D. H., and Green, T. G. A.: Genetic diversity of soil invertebrates corroborates timing estimates for past collapses of the West Antarctic Ice Sheet, Proc. Natl. Acad. Sci. USA, 117, 22293–22302, https://doi.org/10.1073/pnas.2007925117, 2020.
Convey, P. and McInnes, S. J.: Exceptional tardigrade-dominated ecosystems in Ellsworth Land, Antarctica, Ecology, 86, 519–527, https://doi.org/10.1890/04-0684, 2005.
Courtright, E. M., Wall, D. H., and Virginia, R. A.: Determining habitat suitability for soil invertebrates in an extreme environment: The McMurdo Dry Valleys, Antarctica, Antarct. Sci., 13, 9–17, https://doi.org/10.1017/S0954102001000037, 2001.
Davidson, A. D., Hamilton, M. J., Boyer, A. G., Brown, J. H., and Ceballos, G.: Multiple ecological pathways to extinction in mammals, P. Natl. Acad. Sci., 106, 10702–10705, https://doi.org/10.1073/pnas.0901956106, 2009
Diaz, M. A., Adams, B. J., Welch, K. A., Welch, S. A., Opiyo, S. O., Khan, A. L., McKnight, D. M., Cary, S. C., and Lyons, W. B.: Aeolian Material Transport and Its Role in Landscape Connectivity in the McMurdo Dry Valleys, Antarctica, J. Geophys. Res.-Earth Surf., 123, 3323–3337, https://doi.org/10.1029/2017JF004589, 2018.
Diaz, M. A., Gardner, C. B., Cloutier, M., Elliot, D.H., Adams, B. J., and Lyons, W. B.: Change at 85 degrees south: Shackleton Glacier region proglacial lakes from 1960 to 2020, Geological Society of America Abstracts with Programs, 52, https://doi.org/10.1130/abs/2020AM-359713, 2019.
Diaz, M. A., Corbett, L. B., Bierman, P. R., Adams, B. J., Wall, D. H., Hogg, I. D., Fierer, N., and Lyons, W. B.: Relative terrestrial exposure ages inferred from meteoric 10Be and NO3− concentrations in soils along the Shackleton Glacier, Antarctica, Earth Surf. Dynam. Discuss. [preprint], https://doi.org/10.5194/esurf-2020-50, in review, 2020a.
Diaz, M. A., Li, J., Michalski, G., Darrah, T. H., Adams, B. J., Wall, D. H., Hogg, I. D., Fierer, N., Welch, S. A., Gardner, C. B., and Lyons, W. B.: Stable isotopes of nitrate, sulfate, and carbonate in soils from the Transantarctic Mountains, Antarctica: A record of atmospheric deposition and chemical weathering, Front. Earth Sci., 8, 341, https://doi.org/10.3389/feart.2020.00341, 2020b.
Dragone, N. B., Diaz, M. A., Hogg, I., Lyons, W. B., Jackson, W. A., Wall, D. H., Adams, B. J., and Fierer, N.: Exploring the boundaries of microbial habitability in soil, bioRxiv, https://doi.org/10.1101/2020.08.03.234583, 2020.
Freckman, D. W. and Virginia, R. A.: Soil Biodiversity and Community Structure in the Mcmurdo Dry Valleys, Antarctica, in Ecosystem dynamics in a polar desert the McMurdo dry valleys, Antarctica, edited by: Priscu, J. C., 323–335, American Geophysical Union, Washington, DC, 1998.
Golledge, N. R. and Levy, R. H.: Geometry and dynamics of an East Antarctic Ice Sheet outlet glacier, under past and present climates, J. Geophys. Res., 116, F03025, https://doi.org/10.1029/2011JF002028, 2011.
Golledge, N. R., Fogwill, C. J., Mackintosh, A. N., and Buckley, K. M.: Dynamics of the last glacial maximum Antarctic ice-sheet and its response to ocean forcing, P. Natl. Acad. Sci. USA, 109, 16052–16056, 2012.
Golledge, N. R., Levy, R. H., McKay, R. M., Fogwill, C. J., White, D. A., Graham, A. G. C., Smith, J. A., Hillenbrand, C. D., Licht, K. J., Denton, G. H., Ackert, R. P., Maas, S. M., and Hall, B. L.: Glaciology and geological signature of the Last Glacial Maximum Antarctic ice sheet, Quaternary Sci. Rev., 78, 225–247, https://doi.org/10.1016/j.quascirev.2013.08.011, 2013.
Heindel, R. C., Spickard, A. M., and Virginia, R. A.: Landscape-scale soil phosphorus variability in the McMurdo Dry Valleys, Antarct. Sci., 29, 252–263, https://doi.org/10.1017/S0954102016000742, 2017.
Heung, B., Bulmer, C. E., and Schmidt, M. G.: Predictive soil parent material mapping at a regional-scale: A Random Forest approach, Geoderma, 214/215, 141–154, https://doi.org/10.1016/j.geoderma.2013.09.016, 2014.
Hodgson, D. A., Convey, P., Verleyen, E., Vyverman, W., McInnes, S. J., Sands, C. J., Fernández-Carazo, R., Wilmotte, A., De Wever, A., Peeters, K., Tavernier, I., and Willems, A.: The limnology and biology of the Dufek Massif, Transantarctic Mountains 82∘ South, Polar Sci., 4, 197–214, https://doi.org/10.1016/j.polar.2010.04.003, 2010.
Hogg, I. D. and Wall, D. H.: Polar deserts, in: Life at Extremes: Environments, Organisms and Strategies for Survival, edited by: Bell, E. M., 176–195, CAB International, Oxfordshire, England, 2012.
Howat, I. M., Porter, C., Smith, B. E., Noh, M.-J., and Morin, P.: The Reference Elevation Model of Antarctica, The Cryosphere, 13, 665–674, https://doi.org/10.5194/tc-13-665-2019, 2019.
Jackson, A., Davila, A. F., Böhlke, J. K., Sturchio, N. C., Sevanthi, R., Estrada, N., Brundrett, M., Lacelle, D., McKay, C. P., Poghosyan, A., Pollard, W., and Zacny, K.: Deposition, accumulation, and alteration of Cl-, NO3-, ClO4- and ClO3- salts in a hyper-arid polar environment: Mass balance and isotopic constraints, Geochim. Cosmochim. Ac., 182, 197–215, https://doi.org/10.1016/j.gca.2016.03.012, 2016.
Jackson, M. S., Hall, B. L., and Denton, G. H.: Asynchronous behavior of the Antarctic Ice Sheet and local glaciers during and since Termination 1, Salmon Valley, Antarctica, Earth Planet. Sci. Lett., 482, 396–406, https://doi.org/10.1016/j.epsl.2017.11.038, 2018.
Jackson, W. A., Davila, A. F., Estrada, N., Lyons, W. B., Coates, J. D., and Priscu, J. C.: Perchlorate and chlorate biogeochemistry in ice-covered lakes of the McMurdo Dry Valleys, Antarctica, Geochim. Cosmochim. Ac., 98, 19–30, https://doi.org/10.1016/j.gca.2012.09.014, 2012.
Jackson, W. A., Böhlke, J. K., Andraski, B. J., Fahlquist, L., Bexfield, L., Eckardt, F. D., Gates, J. B., Davila, A. F., McKay, C. P., Rao, B., Sevanthi, R., Rajagopalan, S., Estrada, N., Sturchio, N., Hatzinger, P. B., Anderson, T. A., Orris, G., Betancourt, J., Stonestrom, D., Latorre, C., Li, Y., and Harvey, G. J.: Global patterns and environmental controls of perchlorate and nitrate co-occurrence in arid and semi-arid environments, Geochim. Cosmochim. Ac., 164, 502–522, https://doi.org/10.1016/J.GCA.2015.05.016, 2015.
Kassambara, A. and Mundt, F.: Package “factoextra”, Extr. Vis. results Multivar. data Anal., available at: https://github.com/kassambara/factoextra/issues (last access: 11 August 2020), 2017.
Kirkwood, C., Cave, M., Beamish, D., Grebby, S., and Ferreira, A.: A machine learning approach to geochemical mapping, J. Geochemical Explor., 167, 49–61, https://doi.org/10.1016/j.gexplo.2016.05.003, 2016.
LaPrade, K. E.: Climate, geomorphology, and glaciology of the Shackleton Glacier area, Queen Maud Mountains, Transantarctic Mountains, Antarctica, Antarct. Res. Ser., 36, 163–196, https://doi.org/10.1029/ar036p0163, 1984.
Levy, J. S., Fountain, A. G., Welch, K. A., and Lyons, W. B.: Hypersaline “wet patches” in Taylor Valley, Antarctica, Geophys. Res. Lett., 39, L05402, https://doi.org/10.1029/2012GL050898, 2012.
Lyons, W. B., Welch, K. A., Neumann, K., Toxey, J. K., McArthur, R., Williams, C., McKnight, D. M., and Moorhead, D. L.: Geochemical linkages among glaciers, streams and lakes within the Taylor Valley, Antarctica, Ecosyst. Dyn. a polar desert; McMurdo dry Val. Antarct., 72, 77–92, https://doi.org/10.1029/AR072p0077, 1998.
Lyons, W. B., Deuerling, K., Welch, K. A., Welch, S. A., Michalski, G., Walters, W. W., Nielsen, U., Wall, D. H., Hogg, I., and Adams, B. J.: The Soil Geochemistry in the Beardmore Glacier Region, Antarctica: Implications for Terrestrial Ecosystem History, Sci. Rep., 6, 26189, https://doi.org/10.1038/srep26189, 2016.
Magalhães, C., Stevens, M. I., Cary, S. C., Ball, B. A., Storey, B. C., Wall, D. H., Türk, R., and Ruprecht, U.: At Limits of Life: Multidisciplinary Insights Reveal Environmental Constraints on Biotic Diversity in Continental Antarctica, PLoS One, 7, e44578, https://doi.org/10.1371/journal.pone.0044578, 2012.
Nakada, M. and Lambeck, K.: The melting history of the late Pleistocene Antarctic ice sheet, Nature, 333, 36–40, https://doi.org/10.1038/333036a0, 1988.
Nkem, J. N., Virginia, A. R. A., Barrett, A. J. E., Wall, D. H., and Li, A. G.: Salt tolerance and survival thresholds for two species of Antarctic soil nematodes, Polar Biol., 29, 643–651, https://doi.org/10.1007/s00300-005-0101-6, 2006.
Patel, J., Shah, S., Thakkar, P., and Kotecha, K.: Predicting stock market index using fusion of machine learning techniques, Expert Syst. Appl., 42, 2162–2172, https://doi.org/10.1016/j.eswa.2014.10.031, 2015.
Peters, J., De Baets, B., Verhoest, N. E. C., Samson, R., Degroeve, S., Becker, P., and Huybrechts, W.: Random forests as a tool for ecohydrological distribution modelling, Ecol. Modell., 207, 304–318, https://doi.org/10.1016/j.ecolmodel.2007.05.011, 2007.
Prasad, A. M., Iverson, L. R., and Liaw, A.: Newer classification and regression tree techniques: Bagging and random forests for ecological prediction, Ecosystems, 9, 181–199, https://doi.org/10.1007/s10021-005-0054-1, 2006.
R Core Team: R: A language and environment for statistical computing, Vienna, Austria, https://www.R-project.org/, last access: 10 August 2020.
Scarrow, J. W., Balks, M. R., and Almond, P. C.: Three soil chronosequences in recessional glacial deposits near the polar plateau, in the Central Transantarctic Mountains, Antarctica, Antarct. Sci., 26, 573–583, https://doi.org/10.1017/S0954102014000078, 2014.
Stafoggia, M., Bellander, T., Bucci, S., Davoli, M., de Hoogh, K., de' Donato, F., Gariazzo, C., Lyapustin, A., Michelozzi, P., Renzi, M., Scortichini, M., Shtein, A., Viegi, G., Kloog, I., and Schwartz, J.: Estimation of daily PM10 and PM2.5 concentrations in Italy, 2013–2015, using a spatiotemporal land-use random-forest model, Environ. Int., 124, 170–179, https://doi.org/10.1016/j.envint.2019.01.016, 2019.
Stevens, M. I. and Hogg, I. D.: Long-term isolation and recent range expansion from glacial refugia revealed for the endemic springtail Gomphiocephalus hodgsoni from Victoria Land, Antarctica, Mol. Ecol., 12, 2357–2369, https://doi.org/10.1046/j.1365-294X.2003.01907.x, 2003.
Stevens, M. I., Greenslade, P., Hogg, I. D., and Sunnucks, P.: Southern Hemisphere Springtails: Could Any Have Survived Glaciation of Antarctica?, Mol. Biol. Evol., 23, 874–882, https://doi.org/10.1093/molbev/msj073, 2006.
Talarico, F. M., McKay, R. M., Powell, R. D., Sandroni, S., and Naish, T.: Late Cenozoic oscillations of Antarctic ice sheets revealed by provenance of basement clasts and grain detrital modes in ANDRILL core AND-1B, Glob. Planet. Change, 96/97, 23–40, https://doi.org/10.1016/j.gloplacha.2009.12.002, 2012.
Tesoriero, A. J., Gronberg, J. A., Juckem, P. F., Miller, M. P., and Austin, B. P.: Predicting redox-sensitive contaminant concentrations in groundwater using random forest classification, Water Resour. Res., 53, 7316–7331, https://doi.org/10.1002/2016WR020197, 2017.
Toner, J. D., Sletten, R. S., and Prentice, M. L.: Soluble salt accumulations in Taylor Valley, Antarctica: Implications for paleolakes and Ross Sea Ice Sheet dynamics, J. Geophys. Res.-Earth Surf., 118, 198–215, https://doi.org/10.1029/2012JF002467, 2013.
Wall, D. H., Bardgett, R. D., Behan-Pelletier, V., Herrick, J. E., Jones, H., Ritz, K., Six, J., Strong, D. R., and van der Putten, W. H.: Soil Ecology and Ecosystem Services, Oxford University Press, Oxford, UK, 2012.
Warton, D. I., Duursma, R. A., Falster, D. S., and Taskinen, S.: smatr 3 – an R package for estimation and inference about allometric lines, Methods Ecol. Evol., 3, 257–259, https://doi.org/10.1111/j.2041-210X.2011.00153.x, 2012.
Webster-Brown, J., Gall, M., Gibson, J., Wood, S., and Hawes, I.: The biogeochemistry of meltwater habitats in the Darwin Glacier region (80∘S), Victoria Land, Antarctica, Antarct. Sci., 22, 646–661, https://doi.org/10.1017/S0954102010000787, 2010.
Wilson, D. J., Bertram, R. A., Needham, E. F., van de Flierdt, T., Welsh, K. J., McKay, R. M., Mazumder, A., Riesselman, C. R., Jimenez-Espejo, F. J., and Escutia, C.: Ice loss from the East Antarctic Ice Sheet during late Pleistocene interglacials, Nature, 561, 383–386, https://doi.org/10.1038/s41586-018-0501-8, 2018.
Zeglin, L. H., Sinsabaugh, R. L., Barrett, J. E., Gooseff, M. N., and Takacs-Vesbach, C. D.: Landscape Distribution of Microbial Activity in the McMurdo Dry Valleys: Linked Biotic Processes, Hydrology, and Geochemistry in a Cold Desert Ecosystem, Ecosystems, 12, 562–573, https://doi.org/10.1007/s10021-009-9242-8, 2009.