the Creative Commons Attribution 4.0 License.
the Creative Commons Attribution 4.0 License.
 | 10 Mar 2021
Long-term bare-fallow soil fractions reveal thermo-chemical properties controlling soil organic carbon dynamics
Mathieu Chassé
Suzanne Lutfalla
Lauric Cécillon
François Baudin
Samuel Abiven
Claire Chenu
Pierre Barré
Evolution of organic carbon content in soils has the potential to be a major driver of atmospheric greenhouse gas concentrations over the next century. Understanding soil carbon dynamics is a challenge due to a wide range of residence times of soil organic matter and limited constraints on the mechanisms influencing its persistence. In particular, large uncertainties exist regarding the persistence of pyrogenic organic carbon in soils. In order to characterize organic matter with varying degrees of persistence and to distinguish pyrogenic organic carbon, we combined Rock-Eval analysis, a thermo-chemical method, with the benzene polycarboxylic acid molecular marker method and Raman spectroscopy to characterize samples from long-term bare-fallow experiments, progressively depleted in the most labile organic carbon over time. Considering the heterogeneity of soil samples, size fractions have been separated to distinguish pools of organic carbon with distinct properties. We observe that organic carbon dynamics is dependent on granulometry. A pool of organic carbon with intermediate residence times, from years to a few decades, representing ca. 65 % of the bulk soil organic carbon stock, is mainly associated with fine fractions (< 20 µm). With time under bare fallow, this organic carbon is progressively transferred towards finer fractions through the breakdown of organic matter. Coarse fractions (> 20 µm) are rich in centennially persistent organic carbon, representing ca. 20 % of the initial organic carbon stock, due to the chemical recalcitrance of organic matter in these fractions, dominated by pyrogenic organic carbon. A second pool of persistent organic carbon, representing ca. 15 % of the initial organic carbon stock, is associated with the clay fraction, indicating mechanisms of protection occurring at the submicron scale (< 2 µm). This persistent organic carbon only represents 30 % of the organic carbon initially present in the clay fraction. Persistent organic carbon exhibits heterogeneous chemical signatures depending on the considered pool but a consistent thermal signature demonstrating the relationship between thermal stability and biogeochemical stability of soil organic carbon. This gives the possibility of assessing the size of the persistent organic carbon pool in soils using thermal parameters. The persistence of pyrogenic organic carbon in the clay fraction is similar to the one of total organic carbon. The different persistence of coarse and fine pyrogenic organic carbon resides in the highly condensed nature of sand-sized pyrogenic carbon, which may result from burning temperatures over 700 ∘C. Pyrogenic organic carbon is not inert but exhibits a consistent increase in the level of condensation with time in all size fractions, showing the role of chemical quality in pyrogenic organic carbon persistence. Overall, this study helps improve the separation, evaluation and characterization of carbon pools with distinct residence times in soils and gives insight into the mechanistic origin of soil organic carbon dynamics.
- Article
(10834 KB) - Full-text XML
-
Supplement
(2003 KB) - BibTeX
- EndNote


Improved management and forecast of soil organic carbon (SOC) stock evolution is a crucial challenge to soil security (e.g. Lal, 2004; Koch et al., 2013) as well as to climate change models and the associated mitigation strategies (e.g. Eglin et al., 2010; Ciais et al., 2014). A wide range of SOC residence times are observed in soils, from days to millennia (Trumbore, 2000). The processes behind this remain elusive due to the varied chemical nature of organic compounds and complex interactions with the mineral matrix and microbial decomposers (e.g. Gleixner, 2013; Barré et al., 2014; Kögel-Knabner, 2017). Nonetheless, models simulate C outputs resulting from SOC mineralization using different SOC pools distinguished on the basis of C dynamics (e.g. Parton et al., 1987; Coleman and Jenkinson, 1996). The accuracy of the models is limited by insufficient constraints on the size of these pools, in particular regarding the most persistent one, hereafter referred to as the centennially persistent SOC pool (e.g. Todd-Brown et al., 2013; Luo et al., 2016).
The challenge arises from the limited understanding of the origin of long-term SOC persistence (Schmidt et al., 2011). Persistence is expected to depend on three major processes (Sollins et al., 1996): (i) physical protection (Balesdent et al., 2000), (ii) physico-chemical protection (von Lützow et al., 2006) and (iii) chemical recalcitrance (Angst et al., 2016). (i) The physical protection is related to the accessibility of SOC to decomposers, either depending on the distance between SOC particles, limiting the likelihood of degradation by microorganisms (Don et al., 2013), or on the formation of clay-sized aggregates, entrapping SOC and making it inaccessible to microorganisms (Chenu et al., 2009). (ii) The interaction between SOC and mineral particles determines an energy barrier inducing the physico-chemical protection of organic matter (OM) against decomposition (Mikutta and Kaiser, 2011). (iii) Organic matter chemistry controls the chemical energy available for soil heterotrophic microorganisms, which can result in different rates of decomposition (Manzoni et al., 2010). Even if chemical recalcitrance is regarded as a secondary parameter to explain bulk SOC persistence (Amelung et al., 2008), it could be a relevant parameter for a specific form of SOC: pyrogenic organic carbon (PyOC; Schmidt et al., 2011). Also referred to as black carbon, charcoal or fire-derived OM, it is ubiquitous in soils, representing ca. 15 % of the SOC on average (Reisser et al., 2016). It is a charred residue derived from the incomplete burning of biomass. As PyOC mineralizes slowly compared to the initial biomass (Lehmann et al., 2015), it is expected to be a major pool of persistent OC. However, PyOC residues are a mixture of chemical phases with distinct physical states (Keiluweit et al., 2010). Depending on the degree of aromaticity and substitution, PyOC can display contrasted properties (Wiedemeier et al., 2015). Studies on PyOC persistence in soil find a large range of residence time (Singh et al., 2012). The processes responsible for PyOC persistence and its contribution to the persistent SOC pool remain to be determined (Lutfalla et al., 2017).
The determination of SOC chemistry and of the characteristics of organo-mineral interactions leading to SOC persistence is made difficult by the absence of a procedure to separate SOC with different residence times (Poeplau et al., 2018). Long-term bare-fallow (LTBF) field experiments are a simple and effective way to isolate centennially persistent SOC (Barré et al., 2010). In these field experiments, inputs of C to the soil were stopped decades ago, and samples from various plots were regularly collected and stored since the beginning of the experiment. With time, the most labile organic compounds have been mineralized, leading to enrichments in persistent SOC. Among the methods available to study the biogeochemical stability of SOC, thermal analyses proved to be efficient due to the correlation between the energy required for thermal and biological oxidation (Gregorich et al., 2015). In particular, the Rock-Eval (RE) method has successfully emerged for studying the biogeochemical stability of soil OM (Barré et al., 2016) to quantify the size of the persistent SOC pool (Cécillon et al., 2018) or to estimate the proportion of particulate OM (Soucémarianadin et al., 2018). This method provides thermo-chemical measurements from the sequential ramped pyrolysis and oxidation of a sample (Behar et al., 2001). In addition to thermal characterization of SOC, information on OM chemistry can be obtained (Saenger et al., 2013). Chemical indices can be derived from the analysis and related to OM stoichiometry (Disnar et al., 2003). Specifically, PyOC being a substantial SOC component in several LTBF samples (Lutfalla et al., 2017), it gives the possibility of focusing on the origin of long-term persistence of PyOC compounds. The burning temperature of PyOC has been related to its long-term residence in soils (Zimmerman, 2010). This temperature can be estimated using a Raman-based thermometer (Deldicque et al., 2016). The influence of burning temperature is related to the chemical quality of PyOC, which can also be influenced by the parent material and the conditions of PyOC preservation in soils (Spokas, 2010). The chemical quality of PyOC depends on the aromaticity and the degree of aromatic condensation of the material, both described by the benzene polycarboxylic acid (BPCA) molecular marker method (Wiedemeier et al., 2015).
Thermo-chemical analyses are often limited to bulk LTBF samples, implicitly assuming homogeneous properties of SOC within a soil sample. However, soil fractionation shows that functionally distinct OM pools can be distinguished from bulk soil samples (von Lützow et al., 2007), and rare studies on fractionated LTBF samples indicate variations in OM quality (Plante et al., 2005). To provide new insight into the thermo-chemical characteristics of SOC in relation to C dynamics, with emphasis on PyOC, we studied SOC with contrasted persistence by combining RE analyses, Raman spectroscopy and the BPCA molecular marker method on size-fractionated samples from the oldest, 80-year, LTBF experiments in France. The objectives and hypotheses of this work are threefold. (i) We aim to identify SOC pools with distinct dynamics (i.e. persistence and decline of OC in the soil and between soil compartments due to mineralization, leaching or transfer towards other soil fractions) as the heterogeneous properties of the studied fractions should lead to varied SOC residence times, giving the opportunity to separate SOC into distinct pools. (ii) We want to determine the thermo-chemical characteristics of each pool as their dynamics is expected to depend on their stoichiometry (e.g. H and O content), chemistry (e.g. aromaticity for PyOC) and thermal stability. (iii) We wish to deduce the mechanistic origin of their dynamics (i.e. the physical, chemical and biological mechanisms at stake). The correlations between SOC dynamics and thermo-chemical properties in a given pool will enlighten the nature of the underlying mechanisms explaining SOC persistence.
2.1 Long-term bare-fallow experiments
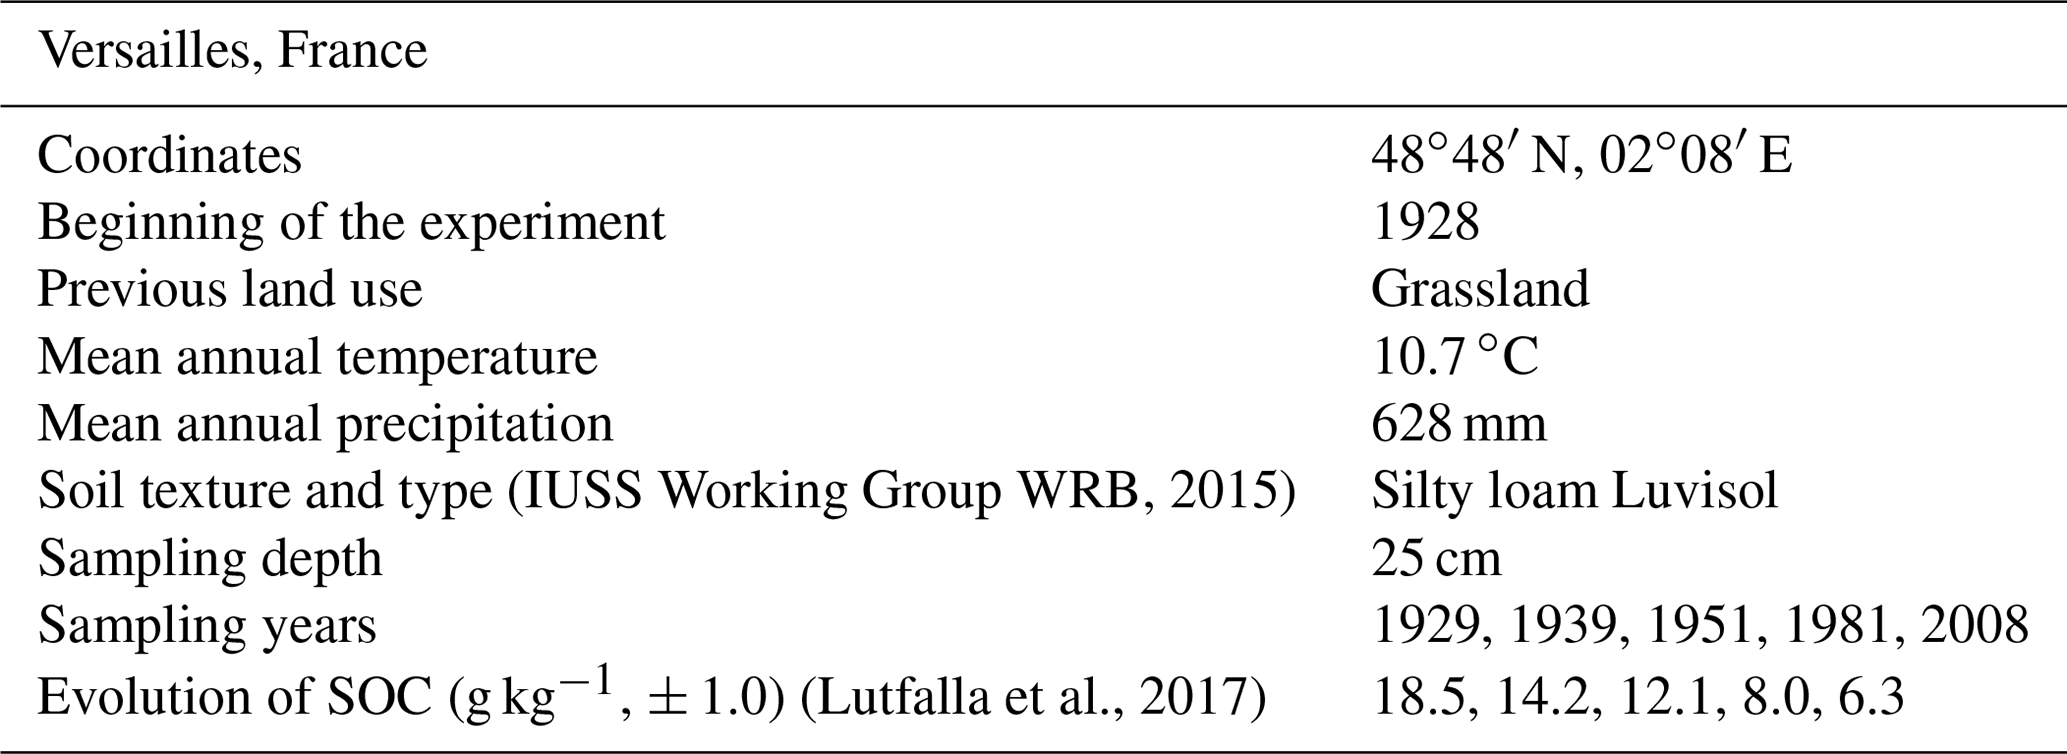
Studied soil samples were recovered from the archives of the Versailles LTBF experiment, France (Table 1). Detailed characteristics of the site are provided in Barré et al. (2010). Archived samples were air-dried and kept in the dark. Bulk soil density remained constant over the LTBF experiment (Barré et al., 2010). Four field-plot replicates were selected. For each plot, samples from the first year of bare-fallow treatment (1929) and after four bare-fallow periods (11, 23, 53 and 80 years) were chosen.
(IUSS Working Group WRB, 2015)(Lutfalla et al., 2017)Table 1Selected characteristics of the Versailles long-term bare-fallow experiment.
2.2 Particle-size fractionation
Physical dispersion and particle-size fractionation were carried out on soil samples (Lutfalla et al., 2018) to separate the sand fraction (> 50 µm), the coarse and fine silt fractions ((20–50) and (2–20) µm) and the clay fraction (< 2 µm) using the method proposed by Balesdent et al. (1998). Fifty grams of soil were shaken overnight with 20 glass beads in 180 mL deionized water to break up aggregates bigger than 50 µm. The obtained suspension was then passed through a 50 µm sieve, thereby preventing the disruption of particulate OM during the subsequent ultrasonic dispersion (Balesdent et al., 1991), and sonicated in an ice bath for a total input of 320 J mL−1, using a digital sonifier (Sonics model 500W operating at 20 kHz, maximum output = 120 W, probe with a flat tip of 2.5 cm diameter). The dispersion conditions allowed the recovery of a clay-size fraction (< 2 µm) equivalent in proportion to that achieved during standard particle-size fractionation (Balesdent et al., 1991). At that stage, the solution was centrifuged at 79 g for 12 min to isolate the clay fraction and then at 5 g for 1 min to isolate the silt fractions. Before weighing, sand and coarse silt fractions were oven-dried at 60 ∘C, while the fine silt and clay fractions were freeze-dried. Total mass recovery was 99.1 % (standard deviation = 0.4 %).
As organo-mineral interactions occur at the submicron scale and induce variable SOC residence time depending on the size of clay subfractions (Balesdent et al., 1987), coarse, intermediate and fine clay subfractions ((0.2–2), (0.05–0.2) and < 0.05 µm) were obtained from the clay fraction (Lutfalla et al., 2018). Two grams of clay subsamples were suspended in water and sonicated at 320 J mL−1. The sonicated suspension was then sequentially centrifuged at 23 056 g for 61 min to isolate the fine fraction and at 5764 g for 15 min 22 s to separate the intermediate and coarse fractions. All clay subfractions were then freeze-dried. Mass recovery for the clay fractionation was 98.3 % (standard deviation = 1.7 %).
A table containing the mass obtained for each fraction of each sample is provided in the Supplement (Table S1).
2.3 Rock-Eval measurements
Thermo-chemical analyses were carried out on the different particle-size fractions of the four plot replicates for the five bare-fallow durations using a RE6 Turbo device (Behar et al., 2001, Vinci Technologies). The RE6 technique provided measurements from the sequential pyrolysis and oxidation of ca. 10 mg of the fine clay subfraction, of ca. 50 mg of the other clay subfractions and clay and fine silt fractions and of ca. 200 mg of the coarse silt and sand fractions. The choice of different masses for C-poor and C-rich samples was necessary to avoid reaching detector saturation or falling below the detection limit. Volatile hydrocarbon effluents from pyrolysis were detected and quantified with flame ionization detection (FID), while the evolution of CO and CO2 gases was quantified by infrared detection during both the pyrolysis and oxidation stages. Pyrolysis was carried out from 200 to 650 ∘C in an N2 atmosphere with a heating rate of 30 ∘C min−1, while the oxidation was carried out from 300 to 850 ∘C in the ambient laboratory air atmosphere with a heating rate of 20 ∘C min−1. The RE6 technique generated five thermograms per sample, giving the evolution of (1) volatile hydrocarbon (HC) effluents during pyrolysis, (2) CO2 during pyrolysis, (3) CO2 during oxidation, (4) CO during pyrolysis and (5) CO during oxidation.
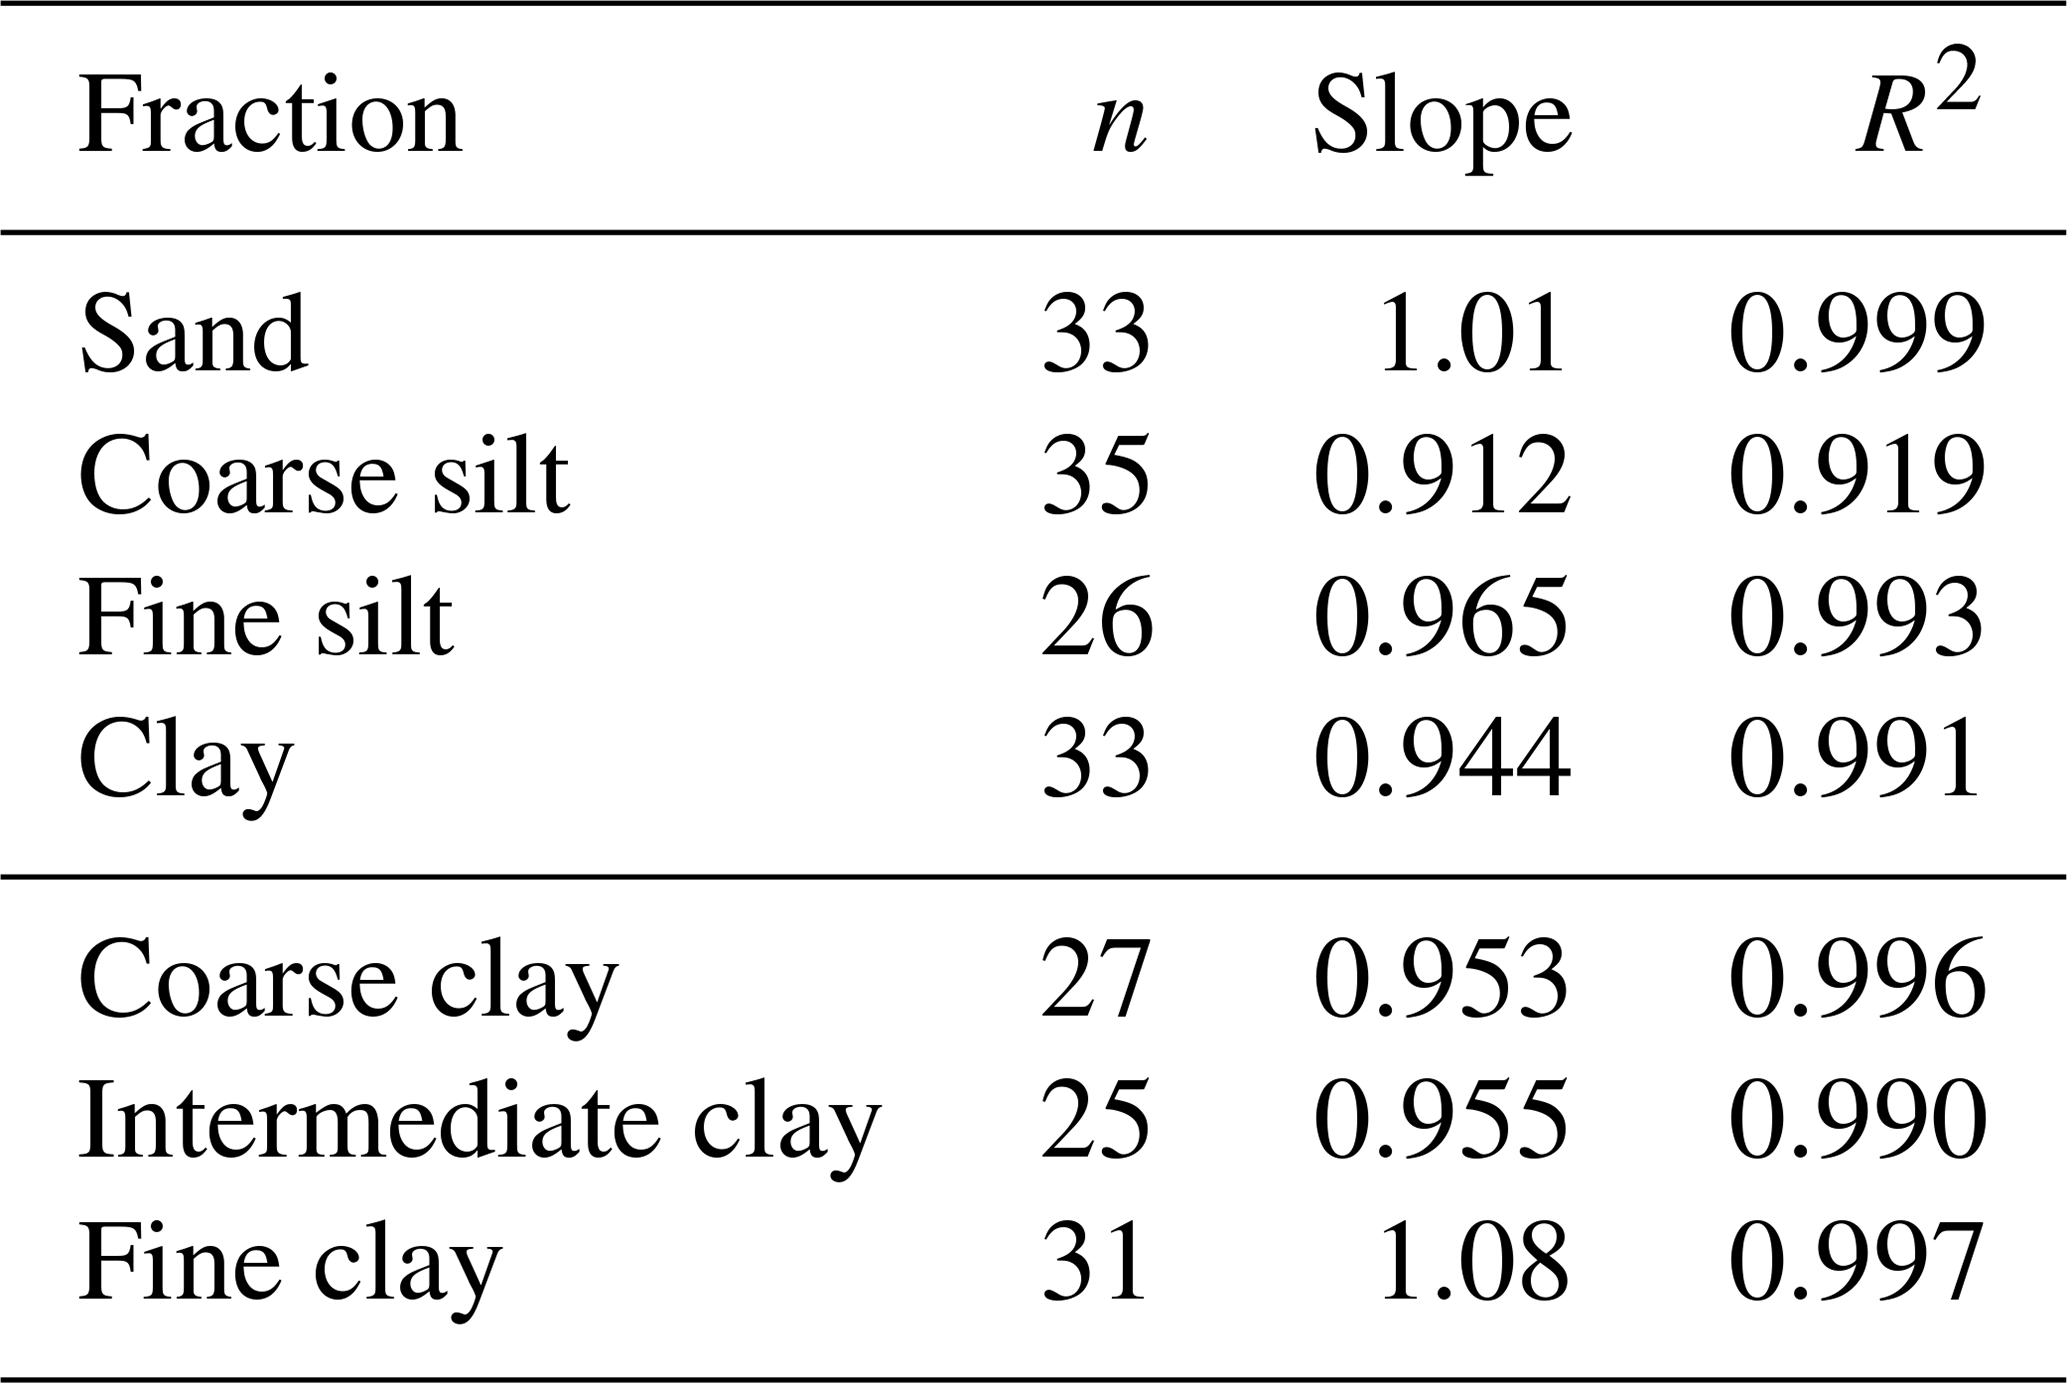
Rock-Eval results were first used to measure C content. To evaluate the reliability of the measurements, the C concentrations obtained were compared to the C content measured by dry combustion (Lutfalla et al., 2018) in a CHN autoanalyser (Carlo Erba NA 1500). On average, the carbon yield of the RE6 analyses was about 101 %, 91.2 %, 96.5 % and 94.4 % for the sand, coarse silt, fine silt and clay fractions and about 95.3 %, 95.5 % and 108 % for the coarse, intermediate and fine clay subfractions (Table 2).
Table 2Parameters of the carbon yield curves of the Rock-Eval 6 analyses for each analysed fraction (n: number of analyses).
Using the HC pyrolysis thermogram, the hydrogen index (HI, g HC kg−1 C) was determined. This index corresponds to the quantity of pyrolysed hydrocarbons relative to the total SOC (TOCRE6) of the sample, reflecting SOC bulk chemistry. Using the CO and CO2 pyrolysis thermograms, we determined another parameter reflecting SOC bulk chemistry, the oxygen index (OIRE6, g O2 kg−1 C) corresponding to the oxygen yield as CO and CO2 during the thermal pyrolysis of soil OM divided by the TOCRE6 of the sample. The HI correlates with the elemental H:C atomic ratio of SOC and the OIRE6 correlates with the elemental O:C atomic ratio of SOC (Espitalié et al., 1977).
For each RE6 thermogram, we determined the temperatures corresponding to each incremental proportion of the amount of gases that evolved during the pyrolysis and oxidation stages (Cécillon et al., 2018). Upper temperatures of 850 ∘C (CO oxidation thermogram), 650 ∘C (HC pyrolysis thermogram), 611 ∘C (CO2 oxidation thermogram) and 560 ∘C (CO and CO2 pyrolysis thermograms) were chosen for signal integration, thereby excluding any interference of soil carbonates (Behar et al., 2001). For each RE6 thermogram, signal integration was performed on the offset-corrected thermogram using sample-specific offset values estimated by the RE6 Turbo device. For the three pyrolysis thermograms, signal integration started after an isotherm step of 200 s at 200 ∘C. The temperature parameters are labelled TX, where X represents the temperature corresponding to the evolution of X % of the amount of evolved gases for a given sample and a specific thermogram (HC, CO2 pyrolysis, CO2 oxidation, CO pyrolysis, CO oxidation).
A table containing the RE6 parameters obtained for each sample with all relevant information on the samples is provided in the Supplement (Table S2).
2.4 Raman spectroscopy
Raman spectra were obtained on a Raman micro-spectrometer (Renishaw inVia). They were obtained on micrometre-sized areas of raw (non-polished), hand-picked, PyOC grains from the sand fraction. Ten to 15 grains were collected from each of the four distinct plots, amounting to 50 grains for each of the 1929 and 2008 samplings. Analyses were performed on the centre of particles, using an argon laser beam (514.5 nm, Spectra Physics) equipped with a LEICA 50× magnification objective (0.5 numerical aperture) and using a circular polarization of the laser. The Raman-scattered light was dispersed by wavelength using a holographic grating with 1800 lines mm−1 and detected by a CCD camera. To avoid any sample heating (which can modify the spectral parameters or the structure of the analysed materials), the laser power on the sample was kept lower than 0.2 mW, i.e. less than 1 % of the nominal power. The spectra were recorded in the (900–2000) cm−1 range (first-order spectrum).
All the Raman spectra of PyOC particles are characterized by two broad D and G bands (Supplement Fig. S1). The background was extracted using a linear baseline. The burning temperature (BT) of PyOC grains was determined using the relative height of these two bands (x= ) following the equation established by Deldicque et al. (2016):
The selection of this thermometer is based on its robustness. The type of organic precursor has negligible effects on temperature estimates and the effect of residence time at the highest temperature of burning is weak. This thermometer gives a ± 20 ∘C estimate of burning temperature in the (600–900) ∘C range for wood fires.
2.5 Benzene polycarboxylic acid analysis
Pyrogenic OC contents were assessed with the BPCA method, a previously described state-of-the-art molecular marker approach for PyOC analysis in environmental samples (Wiedemeier et al., 2015). The analyses were performed on milled bulk (300 mg/analysis), sand (300 mg/analysis) and clay (100 mg/analysis) fractions after 1, 23 and 80 years of experiment on the four field replicates. Samples were analysed in duplicate and analytical error was always < 10 %. For each analytical batch of soils, a laboratory reference soil (Chernozem) was included to ensure the quality of the analytical procedures. The BPCA method is known to provide a conservative assessment of PyOC in soil. It targets pyrogenic molecular markers only. The BPCA method is consistent but underestimates the absolute amount of PyOC (Glaser et al., 1998), and a conversion factor of 2.2717 has been proposed to convert “BPCA-PyOC” to “total-PyOC”. We present unconverted PyOC contents because only relative changes in the PyOC content were of interest. We estimated the content and evolution of PyOC in the silt fraction (coarse silt and fine silt) by difference between bulk PyOC on the one hand and clay and sand PyOC on the other. Four types of molecular markers are also identified, indicating different degrees of aromaticity, from the most condensed benzene hexacarboxylic acid (B6CA) to the less condensed benzene pentacarboxylic, tetracarboxylic and tricarboxylic acids (B5CA, B4CAs, B3CAs).
A table containing the BPCA results obtained for each sample is provided in the Supplement (Table S3).
2.6 Data analysis
Analyses were conducted using the free software environment for statistical computing R (http://www.r-project.org, last access: 8 March 2021).
To assess quantitatively the characteristics of OC decay in the studied fractions, the data were fitted using different decay models successfully applied to describe OC dynamics in LTBF experiments (Barré et al., 2010) (Supplement Table S4). The nls function (“stats” package) was used. Data from the four replicates are fitted at once in order to take into account all sources of error in the uncertainties of the model. A one-pool model with first-order kinetics did not take proper account of the plateau reached by the OC content along the experiment, as shown by the high Akaike score. A two-pool model with first-order kinetics did not converge due to the limited number of sampling dates considered in this study compared to the four parameters in the model. A modified two-pool model was thus selected, with better Akaike scores. In this model, an intermediate C pool is modelled using a mono-exponential decay and a C pool persistent over the timescale of the LTBF experiment is modelled using a constant, assuming that the decay of this pool is negligible over an 80-year period. The following exponential decay function is used (Fig. 1):
with OCi the content of intermediate OC in g kg−1, MRT the mean-residence time of OC in years and OCp the persistent OC content over the timescale of the LTBF experiment in g kg−1.
3.1 Organic carbon evolution in soil size fractions during bare fallow
For the different fractions, the OC content in the fraction is decaying before reaching a plateau after several decades of experiment (Fig. 1). The model used to fit the evolution of OC content over time helps to assess the characteristics of this decay. Two pools of OC are considered: (i) an intermediate pool with a mean-residence time (MRT) characterizing the average time an atom of C remains in this reservoir and (ii) a persistent pool with a negligible decay at the timescale of the experiment, thus considered inert at this timescale.
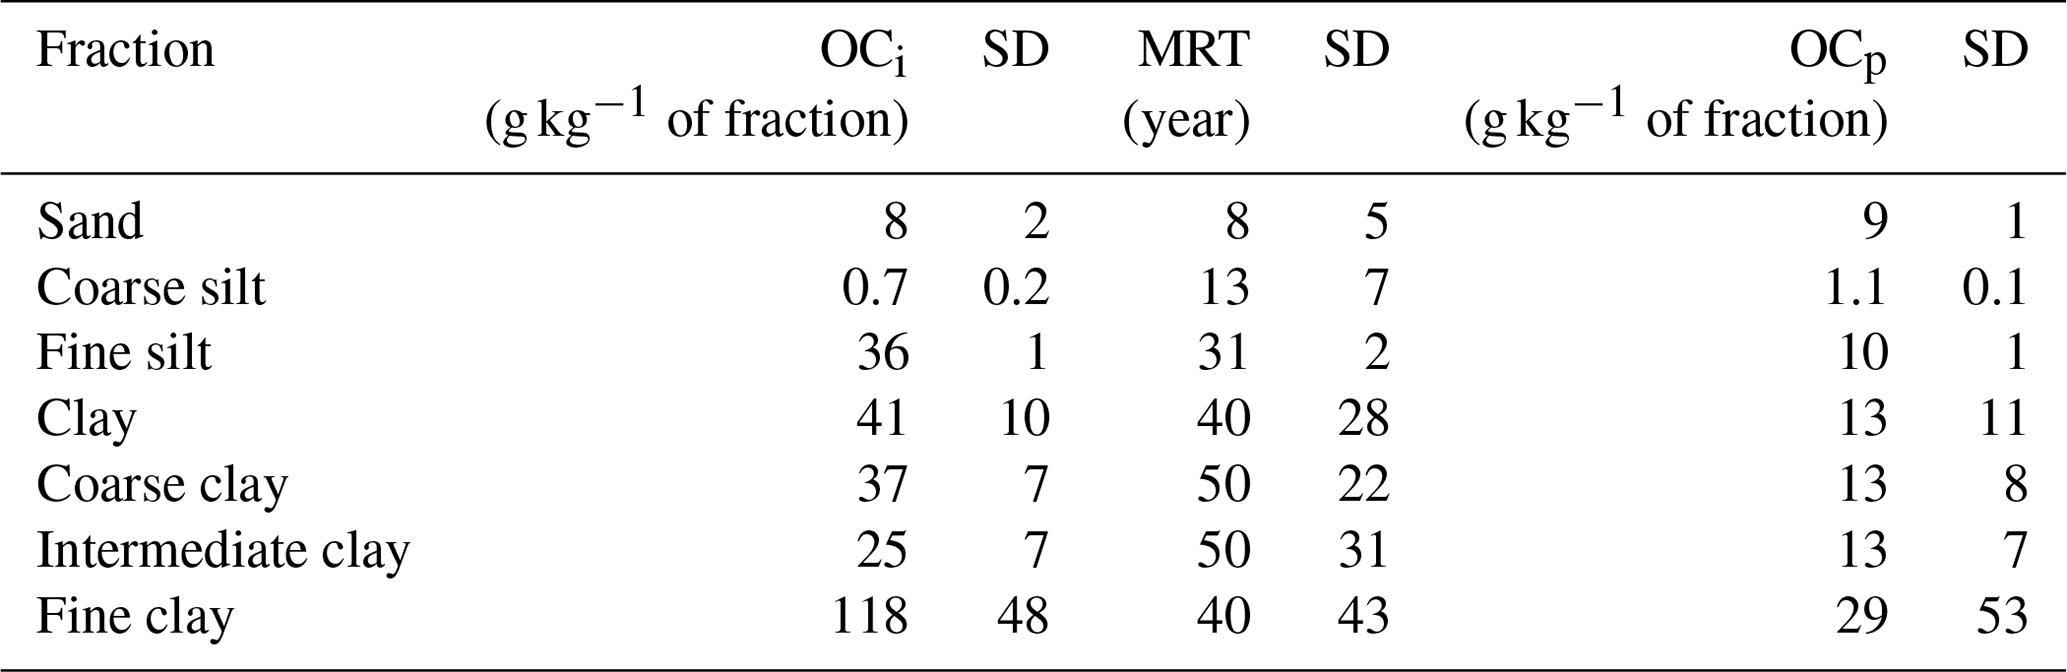
The MRT of intermediate OC is increasing with decreasing granulometry (Table 3, Fig. 1). The MRT of intermediate OC is 8 years (standard deviation, SD = 5 years) for the sand fraction, 13 years (SD = 7 years) for the coarse silt fraction, 31 years (SD = 2 years) for the fine silt fraction and 40 years (SD = 28 years) for the clay fraction. The MRT of intermediate OC is homogeneous in all clay subfractions considering the standard deviation and comparable to the total clay fraction. Inputs of OC in the fine clay subfraction are evidenced by the absolute increase in OC content after 10 years of experiment (Fig. 1b). Compared to the decreasing trend, such an increase is also observed in the clay fraction and subfractions. At first order, such input will have a negligible influence on the parameters of the model, as shown by the distance of the OC content of the clay fraction after 10 years of experiment compared to the trend of the model.
The persistent OC represents an estimate of the OC content remaining in a soil fraction after almost a century of the LTBF experiment. The concentration of persistent OC is similar in the clay, fine silt and sand fractions (Table 3), with 13 g kg−1 of clay fraction (SD = 11 g kg−1), 10 g kg−1 of fine silt fraction (SD = 1 g kg−1) and 9 g kg−1 of sand fraction (SD = 1 g kg−1). It is minimum in the coarse silt fraction, with 1.1 g kg−1 of coarse silt fraction (SD = 0.1 g kg−1). In the clay subfractions, the amount of persistent OC is similar to the total clay fraction, except for the fine clay subfraction, reaching 29 g kg−1 of fine clay subfraction (SD = 53 g kg−1). Despite the large uncertainty in the model, after 80 years of experiment, the high SOC concentration (ca. 50 g kg−1 of fraction) in the fine clay fraction compared to the other fractions (ca. 20 g kg−1 of fraction) confirms this difference (Fig. 1b).

Figure 1Evolution of the organic carbon content with duration of the long-term bare-fallow experiment for the size fractions studied: (a) sand (> 50 µm), silt (coarse: (20–50) µm, fine: (2–20) µm) and clay (< 2 µm) fractions; (b) coarse ((0.2–2) µm), intermediate ((0.05–0.2) µm) and fine (< 0.05 µm) clay subfractions. The organic content is multiplied by 5 for the coarse silt fraction to clearly see the evolution. The error bars correspond to the standard deviation between the four plot replicates. Where not visible, error bars are smaller than the symbol size. For each fraction, the evolution of the organic carbon content with time is fitted by an exponential decay function (OC(t) = OC + OCp, OCi: intermediate organic carbon content, MRT: mean-residence time and OCp: persistent organic carbon content). The 95 % confidence interval obtained from the standard deviation of the function parameters is represented by the coloured areas.
Table 3Parameters of the exponential decay function (OC(t) = OC + OCp) used to fit the evolution of organic carbon content with duration of the long-term bare-fallow experiment for the different size fractions considered (OCi: intermediate organic carbon, MRT: mean-residence time, OCp: persistent organic carbon). The standard deviation (SD) obtained for each parameter is given in the next column to the right.
The OC budget contained in each fraction was obtained from the measured OC content and the corresponding mass proportion (Fig. 2). Most of the initial OC proportion is shared between the sand and fine silt fractions (ca. 25 % each) and the clay fraction (ca. 45 %), while the contribution of the coarse silt fraction is negligible (ca. 5 %). The OC proportion is stable over time in the sand and clay fractions (paired t tests initial/final: p values = 0.20 and 0.57), increases in the coarse silt fraction (paired t test initial/final: p value = 0.04) and decreases in the fine silt fraction (paired t test initial/final: p value = 0.01, Fig. 2a). In terms of OC persistence, at the beginning of the experiment, OC in the clay and fine silt fractions was dominated by intermediate OC, while in the sand and coarse silt fractions, the OC content was shared between intermediate and persistent OC. Persistent OC is mostly present in the sand and clay fraction (ca. 45 % and ca. 35 %, respectively), the coarse and fine silt fractions sharing the remaining ca. 20 %.
Within the clay fraction (Fig. 2b), most of the OC was contained in the coarse clay subfraction (ca. 65 %), which also represented the major fraction in mass (ca. 65 wt %). The rest was shared between the intermediate and fine clay subfractions. The proportion of OC contained in the coarse clay subfraction did not vary significantly during the LTBF experiment (paired t test initial/final: p value = 0.49), while it increased from ca. 15 % to ca. 20 % in the intermediate clay subfraction (paired t test initial/final: p value = 0.02) and decreased from ca. 20 % to ca. 15 % in the fine clay subfraction (paired t test initial/final: p value = 0.01). The relative proportion of persistent and intermediate OC is similar between the subfractions, with a 1:3 ratio. The coarse clay fraction contains about two-thirds of the persistent OC of the clay fraction, the remaining being shared equally between the intermediate and fine clay subfractions.
Overall, persistent OC represents about 35 % of the total SOC at the start of the experiment (Fig. 2), corresponding to 5.8 g kg−1 in the bulk soil.
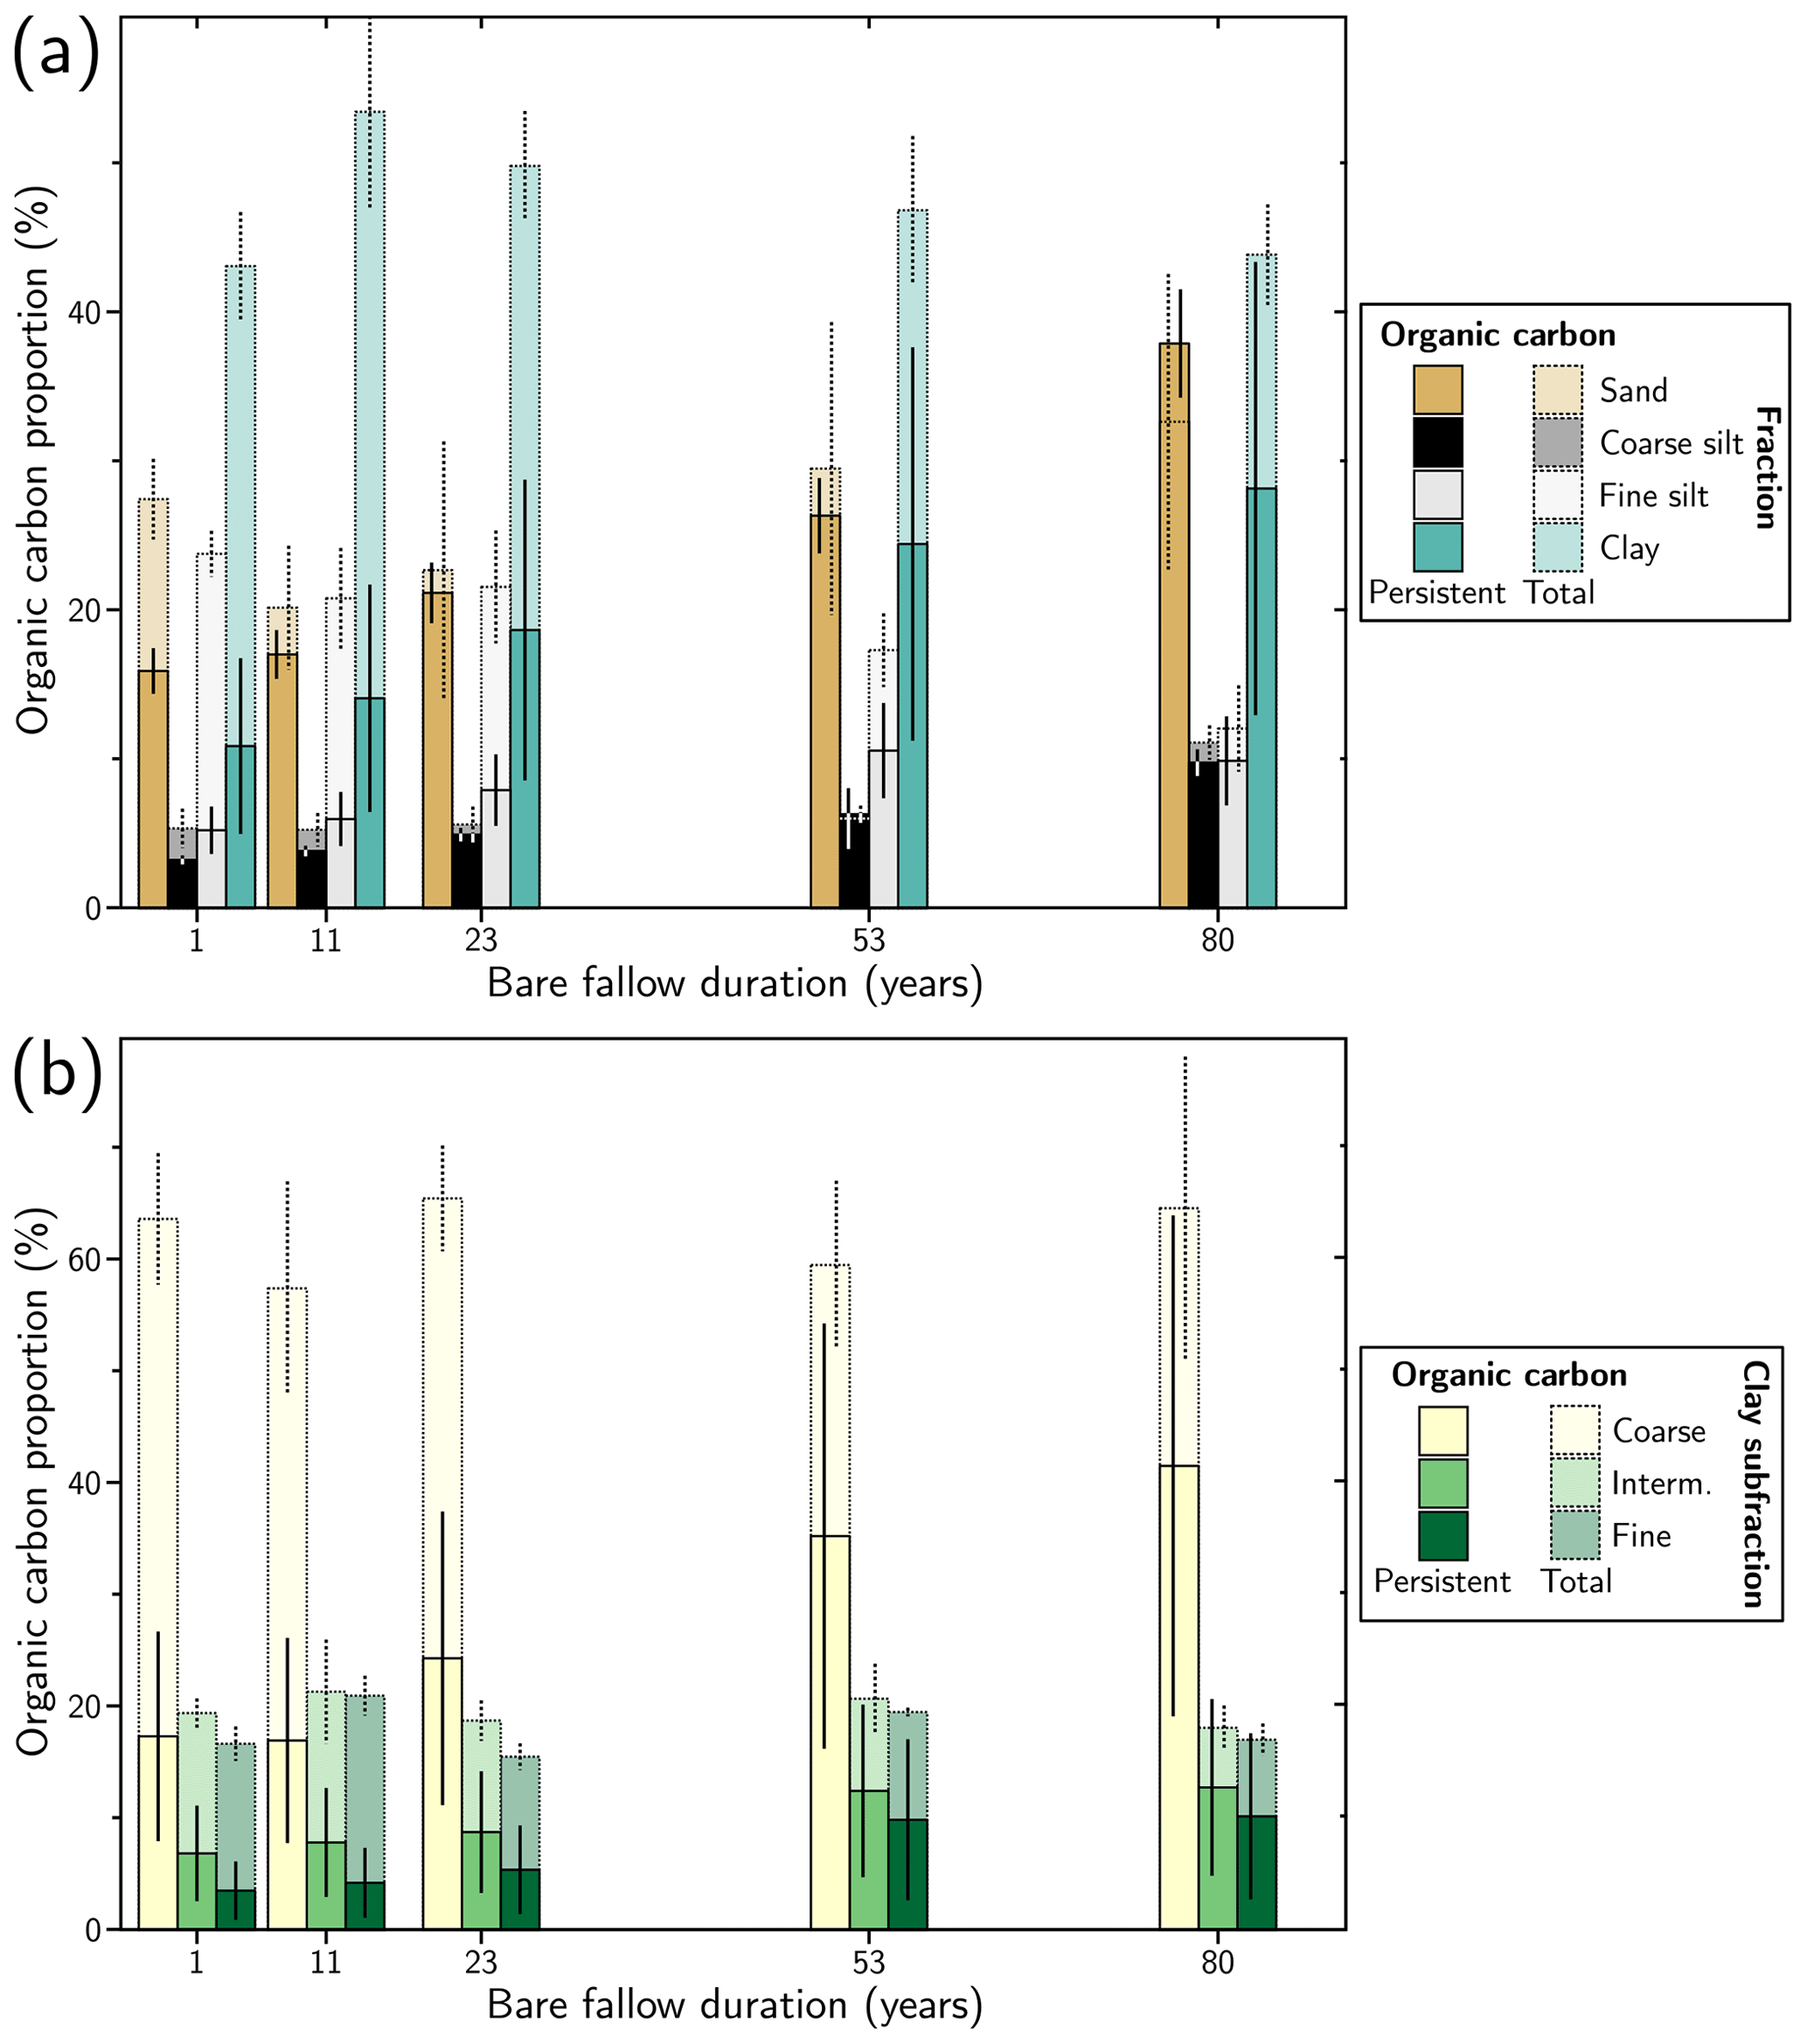
Figure 2Evolution of the organic carbon proportion contained in the studied size fractions with duration of the LTBF experiment: (a) sand (> 50 µm), silt (coarse: (20–50) µm, fine: (2–20) µm) and clay (< 2 µm) fractions; (b) coarse ((0.2–2) µm), intermediate ((0.05–0.2) µm) and fine (< 0.05 µm) clay subfractions. The error bars, corresponding to 2 standard deviations, are calculated from the standard deviation of the organic carbon content and of the mass of the fraction measured for the four plot replicates. The proportion of persistent organic carbon (dark colour) is obtained from exponential decay fitting using the OCp (persistent organic carbon) parameter. The error bars, corresponding to 2 standard deviations, are estimated from the standard deviation of the OCp parameter obtained from the fit and the standard deviation of the mass of the fraction measured for the four plot replicates.
3.2 Thermo-chemical evolution of organic carbon in soil size fractions during bare fallow
The HI decreased with time under bare fallow in all fractions (Fig. 3a). The HI decreased from ca. 130 to ca. 40 g HC kg−1 C in the sand fraction, from ca. 200 to ca. 90 g HC kg−1 C in the fine silt fraction and from ca. 170 to ca. 130 g HC kg−1 C in the clay fraction. The decay rate decreased with decreasing granulometry. The HI decrease in the coarse clay subfraction was similar to the trend observed in the total clay fraction. No clear trend is visible for the other clay subfractions (Fig. 3b), the HI values remaining in the 250 to 150 g HC kg−1 C range.
The OIRE6 exhibited contrasted variations (Fig. 3c). It decreased from ca. 130 to ca. 80 g O2 kg−1 C in the sand fraction. The OIRE6 was stable at ca. 160 g O2 kg−1 C in the fine silt fraction and increased from ca. 210 to ca. 260 g O2 kg−1 C in the clay fraction. This parameter increased in all clay subfractions, from ca. 200 to ca. 250 g O2 kg−1 C in the coarse clay subfraction, from ca. 230 to ca. 280 g O2 kg−1 C in the intermediate clay subfraction and from ca. 250 to ca. 300 g O2 kg−1 C in the fine clay subfraction (Fig. 3d). A slight decrease in the OIRE6 in the finest clay subfraction occurred in the first 10 years of the experiment.
Among the temperature parameters available from RE6 analysis, only the T50 CO2 oxidation parameter is shown, as it is common (Barré et al., 2016). Nonetheless, other thermal parameters such as T50 CO2 pyrolysis or T50 CO oxidation reveal the same trend (see Supplement Fig. S3). Temperature parameters, and thus OM thermal stability, increased with LTBF duration. The T50 CO2 oxidation increased from ca. 440 to ca. 500 ∘C in the sand fraction, from ca. 400 to ca. 430 ∘C in the fine silt fraction and from ca. 440 to ca. 460 ∘C in the clay fraction (Fig. 3e). The range of temperature increased with increasing granulometry. Temperature parameters also tended to increase with bare-fallow duration in the clay subfractions (Fig. 3f). The T50 CO2 oxidation parameter increased from ca. 430 to ca. 460 ∘C in the coarse clay subfraction, from ca. 450 to ca. 470 ∘C in the intermediate clay subfraction and from ca. 430 to ca. 440 ∘C in the fine clay subfraction. The fine clay subfraction exhibited a distinct behaviour with a sharp increase in the first 25 years of the experiment before decreasing.
The RE6 parameters obtained for the coarse silt fraction are given in the Supplement (Fig. S2) considering the low OC content and OC proportion contained in the coarse silt fraction. The evolution of these parameters was similar to the sand fraction discussed above.
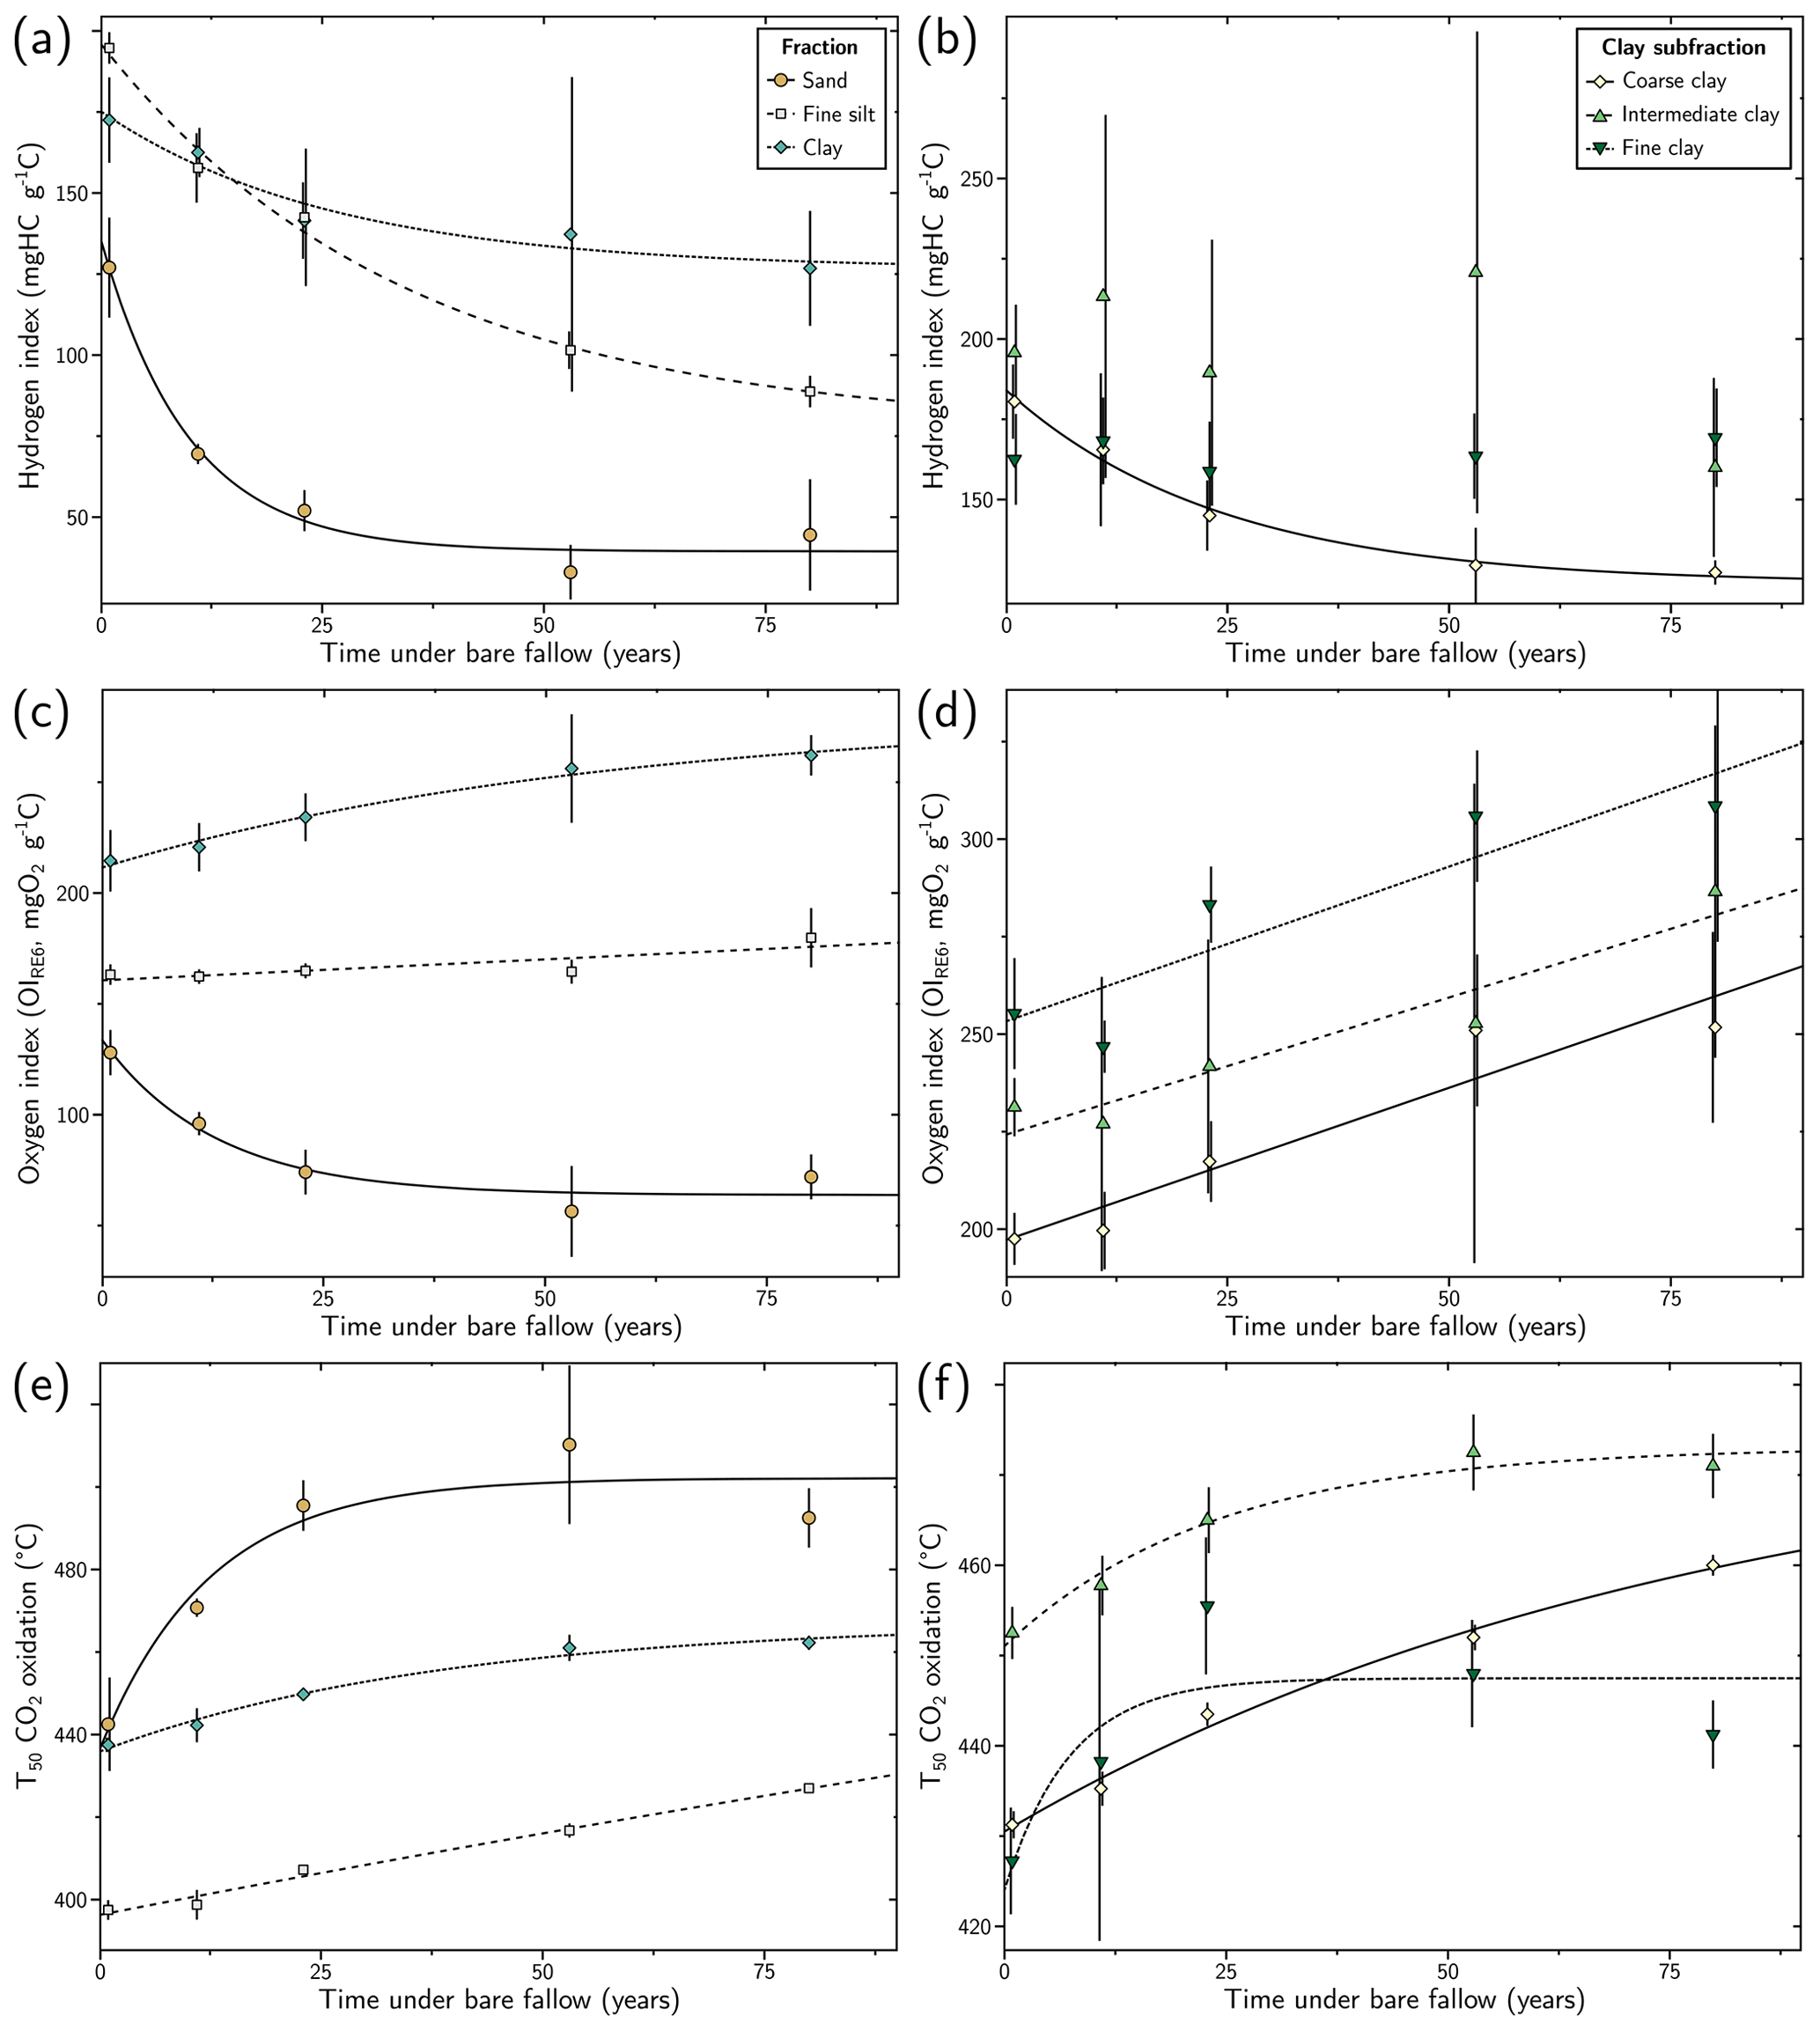
Figure 3Evolution of selected Rock-Eval 6 parameters with duration of the long-term bare-fallow experiment for the studied size fractions: (a) and (b) hydrogen index, (c) and (d) OIRE6 oxygen index and (e) and (f) the temperature at which 50 % of organic carbon combusted during the Rock-Eval 6 oxidation step (T50 CO2 oxidation). In (a), (c) and (e), the results for the sand (> 50 µm), silt (coarse: (20–50) µm, fine: (2–20) µm) and clay (< 2 µm) fractions are given. In (b), (d) and (f), the results for the coarse ((0.2–2) µm), intermediate ((0.05–0.2) µm) and fine (< 0.05 µm) clay subfractions are represented. The error bars correspond to 2 standard deviations calculated from the four plot replicates. Where not visible, error bars are smaller than symbol size. For each fraction, the trend of each parameter as a function of bare-fallow duration is fitted by either exponential decay, exponential recovery or linear functions to guide the reader.
3.3 Evolution of pyrogenic organic carbon content in soil size fractions during bare fallow
The evolution of PyOC content depended on the fraction considered (Fig. 4a). In the sand fraction, the PyOC content was variable between plot replicates (relative standard deviation, %RSD = 20 %–40 %), but the PyOC quantity remained stable during the 80 years of LTBF (paired t test initial/final: p value = 0.13). The average PyOC content of the sand fraction over the four field replicates and the three dates was ca. 0.9 g kg−1 of the sand fraction (SD = 0.3 g kg−1), representing 55 %–60 % of the bulk PyOC.
In the silt fraction, the PyOC content was also variable (%RSD = 45 %–80 %), representing ca. 25 % of the bulk PyOC. The PyOC quantity decreases during the 80 years of LTBF (paired t test initial/final: p value = 0.04), from ca. 0.3 g kg−1 of silt fraction (SD = 0.2 g kg−1) to ca. 0.1 g kg−1 of silt fraction (SD = 0.1 g kg−1).
In the clay fraction, the variability of PyOC content between the four plots was below 10 %. The PyOC content decreased significantly over the 80 years (paired t test initial/final: p value < 0.01), from ca. 1.0 g kg−1 of clay fraction (SD = 0.1 g kg−1) to 0.38 g kg−1 of clay fraction (SD = 0.03 g kg−1), representing ca. 15 % of the bulk PyOC. The rate of PyOC decrease was similar to the one of SOC in the clay fraction (ca. 25 % decrease in the first 22 years and ca. 60 % decrease over the 80 years of experiment).
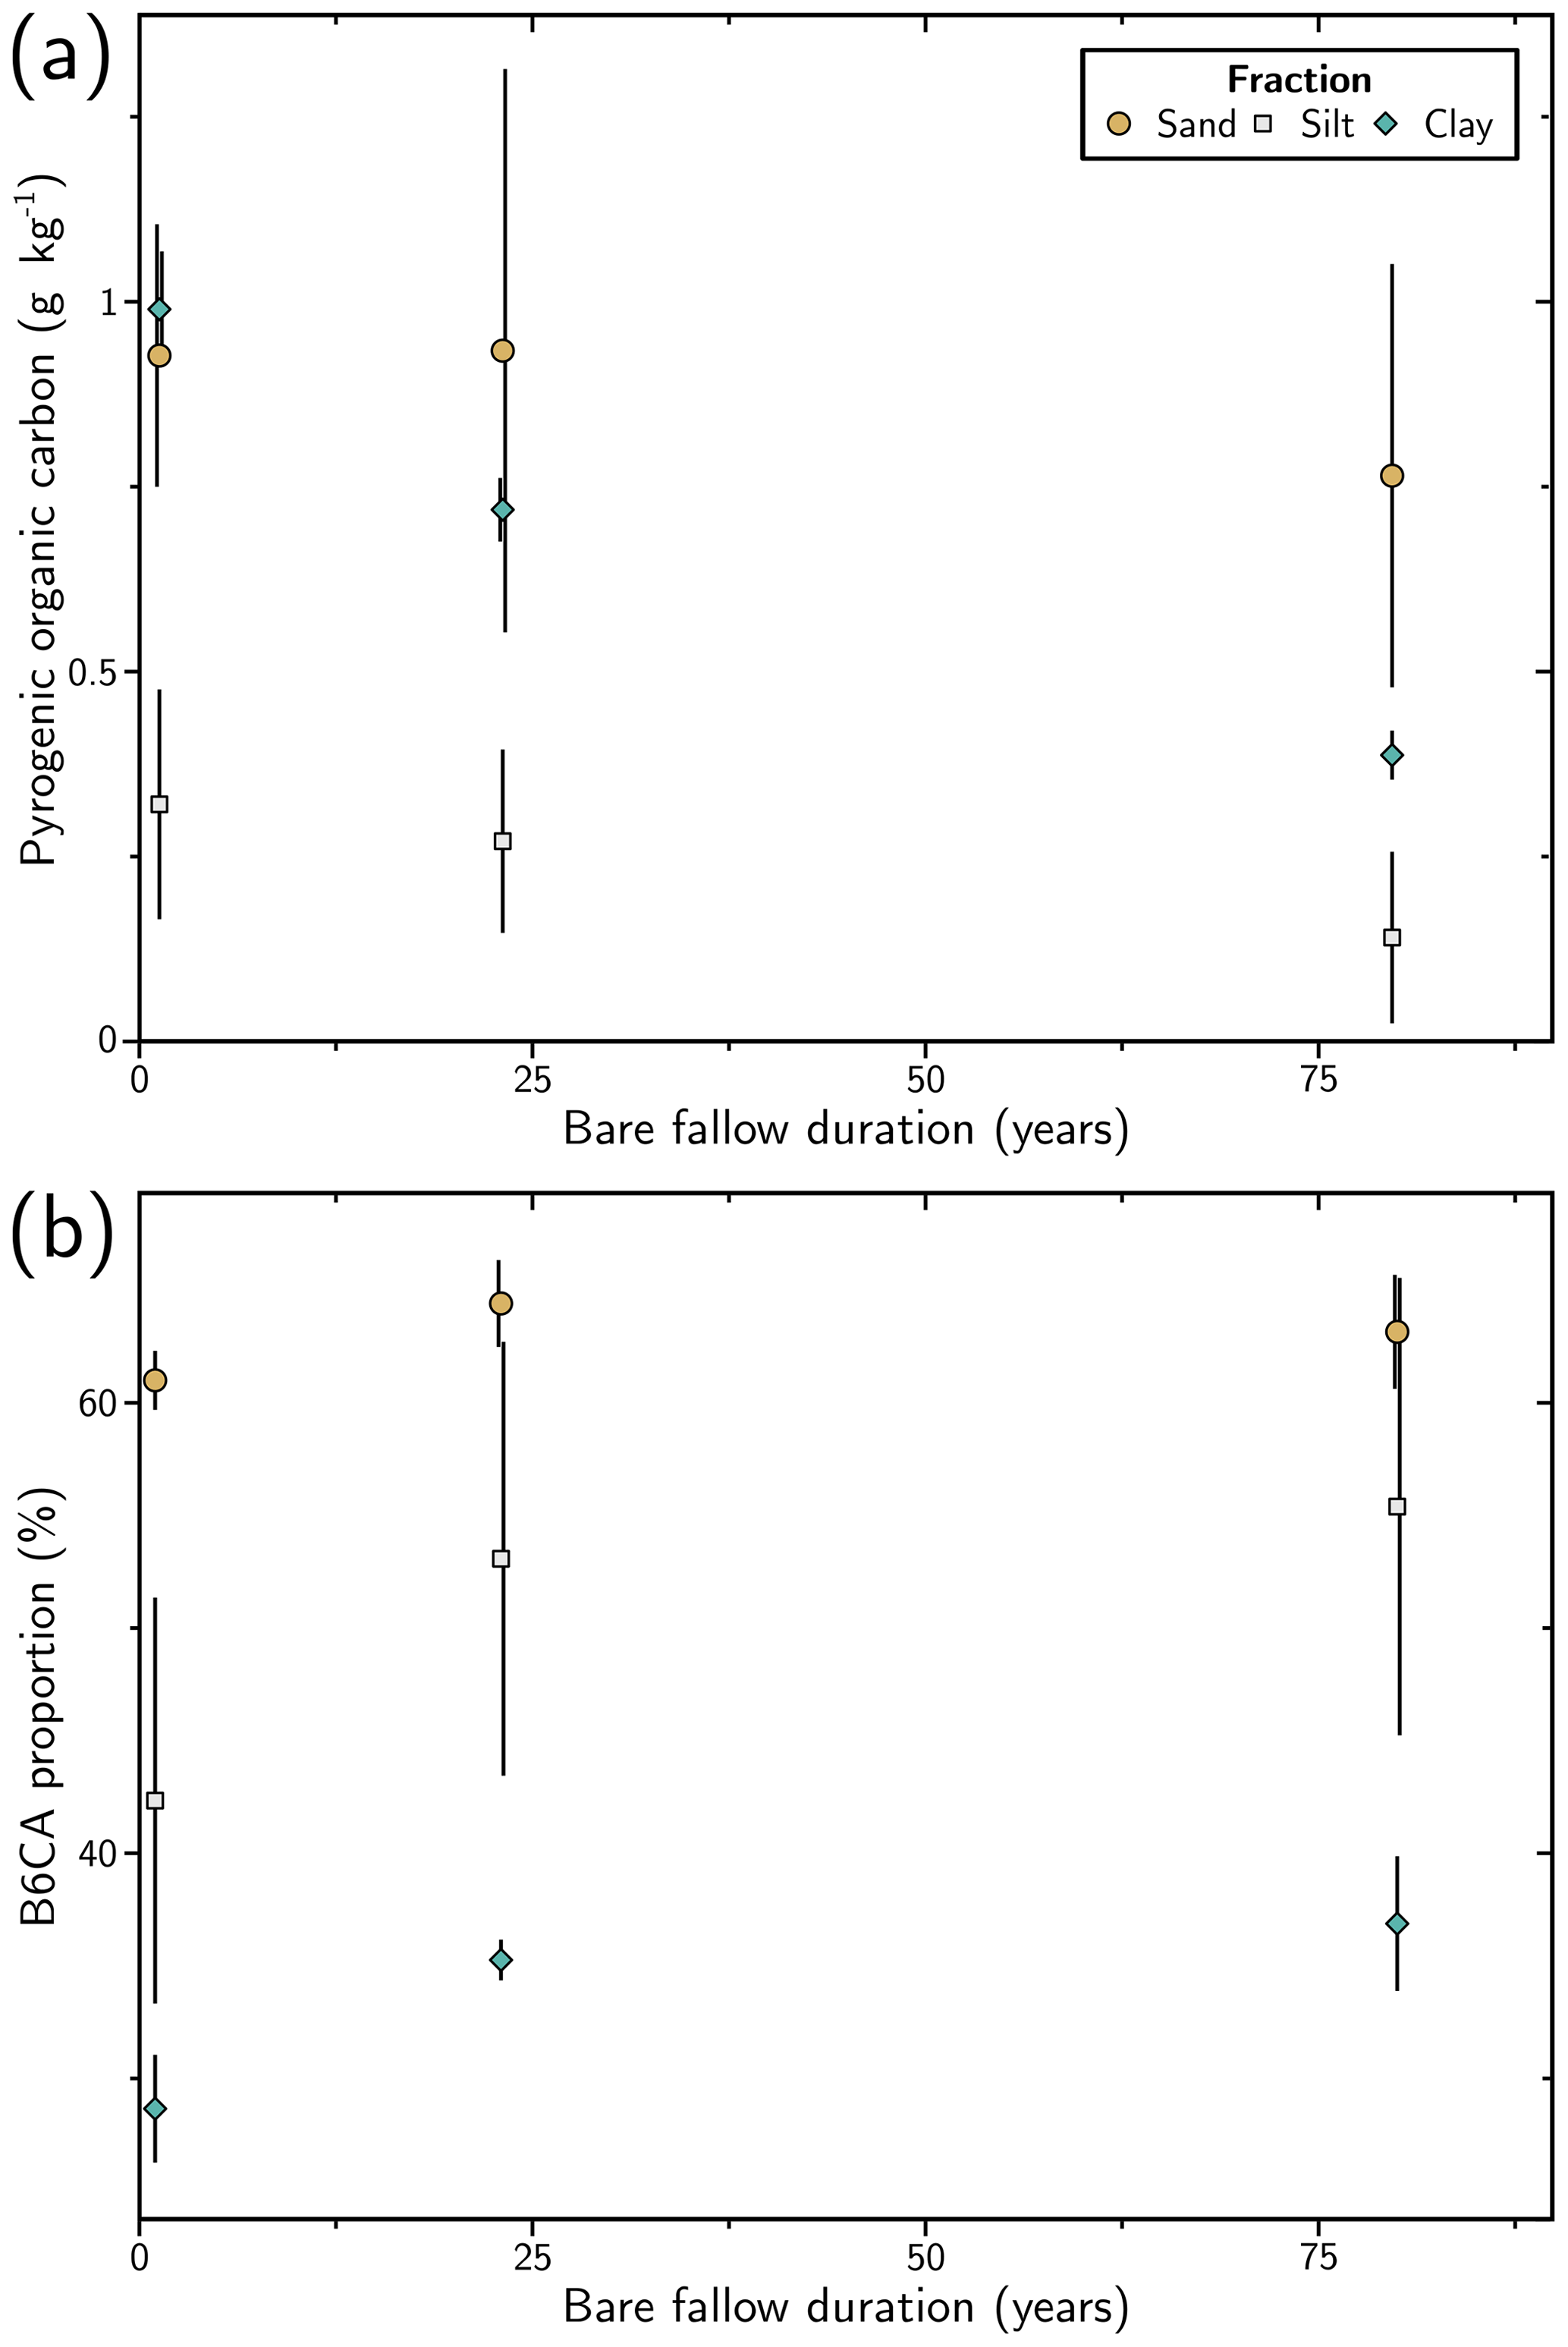
Figure 4Evolution of selected results from benzene polycarboxylic analyses with duration of the long-term bare-fallow experiment for the studied size fractions: (a) pyrogenic organic carbon content; (b) proportion of benzene hexacarboxylic acid (B6CA) molecular marker. The error bars correspond to 2 standard deviations calculated from the four plot replicates.
3.4 Characterization of pyrogenic organic carbon chemistry
The BPCA method yields information about the chemical quality of the material. Isolated size fractions displayed PyOC with contrasted chemical signatures. In the sand fraction, PyOC was the most condensed, with more than 60 % of B6CA. In the clay fraction, PyOC was the less condensed (ca. 35 % of B6CA). In the silt fraction, the condensation was intermediate (ca. (40–55) % of B6CA). In all three fractions, there was a significant evolution over 80 years of LTBF towards more condensed material (paired t test initial/final, p value < 0.05). The relative proportion of BPCA can give an estimate of the burning temperature by comparison with the distribution of BPCA obtained on the reference char material (Wiedemeier et al., 2015). The results obtained indicate burning temperatures exceeding 700 ∘C in the sand fractions. The condensation of PyOC in the clay fraction is characteristic of chars created in the (350–500) ∘C temperature range, while PyOC condensation in the silt fraction corresponds to reference chars from wood and grass produced at charring temperatures around 600 ∘C. However, the chemical quality of the char can also be influenced by the preferential oxidation of B3CAs and B4CAs or the preferential solubilization of B5CA.
Raman spectra obtained on PyOC grains from the sand fraction (Supplement Fig. S5) also reflect the condensation and aromaticity of PyOC, which can be translated into burning temperatures through the paleothermometer developed by Deldicque et al. (2016). The median burning temperature was ca. 710 and ca. 730 ∘C for samples from 1929 and 2008, respectively (Fig. 5). The distribution of burning temperatures shows that high-temperature PyOC grains (> 750 ∘C) were more frequent in the sand fraction from 2008. Half of the PyOC grain population analysed exhibited a burning temperature in the range 610 to 740 ∘C in the sand fraction from 1929, while this range was 590 to 820 ∘C in the sand fraction from 2008.
Different morphologies of PyOC grains were found in the sand fraction (Fig. 6). Nonetheless, mineral grains were often included in PyOC grains and morphological evidence of former plant tissues was common, indicating that they were charcoal. Rare deep black grains may correspond to geological coal (Fig. 6, bottom photographs).
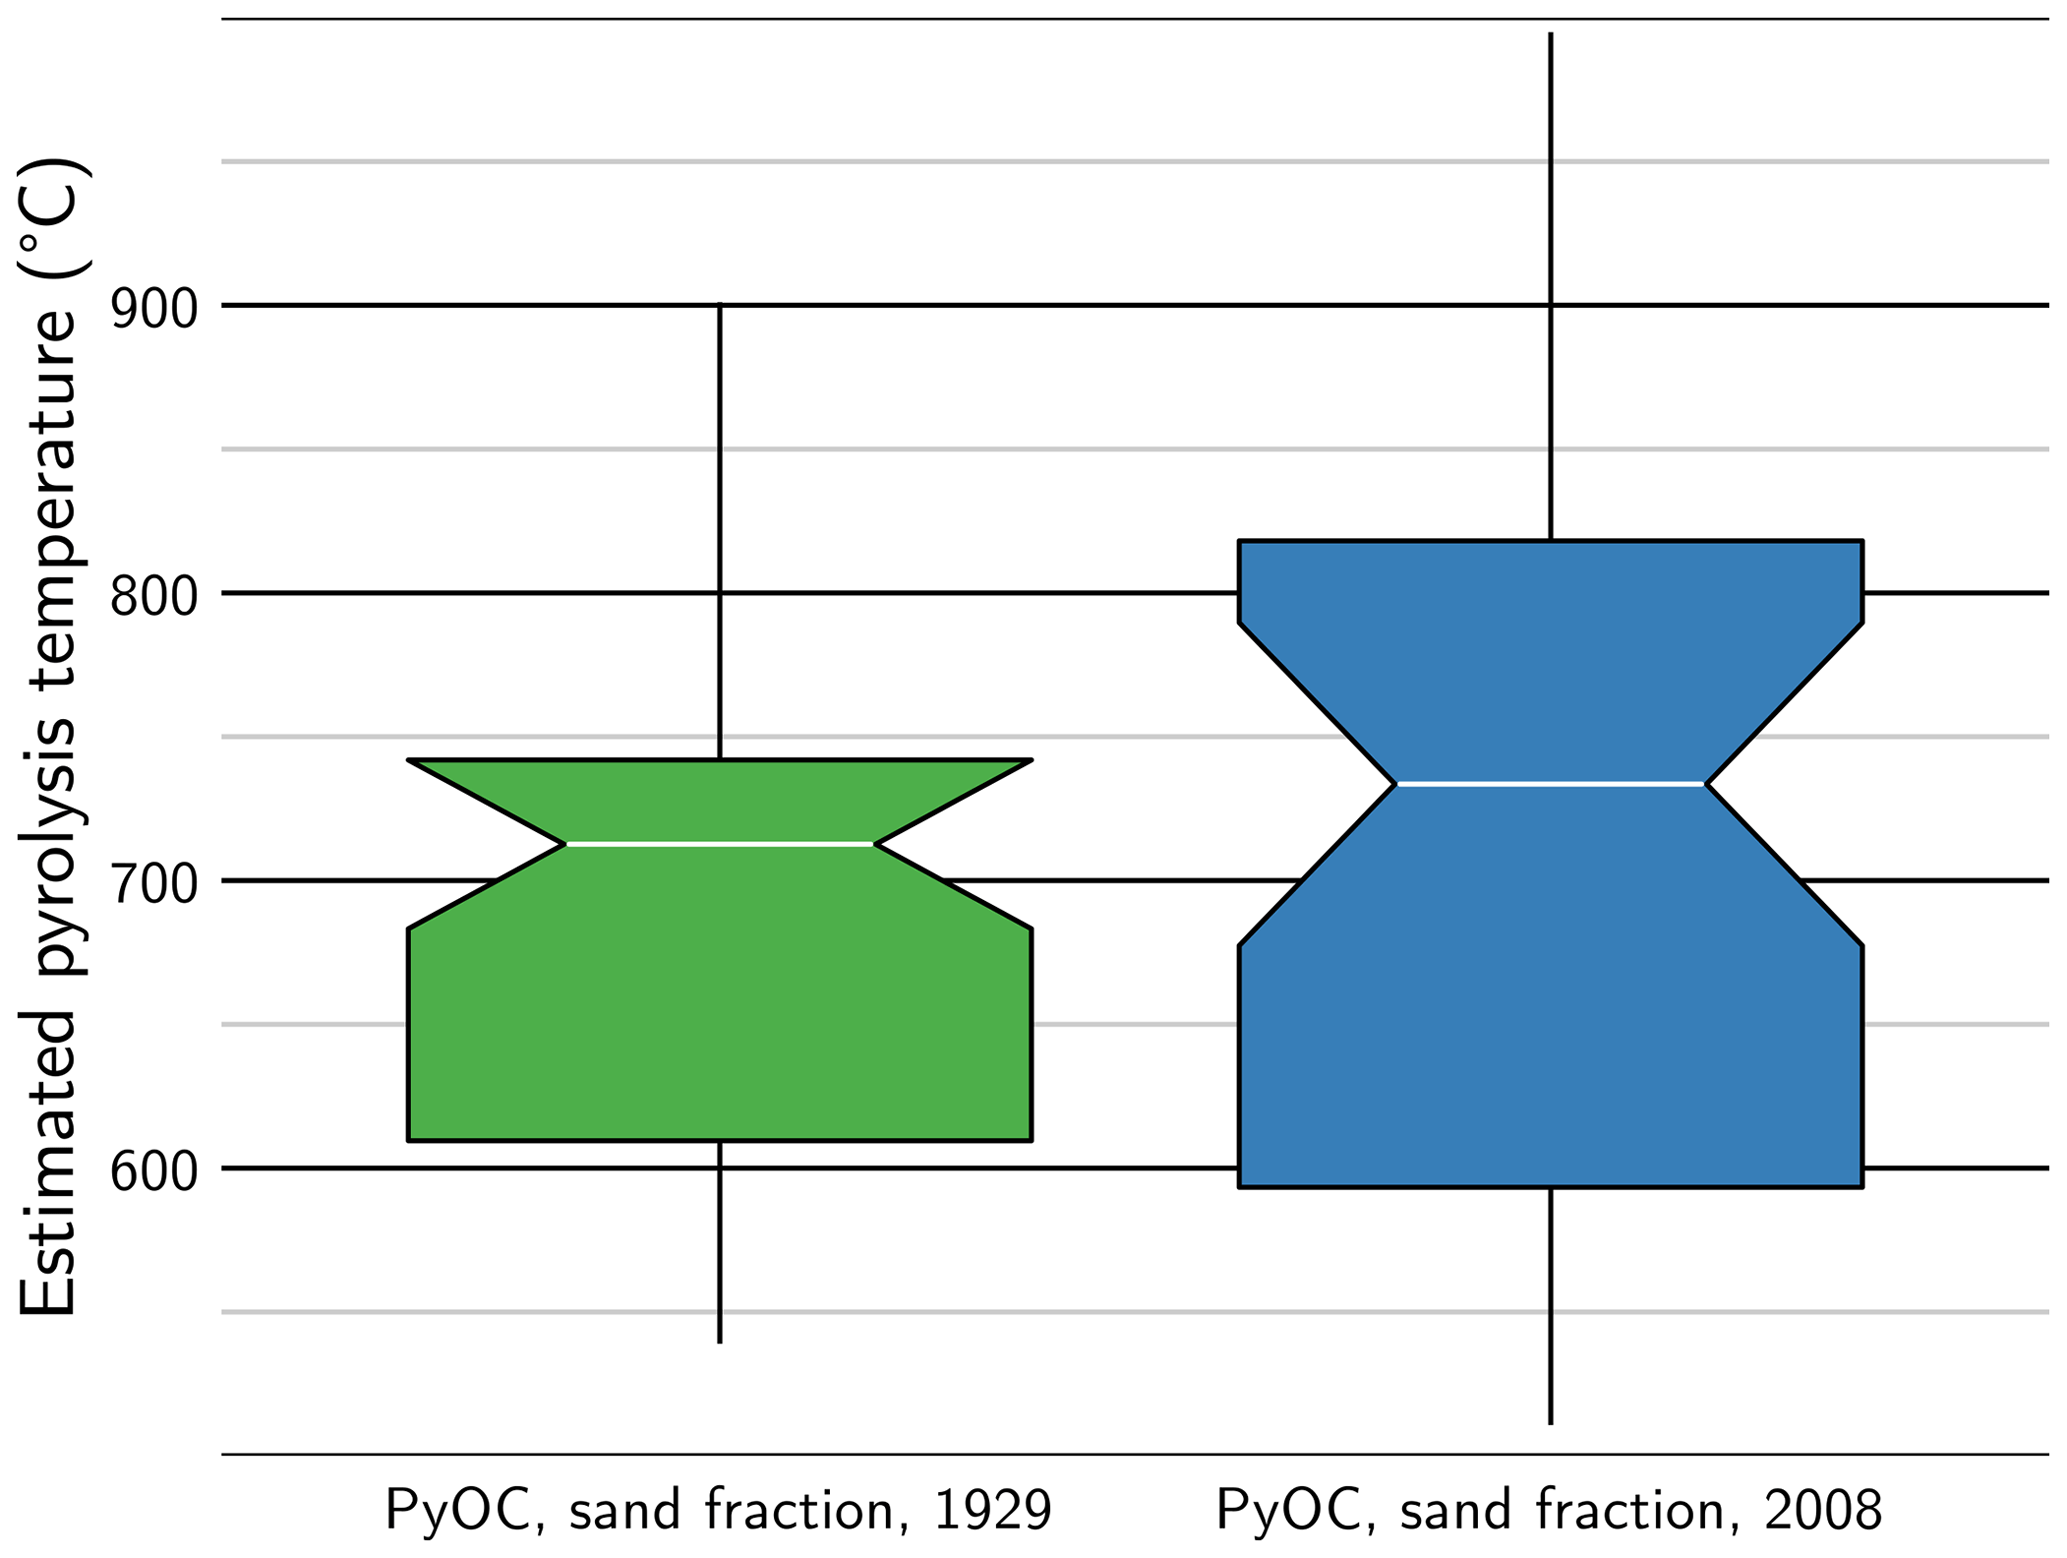
Figure 5Box-and-whisker plot of burning temperature estimated from Raman spectra obtained on individual grains of pyrogenic organic carbon in the sand fraction of long-term bare-fallow soils sampled in 1929 and 2008 (PyOC: pyrogenic organic carbon). The box is limited by the first and third quartiles of the data distribution. The horizontal line represents the median, and the width of the adjacent notches shows the 95 % confidence interval about the median. The “whiskers” represent the last value before the 1.5 times mid-range (the arithmetic mean of maximum and minimum values) beyond the first or third quartile.

Figure 6Optical microscope photographs showing the typical structure and morphology of the PyOC grains analysed by Raman spectroscopy in the sand fraction.
4.1 Distinct organic carbon dynamics between size fractions
On the timescale considered in this LTBF experiment, 80 years, OC can be divided into two pools with distinct residence times in all size fractions: a pool of intermediate OC with residence times ranging from years to several decades and a pool of persistent OC, preserved for more than 100 years (Trumbore, 1997).
4.1.1 The intermediate pool of organic carbon is transferred towards fine fractions
The pool of intermediate OC was distributed between the fractions, explaining that part of the OC decayed in all fractions during the LTBF experiment (Fig. 1). Most of this intermediate OC was present in the fine silt and clay fractions (Fig. 2). In the finest fractions, an input of OC during the first years of the LTBF experiment was observed relative to the decay trend (Fig. 1). No input to the global soil system was observed as OC followed a smooth exponential decay (Barré et al., 2010). Inputs must thus originate from transfers between size fractions. Inputs of OC were notable in the finest fractions (fine silt, clay and clay subfractions) but absent from the coarse fractions (sand and coarse silt), indicating that OC transfer must occur from coarse fractions towards finer ones. The progressive breakdown of OM leads to ever smaller residues (Kögel-Knabner, 2017), which likely explains such transfers. Intermediate OC is preserved for longer periods of time in the finest fractions as shown by the decreasing decay rates estimated with decreasing granulometry (Table 3). Variations in the decay rate of intermediate OC in the different fractions indicate that the speed of OM breakdown depended on its size. Residence time before breakdown spanned from a decade for the coarse OM components to a few decades for the finest OM particles. Breakdown of coarse OM would lead to inputs of new OC with variable chemistry in the clay subfractions. The scattering of the HI and OI values in the clay subfractions during the intermediate years of the LTBF experiment strengthen this idea (Figs. 3b and d).
4.1.2 Most persistent organic carbon is associated with sand- and clay-sized fractions
The proportion of persistent OC in the bulk soil, estimated by addition of the persistent OC in the different fractions, is about 35 % (Fig. 2), in the range expected for similar soils (25 % to 56 %, Cécillon et al., 2018). This proportion corresponds to 5.8 g kg−1, close to the 6.2 g kg−1 of persistent OC estimated for this site (Cécillon et al., 2018) and to the smallest concentration of OC measured in a single plot, 5.5 g kg−1 (Barré et al., 2010). Considering the uncertainties introduced by summing the estimates for each fraction, this demonstrates the consistency of our estimates. Centennially persistent OC was present in all fractions, OC content reaching a plateau after several decades of experiment in the different fractions (Fig. 1). It was not distributed evenly as ca. 75 % of persistent OC was found in the sand and clay fractions, while these fractions only represent ca. 40 wt % of the soil samples. Concentrations of persistent OC and proportion relative to the SOC stock were comparable in these two fractions. Persistent OC in the sand fraction represents ca. 20 % of the SOC stock with a concentration of 9.4 g kg−1 of sand fraction (SD = 0.9 g kg−1). In the clay fraction, persistent OC represents ca. 15 % of the SOC stock with a concentration of 13 g kg−1 of clay fraction (SD = 7 g kg−1). Two major pools of persistent OC can thus be separated from this experiment, a coarse (sand-sized) pool and a fine (clay-sized) one.
4.1.3 Pyrogenic organic carbon exhibits contrasting dynamics between coarse and fine fractions
Size fractionation isolated two pools of PyOC displaying contrasted persistence (Fig. 4a). In the sand fraction, PyOC is centennially persistent as no significant evolution of the absolute PyOC content was observed over time. In the clay fraction, the PyOC content decreased with time and its dynamics were similar to the dynamics of the total OC of the fraction (Fig. 1a). The contrasted persistence of PyOC in the two size fractions led to distinct relative enrichments in PyOC. The relative proportion of PyOC compared to total OC did not change significantly in the clay fraction, while it doubled in the sand fraction over the LTBF experiment. A significant proportion of the coarse pool of persistent OC must thus be constituted of sand-sized PyOC material.
The equivalent persistence of total OC and PyOC in the clay fraction detected in this study contradicts most of the literature stating that PyOC is more persistent than soil OC (Forbes et al., 2006). However, analyses of published data show that PyOC persistence is less than previously expected (Abney and Berhe, 2018). Long-term field-based studies show mean residence times ranging from 90 to 1034 years (Singh et al., 2012). The average MRT for the intermediate OC pool in the clay fraction was estimated at 40 years (SD = 15 years) from this study, and PyOC decrease was following the same trend. Therefore, this study suggests that MRT of the finest PyOC particles may even be shorter than the lowest bulk estimates. These results agree with incubation experiments which demonstrated that pyrogenic material can decrease at similar rates to total OC in the first phases of biodegradation (Hilscher et al., 2009). The balance between centennially persistent coarse PyOC particles and more labile fine PyOC fraction would lead to centennial residence time, consistent with residence times found for natural pyrogenic carbon in field experiments (182 to 541 years, Hammes et al., 2008). This is also consistent with previous studies of PyOC persistence in bulk samples from LTBF showing limited MRT differences with total OC, of the order of the century (Lutfalla et al., 2017).
4.2 Thermo-chemical signature of the persistent organic carbon
4.2.1 Persistent organic carbon hydrogen signature is consistent but oxygen content depends on the fraction
As shown by Barré et al. (2016) for bulk samples, persistent OC has low HI compared to the initial OC in all SOC size fractions (Fig. 3). On the other hand, no clear OI signature of persistent OC in bulk soil samples could be evidenced from LTBF experiments. This may be accounted for by the existence of two persistent OC pools with distinct chemistry. One pool, mainly found in the coarse fraction, has low OI compared to initial OC, while the other, found in the clay fraction, has increased OI. With bare-fallow duration, OI can increase, decrease or remain constant in the bulk soil depending on the relative proportion of these two chemical pools. This also accounts for the stability of the OI in the fine silt fraction, exhibiting mixed contribution from these two pools. This chemical difference is accounted for by the abundance of PyOC in the sand fraction, detected through the BPCA method (Fig. 4) and visible to the naked eye (Fig. 6). The high aromaticity of these chemical compounds, consequently O-poor compared to average soil OM, explains the evolution towards lower OI when the relative PyOC proportion increases with bare-fallow duration. Oxygen-rich OM is degraded, leaving mainly O-poor PyOC (Poot et al., 2009). The inconsistency of this chemical parameter in the presence of PyOC suggests that it could be detected using RE-based procedures.
4.2.2 Persistent organic carbon has high thermal stability
The thermal signature of persistent OC was comparable in all studied soil fractions (Fig. 3). It was characterized by an increased thermal stability compared to the initial pool of OC confirming bulk soil observations (Barré et al., 2016). Despite marked chemical differences between the OM from the different fractions, the established correlation between biogeochemical and thermal stability (Gregorich et al., 2015) remained valid. The variability of thermal parameters was also less than the one of chemical parameters (OIRE6: %RSD = 12 %, HI: %RSD = 9.3 % and T50 CO2 oxidation: %RSD = 1.0 %). This confirms the robustness of OC thermal stability as a proxy of its biogeochemical stability in soils (Cécillon et al., 2018).
4.2.3 Persistent pyrogenic organic carbon is highly condensed
In the sand fraction, the persistence of PyOC was associated with a more condensed form as indicated by the proportion of B6CA consistently higher than in finer fractions (Fig. 4). This high level of PyOC condensation may result from high burning temperatures, exceeding 700 ∘C, as estimated by comparison with reference char materials (Wiedemeier et al., 2015) and confirmed here by Raman spectroscopy (Fig. 5). The abundant and condensed individual pieces of char (Fig. 6) show that the material present in these fractions was probably not created during wildfires, as the temperatures in these natural events rarely exceed 500 ∘C (Turney et al., 2006; Campbell et al., 2007). Nonetheless, mineral inclusions in PyOC grains and the morphological remnants of plant tissues indicate that at least part of the PyOC present in this soil resulted from occupational burning. The presence of material resembling geological coal also suggests that part of the PyOC in the sand fraction could also come from pieces of geological coal used in heating systems.
The clay fraction contained much less condensed PyOC, similar to chars created in the 350 to 500 ∘C temperature range (Wiedemeier et al., 2015). Two hypotheses may explain the observed difference with coarse PyOC. (i) Fine PyOC could correspond to material created through natural burning of biomass (wood and grass), likely to have occurred on this experimental site before the start of the bare-fallow experiment. (ii) The temperature was inhomogeneous during burning, the seat of the fire leaving high-temperature, highly condensed, sand-sized PyOC material, which is persistent and preserved in the sand fraction. Further from the seat of the fire, low-temperature PyOC material, possibly finer or easier to break down, would explain the dominance of low-condensation fine PyOC material in the clay fraction.
Evolution with time of the chemistry of the pyrogenic material was similar in all fractions (Fig. 4b). A consistent evolution of PyOC quality towards more condensed forms was observed. The distribution of burning temperature of sand-sized PyOC was also shifted towards higher temperature between the first and last sampling dates of the LTBF experiment (Fig. 5). It confirmed that high condensation, correlated with high burning temperature, increases PyOC persistence in soil. This result is in line with previous works which find good correlations between PyOC persistence and its degree of condensation (e.g. Singh et al., 2012).
4.3 Inferences on the mechanisms controlling soil organic carbon dynamics
4.3.1 Physical or physico-chemical protection controls organic carbon dynamics in fine fractions
The increasing MRT of intermediate OC with decreasing granulometry of the fractions (Fig. 1a and Table 3) is accounted for by the expected mechanisms of OM preservation demonstrated in a number of studies (e.g. Balesdent et al., 1987; von Lützow et al., 2006). Physical protection results from restricted accessibility of organic matter to decomposers in small pores and aggregates and mainly affects fine-size OM fractions (Balesdent et al., 2000). Physico-chemical protection depends on the establishment of organo-mineral interactions which increases with the specific surface area, greater in the finest soil fractions. In parallel, OC inputs from coarser fractions through the breakdown of OC may also contribute to artificially increase the MRT of the finest fraction. By contrast, in the clay subfractions, the similar proportion and decay of intermediate OC (Fig. 2 and Table 3) indicate that, at first order, no significant difference in the mechanisms involved in OM protection can be evidenced between the clay subfractions.
4.3.2 Chemical recalcitrance controls organic carbon persistence in sand-sized fractions
The second pool of persistent OC present in the sand fraction must result from distinct mechanisms of protection as the specific surface area of coarse particles is small compared to the fine ones. Organo-mineral interaction and physico-chemical protection are thus unlikely to be important in the sand fraction, while the persistent OC content is higher than the one of the clay fraction. Considering the fractionation protocol used in this study (Lutfalla et al., 2018), preserved physical aggregates are smaller than 2 µm (Chenu et al., 2009) and thus absent from the sand fraction. This persistent OC pool must only result from the preservation of highly condensed PyOC. After 80 years of experiment, the PyOC content measured by BPCA only represented 10 % of the OC content of the sand fraction. The BPCA method is known to consistently underestimate the PyOC content (Glaser et al., 1998). It suggests that the conversion factor between “BPCA-PyOC” and “total-PyOC” may be close to 10. This study contradicts previous work which finds that coarse PyOC material disappears more quickly than fine PyOC particles, either because of fragmentation or because of preferential protection of PyOC in micro-aggregates in the finer fractions (e.g. Hilscher and Knicker, 2011). Nonetheless, Nocentini et al. (2010) also found that the smaller PyOC particles were less condensed and more reactive than the coarser ones. This suggests that high-temperature, coarse PyOC material can be resistant to both fragmentation and degradation due to high condensation, possibly combined with peculiar physical properties. Despite not being detected in this study, the apparent persistence of PyOC material in the sand fraction may be reinforced by inputs of pyrogenic material during the bare fallow, as suggested by Lutfalla et al. (2017).
4.3.3 Specific surface area and chemical recalcitrance control pyrogenic organic carbon dynamics
By contrast with this persistent PyOC pool, a low-condensation, intermediate PyOC pool is evidenced in the clay fraction. Different mechanisms can explain the decrease in PyOC content in the clay fraction: biotic degradation, vertical and horizontal transport or erosion and photo-oxidation. Due to twice-yearly tillage, photo-oxidation, impacting PyOC material situated at the soil surface, can occur despite the sampling depth (25 cm) of this study. All plots from the experimental setup of the LTBF experiment were fenced in the late seventies, limiting horizontal losses of OC and more specifically of PyOC by erosion from this date. Earlier horizontal losses can account for PyOC decrease. Vertical transport cannot be excluded either from this setup. Vertical transport should however affect both coarse and fine PyOC particles. The content in sand-sized PyOC particles remaining stable for the duration of the experiment, erosion and transport of PyOC must be limited. In addition, potential losses of PyOC by solubilization are minor compared to biological degradation (Abiven et al., 2011; Maestrini et al., 2014; Schiedung et al., 2020). In general, biological or biotic degradation is demonstrated to be the predominant degradation pathway for PyOC (Santos et al., 2012). The observed loss of PyOC must thus result mainly from biotic processes. Two factors influencing the biodegradability of PyOC must control its persistence in the clay fraction: (i) the size and surface substitution of individual PyOC particles (< 2 µm) which make organo-mineral interactions possible; (ii) the degree of condensation, possibly controlled by the burning temperature of the material, and thus the level of chemical recalcitrance. In the clay fraction, most of the PyOC is found in organo-mineral associations (e.g. Hilscher and Knicker, 2011). Despite being initially hydrophobic, negative surface charges appear quickly on PyOC particles and favour interactions with mineral surfaces protecting it against biodegradation (Vasilyeva et al., 2011). The equivalent total soil OC and PyOC dynamics on a multi-decadal timescale suggests that the protective mechanisms are similar. The contrast of persistence between clay- and sand-sized PyOC material is interpreted as an effect of the lower condensation of finer PyOC particles.
In this temperate soil, we show that two-thirds of the SOC stock is constituted of OC with intermediate residence time, from years to decades, which is progressively transferred towards finer fractions from the breakdown of coarse organic compounds. This suggests that most OC present in the fine fractions is not persistent but in dynamic equilibrium, the outputs of OC due to degradation into carbon dioxide being compensated by input of OC from coarser fractions. Centennially persistent OC can be divided into two pools. A pool present in the coarse fractions, representing 20 % of the SOC stock, was dominated by highly condensed PyOC, with low OI and HI compared to total OC, and was chemically recalcitrant. A second pool present in the fine fractions, representing 15 % of the SOC stock and only 30 % of the total OC initially present in the fine fraction, had low HI and high OI compared to total OC. The presence of a significant PyOC proportion dramatically changes the chemical signature of centennially persistent OC. By contrast, RE thermal parameters are adequate proxies of the biogeochemical stability of OC in soils as the positive relationship between thermal and biogeochemical stability remains valid in the presence of PyOC. Increasing thermal stability of persistent PyOC is also associated with increasing burning temperature and high levels of condensation. This long-term assessment of the dynamics of PyOC in size fractions shows that PyOC is not necessarily more persistent than total SOC on centennial timescales but that its dynamics are controlled by its chemical quality. Further studies on PyOC with contrasted dynamics would help elucidate the properties and mechanisms controlling PyOC persistence in soils.
Data will be made available upon request.
The supplement related to this article is available online at: https://doi.org/10.5194/bg-18-1703-2021-supplement.
MC, SL and PB conceived and designed the study. Sample preparation and analytical work was carried out by MC, SL, FB and SA. All the authors analysed and discussed the data and revised the manuscript, which was written by MC and SL.
The authors declare that they have no conflict of interest.
We thank Florence Savignac for her help in Rock-Eval analyses and Damien Deldicque for his assistance during Raman analyses. We acknowledge INRAE for access to and maintenance of the Versailles 42 plots. We thank Camille Noûs for contributing to the collegial construction of this work.
This work was supported by French state funds managed by the ANR within the Investissements d'Avenir program under reference ANR-11-IDEX-0004-02 and more specifically within the framework of the Cluster of Excellence MATISSE led by Sorbonne Université. The BPCA analyses were funded by the Swiss National Science Foundation (project no. 200021_178768).
This paper was edited by Luo Yu and reviewed by Fan Ding and Lukas Van Zwieten.
Abiven, S., Hengartner, P., Schneider, M. P. W., Singh, N., and Schmidt, M. W. I.: Pyrogenic Carbon Soluble Fraction is Larger and More Aromatic in Aged Charcoal than in Fresh Charcoal, Soil Biol. Biochem., 43, 1615–1617, https://doi.org/10.1016/j.soilbio.2011.03.027, 2011. a
Abney, R. B. and Berhe, A. A.: Pyrogenic Carbon Erosion: Implications for Stock and Persistence of Pyrogenic Carbon in Soil, Front. Earth Sci., 6, 26, https://doi.org/10.3389/feart.2018.00026, 2018. a
Amelung, W., Brodowski, S., Sandhage-Hofmann, A., and Bol, R.: Combining Biomarker with Stable Isotope Analyses for Assessing the Transformation and Turnover of Soil Organic Matter, in: Advances in Agronomy, 100, 155–250, Elsevier Academic Press, Waltham, Mass., USA, https://doi.org/10.1016/S0065-2113(08)00606-8, 2008. a
Angst, G., Heinrich, L., Kögel-Knabner, I., and Mueller, C. W.: The Fate of Cutin and Suberin of Decaying Leaves, Needles and Roots – Inferences from the Initial Decomposition of Bound Fatty Acids, Org. Geochem., 95, 81–92, https://doi.org/10.1016/j.orggeochem.2016.02.006, 2016. a
Balesdent, J., Mariotti, A., and Guillet, B.: Natural 13C Abundance as a Tracer for Studies of Soil Organic Matter Dynamics, Soil Biol. Biochem., 19, 25–30, https://doi.org/10.1016/0038-0717(87)90120-9, 1987. a, b
Balesdent, J., Pétraud, J.-P., and Feller, C.: Some Effects of Ultrasonic Vibrations on Size-Distribution of Soil Organic Matter, Sci. du sol, 29, 95–106, 1991. a, b
Balesdent, J., Besnard, E., Arrouays, D., and Chenu, C.: The Dynamics of Carbon in Particle-Size Fractions of Soil in a Forest-Cultivation Sequence, Plant Soil, 201, 49–57, https://doi.org/10.1023/A:1004337314970, 1998. a
Balesdent, J., Chenu, C., and Balabane, M.: Relationship of Soil Organic Matter Dynamics to Physical Protection and Tillage, Soil Till. Res., 53, 215–230, https://doi.org/10.1016/S0167-1987(99)00107-5, 2000. a, b
Barré, P., Eglin, T., Christensen, B. T., Ciais, P., Houot, S., Kätterer, T., van Oort, F., Peylin, P., Poulton, P. R., Romanenkov, V., and Chenu, C.: Quantifying and isolating stable soil organic carbon using long-term bare fallow experiments, Biogeosciences, 7, 3839–3850, https://doi.org/10.5194/bg-7-3839-2010, 2010. a, b, c, d, e, f
Barré, P., Fernandez-Ugalde, O., Virto, I., Velde, B., and Chenu, C.: Impact of Phyllosilicate Mineralogy on Organic Carbon Stabilization in Soils: Incomplete Knowledge and Exciting Prospects, Geoderma, 235–236, 382–395, https://doi.org/10.1016/j.geoderma.2014.07.029, 2014. a
Barré, P., Plante, A. F., Cécillon, L., Lutfalla, S., Baudin, F., Bernard, S., Christensen, B. T., Eglin, T., Fernandez, J. M., Houot, S., Kätterer, T., Le Guillou, C., Macdonald, A., van Oort, F., and Chenu, C.: The Energetic and Chemical Signatures of Persistent Soil Organic Matter, Biogeochemistry, 130, 1–12, https://doi.org/10.1007/s10533-016-0246-0, 2016. a, b, c, d
Behar, F., Beaumont, V., and De B. Penteado, H. L.: Rock-Eval 6 Technology: Performances and Developments, Oil Gas Sci. Tech., 56, 111–134, https://doi.org/10.2516/ogst:2001013, 2001. a, b, c
Campbell, J., Donato, D., Azuma, D., and Law, B.: Pyrogenic Carbon Emission from a Large Wildfire in Oregon, United States, J. Geophys. Res.-Biogeosci., 112, G04014, https://doi.org/10.1029/2007JG000451, 2007. a
Cécillon, L., Baudin, F., Chenu, C., Houot, S., Jolivet, R., Kätterer, T., Lutfalla, S., Macdonald, A., van Oort, F., Plante, A. F., Savignac, F., Soucémarianadin, L. N., and Barré, P.: A model based on Rock-Eval thermal analysis to quantify the size of the centennially persistent organic carbon pool in temperate soils, Biogeosciences, 15, 2835–2849, https://doi.org/10.5194/bg-15-2835-2018, 2018. a, b, c, d, e
Chenu, C., Virto, I., Plante, A. F., and Elsass, F.: Clay-Size Organo-Mineral Complexes in Temperate Soils: Relative Contributions of Sorptive and Physical Protection, in: Carbon Stabilization by Clays in the Environment: Process and Characterization Methods, edited by: Laird, A. D. and Cervini-Silva, J., vol. 16, of CMS Workshop Lectures, The Clay Minerals Society, Chantilly, Va., United States of America, https://doi.org/10.1346/CMS-WLS-16.6, 120–135, 2009. a, b
Ciais, P., Sabine, C., Bala, G., Bopp, L., Brovkin, V., Canadell, A., Chhabra, A., DeFries, R., Galloway, J., Heimann, M., Jones, C., Le Quéré, C., Myneni, R. B., Piao, S., and Thornton, P.: Carbon and Other Biogeochemical Cycles, in: Climate Change 2013 – The Physical Science Basis: Contribution of Working Group I to the Fifth Assessment Report of the Intergovernmental Panel on Climate Change, edited by: Stocker, T. F., Qin, D., Plattner, G.-K., Tignor, M., Allen, S. K., Boschung, J., Nauels, A., Xia, Y., Bex, V., and Midgley, P. M., Cambridge University Press, Cambridge, United Kingdom and New York, N.Y., USA, 465–570, 2014. a
Coleman, K. and Jenkinson, D. S.: RothC-26.3 – A Model for the Turnover of Carbon in Soil, in: Evaluation of Soil Organic Matter Models, edited by: Powlson, D. S., Smith, P., and Smith, J. U., Springer-Verlag, Berlin, https://doi.org/10.1007/978-3-642-61094-3_17, 283–291,1996. a
Deldicque, D., Rouzaud, J.-N., and Velde, B.: A Raman – HRTEM Study of the Carbonization of Wood: A New Raman-Based Paleothermometer Dedicated to Archaeometry, Carbon, 102, 319–329, https://doi.org/10.1016/j.carbon.2016.02.042, 2016. a, b, c
Disnar, J. R., Guillet, B., Kéravis, D., Di-Giovanni, C., and Sebag, D.: Soil Organic Matter (SOM) Characterization by Rock-Eval Pyrolysis: Scope and Limitations, Org. Geochem., 34, 327–343, https://doi.org/10.1016/S0146-6380(02)00239-5, 2003. a
Don, A., Rödenbeck, C., and Gleixner, G.: Unexpected Control of Soil Carbon Turnover by Soil Carbon Concentration, Environ. Chem. Lett., 11, 407–413, https://doi.org/10.1007/s10311-013-0433-3, 2013. a
Eglin, T., Ciais, P., Piao, S. L., Barré, P., Bellassen, V., Cadule, P., Chenu, C., Gasser, T., Koven, C., Reichstein, M., and Smith, P.: Historical and Future Perspectives of Global Soil Carbon Response to Climate and Land-Use Changes, Tellus B, 62, 700–718, https://doi.org/10.1111/j.1600-0889.2010.00499.x, 2010. a
Espitalié, J., Madec, M., Tissot, B., Mennig, J. J., and Leplat, P.: Source Rock Characterization Method for Petroleum Exploration, in: Offshore Technology Conference, Offshore Technology Conference, Houston, Tex., USA, 1–4 May 1977, OTC-2935-MS, https://doi.org/10.4043/2935-MS, 1977. a
Forbes, M. S., Raison, R. J., and Skjemstad, J. O.: Formation, Transformation and Transport of Black Carbon (Charcoal) in Terrestrial and Aquatic Ecosystems, Sci. Total Environ., 370, 190–206, https://doi.org/10.1016/j.scitotenv.2006.06.007, 2006. a
Glaser, B., Haumaier, L., Guggenberger, G., and Zech, W.: Black Carbon in Soils: the Use of Benzenecarboxylic Acids as Specific Markers, Org. Geochem., 29, 811–819, https://doi.org/10.1016/S0146-6380(98)00194-6, 1998. a, b
Gleixner, G.: Soil Organic Matter Dynamics: a Biological Perspective Derived from the Use of Compound-Specific Isotopes Studies, Ecol. Res., 28, 683–695, https://doi.org/10.1007/s11284-012-1022-9, 2013. a
Gregorich, E. G., Gillespie, A. W., Beare, M. H., Curtin, D., Sanei, H., and Yanni, S. F.: Evaluating Biodegradability of Soil Organic Matter by its Thermal Stability and Chemical Composition, Soil Biol. Biochem., 91, 182–191, https://doi.org/10.1016/j.soilbio.2015.08.032, 2015. a, b
Hammes, K., Torn, M. S., Lapenas, A. G., and Schmidt, M. W. I.: Centennial black carbon turnover observed in a Russian steppe soil, Biogeosciences, 5, 1339–1350, https://doi.org/10.5194/bg-5-1339-2008, 2008. a
Hilscher, A. and Knicker, H.: Degradation of Grass-Derived Pyrogenic Organic Material, Transport of the Residues Within a Soil Column and Distribution in Soil Organic Matter Fractions During a 28 Months Microcosm Experiment, Org. Geochem., 42, 42–54, https://doi.org/10.1016/j.orggeochem.2010.10.005, 2011. a, b
Hilscher, A., Heister, K., Siewert, C., and Knicker, H.: Mineralisation and Structural Changes During the Initial Phase of Microbial Degradation of Pyrogenic Plant Residues in Soil, Org. Geochem., 40, 332–342, https://doi.org/10.1016/j.orggeochem.2008.12.004, 2009. a
IUSS Working Group WRB: World Reference Base for Soil Resources 2014, Update 2015: International Soil Classification System for Naming Soils and Creating Legends for Soil Maps, World Soil Resources Reports No. 106, FAO, Rome, Italy, 2015. a
Keiluweit, M., Nico, P. S., Johnson, M. G., and Kleber, M.: Dynamic Molecular Structure of Plant Biomass-Derived Black Carbon (Biochar), Environ. Sci. Technol., 44, 1247–1253, https://doi.org/10.1021/es9031419, 2010. a
Koch, A., McBratney, A., Adams, M., Field, D., Hill, R., Crawford, J., Minasny, B., Lal, R., Abbott, L., O'Donnell, A., Angers, D., Baldock, J., Barbier, E., Binkley, D., Parton, W., Wall, D. H., Bird, M., Bouma, J., Chenu, C., Flora, C. B., Goulding, K., Grunwald, S., Hempel, J., Jastrow, J., Lehmann, J., Lorenz, K., Morgan, C. L., Rice, C. W., Whitehead, D., Young, I., and Zimmermann, M.: Soil Security: Solving the Global Soil Crisis, Glob. Policy, 4, 434–441, https://doi.org/10.1111/1758-5899.12096, 2013. a
Kögel-Knabner, I.: The Macromolecular Organic Composition of Plant and Microbial Residues as Inputs to Soil Organic Matter: Fourteen Years on, Soil Biol. Biochem., 105, A3–A8, https://doi.org/10.1016/j.soilbio.2016.08.011, 2017. a, b
Lal, R.: Soil Carbon Sequestration Impacts on Global Climate Change and Food Security, Science, 304, 1623–1627, https://doi.org/10.1126/science.1097396, 2004. a
Lehmann, J., Abiven, S., Kleber, M., Pan, G., Singh, B. P., Sohi, S. P., and Zimmermann, A. R.: Persistence of Biochar in Soil, in: Biochar for Environmental Management — Science, Technology and Implementation, edited by: Lehmann, J. and Joseph, S., Routledge, London, United Kingdom, 235–282, 2015. a
Luo, Y., Ahlström, A., Allison, S. D., Batjes, N. H., Brovkin, V., Carvalhais, N., Chappell, A., Ciais, P., Davidson, E. A., Finzi, A., Georgiou, K., Guenet, B., Hararuk, O., Harden, J. W., He, Y., Hopkins, F., Jiang, L., Koven, C., Jackson, R. B., Jones, C. D., Lara, M. J., Liang, J., McGuire, A. D., Parton, W., Peng, C., Randerson, J. T., Salazar, A., Sierra, C. A., Smith, M. J., Tian, H., Todd-Brown, K. E. O., Torn, M. S., van Groenigen, K. J., Wang, Y. P., West, T. O., Wei, Y., Wieder, W. R., Xia, J., Xu, X., Xu, X., and Zhou, T.: Toward More Realistic Projections of Soil Carbon Dynamics by Earth System Models, Global Biogeochem. Cy., 30, 40–56, https://doi.org/10.1002/2015GB005239, 2016. a
Lutfalla, S., Abiven, S., Barré, P., Wiedemeier, D. B., Christensen, B. T., Houot, S., Kätterer, T., Macdonald, A. J., van Oort, F., and Chenu, C.: Pyrogenic Carbon Lacks Long-Term Persistence in Temperate Arable Soils, Front. Earth Sci., 5, 96, https://doi.org/10.3389/feart.2017.00096, 2017. a, b, c, d, e
Lutfalla, S., Barré, P., Bernard, S., Le Guillou, C., Alléon, J., and Chenu, C.: Multidecadal persistence of organic matter in soils: multiscale investigations down to the submicron scale, Biogeosciences, 16, 1401–1410, https://doi.org/10.5194/bg-16-1401-2019, 2019. a, b, c, d
Maestrini, B., Abiven, S., Singh, N., Bird, J., Torn, M. S., and Schmidt, M. W. I.: Carbon losses from pyrolysed and original wood in a forest soil under natural and increased N deposition, Biogeosciences, 11, 5199–5213, https://doi.org/10.5194/bg-11-5199-2014, 2014. a
Manzoni, S., Trofymow, J. A., Jackson, R. B., and Porporato, A.: Stoichiometric Controls on Carbon, Nitrogen, and Phosphorus Dynamics in Decomposing Litter, Ecol. Monographs, 80, 89–106, https://doi.org/10.1890/09-0179.1, 2010. a
Mikutta, R. and Kaiser, K.: Organic Matter Bound to Mineral Surfaces: Resistance to Chemical and Biological Oxidation, Soil Biol. Biochem., 43, 1738–1741, https://doi.org/10.1016/j.soilbio.2011.04.012, 2011. a
Nocentini, C., Certini, G., Knicker, H., Francioso, O., and Rumpel, C.: Nature and Reactivity of Charcoal Produced and Added to Soil During Wildfire Are Particle-Size Dependent, Org. Geochem., 41, 682–689, https://doi.org/10.1016/j.orggeochem.2010.03.010, 2010. a
Parton, W. J., Schimel, D. S., Cole, C. V., and Ojima, D. S.: Analysis of Factors Controlling Soil Organic Matter Levels in Great Plains Grasslands, Soil Sci. Soc. Am. J., 51, 1173, https://doi.org/10.2136/sssaj1987.03615995005100050015x, 1987. a
Plante, A. F., Pernes, M., and Chenu, C.: Changes in Clay-Associated Organic Matter Quality in a C Depletion Sequence as Measured by Differential Thermal Analyses, Geoderma, 129, 186–199, https://doi.org/10.1016/j.geoderma.2004.12.043, 2005. a
Poeplau, C., Don, A., Six, J., Kaiser, M., Benbi, D., Chenu, C., Cotrufo, M. F., Derrien, D., Gioacchini, P., Grand, S., Gregorich, E., Griepentrog, M., Gunina, A., Haddix, M., Kuzyakov, Y., Kühnel, A., Macdonald, L. M., Soong, J., Trigalet, S., Vermeire, M.-L., Rovira, P., van Wesemael, B., Wiesmeier, M., Yeasmin, S., Yevdokimov, I., and Nieder, R.: Isolating Organic Carbon Fractions with Varying Turnover Rates in Temperate Agricultural Soils – A Comprehensive Method Comparison, Soil Biol. Biochem., 125, 10–26, https://doi.org/10.1016/j.soilbio.2018.06.025, 2018. a
Poot, A., Quik, J. T. K., Veld, H., and Koelmans, A. A.: Quantification Methods of Black Carbon: Comparison of Rock-Eval Analysis with Traditional Methods, J. Chromatogr. A, 1216, 613–622, https://doi.org/10.1016/j.chroma.2008.08.011, 2009. a
Reisser, M., Purves, R. S., Schmidt, M. W. I., and Abiven, S.: Pyrogenic Carbon in Soils: A Literature-Based Inventory and a Global Estimation of Its Content in Soil Organic Carbon and Stocks, Front. Earth Sci., 4, 80, https://doi.org/10.3389/feart.2016.00080, 2016. a
Saenger, A., Cécillon, L., Sebag, D., and Brun, J.-J.: Soil Organic Carbon Quantity, Chemistry and Thermal Stability in a Mountainous Landscape: A Rock – Eval Pyrolysis Survey, Org. Geochem., 54, 101–114, https://doi.org/10.1016/j.orggeochem.2012.10.008, 2013. a
Santos, F., Torn, M. S., and Bird, J. A.: Biological Degradation of Pyrogenic Organic Matter in Temperate Forest Soils, Soil Biol. Biochem., 51, 115–124, https://doi.org/10.1016/j.soilbio.2012.04.005, 2012. a
Schiedung, M., Bellè, S.-L., Sigmund, G., Kalbitz, K., and Abiven, S.: Vertical mobility of pyrogenic organic matter in soils: a column experiment, Biogeosciences, 17, 6457–6474, https://doi.org/10.5194/bg-17-6457-2020, 2020. a
Schmidt, M. W. I., Torn, M. S., Abiven, S., Dittmar, T., Guggenberger, G., Janssens, I. A., Kleber, M., Kögel-Knabner, I., Lehmann, J., Manning, D. A. C., Nannipieri, P., Rasse, D. P., Weiner, S., and Trumbore, S. E.: Persistence of Soil Organic Matter as an Ecosystem Property, Nature, 478, 49–56, https://doi.org/10.1038/nature10386, 2011. a, b
Singh, B. P., Cowie, A. L., and Smernik, R. J.: Biochar Carbon Stability in a Clayey Soil As a Function of Feedstock and Pyrolysis Temperature, Environ. Sci. Technol., 46, 11770–11778, https://doi.org/10.1021/es302545b, 2012. a, b, c
Sollins, P., Homann, P., and Caldwell, B. A.: Stabilization and Destabilization of Soil Organic Matter: Mechanisms and Controls, Geoderma, 74, 65–105, https://doi.org/10.1016/S0016-7061(96)00036-5, 1996. a
Soucémarianadin, L., Cécillon, L., Chenu, C., Baudin, F., Nicolas, M., Girardin, C., and Barré, P.: Is Rock-Eval 6 Thermal Analysis a Good Indicator of Soil Organic Carbon Lability? – A Method-Comparison Study in Forest Soils, Soil Biol. Biochem., 117, 108–116, https://doi.org/10.1016/j.soilbio.2017.10.025, 2018. a
Spokas, K. A.: Review of the Stability of Biochar in Soils: Predictability of O:C Molar Ratios, Carbon Manage., 1, 289–303, https://doi.org/10.4155/cmt.10.32, 2010. a
Todd-Brown, K. E. O., Randerson, J. T., Post, W. M., Hoffman, F. M., Tarnocai, C., Schuur, E. A. G., and Allison, S. D.: Causes of variation in soil carbon simulations from CMIP5 Earth system models and comparison with observations, Biogeosciences, 10, 1717–1736, https://doi.org/10.5194/bg-10-1717-2013, 2013. a
Trumbore, S. E.: Potential Responses of Soil Organic Carbon to Global Environmental Change, P. Natl. Acad. Sci. USA, 94, 8284–8291, https://doi.org/10.1073/pnas.94.16.8284, 1997. a
Trumbore, S. E.: Age of Soil Organic Matter and Soil Respiration: Radiocarbon Constraints on Belowground C Dynamics, Ecol. Appl., 10, 399–411, https://doi.org/10.1890/1051-0761(2000)010[0399:AOSOMA]2.0.CO;2, 2000. a
Turney, C. S. M., Wheeler, D., and Chivas, A. R.: Carbon Isotope Fractionation in Wood During Carbonization, Geochim. Cosmochim. Ac., 70, 960–964, https://doi.org/10.1016/j.gca.2005.10.031, 2006. a
Vasilyeva, N. A., Abiven, S., Milanovskiy, E. Y., Hilf, M., Rizhkov, O. V., and Schmidt, M. W. I.: Pyrogenic Carbon Quantity and Quality Unchanged after 55 Years of Organic Matter Depletion in a Chernozem, Soil Biol. Biochem., 43, 1985–1988, https://doi.org/10.1016/j.soilbio.2011.05.015, 2011. a
von Lützow, M., Kögel-Knabner, I., Ekschmitt, K., Matzner, E., Guggenberger, G., Marschner, B., and Flessa, H.: Stabilization of Organic Matter in Temperate Soils: Mechanisms and their Relevance Under Different Soil Conditions – a Review, Eur. J. Soil Sci., 57, 426–445, https://doi.org/10.1111/j.1365-2389.2006.00809.x, 2006. a, b
von Lützow, M., Kögel-Knabner, I., Ekschmitt, K., Flessa, H., Guggenberger, G., Matzner, E., and Marschner, B.: SOM Fractionation Methods: Relevance to Functional Pools and to Stabilization Mechanisms, Soil Biol. Biochem., 39, 2183–2207, https://doi.org/10.1016/j.soilbio.2007.03.007, 2007. a
Wiedemeier, D. B., Abiven, S., Hockaday, W. C., Keiluweit, M., Kleber, M., Masiello, C. A., McBeath, A. V., Nico, P. S., Pyle, L. A., Schneider, M. P. W., Smernik, R. J., Wiesenberg, G. L. B., and Schmidt, M. W. I.: Aromaticity and Degree of Aromatic Condensation of Char, Org. Geochem., 78, 135–143, https://doi.org/10.1016/j.orggeochem.2014.10.002, 2015. a, b, c, d, e, f
Zimmerman, A. R.: Abiotic and Microbial Oxidation of Laboratory-Produced Black Carbon (Biochar), Environ. Sci. Technol., 44, 1295–1301, https://doi.org/10.1021/es903140c, 2010. a