the Creative Commons Attribution 4.0 License.
the Creative Commons Attribution 4.0 License.
 | 16 Mar 2021
Characterizing the origins of dissolved organic carbon in coastal seawater using stable carbon isotope and light absorption characteristics
Heejun Han
Jeomshik Hwang
In order to determine the origins of dissolved organic matter (DOM) occurring in the seawater of Sihwa Lake, we measured the stable carbon isotope ratios of dissolved organic carbon (DOC-δ13C) and the optical properties (absorbance and fluorescence) of DOM in two different seasons (March 2017 and September 2018). Sihwa Lake is enclosed by a dike along the western coast of South Korea, and the water is exchanged with the Yellow Sea twice a day through the sluice gates. The DOC concentrations were generally higher in lower-salinity waters in both periods, and excess of DOC was also observed in 2017 in high-salinity waters. Here, the excess DOC represents any DOC concentrations higher than those in the incoming open-ocean seawater. The excess DOC occurring in the lower-salinity waters originated mainly from marine sediments of tidal flats, based on the DOC-δ13C values ( ‰) and good correlations among the DOC, humic-like fluorescent DOM (FDOMH), and concentrations. However, the origins of the excess DOC observed in 2017 appear to be from two different sources: one mainly from marine sources such as biological production based on the DOC-δ13C values (−19.1 ‰ to −20.5 ‰) and the other mainly from terrestrial sources by land–seawater interactions based on its depleted DOC-δ13C values (−21.5 ‰ to −27.8 ‰). This terrestrial DOM source observed in 2017 was likely associated with DOM on the reclaimed land, which experienced extended exposure to light and bacterial degradation as indicated by the higher spectral slope ratio (SR) of light absorbance and no concurrent increases in the FDOMH and concentrations. Our study demonstrates that the combination of these biogeochemical tools can be a powerful tracer of DOM sources and characteristics in coastal environments.
- Article
(3011 KB) - Full-text XML
-
Supplement
(1800 KB) - BibTeX
- EndNote


Dissolved organic carbon (DOC), a major component of dissolved organic matter (DOM), is the largest reduced carbon pool in the ocean (Benner et al., 1992; Raymond and Spencer, 2015). DOC plays a significant role in coastal carbon dynamics and biogeochemical cycles, and thus it is important to understand the sources and characteristics of DOC (Vetter et al., 2007; Carson and Hansell, 2015). In the coastal ocean, DOM sources include (1) in situ biological production (Carlson and Hansell, 2015), (2) terrestrial organic matter such as soils and plant matters (Opsahl and Benner, 1997; Bauer and Bianchi, 2011), and (3) anthropogenic sources such as industrial and agricultural wastewaters (Tedetti et al., 2010; Griffith and Raymond, 2011).
A part of DOM is known as colored dissolved organic matter (CDOM), which is the light-absorbing fraction of organic matter (Coble, 2007; Kim and Kim, 2016, 2018). The major fraction of CDOM, which emits fluorescence after absorbing light energy, is referred to as fluorescent DOM (FDOM) (Coble, 1996, 2007; Kim and Kim, 2016). Rivers are known as the major source of the humic-like FDOM (FDOMH) in the coastal ocean (Stedmon and Nelson, 2015; Kim and Kim, 2016), while aerobic microbial remineralization of sinking organic matter is the major source of FDOMH in the deep sea (Jørgensen et al., 2011; Catalá et al., 2015; Kim and Kim, 2016). On the other hand, Kim and Kim (2016) reported that anaerobic production in the bottom sediment of the deep East Sea (Japan Sea) accounted for approximately 10 % of the total production of FDOMH in the deep-water column. Recently, the anaerobic process in the bottom sediment of coastal oceans was also suggested as an important source of FDOMH (Kim and Kim, 2018).
In order to decipher the sources of FDOMH and DOC in coastal waters, various approaches including optical properties and stable carbon isotope ratios (δ13C) have been developed. The humic-like component and protein-like component of FDOM were identified based on an excitation-emission matrix (EEM) spectroscopy method combined with a parallel factor analysis (PARAFAC) model (Bro, 1997; Coble, 2007; Kim and Kim, 2016, 2018). The molecular weight and photochemical processes of DOM were characterized by the absorption spectra and spectral parameters of CDOM. For example, the absorption spectral slope ratio (SR) negatively correlates with the DOM molecular weight and increases upon irradiation (Helms et al., 2008; Hansen et al., 2016). The stable carbon isotopic composition of DOC (DOC-δ13C) has been used to differentiate terrestrial versus marine DOC (Gearing, 1988; Wang et al., 2004; Lee and Kim, 2018; Lee et al., 2020). In general, δ13C values of terrestrial sources such as C3 and C4 plants range from −23 ‰ to −34 ‰ and −9 ‰ to −17 ‰, respectively, while those derived from marine phytoplankton range from −18 ‰ to −22 ‰ (Gearing, 1988).
In this study, we used DOC-δ13C, FDOM, and SR values together to characterize different sources of DOM in Sihwa Lake, South Korea, one of the most dynamic coastal settings in terms of salinity changes, hypoxia, metal pollution, and eutrophication (Kim et al., 2009; Ra et al., 2011; Lee et al., 2014, 2017; Kim and Kim, 2014, 2018).
2.1 Study area and sampling
Sihwa Lake (126.6∘ E; 37.3∘ N) is located on the western coast of South Korea, with an area of 57 km2 and an average depth of 3.2 m (maximum depth: 18 m). This lake was originally constructed as a land reclamation project planned by the government to provide agricultural land and water for the nearby metropolitan area during the 1980s and 1990s (Bae et al., 2010) (Fig. 1). Freshwater runs through six small streams into the lake, and four waterways connect the lake to the Banwol industrial complex (Fig. 1). Because the lake experienced serious deterioration of its water quality owing to wastewater discharges from industrial complexes under limited water circulation, sluice gates were constructed and opened twice a day for water exchanges between the lake and the Yellow Sea since 2012. The dike is currently used as a tidal power plant (Lee et al., 2017) (Fig. 1). The total volume of Sihwa Lake water is m3. The water exchange rate is approximately 3.4×10⁸ m3 yr−1, enough to replace the entire reservoir in a year (Lee et al., 2003, 2014).
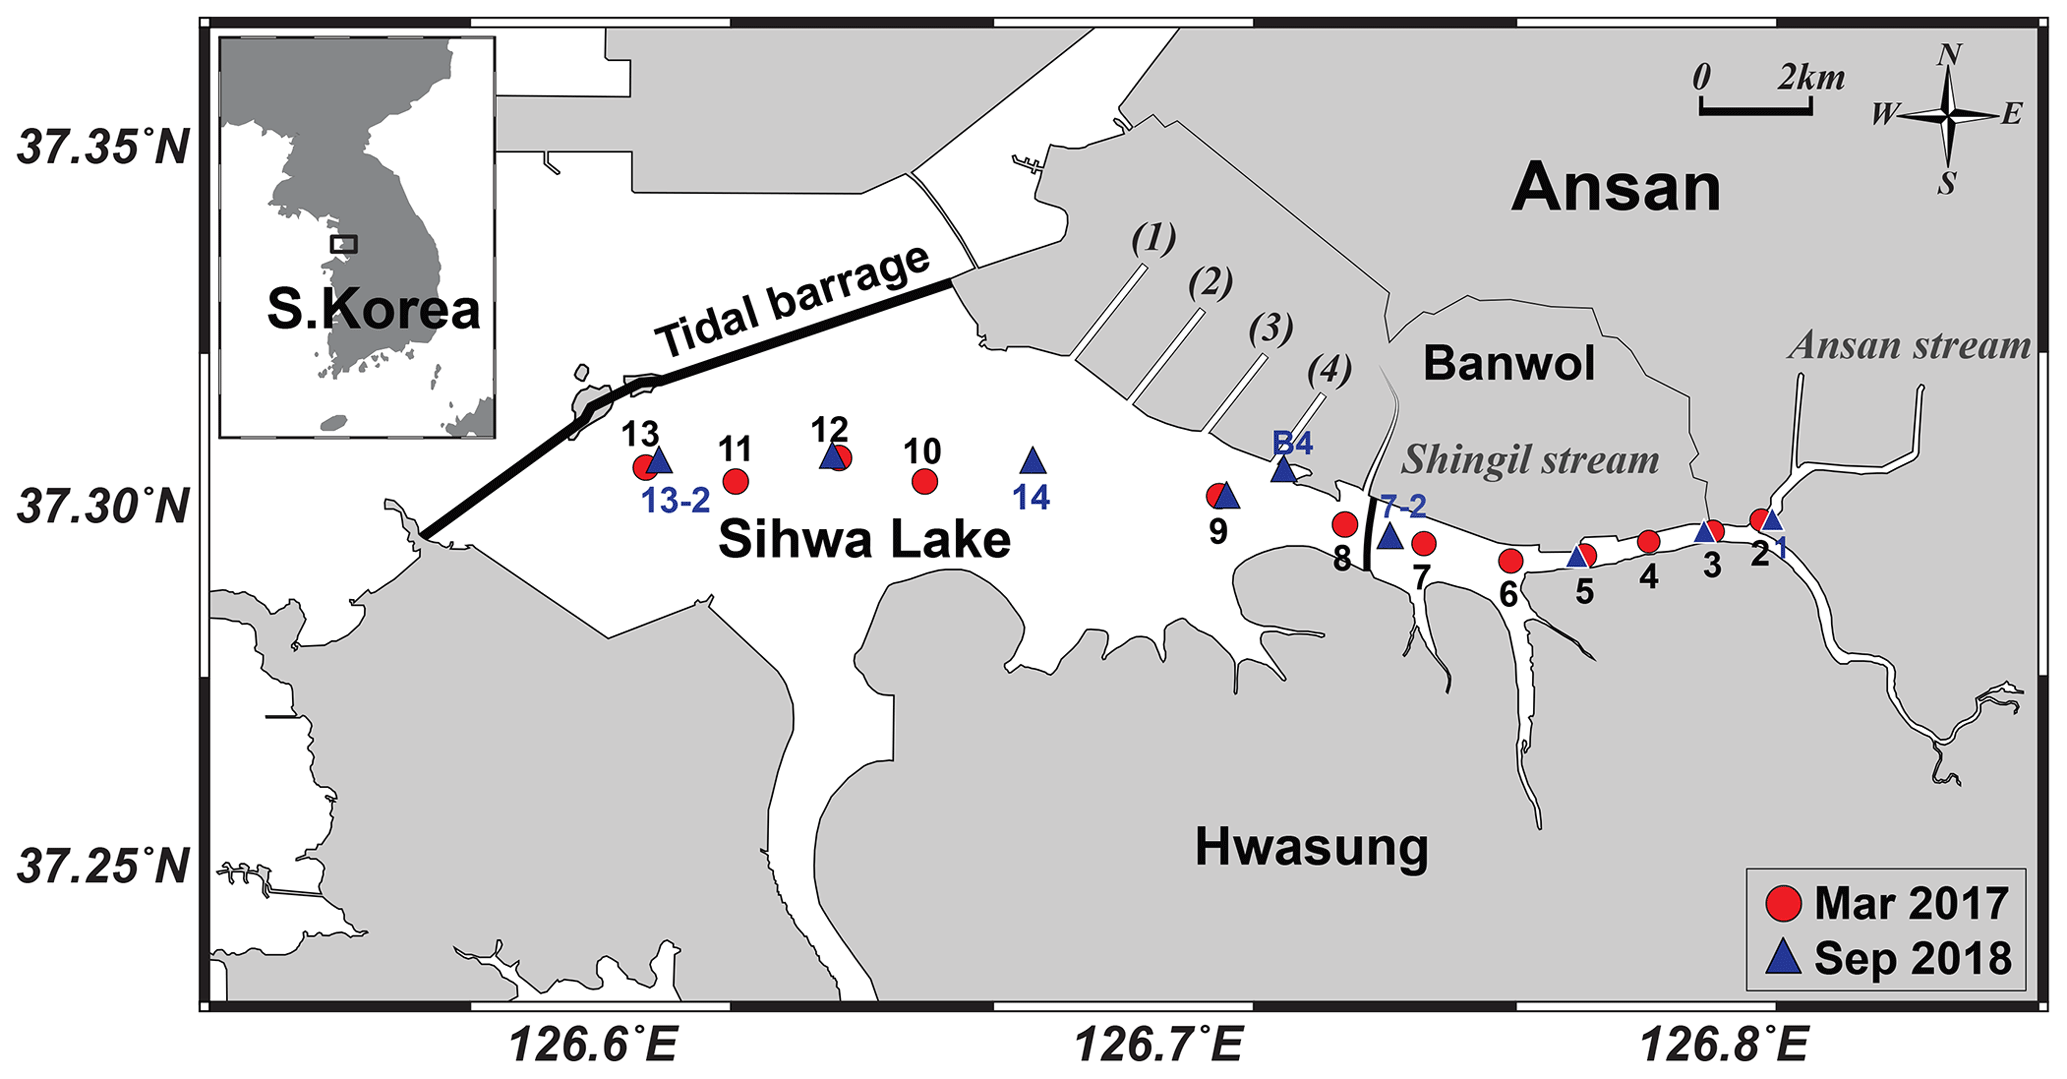
Figure 1Map of sampling stations in Sihwa Lake, South Korea.
Water samples for the entire water column were collected on board a ship (∼1 t) in March 2017 and September 2018. In 2018, only surface water samples were collected at shallow stations (station numbers 1–6) as the water level of the reservoir was lower than in 2017. In order to investigate the effect of wastewater from the industrial complex, an additional sample was collected near the Banwol waterway (station B4) in 2018 (Fig. 1). The temperature and salinity were measured using a conductivity–temperature–depth (CTD) instrument (Ocean Seven 304, Idronaut Srl).
The water samples were filtered through a pre-combusted (450 ∘C for 5 h) GF/F filter (pore size: 0.7 µm; Whatman). The samples for the DOC and DOC-δ13C analyses were acidified with 6 M HCl (to a final sample pH of ∼2) to avoid any bacterial activity and were stored in pre-combusted glass ampoules (Kim and Kim, 2010). Samples for the FDOM analysis were stored in pre-combusted amber vials in a refrigerator at 4 ∘C. Samples for the dissolved inorganic nutrient analysis were stored frozen in polypropylene conical tubes.
2.2 Chemical analyses
Inorganic nutrient concentrations were measured using a nutrient auto-analyzer (New QuAAtro39, SEAL analytical). The analytical uncertainties were <5 % for the reference materials for nutrients in seawater (KANSO CO., LTD). The dissolved oxygen (DO) concentration was determined using Winkler's method (Carpenter, 1965). The DOC concentration was measured using a high-temperature catalytic oxidation (HTCO) method using a total organic carbon (TOC) analyzer (TOC-VCPH, Shimadzu) (Kim and Kim, 2010). The accuracy of the DOC measurements was ±2 µmol L−1 for the reference material of deep seawater (DSR; ∼43 µmol L−1 DOC; University of Miami) (Hansell, 2005). The DOC-δ13C values were measured using an isotope ratio mass spectrometer (IRMS; Isoprime, Elementar) connected to a TOC analyzer (Vario TOC cube, Elementar) (Panetta et al., 2008; Troyer et al., 2010). The DOC-δ13C values were in very good agreement, within <5 %, with the reported values of the reference materials: IAEA-CH6 sucrose ( ‰), Suwannee River fulvic acid (SRFA; ‰; International Humic Substances Society), and DSR (University of Miami) as reported by Lang et al. (2007) ( ‰) and Panetta et al. (2008) ( ‰).
2.3 Optical measurements
Fluorescence and absorbance spectra of the samples were measured using a spectrophotometer (Aqualog, Horiba). For the FDOM analysis, the emission and excitation wavelength ranges were set from 240 to 600 and from 250 to 500 nm, respectively, with 3 nm scanning intervals. The PARAFAC analysis for the EEM data was conducted using the Solo software (Eigenvector, 108 Inc.) (Han et al., 2020). The Raman and Rayleigh scattering signals, inner-filter effect, and blank subtraction were corrected with Milli-Q water (18.2 MΩ cm) using the Solo software (Bro, 1997; Zepp et al., 2004; Stedmon and Bro, 2008; Han et al., 2020). The PARAFAC results were validated by a split-half analysis and random initialization (Stedmon and Bro, 2008). The fluorescence intensities of FDOM were normalized with the Raman peak area of water and were presented in Raman units (RU) (Lawaetz and Stedmon, 2009).
The PARAFAC model characterized one marine humic-like, one protein-like, and two terrestrial humic-like fluorescent components in Sihwa Lake, which are consistent with those of a previous study (Kim and Kim, 2018) (Fig. S1 in the Supplement). The spectral shapes of the fluorescent components were compared with those in other results in the OpenFluor database (https://openfluor.lablicate.com, last access: 10 September 2020) (Murphy et al., 2014). All components (C1 to C4) were matched with the major components from 36, 39, 62, and 19 studies, respectively, with similarity scores of 95 %. The spectral characteristics of component 1 (FDOMC; Ex/Em = 342/427 nm) and component 3 (FDOMA; Ex/Em = 381/493 nm) are known to be associated with terrestrial humic-like DOM (Coble 2007). The spectral characteristics of component 2 (FDOMM; Ex/Em = 297/388 nm) are known to be associated with marine humic-like DOM originating from microbial remineralization (Coble, 2007; Jørgensen et al., 2011). Component 4 (FDOMP; Ex/Em = 282/322 nm) is characterized as a protein-like (tryptophan-like) DOM, which originates mainly from biological production (Coble, 2007). In this study, FDOMC was used to represent humic FDOM (FDOMH) since all humic-like components showed similar patterns.
UV–visible absorption spectra of the samples were measured with a scanning wavelength range of 240–700 nm. The absorption coefficient was calculated using the following equation:
where α is the absorption coefficient (m−1), Aλ is the absorbance, and l is the optical path length of the quartz cuvette (m). The SR value was calculated as the ratio of the spectral slope of shorter wavelengths (S275–295) to that of longer wavelengths (S350–400) (Helms et al., 2008; Han et al., 2020). The spectral slope (S) was calculated using the following equation:
where α is the Napierian absorption coefficient (m−1), λ is the wavelength, and λref is the reference wavelength (Twardowski et al., 2004; Helms et al., 2008).
In 2017, the vertical distribution of salinity indicated a well-mixed water column (Fig. 2). Similarly, the concentrations of DO and were vertically uniform (Fig. 2). Horizontally, salinity increased from 28 at the innermost station to 32 at the outermost station (Fig. 2). The concentrations of DO and were in the ranges of 7–13 mg L−1 (average: 10.1±2.4 mg L−1) and 0.1–25 µmol L−1 (average: 8.7±8.1 µmol L−1), respectively (Fig. 2). The DO concentration gradually increased with an increase in salinity along the transect, while the concentration decreased with an increase in salinity (Fig. 2). The concentration showed the lowest values (<1 µmol L−1) between station 10 and station 13 (Fig. 2).
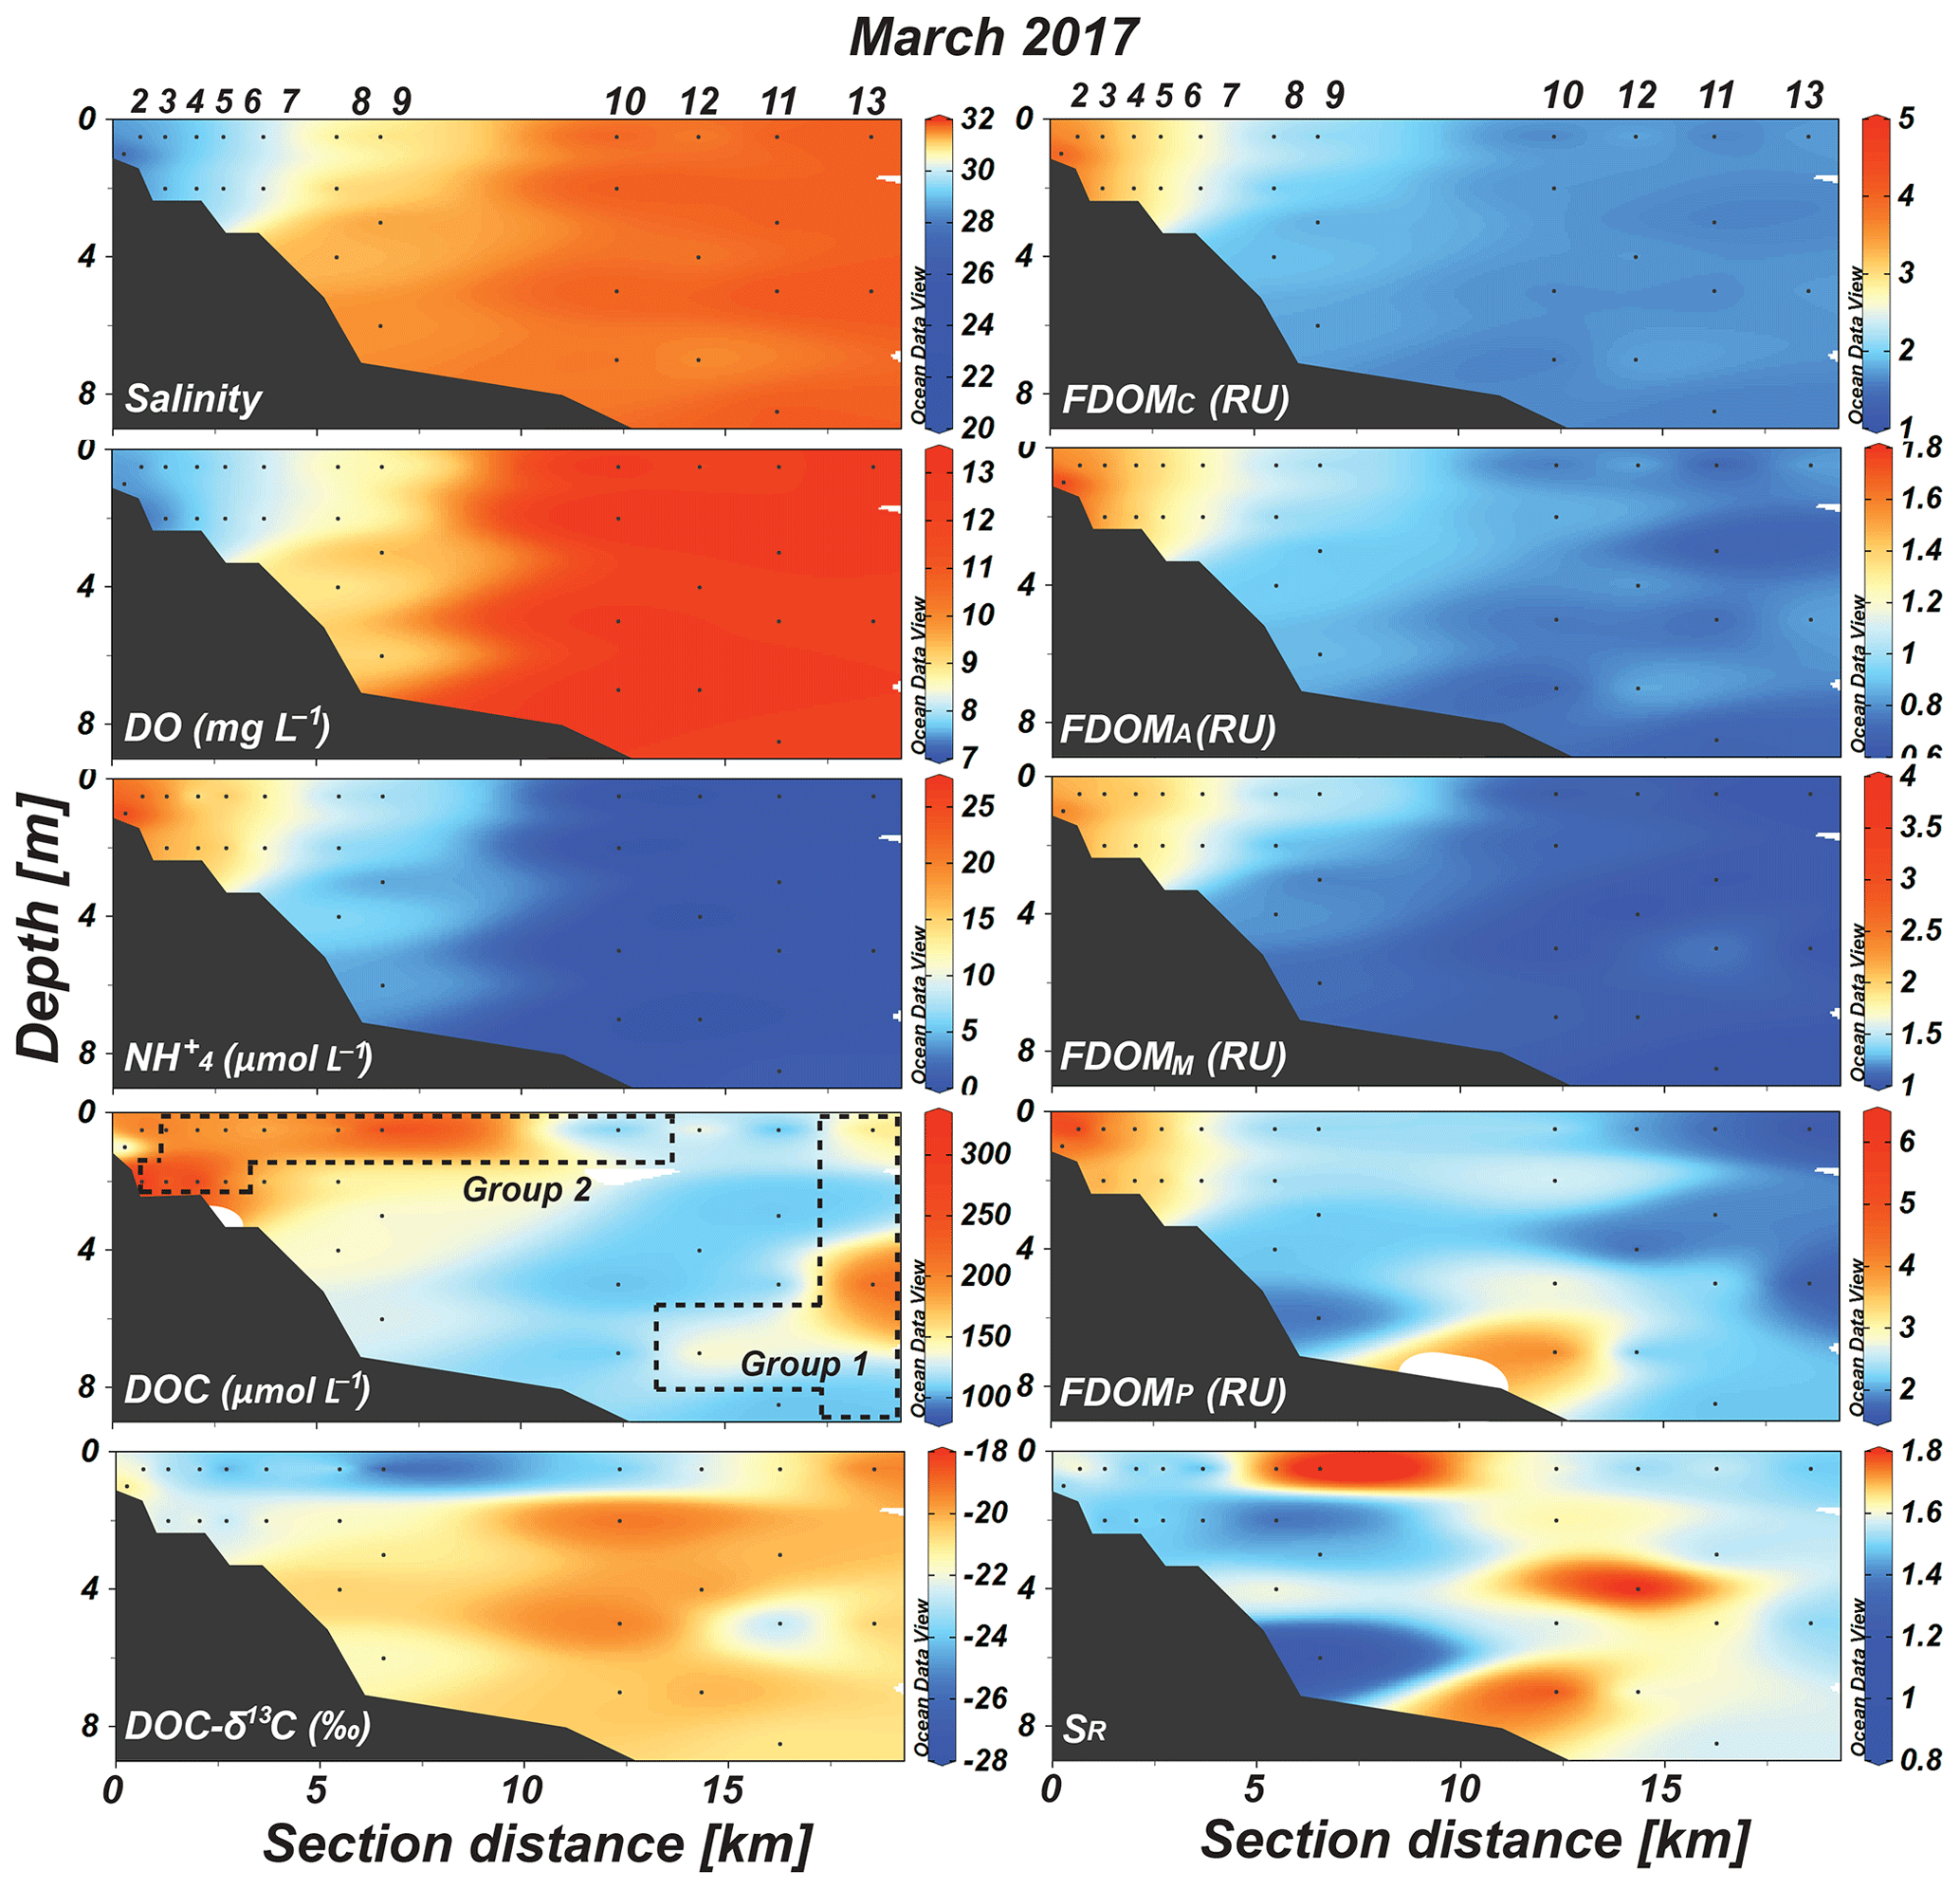
Figure 2Vertical distributions of salinity, DO, , DOC, DOC-δ13C, FDOMC, FDOMA, FDOMM, FDOMP, and SR values in Sihwa Lake in March 2017. The dashed blocks represent stations belonging to Group 1 and Group 2, which were separated based on the distributions of DOC, DOC-δ13C, and salinity.
In 2017, the DOC concentrations were in the range of 97–349 µmol L−1 (average: 184±76 µmol L−1). The distribution of DOC concentrations was quite different from the salinity and DO distributions, with the highest concentrations in the surface water samples of stations 3–9 and the bottom water samples of stations 3–5 (Fig. 2). The DOC-δ13C values ranged from −19.2 ‰ to −27.8 ‰ (average: ‰) (Fig. 2). The most depleted values were observed in the surface water samples of stations 5–7, 9, and 10 (−22.6 ‰ to −27.8 ‰ (Fig. 2). The concentrations of FDOMC (terrestrial humic-like component 1), FDOMA (terrestrial humic-like component 2), FDOMM (marine humic-like component), and FDOMP (protein-like component) were in the ranges of 1.6–4.1 (average: 2.3±0.8), 0.6–1.8 RU (average: 1.1±0.3), 1.0–2.4 (average: 1.5±0.5), and 1.6–6.1 RU (average: 2.8±1.0 RU), respectively (Fig. 2). The concentrations of all FDOM components were generally higher in the upstream stations and decreased with salinity (Fig. 2). The FDOMP concentration was slightly higher in the bottom water of station 10 (Fig. 2). The SR values were in the range of 0.70–1.76 (average: 1.21±0.20), with higher values in the surface water samples of stations 6 and 8–10 (Fig. 2).
In 2018, salinity showed a wide range, between 18 and 30, compared with that in 2017 (Fig. 3). Low-salinity waters (salinity: 18–27) were observed from the innermost station to station 9 (Fig. 3). The concentrations of DO and were in the ranges of 6–11 mg L−1 (average: 8.2±1.6 mg L−1) and 0.4–25 µmol L−1 (average: 13.1±7.9 µmol L−1), respectively (Fig. 3). The concentrations in the outermost stations were lower than the detection limit (Fig. 3).
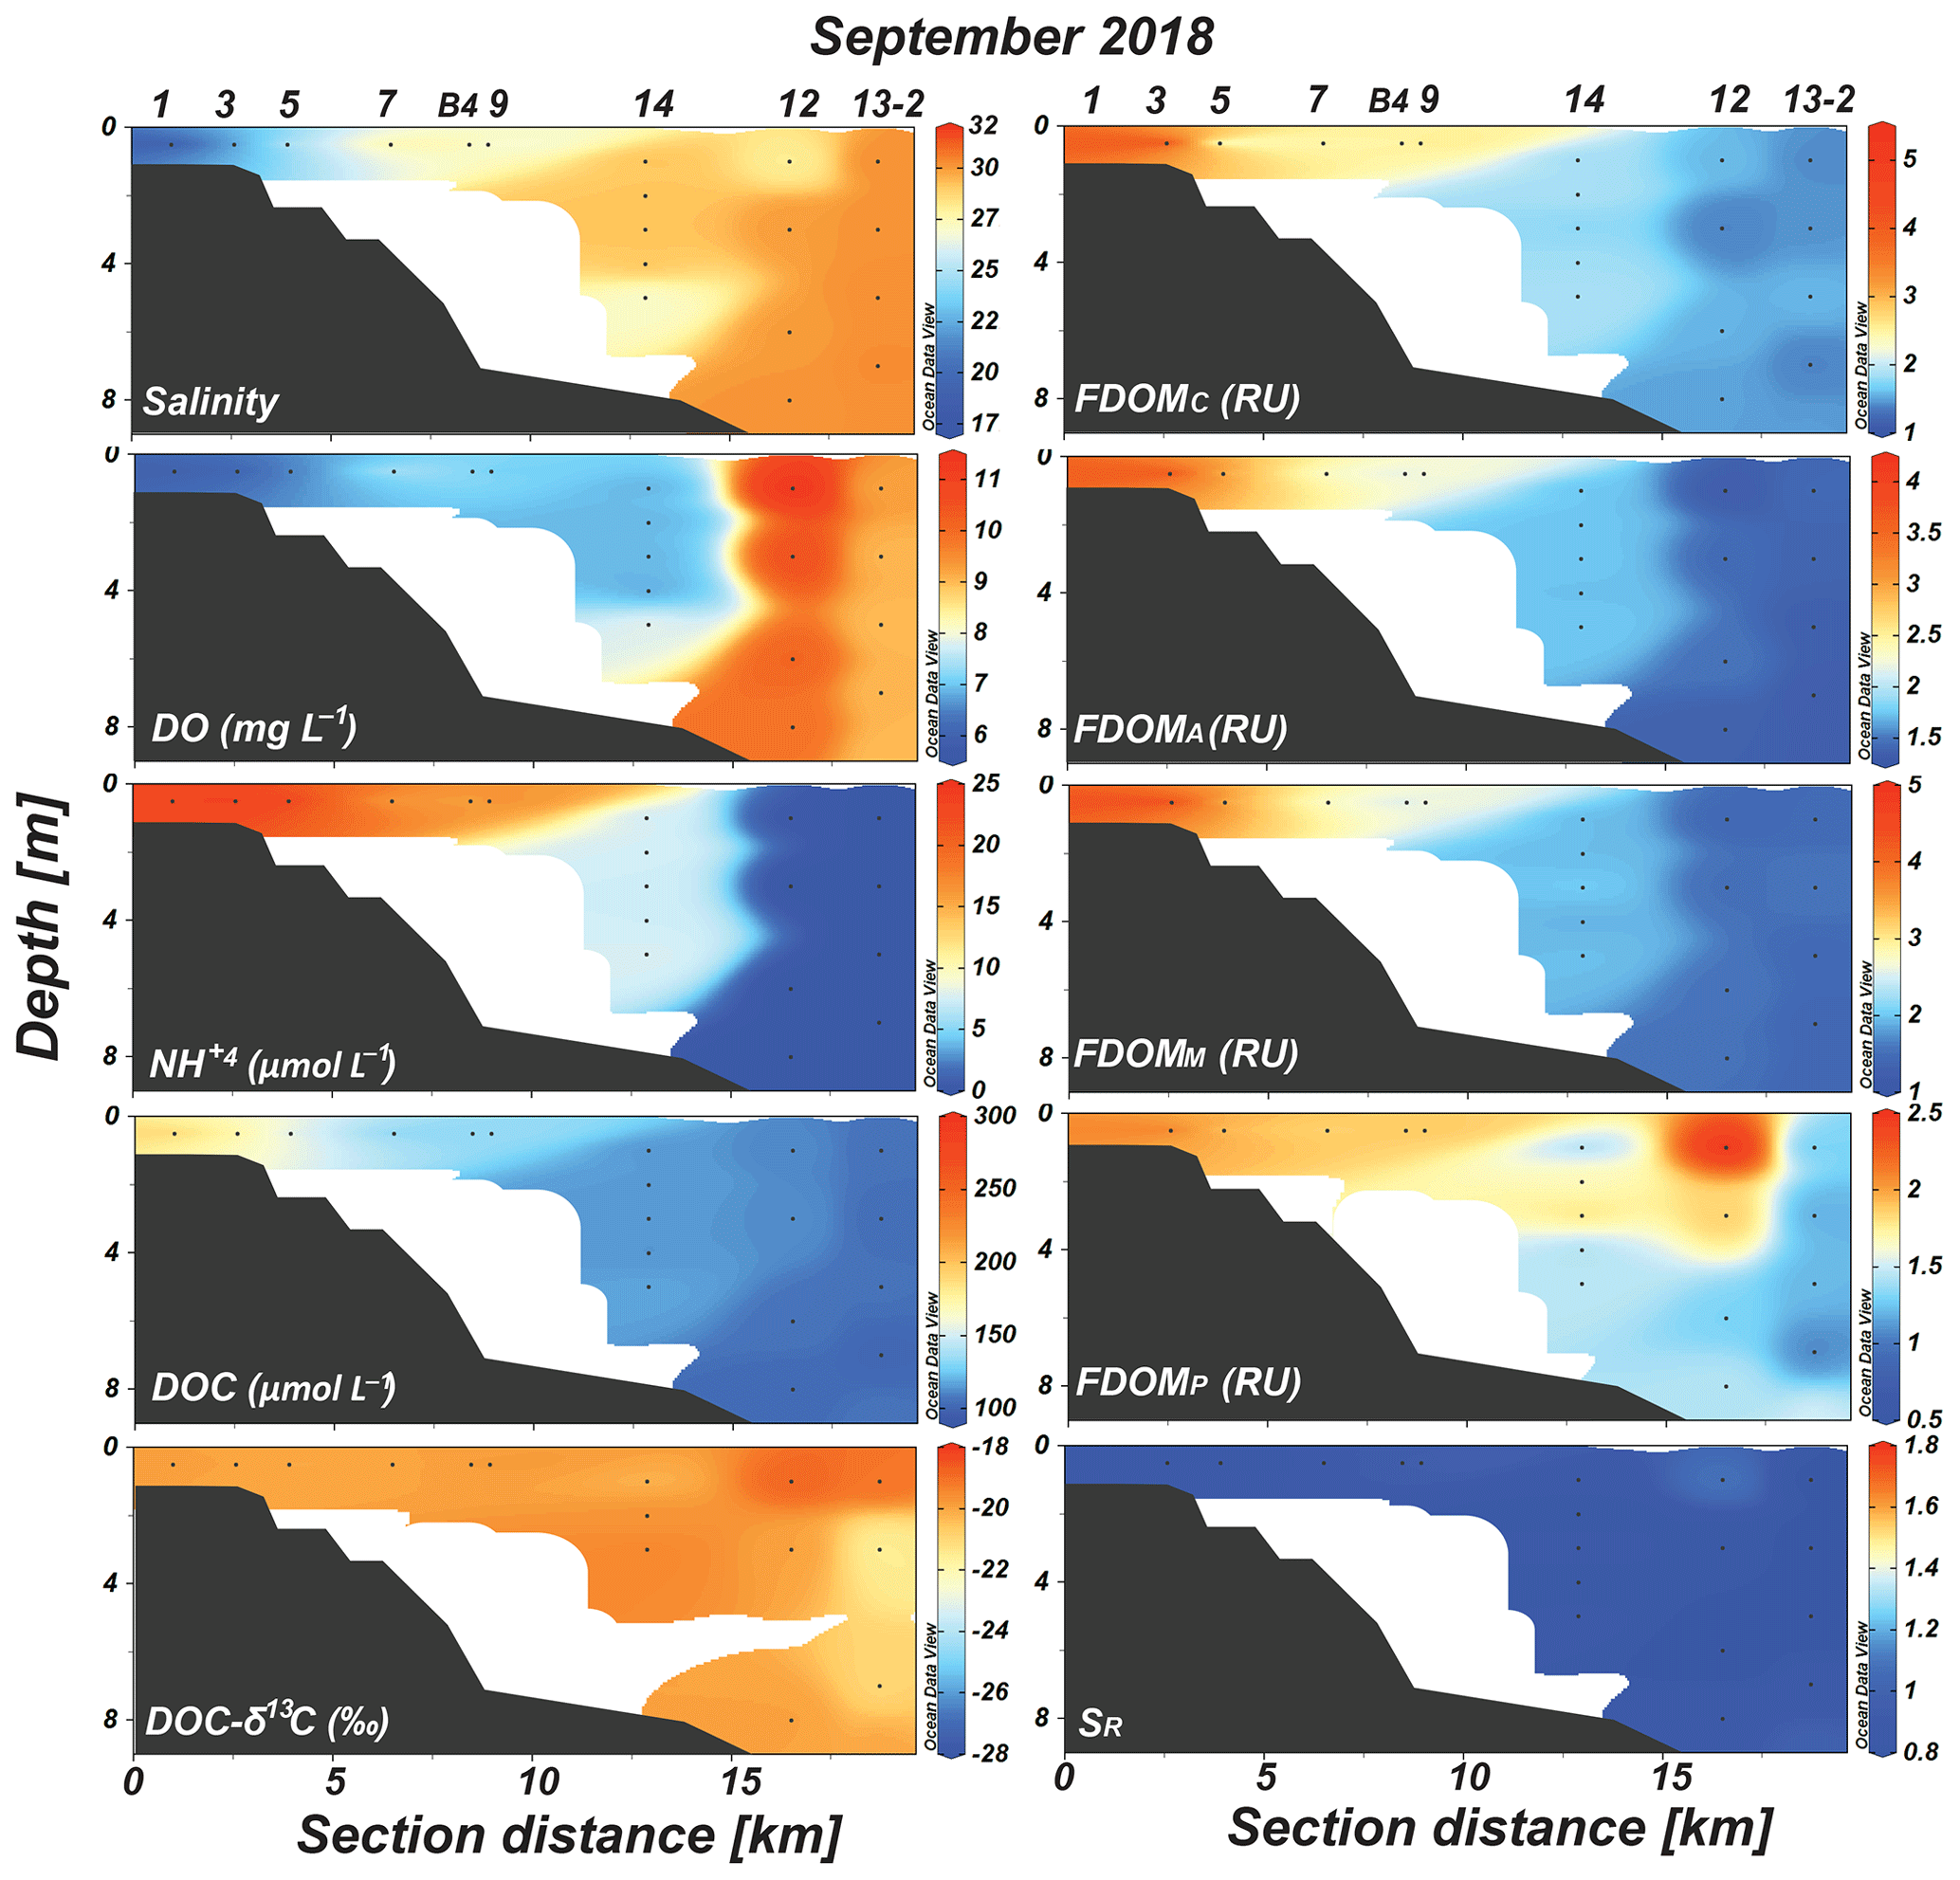
Figure 3Vertical distributions of salinity, DO, , DOC, DOC-δ13C, FDOMC, FDOMA, FDOMM, FDOMP, and SR values in Sihwa Lake in September 2018.
In 2018, the concentrations of DOC were in the range of 101–195 µmol L−1 (average: 130±32 µmol L−1). The DOC concentrations gradually decreased with an increase in the salinity (Fig. 3). The DOC-δ13C values ranged from −19.1 ‰ to −21.5 ‰ (average: ‰) (Fig. 3). The concentrations of FDOMC, FDOMA, FDOMM, and FDOMP were in the ranges of 1.4–5.1 (average: 1.9±0.9), 1.3–4.1 (average: 1.8±0.7), 1.4–4.9 (average: 2.1±0.9), and 1.1–2.5 RU (average: 1.6±0.4 RU), respectively (Fig. 3). All FDOMH concentrations were higher in 2018 than those in 2017 (Fig. 3). The FDOMP concentrations were generally higher in the surface water samples, with a slightly higher value at station 12, where the salinity is slightly lower (Fig. 3). The SR values were in the range of 0.72–1.08 (average: 0.87±0.10) (Fig. 3). The SR values were relatively constant at all sampling stations (Fig. 3).
In both sampling periods, low-salinity waters showed higher DOC, lower DO, higher , and higher FDOMH (FDOMC) concentrations (Figs. 2 and 3). As such, the DOC and FDOMH concentrations exhibited significant negative correlations against salinity, indicating low-salinity-associated inputs of both DOM components (Fig. 4a and b). However, the patterns of the DOC distributions were very different from those of the FDOMH distributions, indicating a decoupling of major sources for both DOM components (Figs. 2 and 3). In this region, anthropogenic source inputs were found to be insignificant since there were no anomalous increases in DOC and FDOMH concentrations in 2018 at station B4, where the waterway connects to the Banwol industrial complex (Fig. 3).
In both periods, the concentrations of FDOMH showed significant correlations against salinities and concentrations, with two negative slopes against salinity and a single positive slope against (Figs. 4 and 5). This correlation trend suggests that the main source of FDOMH was dependent on the supply of rather than freshwater inputs (Figs. 4a and 5a). In this lake, Kim and Kim (2018) hypothesized that FDOMH is produced by the anaerobic decomposition of organic matter in bottom sediments in the freshwater–seawater mixing zone. The hypothesis was based on good correlations among the salinity, , and FDOMH concentrations as well as low Eh values in samples with higher FDOMH concentrations, although possible terrestrial inputs could not be excluded. Such correlations could also be observed if terrestrial fresh water, which had higher FDOMH and lower levels, passed through a salinity mixing zone where extremely high amounts of and low FDOMH are introduced from the bottom sediments. However, our DOC-δ13C values ( ‰) observed in low-salinity (<28) water samples here exclude any possible significant contributions of terrestrial sources, indicating the effective degradation of terrestrial sources before they reached the mixing zone. In this tidal flat environment, the large inputs (i.e., seepage) of DOC and FDOMH, together with , might happen from marine sediments without significant decreases in the DO concentration (Kim et al., 2012), as the shore water runs back and forth over a wide sediment-surface area during the tidal cycle (Fig. 5). In this case, depending on the salinity ranges of the overlying waters, different slopes of FDOMH against salinities could be observed for different seasons as observed in this study (Fig. 4b).
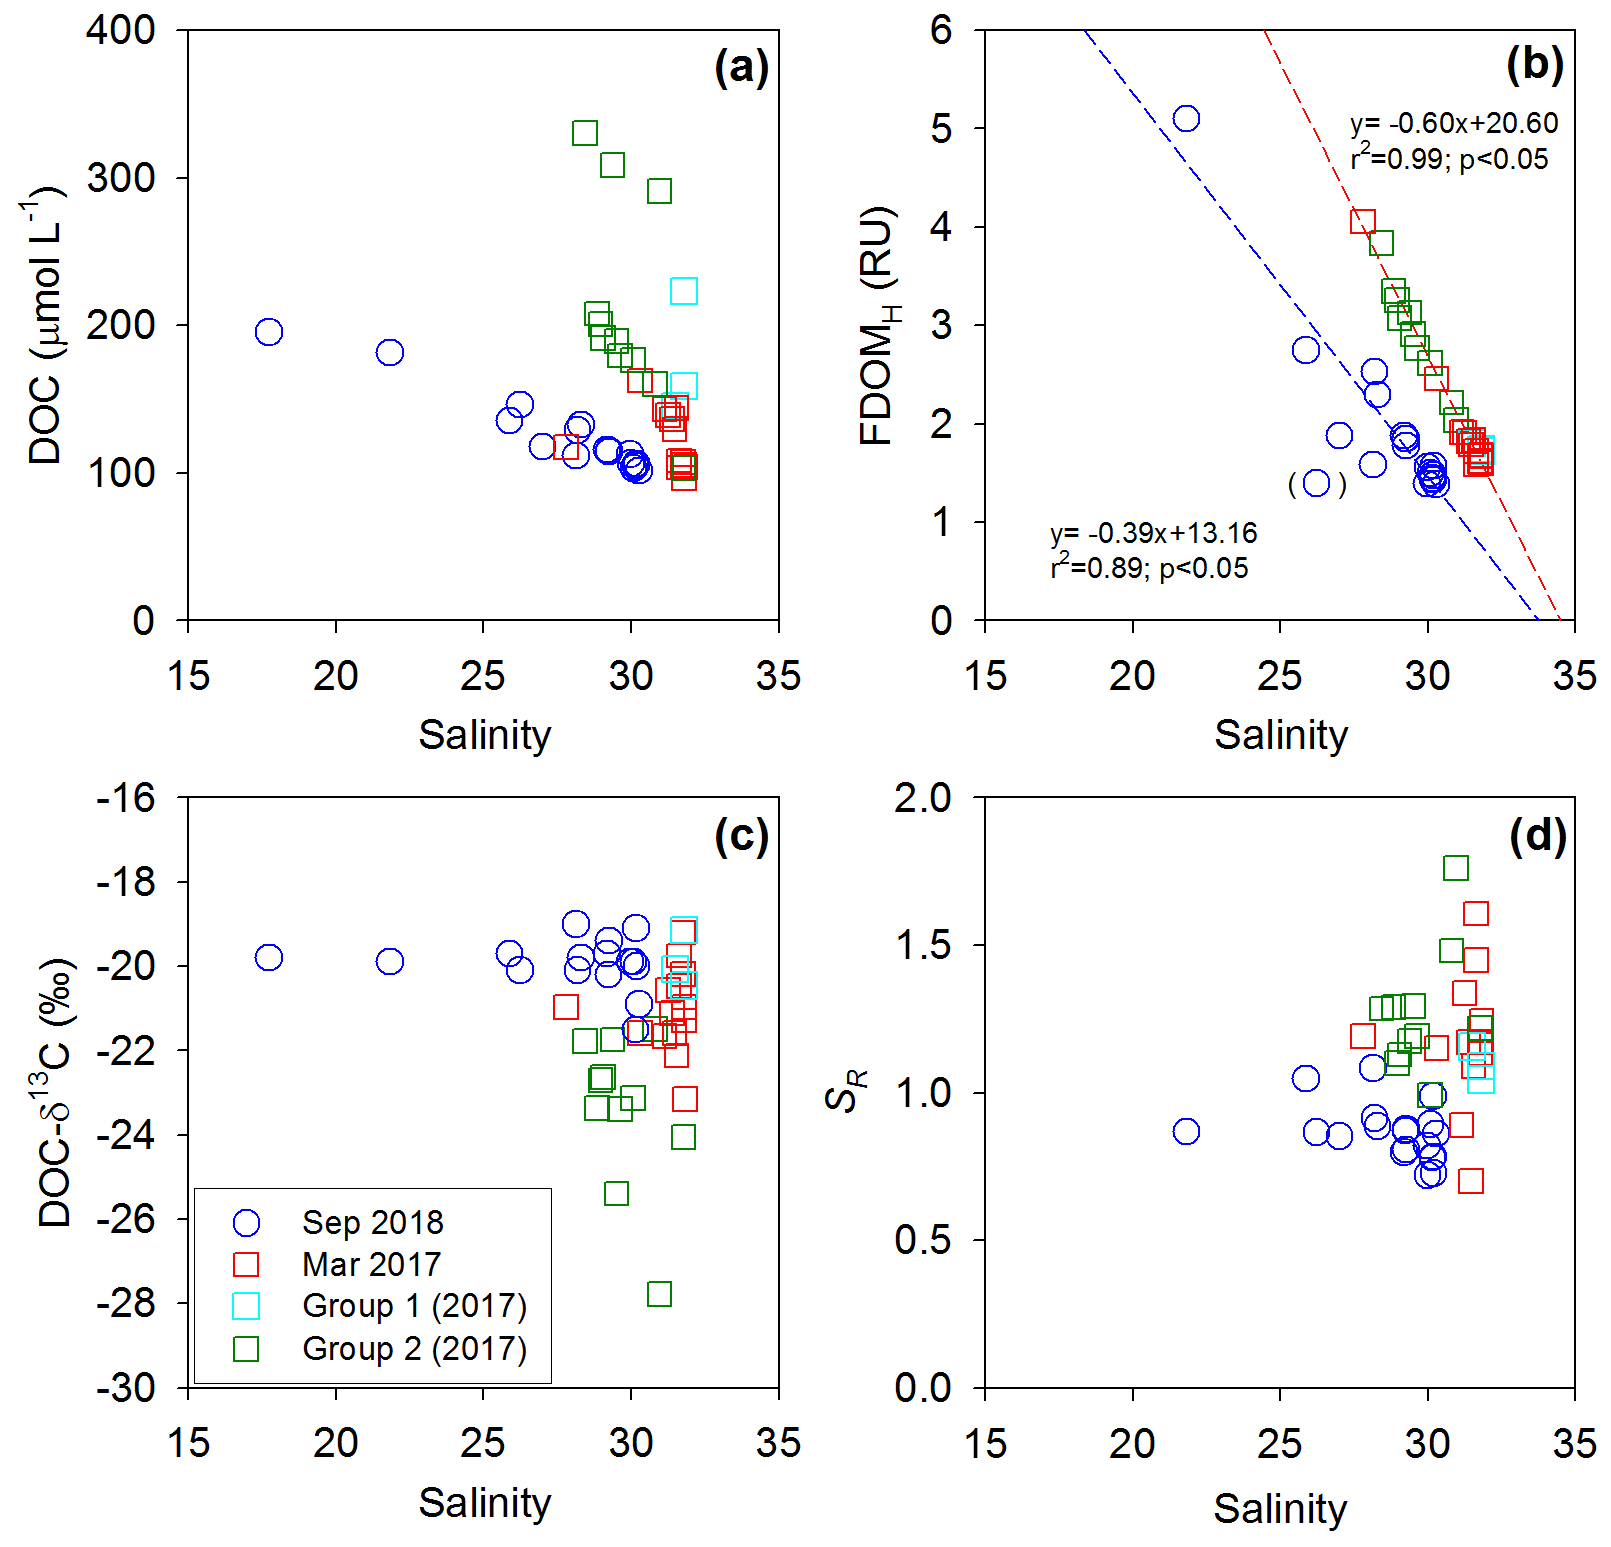
Figure 4Plots of salinity versus (a) DOC concentrations, (b) FDOMH concentrations, (c) DOC-δ13C values, and (d) SR values in Sihwa Lake in March 2017 (red square) and September 2018 (blue circle). The dashed lines represent the regression lines.
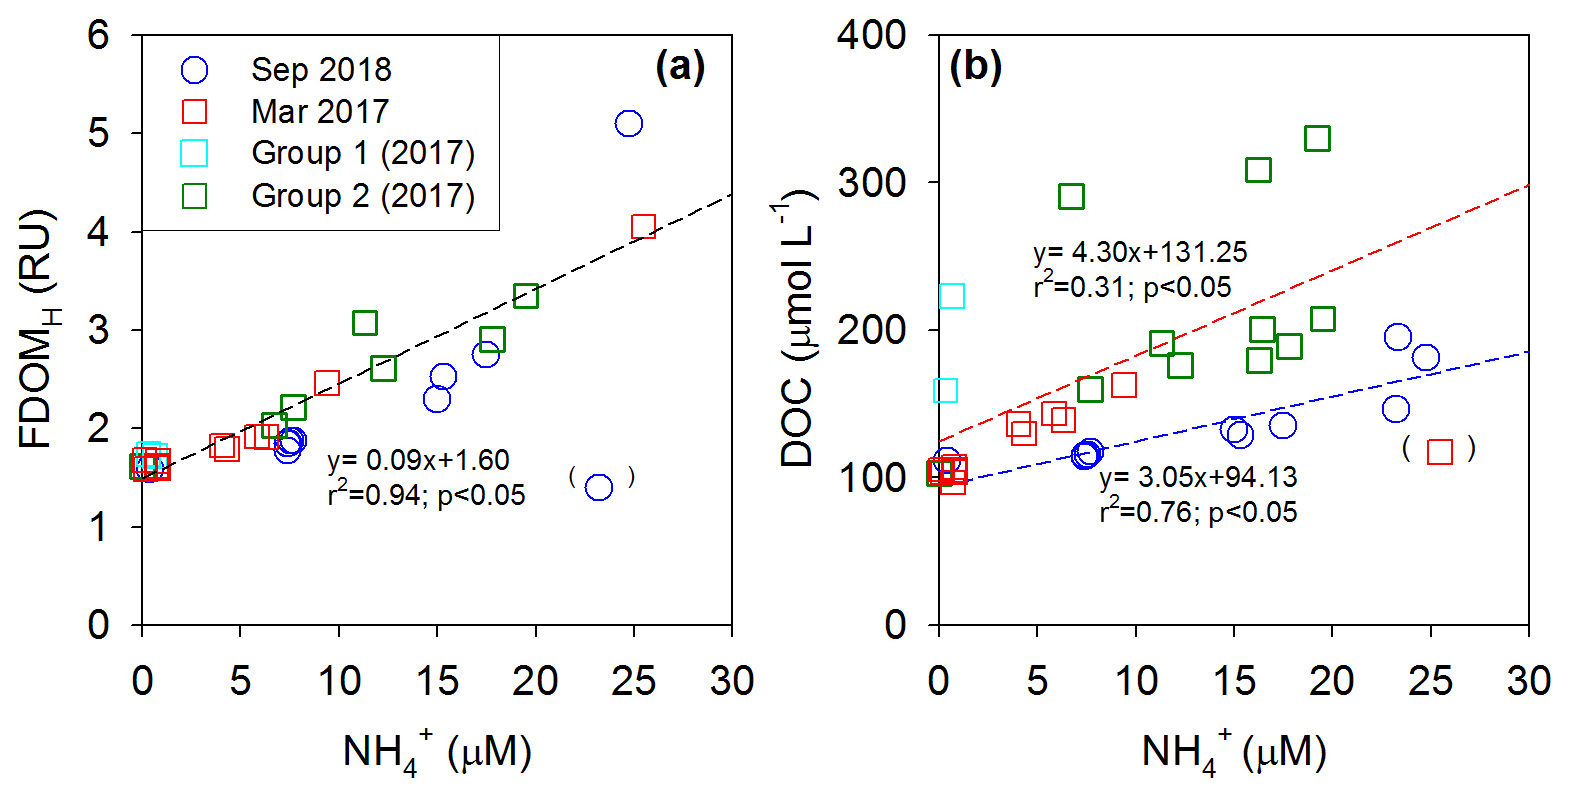
Figure 5Plots of concentrations versus (a) FDOMH concentrations and (b) DOC concentrations in Sihwa Lake in March 2017 (red square) and September 2018 (blue circle). The dashed lines represent the regression lines.
In 2018, the distribution pattern of the DOC concentrations was similar to that of FDOMH, showing a conservative mixing (Fig. 3). During this period, the freshwater contribution was greater compared with that in 2017, with the lowest salinity of ∼18. However, the DOC-δ13C values in all samples in this period ranged from −19.1 ‰ to −21.5 ‰ (average: ‰), falling into the range of marine phytoplankton values (−18 ‰ to −22 ‰) (Gearing, 1988) (Fig. 4c). The SR values were relatively low and constant (average: 0.86±0.1) at all stations in 2018, indicating no significant changes in the input sources or the effects of photochemical and bacterial degradation (Moran et al., 2000; Helms et al., 2008) (Fig. 4d). Thus, we conclude that the main source of DOC in 2018 was from marine sediments, together with FDOMH and NH4, as external terrestrial sources of DOC were insignificant or effectively degraded on the tidal flat (Kim et al., 2012).
In 2017, the DOC sources were more complicated than in 2018, showing excess DOC concentrations regardless of salinity (Fig. 2). Here, this excess DOC represents any DOC concentrations higher than those in the incoming open-ocean seawater from the Yellow Sea (the highest salinity and the lowest DOC concentrations observed in Sihwa Lake) (Fig. 4a). The samples with excess DOC levels observed in 2017 were nearly 69 % higher than the DOC values of the background seawater (∼110 µmol L−1) (Fig. 4a). The samples with excess DOC levels observed in 2017 were separated into two major groups (Group 1 and Group 2) based on their DOC concentrations, DOC-δ13C values, and salinities (Fig. 2). Group 1 (n=3) includes the samples observed in stations 12 and 13 (Fig. 2). Group 2 (n=11) includes the samples observed in the surface waters of stations 4–10 and in the bottom waters of stations 3–6 (Fig. 2).
For the Group 1 samples, the DOC concentrations ranged from 144 to 223 µmol L−1 (average: 175±42 µmol L−1) (Figs. 2 and 4a). The DOC-δ13C values ranged from −19.1 ‰ to −22.1 ‰ (average: ‰), which were close to the δ13C values of marine organisms (Figs. 2 and 4c). The SR values (average: 1.07±0.03) in this group were relatively low and constant compared with those of Group 2, indicating the presence of high-molecular-weight DOM (Figs. 2 and 4d). Thus, the higher DOC concentrations observed in this group appear to be from in situ biological production.
For the Group 2 samples, the DOC concentrations ranged from 103 to 330 µmol L−1 (average: 213±69 µmol L−1) (Figs. 2 and 4a). The DOC-δ13C values ranged from −21.5 ‰ to −27.8 ‰, which include the signature of terrestrial C3 plants (−23 ‰ to −32 ‰ (Gearing, 1988) (Figs. 2 and 4c). For this group, increases in FDOMH concentrations were not observed, although the SR values (average: 1.26±0.2) were higher than those at other stations, likely due to the influence of highly degraded low-molecular-weight DOM (Helms et al., 2008) (Fig. 4d). Thus, this terrestrial DOM observed in 2017 seems to be associated with non-fluorescent and low-molecular-weight DOM on the reclaimed land by direct land–seawater interaction through the tidal inundation of seawater. This could happen if the terrestrial DOM experienced intense light exposure and/or bacterial degradation on land, a condition likely facilitated through the process of land reclamation.
Without the use of these multiple tracers, in this region, the higher DOC and FDOMH concentrations occurring in areas with lower-salinity waters could be attributed to inputs with terrestrial origins, while the higher DOC concentrations in high-salinity areas could be attributed to in situ biological production. These multiple tracers could lead to the better identification of different source inputs. Therefore, our results suggest that the combination of stable carbon isotope, FDOM, and SR values can be a crucial tool for deciphering the sources and characteristics of DOM in coastal waters where various DOM sources are present.
Different sources and distributions of DOM were determined in different seasons using various tracers in Sihwa Lake, South Korea. Our results reveal that the higher DOC concentrations occurring in low-salinity water, which could be regarded as having terrestrial sources, were actually from marine sediment sources based on DOC-δ13C values (−19.1 ‰ to −21.5 ‰), together with significant correlations among the DOC, FDOMH, and concentrations. On the other hand, the excess DOC concentrations occurring in high-salinity waters at some stations, which are generally believed to be from marine sources, were found to be from non-fluorescent, low-molecular-weight, terrestrial DOM sources from the reclaimed land area based on depleted DOC-δ13C values (−21.5 ‰ to −27.8 ‰) and high SR values (1.26±0.2), without concurrent increases in FDOMH and concentrations. Our study demonstrates that combining these multiple DOM tracers can be used successfully in other coastal settings where the sources and characteristics of DOM are complicated.
All data are available upon request to the corresponding author.
The supplement related to this article is available online at: https://doi.org/10.5194/bg-18-1793-2021-supplement.
GK contributed to the conceptualization of the manuscript. HH and GK were involved in planning the research. HH collected samples and performed the analyses. All authors were involved in analyzing the results and writing the paper.
The authors declare that they have no conflict of interest.
This research was supported by the National Research Foundation (NRF) of Korea (NRF-2018R1A2B3001147) funded by the South Korean government. We would like to thank all lab members for their assistance.
This research has been supported by the National Research Foundation of Korea (grant no. NRF-2018R1A2B3001147).
This paper was edited by Minhan Dai and reviewed by four anonymous referees.
Bae, Y. H., Kim, K. O., and Choi, B. H.: Lake Sihwa tidal power plant project, Ocean. Eng., 37, 454–463, https://doi.org/10.1016/j.oceaneng.2010.01.015, 2010.
Bauer, J. E. and Bianchi, T. S.: Dissolved organic carbon cycling and transformation, in: Treatise on estuarine and coastal science, edited by: Wolanski, E. and Mcluski, D. S., 5, 7–67, Academic Press, Waltham, 2011.
Benner, R., Pakulski, J. D., McCarthy, M., Hedges, J. I., and Hatcher, P. G.: Bulk chemical characteristics of dissolved organic matter in the ocean, Science, 255, 1561–1564, https://doi.org/10.1126/science.255.5051.1561, 1992.
Bro, R.: PARAFAC. Tutorial and applications, Chemometr. Intell. Lab., 38, 149–171, 1997.
Carlson, C. A. and Hansell, D. A.: Chapter 3 – DOM sources, sinks, reactivity, and budgets, in: Biogeochemistry of marine dissolved organic matter (Second Edition), edited by: Hansell, D. A. and Carlson, C. A., 65–126, Academic Press, Boston, 2015.
Carpenter, J. H.: The Chesapeake Bay institute technique for the Winkler dissolved oxygen method, Limnol. Oceanogr., 10, 141–143, 1965.
Catalá, T. S., Reche, I., Álvarez, M., Khatiwala, S., Guallart, E. F., Benítez-Barrios, V. M., Fuentes-Lema, A., Romera-Castillo, C., Nieto-Cid, M., Pelejero, C., Fraile-Nuez, E., Ortega-Retuerta, E., Marrasé, C., and Álvarez-Salgado, X. A.: Water mass age and aging driving chromophoric dissolved organic matter in the dark global ocean, Global Biogeochem. Cy., 29, 917–934, https://doi.org/10.1002/2014GB005048, 2015.
Coble, P. G.: Characterization of marine and terrestrial DOM in seawater using excitation-emission matrix spectroscopy, Mar. Chem., 51, 325–346, https://doi.org/10.1016/0304-4203(95)00062-3, 1996.
Coble, P. G.: Marine optical biogeochemistry: the chemistry of ocean color, Chem. Rev., 107, 402–418, https://doi.org/10.1021/cr050350+, 2007.
Gearing, J. N.: The use of stable isotope ratios of tracing the nearshore-offshore exchange of organic matter, in: Coastal-offshore ecosystem interactions, edited by: Jansson, B.-O., 69–101, Springer-Verlag, Berlin, 1988.
Griffith, D. R. and Raymond, P. A.: Multiple-source heterotrophy fuelled by aged organic carbon in an urbanized estuary, Mar. Chem., 124, 14–22, https://doi.org/10.1016/j.marchem.2010.11.003, 2011.
Han, H., Kim, G., Seo, H., Shin, K.-H., and Lee, D.-H.: Significant seasonal changes in optical properties of brown carbon in the midlatitude atmosphere, Atmos. Chem. Phys., 20, 2709–2718, https://doi.org/10.5194/acp-20-2709-2020, 2020.
Hansell, D. A.: Dissolved organic carbon reference material program, Eos, 86, 318, https://doi.org/10.1029/2005EO350003, 2005.
Hansen, A. M., Kraus, T. E. C., Pellerin, B. A., Fleck, J. A., Downing, B. D., and Bergamaschi, B. A.: Optical properties of dissolved organic matter (DOM): Effects of biological and photolytic degradation, Limnol. Oceanogr., 61, 1015–1032, https://doi.org/10.1002/lno.10270, 2016.
Helms, J. R., Stubbins, A., Ritchie, J. D., and Minor, E. C.: Absorption spectral slopes and slope ratios as indicators of molecular weight, source, and photobleaching of chromophoric dissolved organic matter, Limnol. Oceanogr., 53, 955–969, https://doi.org/10.4319/lo.2008.53.3.0955, 2008.
Jørgensen, L., Stedmon, C. A., Kragh, T., Markager, S., Middelboe, M., and Søndergaard, M.: Global trends in the fluorescence characteristics and distribution of marine dissolved organic matter, Mar. Chem., 126, 139–148, https://doi.org/10.1016/j.marchem.2011.05.002, 2011.
Kim, J. and Kim, G.: Significant anaerobic production of fluorescent dissolved organic matter in the deep East Sea (Sea of Japan), Geophys. Res. Lett., 43, 7609–7616, https://doi.org/10.1002/2016GL069335, 2016.
Kim, J. and Kim, T.-H.: Distribution of humic fluorescent dissolved organic matter in lake Shihwa: the role of the redox condition, Estuaries Coasts, 43, 578–588, https://doi.org/10.1007/s12237-018-00491-0, 2018.
Kim, K. T., Kim, E. S., Cho, S. R., and Park, J. K.: Distribution and temporal change of heavy metals in the surface sediments of lake Shihwa and adjacent sea, Korea, J. Coast. Res., 56, 817–821, 2009.
Kim, T.-H. and Kim, G.: Distribution of dissolved organic carbon (DOC) in the southwestern East Sea in summer, Ocean Polar Res., 32, 291–297, 2010.
Kim, T.-H. and Kim, G.: Estimating benthic fluxes of trace elements to hypoxic coastal waters using 210Po, Estuar. Coast. Shelf Sci., 151, 324–330, https://doi.org/10.1016/j.ecss.2014.05.008, 2014.
Kim, T.-H., Waska, H., Kwon, E., Suryaputra, G. N., and Kim, G.: Production, degradation, and flux of dissolved organic matter in the subterranean estuary of a large tidal flat, Mar. Chem., 142–144, 1–10, https://doi.org/10.1016/j.marchem.2012.08.002, 2012.
Lang, S. Q., Lilley, M. D., and Hedge, J. I.: A method to measure the isotopic (13C) composition of dissolved organic carbon using a high temperature combustion instrument, Mar. Chem., 103, 318–326, 2007.
Lawaetz, A. J. and Stedmon, C. A.: Fluorescence intensity calibration using the raman scatter peak of water, Appl. Spectrosc., 62, 936–940, 2009.
Lee, C.-H., Lee, B.-Y., Chang, W. K., Hong, S., Song, S. J., Park, J., Kwon, B., and Khim, J. S.: Environmental and ecological effects of Lake Shihwa reclamation project in South Korea: A review, Ocean Coast. Manag., 102, 545–558, https://doi.org/10.1016/j.ocecoaman.2013.12.018, 2014.
Lee, J., Hong, S., Yoon, S. J., Kwon, B., Ryu, J., Giesy, J. P., Allam, A. A., Al-khedhairy, A. A., and Khim, J. S.: Long-term changes in distributions of dioxin-like and estrogenic compounds in sediments of Lake Sihwa, Korea: Revisited mass balance, Chemosphere, 181, 767–777, https://doi.org/10.1016/j.chemosphere.2017.04.074, 2017.
Lee, J.-H., Park, J.-Y., Lee, H.-G., Park, H.-S., and Kim, D.-S.: Environmental assessment of the Shihwa lake by using the benthic pollution index, Ocean. Polar Res., 25, 183–200, https://doi.org/10.4217/OPR.2003.25.2.183, 2003.
Lee, S.-A. and Kim, G.: Sources, fluxes, and behaviors of fluorescent dissolved organic matter (FDOM) in the Nakdong River Estuary, Korea, Biogeosciences, 15, 1115–1122, https://doi.org/10.5194/bg-15-1115-2018, 2018.
Lee, S.-A., Kim, T.-H., and Kim, G.: Tracing terrestrial versus marine sources of dissolved organic carbon in a coastal bay using stable carbon isotopes, Biogeosciences, 17, 135–144, https://doi.org/10.5194/bg-17-135-2020, 2020.
Moran, M. A., Sheldon, W. M., and Zepp, R. G.: Carbon loss and optical property changes during long-term photochemical and biological degradation of estuarine dissolved organic matter, Limnol. Oceanogr., 45, 1254–1264, 2000.
Murphy, K. R., Stedmon, C. A., Wenig, P., and Bro, R.: OpenFluor- an online spectral library of auto-fluorescence by organic compounds in the environment, Anal. Methods, 6, 658–661, https://doi.org/10.1039/C3AY41935E, 2014.
Opsahl, S. and Benner, R.: Distribution and cycling of terrigenous dissolved organic matter in the ocean, Nature, 386, 480–482, https://doi.org/10.1038/386480a0, 1997.
Panetta, R. J., Ibrahim, M., and Gélinas, Y.: Coupling a high-temperature catalytic oxidation total organic carbon analyzer to an isotope ratio mass spectrometer to measure natural-abundance δ13C-dissolved organic carbon in marine and freshwater samples, Anal. Chem., 80, 5232–5239, https://doi.org/10.1021/ac702641z, 2008.
Ra, K., Bang, J.-H., Lee, J.-M., Kim, K.-T., and Kim, E.-S.: The extent and historical trend of metal pollution recorded in core sediments from the artificial Lake Shihwa, Korea, Mar. Pollut. Bull., 62, 1814–1821, https://doi.org/10.1016/j.marpolbul.2011.05.010, 2011.
Raymond, P. A. and Spencer, R. G. M.: Chapter 11 – Riverine DOM, in: Biogeochemistry of marine dissolved organic matter (Second Edition), edited by: Hansell, D. A. and Carlson, C. A., 509–535, Academic Press, Boston, 2015.
Stedmon, C. A. and Bro, R.: Characterizing dissolved organic matter fluorescence with parallel factor analysis: a tutorial, Limnol. Oceanogr.-Meth., 6, 572–579, 2008.
Stedmon, C. A. and Nelson, N. B.: Chapter 10 – The optical properties of DOM in the ocean, in: Biogeochemistry of marine dissolved organic matter (Second Edition), edited by: Hansell, D. A. and Carlson, C. A., 481–508, Academic Press, Boston, 2015.
Tedetti, M., Guigue, C., and Goutx, M.: Utilization of a submersible UV fluorometer for monitoring anthropogenic inputs in the Mediterranean coastal waters, Mar. Pollut. Bull., 60, 350–362, https://doi.org/10.1016/j.marpolbul.2009.10.018, 2010.
Troyer, I. D., Bouillon, S., Barker, S., Perry, C., Coorevits, K., and Merckx, R.: Stable isotope analysis of dissolved organic carbon in soil solutions using a catalytic combustion total organic carbon analyzer-isotope ratio mass spectrometer with a cryofocusing interface, Rapid Commun. Mass Sp., 24, 365–374, https://doi.org/10.1002/rcm.4403, 2010.
Twardowski, M. S., Boss, E., Sullivan, J. M., and Donaghay, P. L.: Modeling the spectral shape of absorbing chromophoric dissolved organic matter, Mar. Chem., 89, 69–88, https://doi.org/10.1016/j.marchem.2004.02.008, 2004.
Vetter, T. A., Perdue, E. M., Ingall, E., Koprivnjak, J.-F., and Pfromm, P. H.: Combining reverse osmosis and electrodialysis for more complete recovery of dissolved organic matter from seawater, Sep. Purif. Technol., 56, 383–387, https://doi.org/10.1016/j.seppur.2007.04.012, 2007.
Wang, X.-C., Chen, R. F., and Gardner, G. B.: Sources and transport of dissolved and particulate organic carbon in the Mississippi River estuary and adjacent coastal waters of the northern Gulf of Mexico, Mar. Chem., 89, 241–256, https://doi.org/10.1016/j.marchem.2004.02.014, 2004.
Zepp, R. G., Sheldon, W. M., and Moran, M. A.: Dissolved organic fluorophores in southeastern US coastal waters: correction method for eliminating Rayleigh and Raman scattering peaks in excitation-emission matrices, Mar. Chem., 89, 15–36, https://doi.org/10.1016/j.marchem.2004.02.006, 2004.