the Creative Commons Attribution 4.0 License.
the Creative Commons Attribution 4.0 License.
 | 19 Mar 2021
Impacts of fertilization on grassland productivity and water quality across the European Alps under current and warming climate: insights from a mechanistic model
Matthias Zeeman
Paolo Burlando
Simone Fatichi
Alpine grasslands sustain local economy by providing fodder for livestock. Intensive fertilization is common to enhance their yields, thus creating negative externalities on water quality that are difficult to evaluate without reliable estimates of nutrient fluxes. We apply a mechanistic ecosystem model, seamlessly integrating land-surface energy balance, soil hydrology, vegetation dynamics, and soil biogeochemistry, aiming at assessing the grassland response to fertilization. We simulate the major water, carbon, nutrient, and energy fluxes of nine grassland plots across the broad European Alpine region. We provide an interdisciplinary model evaluation by confirming its performance against observed variables from different datasets. Subsequently, we apply the model to test the influence of fertilization practices on grassland yields and nitrate () losses through leaching under both current and modified climate scenarios.
Despite the generally low concentration in groundwater recharge, the variability across sites is remarkable, which is mostly (but not exclusively) dictated by elevation. In high-Alpine sites, short growing seasons lead to less efficient nitrogen (N) uptake for biomass production. This combined with lower evapotranspiration rates results in higher amounts of drainage and leaching to groundwater. Scenarios with increased temperature lead to a longer growing season characterized by higher biomass production and, consequently, to a reduction of water leakage and N leaching. While the intersite variability is maintained, climate change impacts are stronger on sites at higher elevations.
The local soil hydrology has a crucial role in driving the use efficiency. The commonly applied fixed threshold limit on fertilizer N input is suboptimal. We suggest that major hydrological and soil property differences across sites should be considered in the delineation of best practices or regulations for management. Using distributed maps informed with key soil and climatic attributes or systematically implementing integrated ecosystem models as shown here can contribute to achieving more sustainable practices.
- Article
(6049 KB) - Full-text XML
-
Supplement
(1533 KB) - BibTeX
- EndNote


Alpine grasslands are a vital resource for the European economy. They provide a variety of ecosystem services such as maintaining biodiversity, protecting soil, and offering recreational functions (Sala and Paruelo, 1997; Lamarque et al., 2011; Schirpke et al., 2017). Above all, they sustain economy by providing fodder for livestock. To this purpose, high yields are desired, as they correspond to increasing income for farmers; hence, large amounts of fertilizers are applied every year. One of the most important components of fertilizers is nitrogen. On the one hand, nitrogen plays a crucial role as a nutrient contributing to the grassland growth. On the other hand, it is one of the main responsible components for environmental pollution from agriculture. Nitrogen is lost into the environment either through gaseous emissions of N2O, N2, and NH3 (Amon et al., 2006; Ibraim et al., 2019; Schlingmann et al., 2020) or as , either through surface runoff or as leaching to groundwater. Well-known water quality issues, such as eutrophication, result directly from intensive management of grasslands (e.g., Heathwaite, 1995; Peukert et al., 2014). In order to tackle the problem of losses to the environment, the European Union (EU) approved the Nitrate Directive 91/676/EEC (EEC, 1991), which imposes limits on the yearly load of fertilizers and restricts the fertilization season. In this frame, EU countries should pursue grassland management strategies designed with the intention of maximizing the grassland yields without damaging the environment. The task is particularly daunting given the spatial heterogeneity across the wide Alpine grassland areas and given the threat of climate change, which is likely to remarkably impact the nitrogen cycle (Wang et al., 2016). Elevation is often a major constraint for management in the Alpine environment, with low-elevation sites generally being more prone to intensive management than high-elevation sites, for both climatological and pragmatic reasons. Since the EU Nitrate Directive has been in effect, many studies attempted to quantify the fluxes with various methods (e.g., Kronvang et al., 2009; Groenendijk et al., 2014). However, according to a questionnaire submitted to grassland experts across EU countries, Norway, and Switzerland (Velthof et al., 2014), “non-academic” quantification of fluxes is still mainly based on expert estimates or on prescribed values. Rarely models are applied. When they are, the most common approach is the simple empirical feed balance method, where grassland yields are estimated using statistical data on feed availability for ruminants and their feed requirements. The nutrient balance is consequently estimated by applying values derived from literature or direct measurements of nitrogen content in sampled grass.
More complex modeling approaches for the quantification of nitrate losses from agricultural activity are emerging. Some European projects have been promoted with the goal of assessing the state-of-the-art modeling tools in view of a harmonized assessment procedure across Europe. For example, the EUROHARP project (Kronvang et al., 2009) compares available distributed models applied in different European countries. The analyzed models span from conceptual models such as NLES_CAT (Simmelsgaard and Djurhuus, 1998) and MONERIS (Behrendt et al., 2003) to more complex and process-oriented models like SWAT and NL-CAT, which are born from the integration of ANIMO (Groenendijk et al., 2005), SWAP (Kroes and Dam, 2003), SWQN (Smit et al., 2009), and SWQL (Siderius et al., 2008). Another example is the GENESIS Project (Groenendijk et al., 2014), which compares 1-D mechanistic models integrating hydrology, vegetation dynamics, and soil biogeochemistry. The performance of some models such as ARMOSA (Perego et al., 2013), CoupModel (Jansson, 2012), and EPIC (Williams et al., 1984; Sohier et al., 2009) are compared to simulated nitrate leaching rates from lysimeters. What emerges from these studies is that mechanistic models are currently not used for the purpose of supporting management, because they are thought to be difficult to operate, require a large amount of input data, and require complex parameterization (see also discussions in Fatichi et al., 2019). However, when the above limitations are overcome, mechanistic models could provide insights into biomass and nutrient budget quantification that would be too difficult to obtain otherwise. They can constrain the description of soil biogeochemical processes by means of mass and stoichiometric constraints better than empirical approaches, providing a larger predictive power (Moorhead et al., 1996; Wieder et al., 2013; Manzoni et al., 2016).
The leaching depends on the overall N cycle, which results from the interplay of various processes. Hence, mechanistic models reproducing the whole N cycle require a tight integration with models or modules dealing with land-surface exchanges of energy and water, vegetation dynamics, soil hydrological and biogeochemical processes, and hydrological transport, in other words what are called ecosystem or terrestrial biosphere models (Fatichi et al., 2016).
Different ecosystem models have been developed, but they rarely integrate all the abovementioned modules or treat them with a similar level of complexity. For example, models that were born as tools for the estimation of the greenhouse gas emissions tend to simplify the soil hydrology using bucket-type approaches. Some examples of this kind of models are CERES-EGC (Gabrielle et al., 1995; Gabrielle and Kengni, 1996; Hénault et al., 2005), DAYCENT (Parton et al., 1998, 2015; Del Grosso et al., 2000, 2002), STICS (Brisson et al., 1998, 2002, 2003), and DNDC (Li, 2000; Li et al., 2012), although efforts have recently been made to enhance the hydrological module of the latter (Smith et al., 2020). In other models, the soil hydrology module is represented with much higher detail than the soil biogeochemistry module, as is the case for HYDRUS-1D/2D/3D (Tafteh and Sepaskhah, 2012; Phogat et al., 2013) or DAISY (Hansen et al., 1990; Hansen, 2002). More recently, ecosystem models were built by combining different models, each highly specialized in a specific compartment of the ecosystem. The result leads to fully integrated models such as ARMOSA (Perego et al., 2013), which is the combination SWAP (Van Dam, 2000) for the hydrological model, STAMINA (Ferrara et al., 2010; Richter et al., 2010) for simulating the crop dynamics, and SOILN (Bergström et al., 1991) to represent the soil carbon and nitrogen cycles. The model SIM-STO (Pütz et al., 2018) was also created from the merging of SIMWASER (Stenitzer, 1988) and STOTRASIM (Feichtinger, 1998), which are focused on water fluxes and nitrogen dynamics, respectively. RT-Flux-PIHM (Bao et al., 2017) combines a reactive transport (RT) model, a land-surface model (Noah LSM; Chen and Dudhia, 2001; Shi et al., 2013), and the hydrological model PIHM (Shi et al., 2013). These models are usually performing well when applied with targeted applications. In most of the cases they are validated only against the data concerning one specific module that is the most important to solve the problem at hand. The models are hardly ever concurrently evaluated against vegetation and soil water dynamics or energy and biogeochemical fluxes. Here, we push the envelope of integrated models by applying the mechanistic ecosystem model T&C-BG, which simulates the interactions among vegetation dynamics, soil biogeochemistry, and hydrological fluxes. T&C-BG was recently developed (Fatichi et al., 2019) as a single fully integrated model and therefore does not require many of the pragmatic simplifications necessary to externally couple different models. We evaluate the model capabilities by applying a “common” (non-site-specific) parametrization to nine managed grassland sites across the broad Alpine region, derived from previous plot-scale studies (Fatichi et al., 2014; Fatichi and Pappas, 2017). First, we evaluate the model against hydrological, energy, vegetation, and soil biogeochemical observations according to the available data. Then, we run numerical experiments to estimate the grass yields and the losses of under different fertilization regimes and compare results across the sites. Ultimately, we simulate a climate change sensitivity test for each management scenario by modifying atmospheric CO2 concentrations by +250 ppm and air temperature by , to compare results with outcomes from the simulations under present climate. Specifically, we investigate and answer the following questions:
-
Is a mechanistic ecosystem model provided with a common parameterization for Alpine managed grasslands able to reliably represent the ecosystem dynamics across nine sites?
-
How do grass productivity and leaching change in response to different fertilization scenarios and to warming climate across the broad Alpine region?
-
Can mechanistic models provide insights for legislators setting guidelines for management also in view of changing climatic conditions?
Answering these questions, beyond allowing the assessment of a state-of-the-art ecosystem model in reproducing multiple aspects of ecosystem functioning, also provides quantitative information that can be used to delineate best grassland management practices.
2.1 Study sites and instrumentation
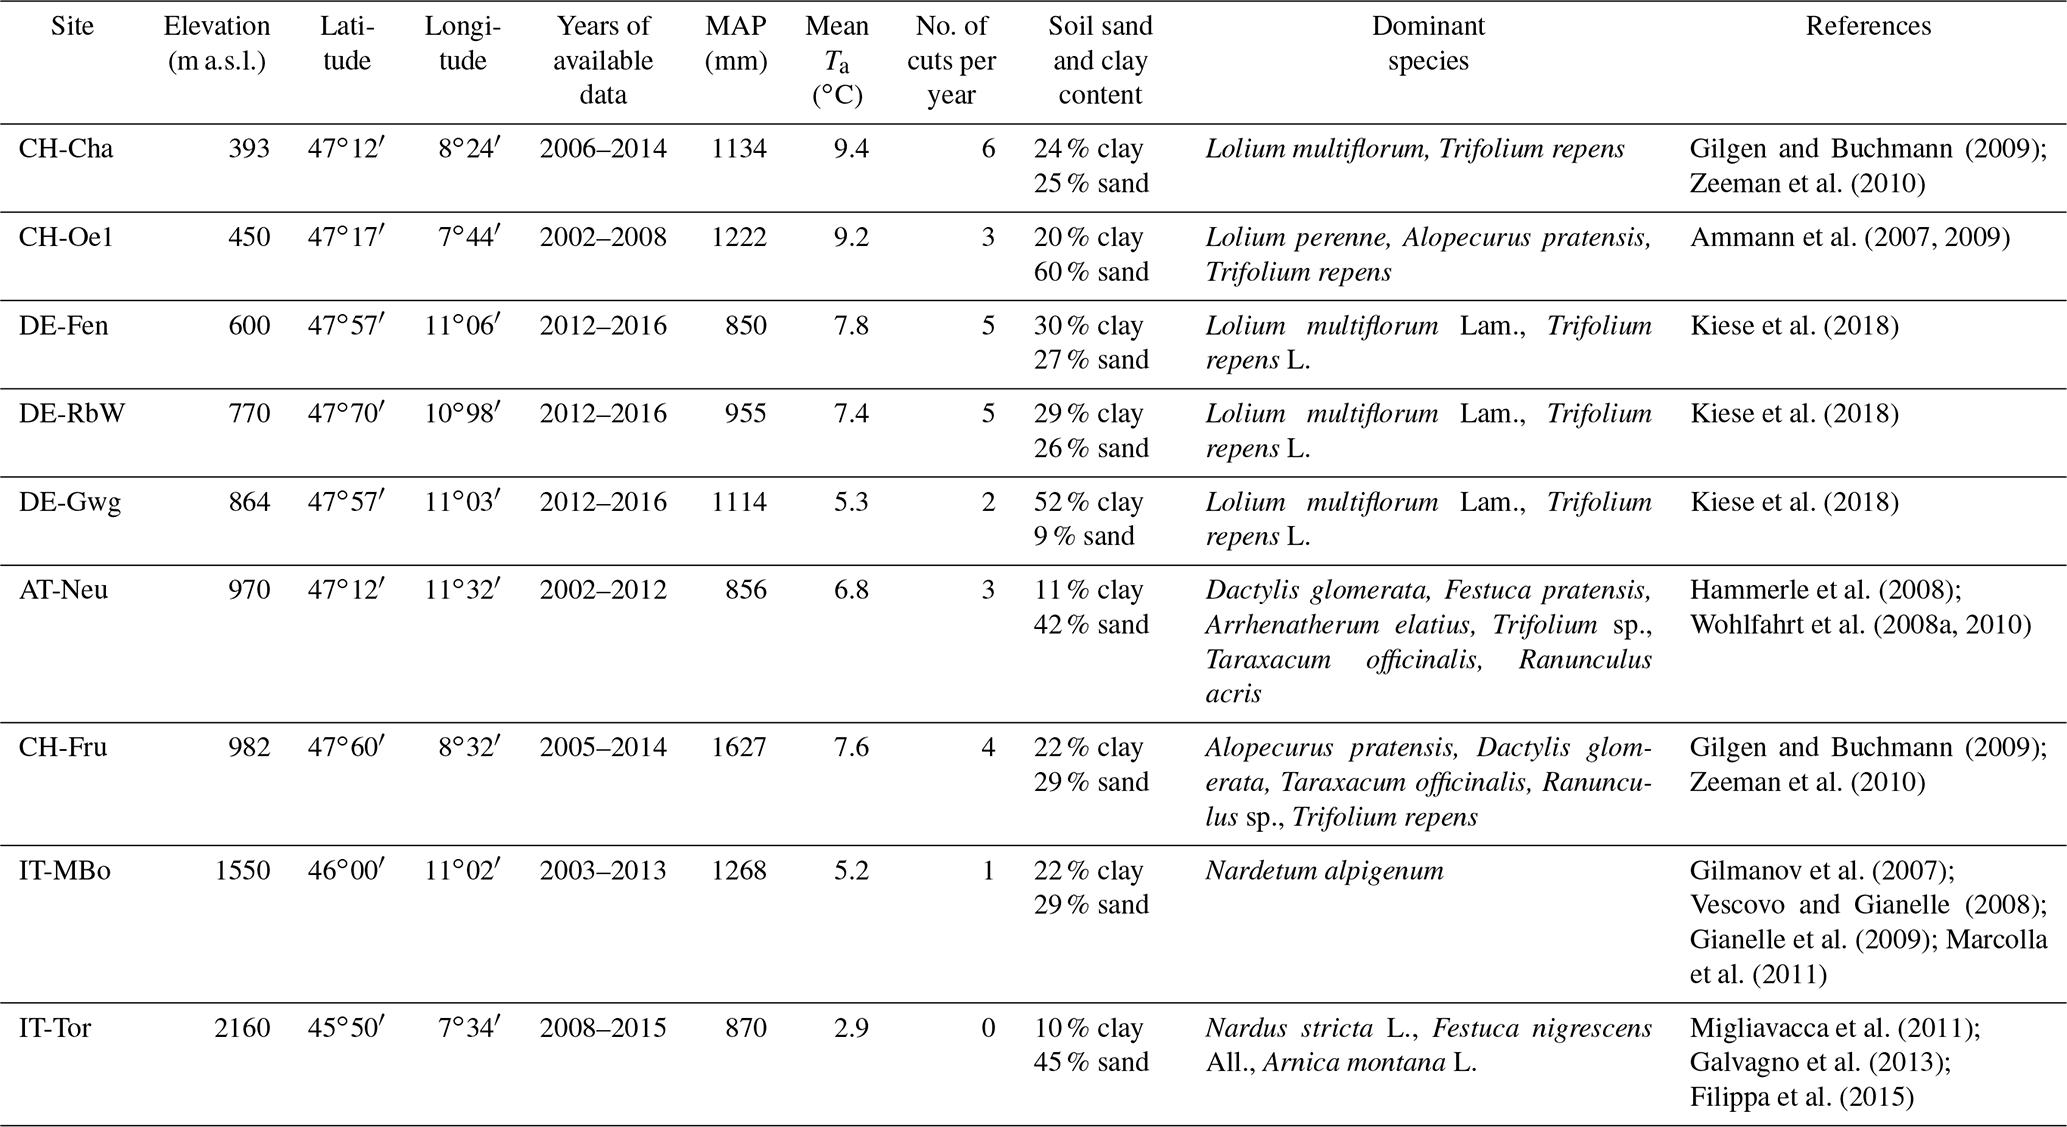
The study sites are located in the European Alps and cover an elevation gradient ranging between 393 and 2160 We used grassland sites in the Alpine region for which at least eddy covariance flux tower observations were available. For a subset of sites, additional observations about leaf area index, soil moisture, grass productivity, and water and nitrogen leaching were also available. Specifically, we used the sites of Torgnon (IT-Tor) and Monte Bondone (IT-MBo) in Italy; Oensingen (CH-Oe1), Chamau (CH-Cha), and Früebüel (CH-Fru) in Switzerland; Neustift (AT-Neu) in Austria; and Fendt (DE-Fen), Rottenbuch (DE-RbW), and Graswang (DE-Gwg) in Germany. The mean annual precipitation (MAP) across sites ranges between 850 and 1627 mm, while mean annual temperature varies between 2.9 and 9.5 ∘C following the elevation gradient (Table 1). All these sites are permanent grassland ecosystems, mainly used for fodder production (Ammann et al., 2007; Hammerle et al., 2008; Vescovo and Gianelle, 2008; Kiese et al., 2018). Apart from the site IT-Tor, which is unmanaged, the other grassland sites are managed with regular fertilizer applications and harvested with grass cuts at standard height (0.07 m).
Table 1Site characteristics. The following main site characteristics are reported: elevation, latitude, longitude, period for which measurements are available, mean annual precipitation (MAP), mean air temperature (mean Ta), number of grass cuts per year, and main references to original studies referring to the study sites. The values of MAP and mean Ta are computed from the available time series.
Each site is equipped with a flux tower providing time series of micrometeorological variables, as well as energy (e.g., net radiation, latent heat, sensible heat) and carbon dioxide fluxes by means of the eddy covariance (EC) method (Aubinet et al., 2012). The flux tower data for all the sites except the German ones are retrieved from the FLUXNET-2015 database (Pastorello et al., 2020). German sites (DE-Fen, DE-RbW, DE-Gwg) belong to the Pre-Alpine Observatory of the TERENO network (Zacharias et al., 2011; Pütz et al., 2016; Kiese et al., 2018), where lysimeters are also installed in proximity to the flux tower site (Fu et al., 2017, 2019; Zeeman et al., 2017; 2019).
For the stations DE-Fen, DE-RbW, and DE-Gwg, annual totals of lysimeter evapotranspiration (ET) and water leakage are retrieved for the years 2012–2014 from Fu et al. (2017, 2019). The same study provides annual DOC-C (dissolved organic carbon) and nitrate-N (N-) concentrations in the water leached at the bottom of the lysimeter. The ScaleX campaign of 2015 (Wolf et al., 2017; Zeeman et al., 2019) provided additional data concerning harvested biomass and its carbon and N content.
2.2 T&C-BG model
We simulate the grassland ecosystem dynamics in each site with the fully coupled terrestrial biosphere and ecosystem model T&C-BG, introduced by Fatichi et al. (2019), who provided a complete model description. T&C-BG combines a well-tested ecohydrological model (T&C, e.g., Fatichi et al., 2012a, b, 2014, 2015; Manoli et al., 2018; Mastrotheodoros et al., 2020) with a soil biogeochemistry module, which represents soil carbon and nutrient dynamics as well as plant mineral nutrition and multiple feedbacks between nutrient availability, plant growth, and soil mineralization processes. The T&C-BG model inputs include hourly local observations of microclimate (i.e., precipitation, air temperature, wind speed, relative humidity, incoming shortwave and longwave radiation, atmospheric pressure) and resolves the principal land-surface energy exchanges (i.e., net radiation, sensible and latent heat), which are interconnected with hydrological processes, such as evaporation and transpiration, infiltration, runoff, saturated and unsaturated zone water dynamics, groundwater recharge, and snow and ice hydrology dynamics. The soil hydrology module solves the 1-D Richard's equation in the vertical direction and uses a heat diffusion solution to compute the soil temperature profile. A soil-freezing module has also been recently introduced (Yu et al., 2020). The vegetation module computes photosynthesis, respiration, vegetation phenology, and carbon and nutrient budgets including allocation to different plant compartments and tissue turnover.
The management of vegetation such as grass cuts and fertilization can be prescribed as part of model inputs. The soil biogeochemistry module accounts for the carbon and nutrient budgets of litter and soil organic matter. Mineral nitrogen (N), phosphorous (P), and potassium (K) budgets and the nutrient leaching are also simulated. This study is particularly focused on . Nitrate pool in the soil depends on the net immobilization and/or mineralization fluxes, nitrogen uptake, nitrogen leaching, and nitrification and/or denitrification fluxes, with the latter that are simulated with empirical functions of the amount of and environmental conditions (detailed description in Fatichi et al., 2019). The transport process is not solved within the soil column, but leaching is assumed to occur at the bottom of the soil column and is proportional to the water leakage and bulk concentration in soil water in the soil biogeochemical active zone (Fatichi et al., 2019).
The model can be run in a distributed topographically complex domain (e.g., Mastrotheodoros et al., 2019, 2020), but here it is employed in its plot-scale version, which simply solves 1-D vertical exchanges. In summary, based solely on meteorological inputs, soil, and vegetation parameters, T&C-BG simulates prognostically all the other variables, from energy, carbon, and water fluxes via vegetation biomass up to soil nutrient mineralization and leaching. All these processes interact with each other.
2.3 Model parametrization
The model allows the simulation of different vegetation types, but in this case only grass is included. In order to keep results general enough and maximize future model transferability across grassland sites, we adopt a common parametrization for all of the nine sites with a few exceptions justified by elevation-dependent parameters such as threshold temperature for leaf onset. Vegetation parameter selection was based on previous experience with European grasslands (Fatichi et al., 2014; Fatichi and Pappas, 2017); soil biogeochemistry parameters are currently fixed for all sites in the absence of more specific information (see discussion in Fatichi et al., 2019). The site-specific soil content of clay, sand, and organic matter in each site is provided as input parameter to the model, which internally computes the hydraulic soil parameters by means of pedo-transfer functions (Saxton and Rawls 2006). To make results comparable, across all the sites, we assume a soil depth equal to 1.4 m, corresponding to the depth of lysimeters, which is discretized into 16 soil layers of increasing depth from the surface to the bedrock. The biogeochemistry active zone is fixed at 25 cm depth, and the grass roots are assumed to be exponentially distributed with a maximum rooting depth of also 25 cm. We do not simulate the groundwater dynamics, but we compute the groundwater recharge as the water leakage at 1.40 m depth. The parameters selected for all simulations are detailed in Table S1 in the Supplement where the few site-specific parameters are highlighted in bold.
In each site we force the model with the local meteorological conditions, while atmospheric CO2 concentrations are assumed to follow the observed historical global trend (Keeling et al., 2009). Nutrient depositions in the absence of local specific information for each site are set using global maps of recently observed values for nitrogen and phosphorus (Galloway et al., 2004; Mahowald et al., 2008; Vet et al., 2014).
Simulations corresponding to the described setup are used for evaluating the model performance before running the scenario analysis, and they represent the reference simulations. We evaluate the model performance against an ensemble of diverse variables. First, we compare simulated and observed net radiation, latent heat, sensible heat, gross primary production (GPP), and net ecosystem exchange (NEE) using flux tower data. Second, we test the hydrological module by comparing the effective soil saturation (e.g., normalized soil moisture) from the model and from local measurements. Third, we evaluate the vegetation module comparing the simulated biomass and/or leaf area index (LAI) dynamics with data retrieved from literature wherever available (Ammann et al., 2007; 2009; Hammerle et al., 2008; Gilgen and Buchmann, 2009; Zeeman et al., 2010; Chang et al., 2013; Finger et al., 2013; Filippa et al., 2015; Prechsl et al., 2015). Finally, we compare biogeochemical fluxes in terms of harvested nitrogen and carbon, as well as leaching of and DOC. The evaluation of the soil biogeochemistry module is possible only for the sites DE-Fen, DE-RbW, and DE-Gwg (equipped with lysimeters); however, differences in scale, soil properties, and timing of management between flux tower footprint and lysimeters exist (Oberholzer et al., 2017; Mauder et al., 2018).
Detailed manure input data for all the case studies were not available. To bypass this problem, whenever we did not have information about fertilization (i.e., in all sites except in the German ones), we assume that the cut grass is left on the ground only for the reference simulations. Such a hypothesis is clearly unrealistic, because it opposes the purpose of the grassland management (i.e., producing yields), but it guarantees a nearly closed nutrient cycle, thus performing the same function of fertilizers, but providing the most targeted fertilization possible. While aiming at testing the model performance on the baseline scenario, such a hypothesis is preferred to assuming a fertilization rate for each site to avoid excessive or insufficient nutrient addition.
In DE-Fen, DE-RbW, and DE-Gwg, the sites where both the flux tower and the lysimeters are co-located, grassland is managed slightly differently above the lysimeters and in the flux tower footprint. To validate model results, we ran multiple simulations, each fed with the corresponding management of either flux tower or lysimeter plots.
Since the current initial conditions of the carbon and nutrient pools in the soil are unknown, as is common in modeling studies, we spin up carbon and nutrient pools running only the soil-biogeochemistry module for 1000 years using average climatic conditions with prescribed litter inputs taken from preliminary simulations with the soil-biogeochemistry module inactive. Then we used the spun-up carbon and nutrient pools as initial conditions for the hourly scale fully coupled simulation over the period for which hourly observations are available. This last operation is repeated two times, which allows for reaching a dynamic equilibrium. We compare available observation of soil C : N values retrieved from literature with the values resulting from such a spin-up process.
2.4 Numerical fertilization experiments and climate change scenario
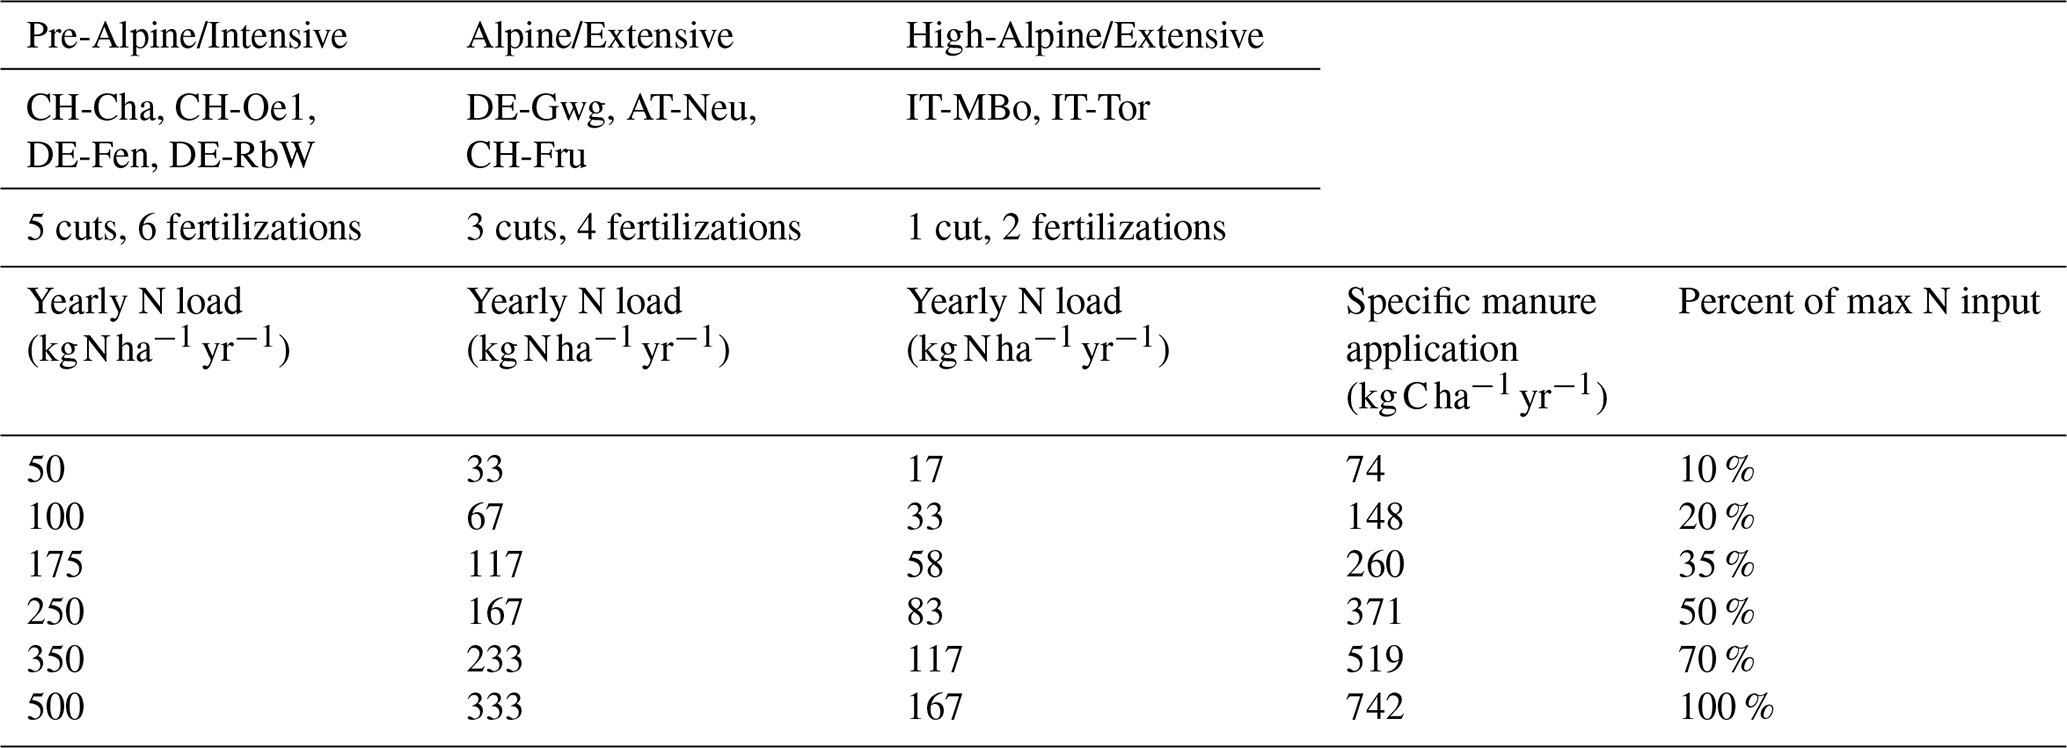
We set up numerical experiments to test the response of the study sites to different manure application regimes under historical climate and with modified temperature and atmospheric CO2 conditions potentially representative of the future. First, we classify the sites based on elevation and management. We defined pre-Alpine/Intensive sites as those located at elevations lower than 800 and intensively managed (CH-Cha, CH-Oe1, DE-Fen, DE-RbW), Alpine/Extensive for sites with an altitude between 800 and 1000 and extensively managed (DE-Gwg, AT-Neu, CH-Fru), and high-Alpine/Extensive sites as those above 1000 and extensively managed, which include the two grasslands of IT-MBo and IT-Tor. It is common practice among farmers to fertilize at the beginning of the growing season and after each cut. The numbers of cuts and manure applications during the year decrease with elevation. Although the time intervals between cuts can be similar, the length of the winter dormant period ultimately determines growing season length and, in turn, the number of cuts, the volume of locally needed organic fertilizer, and the opportunity to bring that out into the field. We aligned the management strategy of our numerical experiments to these notions and used a classification of the sites into three groups. In our simulations, manure is applied 6, 4, and 2 times, and the grass is cut 5, 3, and 1 times, respectively, in pre-Alpine, Alpine, and high-Alpine sites. Grass is cut at a height of 0.07 m, following common practice. Referring to literature (Ammann et al., 2007, 2012; Merbold et al., 2014; Fu et al., 2017), we identified a broad range of possible N yearly loads applied in grasslands. For pre-Alpine sites, the simulated range spans between 50 (i.e., extensive management) and 500 (highly intensive management). This upper limit intentionally exceeds the actual management practices and allows us to analyze what can happen if fertilization loads are increased. We computed the corresponding single application amount of manure based on C : N ratio of manure equal to 8.9, which is reported for the sites of DE-Fen, DE-RbW, and DE-Gwg (Fu et al., 2017) and is also similar to values suggested in literature (Sommerfeldt et al., 1988; Nyamangara et al., 1999) or slightly lower (Zhu, 2007; Kumar et al., 2010). The input of P and K is assumed to be proportional to the N input based on assigned N : P and N : K values, guaranteeing non P- or K-limited conditions to the system. The specific manure amount computed for pre-Alpine sites is applied for Alpine and high-Alpine sites at the corresponding lower frequencies. The resulting annual loads in all the scenarios are reported in Table 2. For each fertilization scenario, in each site, we spin up the system running the soil-biogeochemistry module for 1000 years under average climatic conditions and the specific management scenario. Thus, the initial conditions of each simulation correspond to the final state of the spin-up simulation run for each specific site and management scenario. Finally, we run each management scenario in each site under both historical and modified climate scenario, representing the latter with an increase in atmospheric CO2 concentration of 250 ppm and an increase in air temperature of +3 ∘C.
Table 2Numerical experiments. The sites are divided into pre-Alpine, Alpine, and high-Alpine sites based on the elevation in which they are located. For each class, the numbers of cuts and manure applications as well as the yearly N load injected in the different modeling experiments are reported. The specific manure application is the same for each site class, but the total amount varies across classes as the number of yearly applications is different. The results are presented as a function of the percentage of max N input, reported in the table for each experimental setup.
In the results analysis, we focus our attention on the resulting N contribution to grass productivity and on the N lost as leaching at the bottom of the soil profile. The former represents one of the positive gains from agriculture as economic activity and the latter a negative externality into the environment, as most leaching will ultimately reach the groundwater storage and the rivers. We evaluate the different management strategies by bringing together the two indicators in an index computed as the ratio of harvested N to N- leachate. The higher the value of the index, the most favorable is the management strategy for both farmers and the environment. Thus, we interpret this index as a proxy of the efficiency of the grassland in profiting from the N added in fertilization. We also analyze potential relations between such an efficiency index and site-specific characteristics, such as the elevation and the percentage of precipitation that becomes groundwater recharge. We further assess the impact of increased atmospheric CO2 concentration and temperature on the short term by comparing the results of the historic and modified climate scenarios. We compare variables such as water leakage, harvested N, and N leaching, and we analyze their implications for the efficiency index.
3.1 Model evaluation
The performance of the model in representing the energy and carbon fluxes measured from the flux towers is good across all the sites. The R2 values of the model and observations comparison are reported in Table 3, and further goodness of fit metrics are reported in Table S2 in the Supplement. The seasonality of the energy and carbon fluxes is well represented across all the study sites, as illustrated by the pattern of latent heat shown in Fig. 2 and the patterns of sensible heat H, GPP, and NEE reported in Figs. S1, S2, and S3 in the Supplement, respectively. One exception is the NEE seasonality in sites where top soil freezing is simulated as IT-MBo, with NEE peaking later in the model.
Table 3Coefficient of determination (R2) of the simulated vs. observed energy and carbon fluxes from flux tower data.
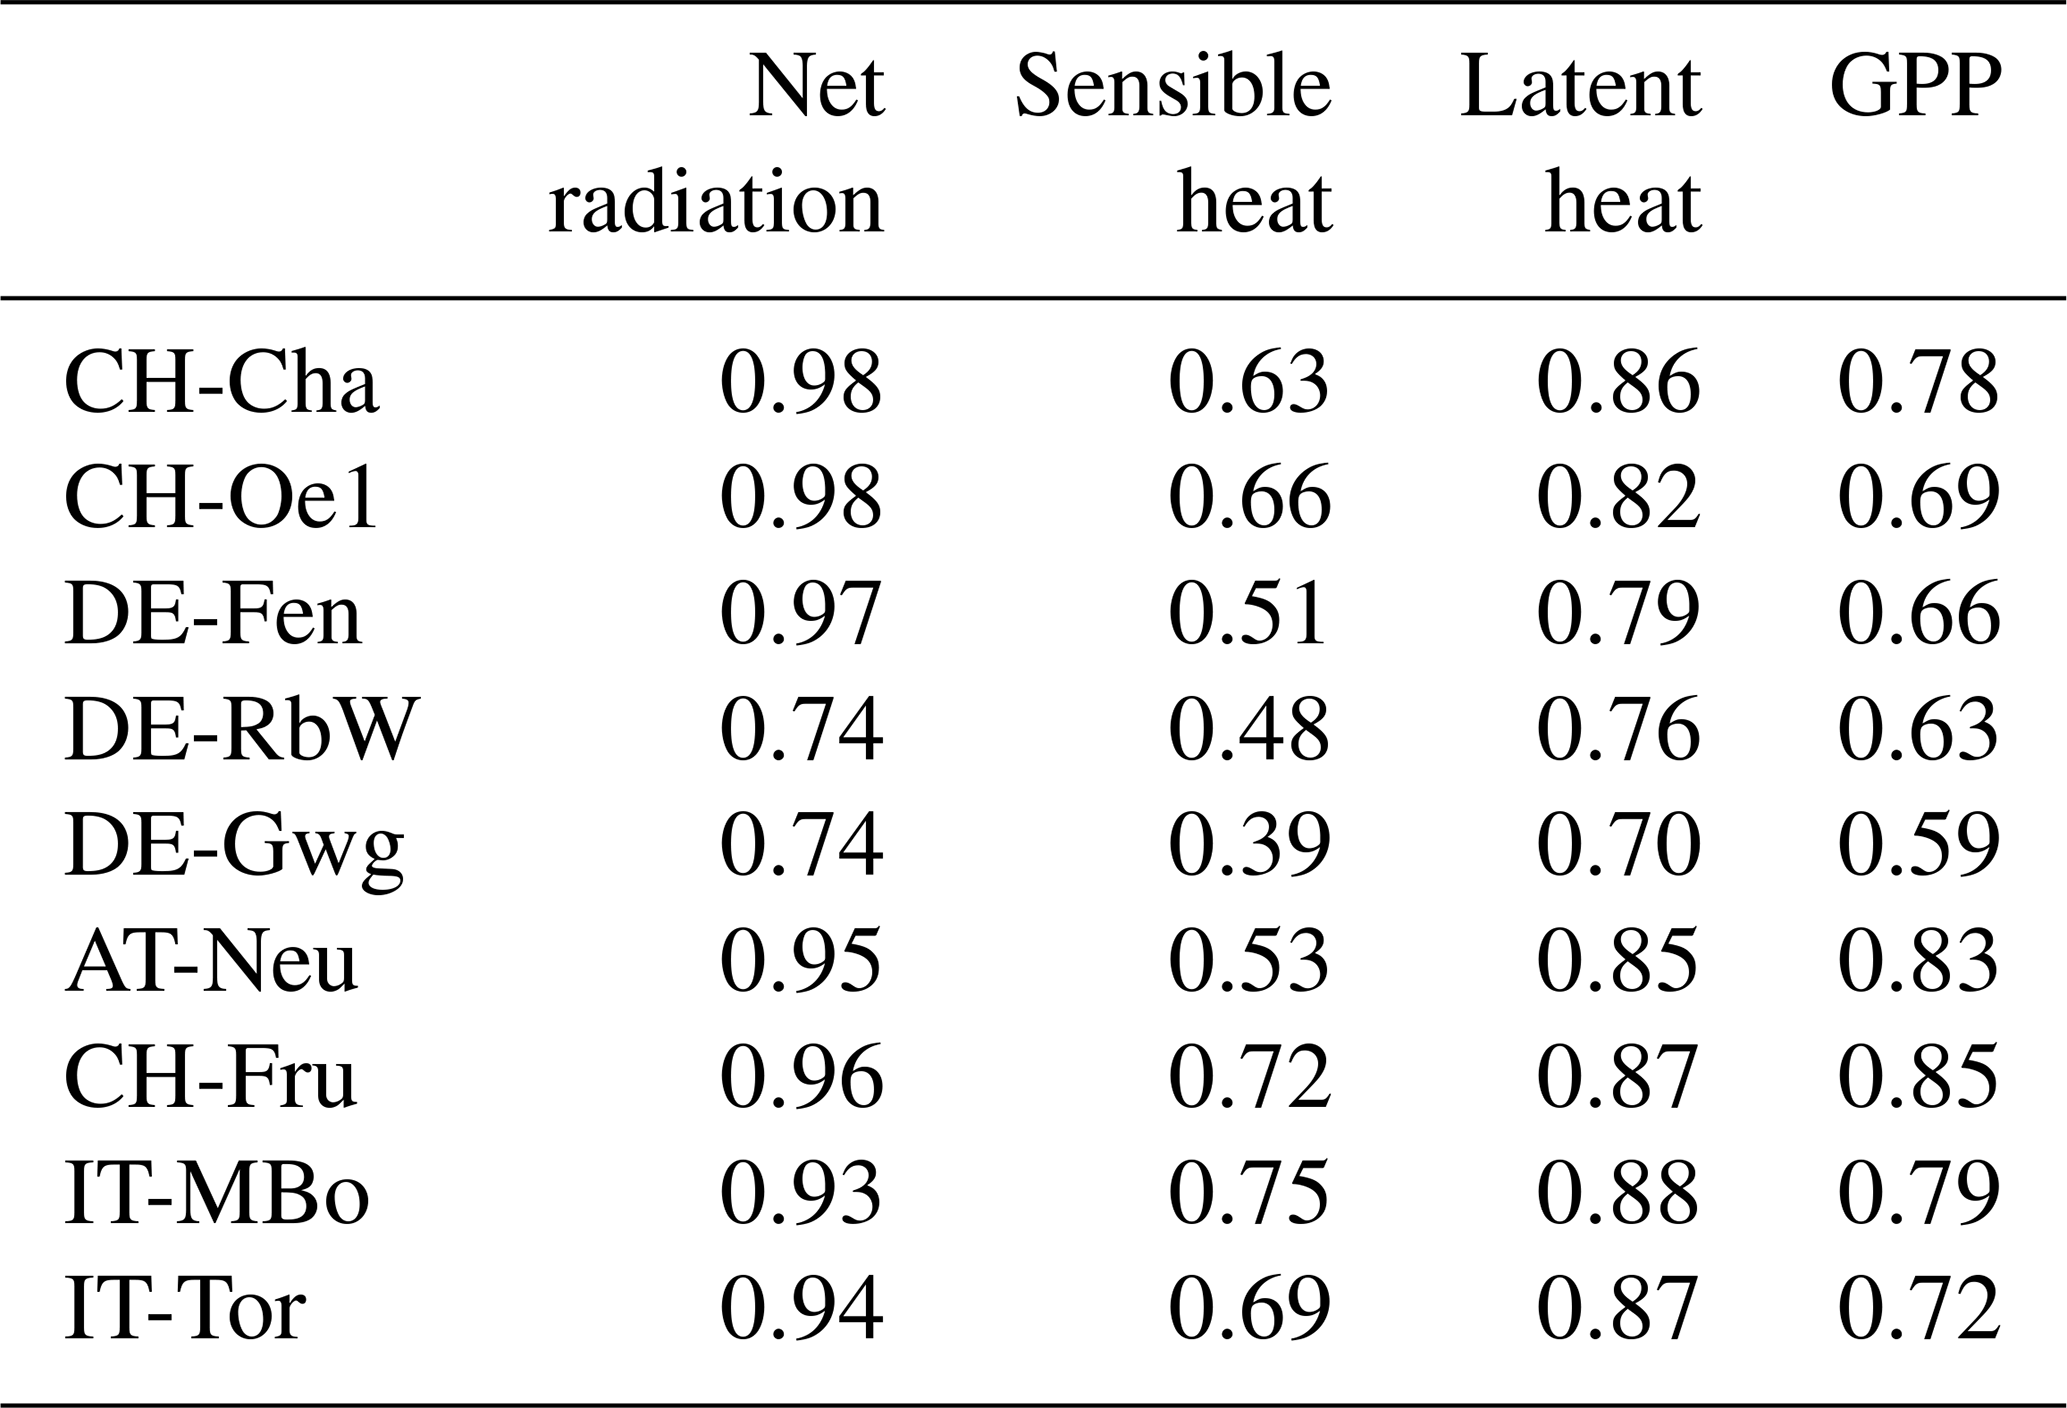
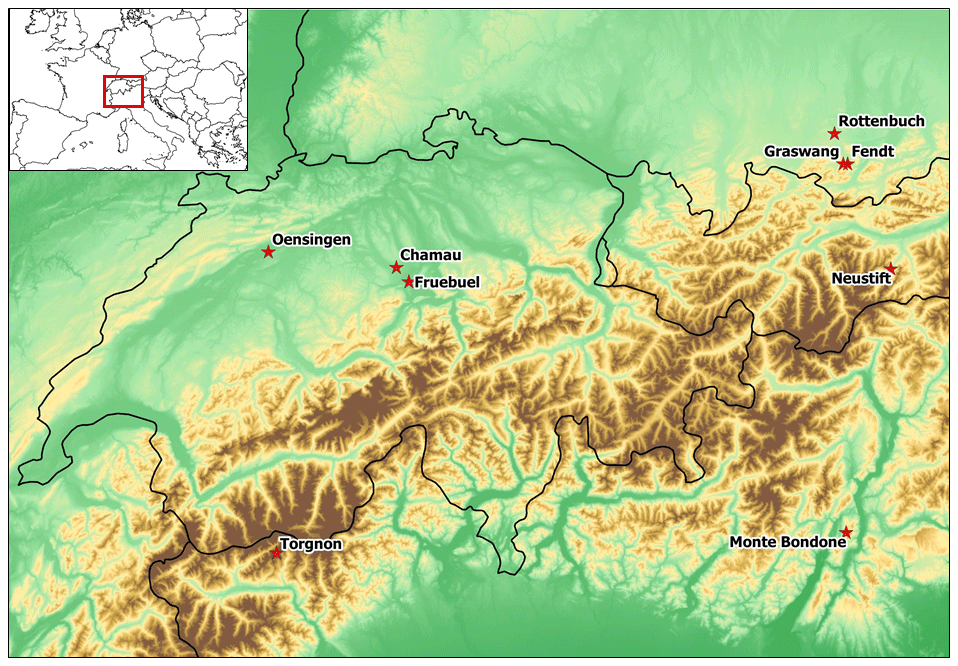
Figure 1Location of the study sites. The nine sites are located across the European Alps in Italy (IT-Tor, IT-MBo), Switzerland (CH-Cha, CH-Oe1, CH-Fru), Austria (AT-Neu), and Germany (DE-Fen, DE-RbW, DE-Gwg). The map was produced by the authors, the map with country borders was retrieved from “Made with Natural Earth”, and the DTM (digital terrain model) is from SwissTopo.ch.
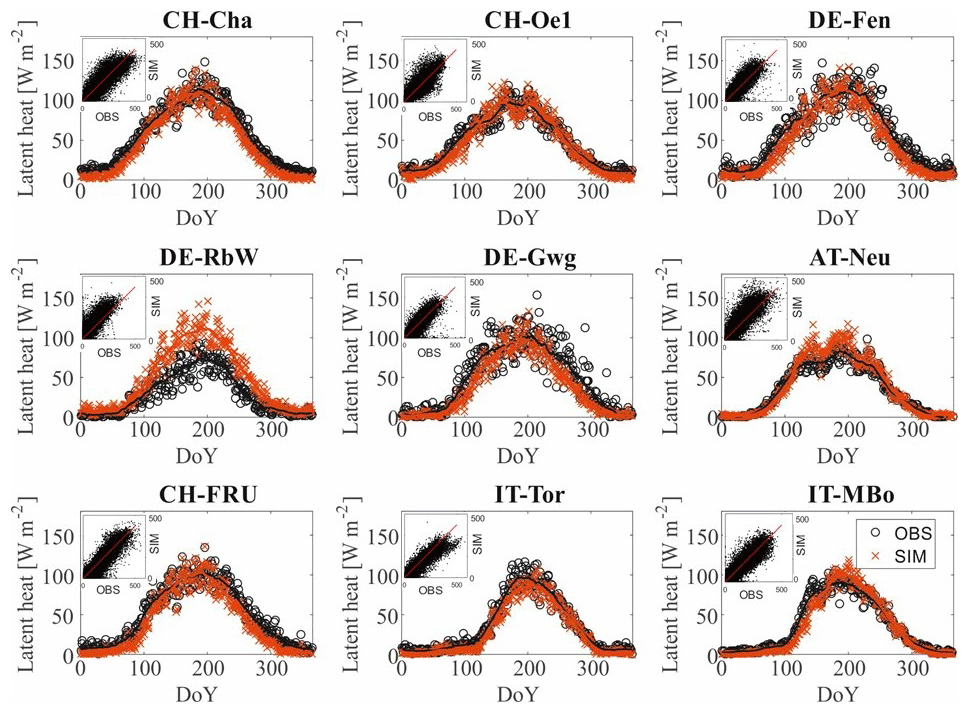
Figure 2Observed versus simulated seasonal daily latent heat fluxes. We compare the observed (black circles) and simulated (red crosses) seasonal pattern of latent heat computing the average value for every day of the year (DoY) considering all the years for which observations are available. We also apply a moving average with a centered window of 30 d (continuous lines). In the upper left corner of each subplot, a scatter plot comparison of the hourly values of observed and simulated latent heat is shown. In red is plotted the 1:1 line.
We show the comparison between the observed and the simulated effective saturation of the soil (Fig. 3) to evaluate the hydrological dynamics. The intra-annual pattern is generally well captured by the model. The average coefficient of determination R2 equals 0.49, and the average RMSE is 0.10. Results highlight the pedo-climatic differences across the Alpine region. Some sites tend to reach field capacity quite easily (e.g., DE-Fen, DE-RbW, and DE-Gwg); in other sites effective saturation is often below 50 % (CH-Cha, CH-Oe1, AT-Neu, and CH-Fru). The high-Alpine sites IT-Tor and IT-MBo fall into this second case but with pronounced peaks of saturation when snowmelt occurs.
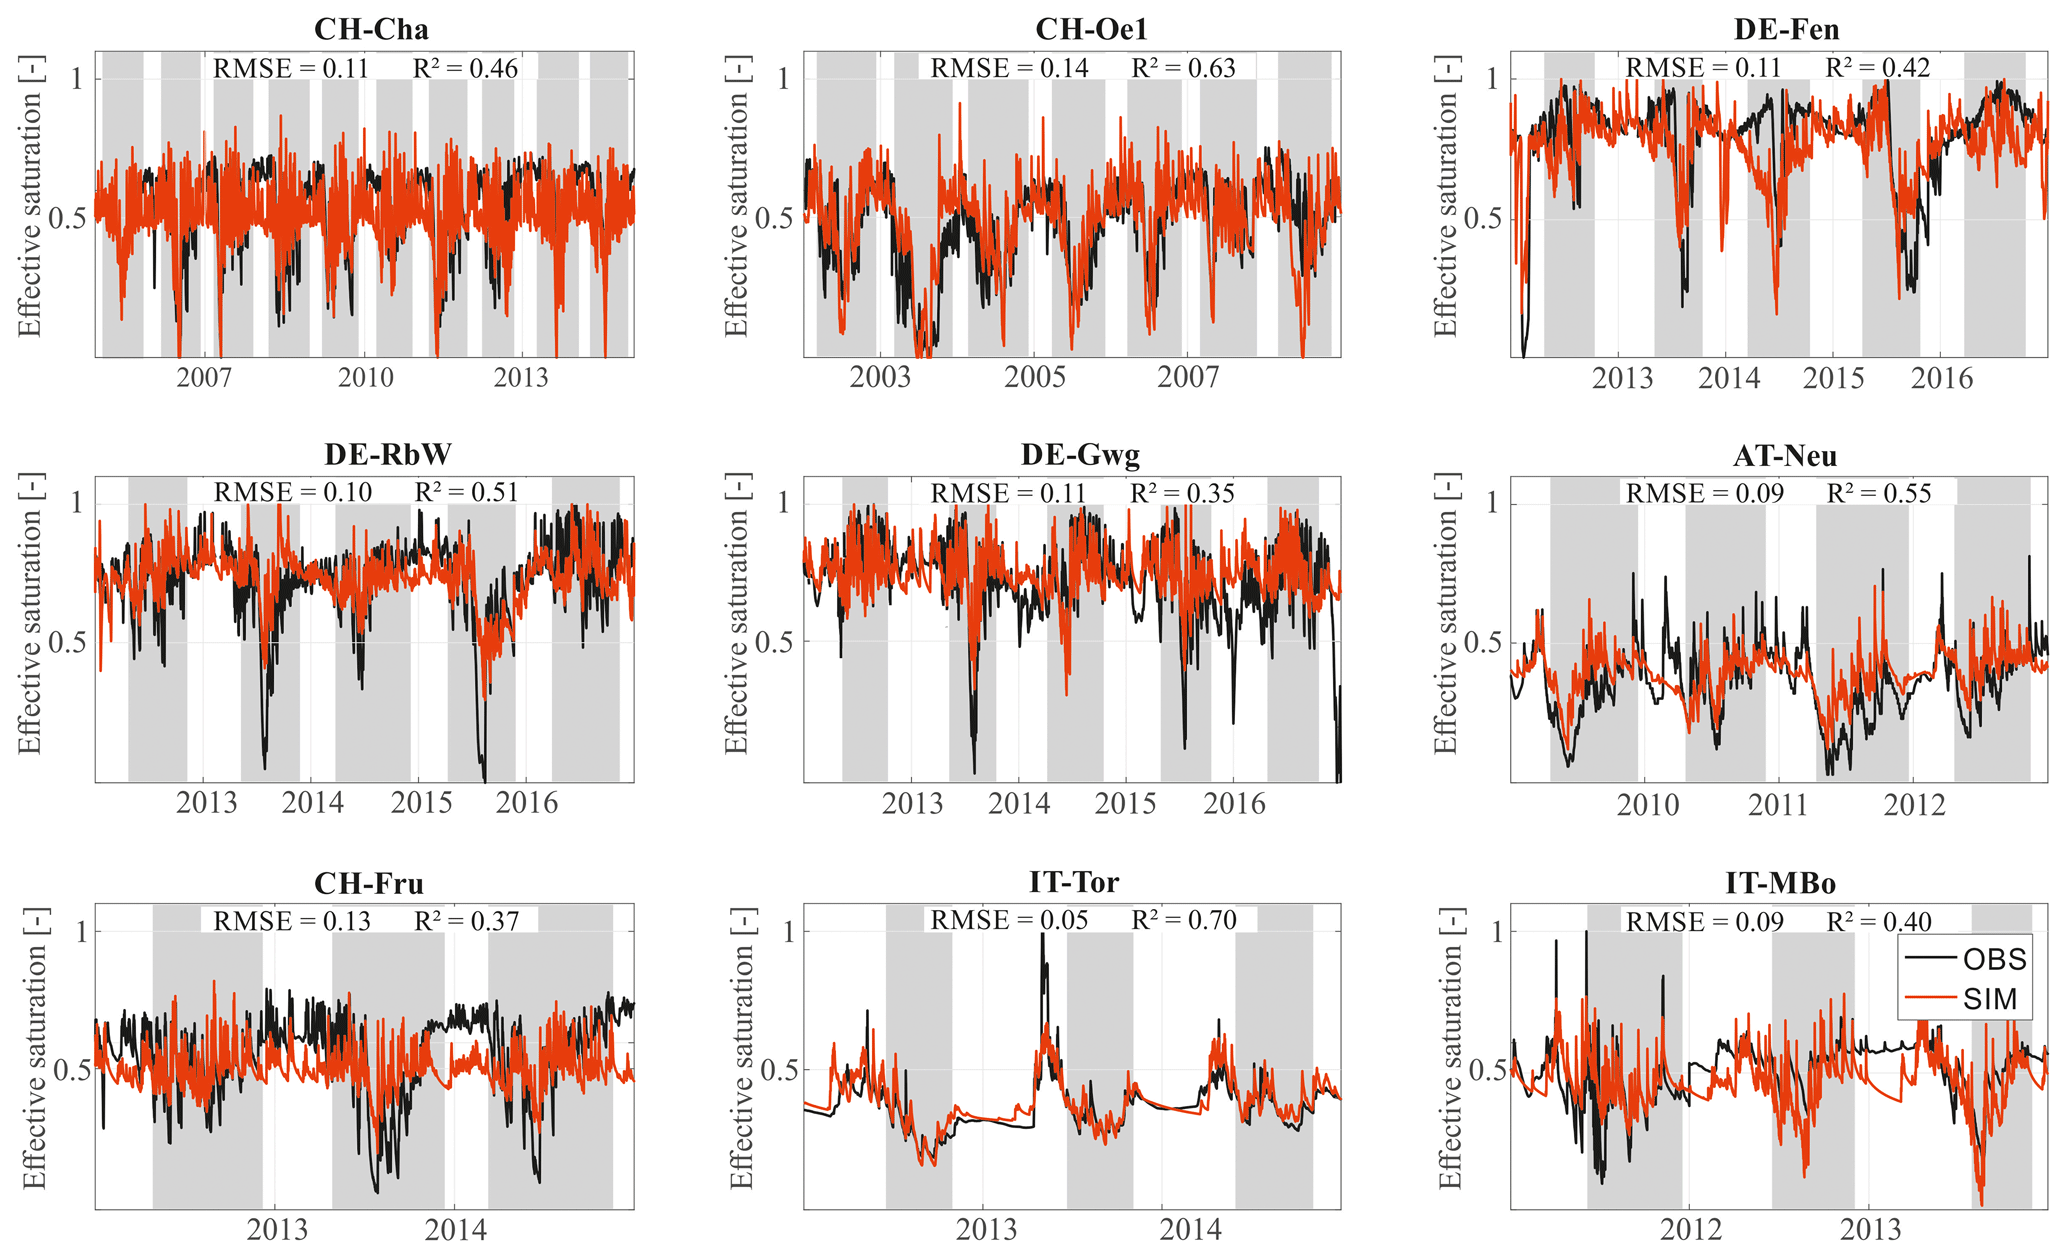
Figure 3Observed vs. simulated daily effective saturation. We compare the observed (black) and measured (red) pattern of the effective saturation across all the sites. In CH-Cha, AT-Neu, CH-Fru, and IT-Tor soil water content is measured at 5 cm depth; in CH-Oe1 and IT-MBo it is at 10 cm depth; and in DE-Fen, DE-RbW, and DE-Gwg it is at 12 cm depth. The goodness of fit metrics room-mean-square error (RMSE) and coefficient of determination (R2) are reported for each station in each subplot. Gray areas represent the growing seasons for each year and site.
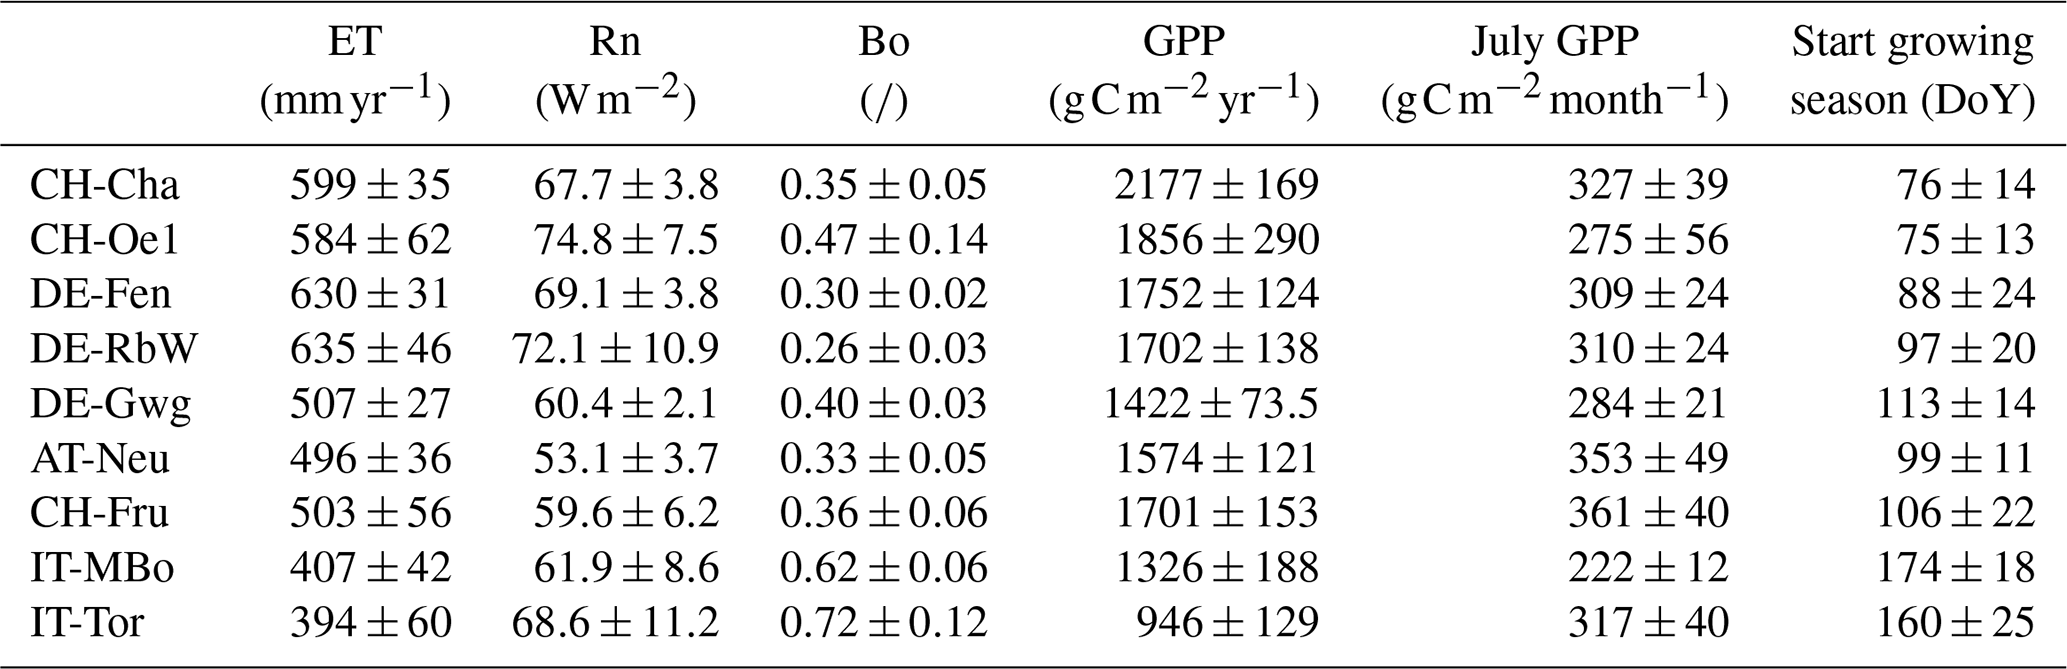
A summary of the simulated site-specific variables in terms of water, energy, and carbon fluxes is shown in Table 4. The total net radiation does not vary consistently with elevation. As a result of temperature constraints, latent heat decreases with increasing elevation, leading to lower ET in high-Alpine sites, as the higher values of the Bowen ratio for the high-Alpine sites indicates. Phenology is also affected by elevation, and the average day of the year when the simulated growing season starts (taken as the mean day when the biomass is higher than the biomass threshold at cut height) increases with increasing elevation. It spans from mid-March in the pre-Alpine site CH-Cha to mid-May in the high-Alpine sites of IT-MBo and IT-Tor. Consequently, the mean yearly GPP is higher when the growing season starts earlier. For instance, the resulting mean annual GPP in CH-Cha is more than double compared to IT-Tor. However, the average GPP of the month July only, intended as a proxy for the GPP in the maximum growth period, does not differ much across the sites, and lower values are rather indicative of water limitations, testifying to similar levels of productivity in the peak of the summer regardless of the site elevation.
Table 4Simulated energy, water, and carbon fluxes at each site. The mean annual evapotranspiration (ET), mean annual net radiation (Rn), mean annual Bowen ratio (Bo), mean annual gross primary production (GPP), mean gross primary production in the month of July (July GPP), and the mean day of the year in which the growing season starts (Start growing season) are reported. The values are reported as mean ± standard deviation of the interannual variability.
The model evaluation against grass biomass dynamics clearly shows that snow presence on the ground limits the growing season at higher altitudes (Fig. 4). The model responds to the interannual variability of the snow cover. In years with large snow accumulation, the growing season starts later compared to years with a less persistent snow pack. For instance, the years 2011 and 2013 in IT-Tor are characterized by lower and higher than average snow depth, respectively. The following growing seasons are anticipated and delayed in both simulations and observations, respectively.
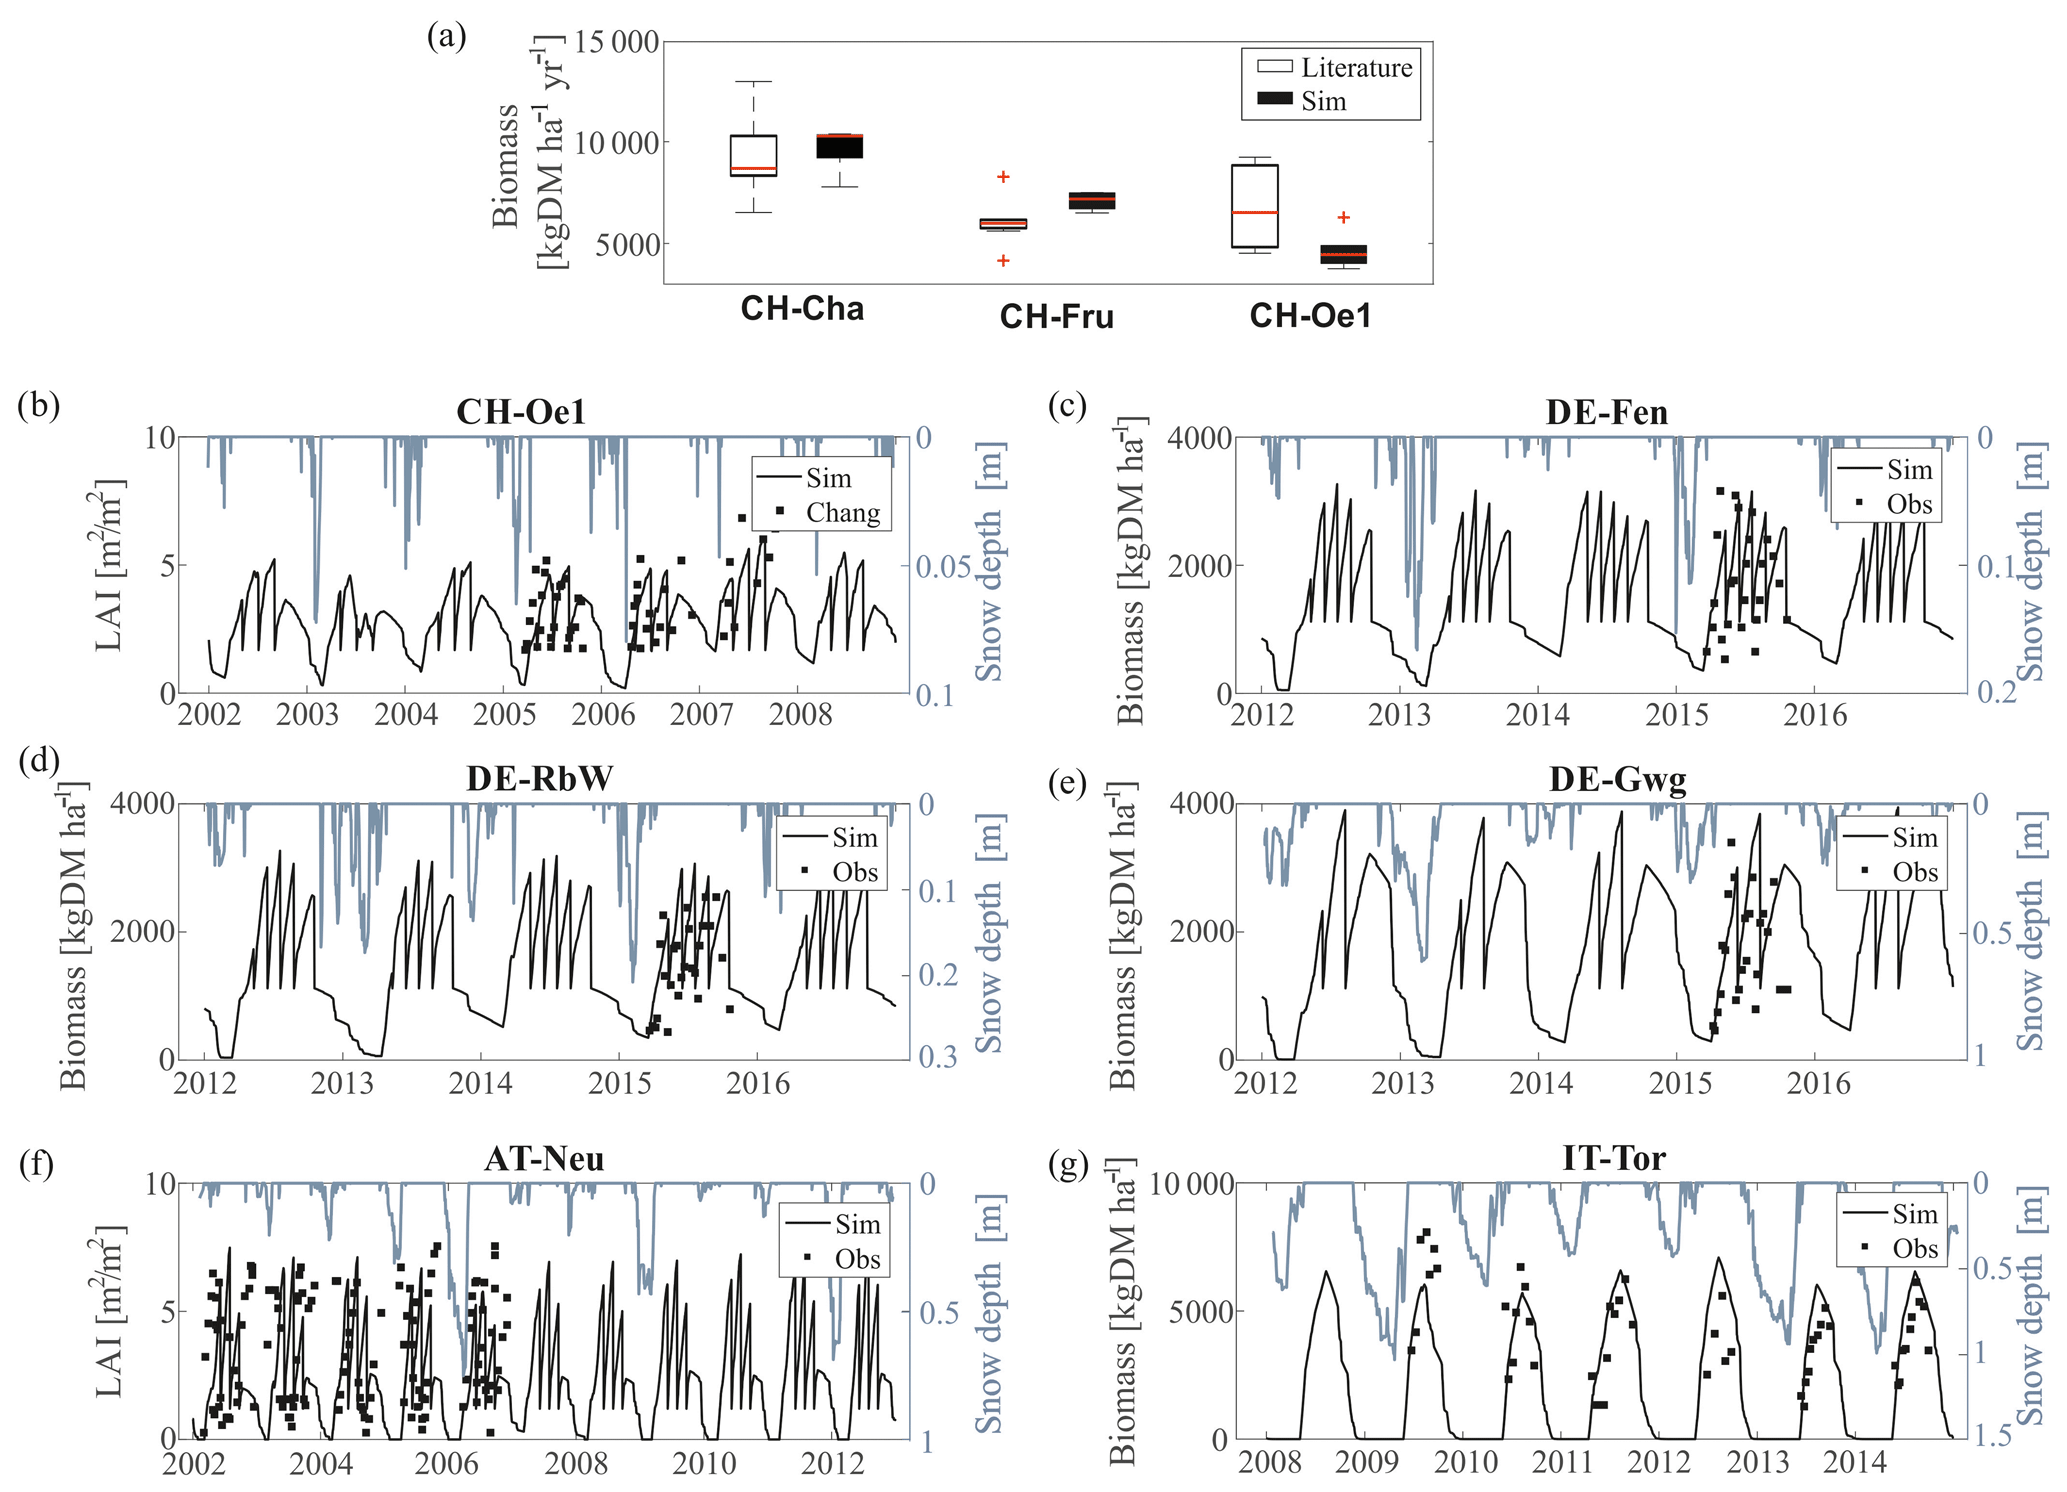
Figure 4Observed versus simulated leaf biomass and LAI. (a) The simulated mean yearly harvested biomass in CH-Cha, CH-Fru, and CH-Oe1 are compared with published values. For CH-Cha, data are extracted from Gilgen and Buchmann (2009), Zeeman et al. (2010), and Prechsl et al. (2015). For CH-Fru, we compare with data from Gilgen and Buchmann (2009) and Zeeman et al. (2010). For the site CH-Oe1, we compare simulated values with data reported by Ammann et al. (2009). (b) LAI in CH-Oe1 is compared with observations from Chang et al. (2013). (c–e) Biomass data for the sites in Germany (DE-Fen, DE-RbW, and DE-Gwg) were provided by the ScaleX campaign 2015 (Zeeman et al., 2019). (f) LAI data in AT-Neu were digitalized from Wohlfahrt et al. (2008b). (g) For biomass data in IT-Tor, observations were provided by the Environmental Protection Agency of Aosta Valley (Filippa et al., 2015). In all the subplots, we compare the simulated biomass or LAI (black line) with observations (black dots), and simulated snow depth (gray line) is also shown.
In CH-Cha, CH-Fru, and CH-Oe1 the total simulated harvested biomass falls within (or is very close to) the range reported by observational studies. Considering the large variability in published biomass estimates across sites and even within the same site, it is difficult to conclude if such differences are a model shortcoming or simply dictated by observation uncertainty. In CH-Oe1 the LAI dynamics are also well captured. The simulated biomass and LAI patterns in DE-Fen, DE-RbW, and DE-Gwg fit the more detailed field data for 2015 (Fig. S4 in the Supplement). Also, the LAI in AT-Neu is simulated well, and the length of growing season and the range of variability of available observations are matched. However, there are discrepancies on the exact dynamics of grass cuts in several sites, most pronounced at AT-Neu. These are expected as grass cuts are prescribed at regular intervals in the model, while they may occur irregularly in reality (for instance dictated by specific weather conditions), and they might also vary from year to year. The simulation in IT-Tor matches quite well the magnitude of the grass biomass and the beginning of the growing season but overestimates its length by approximately 1 month, which explains the major discrepancy between simulated and observed LAI and leaf biomass.
Simulations of the lysimeter data in DE-Fen, DE-RbW, and DE-Gwg provide the opportunity to test the soil biogeochemical dynamics and especially nutrient leaching as well as biomass productivity. The harvested dry matter and, consequently, also harvested nitrogen are considerably underestimated by the model compared to the lysimeters data. The simulated mean annual leaching of DOC in the years 2012–2014 shows values of the same magnitude of observations across all the three sites. The model estimates accurately N- leaching in DE-RbW and DE-Gwg, while it underestimates it in DE-Fen, where observations vary more than for the other sites (Fig. 5).
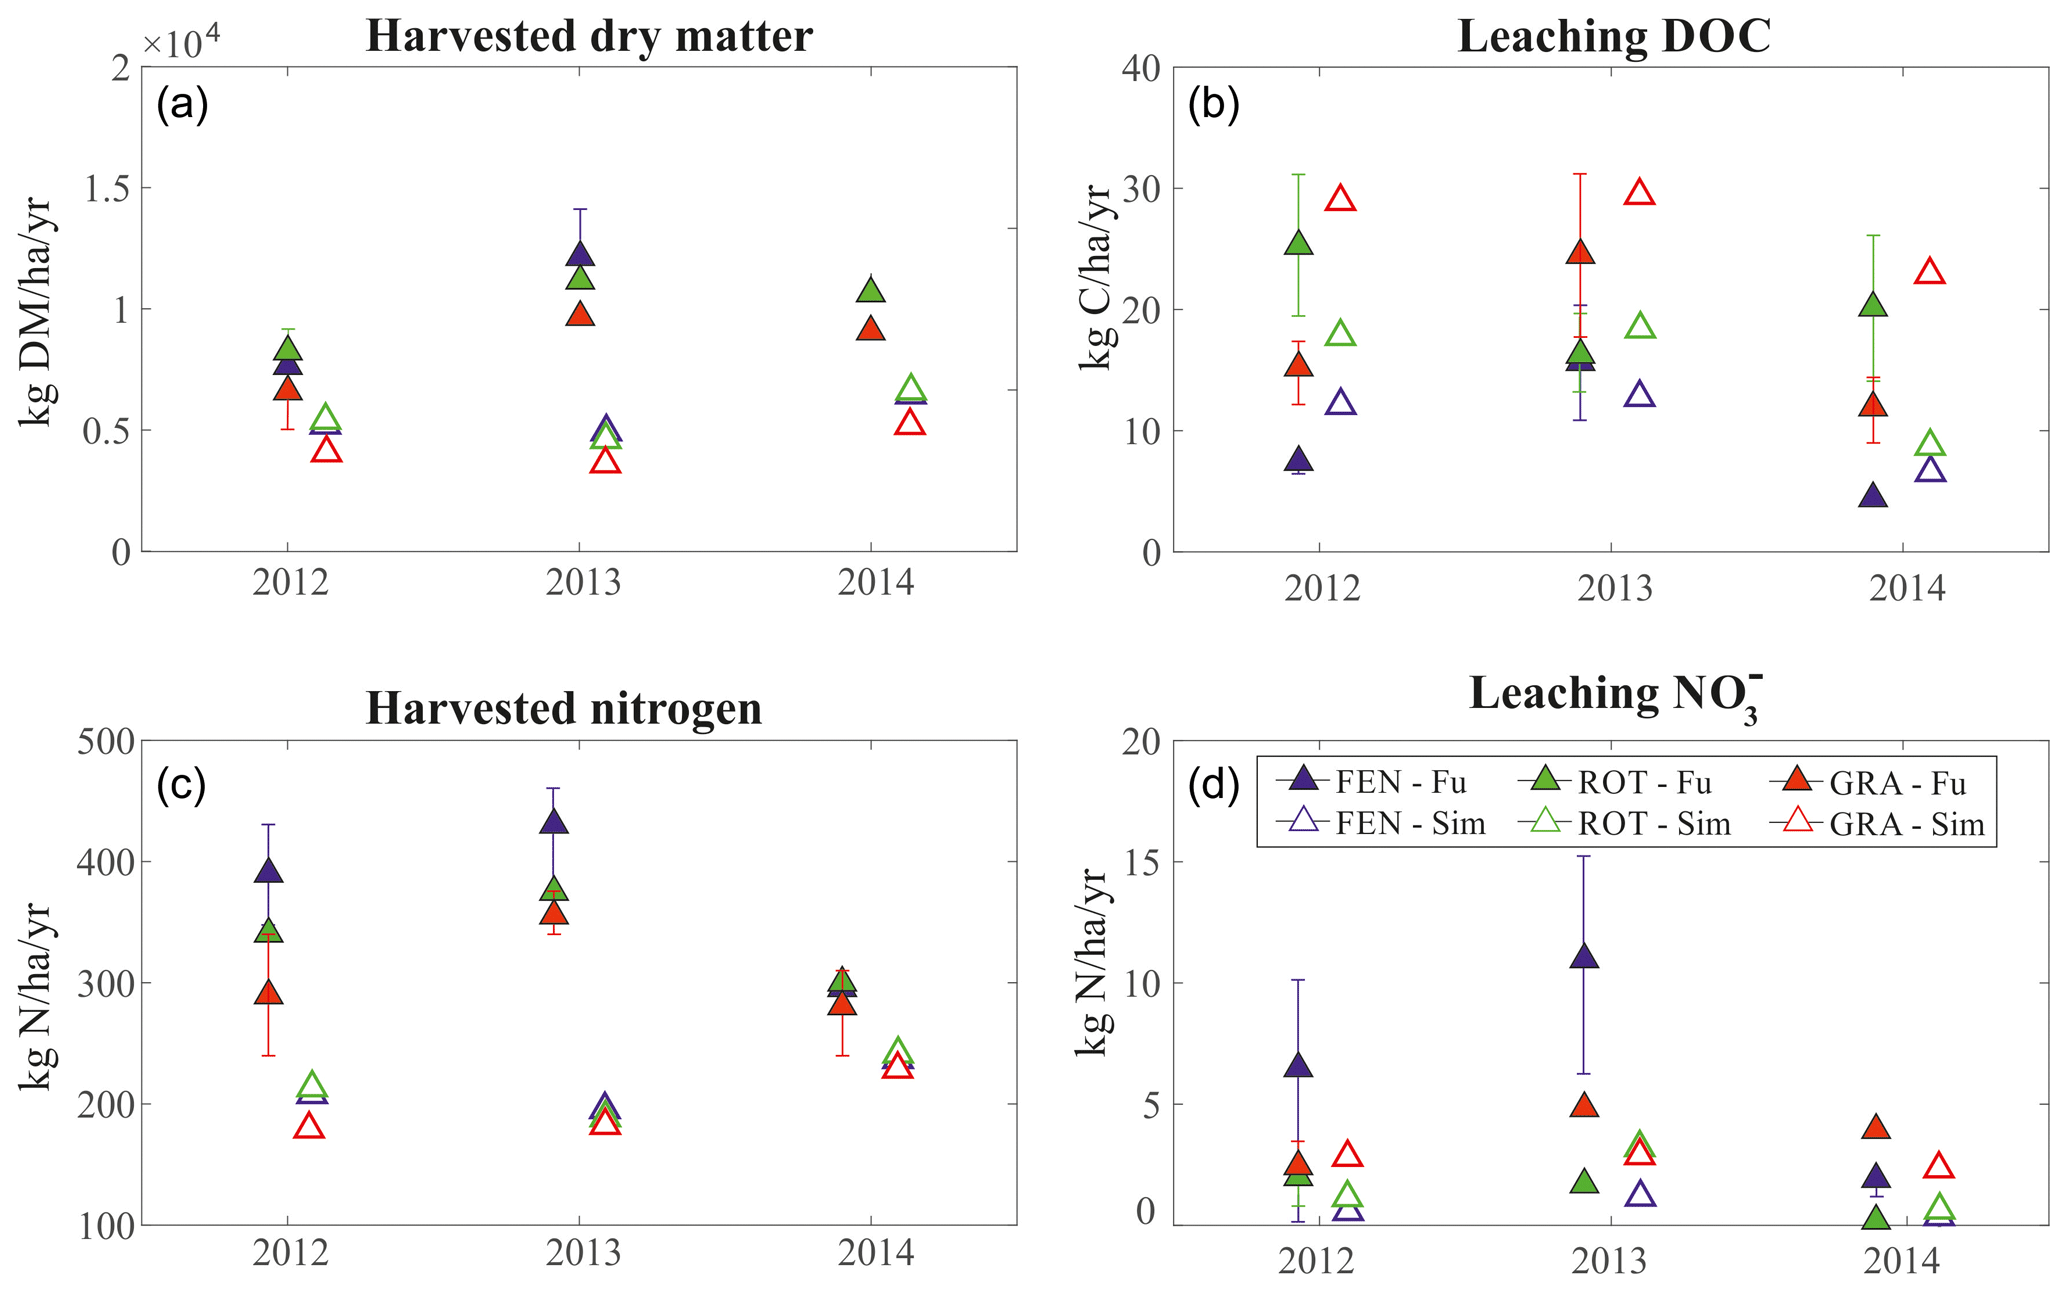
Figure 5Biogeochemistry module evaluation. Observed versus simulated (a) harvested dry matter, (b) leaching of DOC, (c) harvested nitrogen, and (d) leaching of . Simulated annual totals (empty triangles) are compared with annual totals (full triangles) reported by Fu et al. (2017, 2019) in DE-Fen (blue), DE-RbW (green), and DE-Gwg (red). The uncertainty bars represent the 25th and 75th percentiles of observations.
Since the information required to initialize the model carbon and nutrient pools is not available, we a posteriori compare the C : N values obtained through the spin-up process with the values reported in literature for each site (Table S3 in the Supplement). Although measurements might be affected by considerable uncertainty, it is clear that the model underestimate the observed C : N ratio (Table S3). In the sites of DE-Fen and DE-RbW, simulated C : N soil ratio are 5.29 and 5.00, respectively, while the observed values are much higher (8.8 and 8.9, respectively). Such discrepancy might be due to the combination of the relatively low C : N of litter and the low C : N of manure used in the simulations, which is fixed to 8.9 as suggested by literature (Fu et al., 2017). To ensure that this assumption is not problematic, we perform a series of simulations for the site DE-RbW, fertilizing the system with manure characterized by an increasing C : N spanning from 10 to 25 but preserving the absolute amount of N introduced in the ecosystem. As expected, the soil C : N increases with increasing manure C : N (Fig. S7a in the Supplement), while the simulated leaching of N and net primary production (NPP) do not remarkably change across the experiments (Fig. S7b and c). These results highlight the importance of the site's history for the determination of the exact C : N value, but at the same time they suggest that this is not particularly critical in the model to determine nitrogen leaching and grassland productivity, which are controlled by the actual amount of N, rather than by C : N.
3.2 Numerical fertilization experiments
The simulated concentrations in the leaching flux span 2 orders of magnitude, ranging between 0.03 and 12 mg L−1 (Fig. 6a), compared to an environmental limit of 50 mg L−1 in Europe (EEC, 1998). In this case we prefer comparing rather than -N concentrations to the widely known threshold of 50 mg L−1 imposed by the European Directive. The high-Alpine site IT-Tor exhibits the highest concentration, increasing almost monotonically with increasing nitrogen input (Fig. 6a). The other high-Alpine site IT-MBo shows concentrations comparable to the other sites but with higher interannual variability. Except for IT-Tor, for the other sites, the concentration in leaching does not increase monotonically with the input in the range of N inputs between 30 % and 50 % of the maximum fertilization (Fig. 6a).

Figure 6Results of the fertilization experiments. (a) concentration in groundwater recharge as a function of different nitrogen fertilization scenarios (percentage of the maximum) in each site. (b) Harvested N in each site as a function of different nitrogen fertilization scenarios. (c) Harvested N vs. N leaching in each site. Moving counterclockwise follows the increase in N input. As a reference, the biggest marker indicates N input of 100 %. The dotted lines represent the estimate of maximum losses assumed by EU regulations or nearby countries. They correspond to the values 17 and 51 , i.e., 10 % and 30 % of the maximum allowed input of 170 . (d) N fertilization efficiency index computed as the ratio between the harvested N and N concentration in groundwater recharge as a function of nitrogen input. In all the subplots the colors represent the elevation class, i.e., pre-Alpine (red), Alpine (blue), and high-Alpine (yellow) sites. The colored area around the markers and lines represent the 25th and 75th percentiles of the interannual variability of the simulated variables, while the colored lines connecting data points represent the median values. The vertical dashed bars represent the limit of 170 imposed by the EU Nitrate Directive in each of the three classes.
The variability of leaching concentration is remarkable not only across sites belonging to different elevation classes but also within the same elevation range. The largest variability among sites of similar elevation is in the N input range of 30 % to 50 % of the maximum N fertilization. For example, the difference in leaching concentration between AT-Neu and CH-Fru at 50 % of maximum fertilization is comparable to the difference between the leaching obtained in AT-Neu increasing the N load from 50 % to 100 %. The same observation applies to the pre-Alpine sites of DE-Fen and CH-Oe1.
Harvested N as a function of the nitrogen fertilization in the high-Alpine sites IT-MBo and IT-Tor differs remarkably from the other sites (Fig. 6b). At these high-Alpine sites, the harvested N does not considerably increase with increasing N inputs, as grass productivity is likely constrained by other factors than N. For the other sites, a clear increase in harvested N emerges for N fertilization spanning from 10 % to about 40 % of the maximum. For values higher than 40 %, there is not much gain in simulated harvested N (and thus biomass) regardless of the increased nutrient availability.
When results are summarized in the harvested N versus N leaching space, this difference is more pronounced (Fig. 6c). Patterns of pre-Alpine and Alpine sites partly overlap but occupy a distinct space away from high-Alpine sites. High-Alpine sites show a limited range of variability of harvested N compared to the range of leaching . Beyond a certain threshold of N input, also the other pre-Alpine and Alpine sites show limited increase in harvested N. Also note that for lower N input the leaching is relatively stable, while harvested N and thus grass biomass increase. The N contributing to grass growth is 1 order of magnitude higher than the leaching N in the high-Alpine sites. In comparison, for pre-Alpine and Alpine sites it is 2 orders of magnitude higher, testifying to a closer N cycle despite more intensive fertilization.
When the harvested N and the N concentration in groundwater recharge are combined into a ratio, we obtain an index, which depicts the efficiency of the fertilization practice (Fig. 6d). Ideally, this index should be maximized to obtain a win-win situation which maximizes grass yield and minimizes water quality issues. When plotting the index as a function of the percentage fertilization, the pre-Alpine and Alpine sites exhibit a range where the index is maximum. This range is between 20 % and 60 %. Specifically, CH-Cha, CH-Oe1, DE-Fen, DE-Gwg, and CH-Fru exhibit the highest value at 20 % of the fertilization input (67–100 ), DE-RbW at 35 % of the maximum load (175 ), and AT-Neu at 50 % of the maximum load (167 ). The high-Alpine sites do not exhibit any optimum but only a monotonically decreasing line, as N fertilization does not stimulate growth but rather increases leaching.
As a matter of fact, correlating the efficiency index with the elevation (, p=0.05) of each site shows a predominant decreasing trend with increasing elevation (Fig. 7a). However, there are exceptions such as CH-Oe1, DE-Gwg, and CH-Fru showing low index despite relatively low elevation. The correlation of the index with the fraction of precipitation, which is lost through groundwater recharge, provides an even better descriptor (, p=0.02) of the fertilization efficiency. We also correlate the index to the soil hydraulic conductivity (Fig. S6), but the correlation is not significant (, p=0.47). Low water leakage fractions are associated with a higher value of the N efficiency index (CH-Cha, DE-Fen, DE-RbW, AT-Neu), while sites characterized by higher groundwater recharge have a low index (CH-Oe1, DE-Gwg, CH-Fru, IT-MBo, IT-Tor), highlighting a dominant hydrological control beyond soil-element biogeochemistry. In the sites CH-Oe1, CH-Fru, IT-MBo, and IT-Tor the high groundwater recharge also corresponds to high soil hydraulic conductivity (Ks), while in DE-Gwg Ks is relatively small (Fig. S6). On the contrary, in AT-Neu the groundwater recharge fraction is relatively small, and the N efficiency index is high despite a high hydraulic conductivity (Fig. S6).
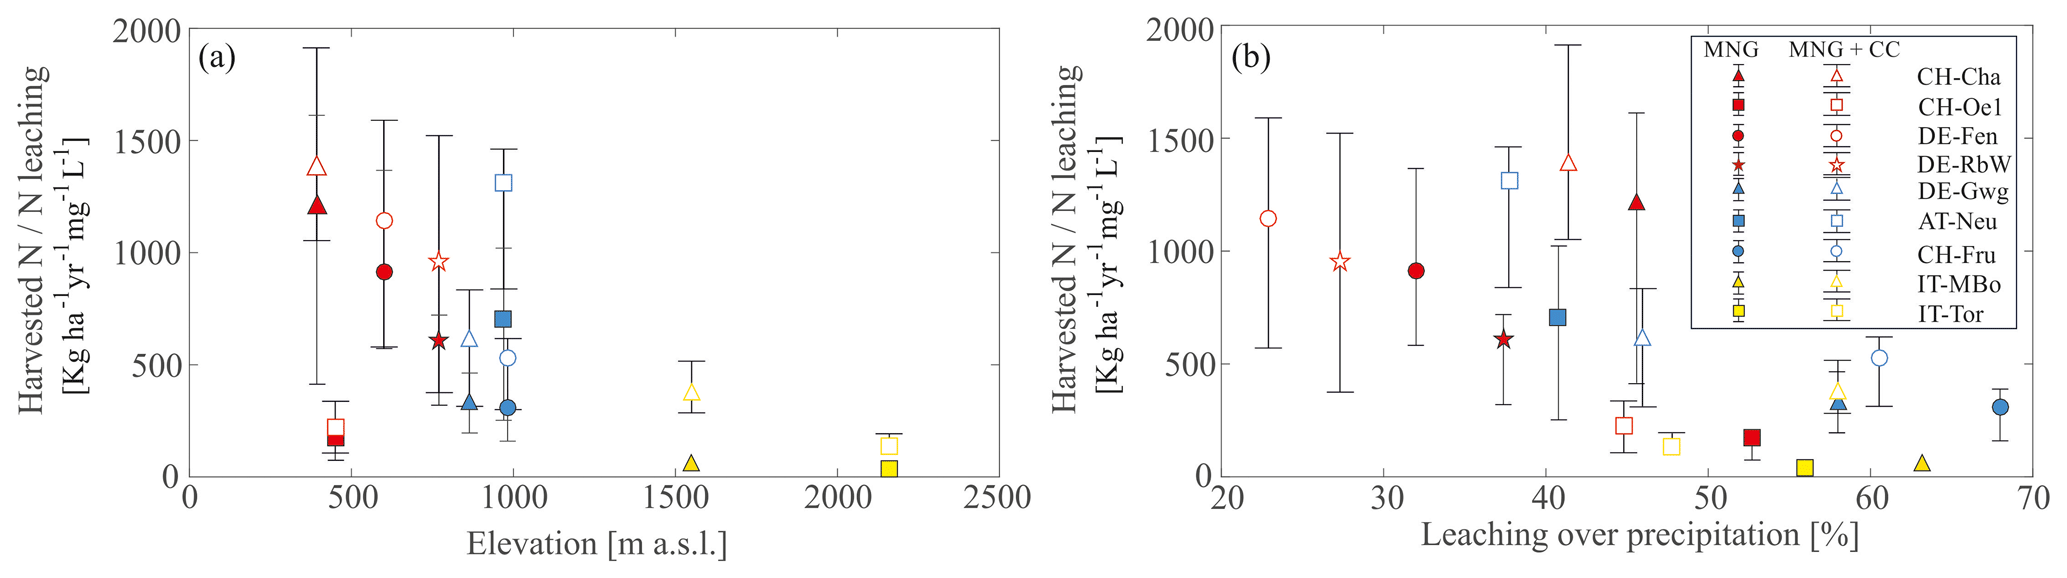
Figure 7Ratio between harvested N and N leaching concentration as a function of site characteristics. (a) Harvested N to N leaching concentration as a function of elevation in each site. (b) Harvested N to N leaching concentration as a function of the percentage of yearly water recharge to groundwater over the yearly precipitation. In both plots the whiskers span the 25th and 75th percentiles of the interannual variability. Full markers refer to management scenarios (MNG in the legend) with the historical climate, while empty markers refer to management plus climate change (MNG + CC in the legend) scenarios.
3.3 Numerical climate change experiments
An increase in air temperature of +3 ∘C and CO2 of +250 ppm result in higher grassland productivity and a change in the water balance with higher ET. Specifically, ET increases on average across all the sites of 88 mm (8.2 %), while water leakage decreases by a corresponding quantity in millimeters to close the water budget (Fig. 8). The enhanced productivity of grasslands leads to higher yields, which, however, do not increase at the same rate across the different sites. While pre-Alpine and Alpine sites are simulated to experience an average yield increase of 17 % compared to the current climate scenario, grasslands in high-Alpine sites are expected to produce up to +73 % (IT-MBo) and +120 % in (IT-Tor) (Fig. 8). The reason for such a variability resides in the different increases in the length of the growing season. With higher temperature, the sites IT-MBo and IT-Tor would benefit from a 25 and 45 d longer growing season, respectively, while the other sites would experience a 13 d longer growing season on average. Despite such a high relative increase, the absolute yields in high-Alpine sites would still be remarkably lower than in pre-Alpine and Alpine sites (Fig. S5a in the Supplement). For the same N input, the N losses to the environment through leaching are expected to decrease for modified climate conditions compared to the historical climate (Fig. 8).
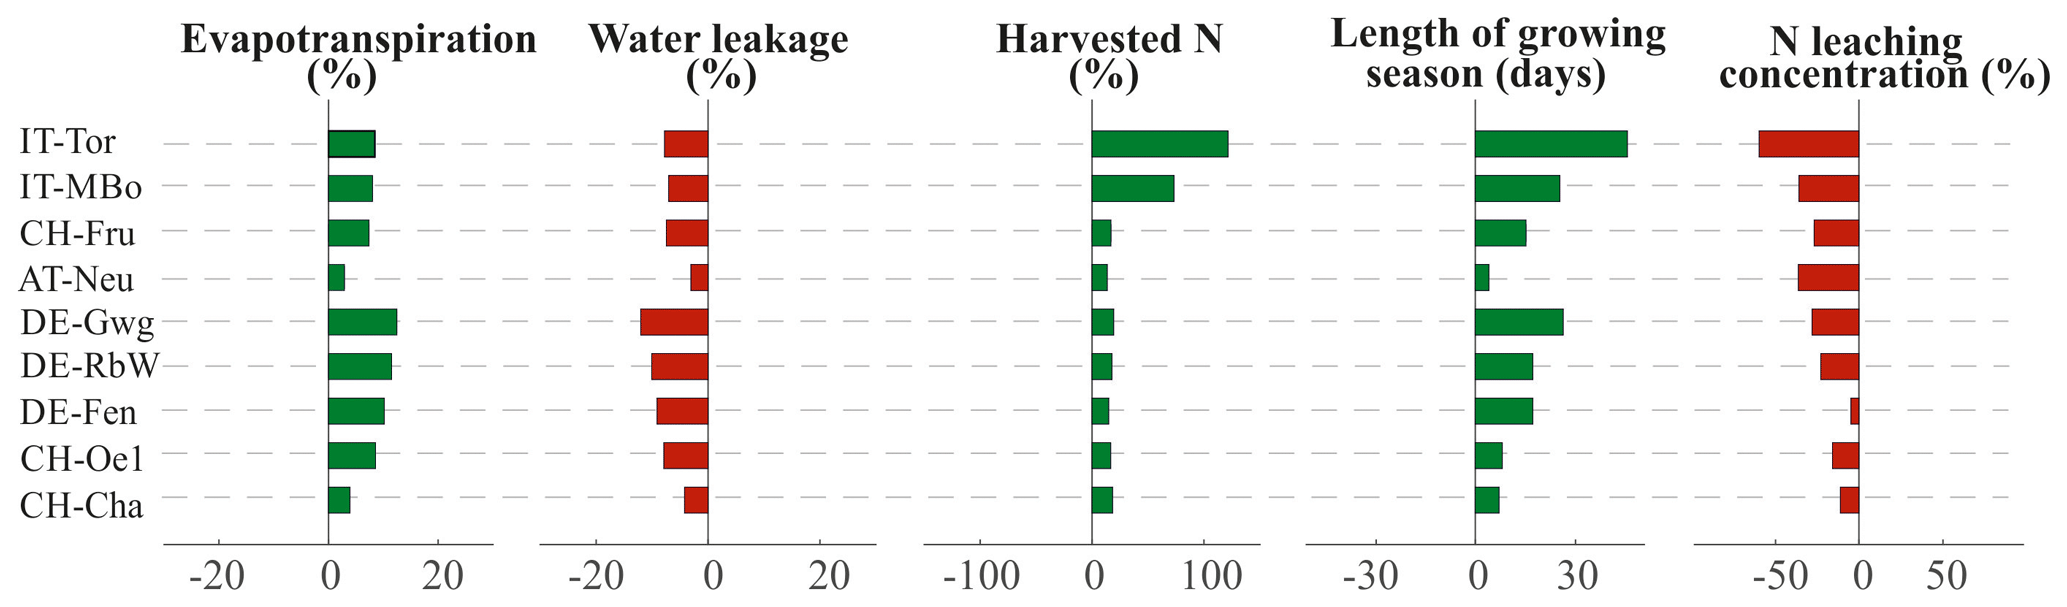
Figure 8Changes in evapotranspiration, water leakage, harvested N, length of the growing season, and N concentration in leaching under the influence of modified climate (+3 ∘C and +250 ppm). The bar plots indicate the average percentage change of the management scenarios when run under historical and modified climate scenario. The variation in the length of growing season is expressed in days. Red bars refer to a decrease in the variable under modified climate, while green bars represent an increase.
As a result, the efficiency index generally increases, highlighting a more efficient use of N (Fig. S5b) and in some cases (i.e., DE-Fen, DE-Gwg, CH-Fru) the optimal N input may also increase. The efficiency index still shows a predominant decreasing trend with increasing elevation (Fig. 7a), although the correlation is weaker (, p=0.14) compared to the historical climate, while the fraction of precipitation which is lost through groundwater recharge is still confirmed to be a very good descriptor (, p=0.02) of the fertilization efficiency (Fig. 7b).
4.1 Fully integrated mechanistic ecosystem modeling: successes and limitations
While many ecosystem modeling applications have been discussed in the literature, including detailed ecohydrological (e.g., Ivanov et al., 2008; Tague et al., 2013; Millar et al., 2017) and soil biogeochemistry applications (e.g., Parton et al., 1998; Kraus et al., 2014; Robertson et al., 2019), rarely, if ever, has a single integrated model been tested across different compartments and disciplines for concurrently reproducing surface energy budget, hydrological dynamics, vegetation productivity, and nitrogen budget. Here, we raise the bar to challenge T&C-BG, in reproducing these processes across nine grassland sites in the broad Alpine region. Furthermore, to ensure future model transferability and to avoid local tuning, we also use the same vegetation and soil biogeochemistry parameters across all sites, with few exceptions where an elevation or latitudinal dependence of a parameter should be preserved. Despite such an “average” parameterization, the model responds surprisingly well to the challenge as energy and carbon fluxes, soil hydrology, vegetation dynamics, and and DOC leaching fluxes are all with realistic magnitude and similar to observations with few notable exceptions discussed below. Also feedbacks between compartments are realistic in the model, as it is the case of growing season length varying depending on the date of complete snow cover disappearance or the limitations in grass growth and thus LAI at low nitrogen availability (Fig. 6a). Overall, simulations suggest that a correct representation of phenology (and thus length of the growing season) is a fundamental aspect of model performance as peak of the season GPP is much more similar across sites than annual GPP values (Table 4).
Despite such a positive outcome, there are a number of uncertainties in both the observations and model simulation that are relevant to highlight. It is well known that flux towers do not close the energy budget (e.g., Foken, 1998, 2008; Wilson et al., 2002; Widmoser and Wohlfahrt, 2018; Mauder et al., 2020). The model generally overestimates the sensible heat compared to observations, thus suggesting that the missing energy is most likely attributable to sensible heat as supported by other studies (Mauder et al., 2006; Wohlfahrt et al., 2010; Liu et al., 2011) and justifies the lower R2 for sensible heat compared to the other fluxes. Observations of soil water content depend on the specific soil hydraulic properties and microtopography in the location where the sensor is installed and are also often subject to temporal drifts (Takruri et al., 2011; Mittelbach et al., 2012). The model represents a vertically explicit but spatially implicit average soil moisture over the tower footprint. For this reason, even though we normalize soil moisture using effective saturation, the comparison should be seen more in qualitative terms rather than attempting to reproduce exactly the observed soil moisture values. Most important, in terms of vegetation productivity, biomass data reported from different articles present a remarkable variability despite referring to the same study site. This might depend on differences in sampling protocol and instrumentation (Zeeman et al., 2019) as well as natural spatial variability. In light of these uncertainties we do not dwell on explaining model to data differences as far as the long-term magnitude of observed biomass is similar. The only exception is the very significant underestimation of the simulated biomass compared to lysimeters measurements. We attribute a large portion of this inconsistency to the well-documented lysimeter oasis or border effect, which generates crop yields and evapotranspiration fluxes 10 %–20 % larger than larger-field observations (Oberholzer et al., 2017). As the model captures well the pattern of biomass and carbon fluxes in the flux tower locations, it would be difficult to justify why biomass productivity should be much more different a few hundred meters apart in the lysimeters under similar management (Fu et al., 2017). The model does not properly represent the interannual variability of harvested carbon and N, e.g., not capturing the higher productivity of 2013, a particularly productive year due to the reduced snow cover (Zeeman et al., 2017). One explanation could be that we input to the model the same management strategy every year, while local management varies from year to year (see SI in Fu et al., 2019). Inconsistencies in the number of manure applications or grass cuts as well as a discrepancy on the order of weeks on the day of the actual manure application or grass cut might occur in the simulations in a given year. More generally, simulation results can be affected by the spin-up process performed to initialize the carbon and nutrient pools in the system in the absence of historical information. The induced stationarity might influence the soil organic carbon and nitrogen pool enrichment or depletion and can generate discrepancies with observations. For instance, simulated C : N values are considerably lower than values reported in literature for each site (Table S3), likely due to the quite low value of C : N used for the manure stoichiometry (Fu et al., 2017), where carbon is in part quickly respired, as manure is modeled similarly to fresh litter. However, the absolute value of added nitrogen in the soil is much more important than the C : N ratio itself in controlling N leaching and grassland productivity (Fig. S7), attenuating this problem in the computation of the nitrogen fluxes. Other possible N losses in the environment such as ammonia volatilization or denitrification (N2) do not affect the N budget significantly, with their average losses across the three German sites being on the order of 0.74 and 0.28 , respectively.
Simulated concentration in groundwater recharge in DE-Fen is underestimated compared to the observed values from lysimeters. While this can be likely due to model shortcoming, the model uncertainty is not the only factor contributing to this incongruence as also the discrepancy of management between the model and reality might play a role. Moreover, the model does not take into account preferential flows, which might be particularly pronounced in the lysimeters (Schoen et al., 1999; Groh et al., 2015; Benettin et al., 2019; Shajari et al., 2019). Regardless of these existing differences – and keeping in mind that the exact value of the results is likely more uncertain than the comparison across scenarios and/or sites – we argue that results obtained with T&C-BG are more encouraging than discouraging, and they allowed us to explore the complex functioning of the overall ecosystem and to carry out virtual numerical experiments that can inform farmers and legislators.
4.2 Simulated responses to fertilization and climate change: management implications
A term of comparison for the simulated leaching concentrations is the limit of 50 mg L−1 imposed on groundwater nitrate concentrations by the European Drinking Water Directive (98/83/EC, EEC, 1998). Results from the numerical experiments under historical climatic conditions show that leaching concentrations are generally lower or much lower than this threshold, even under highly intensive management practices. A scenario with temperature increase is expected to lower such leaching concentrations in favor of higher biomass productivity (Figs. 8 and S5a).
The EU Nitrate Directive 91/676/EEC (EEC, 1991) imposes the maximum N fertilization rate for stable managed grasslands of 170 . The directive leaves room for flexibility to European countries, since they are allowed to introduce higher N fertilization loads if they demonstrate that grassland absorbs it efficiently. However, if the monitoring of surface and groundwater concentration reveals water quality issues, then the EU can intervene with an infringement proceeding. As an example, Germany in 2017 readapted the national Fertilizer Ordinance of 2007 after an infringement proceeding by the EU (Kuhn, 2017).
The threshold of 170 is computed on the basis of a input–output balance at the farm scale. In such a simple computation the losses in the environment are assumed to be 30 % of the input (IPCC, 2000, 2006). These losses include both groundwater recharge and surface runoff. Although some countries have lowered this threshold to 10 %, such as Ireland, or to 20 %, such as Switzerland, there is evidence that the threshold is quite high compared to observed losses in grasslands (Eder et al., 2015). Our study confirms such a finding highlighting concentrations on the order of 0.3–12 mg L−1 for historical climate conditions, although we only consider the losses with groundwater recharge and neglect those through surface runoff. However, there is evidence that losses through surface runoff are usually small compared to losses through groundwater recharge (Jackson et al., 1973; Casson et al., 2008). Despite the noticeable intersite variability, the simulated losses of into groundwater are generally lower than 10 % of the N input, even under highly intensive fertilization scenarios (Fig. 6c). As a result of increasing temperature, this percentage is expected to decrease even further, due to longer growing seasons and higher ET, which lead to a more efficient use of the N input (Fig. 8).
Among the N inputs explored in the analysis, the value that guarantees the maximization of the N efficiency ratio, for the current climate, is quite close or lower than the limit of 170 in pre-Alpine and Alpine sites (Fig. 6d). Thus, we confirm that such a limit is a reasonable upper threshold. However, an emerging aspect from the simulations is the large variability across sites in leaching and response to fertilization. While model uncertainties exist, and we are unlikely to capture the exact magnitude of all N fluxes at all sites, this variability is likely underestimated rather than overestimated by the model due to simplifying assumptions and commonality of parameters. The leaching and the grassland yields depend on the degree at which nitrogen is limiting productivity versus other environmental factors (e.g., temperature), on the capability of vegetation in taking up nutrients, and on the hydrological characteristics of the sites. A soil favoring water drainage or a fast snowmelt at the end of the winter generates larger amounts of N leaching into groundwater. Most likely one factor does not exclude the other (Fig. 7 and Fig. S6 in the Supplement), but the combination of both soil properties and hydrological regime drives the correlation between N leaching concentration and groundwater recharge fraction. The N uptake efficiency of grassland depends more on the nutrient demand with a longer growing season (Zeeman et al., 2017), higher temperatures, and lack of water stress favoring the N demand, even though the importance of the different aspects is difficult to disentangle (Lü et al., 2014). In the simulations, the length of the growing season at CH-Oe1, DE-Gwg, and CH-Fru is comparable to the other pre-Alpine and Alpine sites (Table 4). However, simulated leaching is higher, and the produced biomass is lower. This is especially true at low N fertilization levels. This further explains the important role of local hydrology (Fig. 6a–c) on the N cycle. The comparison between current and modified climate scenarios further explains the importance of the interplay among various factors, since higher temperatures increase the efficiency in using N, due to longer growing season and consequent higher N uptake. In the simulations, an increase in air temperature has a positive impact on the overall grassland functioning; however, multidecadal effects should be evaluated more carefully, since long-term impacts on soil biogeochemistry – not analyzed here – might affect the fertility of the site (Schlingmann et al., 2020). Literature shows that also the richness of species composing the grassland might favor nutrient uptake (Tilman et al., 1996; Spehn et al., 2005; Niklaus et al., 2006), but this type of ecological feedback is not implemented in the model, which simply considers an “average species composition” as a representative grassland. While grass composition and botanical heterogeneity might be important for the ecological functioning of the system, they are unlikely to affect significantly carbon and water fluxes at the ecosystem scale, at least to a level that goes beyond current model and observational uncertainties as demonstrated by the match between simulations with common parameters and flux tower observations.
As local hydrological and soil conditions (and potentially also different site biogeochemical history and species composition – not considered here) modify the grass response to N fertilization, disparities among farmers might emerge simply as a function of location. Farmers owning a field in an area characterized by higher groundwater recharge might be disadvantaged, because losses of to groundwater could be higher and yields limited for the same amount of N fertilization. On the contrary, farmers owning fields in hydrologically favorable sites might be advantaged. Such disparities should be taken into account in two ways: first in delineating location specific fertilization limits and second in applying some sort of compensation for locations or regions that are disadvantaged. A good practice in this direction is the proof of ecological performance (PEP), introduced in Switzerland (Swiss Federal Council, 1998). Direct payments are transferred to farmers who join this program, which imposes a wealth of rules in order to preserve the environment. Among the requirements, the computation of the farm balance also needs to be provided.
On the basis of modeling results, regulations based on a fixed threshold for the whole European grasslands could be largely suboptimal. Even if we might underestimate losses because of model uncertainties and because we do not consider surface runoff, resulting losses are abundantly lower than 30 % of the N input and can even decrease with a warming climate.
Overall, there is still leverage for enhancing N fertilization before reaching the threshold assumed by the EU Directive. However, we also showed that higher N load does not necessarily correspond to higher yields, especially above certain thresholds. Therefore, even though leaching is low, an effective increase in manure application might not be beneficial for grass yield and should be evaluated on the basis of the site-specific characteristics. Fixed-threshold-based regulations might allow more debate in view of climate change, since response to warming might widely differ across Alpine elevations.
We suggest as a possible alternative and better strategy the definition of thresholds on fertilizer input based on a distributed mapping of the landscape. In the absence of more precise information, agricultural areas could be classified based on the crop use efficiency, soil type, and hydrological characteristics. For instance, Klammler et al. (2013) provide and interesting example of leaching mapping in a case study in Austria. Alternatively, mechanistic ecosystem models as used in this study could be employed to identify ranges of optimal fertilization levels, here identified as the maximum in the ratio between harvested N and N leachate (Fig. 6d), for different sites, groups of sites, or even in a fully distributed manner. This process could be demanding in terms of resources as it requires advanced expertise, sufficient data to constrain the models, and adequate modeling tools (Decrem et al., 2007). However, with increasing computational capabilities and data availability to constrain model parameters, it is likely that mechanistic modeling approaches might become more popular and an essential tool for fostering the mapping process and provide distributed information to refine environmental regulations.
We simulated the dynamics of nine managed grassland sites across the broad European Alpine region. We applied the mechanistic model T&C-BG which fully integrates land-surface mass and energy fluxes, soil hydrology, vegetation dynamics, and soil biogeochemistry. The model was confirmed to reproduce realistic magnitude and temporal dynamics of ecohydrological variables across multiple compartments in an effort of model evaluation that goes beyond many of the existing attempts to confirm ecosystem models. The model was subsequently used to quantify the impact of different N fertilization scenarios, with a focus on grass productivity and concentration in groundwater recharge. Each management scenario was simulated under current and modified climatic conditions (i.e., +250 ppm of atmospheric CO2 concentration and +3 ∘C in air temperature). Simulations reveal that although groundwater recharge concentrations of are relatively small and well below environmental policy limits there is high variability across grasslands also for sites located at similar elevation. Such variability is mainly driven by local environmental controls on productivity that reflects in the grass capability to take up nutrients and by the differences in the hydrological regime summarized as the fraction of precipitation that becomes recharge. Under modified climate scenarios, the variability across sites remains, and increased temperature results in higher N use efficiency, especially in high-Alpine sites, at least for the timeframe analyzed here. We suggest that these factors should be taken into account by legislators while defining thresholds on fertilizer loads. Guidelines based on the site-specific thresholds rather than based on fixed thresholds across large regions would favor the maximization of grass yields while allowing for preserving similar water quality targets. Fully integrated mechanistic ecosystem models as employed here have a big potential as tools to construct these maps under current and future climate scenarios.
The model code is available at the following link: https://github.com/simonefatichi/TeC_Source_Code (last access December 2020) and at https://doi.org/10.24433/CO.0905087.v1 (Fatichi, 2020).
FLUXNET data for running and confirming T&C-BG plot-scale simulations were downloaded from https://fluxnet.fluxdata.org/ (last access: January 2021). Specifically, we downloaded data for the stations Chamau (https://doi.org/10.18140/FLX/1440131, Hörtnagl et al., 2020a), Oensingen (https://doi.org/10.18140/FLX/1440135, Ammann, 2020), Früebüel (https://doi.org/10.18140/FLX/1440133, Hörtnagl et al., 2020b), Neustift (https://doi.org/10.18140/FLX/1440121, Wohlfahrt et al., 2020), Monte Bondone (https://doi.org/10.18140/FLX/1440170, Gianelle et al., 2020) and Torgnon (https://doi.org/10.18140/FLX/1440237, Cremonese et al., 2020). Data for the sites Fendt, Rottenbuch, and Graswang are available on Zenodo, divided into management and plant physiology data (https://doi.org/10.5281/zenodo.4267810, Zeeman and Ruehr, 2020) and meteorology, environment, and surface flux data (https://doi.org/10.5281/zenodo.4267887, Zeeman, 2020).
The supplement related to this article is available online at: https://doi.org/10.5194/bg-18-1917-2021-supplement.
MB and SF conceived the ideas and discussions with MZ supporting their development. MB and SF designed the experiments; MB ran simulations and developed the analyses. All authors contributed to the writing.
The authors declare that they have no conflict of interest.
The authors acknowledge Gianluca Filippa from the Environmental Protection Agency of Aosta Valley for sharing data of the site IT-Tor. A special acknowledgment to Ralf Kiese from KIT-IFU for the insightful comments on the article. We also acknowledge Edoardo Cremonese and Stefano Manzoni for the extremely helpful reviews of the original version of this article.
This study built upon the TERENO/ScaleX cooperation and we thank Benjamin Wolf, Nadine Ruehr, Heather Shupe, Martina Bauerfeind, Carsten Malchow, Maximilian Graf, Matthias Mauder (all KIT/IMK-IFU), and the Scientific Team of ScaleX Campaign 2015 for their contributions. The TERrestrial Environmental Observatory (TERENO) infrastructure is funded by the ATMO program of the Helmholtz Association and the Federal Ministry of Education and Research. MZ received support from the German Research Foundation (DFG; project ZE 1006/2-1).
This research has been supported by the Horizon 2020 (DAFNE (grant no. 690268)).
This paper was edited by Trevor Keenan and reviewed by Edoardo Cremonese and Stefano Manzoni.
Ammann, C.: FLUXNET2015 CH-Oe1 Oensingen grassland, Fluxnet, https://doi.org/10.18140/FLX/1440135, 2020.
Ammann, C., Flechard, C. R., Leifeld, J., Neftel, A., and Fuhrer, J.: The carbon budget of newly established temperate grassland depends on management intensity, Agric. Ecosyst. Env., 121, 5–20, https://doi.org/10.1016/j.agee.2006.12.002, 2007.
Ammann, C., Spirig, C., Leifeld, J., and Neftel, A.: Assessment of the nitrogen and carbon budget of two managed temperate grassland fields, Agric. Ecosyst. Env., 133, 150–162, https://doi.org/10.1016/j.agee.2009.05.006, 2009.
Ammann, C., Wolff, V., Marx, O., Brümmer, C., and Neftel, A.: Measuring the biosphere-atmosphere exchange of total reactive nitrogen by eddy covariance, Biogeosciences, 9, 4247–4261, https://doi.org/10.5194/bg-9-4247-2012, 2012.
Amon, B., Kryvoruchko, V., Amon, T., and Zechmeister-Boltenstern, S.: Methane, nitrous oxide and ammonia emissions during storage and after application of dairy cattle slurry and influence of slurry treatment, Agric. Ecosyst. Env., 112, 153–162, https://doi.org/10.1016/j.agee.2005.08.030, 2006.
Aubinet, M., Vesala, T., and Papale, D.: Eddy Covariance: A Practical Guide to Measurement and Data Analysis, Springer, Dordrecht, 2012.
Bao, C., Li, L., Shi, Y., and Duffy, C.: Understanding watershed hydrogeochemistry: 1. Development of RT-Flux-PIHM, Water Resour. Res., 53, 2328–2345, https://doi.org/10.1002/2016WR018934, 2017.
Behrendt, H., Bach, M., Kunkel, R., Opitz, D., Pagenkopf, W. G., Scholz, G., and Wendland, F.: Nutrient Emissions into River Basins of Germany on the Basis of a Harmonized Procedure, available at: http://www.umweltbundesamt.de (last access: July 2020), 2003.
Benettin, P., Queloz, P., Bensimon, M., McDonnell, J. J., and Rinaldo, A.: Velocities, Residence Times, Tracer Breakthroughs in a Vegetated Lysimeter: A Multitracer Experiment, Water Resour. Res., 55, 21–33, https://doi.org/10.1029/2018WR023894, 2019
Bergström, L., Johnsson, H., and Torstensson, G.: Simulation of soil nitrogen dynamics using the SOILN model, Fert. Res., 27, 181–188, https://doi.org/10.1007/BF01051126, 1991.
Brisson, N., Mary, B., Ripoche, D., Jeuffroy, M. H., Ruget, F., Nicoullaud, B., Gate, P., Devienne-Barret, F., Antonioletti, R., Durr, C., Richard, G., Beaudoin, N., Recous, S., Tayot, X., Plenet, D., Cellier, P., Machet, J.-M., Meynard, J. M., and Delécolle, R.: STICS: a generic model for the simulation of crops and their water and nitrogen balances. I. Theory and parameterization applied to wheat and corn, Agronomie, 18, 311–346, https://doi.org/10.1051/agro:19980501, 1998.
Brisson, N., Ruget, F., Gate, P., Lorgeou, J., Nicoullaud, B., Tayot, X., Plenet, D., Jeuffroy, M.-H., Bouthier, A., Ripoche, D., Mary, B., and Justes, E.: STICS: a generic model for simulating crops and their water and nitrogen balances. II. Model validation for wheat and maize, Agronomie, 22, 69–92, https://doi.org/10.1051/agro:2001005, 2002.
Brisson, N., Gary, C., Justes, E., Roche, R., Mary, B., Ripoche, D., Zimmer, D., Sierra, J., Bertuzzi, P., Burger, P., Bussière, F., Cabidoche, Y. M., Cellier, P., Debaeke, P., Gaudillère, J. P., Hénault, C., Maraux, F., Seguin, B., and Sinoquet, H.: An overview of the crop model STICS, Eur. J. Agron., 18, 309–332, https://doi.org/10.1016/S1161-0301(02)00110-7, 2003.
Casson, J. P., Olson, B. M., Little, J. L., and Nolan, S. C.: Assessment of Environmental Sustainability in Alberta's Agricultural Watersheds Project, Volume 4: Nitrogen loss in surface runoff, Alberta Agriculture and Rural Development, Lethbridge, Alberta, Canada, 71 pp., 2008.
Chang, J. F., Viovy, N., Vuichard, N., Ciais, P., Wang, T., Cozic, A., Lardy, R., Graux, A.-I., Klumpp, K., Martin, R., and Soussana, J.-F.: Incorporating grassland management in ORCHIDEE: model description and evaluation at 11 eddy-covariance sites in Europe, Geosci. Model Dev., 6, 2165–2181, https://doi.org/10.5194/gmd-6-2165-2013, 2013.
Chen, F. and Dudhia, J.: Coupling an Advanced Land Surface–Hydrology Model with the Penn State–NCAR MM5 Modeling System. Part I: Model Implementation and Sensitivity, Mon. Weather Rev., 129, 569–585, 2001.
Cremonese, E., Galvagno, M., Morra di Cella, U., and Migliavacca, M.: FLUXNET2015 IT-Tor Torgnon, Dataset, Fluxnet, https://doi.org/10.18140/FLX/1440237, 2020.
Decrem, M., Spiess, E., Richner, W., and Herzog, F.: Impact of Swiss agricultural policies on nitrate leaching from arable land, Agron. Sustain. Dev., 27, 243–253, https://doi.org/10.1051/agro:2007012, 2007.
Del Grosso, S. J., Parton, W. J., Mosier, A. R., Ojima, D. S., Kulmala, A. E., and Phongpan, S.: General model for N2O and N2 gas emissions from soils due to dentrification, Global Biogeochem. Cy., 14, 1045–1060, https://doi.org/10.1029/1999GB001225, 2000.
Del Grosso, S., Ojima, D., Parton, W., Mosier, A., Peterson, G., and Schimel, D.: Simulated effects of dryland cropping intensification on soil organic matter and greenhouse gas exchanges using the DAYCENT ecosystem model, Environ. Pollut., 116, S75–S83, https://doi.org/10.1016/S0269-7491(01)00260-3, 2002.
Eder, A., Blöschl, G., Feichtinger, F., Herndl, M., Klammler, G., Hösch, J., Erhart, E., and Strauss, P.: Indirect nitrogen losses of managed soils contributing to greenhouse emissions of agricultural areas in Austria: results from lysimeter studies, Nutr. Cycl. Agroecosyst., 101, 351–364, https://doi.org/10.1007/s10705-015-9682-9, 2015.
EEC: Council Directive 19/676/EEC of 12 December, 1991 concerning the protection of waters against pollution caused by nitrates from agricultural sources, Official Journal, Brussels, 1991.
EEC: Council Directive 98/83/EC of 3 November 1998 on the quality of water intended for human consumption, Official Journal, Brussels, 1998.
Fatichi, S.: Tethys-Chloris (T&C) – Terrestrial Biosphere Model – Public release September 2020, Code Ocean, https://doi.org/10.24433/CO.0905087.v1, 2020.
Fatichi, S. and Pappas, C.: Constrained variability of modeled T:ET ratio across biomes, Geophys. Res. Lett., 44, 6795–6803, https://doi.org/10.1002/2017GL074041, 2017.
Fatichi, S., Ivanov, V. Y., and Caporali, E.: A mechanistic ecohydrological model to investigate complex interactions in cold and warm water-controlled environments: 1. Theoretical framework and plot-scale analysis, J. Adv. Model. Earth Syst., 4, M05002, https://doi.org/10.1029/2011MS000086, 2012a.
Fatichi, S., Ivanov, V. Y., and Caporali, E.: A mechanistic ecohydrological model to investigate complex interactions in cold and warm water-controlled environments: 2. Spatiotemporal analyses, J. Adv. Model. Earth Syst., 4, M05003, https://doi.org/10.1029/2011MS000087, 2012b.
Fatichi, S., Zeeman, M. J., Fuhrer, J., and Burlando, P.: Ecohydrological effects of management on subalpine grasslands: From local to catchment scale, Water Resour. Res., 50, 148–164, https://doi.org/10.1002/2013WR014535, 2014.
Fatichi, S., Katul, G. G., Ivanov, V. Y., Pappas, C., Paschalis, A., Consolo, A., Kim, J., and Burlando, P.: Abiotic and biotic controls of soil moisture spatiotemporal variability and the occurrence of hysteresis, Water Resour. Res., 51, 3505–3524, https://doi.org/10.1002/2014WR016102, 2015.
Fatichi, S., Pappas, C., and Ivanov, V. Y.: Modeling plant-water interactions: an ecohydrological overview from the cell to the global scale, WIRES Water, 3, 327–368, https://doi.org/10.1002/wat2.1125, 2016.
Fatichi, S., Manzoni, S., Or, D., and Paschalis, A.: A Mechanistic Model of Microbially Mediated Soil Biogeochemical Processes: A Reality Check, Global Biogeochem. Cy., 33, 2018GB006077, https://doi.org/10.1029/2018GB006077, 2019.
Feichtinger, F.: STOTRASIM – Ein Modell zur Simulation der Stickstoffdynamik in der ungesättigten Zone eines Ackerstandortes, Schriftenreihe des Bundesamtes für Wasserwirtschaft, Wien, 1998.
Ferrara, R. M., Trevisiol, P., Acutis, M., Rana, G., Richter, G. M., and Baggaley, N.: Topographic impacts on wheat yields under climate change: Two contrasted case studies in Europe, Theor. Appl. Climatol., 99, 53–65, https://doi.org/10.1007/s00704-009-0126-9, 2010.
Filippa, G., Cremonese, E., Galvagno, M., Migliavacca, M., Morra di Cella, U., Petey, M., and Siniscalco, C.: Five years of phenological monitoring in a mountain grassland: inter-annual patterns and evaluation of the sampling protocol, Int. J. Biometeorol., 59, 1927–1937, https://doi.org/10.1007/s00484-015-0999-5, 2015.
Finger, R., Gilgen, A. K., Prechsl, U. E., and Buchmann, N.: An economic assessment of drought effects on three grassland systems in Switzerland, Reg. Environ. Change, 13, 365–374, https://doi.org/10.1007/s10113-012-0346-x, 2013.
Foken, T.: Die scheinbar ungeschlossene Energiebilanz am Erdboden – eine Herausforderung an die Experimentelle Meteorologie, Sitzungsberichte der Leibniz-Sozietät, Sitzungsberichte der Leibnitz-Sozietaet, Berlin, 1998.
Foken, T.: The energy balance closure problem: an overview, Ecol. Appl., 18, 1351–1367, https://doi.org/10.1890/06-0922.1, 2008.
Fu, J., Gasche, R., Wang, N., Lu, H., Butterbach-Bahl, K., and Kiese, R.: Impacts of climate and management on water balance and nitrogen leaching from montane grassland soils of S-Germany, Environ. Pollut., 229, 119–131, https://doi.org/10.1016/J.ENVPOL.2017.05.071, 2017.
Fu, J., Gasche, R., Wang, N., Lu, H., Butterbach-Bahl, K., and Kiese, R. : Dissolved organic carbon leaching from montane grasslands under contrasting climate, soil and management conditions, Biogeochemistry, 145, 47–61, https://doi.org/10.1007/s10533-019-00589-y, 2019.
Gabrielle, B. and Kengni, L.: Analysis and Field-Evaluation of the CERES Models' Soil Components: Nitrogen Transfer and Transformations, Soil Sci. Soc. Am. J., 60, 142–149, https://doi.org/10.2136/sssaj1996.03615995006000010023x, 1996.
Gabrielle, B., Menasseri, S., and Houot, S.: Analysis and Field Evaluation of the Ceres Models Water Balance Component, Soil Sci. Soc. Am. J., 59, 1403–1412, https://doi.org/10.2136/sssaj1995.03615995005900050029x, 1995.
Galloway, J. N., Dentener, F. J., Capone, D. G., Boyer, E. W., Howarth, R. W., Seitzinger, S. P., Asner, G. P., Cleveland, C. C., Green, P. A., Holland, E. A., Karl, D. M., Michaels, A. F., Porter, J. H., Townsend, A. R., and Vörösmarty, C. J.: Nitrogen cycles: Past, present, and future, Biogeochemistry, 70, 153–226, https://doi.org/10.1007/s10533-004-0370-0, 2004.
Galvagno, M., Wohlfahrt, G., Cremonese, E., Rossini, M., Colombo, R., Filippa, G., Julitta, T., Manca, G., Siniscalco, C., Morra di Cella, U., and Migliavacca, M.: Phenology and carbon dioxide source/sink strength of a subalpine grassland in response to an exceptionally short snow season, Environ. Res. Lett., 8, 025008, https://doi.org/10.1088/1748-9326/8/2/025008, 2013.
Gianelle, D., Vescovo, L., Marcolla, B., Manca, G., and Cescatti, A.: Ecosystem carbon fluxes and canopy spectral reflectance of a mountain meadow, Int. J. Remote Sens., 30, 435–449, https://doi.org/10.1080/01431160802314855, 2009.
Gianelle, D., Cavagna, M., Zampedri, R., and Marcolla, B.: FLUXNET2015 IT-MBo Monte Bondone, Dataset, Fluxnet, https://doi.org/10.18140/FLX/1440170, 2020.
Gilgen, A. K. and Buchmann, N.: Response of temperate grasslands at different altitudes to simulated summer drought differed but scaled with annual precipitation, Biogeosciences, 6, 2525–2539, https://doi.org/10.5194/bg-6-2525-2009, 2009.
Gilmanov, T. G., Soussana, J. F., Aires, L., Allard, V., Ammann, C., Balzarolo, M., Barcza, Z., Bernhofer, C., Campbell, C. L., Cernusca, A., Cescatti, A., Clifton-Brown, J., Dirks, B. O. M., Dore, S., Eugster, W., Fuhrer, J., Gimeno, C., Gruenwald, T., Haszpra, L., Hensen, A., Ibrom, A., Jacobs, A. F. G., Jones, M. B., Lenigan, G., Laurila, T., Lohila, A., Manca, G., Marcolla, B., Nagy, Z., Pilegaard, K., Pinter, K., Pio, C., Raschi, A., Rogiers, N., Sanz, M. J., Stefani, P., Sutton, M., Tuba, Z., Valentini, R., Williams, M. L., and Wohlfahrt, G.: Partitioning European grassland net ecosystem CO2 exchange into gross primary productivity and ecosystem respiration using light response function analysis, Agric. Ecosyst. Env., 121, 93–120, https://doi.org/10.1016/j.agee.2006.12.008, 2007.
Groenendijk, P., Renaud, L. V., and Roelsma, J.: Prediction of nitrogen and phosphorus leaching to groundwater and surface waters; process descriptions of the animo4.0 model, Alterra, Wageningen, the Netherlands, 2005.
Groenendijk, P., Heinen, M., Klammler, G., Fank, J., Kupfersberger, H., Pisinaras, V., Gemitzi, A., Peña-Haro, S., García-Prats, A., Pulido-Velazquez, M., Perego, A., Acutis, M., and Trevisan, M.: Performance assessment of nitrate leaching models for highly vulnerable soils used in low-input farming based on lysimeter data, Sci. Total Environ., 499, 463–480, https://doi.org/10.1016/j.scitotenv.2014.07.002, 2014.
Groh, J., Pütz, T., Jülich, F., Vanderborght, J., and Vereecken, H.: Estimation of evapotranspiration and crop coefficient of an intensively managed grassland ecosystem with lysimeter measurements, 16. Gumpensteiner Lysimetertagung 2015, 107–112, available at: https://www.researchgate.net/publication/275533480 (last access: July 2020), 2015.
Hammerle, A., Haslwanter, A., Tappeiner, U., Cernusca, A., and Wohlfahrt, G.: Leaf area controls on energy partitioning of a temperate mountain grassland, Biogeosciences, 5, 421–431, https://doi.org/10.5194/bg-5-421-2008, 2008.
Hansen, S.: Equation Section 1 Daisy, a flexible Soil-Plant-Atmosphere system Model, The Royal Veterinary and Agricultural University, Copenhagen, 2002.
Hansen, S., Jensen, H. E., Nielsen, N. E., and Svendsen, H.: DAISY: Soil plant atmosphere system model, National Agency for Environmental Protection, Copenhagen, 1990.
Heathwaite, L.: Sources of eutrophication: hydrological pathways of catchment nutrient export, in: Man's Influence on Freshwater Ecosystems and Water Use (Issue 230), Int. Assoc. Hydrol. Sci., 230, 161–176, 1995.
Hénault, C., Bizouard, F., Laville, P., Gabrielle, B., Nicoullaud, B., Germon, J. C., and Cellier, P.: Predicting in situ soil N2O emission using NOE algorithm and soil database, Glob. Change Biol., 11, 115–127, https://doi.org/10.1111/j.1365-2486.2004.00879.x, 2005.
Hörtnagl, L., Feigenwinter, I., Fuchs, K., Merbold, L., Buchmann, N., Eugster, W., and Zeeman, M.: FLUXNET2015 CH-Cha Chamau, Dataset, Fluxnet, https://doi.org/10.18140/FLX/1440131, 2020a.
Hörtnagl, L., Feigenwinter, I., Fuchs, K., Merbold, L., Buchmann, N., Eugster, W., Zeeman, M., Käslin, F., Meier, P., Koller, P., Baur, T., and Pluess, P.: FLUXNET2015 CH-Fru Früebüel. Switzerland, Fluxnet, https://doi.org/10.18140/FLX/1440133, 2020b.
Ibraim, E., Wolf, B., Harris, E., Gasche, R., Wei, J., Yu, L., Kiese, R., Eggleston, S., Butterbach-Bahl, K., Zeeman, M., Tuzson, B., Emmenegger, L., Six, J., Henne, S., and Mohn, J.: Attribution of N2O sources in a grassland soil with laser spectroscopy based isotopocule analysis, Biogeosciences, 16, 3247–3266, https://doi.org/10.5194/bg-16-3247-2019, 2019.
IPCC: IPCC – Task Force on National Greenhouse Gas Inventories, available at: https://www.ipcc-nggip.iges.or.jp/public/gp/english/ (last access: May 2020), 2000.
IPCC: IPCC – Overview 2 2006 IPCC Guidelines for National Greenhouse Gas Inventories, available at: http://www.ipcc-nggip.iges.or.jp/ (last access: May 2020), 2006.
Ivanov, V. Y., Bras, R. L., and Vivoni, E. R.: Vegetation-hydrology dynamics in complex terrain of semiarid areas: 1. A mechanistic approach to modeling dynamic feedbacks, Water Resour. Res., W03429, 44, https://doi.org/10.1029/2006WR005588, 2008.
Jackson, W. A., Asmussen, L. E., Hauser, E. W., and White, A. W.: Nitrate in Surface and Subsurface Flow from a Small Agricultural Watershed, J. Environ. Qual., 2, 480–482, https://doi.org/10.2134/jeq1973.00472425000200040017x, 1973.
Jansson, P. E.: CoupModel: Model Use, Calibration, and Validation, T. ASABE, 55, 1337–1346, https://doi.org/10.13031/2013.42245, 2012.
Keeling, R. F., Piper, S. C., Bollenbacher, A. F., and Walker, J. S.: Atmospheric CO2 records from sites in the sio air sampling network, in trends: A compendium of data on global change, in: Trends: A Compendium of Data on Global Change. Carbon Dioxide Information Analysis Center, Oak Ridge National Laboratory, U.S. Department of Energy, Oak Ridge, TN, 2009.
Kiese, R., Fersch, B., Baessler, C., Brosy, C., Butterbach-Bahl, K., Chwala, C., Dannenmann, M., Fu, J., Gasche, R., Grote, R., Jahn, C., Klatt, J., Kunstmann, H., Mauder, M., Rödiger, T., Smiatek, G., Soltani, M., Steinbrecher, R., Völksch, I., Werhahn, J., Wolf, B., Zeeman, M., and Schmid, H. P.: The TERENO Pre-Alpine Observatory: Integrating Meteorological, Hydrological, and Biogeochemical Measurements and Modeling, Vadose Zone J., 17, 180060, https://doi.org/10.2136/vzj2018.03.0060, 2018.
Klammler, G., Kupfersberger, H., Rock, G., and Fank, J.: Modeling coupled unsaturated and saturated nitrate distribution of the aquifer Westliches Leibnitzer Feld, Austria, Environ. Earth Sci., 69, 663–678, https://doi.org/10.1007/s12665-013-2302-6, 2013.
Kraus, D., Weller, S., Klatt, S., Haas, E., Wassmann, R., Kiese, R., and Butterbach-Bahl, K.: A new LandscapeDNDC biogeochemical module to predict CH4 and N2O emissions from lowland rice and upland cropping systems, Plant Soil, 386, 125–149, https://doi.org/10.1007/s11104-014-2255-x, 2014, 2014.
Kroes, J. G. and van Dam, J. C.: Reference Manual SWAP; version 3.0.3, Alterra-rapport 773, ISSN 1566-7197, 2003.
Kronvang, B., Borgvang, S. A., and Barkved, L. J.: Towards European harmonised procedures for quantification of nutrient losses from diffuse sources – The EUROHARP project, J. Environ. Monit., 11, 503–505, https://doi.org/10.1039/b902869m, 2009.
Kuhn, T.: The revision of the German Fertiliser Ordinance in 2017 The revision of the German Fertiliser Ordinance in 2017 Till Kuhn, Institute for Food and Resource Economics, Discussion Paper 2017, 2, 2017.
Kumar, M., Ou, Y. L., and Lin, J. G.: Co-composting of green waste and food waste at low C/N ratio, Waste Manage., 30, 602–609, https://doi.org/10.1016/j.wasman.2009.11.023, 2010.
Lamarque, P., Tappeiner, U., Turner, C., Steinbacher, M., Bardgett, R. D., Szukics, U., Schermer, M., and Lavorel, S.: Stakeholder perceptions of grassland ecosystem services in relation to knowledge on soil fertility and biodiversity, Reg. Environ. Change, 11, 791–804, https://doi.org/10.1007/s10113-011-0214-0, 2011.
Li, C. S.: Modeling trace gas emissions from agricultural ecosystems, in: Methane Emissions from Major Rice Ecosystems in Asia, 259–276, Springer, Dordrecht, https://doi.org/10.1007/978-94-010-0898-3_20, 2000.
Li, C., Salas, W., Zhang, R., Krauter, C., Rotz, A., and Mitloehner, F.: Manure-DNDC: A biogeochemical process model for quantifying greenhouse gas and ammonia emissions from livestock manure systems, Nutr. Cycl. Agroecosyst., 93, 163–200, https://doi.org/10.1007/s10705-012-9507-z, 2012.
Liu, S. M., Xu, Z. W., Wang, W. Z., Jia, Z. Z., Zhu, M. J., Bai, J., and Wang, J. M.: A comparison of eddy-covariance and large aperture scintillometer measurements with respect to the energy balance closure problem, Hydrol. Earth Syst. Sci., 15, 1291–1306, https://doi.org/10.5194/hess-15-1291-2011, 2011.
Lü, X. T., Dijkstra, F. A., Kong, D. L., Wang, Z. W., and Han, X. G.: Plant nitrogen uptake drives responses of productivity to nitrogen and water addition in a grassland, Sci. Rep., 4, 1–7, https://doi.org/10.1038/srep04817, 2014.
Mahowald, N., Jickells, T. D., Baker, A. R., Artaxo, P., Benitez-Nelson, C. R., Bergametti, G., Bond, T. C., Chen, Y., Cohen, D. D., Herut, B., Kubilay, N., Losno, R., Luo, C., Maenhaut, W., McGee, K. A., Okin, G. S., Siefert, R. L., and Tsukuda, S.: Global distribution of atmospheric phosphorus sources, concentrations and deposition rates, and anthropogenic impacts, Global Biogeochem. Cy., 22, GB4026, https://doi.org/10.1029/2008GB003240, 2008
Manoli, G., Ivanov, V. Y., and Fatichi, S.: Dry-Season Greening and Water Stress in Amazonia: The Role of Modeling Leaf Phenology, J. Geophys. Res.-Biogeosci., 123, 1909–1926, https://doi.org/10.1029/2017JG004282, 2018.
Manzoni, S., Moyano, F., Kätterer, T., and Schimel, J.: Modeling coupled enzymatic and solute transport controls on decomposition in drying soils, Soil Biol. Biochem., 95, 275–287, https://doi.org/10.1016/j.soilbio.2016.01.006, 2016.
Marcolla, B., Cescatti, A., Manca, G., Zorer, R., Cavagna, M., Fiora, A., Gianelle, D., Rodeghiero, M., Sottocornola, M., and Zampedri, R.: Climatic controls and ecosystem responses drive the inter-annual variability of the net ecosystem exchange of an alpine meadow, Agric. Forest Meteorol., 151, 1233–1243, https://doi.org/10.1016/j.agrformet.2011.04.015, 2011.
Mastrotheodoros, T., Pappas, C., Molnar, P., Burlando, P., Hadjidoukas, P., and Fatichi, S.: Ecohydrological dynamics in the Alps: Insights from a modelling analysis of the spatial variability, Ecohydrology, 12, e2054, https://doi.org/10.1002/eco.2054, 2019.
Mastrotheodoros, T., Pappas, C., Molnar, P., Burlando, P., Manoli, G., Parajka, J., Rigon, R., Szeles, B., Bottazzi, M., Hadjidoukas, P., and Fatichi, S.: More green and less blue water in the Alps during warmer summers, Nat. Clim. Change, 10, 155–161, https://doi.org/10.1038/s41558-019-0676-5, 2020.
Mauder, M., Liebethal, C., Göckede, M., Leps, J. P., Beyrich, F., and Foken, T.: Processing and quality control of flux data during LITFASS-2003, Bound.-Layer Meteorol., 121, 67–88, https://doi.org/10.1007/s10546-006-9094-0, 2006.
Mauder, M., Genzel, S., Fu, J., Kiese, R., Soltani, M., Steinbrecher, R., Zeeman, M., Banerjee, T., De Roo, F., and Kunstmann, H.: Evaluation of energy balance closure adjustment methods by independent evapotranspiration estimates from lysimeters and hydrological simulations, Hydrol. Process., 32, 39–50, https://doi.org/10.1002/hyp.11397, 2018.
Mauder, M., Foken, T., and Cuxart, J.: Surface-Energy-Balance Closure over Land: A Review, Bound.-Layer Meteorol., 177, 395–426, https://doi.org/10.1007/s10546-020-00529-6, 2020.
Merbold, L., Eugster, W., Stieger, J., Zahniser, M., Nelson, D., and Buchmann, N.: Greenhouse gas budget (CO2, CH4 and N2O) of intensively managed grassland following restoration, Glob. Change Biol., 20, 1913–1928, https://doi.org/10.1111/gcb.12518, 2014.
Migliavacca, M., Galvagno, M., Cremonese, E., Rossini, M., Meroni, M., Sonnentag, O., Cogliati, S., Manca, G., Diotri, F., Busetto, L., Cescatti, A., Colombo, R., Fava, F., Morra di Cella, U., Emiliano, P., Consolata, S., and Richardson, A. D.: Using digital repeat photography and eddy covariance data to model grasslandphenology and photosynthetic CO2 uptake, Agric. Forest Meteorol., 151, 1325–1337, 2011.
Millar, D. J., Ewers, B. E., Mackay, D. S., Peckham, S., Reed, D. E., and Sekoni, A.: Improving ecosystem-scale modeling of evapotranspiration using ecological mechanisms that account for compensatory responses following disturbance, Water Resour. Res., 53, 7853–7868, https://doi.org/10.1002/2017WR020823, 2017.
Mittelbach, H., Lehner, I., and Seneviratne, S. I.: Comparison of four soil moisture sensor types under field conditions in Switzerland, J. Hydrol., 430–431, 39–49, https://doi.org/10.1016/j.jhydrol.2012.01.041, 2012.
Moorhead, D. L., Sinsabaugh, R. L., Linkins, A. E., and Reynolds, J. F.: Decomposition processes: Modelling approaches and applications, Sci. Total Environ., 183, 137–149. https://doi.org/10.1016/0048-9697(95)04974-6, 1996.
Niklaus, P. A., Wardle, D. A., and Tate, K. R.: Effects of plant species diversity and composition on nitrogen cycling and the trace gas balance of soils, Plant Soil, 282, 83–98, https://doi.org/10.1007/s11104-005-5230-8, 2006.
Nyamangara, J., Piha, M. I., and Kirchmann, H.: Interactions of aerobically decomposed cattle manure and nitrogen fertilizer applied to soil, Nutr. Cycl. Agroecosyst., 54, 183–188, https://doi.org/10.1023/A:1009794416012, 1999.
Oberholzer, S., Prasuhn, V., and Hund, A.: Crop water use under Swiss pedoclimatic conditions – Evaluation of lysimeter data covering a seven-year period, Field Crops Res., 211, 48–65, https://doi.org/10.1016/j.fcr.2017.06.003, 2017.
Parton, W. J., Hartman, M., Ojima, D., and Schimel, D.: DAYCENT and its land surface submodel: Description and testing, Global Planet. Change, 19, 35–48, https://doi.org/10.1016/S0921-8181(98)00040-X, 1998.
Parton, W. J., Schimel, D. S., Ojima, D. S., and Cole, C. V.: A generalmodel for soil organic matter dynamics, in: Sensitivity to LitterChemistry, Texture and Management, edited by: Bryant, R. B. and Arnold, R. W., Quantitative modeling of soil forming processes, Soil Science Society of America Special Publication, 38, 137–167, 1994.
Pastorello, G., Trotta, C., Canfora, E., et al.: The FLUXNET2015 dataset and the ONEFlux processing pipeline for eddy covariance data, Sci. Data, 7, 225, https://doi.org/10.1038/s41597-020-0534-3, 2020.
Perego, A., Giussani, A., Sanna, M., and Fumagalli, M.: The ARMOSA simulation crop model: Overall features, calibration and validation results Space-time mapping and modelling of soil properties in Mediterranean and Temperate areas View project, Ital. J. Agrometeorol., 18, 23–38, 2013.
Peukert, S., Griffith, B. A., Murray, P. J., Macleod, C. J. A., and Brazier, R. E.: Intensive Management in Grasslands Causes Diffuse Water Pollution at the Farm Scale, J. Environ. Qual., 43, 2009–2023, https://doi.org/10.2134/jeq2014.04.0193, 2014.
Phogat, V., Skewes, M. A., Cox, J. W., Alam, J., Grigson, G., and Šimůnek, J.: Evaluation of water movement and nitrate dynamics in a lysimeter planted with an orange tree, Agric. Water Manage., 127, 74–84, https://doi.org/10.1016/j.agwat.2013.05.017, 2013.
Prechsl, U. E., Burri, S., Gilgen, A. K., Kahmen, A., and Buchmann, N.: No shift to a deeper water uptake depth in response to summer drought of two lowland and sub-alpine C3-grasslands in Switzerland, Oecologia, 177, 97–111, https://doi.org/10.1007/s00442-014-3092-6, 2015.
Pütz, T., Kiese, R., Wollschläger, U., Groh, J., Rupp, H., Zacharias, S., Priesack, E., Gerke, H. H., Gasche, R., Bens, O., Borg, E., Baessler, C., Kaiser, K., Herbrich, M., Munch, J., Sommer, M., Vogel, H., Vanderborght, J., and Vereecken, H.: TERENO-SOILCan: a lysimeter-network in Germany observing soil processes and plant diversity influenced by climate change, Environ. Earth Sci., 75, 1242, https://doi.org/10.1007/s12665-016-6031-5, 2016.
Pütz, T., Fank, J., and Flury, M.: Lysimeters in Vadose Zone Research, Vadose Zone J., 17, 1–4, https://doi.org/10.2136/vzj2018.02.0035, 2018.
Richter, G. M., Acutis, M., Trevisiol, P., Latiri, K., and Confalonieri, R.: Sensitivity analysis for a complex crop model applied to Durum wheat in the Mediterranean, Eur. J. Agron., 32, 127–136, https://doi.org/10.1016/j.eja.2009.09.002, 2010.
Robertson, A. D., Paustian, K., Ogle, S., Wallenstein, M. D., Lugato, E., and Cotrufo, M. F.: Unifying soil organic matter formation and persistence frameworks: the MEMS model, Biogeosciences, 16, 1225–1248, https://doi.org/10.5194/bg-16-1225-2019, 2019.
Sala, O. E. and Paruelo, J. M.: Ecosystem services in grasslands, in: Nature's services: societal dependence on natural ecosystems, edited by: Daily, G. C., Nature's Services: Societal Dependence on Natural Ecosystems, Island Press, Washington, DC, USA, 237–251, 1997.
Saxton, K. E. and Rawls, W. J.: Soil Water Characteristic Estimates by Texture and Organic Matter for Hydrologic Solutions, Soil Sci. Soc. Am. J., 70, 1569–1578, https://doi.org/10.2136/sssaj2005.0117, 2006.
Schirpke, U., Kohler, M., Leitinger, G., Fontana, V., Tasser, E., and Tappeiner, U.: Future impacts of changing land-use and climate on ecosystem services of mountain grassland and their resilience, Ecosyst. Serv., 26, 79–94, https://doi.org/10.1016/j.ecoser.2017.06.008, 2017.
Schlingmann, M., Tobler, U., Berauer, B., Garcia-Franco, N., Wilfahrt, P., Wiesmeier, M., Jentsch, A., Wolf, B., Kiese, R., and Dannenmann, M.: Intensive slurry management and climate change promote nitrogen mining from organic matter-rich montane grassland soils, Plant Soil, 456, 81–98, https://doi.org/10.1007/s11104-020-04697-9, 2020.
Schoen, R., Gaudet, J. P., and Bariac, T.: Preferential flow and solute transport in a large lysimeter, under controlled boundary conditions, J. Hydrol., 215, 70–81, https://doi.org/10.1016/S0022-1694(98)00262-5, 1999.
Shajari, F., Einsiedl, F., and Rein, A.: Characterizing Water Flow in Vegetated Lysimeters with Stable Water Isotopes and Modeling, Groundwater, 58, 759–770, https://doi.org/10.1111/gwat.12970, 2019.
Shi, Y., Davis, K. J., Duffy, C. J., and Yu, X.: Development of a Coupled Land Surface Hydrologic Model and Evaluation at a Critical Zone Observatory, J. Hydrometeorol., 14, 1401–1420, https://doi.org/10.1175/JHM-D-12-0145.1, 2013.
Siderius C., Groenendijk, P., van Gerven, L. P. A., Jeuken, M. H. J. L., and Smit, A. A. M. F. R.: Process description of NuswaLite; a simplified model for the fate of nutrients in surface waters, Alterra Report 1226.2, Alterra, Wageningen, 2008.
Simmelsgaard, S. E. and Djurhuus, J.: An empirical model for estimating nitrate leaching as affected by crop type and the long-term N fertilizer rate, Soil Use Manage., 14, 37–43, https://doi.org/10.1111/j.1475-2743.1998.tb00608.x, 1998.
Smit, A. A. M. F. R., Siderius, C., and van Gerven, L. P. A.: Process description of SWQN, A simplified hydraulic model, Report 1226.1, Alterra, Wageningen, 2009.
Smith, W., Grant, B., Qi, Z., He, W., VanderZaag, A., Drury, C. F., and Helmers, M.: Development of the DNDC model to improve soil hydrology and incorporate mechanistic tile drainage: A comparative analysis with RZWQM2, Environ. Model. Softw., 123, 104577, https://doi.org/10.1016/j.envsoft.2019.104577, 2020.
Sohier, C., Degre, A., and Dautrebande, S.: From root zone modelling to regional forecasting of nitrate concentration in recharge flows – The case of the Walloon Region (Belgium), Elsevier, available at: https://www.sciencedirect.com/science/article/pii/S0022169409001218 (last access: May 2020), 2009.
Sommerfeldt, T. G., Chang, C., and Entz, T.: Long-term Annual Manure Applications Increase Soil Organic Matter and Nitrogen, and Decrease Carbon to Nitrogen Ratio, Soil Sci. Soc. Am. J., 52, 1668–1672, https://doi.org/10.2136/sssaj1988.03615995005200060030x, 1988.
Spehn, E. M., Hector, A., Joshi, J., Scherer-Lorenzen, M., Schmid, B., Bazeley-White, E., Beierkuhnlein, C., Caldeira, M. C., Diemer, M., Dimitrakopoulos, P. G., Finn, J. A., Freitas, H., Giller, P. S., Good, J., Harris, R., Högberg, P., Huss-Danell, K., Jumpponen, A., Koricheva, J., Leadley, P. W., Loreau, M., Minns, A., Mulder, C. P. H., O'Donovan, G., Otway, S. J., Palmborg, C., Pereira, J. S., Pfisterer, A. B., Prinz, A., Read, D. J., Schulze, E.-D., Siamantziouras, A.-S. D., Terry, A. C., Troumbis, A. Y., Woodward, F. I., Yachi, S., and Lawton, J. H.: Ecosystem effects of biodiversity manipulations in european grasslands, Ecol. Monogr., 75, 37–63, https://doi.org/10.1890/03-4101, 2005.
Stenitzer, E.: Ein numerisches Modell zur Simulation des Bodenwasserhaushaltes und des Pflanzenertrages eines Standortes, Mitt. Bundesanstalt Kulturtech. Bodenwasserhaushalt 31, 201 pp., 1988.
Swiss Federal Council: Verordnung vom 23. Oktober 2013 über die Direktzahlungen an die Landwirtschaft (Direktzahlungsverordnung, DZV), available at: https://www.admin.ch/opc/de/classified-compilation/20130216/index.html (last access: May 2020), 1998.
Tafteh, A. and Sepaskhah, A. R.: Application of HYDRUS-1D model for simulating water and nitrate leaching from continuous and alternate furrow irrigated rapeseed and maize fields, Agric. Water Manage., 113, 19–29, https://doi.org/10.1016/j.agwat.2012.06.011, 2012.
Tague, C. L., McDowell, N. G., and Allen, C. D.: An Integrated Model of Environmental Effects on Growth, Carbohydrate Balance, and Mortality of Pinus ponderosa Forests in the Southern Rocky Mountains, PLoS ONE, 8, e80286, https://doi.org/10.1371/journal.pone.0080286, 2013.
Takruri, M., Rajasegarar, S., Challa, S., Leckie, C., and Palaniswami, M.: Spatio-temporal modelling-based drift-aware wireless sensor networks, IET Wireless Sens. Syst., 1, 110–122, https://doi.org/10.1049/iet-wss.2010.0091, 2011.
Tilman, D., Wedin, D., and Knops, J.: Productivity and sustainability influenced by biodiversity in grassland ecosystems, Nature, 379, 718–720, https://doi.org/10.1038/379718a0, 1996.
Van Dam, J. C.: Field-scale water flow and solute transport: SWAP model concepts, parameter estimation and case studies, Wageningen University, Wageningen, 2000.
Velthof, G. L., Lesschen, J. P., Schils, R. L. M., Smit, A., Elbersen, B. S., Hazeu, G. W., Mucher, C. A., and Oenema, O.: Grassland areas, production and use. Lot 2. Methodological studies in the field of Agro-Environmental Indicators, European Commission, Wageningen, 2014.
Vescovo, L. and Gianelle, D.: Using the MIR bands in vegetation indices for the estimation of grassland biophysical parameters from satellite remote sensing in the Alps region of Trentino (Italy), Adv. Space Res., 41, 1764–1772, https://doi.org/10.1016/j.asr.2007.07.043, 2008.
Vet, R., Artz, R. S., Carou, S., Shaw, M., Ro, C. U., Aas, W., Baker, A., Bowersox, V. C., Dentener, F., Galy-Lacaux, C., Hou, A., Pienaar, J. J., Gillett, R., Forti, M. C., Gromov, S., Hara, H., Khodzher, T., Mahowald, N. M., Nickovic, S., Rao, P. S. P., and Reid, N. W.: A global assessment of precipitation chemistry and deposition of sulfur, nitrogen, sea salt, base cations, organic acids, acidity and pH, and phosphorus, Atmos. Environ., 93, 3–100, https://doi.org/10.1016/j.atmosenv.2013.10.060, 2014.
Wang, C., Chen, Z., Unteregelsbacher, S., Lu, H., Gschwendtner, S., Gasche, R., Kolar, A., Schloter, M., Kiese, R., Butterbach-Bahl, K., and Dannenmann, M.: Climate change amplifies gross nitrogen turnover in montane grasslands of Central Europe in both summer and winter seasons, Glob, Change Biol., 22, 2963–2978, https://doi.org/10.1111/gcb.13353, 2016.
Widmoser, P. and Wohlfahrt, G.: Attributing the energy imbalance by concurrent lysimeter and eddy covariance evapotranspiration measurements, Agric. Forest Meteorol., 263, 287–291, https://doi.org/10.1016/j.agrformet.2018.09.003, 2018.
Wieder, W. R., Bonan, G. B., and Allison, S. D.: Global soil carbon projections are improved by modelling microbial processes, Nat. Clim. Change, 3, 909–912, https://doi.org/10.1038/nclimate1951, 2013.
Williams, J., Jones, C., and Dyke, P. T.: A modeling approach to determining the relationship between erosion and soil productivity, T. ASAE, 27, 129–144, https://doi.org/10.13031/2013.32748, 1984.
Wilson, K., Goldstein, A., Falge, E., Aubinet, M., Baldocchi, D., Berbigier, P., Bernhofer, C., Ceulemans, R., Dolman, H., Field, C., Grelle, A., Ibrom, A., Law, B. E., Kowalski, A., Meyers, T., Moncrieff, J., Monson, R., Oechel, W., Tenhunen, J., Valentini, R., and Verma, S.: Energy balance closure at FLUXNET sites, Agric. Forest Meteorol., 113, 223–243, https://doi.org/10.1016/S0168-1923(02)00109-0, 2002.
Wohlfahrt, G., Anderson-Dunn, M., Bahn, M., Balzarolo, M., Berninger, F., Campbell, C., Carrara, A., Cescatti, A., Christensen, T., Dore, S., Eugster, W., Friborg, T., Furger, M., Gianelle, D., Gimeno, C., Hargreaves, K., Hari, P., Haslwanter, A., Johansson, T., Marcolla, B., Milford, C., Nagy, Z., Nemitz, E., Rogiers, N., Sanz, M. J., Siegwolf, R. T. W., Susiluoto, S., Sutton, M., Tuba, Z., Ugolini, F., Valentini, R., Zorer, R., and Cernusca, A.: Biotic, abiotic, and management controls on the net ecosystem CO2 exchange of European mountain grassland ecosystems, Ecosystems, 11, 1338–1351, https://doi.org/10.1007/s10021-008-9196-2, 2008a.
Wohlfahrt, G., Hammerle, A., Haslwanter, A., Bahn, M., Tappeiner, U., and Cernusca, A.: Seasonal and inter-annual variability of the net ecosystem CO2 exchange of a temperate mountain grassland: Effects of weather and management, J. Geophys. Res., 113, D8, https://doi.org/10.1029/2007JD009286, 2008b.
Wohlfahrt, G., Irschick, C., Thalinger, B., Hörtnagl, L., Obojes, N., and Hammerle, A.: Insights from Independent Evapotranspiration Estimates for Closing the Energy Balance: A Grassland Case Study, Vadose Zone J., 9, 1025–1033, https://doi.org/10.2136/vzj2009.0158, 2010.
Wohlfahrt, G., Hammerle, A., and Hörtnagl, L.: FLUXNET2015 AT-Neu Neustift, Dataset, Fluxnet, https://doi.org/10.18140/FLX/1440121, 2020.
Wolf, B., Chwala, C., Fersch, B., Garvelmann, J., Junkermann, W., Zeeman, M. J., Angerer, A., Adler, B., Beck, C., Brosy, C., Brugggger, P., Emeis, S., Dannenmann, M., De Roo, F., Diaz-Pines, E., Haas, E., Hagen, M., Hajnsek, I., Jacobeit, J., Jagdhuber, T., Kalthoff, N., Kiese, R., Kunstmann, H., Kosak, O., Krieg, R., Malchow, C., Mauder, M., Merz, R., Notarnicola, C., Philipp, A., Reif, W., Reineke, S., Rödiger, T., Ruehr, N., Schäfer, K., Schrön, M., Senatore, A., Shupe, H., Völksch, I., Wanninger, C., Zacharias, S., and Schmid, H. P.: The scalex campaign: Scale-crossing land surface and boundary layer processes in the TERENO-prealpine observatory, B. Am. Meteorol. Soc., 98, 1217–1234, https://doi.org/10.1175/BAMS-D-15-00277.1, 2017.
Yu, L., Fatichi, S., Zeng, Y., and Su, Z.: The role of vadose zone physics in the ecohydrological response of a Tibetan meadow to freeze–thaw cycles, The Cryosphere, 14, 4653–4673, https://doi.org/10.5194/tc-14-4653-2020, 2020.
Zacharias, S., Bogena, H., Samaniego, L., Mauder, M., Fuß, R., Pütz, T., Frenzel, M., Schwank, M., Baessler, C., Butterbach-Bahl, K., Bens, O., Borg, E., Brauer, A., Dietrich, P., Hajnsek, I., Helle, G., Kiese, R., Kunstmann, H., Klotz, S., and Vereecken, H.: A Network of Terrestrial Environmental Observatories in Germany, Vadose Zone J., 10, 955–973, https://doi.org/10.2136/vzj2010.0139, 2011.
Zeeman, M.: Meteorology, environment and surface flux data for grassland sites in Germany, Zenodo, https://doi.org/10.5281/zenodo.4267887, 2020.
Zeeman, M. and Ruehr, N.: Management and plant physiology data for grassland sites in Germany, Zenodo, https://doi.org/10.5281/zenodo.4267810, 2020.
Zeeman, M. J., Hiller, R., Gilgen, A. K., Michna, P., Plüss, P., Buchmann, N., and Eugster, W.: Management and climate impacts on net CO2 fluxes and carbon budgets of three grasslands along an elevational gradient in Switzerland, Agric. Forest Meteorol., 150, 519–530, https://doi.org/10.1016/j.agrformet.2010.01.011, 2010.
Zeeman, M. J., Mauder, M., Steinbrecher, R., Heidbach, K., Eckart, E., and Schmid, H. P.: Reduced snow cover affects productivity of upland temperate grasslands, Agric. Forest Meteorol., 232, 514–526, https://doi.org/10.1016/j.agrformet.2016.09.002, 2017.
Zeeman, M. J., Shupe, H., Baessler, C., and Ruehr, N. K.: Productivity and vegetation structure of three differently managed temperate grasslands, Agric. Ecosyst. Env., 270–271, 129–148, https://doi.org/10.1016/j.agee.2018.10.003, 2019.
Zhu, N.: Effect of low initial C/N ratio on aerobic composting of swine manure with rice straw, Biores. Technol., 98, 9–13, https://doi.org/10.1016/j.biortech.2005.12.003, 2007.