the Creative Commons Attribution 4.0 License.
the Creative Commons Attribution 4.0 License.
 | 27 Apr 2021
Arctic aquatic graminoid tundra responses to nutrient availability
Vanessa L. Lougheed
Unraveling the environmental controls influencing Arctic tundra productivity is paramount for advancing our predictive understanding of the causes and consequences of warming in tundra ecosystems and associated land–atmosphere feedbacks. This study focuses on aquatic emergent tundra plants, which dominate productivity and methane fluxes in the Arctic coastal plain of Alaska. In particular, we assessed how environmental nutrient availability influences production of biomass and greenness in the dominant aquatic tundra species: Arctophila fulva and Carex aquatilis. We sampled a total of 17 sites distributed across the Barrow Peninsula and Atqasuk, Alaska, following a nutrient gradient that ranged from sites with thermokarst slumping or urban runoff to sites with relatively low nutrient inputs. Employing a multivariate analysis, we explained the relationship of soil and water nutrients to plant leaf macro- and micro-nutrients. Specifically, we identified soil phosphorus as the main limiting nutrient factor given that it was the principal driver of aboveground biomass (R2=0.34, p=0.002) and normalized difference vegetation index (NDVI) (R2=0.47, p=0.002) in both species. Plot-level spectral NDVI was a good predictor of leaf P content for both species. We found long-term increases in N, P and Ca in C. aquatilis based on historical leaf nutrient data from the 1970s of our study area. This study highlights the importance of nutrient pools and mobilization between terrestrial–aquatic systems and their potential influence on productivity and land–atmosphere carbon balance. In addition, aquatic plant NDVI spectral responses to nutrients can serve as landscape hot-spot and hot-moment indicators of landscape biogeochemical heterogeneity associated with permafrost degradation, nutrient leaching and availability.
- Article
(7590 KB) - Full-text XML
- BibTeX
- EndNote


In the Arctic, plant growth is limited by several factors including low temperatures, short growing seasons (e.g., irradiance) and nutrient availability (Chapin et al., 1975; Shaver et al., 1998). Although Arctic temperatures have increased dramatically over recent decades with parallel increases in plant biomass, nutrients have been shown to be the main driver enhancing Arctic tundra productivity compared to temperature in long-term experimental treatments (Boelman et al., 2003; Johnson et al., 2000; Jónsdóttir et al., 2005; Shaver et al., 1998) and in long-term field observations (López-Blanco et al., 2020). Increased tundra productivity has generally been explained by warming-mediated processes including increases in nutrient availability through soil warming, heterotrophic decomposition, and nutrient release from mineralization of organic matter and permafrost thaw (Keuper et al., 2012; Natali et al., 2012; Pastick et al., 2019; Reyes and Lougheed, 2015). In addition, abrupt thaw and recent lake drainage events enhanced during warm summers have also contributed to increased productivity through the availability of fertile soils (Jones et al., 2012; Loiko et al., 2020; Nitze et al., 2020; Turetsky et al., 2020). These factors highlight the complexity of tundra plant growth and production under a warming and changing Arctic with implications for carbon budgets (McGuire et al., 2018; Oberbauer et al., 2007). Unraveling the covarying climate and environmental controls influencing Arctic tundra productivity is paramount for advancing our predictive understanding of the causes and consequences of warming in tundra ecosystems and associated land–atmosphere feedbacks.
Nutrients play a key role influencing tundra plant production with complex effects on ecosystem carbon balance. Early work by Chapin et al. (1975) and Shaver et al. (1998) demonstrated that nutrients, particularly N and P, enhanced plant biomass and aboveground plant nutrients in wet tundra communities. In contrast, temperature alone has shown no effect on biomass production in long-term experimental treatments (Boelman et al., 2003; Johnson et al., 2000; Jónsdóttir et al., 2005; Shaver et al., 1998). While nutrients drive productivity and accumulation of new organic matter in the soil, nutrient enrichment can result in net carbon losses by enhancing decomposition of old carbon stocks (Mack et al., 2004). These results emphasize the importance of nutrient–carbon interactions in controlling ecosystem processes and ecosystem C balance in arctic tundra.
Our study builds on previous experimental studies that examined nutrient impacts on wet tundra (Beermann et al., 2015; Boelman et al., 2003; Lara et al., 2019; McLaren and Buckeridge, 2019; Shaver et al., 1998) by focusing on aquatic tundra, which are a relatively understudied plant community in the Arctic. Aquatic emergent tundra plants are known to have the highest productivity compared to terrestrial communities and contribute to a significant portion of regional carbon sink and methane fluxes (Andresen et al., 2017; Joabsson and Christensen, 2001; Lara et al., 2015). In recent decades, Arctic aquatic communities have increased in biomass and cover (Andresen and Lougheed, 2015; Villarreal et al., 2012), likely attributed to an increase in nutrient input leached from terrestrial systems through permafrost degradation and abrupt thaw events into aquatic habitats (Reyes and Lougheed, 2015; Turetsky et al., 2020), but the impacts of nutrients on Arctic aquatic plant communities have not been well documented in literature (Andresen, 2014).
Nutrients have increased over the past 40 years in aquatic habitats (Lougheed et al., 2011) with parallel biomass increases in aquatic graminoids (Andresen et al., 2017). This phenomenon will likely become more pronounced as increasing temperatures in Arctic soils continue enhancing nitrogen mineralization (Uhlířová et al., 2007; Weintraub and Schimel, 2003) as well as permafrost degradation and nutrient leaching (Fouché et al., 2020; Frey and McClelland, 2009; Keuper et al., 2012; Reyes and Lougheed, 2015). With increased thaw and subsurface flow (Frampton et al., 2013; Shiklomanov et al., 2013), these processes may provide substantial nutrient inputs to freshwater ecosystems; however, there is increased need to assess the effects of these increased nutrient inputs on aquatic tundra productivity.
Remote sensing has been used to detect and quantify plant productivity in Arctic systems based on multispectral indices (Epstein et al., 2012; Pastick et al., 2019; Walker et al., 2012a). Boelman et al. (2003) showed the applicability of the normalized vegetation index (NDVI) as a tool to track spectral responses of wet sedge tundra to nutrients in fertilization and warming experiments. Other studies employing digital repeat photography have successfully assessed plant phenology, biomass and productivity by evaluating vegetation color with indices in the visual spectral range (i.e., blue, green and red) (Andresen et al., 2018; Saitoh et al., 2012; Sonnentag et al., 2012). Plant spectral responses to nutrient enrichment in aquatic communities are poorly understood, and remote sensing data would help monitor and quantify potential carbon and energy feedbacks to the atmosphere at regional scales.
With current and projected warming and nutrient loading into Arctic aquatic systems, it is important to understand nutrient impacts on aquatic emergent vegetation and how these changes can be detected and modeled using remote sensing methods. In this study, we sampled tundra pond sites that followed a nutrient gradient that ranges from sites with thermokarst slumping or urban runoff to sites with relatively low nutrient inputs. We aim to characterize nutrient limitation of aquatic emergent tundra vegetation and spectral responses of this vegetation to nutrient inputs. We focus on the influence of soil and water nutrients on plant biomass and greenness of Carex aquatilis and Arctophila fulva, the dominant aquatic emergent vascular plants in the Arctic coastal plain (Andresen et al., 2018; Villarreal et al., 2012), to answer the following questions. (i) How is aquatic tundra responding to nutrient availability? (ii) How does environmental nutrient status influence leaf nutrients in aquatic tundra? (iii) What are the spectral responses (NDVI) of aquatic tundra to nutrient availability?
2.1 Study sites
This study was conducted in the Barrow Peninsula, Alaska, (70∘ N, 156∘ W) near the town of Uqtiaġvik (formerly known as Barrow). Physiographically, the area is located in the Arctic Coastal Plain (ACP, ∼ 60 000 km2) of northern Alaska, which stretches from the western coast along the Chukchi Sea to the Beaufort coastal Canadian border. The ACP is dominated by thick continuous permafrost with high ground-ice content for the Arctic peaty lowland of the peninsula (Hinkel et al., 2003). Soil organic horizon varies across the landscape due to the age of the landform (i.e., drained thaw lake basin) and cryoturbation of the soil. Nonetheless, sites are located in old and ancient drained thaw lake basins where the surface organic thickness ranges between 15 and 35 cm from surface (Hinkel et al., 2003). A complex mosaic of ice-wedge-patterned ground landforms developed over millennial seasonal cycles of cracking, heaving and thawing, producing its characteristic pond- and lake-dominated landscape (Andresen and Lougheed, 2015; Jorgenson and Shur, 2007). These aquatic habitats of the ACP are hosts for aquatic graminoid tundra that grows in shallow standing water with a depth range of 5–50 cm. This study focuses on two species: C. aquatilis and A. fulva. These graminoids are the dominant cover in aquatic habitats, generally grow as monotypic stands on the edge and/or inside tundra ponds (Andresen et al., 2017; Villarreal et al., 2012), and their distribution is in the low and sub-Arctic. Although these species have growth forms in moist and dry tundra (Shaver et al., 1979), this study focuses on their aquatic phenotypes.
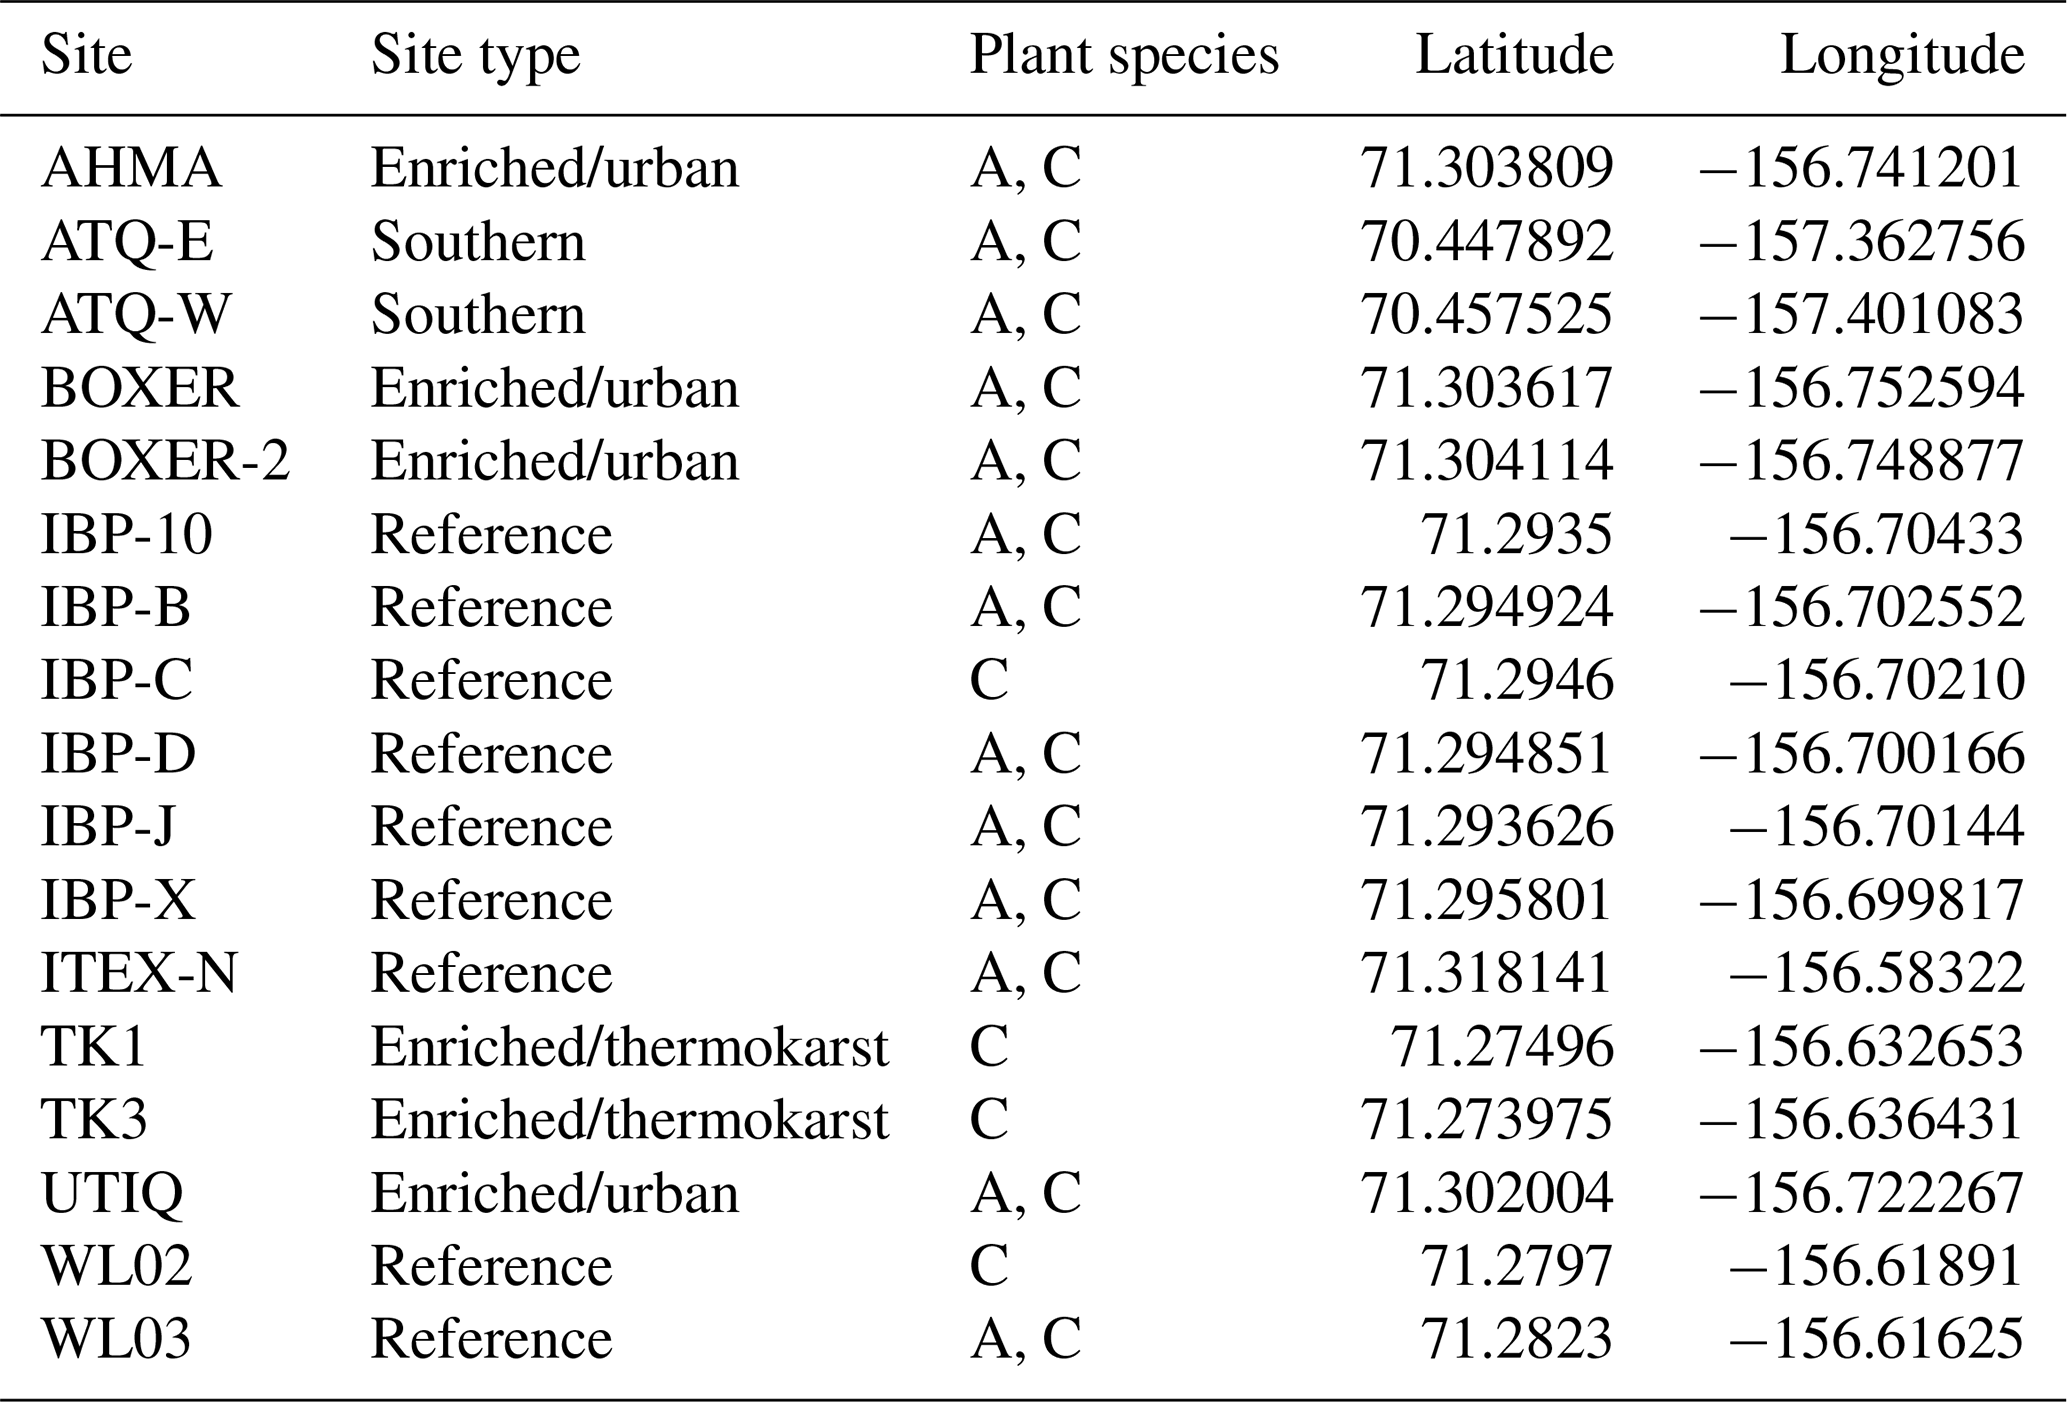
A total of 17 tundra ponds were sampled in 4–9 August 2013 along a nutrient gradient with long-term sources of nutrients. Sites were grouped in four categories according to their geographic location and nutrient source as (i) enriched urban, (ii) enriched thermokarst, (iii) reference and (iv) southern (Figs. 1, 2, Appendix Table A1). Enriched urban ponds were located within the town of Utqiaġvik, AK, and their source of nutrients was mainly from village runoff. Enriched thermokarst ponds were situated within the Barrow Environmental Observatory (BEO), and their nutrient inputs originate from permafrost slumping into ponds. Reference sites were located across the region in the historical International Biological Program (IBP) sites and in the BEO; but these sites do not contain evidence of continuous permafrost slumping. Southern latitude ponds were located 100 km south of Utqiaġvik, near the town of Atqasuk, AK. We sampled these ponds in order to expand the geographic footprint of the study and serve as reference to the Utqiaġvik area. It is important to note that while C. aquatilis occurs in all ponds, A. fulva does not occur in thermokarst ponds nor in IBP-C and WL02 ponds (Appendix Table A1).
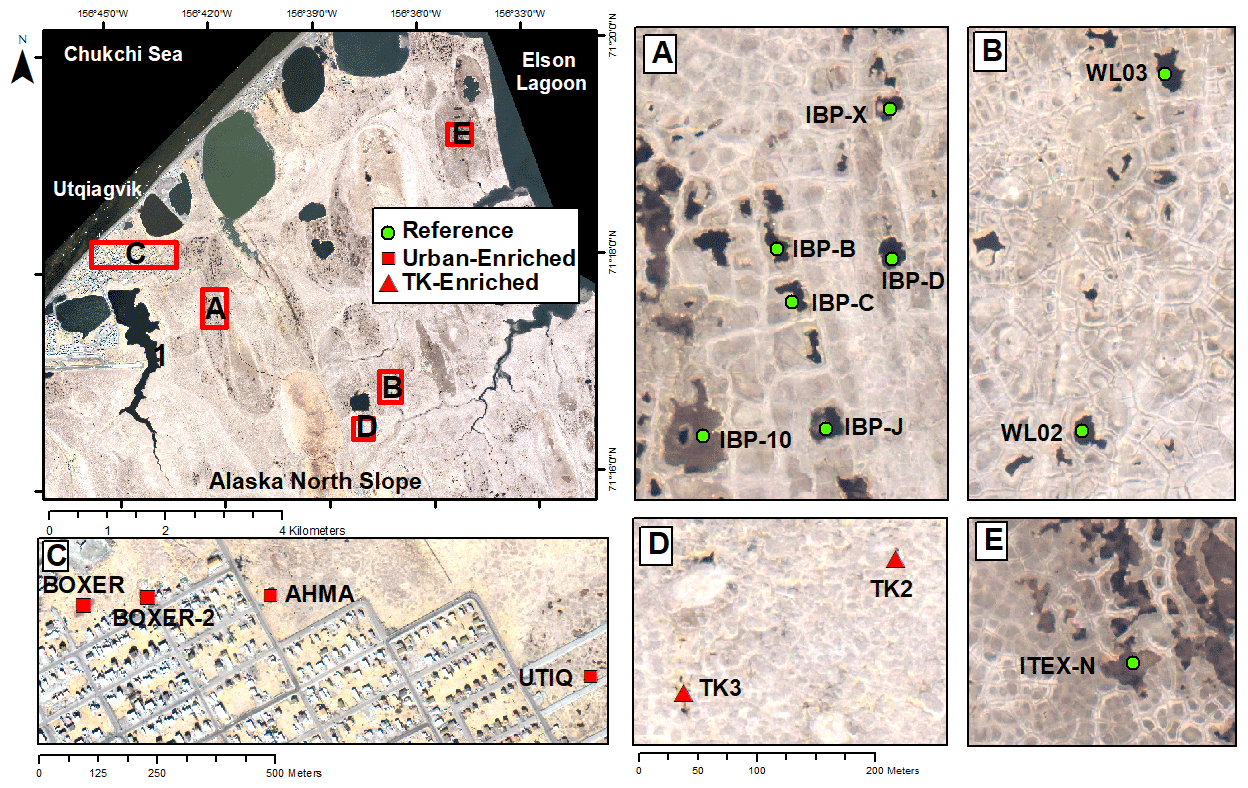
Figure 1Map of Utqiaġvik sites sampled in this study. For site details including southern sites, see Appendix Table A1 (Imagery© (2012) DigitalGlobe, Inc.).
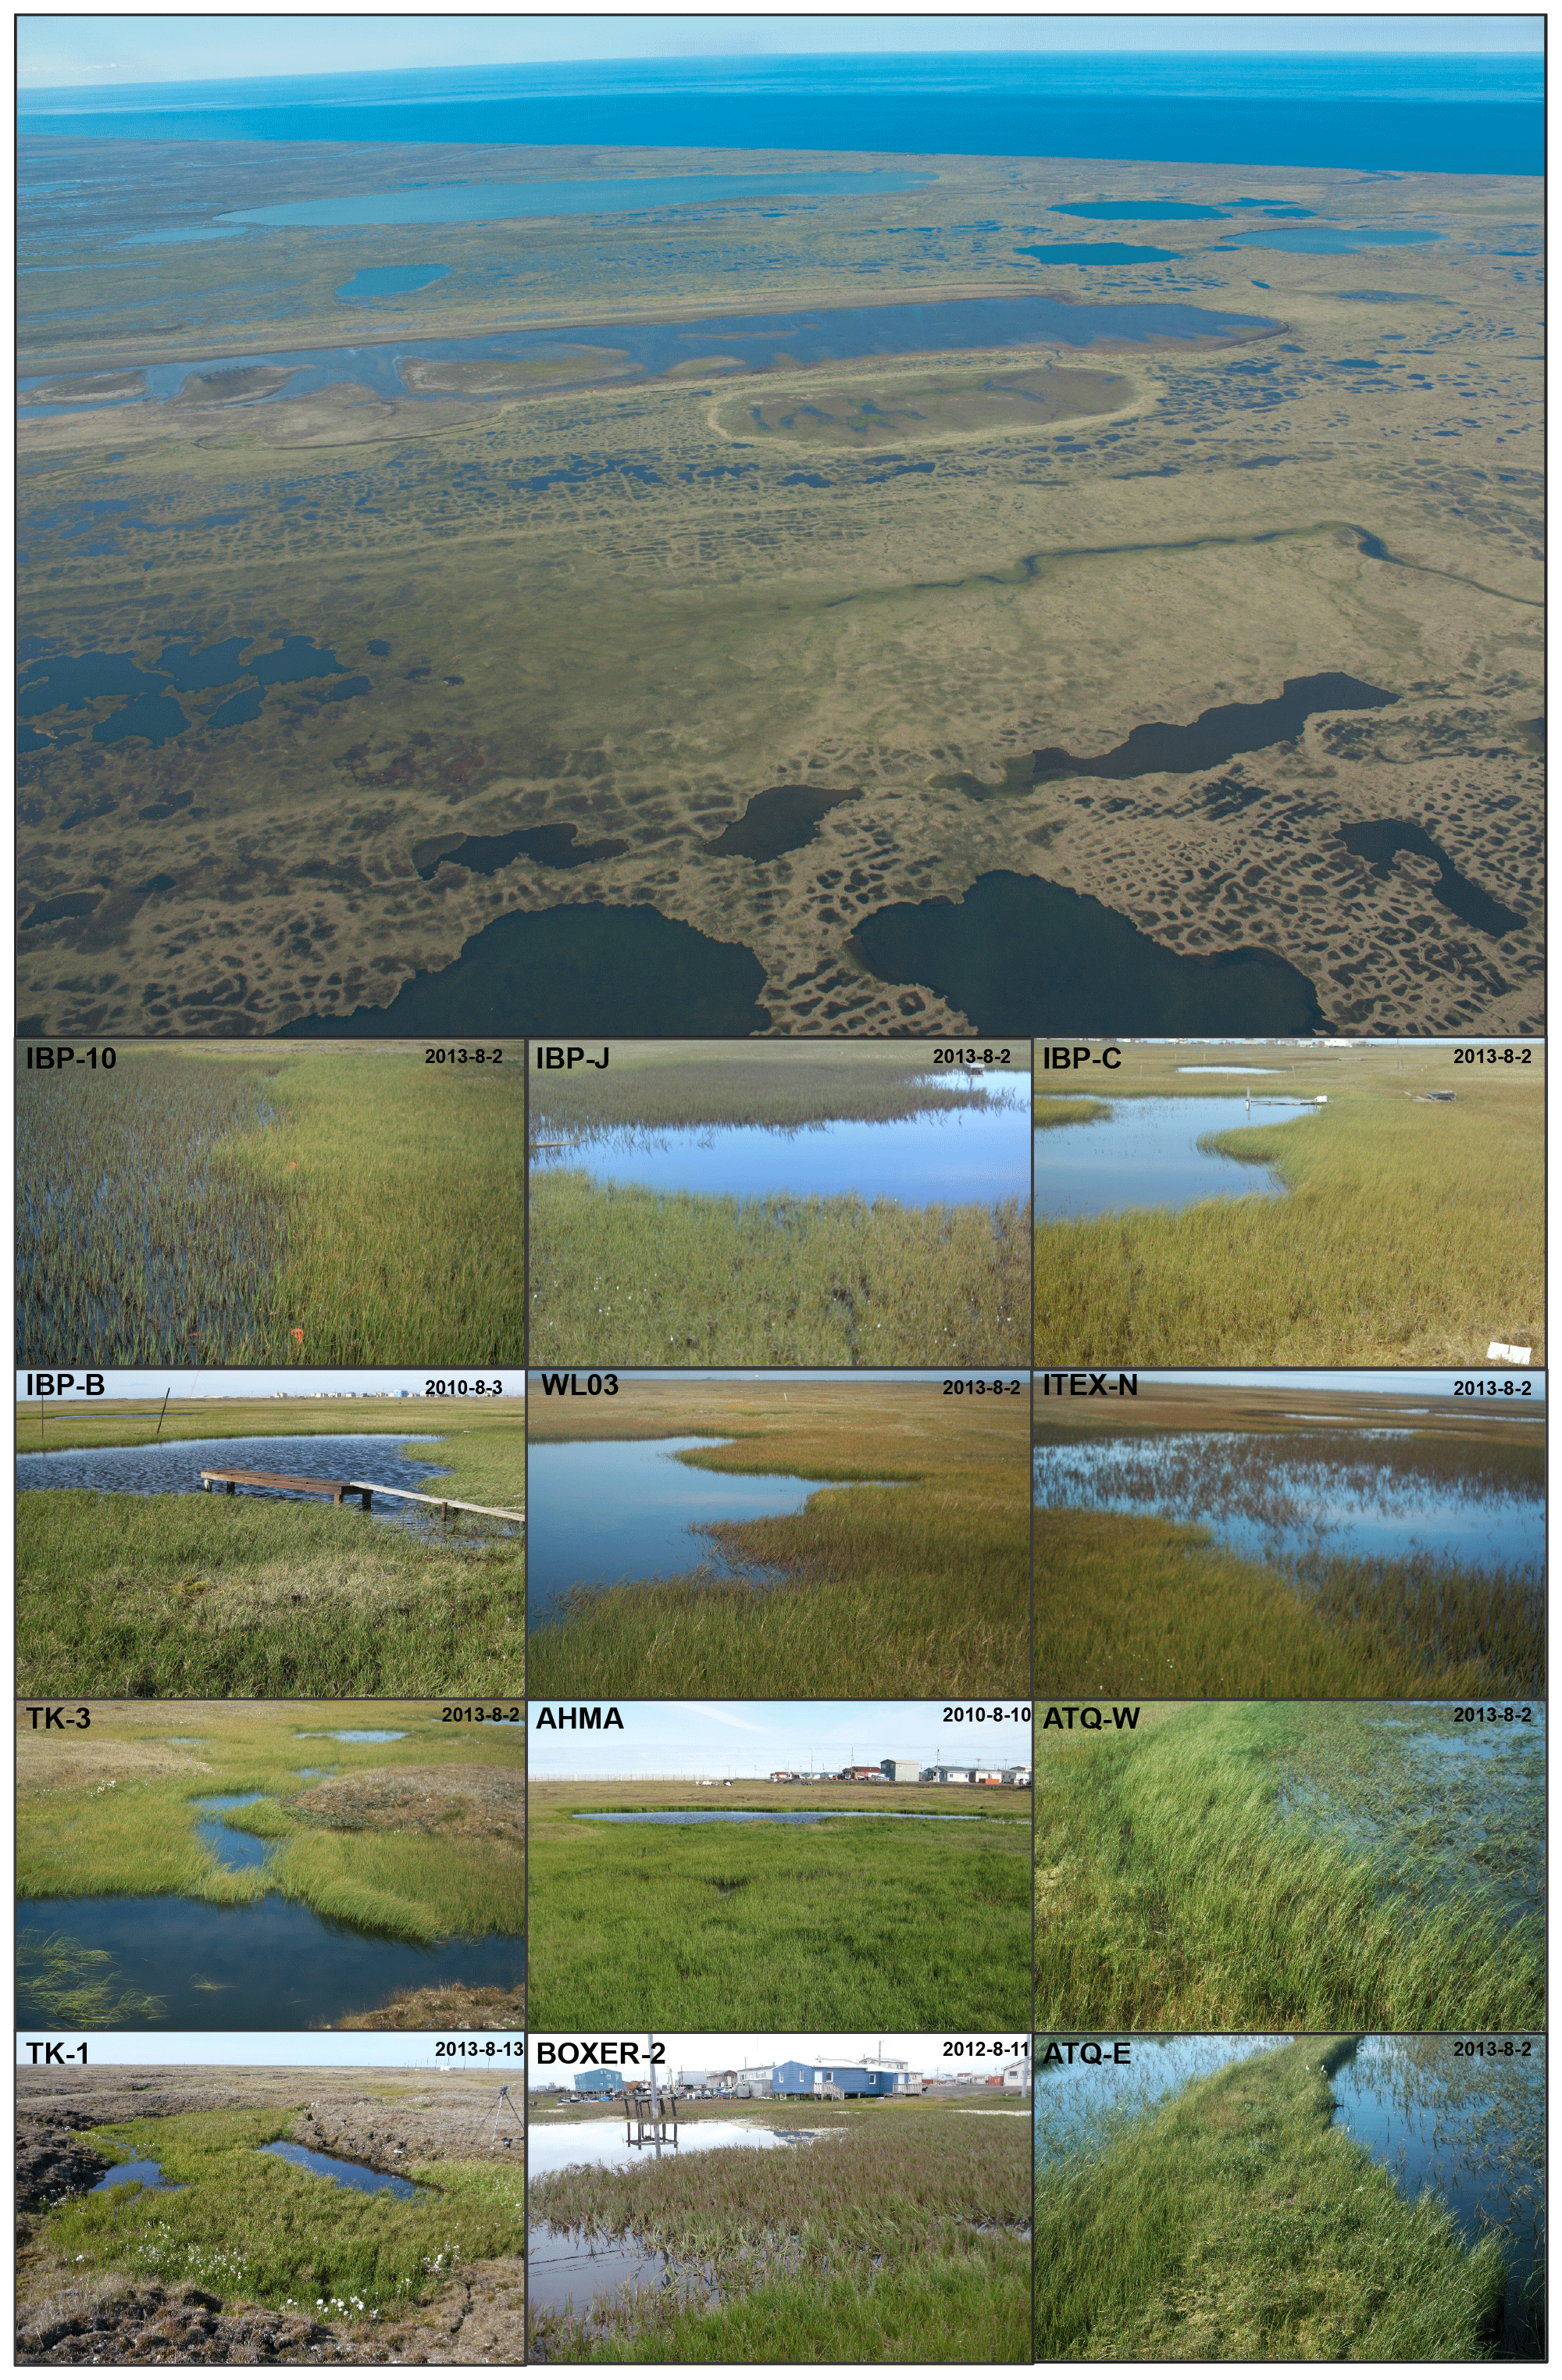
Figure 2Aerial view the Arctic coastal plain near Utqiaġvik, AK, and examples of sites sampled in this study. Images indicate site name (top left) and picture date YYYY/M/D (top right). Photos by Christian G. Andresen.
2.2 Plant nutrients
We collected live, green samples of A. fulva and C. aquatilis at peak growing season (25 July–5 August 2013). Each sample consisted of 10–15 plants collected from different water depths and multiple randomly selected locations in pond habitats within monotypic stands of each species. The collected plants were separated into leaves and roots, then rinsed with distilled water, oven-dried at 60 ∘C for 24 h inside open paper envelopes, and then shipped to Utah State University Analytical Labs (USUAL) for immediate processing. Most macro- and micro-nutrients in leaves of each plant were analyzed using an inductively coupled plasma spectrometer (ICP-MS). Total nitrogen was analyzed by combustion analysis (HNO3 H2O2 digestion, LECO Corporation).
2.3 Ancillary data
Concomitant with the collection of aquatic plants for nutrient analysis, we collected soil and water samples, harvested aboveground plant biomass, measured spectral reflectance, and monitored most sites using time-lapse photography (Andresen et al., 2018) (Fig. 2). For each site, sediment samples from the active root soil depth of 10–20 cm for each species were collected in triplicates within the site. Samples were then combined in a plastic bag and frozen until analysis. Soil at this depth range (10–20 cm) was a combination of mineral and organic horizon and varied among sites and within each site. Thus, the combination of three soil samples in each site aided to minimize soil heterogeneity discrepancies and give an overall picture of soil conditions at each site. In the lab, soil samples were air dried for 3 d after thaw and then analyzed for physical and chemical factors including pH, electric conductance (EC) and macronutrients (for logistical reasons, only P, K and nitrate were analyzed). Water chemistry followed standard methods (American Public Health Association, 1998) where nitrate-nitrogen was quantified by cadmium reduction, ammonia using the phenate method, total phosphorus by ascorbic acid method with persulfate digestion, soluble reactive phosphorus by the ascorbic acid method and silica using the heteropoly blue method. In contrast to sediment, which was sampled for each plant type, water samples from the open water mid-column were assumed to be representative of the whole pond, including both plant species given the relatively well-mixed environment.
Aboveground plant biomass was harvested within duplicate representative 50 cm × 20 cm quadrats for each species at each site. In addition, reflectance measurements of canopy radiance were collected at each site employing a single-channel portable spectrometer (JAZ, Ocean Optics). Following Andresen et al. (2018), reflectance measurements were collected during sunny conditions between 12:00 and 16:00 (time zone is AKST for all times throughout the paper) for maximum solar elevation angles (29–33∘; ∼ 14:00 is highest https://www.esrl.noaa.gov/, last access: 20 August 2020) and to best match satellite observations. The person doing the collection was standing in the opposite direction of the solar azimuth angle to avoid any effects of shading by the instrument or person. All plots for both aquatic species were inundated at the time of sampling (including soil, plant and spectral samples) with a water depth (± SD) of 25.2 ± 4.6 for A. fulva and 10.3 ± 3.22 cm for C. aquatilis. Solar specular reflection of water on aquatic emergent plant spectral measurements was insignificant given that solar elevation angles are relatively low in the Arctic (∼ 33∘, peak season) and solar specular reflection was outside of the ∼ 1 m spectral footprint of the measured plot. The reflectance ratio was estimated between plot radiance at nadir and the calibration standard radiance. White calibration standard (38 mm wide) was positioned 30 mm at nadir below the field spectrometer optic fiber (field of view of 25∘) at each calibration and then capped closed to minimize degradation. NDVI measurements from five scans were averaged in each plot and four to six plots per pond for comparison with leaf nutrients. Normalized difference vegetation index (NDVI) was estimated from reflectance ratio values using the formula NDVI = (800 nm − 680 nm) (800 nm + 680 nm). NDVI is a standard proxy of plant productivity and biomass in the Arctic and has been used to track plot (Andresen et al., 2018; Gamon et al., 2013; Soudani et al., 2012) to regional and global seasonal and decade timescale productivity trends (Bhatt et al., 2010; Walker et al., 2012b; Zeng and Jia, 2013).
Parallel to reflectance NDVI measurements, we employed phenocams (optical photography) at each site to calculate the “green excess” index (GEI) (Andresen et al., 2018; Richardson et al., 2009) from peak-season oblique images using the formula [ (R+B)], where G is the brightness value in the green, R is the brightness value in the red and B is the brightness value in the blue. Oblique-angle GEI collected from cameras in this study is strongly associated with nadir-angle NDVI for both A. fulva and C. aquatilis (Andresen et al., 2018). For additional camera details and setup, refer to Andresen et al. (2018).
2.4 Statistical analysis
We employed principal component analysis (PCA) to generate linear combinations of the plant leaf nutrient data to describe the primary gradients in plant nutrient enrichment among the sites. PCA assumes linear relationships among variables, which was confirmed with scatterplots prior to analysis. Plant nutrient data were standardized to zero mean and unit variance and log10 transformed where applicable to obtain a normal distribution. PCA axes were then associated with environmental data (i.e., soil and water nutrients, plant biomass, NDVI, GEI) using a Pearson correlation. Variables were log-transformed as required to meet the assumptions of normality. All statistical analyses were performed in SAS JMP software v4.0. Significance of the PC axes was confirmed in PC-ORD. Differences in environmental and biological characteristics among areas within ponds dominated by C. aquatilis and A. fulva were assessed using a paired t test, with areas compared within each sampled pond. Green-up dates by phenocams were determined using a regression tree analysis as described in Andresen et al. (2018).
Examining the relationships between plant biomass and macronutrient (N, P) content of the plant leaves and soil revealed that plant leaf phosphorus content was the primary determinant of aquatic plant biomass, significantly explaining 40 % of the variation in biomass of C. aquatilis (p=0.01) and 32 % of the biomass variation in A. fulva (marginally significant at p=0.6). Combining both aquatic species, leaf P significantly explains 34 % of aboveground biomass variability with p=0.002 (Fig. 3).
In addition, we found a positive linear relationship (R2=0.48, p<0.01) between leaf phosphorus and NDVI (Fig. 3). There were no significant relationships between plant biomass and leaf nitrogen. Among site types, enriched sites (urban and thermokarst) have statistically higher soil, leaf and water nutrients compared to reference sites (p<0.001), with no differences found for southern sites.
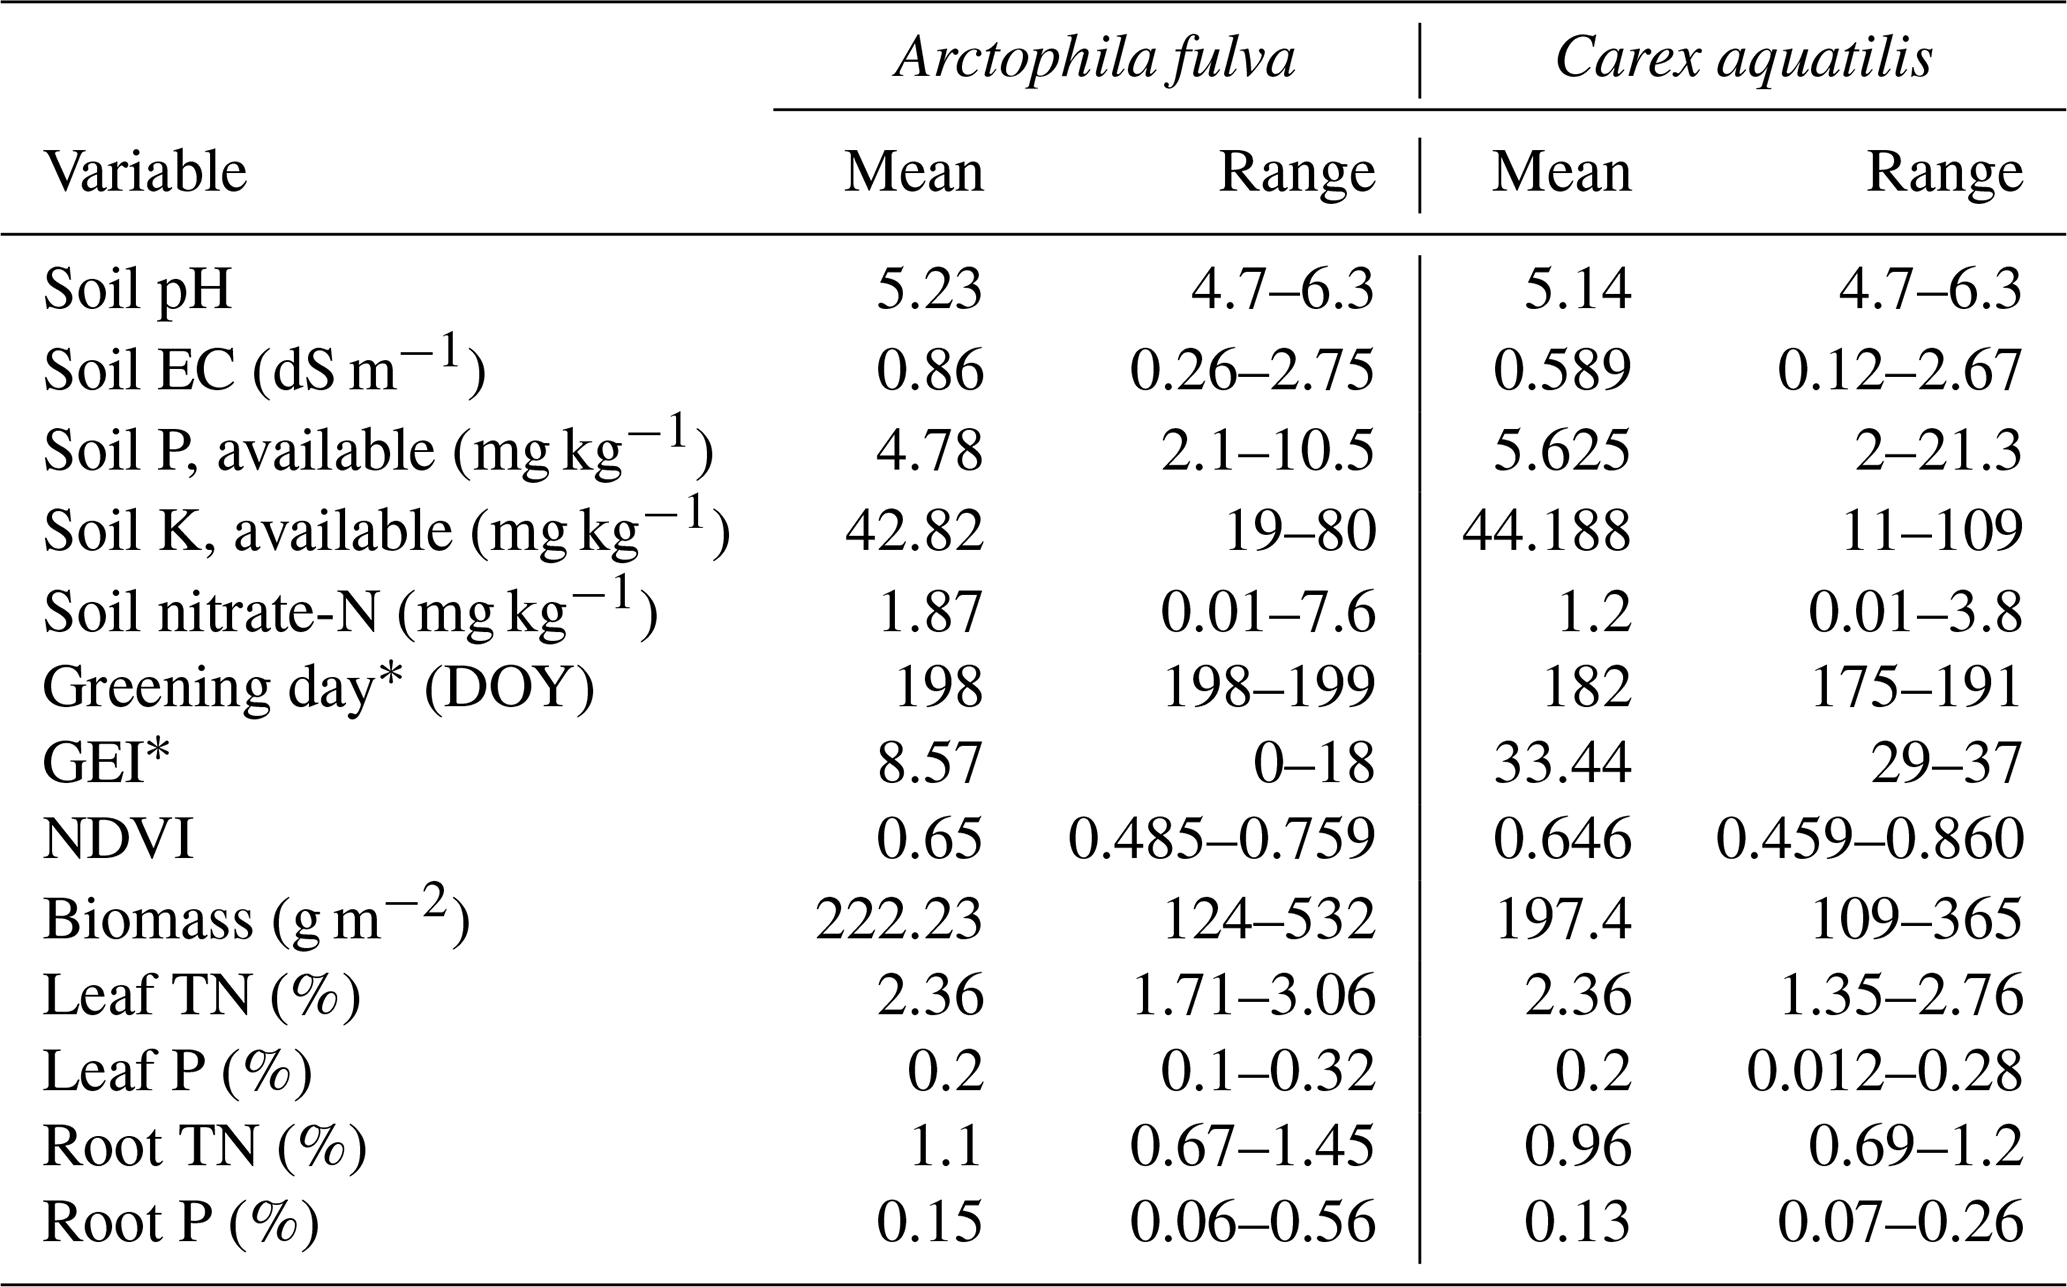
There were no significant differences in leaf and soil macro-nutrients among plant species in a given pond from reference sites (paired t test, p>0.05) (Table 1). However, leaf micronutrients among plant species differed. We found significantly higher amounts of leaf Al, B, Ba, Mn, Na, Ni, Si and Zn in C. aquatilis compared to A. fulva (p<0.05 level). The most abundant leaf element in both plant species was N, followed in decreasing order by K, P, S and Mg, and these ratios were consistent across the nutrient gradient sites (Fig. 4).
There were significant differences in green-up date and peak season greenness excess index (GEI) among species (p<0.01, Table 1). A. fulva greened later (day 200 vs. 183) and had lower GEI (9 vs. 33) compared to C. aquatilis. These differences are associated with unique phenotypic properties between species in the visual spectral range (Andresen et al., 2018). There was no corresponding difference in NDVI or biomass among species (p>0.05).
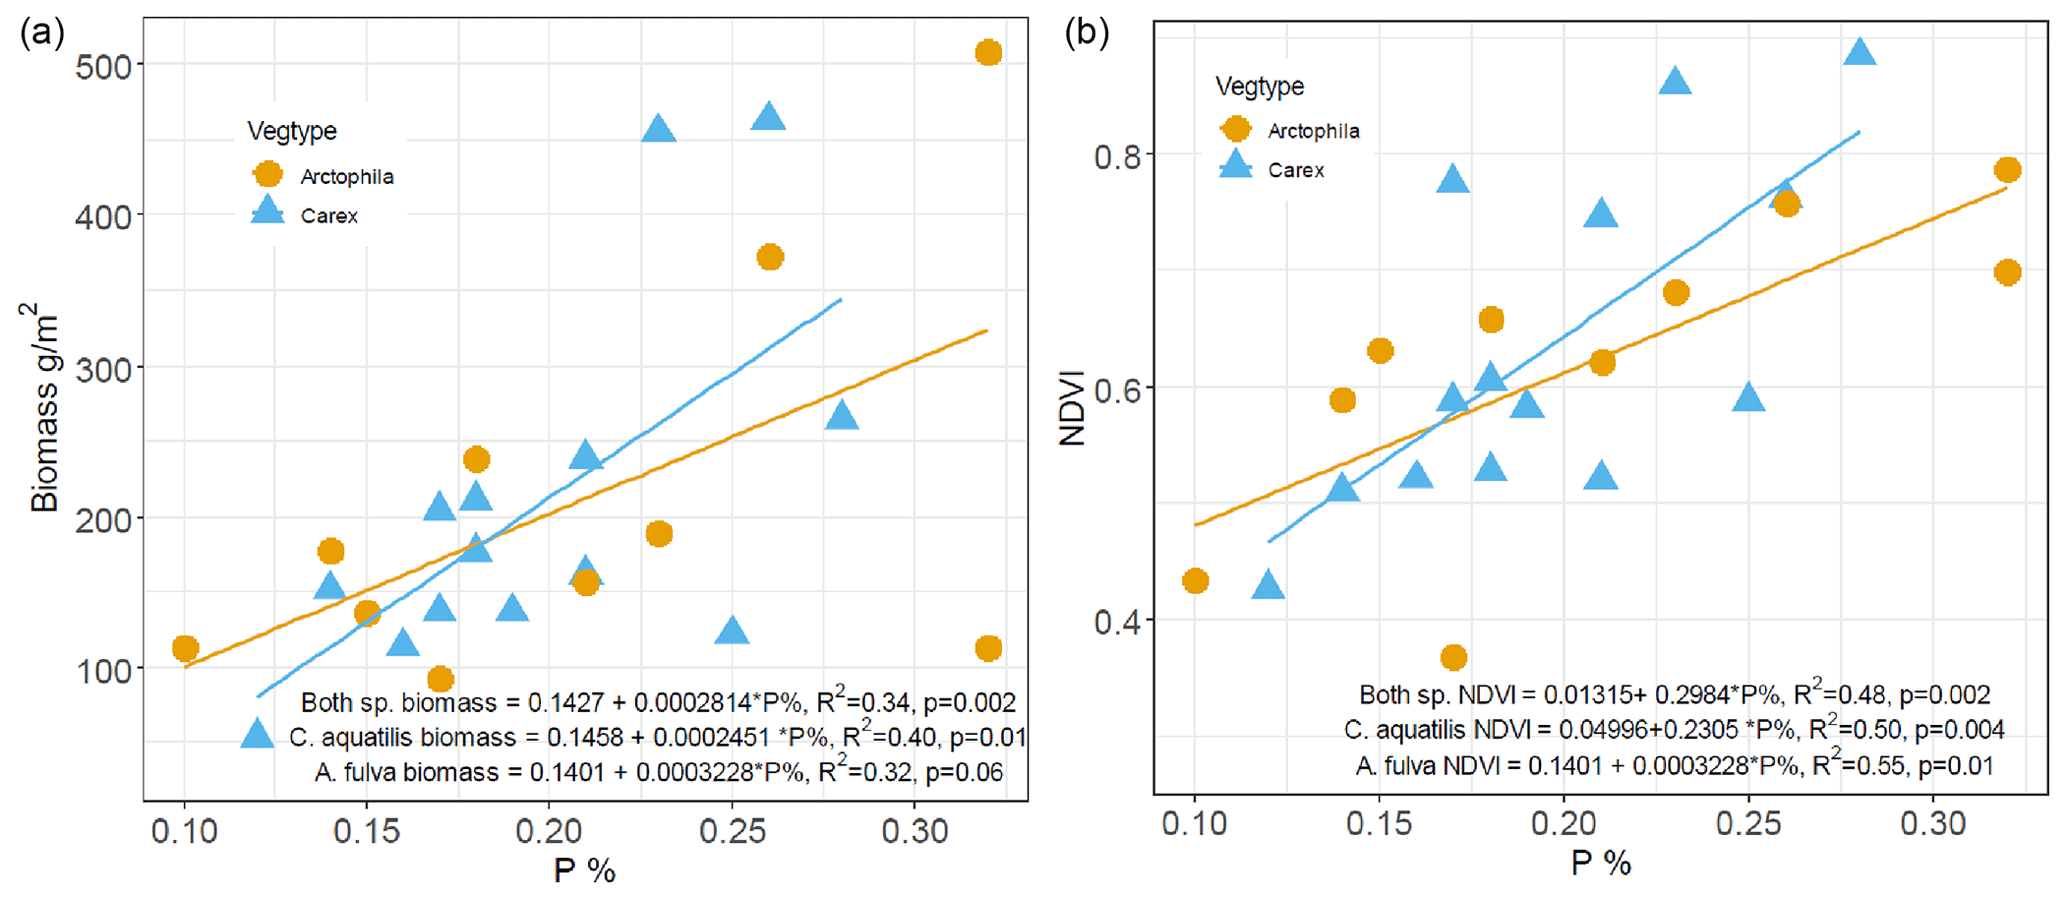
Figure 3Relationship between phosphorus content (%) of leaves and dry weight aboveground biomass (a) and NDVI (b) for Carex aquatilis and Arctophila fulva. Biomass collected during peak growing season (first week of August). Each point represents site averages.

Figure 4Descending order of element concentration in aboveground tissue among plant species. Error bars represent 1 standard deviation from mean.
Table 1Range of environmental variables by vegetation type from 17 ponds in Utqiaġvik and Atqasuk, Alaska. The asterisk represents significantly different among species at p<0.01. Range represents min and max.
3.1 Arctophila fulva
For A. fulva, the first four PC axes explained 72 % of the variation in plant leaf nutrients. However, only axes 1 and 4 were significant (p<0.05). Axis 1 explained 29 % of the variation and was positively correlated with the plant macronutrients N, P, K, Ca, Mg and S as well as other elements such as Al, B, Ba, Mn, S and Zn and negatively correlated with Ni, Pb and Fe. On the other hand, PC axis 4 explained 13 % of the variation and was positively correlated with As, Ca, Cr, Ni, Si and Zn (Table 2, Fig. 5).
Site types for A. fulva were clearly separated along axes PCA-1 and PCA-4 (Fig. 5). Enriched urban systems were located on the upper left quadrant, coinciding with higher concentrations of many leaf nutrients and environmental variables such as soil P, EC, water P, Si, DOC, plant biomass and higher green spectral indices (NDVI, GEI). Conversely, reference sites and those at southern latitudes were located in the opposite quadrants of the plot with a wider distribution along PCA-4 and thus wider variability in leaf nutrients and environmental conditions. Southern sites for A. fulva showed a similar distribution to reference sites (Fig. 5).
3.2 Carex aquatilis
C. aquatilis PC axes 1 and 2 explained 50 % of the variation in the plant nutrient data. PC axis 1 (26 %) showed positive relationships with important macronutrients N, P and Mg and other elements such as Al, Ba, Co, Cu, Fe, Mo, Pb and Zn. PC axis 2 explained 24 % of the variation in leaf nutrients and was positively associated with Al, Ba, K, Mn, P, S and Sr and negatively associated with Ni, Mo, Se, Zn (Table 2).
The C. aquatilis PC plot of axes 1 and 2 also showed sites grouped by type (Fig. 5). We observed a good separation along PCA-2 of enriched urban ponds compared to reference, southern and enriched thermokarst. Similar to A. fulva, the enriched sites were found at the positive end of an axis that was positively associated with water nutrients, alkalinity, conductance, plant biomass, NDVI and soil K (Table 3). Environmental variables positively associated with the vertical distribution of sites along axis 1 included soil EC and water nutrients (TDP, SRP, NO3) and negative correlations with water pH, alkalinity and C. aquatilis green-up date (Table 2). We noticed grouping of enriched thermokarst and reference sites for C. aquatilis in a portion of the plot associated with high electrical conductance and water TDP, SRP and NO3. Conversely to A. fulva, the southern sites were clustered away from other sites, in the lower left quadrant, likely reflecting earlier green-up, higher GEI, and lower soil and water nutrients.
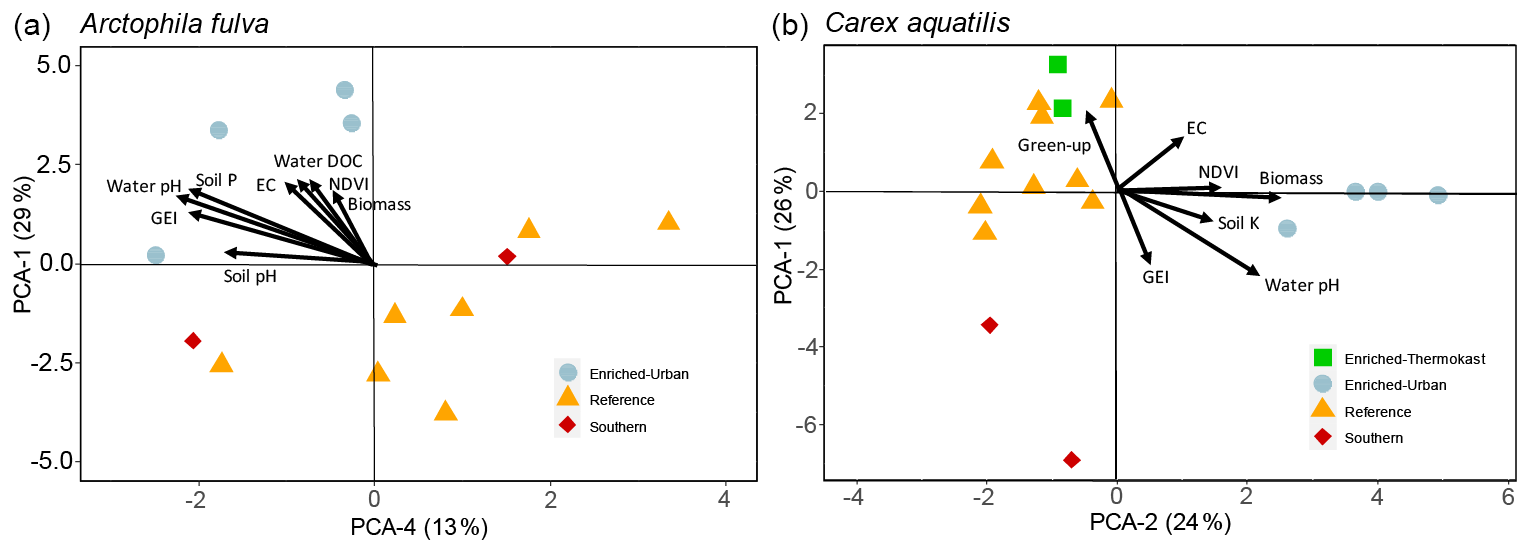
Figure 5Plots of PCA site scores for Arctophila fulva (a) and Carex aquatilis (b) plant nutrient data. Eigenvectors depict PCA axis correlations with environmental variables. Eigenvectors are scaled for clarity.
Table 2Correlation coefficients between PC axes and leaf nutrients for Carex aquatilis (right) and Arctophila fulva (left).

We explored the effects of plant nutrient enrichment in the dominant aquatic tundra species of the Arctic Coastal Plain: A. fulva and C. aquatilis. Our study is unique as it focuses on aquatic emergent plants and is based on natural responses to non-experimental, long-term nutrient enrichment compared to previous studies of fertilization treatment experiments. Plant leaf nutrients were a function of soil and water nutrients in Arctic tundra ponds. Phosphorus was the main driver of biomass in aquatic plants and plant greenness measured by NDVI in both plant species.
4.1 Leaf nutrients
The environmental gradient investigated in this study was highlighted by the principal component analysis and allowed better understanding of the factors influencing leaf nutrients. Our analysis shows how soil and water nutrients in ponds influence plant leaf nutrients and aboveground biomass of aquatic tundra graminoids. The Arctic is typically nutrient limited in inorganic forms of N and P in both soil (Beermann et al., 2015; Keuper et al., 2012; Mack et al., 2004) and surface waters (Rautio et al., 2011). Similar to aquatic growth forms, moist and wet tundra C. aquatilis and A. fulva appear to be P limited (Beermann et al., 2015; Boelman et al., 2003; Chapin et al., 1995; Mack et al., 2004) given the highly organic soil which enhances recycling of N by mineralization of soil organic matter (Beermann et al., 2015; Chapin et al., 1975). On the aquatic side, primary productivity of phytoplankton and periphyton in tundra ponds in the Utqiaġvik area (including some of our study sites) have been shown to be largely NP co-limited (Lougheed et al., 2015). In fact, Lougheed et al. (2015) suggested that macrophytes may be outcompeting algae for available nitrogen, which may account for the N limitation of algae but N sufficiency of plants. Soil nutrients were similar among cover types which may explain the homogeneous leaf macronutrient concentrations among C. aquatilis and A. fulva. However, we observed higher micronutrients and other non-essential minerals in C. aquatilis compared to A. fulva. These disparities are likely attributed to differences in taxonomic groups and thus taxa-specific nutrient content (Chapin et al., 1975).
We designed the sample collection to give an overall representation of plant–soil relationships for detection using remote sensing. The plant leaf samples and soil samples were not taken within the exact location, but rather plants were collected in different areas of the monotypic stands, trying to have a diverse representation of the species within each pond. Similarly, soils were collected in three different locations within the same area and mixed together for processing. However, given the high heterogeneity in soil properties on polygonal tundra due to cryoturbation, the relationships between soil and leaf nutrients are likely weakened and may explain the low strength of the relationships of Fig. 3.
Compared to historical studies in the Utqiaġvik area, we found that the major plant macronutrients in C. aquatilis had increased since they were determined in 1970 by Chapin et al. (1975). N, P and Ca plant percentage content increased from 2.18 ± 0.09 to 2.4 ± 0.2 (10 % increase), 0.15 ± 0.02 to 0.18 ± 0.03 (20 %) and 0.08 ± 0.02 to 0.14 ± 0.08 (75 %) respectively, for samples collected in early August. However, K and Mg were lower compared to 1970. Increases in leaf nutrients are concomitant with long-term observations of nutrient increases in tundra ponds of nitrate, ammonia and soluble reactive phosphorus (Lougheed et al., 2011). Increased plant nutrients may be a result of nutrient release from long-term increases of active layer depth (Andresen and Lougheed, 2015), thawing permafrost (Keuper et al., 2012; Reyes and Lougheed, 2015) and nitrogen mineralization (Uhlířová et al., 2007; Weintraub and Schimel, 2003) leached from terrestrial inputs. The remarkable increase in Ca observed by Chapin et al. (1975) between 1970 and 2013 is likely associated with accumulation from high transpiration (Chapin, 1980) and suggests enhanced C. aquatilis evapotranspiration rates compared to 50 years ago as a result of modern warmer temperatures in both air and water (Andresen and Lougheed, 2015; Lougheed et al., 2011). It is important to note that C. aquatilis has been shown to have phenotypical differences across moisture gradients (Shaver et al., 1979). Thus, C. aquatilis sampled in wet meadows (Chapin et al., 1975) might have different physiological characteristics and therefore different nutrient tissue composition compared to C. aquatilis in aquatic habitats.
This study focused on peak season to reflect peak biomass (Andresen et al., 2017) and greenness (Andresen et al., 2018) of aquatic graminoid tundra with different environmental nutrient status. In addition, peak season is the preferred timing for assessing long-term Arctic greenness trends from satellite platforms (Bhatt et al., 2010; Walker et al., 2012a). Nutrients are known to affect seasonal phenology of aquatic graminoids by promoting earlier green-up date as well as higher season greenness (Andresen et al., 2018). However, the relationship between environmental nutrient status and seasonal plant nutrient dynamics is unclear in tundra graminoids and should be further investigated.

There are other important seasonal considerations that are worth noting. Concentrations of leaf nutrients have been shown to vary through the growing season in tundra vegetation communities. In graminoids, N and P peak within 10 d of snowmelt and gradually decrease to half of their concentration over the course of the growing season (Chapin et al., 1975). On the other hand, water and soil nutrients may increase over the season in ponds as the active layer thaws and soil biogeochemical processes activate (e.g., N mineralization), resulting in increased nutrient leaching from terrestrial to aquatic systems. Evaporation and evapotranspiration likely help increase nutrient concentrations in small ponds. As climate change continues to stretch the growing season, we need to further understand seasonal dynamics of plant nutrients and its implications on productivity and land–atmosphere carbon exchange.
4.2 Nutrients, biomass, NDVI and GEI
NDVI of Arctic graminoid tundra has been noted to be a function of biomass caused by increased nutrients (Andresen et al., 2018; Boelman et al., 2003, 2005; Epstein et al., 2012; Raynolds et al., 2012). For example, Boelman et al. (2003) observed higher NDVI values in N- and P-fertilized experimental treatments in wet sedge tundra communities compared to control treatments. Also, Andresen et al. (2018) noted higher NDVI and GEI greenness values concomitant with higher biomass in enriched sites. Our study supports previous studies on the importance of spectral measurements to be a function of environmental nutrient availability through the enhancement of tundra biomass and leaf greenness at the plot level (Andresen et al., 2018; Boelman et al., 2005). In particular, this study highlights phosphorus as the main nutrient augmenting aboveground biomass and plant greenness in aquatic tundra. Aquatic tundra graminoids studied here showed higher biomass in nutrient-rich sites, which translated to higher plot-level greenness (e.g., NDVI, GEI). We suspect that the combination of nutrient-induced factors such as (i) increased plant density through increased foliage and leaf area as well as (ii) plant vitality from chlorophyll production and other pigment-enhanced NDVI and GEI spectral signatures. It is important to consider that plot-scale spectral measurements such as NDVI and GEI may differ from coarser remote sensing platforms given the spectral heterogeneity of the radiance signal measured by the satellite sensor pixel (Guay et al., 2014), and caution should be given to interpretations of NDVI with coarse imagery.
Increases in terrestrial productivity of the Arctic as inferred from coarse satellite NDVI measurements have been directly attributed to increasing temperatures associated with sea ice decline (Bhatt et al., 2010; Epstein et al., 2012). However, satellite-based observations of tundra change are complex (Myers-Smith et al., 2020), with differing trends of greening and browning observed in recent decades (Pastick et al., 2019; Phoenix and Bjerke, 2016; Verbyla, 2008). At the plot level, biological factors influencing spectral greenness signals include community composition (Forbes et al., 2010), leaf area and phenology (Andresen et al., 2018; Post et al., 2018). These factors are greatly influenced by nutrient environmental availability as shown in this study and others (Andresen et al., 2018; Boelman et al., 2003). As permafrost degradation and abrupt thaw events continue to increase in frequency (Andresen et al., 2020; Reyes and Lougheed, 2015; Turetsky et al., 2020), it is imperative that we continue understanding plot-level spectral signals and how they influence landscape-level satellite observations.
The wide range of environmental nutrient status and the broad spatial sampling undertaken in this study provide a strong confidence on the use of spectral indices such as NDVI to monitor environmental nutrient status at a regional scale. In particular, the strong relationships between NDVI and phosphorous suggest that aquatic plant communities can be used as hot-spot and/or hot-moment indicators of nutrient availability and biochemical landscape-scale processes. Hot spots (disproportionately high reaction rates relative to the surrounding landscape) and hot moments (short periods of disproportionately high reaction rates relative to longer time periods) are generally associated with rates and reactions of biochemical processes (e.g., nutrient cycling, productivity) and often enhanced at the terrestrial–aquatic interface where hydrological flow paths mobilize substrates containing complementary reactants (e.g., nutrients) (McClain et al., 2003). Aquatic plant communities are situated at the terrestrial–aquatic interface inside catch points of small landscape drainages (e.g., ponds, low-center polygons, ice wedge pits) where biogeochemical changes such as mobilization processes from permafrost degradation (hot moment) and nutrient mineralization (hot moment) can be detected and mapped (hot spot) with spatial detail over large areas.
This study highlights the influence and sensitivity of aquatic graminoid tundra community to environmental nutrient status. In particular, we addressed that (i) aquatic graminoids were responding to higher soil and water nutrient availability through increased biomass and greenness and (ii) phosphorus was the principal limiting nutrient driving aquatic graminoid plant biomass as well as (iii) positively enhancing plot-level NDVI spectral signatures. With projected increased warming and associated terrestrial biogeochemical processes such as increased active layer depth and permafrost thaw, increased nutrient availability and mineralization and enhanced ecosystem carbon dynamics, aquatic plants will continue to be a hot spot/hot moment of change in structure and function as they sustain encroachment of aquatic habitats that are increasing in nutrients with potential carbon and surface energy feedbacks to climate. Characterizing mechanisms for detection and quantification of biogeochemical responses to climate change employing remote sensing will continue to be pivotal in understanding spatial and temporal evolution of the Arctic terrestrial and aquatic systems and their interactions.
Table A1Study sites and plant types. Plants species included C. aquatilis (C) and A. fulva (A).
Data used in this research can be found at https://arcticdata.io/ (Andresen, 2021).
CGA and VLL collected and processed the data and wrote the manuscript.
The authors declare that they have no conflict of interest.
We thank Frankie Reyes, Christina Hernandez and Nicole Miller for their help in the field. We thank UMIAQ, the Barrow Arctic Science Consortium (BASC) and the Ukpeaġvik Inupiaq Corporation (UIC) for logistical support and land access.
This research has been supported by the National Science Foundation (grant nos. ARC-0909502 and NSF-1110312).
This paper was edited by Michael Weintraub and reviewed by one anonymous referee.
American Public Health Association: Standard methods for the examination of water and wastewater, 20th Edn., edited by: Rice, E. W., Baird, R. B., and Eaton, A. D., American Public Health Association, Washington, DC, 1998.
Andresen, C.: Arctic aquatic graminoid tundra: soil, water, leaf, root chemistry and spectral data, Arctic Data Center [Dataset], available at: https://arcticdata.io/, last access: 20 April 2021.
Andresen, C. G.: Monitoring and understanding decadal scale changes in hydrology, productivity and carbon balance in Arctic tundra ponds, University of Texas at El Paso, El Paso, Texas, USA, 2014.
Andresen, C. G. and Lougheed, V. L.: Disappearing arctic tundra ponds: Fine-scale analysis of surface hydrology in drained thaw lake basins over a 65 year period (1948–2013), J. Geophys. Res., 120, 1–14, https://doi.org/10.1002/2014JG002778, 2015.
Andresen, C. G., Lara, M. J., Tweedie, C. T., and Lougheed, V. L.: Rising plant-mediated methane emissions from arctic wetlands, Glob. Change Biol., 23, 1128–1139, https://doi.org/10.1111/gcb.13469, 2017.
Andresen, C. G., Tweedie, C. E., and Lougheed, V. L.: Climate and nutrient effects on arctic wetland plant phenology observed from phenocams, Remote Sens. Environ., 205, 46–55, https://doi.org/10.1016/j.rse.2017.11.013, 2018.
Andresen, C. G., Lawrence, D. M., Wilson, C. J., McGuire, A. D., Koven, C., Schaefer, K., Jafarov, E., Peng, S., Chen, X., Gouttevin, I., Burke, E., Chadburn, S., Ji, D., Chen, G., Hayes, D., and Zhang, W.: Soil moisture and hydrology projections of the permafrost region – a model intercomparison, The Cryosphere, 14, 445–459, https://doi.org/10.5194/tc-14-445-2020, 2020.
Beermann, F., Teltewskoi, A., Fiencke, C., Pfeiffer, E. M., and Kutzbach, L.: Stoichiometric analysis of nutrient availability (N, P, K) within soils of polygonal tundra, Biogeochemistry, 122, 211–227, https://doi.org/10.1007/s10533-014-0037-4, 2015.
Bhatt, U. S., Walker, D. A., Raynolds, M. K., Comiso, J. C., Epstein, H. E., Jia, G., Gens, R., Pinzon, J. E., Tucker, C. J., Tweedie, C. E., and Webber, P. J.: Circumpolar arctic tundra vegetation change is linked to sea ice decline, Earth Interact., 14, 1–20, https://doi.org/10.1175/2010EI315.1, 2010.
Boelman, N. T., Stieglitz, M., Rueth, H. M., Sommerkorn, M., Griffin, K. L., Shaver, G. R., and Gamon, J. a: Response of NDVI, biomass, and ecosystem gas exchange to long-term warming and fertilization in wet sedge tundra, Oecologia, 135, 414–21, https://doi.org/10.1007/s00442-003-1198-3, 2003.
Boelman, N. T., Stieglitz, M., Griffin, K. L., and Shaver, G. R.: Inter-annual variability of NDVI in response to long-term warming and fertilization in wet sedge and tussock tundra, Oecologia, 143, 588–97, https://doi.org/10.1007/s00442-005-0012-9, 2005.
Chapin, F. I.: The mineral nutrition of wild plants, Annu. Rev. Ecol. Syst., 11, 233–260, 1980.
Chapin, F. I., Van Cleve, K., and Tieszen, L.: Seasonal nutrient dynamics of tundra vegetation at Barrow, Alaska, Arct. Alp. Res., 7, 209–226, 1975.
Chapin, F. S. I., Shaver, G., and Giblin, A.: Responses of arctic tundra to experimental and observed changes in climate, Ecology, 76, 694–711, 1995.
Epstein, H. E., Raynolds, M. K., Walker, D. A., Bhatt, U. S., Tucker, C. J., and Pinzon, J. E.: Dynamics of aboveground phytomass of the circumpolar Arctic tundra during the past three decades, Environ. Res. Lett., 7, 015506, https://doi.org/10.1088/1748-9326/7/1/015506, 2012.
Forbes, B. C., Macias-Fauria, M., and Zettenberg, P.: Arctic warming and “greening” are closely tracked by tundra shrub willows, Glob. Change Biol., 16, 1542–1554, 2010.
Fouché, J., Christiansen, C. T., Lafrenière, M. J., Grogan, P., and Lamoureux, S. F.: Canadian permafrost stores large pools of ammonium and optically distinct dissolved organic matter, Nat. Commun., 11, 1–11, https://doi.org/10.1038/s41467-020-18331-w, 2020.
Frampton, A., Painter, S. L., and Destouni, G.: Permafrost degradation and subsurface-flow changes caused by surface warming trends, Hydrogeol. J., 21, 271–280, https://doi.org/10.1007/s10040-012-0938-z, 2013.
Frey, K. E. and McClelland, J. W.: Impacts of permafrost degradation on arctic river biogeochemistry, Hydrol. Process., 23, 169–182, 2009.
Gamon, J. a., Huemmrich, K. F., Stone, R. S., and Tweedie, C. E.: Spatial and temporal variation in primary productivity (NDVI) of coastal Alaskan tundra: Decreased vegetation growth following earlier snowmelt, Remote Sens. Environ., 129, 144–153, https://doi.org/10.1016/j.rse.2012.10.030, 2013.
Guay, K. C., Beck, P. S. A., Berner, L. T., Goetz, S. J., Baccini, A., and Buermann, W.: Vegetation productivity patterns at high northern latitudes: a multi-sensor satellite data assessment, Glob. Change Biol., 20, 3147–3158, https://doi.org/10.1111/gcb.12647, 2014.
Hinkel, K. M., Eisner, W. R., Bockheim, J. G., Nelson, F. E., Peterson, K. M., and Dai, X.: Spatial Extent, Age, and Carbon Stocks in Drained Thaw Lake Basins on the Barrow Peninsula, Alaska, Arctic, Antarct. Alp. Res., 35, 291–300, https://doi.org/10.1657/1523-0430(2003)035[0291:SEAACS]2.0.CO;2, 2003.
Joabsson, A. and Christensen, T. R.: Methane emissions from wetlands and their relationship with vascular plants: an Arctic example, Glob. Change Biol., 7, 919–932, 2001.
Johnson, L. C., Shaver, G. R., Cades, D. H., Rastetter, E., Nadelhoffer, K., Giblin, A., Laundre, J., and Stanley, A.: Plant carbon-nutrient interactions control CO2 exchange in Alaskan wet sedge tundra ecosystems, Ecology, 81, 453–469, https://doi.org/10.1890/0012-9658(2000)081[0453:PCNICC]2.0.CO;2, 2000.
Jones, M. C., Grosse, G., Jones, B. M., and Walter Anthony, K.: Peat accumulation in drained thermokarst lake basins in continuous, ice-rich permafrost, northern Seward Peninsula, Alaska, J. Geophys. Res.-Biogeo., 117, 1–16, https://doi.org/10.1029/2011JG001766, 2012.
Jónsdóttir, I. S., Khitun, O., and Stenström, A.: Biomass and nutrient responses of a clonal tundra sedge to climate warming, Can. J. Bot., 83, 1608–1621, https://doi.org/10.1139/b05-129, 2005.
Jorgenson, M. T. and Shur, Y.: Evolution of lakes and basins in northern Alaska and discussion of the thaw lake cycle, J. Geophys. Res., 112, F02S17, https://doi.org/10.1029/2006JF000531, 2007.
Keuper, F., van Bodegom, P. M., Dorrepaal, E., Weedon, J. T., van Hal, J., van Logtestijn, R. S. P., and Aerts, R.: A frozen feast: thawing permafrost increases plant-available nitrogen in subarctic peatlands, Glob. Change Biol., 18, 1998–2007, https://doi.org/10.1111/j.1365-2486.2012.02663.x, 2012.
Lara, M. J., McGuire, A. D., Euskirchen, E. S., Tweedie, C. E., Hinkel, K. M., Skurikhin, A. N., Romanovsky, V. E., Grosse, G., Bolton, W. R., and Genet, H.: Polygonal tundra geomorphological change in response to warming alters future CO2 and CH4 flux on the Barrow Peninsula, Glob. Change Biol., 21, 1663–1651, https://doi.org/10.1111/gcb.12757, 2015.
Lara, M. J., Lin, D. H., Andresen, C., Lougheed, V. L., and Tweedie, C. E.: Nutrient Release From Permafrost Thaw Enhances CH4 Emissions From Arctic Tundra Wetlands, J. Geophys. Res.-Biogeo., 124, 1560–1573, https://doi.org/10.1029/2018JG004641, 2019.
Loiko, S., Klimova, N., Kuzmina, D., and Pokrovsky, O.: Lake Drainage in Permafrost Regions Produces Variable Plant Communities of High Biomass and Productivity, Plants, 9, 1–41, 2020.
López-Blanco, E., Jackowicz-Korczynski, M., Mastepanov, M., Skov, K., Westergaard-Nielsen, A., Williams, M., and Christensen, T. R.: Multi-year data-model evaluation reveals the importance of nutrient availability over climate in arctic ecosystem C dynamics, Environ. Res. Lett., 15, 094007, https://doi.org/10.1088/1748-9326/ab865b, 2020.
Lougheed, V. L., Butler, M. G., McEwen, D. C., and Hobbie, J. E.: Changes in Tundra Pond Limnology: Re-sampling Alaskan Ponds After 40 Years, Ambio, 40, 589–599, https://doi.org/10.1007/s13280-011-0165-1, 2011.
Lougheed, V. L., Hernandez, C., Andresen, C. G., Miller, N. A., Alexander, V., and Prentki, R.: Contrasting responses of phytoplankton and benthic algae to recent nutrient enrichment in Arctic tundra ponds, Freshw. Biol., 60, 2169–2186, https://doi.org/10.1111/fwb.12644, 2015.
Mack, M. C., Schuur, E. a G., Bret-Harte, M. S., Shaver, G. R., and Chapin, F. S.: Ecosystem carbon storage in arctic tundra reduced by long-term nutrient fertilization, Nature, 431, 440–443, https://doi.org/10.1038/nature02887, 2004.
McClain, M. E., Boyer, E. W., Dent, C. L., Gergel, S. E., Grimm, N. B., Groffman, P. M., Hart, S. C., Harvey, J. W., Johnston, C. A., Mayorga, E., McDowell, W. H., and Pinay, G.: Biogeochemical Hot Spots and Hot Moments at the Interface of Terrestrial and Aquatic Ecosystems, Ecosystems, 6, 301–312, https://doi.org/10.1007/s10021-003-0161-9, 2003.
McGuire, A. D., Lawrence, D. M., Koven, C., Clein, J. S., Burke, E., Chen, G., Jafarov, E., MacDougall, A. H., Marchenko, S., Nicolsky, D., Peng, S., Rinke, A., Ciais, P., Gouttevin, I., Hayes, D. J., Ji, D., Krinner, G., Moore, J. C., Romanovsky, V., Schädel, C., Schaefer, K., Schuur, E. A. G., and Zhuang, Q.: The Dependence of the Evolution of Carbon Dynamics in the Northern Permafrost Region on the Trajectory of Climate Change, P. Natl. Acad. Sci. USA, 1719903115, https://doi.org/10.1073/pnas.1719903115, 2018.
McLaren, J. R. and Buckeridge, K. M.: Decoupled above- and belowground responses to multi-decadal nitrogen and phosphorus amendments in two tundra ecosystems, Ecosphere, 10, https://doi.org/10.1002/ecs2.2735, 2019.
Myers-Smith, I. H., Kerby, J. T., Phoenix, G. K., Bjerke, J. W., Epstein, H. E., Assmann, J. J., John, C., Andreu-Hayles, L., Angers-Blondin, S., Beck, P. S. A., Berner, L. T., Bhatt, U. S., Bjorkman, A. D., Blok, D., Bryn, A., Christiansen, C. T., Cornelissen, J. H. C., Cunliffe, A. M., Elmendorf, S. C., Forbes, B. C., Goetz, S. J., Hollister, R. D., de Jong, R., Loranty, M. M., Macias-Fauria, M., Maseyk, K., Normand, S., Olofsson, J., Parker, T. C., Parmentier, F. J. W., Post, E., Schaepman-Strub, G., Stordal, F., Sullivan, P. F., Thomas, H. J. D., Tømmervik, H., Treharne, R., Tweedie, C. E., Walker, D. A., Wilmking, M., and Wipf, S.: Complexity revealed in the greening of the Arctic, Nat. Clim. Change, 10, 106–117, https://doi.org/10.1038/s41558-019-0688-1, 2020.
Natali, S. M., Schuur, E. A. G., and Rubin, R. L.: Increased plant productivity in Alaskan tundra as a result of experimental warming of soil and permafrost, J. Ecol., 100, 488–498, https://doi.org/10.1111/j.1365-2745.2011.01925.x, 2012.
Nitze, I., Cooley, S. W., Duguay, C. R., Jones, B. M., and Grosse, G.: The catastrophic thermokarst lake drainage events of 2018 in northwestern Alaska: fast-forward into the future, The Cryosphere, 14, 4279–4297, https://doi.org/10.5194/tc-14-4279-2020, 2020.
Oberbauer, S., Tweedie, C., Welker, J. M., Fahnestock, J. T., Henry, G. H. R., Webber, P. J., Hollister, R. D., Walker, D. A., Kuchy, A., Elmore, E., and Starr, G.: Tundra CO2 fluxes in response to experimental warming across latitudinal and moisture gradients, Ecological monographs, 77, 221–238, 2007.
Pastick, N. J., Jorgenson, M. T., Goetz, S. J., Jones, B. M., Wylie, B. K., Minsley, B. J., Genet, H., Knight, J. F., Swanson, D. K., and Jorgenson, J. C.: Spatiotemporal remote sensing of ecosystem change and causation across Alaska, Glob. Change Biol., 25, 1171–1189, https://doi.org/10.1111/gcb.14279, 2019.
Phoenix, G. K. and Bjerke, J. W.: Arctic browning: extreme events and trends reversing arctic greening, Glob. Change Biol., 22, 2960–2962, https://doi.org/10.1111/gcb.13261, 2016.
Post, E., Steinman, B. A., and Mann, M. E.: Acceleration of phenological advance and warming with latitude over the past century, Sci. Rep., 8, 3927, https://doi.org/10.1038/s41598-018-22258-0, 2018.
Rautio, M., Dufresne, F., Laurion, I., Bonilla, S., Vincent, W. F., and Christoffersen, K. S.: Shallow Freshwater Ecosystems of the Circumpolar Arctic, Ecoscience, 18, 204–222, https://doi.org/10.2980/18-3-3463, 2011.
Raynolds, M. K., Walker, D. A., Epstein, H. E., Pinzon, J. E., and Tucker, C. J.: A new estimate of tundra-biome phytomass from trans-Arctic field data and AVHRR NDVI, Remote Sens. Lett., 3, 403–411, https://doi.org/10.1080/01431161.2011.609188, 2012.
Reyes, F. R. and Lougheed, V. L.: Rapid nutrient release from permafrost in Arctic aquatic ecosystems, Arctic, Antarct. Alp. Res., 47, 35–48, 2015.
Richardson, A. D., Braswell, B. H., Hollinger, D. Y., Jenkins, J. P., and Ollinger, S. V: Near-surface remote sensing of spatial and temporal variation in canopy phenology, Ecol. Appl., 19, 1417–28, 2009.
Saitoh, T. M., Nagai, S., Saigusa, N., Kobayashi, H., Suzuki, R., Nasahara, K. N., and Muraoka, H.: Assessing the use of camera-based indices for characterizing canopy phenology in relation to gross primary production in a deciduous broad-leaved and an evergreen coniferous forest in Japan, Ecol. Inform., 11, 45–54, https://doi.org/10.1016/j.ecoinf.2012.05.001, 2012.
Shaver, G., Chapin, F. I., and Billings, W.: Ecotypic differentiation in Carex aquatilis on ice-wedge polygons in the Alaskan coastal tundra, J. Ecol., 67, 1025–1045, 1979.
Shaver, G. R., Johnson, L. C., Cades, D. H., Murray, G., Laundre, J. a., Rastetter, E. B., Nadelhoffer, K. J., and Giblin, a. E.: Biomass and Flux in Wet Sedge Tundras: Responses To Nutrients, Temperature, and Light, Ecol. Monogr., 68, 75–97, 1998.
Shiklomanov, N. I., Streletskiy, D. A., Little, J. D., and Nelson, F. E.: Isotropic thaw subsidence in undisturbed permafrost landscapes, Geophys. Res. Lett., 40, 6356–6361, https://doi.org/10.1002/2013GL058295, 2013.
Sonnentag, O., Hufkens, K., Teshera-Sterne, C., Young, A. M., Friedl, M., Braswell, B. H., Milliman, T., O'Keefe, J., and Richardson, A. D.: Digital repeat photography for phenological research in forest ecosystems, Agr. Forest Meteorol., 152, 159–177, https://doi.org/10.1016/j.agrformet.2011.09.009, 2012.
Soudani, K., Hmimina, G., Delpierre, N., Pontailler, J.-Y., Aubinet, M., Bonal, D., Caquet, B., de Grandcourt, a., Burban, B., Flechard, C., Guyon, D., Granier, A., Gross, P., Heinesh, B., Longdoz, B., Loustau, D., Moureaux, C., Ourcival, J.-M., Rambal, S., Saint André, L., and Dufrêne, E.: Ground-based Network of NDVI measurements for tracking temporal dynamics of canopy structure and vegetation phenology in different biomes, Remote Sens. Environ., 123, 234–245, https://doi.org/10.1016/j.rse.2012.03.012, 2012.
Turetsky, M. R., Abbott, B. W., Jones, M. C., Anthony, K. W., Olefeldt, D., Schuur, E. A. G., Grosse, G., Kuhry, P., Hugelius, G., Koven, C., Lawrence, D. M., Gibson, C., Sannel, A. B. K., and McGuire, A. D.: Carbon release through abrupt permafrost thaw, Nat. Geosci., 13, 138–143, https://doi.org/10.1038/s41561-019-0526-0, 2020.
Uhlířová, E., Šantrůčková, H., and Davidov, S. P.: Quality and potential biodegradability of soil organic matter preserved in permafrost of Siberian tussock tundra, Soil Biol. Biochem., 39, 1978–1989, https://doi.org/10.1016/j.soilbio.2007.02.018, 2007.
Verbyla, D.: The greening and browning of Alaska based on 1982–2003 satellite data, Glob. Ecol. Biogeogr., 17, 547–555, https://doi.org/10.1111/j.1466-8238.2008.00396.x, 2008.
Villarreal, S., Hollister, R. D., Johnson, D. R., Lara, M. J., Webber, P. J., and Tweedie, C. E.: Tundra vegetation change near Barrow, Alaska (1972–2010), Environ. Res. Lett., 7, 015508, https://doi.org/10.1088/1748-9326/7/1/015508, 2012.
Walker, D., Bhatt, U., and Epstein, H.: Changing Arctic tundra vegetation biomass and Greenness, Bull. Am. Meteorol. Soc, 93, 138–139, 2012a.
Walker, D. A., Epstein, H. E., Raynolds, M. K., Kuss, P., Kopecky, M. A., Frost, G. V, Daniëls, F. J. A., Leibman, M. O., Moskalenko, N. G., Matyshak, G. V, Khitun, O. V, Khomutov, a V, Forbes, B. C., Bhatt, U. S., Kade, A. N., Vonlanthen, C. M., and Tichý, L.: Environment, vegetation and greenness (NDVI) along the North America and Eurasia Arctic transects, Environ. Res. Lett., 7, 015504, https://doi.org/10.1088/1748-9326/7/1/015504, 2012b.
Weintraub, M. N. and Schimel, J. P.: Interactions between Carbon and Nitrogen Mineralization and Soil Organic Matter Chemistry in Arctic Tundra Soils, Ecosystems, 6, 129–143, https://doi.org/10.1007/s10021-002-0124-6, 2003.
Zeng, H. and Jia, G.: Impacts of snow cover on vegetation phenology in the arctic from satellite data, Adv. Atmos. Sci., 30, 1421–1432, https://doi.org/10.1007/s00376-012-2173-x, 2013.