the Creative Commons Attribution 4.0 License.
the Creative Commons Attribution 4.0 License.
 | 15 Jan 2021
A Lagrangian study of the contribution of the Canary coastal upwelling to the nitrogen budget of the open North Atlantic
Derara Hailegeorgis
Zouhair Lachkar
Christoph Rieper
Nicolas Gruber
The Canary Current System (CanCS) is a major eastern boundary upwelling system (EBUS), known for its high nearshore productivity and for sustaining a large fishery. It is also an important but not well quantified source of nitrogen to the adjacent oligotrophic subtropical gyre of the North Atlantic. Here, we use a Lagrangian modeling approach to quantify this offshore transport and investigate its timescales, reach and contribution to the fueling of productivity in the offshore regions. In our Lagrangian model, we release nearly 10 million particles off the northwestern African coast and then track all those that enter the nearshore region and upwell along the coast between 14 and 35∘ N. We then follow them as they are transported offshore, also tracking the biogeochemical transformations, permitting us to construct biogeochemical budgets along the offshore moving particles. The three-dimensional velocity field as well as the biogeochemical tracers and fluxes are taken from an eddy-resolving configuration of the Regional Ocean Modeling System (ROMS). Our Lagrangian model analysis reveals a very intense offshore transport of nitrogen, with about 20 %–40 % in the form of organic nitrogen. The transport varies greatly along the coast. Even though the central CanCS (21–28∘ N) transports the largest amount of water offshore, its offshore transport of nitrogen is somewhat smaller than that in the southern CanCS (14–21∘ N), primarily because of the higher nitrogen content of the upwelling waters there. Around one-third of the total offshore transport of water occurs around major capes along the CanCS. The persistent filaments associated with these capes are responsible for an up to 4-fold enhancement of the offshore transport of water and nitrogen in the first 400 km. Much of this water and nitrogen stems from upwelling at quite some distance from the capes, confirming the capes' role in collecting water from along the coast. North of Cape Blanc and within the first 500 km from the coast, water recirculation is a dominant feature of offshore transport. This process, likely associated with mesoscale eddies, tends to reduce the efficiency of offshore transport. The Canary upwelling is modeled to supply around 44 and 7 mmol N m−2 yr−1 to the North Atlantic Tropical Gyral (NATR) and the North Atlantic Subtropical Gyral East (NASE) Longhurst provinces, respectively. In the NATR, this represents nearly half (53 ± 26 %) of the estimated total new production, while in the NASE, this fraction is small (4 ± 2 %). Our results highlight the importance of the CanCS upwelling as a key source of nitrogen to the open North Atlantic and stress the need for improving the representation of EBUS in global coarse-resolution models.
- Article
(4780 KB) - Full-text XML
-
Supplement
(11389 KB) - BibTeX
- EndNote


Over the last 3 decades, several studies have highlighted the importance of the coastal ocean in the global carbon cycle (e.g., Walsh, 1991; Wollast, 1998). For instance, it has been estimated that continental margins contribute nearly half of the globally integrated oceanic primary production, although they only occupy about 10 % of the world ocean surface (Jahnke et al., 1990; Walsh, 1991; Smith and Hollibaugh, 1993; Muller‐Karger et al., 2005; Liu et al., 2010). The coastal ocean is not only highly productive but is also a major source of nutrients and organic matter to the open ocean (Liu et al., 2000, 2010; Lovecchio et al., 2017; Frischknecht et al., 2018). Eastern boundary upwelling systems (EBUSs), in particular, are known to be an important source region for the open ocean. Owing to their intense upwelling that brings nutrients from the thermocline into sunlit near-surface waters, these systems are among the most productive ecosystems in the world, sustaining 30 % of global fish catch (Pauly and Christensen, 1995; Carr, 2001; Hansell, 2002; Chavez and Messié, 2009). A high fraction of the upwelled nutrients and the organic matter formed from them tends to be laterally exported into the adjacent subtropical gyres. These gyres are particularly receptive, as they have low nutrient conditions (oligotrophic), and have been shown to be net heterotrophic based on observational data (Duarte and Agustí, 1998; Del Giorgio and Duarte, 2002). Yet, the question of whether and how far into the open ocean the additional input of organic and inorganic matter can increase in situ respiration and new production (NP) remains a subject of a long and unresolved debate (Smith and Hollibaugh, 1993; Duarte and Agustí, 1998; Liu et al., 2010; Lovecchio et al., 2017).
Located along the northwestern African coast, the Canary Current System (CanCS) constitutes the EBUS of the North Atlantic subtropical gyre (Barton et al., 1989; Pelegri et al., 2005a, 2006). The CanCS is composed of the Canary Current (CC) and the Canary Upwelling Current (CUC). The CC represents the eastern boundary current of the North Atlantic subtropical gyre. It flows parallel to the Moroccan coast and merges with the westward North Equatorial Current (NEC) around Cape Blanc (21∘ N) (Barton, 1987; Hernández‐Guerra et al., 2005). The CUC is a nearshore surface jet associated with the coastal upwelling front, which flows equatorward along the northwestern African coast (Pelegri et al., 2006). The Cabo Verde frontal zone, between Cape Blanc and the Cabo Verde archipelago, is dominated by a permanent cyclonic circulation with a poleward boundary current, the Mauritanian current (MC), which extends at depth beyond Cape Blanc as a slope undercurrent typical of eastern boundary upwelling systems (Barton et al., 1989; Arístegui et al., 2009). Upwelling is permanent along most of the Moroccan coast (21–35∘ N), albeit with weaker intensity and stronger seasonality north of 26∘ N (Cropper et al., 2014). South of Cape Blanc, upwelling is present essentially in late fall and winter (October–March). Upwelled waters have different nutrient contents depending on their respective sources. North of Cape Blanc, the relatively nutrient-impoverished North Atlantic Central Waters (NACW) feed most of the upwelling (Mason et al., 2012). In contrast, waters upwelling south of Cape Blanc have a higher nutrient content, as they are fed by the nutrient-richer South Atlantic Central Waters (SACW) brought by the MC (Schütte et al., 2016; Kounta et al., 2018; Glessmer et al., 2009; Peña‐Izquierdo et al., 2015). Intense mesoscale structures, including eddies and filaments develop in different parts of the CanCS and contribute to the offshore transport of the coastal waters (Lovecchio et al., 2018).
The quantification of their contribution to the lateral export is challenging due to their fast and complex spatiotemporal dynamics, whose appropriate in situ sampling goes beyond the ability of current observing systems. High-resolution coupled physical–biogeochemical models provide an avenue to overcome this challenge. Yet, the number of high-resolution model-based studies that addressed and quantified the coastal–open-ocean exchange in the CanCS remains limited (e.g., Fischer and Karakaş, 2009; Lachkar and Gruber, 2011; Pastor et al., 2013; Auger et al., 2016; Lovecchio et al., 2017, 2018). In one of the most detailed model-based studies conducted so far, Lovecchio et al. (2017) examined the export of organic carbon from the CanCS using a coupled physical–biogeochemical ocean model with a telescopic grid that covers the whole Atlantic Ocean while maintaining a high resolution along the coast of northwestern Africa. They demonstrated that about a third of the organic carbon produced along the northwestern African coast is transported offshore, with some of it well beyond 1500 km from the coast, contributing substantially to the net community production there. In a follow-up study, Lovecchio et al. (2018) showed that much of this transport is driven first by filaments (in the first 100 km from the coast) and then later taken over by westward-propagating mesoscale eddies. However, these authors focused on the transport of organic carbon only and so did not estimate the contribution of the Canary upwelling to the offshore export of nutrients into the open ocean and the implications this might have for the biogeochemistry of the North Atlantic Ocean. Furthermore, the Eulerian approach used by Lovecchio et al. (2017, 2018) does not allow for the identification of waters that upwell at the coast and the tracking of their trajectories after they enter the open ocean.
Here, we aim to close this gap and investigate the contribution of the upwelling waters to the nitrogen budget of the open North Atlantic, thereby considering the transport of both organic and inorganic forms of nitrogen. To this end, we use a Lagrangian approach to quantify the offshore reach, the spatial structure and the dominant timescales of the offshore transport of upwelled waters by tracking all open-ocean waters that upwell along the coastal region of the CanCS. Lagrangian approaches have a long and rich history in the study of dynamical systems, especially in the atmosphere (Lin et al., 2012) but also in the ocean (Van Sebille et al., 2018), as they present a number of advantages relative to the much more commonly used Eulerian approach, especially in the context of offshore transport. By taking the moving particle as a frame of reference, the Lagrangian tracking of water masses is much better suited to analyze the connectivity between the coastal and the open-ocean regions. Furthermore, the Lagrangian method can be used to derive conditional statistics where subsets of particles that fulfill certain criteria are analyzed. This is useful for instance here to restrict the analysis of offshore transport to upwelling particles only. By not only tracking waters through the appropriate seeding of Lagrangian particles but also tabulating the biogeochemical transformations along the pathways, we can also establish Lagrangian budgets. This permits us to develop a holistic perspective of the pathways taken by nutrients and carbon along their journey from the ocean’s interior through upwelling and then their offshore transport to their ultimate fate of being exported to depth again (Frischknecht et al., 2018). Such an analysis of the origin, transformation and fate is impossible to undertake when using an Eulerian point of view. However, a Lagrangian approach also comes with a number of disadvantages. Perhaps the most important one is the difficulty to fully take into account subgrid mixing that is associated with the model treatment of unresolved physics.
Previous studies have used the Lagrangian approach to study different aspects of the CanCS. For instance, Brochier et al. (2011) conducted a ROMS-based Lagrangian experiment to study the transport of ichthyoplankton (fish eggs and larvae) due to filaments between the western African coast and the Canary Islands. Mason et al. (2012) used a Lagrangian approach to characterize the source waters of upwelling in the CanCS between 31 and 35∘ N. Yet, these studies were limited to specific regions of the CanCS and did only partially sample coastal upwelling there. Here we substantially expand on these previous efforts by sampling and tracking all open-ocean waters that upwell along the western African coast between 14 and 35∘ N and quantifying the offshore export of water, nutrients and organic matter. We also investigate the kinetics and the structure of this offshore transport and explore the role of water recirculation and capes in enhancing both coastal upwelling and offshore export. Finally, we examine the contribution of the CanCS upwelling to the nitrogen budget of the open North Atlantic.
2.1 Models and configuration
We use a CanCS configuration of the Regional Ocean Modeling System (ROMS)-AGRIF (http://www.croco-ocean.org/, last access: 1 January 2018) similar to that used by Lachkar et al. (2016). ROMS solves the primitive equations and has free-surface and terrain-following vertical coordinates (Shchepetkin and McWilliams, 2005). We use a rotated-split third-order upstream biased operator for the advection of momentum and material properties (Marchesiello et al., 2009). The non-local K-profile parameterization (KPP) scheme is used to represent the subgrid vertical mixing (Large et al., 1994). The biogeochemical model is a nutrient–phytoplankton–zooplankton–detritus (NPZD) model based on nitrogen (Gruber et al., 2006). It uses a system of ordinary differential equations representing the time evolution of the following state variables: nitrate (NO), ammonium (NH), phytoplankton, zooplankton, two pools of detritus and a dynamic chlorophyll-to-carbon ratio. The two classes of detritus represent, respectively, fast-sinking large organic matter particles and slow-sinking small particles. The small particles can coagulate with phytoplankton to form large detritus. In the water column, small and large detritus are remineralized to ammonium at rates of 0.03 and 0.01 d−1, respectively. Sinking particulate organic matter that reaches the seafloor is also remineralized to ammonium at a rate of 0.003 d−1 (Gruber et al., 2006).
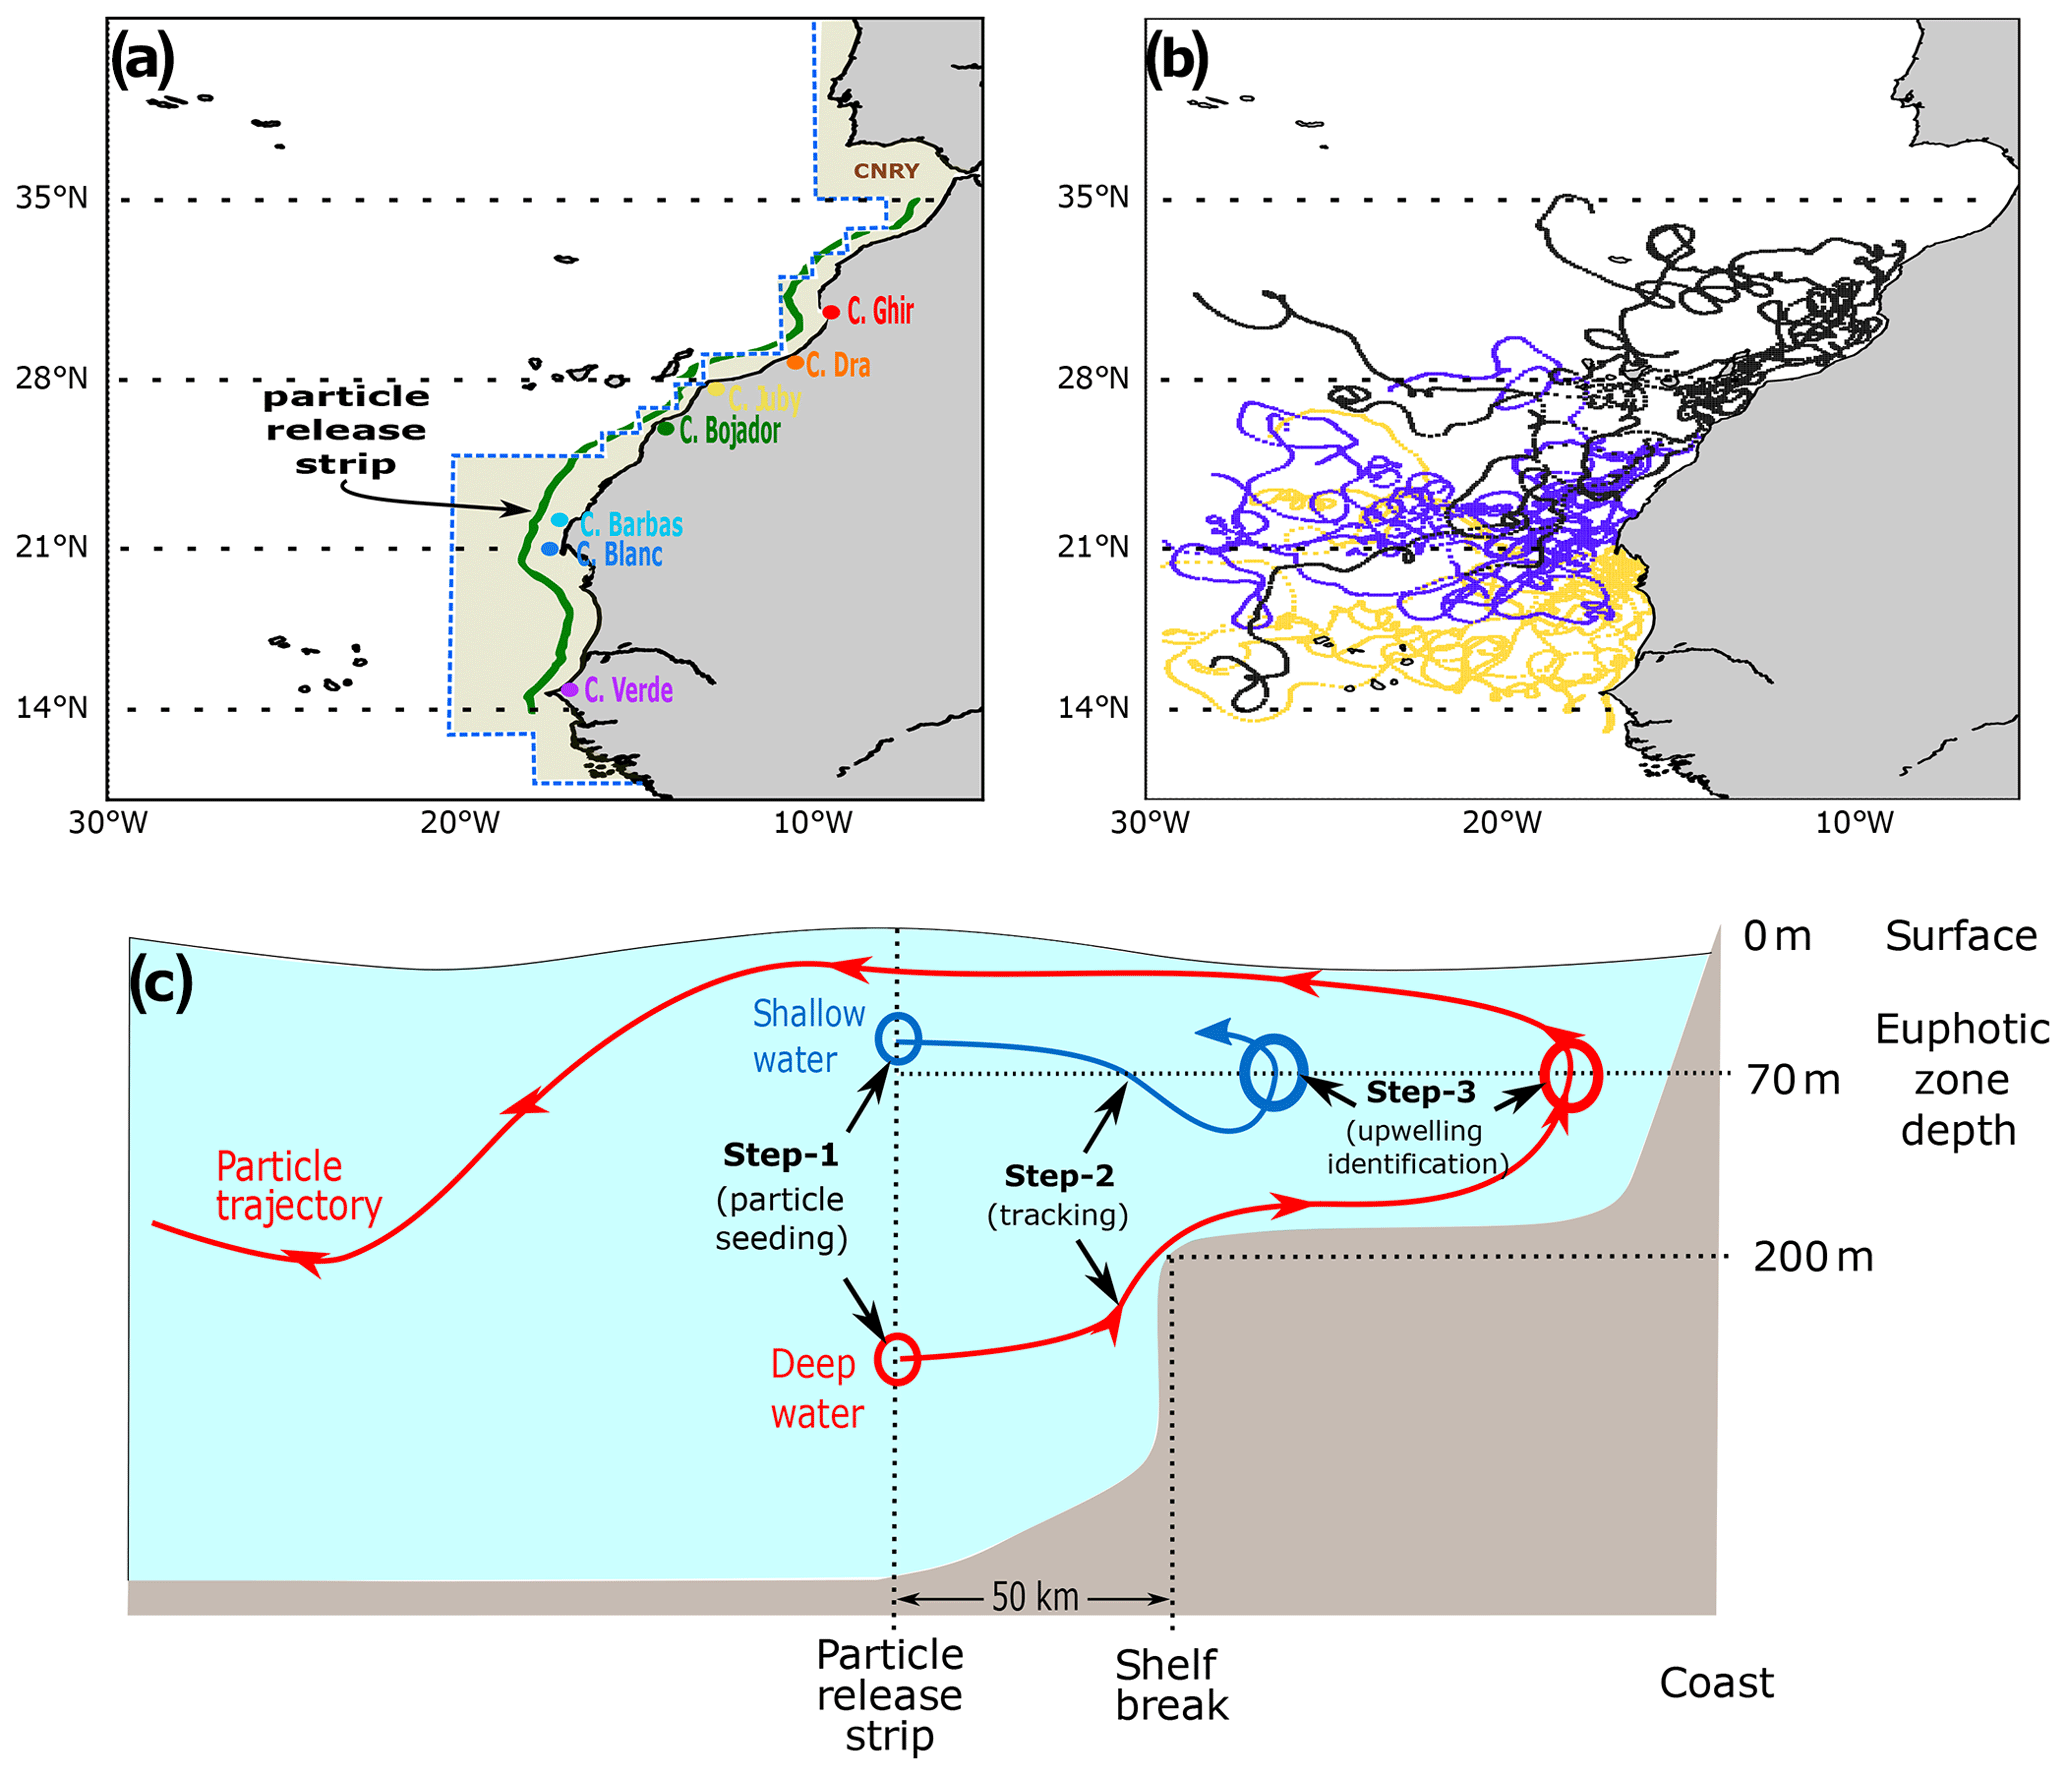
Figure 1(a) The model domain stretches from 30 to 6∘ W and from 10 to 41∘ N. The solid green line indicates the limit of the coastal strip where particles are released at each vertical layer proportionally with the onshore water volume transport. The black dotted lines partition the domain into the three latitudinal subregions: the southern CanCS (14–21∘ N), the central CanCS (21–28∘ N) and the northern CanCS (28–35∘ N). The yellow-shaded area corresponds to the portion of the Longhurst Canary Coastal Province (CNRY) that lies within the model domain. The location of the seven capes studied in Sect. 5.1 is shown here in different colors. (b) A plot of sample trajectories of 10 randomly selected particles in our Lagrangian experiment from each of the southern (golden), central (blue) and northern (black) subregions. (c) A schematic of the Lagrangian sampling of upwelling particles. In step 1, particles are released when open-ocean water enters the coastal strip. Based on their depth when released, we term particles to be of a shallow (<70 m) or deep (>70 m) source. In step 2, the trajectories of the particles are tracked for up to 2 years. In step 3, upwelling particles are identified as those that cross the 70 m depth while at the coast.
The model domain covers the region from 10 to 42∘ N in latitude and from 30 to 6∘ W in longitude with a grid resolution of 1∕20∘. This corresponds to a mesh size of about 5 km, which is sufficient for fully resolving mesoscale processes. The vertical grid consists of 32 layers with enhanced resolution near the surface. The bathymetry is derived from the ETOPO2 file provided by the National Geophysical Data Center (Smith and Sandwell, 1997), and a minimum bathymetry of 50 m is set. We use a monthly climatological forcing based on the Comprehensive Ocean–Atmosphere Data Set (COADS) (da Silva et al., 1994a, b) for surface heat and freshwater fluxes. Surface temperature and salinity are restored to COADS observations using kinematic-heat and freshwater-flux corrections following Barnier et al. (1995). Wind stress is derived from the QuikSCAT-based Scatterometer Climatology of Ocean Winds (Risien and Chelton, 2008). The initial and lateral boundary conditions for temperature, salinity and nitrate are derived from the World Ocean Atlas (WOA) 2009. Other ecological tracers are initialized uniformly to arbitrary low values. Currents at the boundaries are derived from temperature and salinity data using geostrophy together with Ekman transport in the upper 40 m. The model starts from rest and is spun up for 9 years. We then run it for 3 more years, on which we carry out the analysis, and store these outputs at a daily frequency.
The model was evaluated by confronting its outputs to a wide array of in situ and satellite-based observations (see the Supplement for full details). We find that despite some local biases and discrepancies with observations, the model generally shows good skill in reproducing the large-scale features of the circulation and the productivity of the Canary Current region (Figs. S1 and S2). More importantly, it reproduces the strength and structure of the Canary coastal upwelling and captures the observed vertical structure of nitrate and organic matter (Figs. S3 to S17). Overall, this CanCS-only ROMS setup has similar strengths and weaknesses as the telescopic grid setup employed by Lovecchio et al. (2017, 2018). We will discuss the potential impact of the model limitations on our results in the discussion section.
2.2 Lagrangian experiment
The Lagrangian particle-tracking experiment is performed offline with Ariane (Blanke and Raynaud, 1997; http://stockage.univ-brest.fr/~grima/Ariane/, last access: 1 January 2018) using ROMS daily output. Ariane tracks water particles based on the velocity output of the model. In this experiment, Ariane runs based on the model output of zonal and meridional velocities (Ariane internally computes vertical velocities from the continuity equation). Ariane analytically computes streamlines of particle trajectories across grid walls by assuming a steady-state flow. The data points for successive days are used as piecewise steady flow where the velocity is assumed to be static for each day and not interpolated between different days. The velocity at a given point inside the regular cells of the model is computed by linearly interpolating the velocity at opposite faces of a cell. Ariane’s computation of particle trajectories does not account for the subgrid vertical mixing in the model.
With our Lagrangian experiment we aim to study trajectories of open-ocean water masses that enter the coastal region and upwell between 14 and 35∘ N (see sample trajectories in Fig. 1b). This region extends in a north–south direction a total of 3185 km and covers most of the western African coast component of the Canary Current Coastal Province (CNRY) of Longhurst (2007) (Figs. 1a and S18). The Lagrangian experiment requires three steps: (i) particle seeding based on water flow volume into the coastal region, (ii) particle tracking and (iii) selection of particles (see Fig. 1c). Only the selected particles will be further analyzed for our Lagrangian budgets. In the first step, we seed particles along a coastal strip that sits offshore of our coastal upwelling region, i.e., the region between 14 and 35∘ N (Fig. 1a). The particle release strip is set at 50 km westward of the 200 m isobath along the coast, which ensures sampling coastal upwelling occurring over the continental shelf and at the shelf break (Fig. 1c). This results in a coastal upwelling region with a width that varies from less than 60 km near 27∘ N, where the continental shelf is narrowest, to more than 160 km near 25∘ N, where the shelf is widest. The seeding of particles is done with Ariane based on the onshore water flow volume into the coastal region, where each particle is tagged with the corresponding initial transport. We limit the maximum transport a particle is associated with to 0.01 Sv (1 Sv =106 m3 s−1)., which limits the maximum volume assigned to one particle to 0.864 km3. Through a daily particle release for 1 year at each cell along the particle release strip, a total of 9 888 387 particles are released. By the end of the seeding phase for each particle, we have its location, time of release and associated water volume. In the second step, particles are tracked for 720 d since their release until they leave the simulation's domain. Along each particle's trajectory, its latitude, longitude and depth are saved daily along with biogeochemical tracers. Note that around 4.2 %, 0.37 % and 0 % of the particles released in the southern, central and northern subregions, respectively, leave the domain southward or northward within 1 year of their release. Assuming the ocean to be an incompressible fluid and its velocity field to be non-divergent, the volume transport is conserved. We quantify the amount of nutrients carried by each particle to a given location as the product of its associated volume and the concentration of the tracer associated with the particle when it reaches that location. Finally, tracked particles that enter the coastal region and cross upwards of 70 m depth, the average depth of the euphotic zone in the Canary coastal region, are identified as upwelled particles. Since only particles that enter the coastal area and upwell there are followed, our experiment disregards wind-stress-curl-driven upwelling that occurs in the open ocean and can locally be important, particularly in the southern subregion of Lovecchio et al. (2017). From all tracked particles, 352 873 (3.57 %) upwell, which form the basis for our analyses.
Previous studies have shown subregional differences within the CanCS in the circulation patterns, mesoscale activity, seasonality of upwelling, biology and subsurface nutrient concentration (Arístegui et al., 2009; Lovecchio et al., 2017; Pelegri and Benazzouz, 2015). We thus separately characterize the trajectories of waters that upwell in three latitudinal subregions of the upwelling domain. These subregions cover southern (14–21∘ N), central (21–28∘ N) and northern (28–35∘ N) parts of the CanCS (Fig. 1a).
Our Lagrangian analysis reveals an annual upwelling of offshore-derived waters of nearly 80 000 km3 (see Table 1). This is about 25 km3 of water per year per kilometer of coastline or 0.8 m3 s−1 per meter of coastline. The strongest upwelling occurs in the central CanCS, with a particularly strong peak around Cape Bojador (27∘ N) (Fig. 2a). This subregion alone is responsible for more than half of the total upwelling (40 705 km3 yr−1). The northern subregion contributes about 25 000 km3 yr−1 to the upwelling, while the southern subregion has the smallest upwelling (13 000 km3 yr−1).
Table 1The annual number of upwelling particles and their associated water and nitrogen, the median distance of upwelling to the coast and the net transport of water to 400 and 1000 km from coast (as percent of upwelling volume) in the three subregions as well as the entire CanCS region in our experiment.
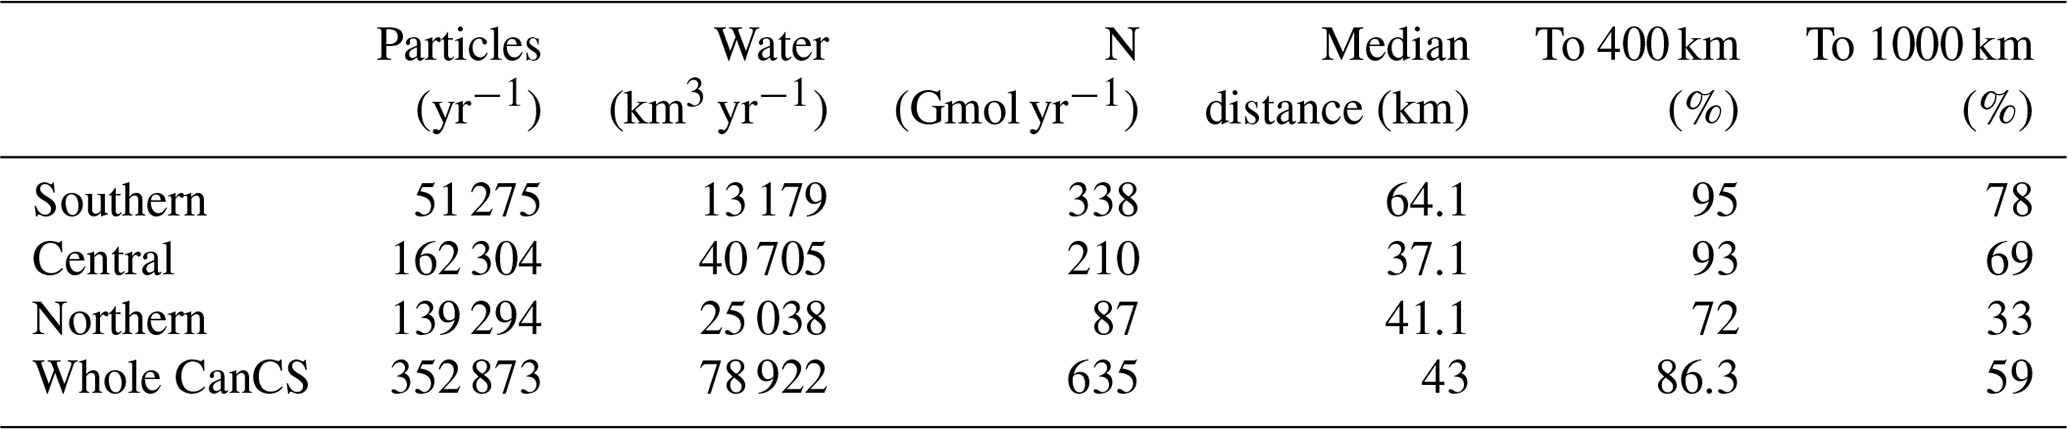
Most of the upwelling stems from deeper waters, i.e., waters that enter our analysis region below 70 m; 85 % of the tracked particles and 88 % of the associated water volume follow that path (termed “deep source”). The remaining upwelling stems from waters that enter the region within the euphotic zone and then are transported below 70 m before upwelling (here termed “shallow source”) (Fig. 1c). This fractional distribution varies little between subregions. But the upwelling zonal distribution differs strongly between the three CanCS subregions (Fig. S20). These differences are reflected in the median upwelling distances being 64.1, 37.1 and 41.1 km in the southern, central and northern subregions, respectively (Table 1).
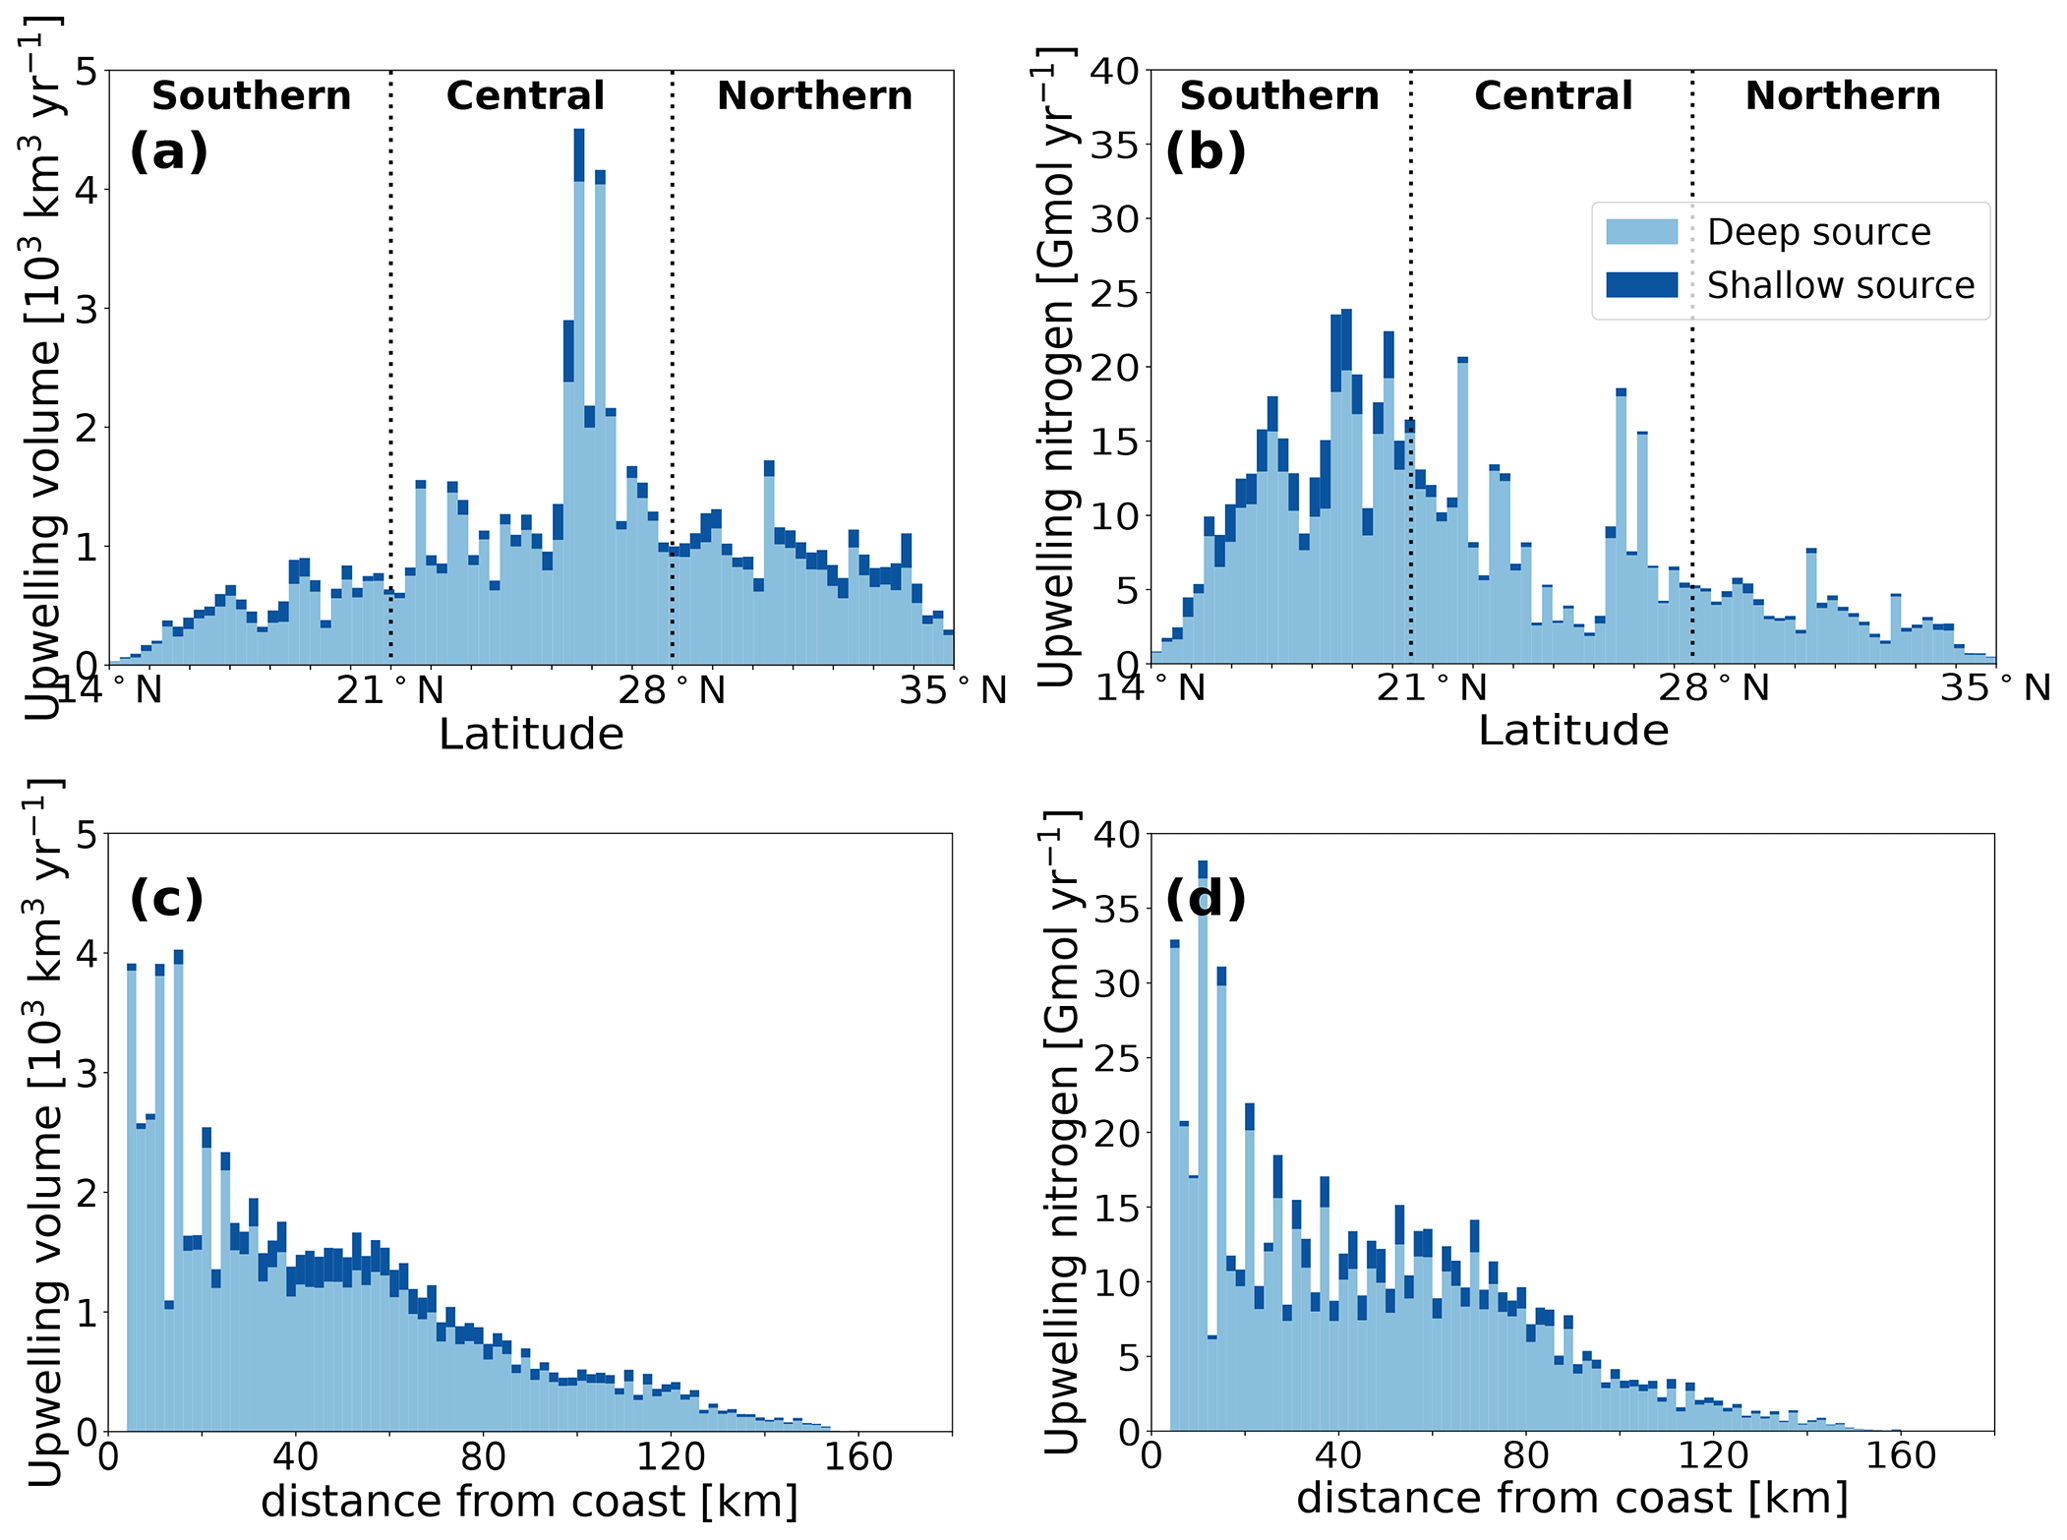
Figure 2(a, b) Annual upwelling (a) water volume and (b) nitrogen zonally integrated across the coastal upwelling region (between the coast and 50 km westward of the 200 m bathymetry). (c, d) Annual upwelling (c) water volume and (d) nitrogen with distance from the coast in the whole CanCS upwelling domain (14–35∘ N). Light- and dark-blue segments represent contribution by deep and shallow sources of water, respectively.
Most of this variability has to do with the variability of offshore Ekman-transport- and curl-driven upwelling between the three subregions. For instance, the central subregion has strong year-round coastal upwelling, whereas upwelling tends to be strong only in the summer season in the northern subregion (Pelegri and Benazzouz, 2015). Similarly, the Ekman-driven upwelling in the southern subregion is restricted to the winter and spring (Pelegri and Benazzouz, 2015; Capet et al., 2017). There are distinct differences also with regard to the wind-curl-driven upwelling between the three subregions. Indeed, the wind stress curl is predominantly downwelling-favorable in the northern and central subregions and upwelling-favorable in the southern subregion. This enhances upwelling in the southern region, particularly in the open ocean, but its effect is only partially sampled in the present study given our focus on the coastal region. Other inter-regional variations may also stem from the design of the experiment. For instance, our experiment identifies limited coastal upwelling south of Cape Blanc and between Cape Barbas and Cape Bojador because their bathymetry is shallower than the 70 m upwelling depth criterion used here. Furthermore, the upwelling strip is relatively narrow in the northern subregion because of the narrower shelf, thus limiting the offshore spread of coastal upwelling there (Fig. S19).
Finally, the upwelling patterns of water and nitrogen have a few important differences. The southern subregion has the lowest upwelling water volume yet the strongest upwelling flux of nitrogen (Fig. 2). This is primarily due to the shallower nutricline associated with a shallower thermocline there as well as the higher nutrient content of the South Atlantic Central Waters (SACW) that feed upwelling south of Cape Blanc. Conversely, the weakest upwelling-driven nitrogen flux is in the northern subregion (Table 1 and Fig. 2).
4.1 Reach and timescales of offshore transport
Over the whole CanCS, the water offshore transit times (the median particle's travel time to traverse a given offshore interval) are longer in the nearshore region and decrease as we go further away from the coast (Fig. 3). Large differences in the offshore transport timescales exist between the three CanCS subregions. In the first 200 km from the coast, the offshore transport is fastest for particles upwelled in the central subregion and slowest for those in the northern subregion (Figs. 3 and S23). Indeed, in the central subregion, 80 % of the upwelling particles reach 200 km in 3 months and 50 % reach that distance in 2 months only. In contrast, less than 30 % of particles upwelling in the northern subregion reach 200 km offshore in 3 months, and it takes more than 4 months for half of them to reach that distance. At larger distances from the coast (beyond 400 km), the offshore transport becomes fastest for particles that upwelled in the southern subregion with nearly 80 % of particles reaching 1200 km in 2 years, while only 70 % and 30 % of particles upwelling in the central and northern subregions reach that distance in 2 years. This can also be seen in the water residence times being shortest for the central subregion particles up to 400 km and for the southern subregion particles beyond 400 km (Table S1).
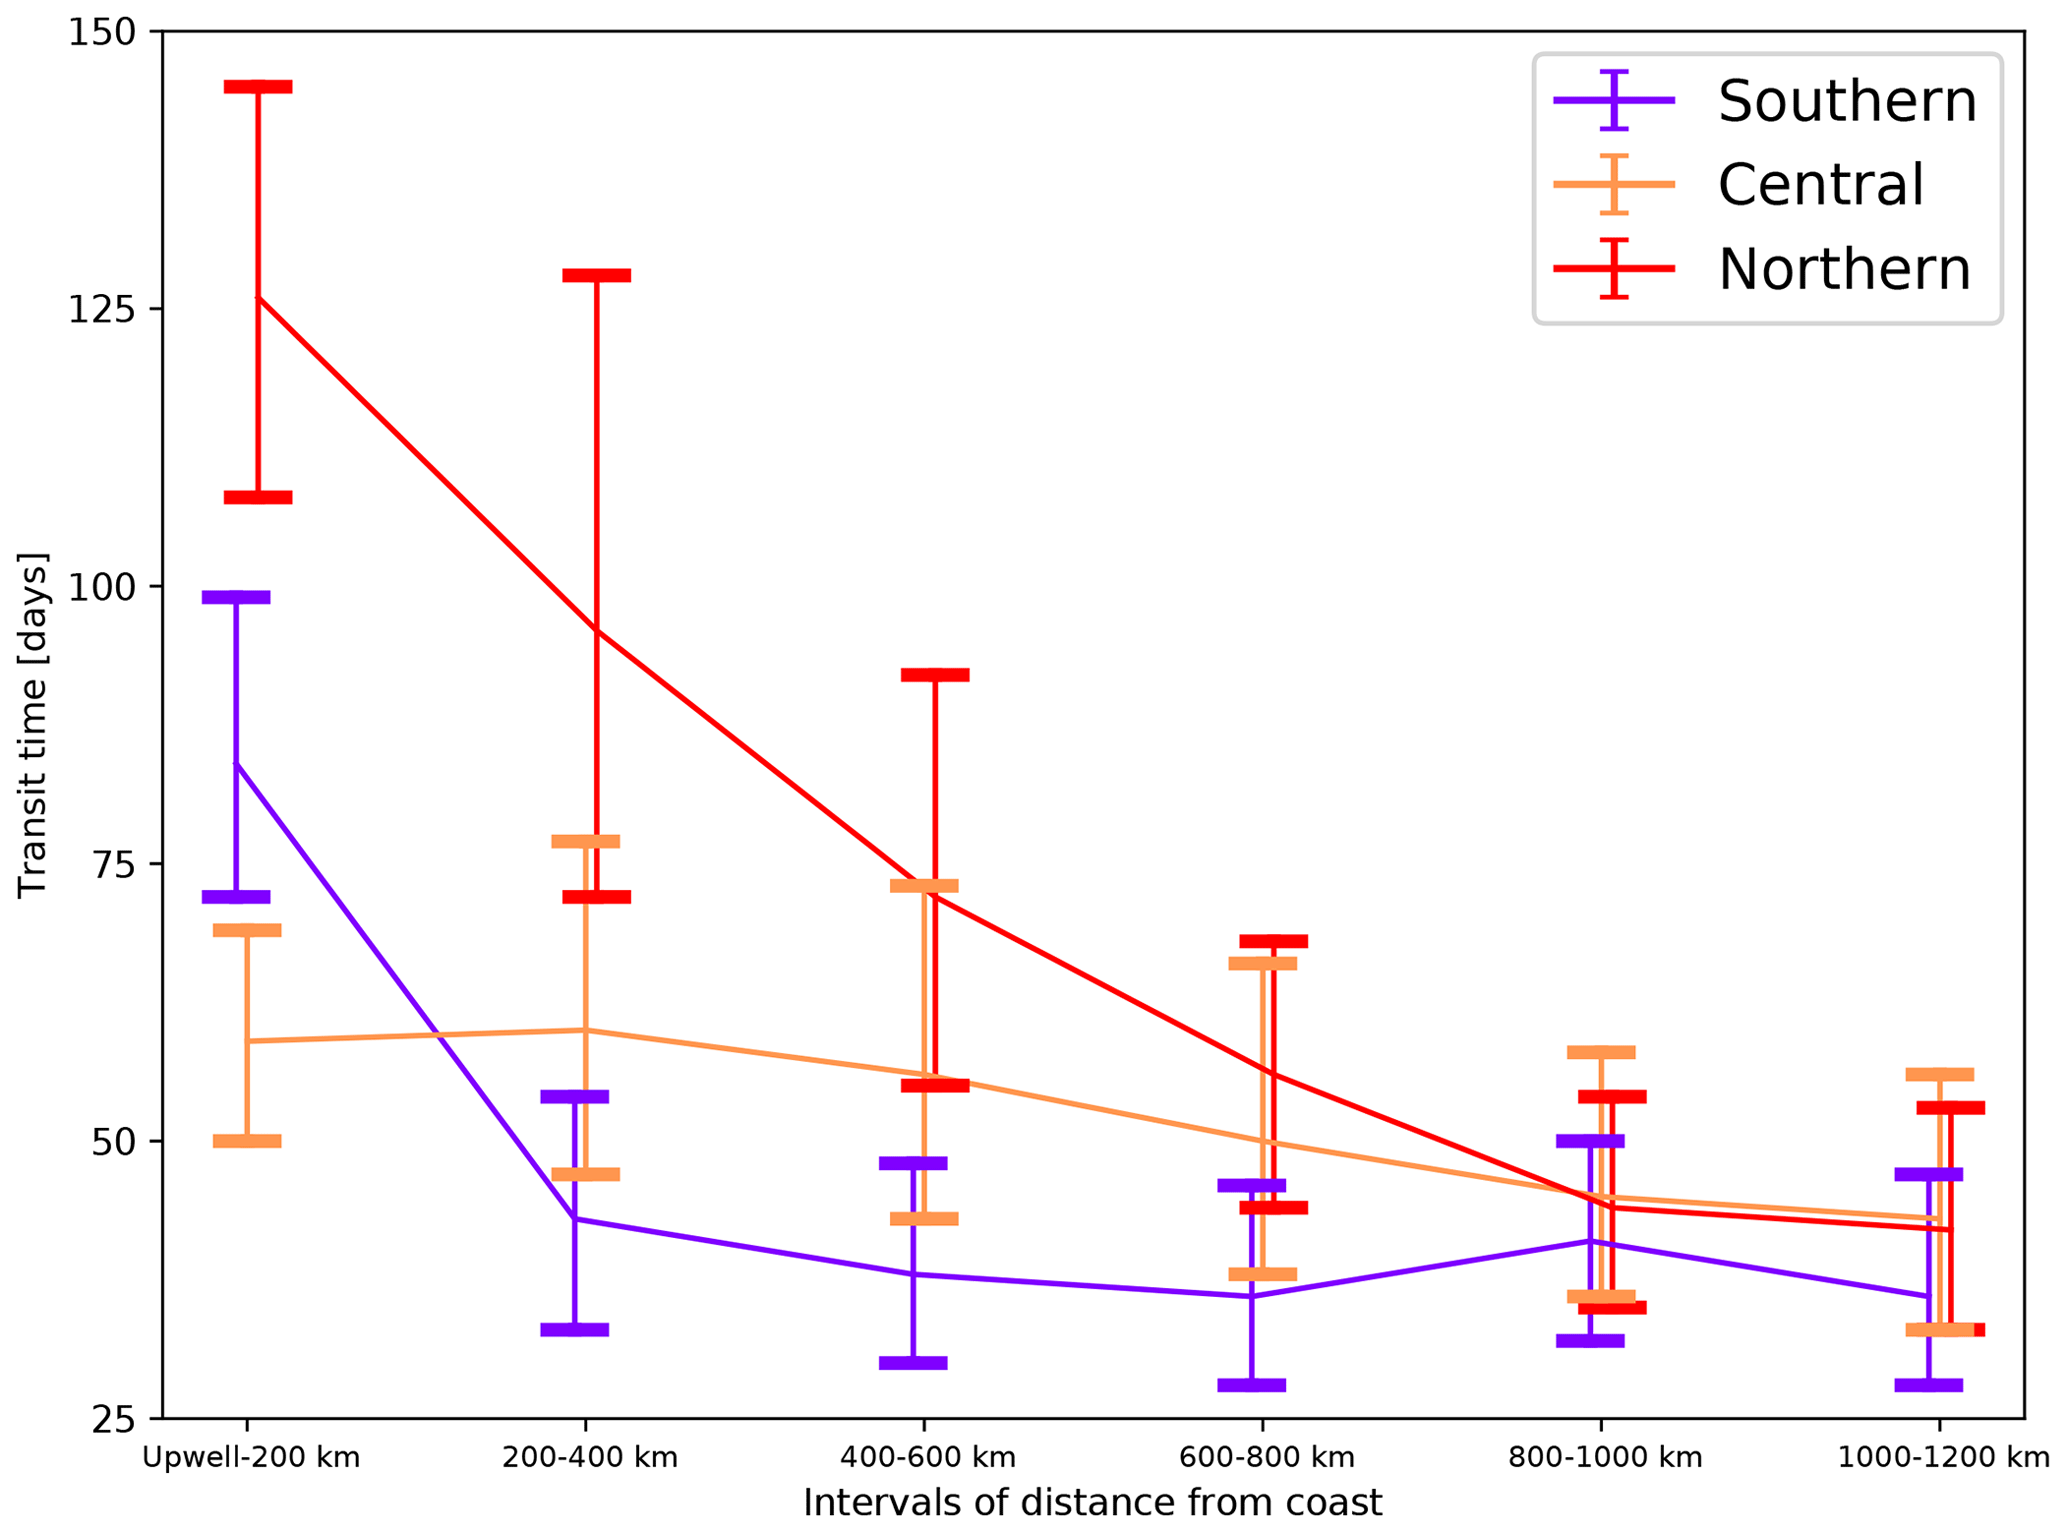
Figure 3A plot of median transit times for particles to traverse subsequent intervals of distance from the coast for the three subregions in the CanCS. The first point shows the transit time from particles' upwelling to distances reaching 200 km. The error bars indicate the 10 percentile distributions above and below the median transit times. Only particles that traverse the whole distance range are considered.
4.2 Net offshore transport
Integrated over the whole analysis domain from 10 to 41.5∘ N, the CanCS exports over 70 000 km3 yr−1 of water toward the open North Atlantic (Fig. 4a). The maximum offshore transport is reached at close to 150 km from the shore at around the edge of the coastal upwelling area. It is around 150 km because at closer distances to the coast (<100–150 km), upwelled volume is only partially sampled, while further distances (>100–150 km) are never reached by a proportion of particles because of recirculation retaining them close to the coast and alongshore transport exporting some particles out of the model domain. Beyond this maximum, the transport decreases gradually as the number of particles reaching farther offshore distances within the 2-year integration period declines. But even at a distance of 1200 km from the coast, the offshore transport still amounts to 40 000 km3 yr−1.
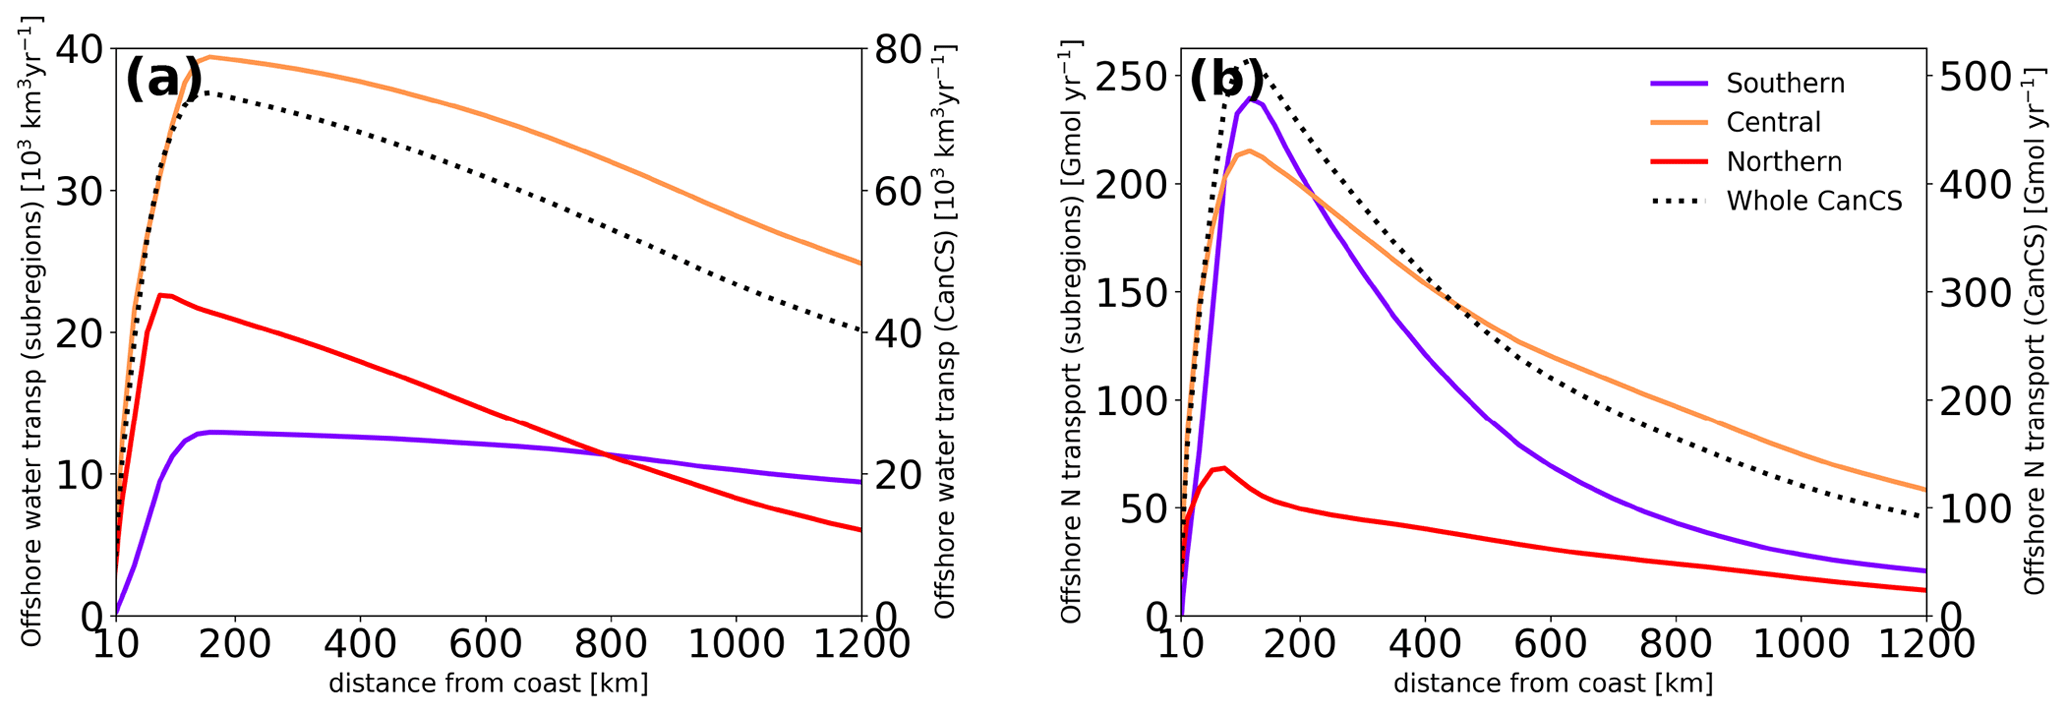
Figure 4Net offshore transport of (a) water and (b) nitrogen as a function of the distance to the coast in the three subregions (left axis) as well as the entire CanCS (right axis) in our experiment.
There are substantial differences between the different subregions. The central subregion of the Canary system is responsible for over half of the entire net offshore transport of water from the CanCS at any distance from the coast (Fig. 4a). The offshore transport associated with the northern subregion upwelling is initially very strong but decreases sharply thereafter so that beyond 800 km, it becomes the weakest of all three regions. Reduced coastal upwelling and low offshore transport efficiency (i.e., the ratio of offshore transport volume at a given distance to upwelling volume) explain this pattern (Table 1, Fig. 4a). The southern subregion is associated with the smallest offshore transport of water up to 800 km offshore due to its small coastal upwelling volume.
Around 150 km from the coast, the nitrogen transport reaches values as large as 500 Gmol yr−1 at 200 km, decreasing exponentially further offshore, although with a relatively long decay length scale such that at a distance of 1200 km, the offshore export of nitrogen still amounts to 100 Gmol yr−1.
Although offshore water transport was minimal for the southern CanCS particles, this subregion is responsible for the greatest offshore export of nitrogen (nearly half of the offshore export of nitrogen by the whole CanCS region at this distance). This is a direct consequence of the large upwelling flux of nitrogen (Table 1 and Fig. 4b). This pattern reverses further offshore. Beyond 200 km from the coast, the offshore transport of nitrogen associated with the central subregion upwelling exceeds that originating from both the southern and northern subregions. At all distances past 600 km, the central subregion contributes over half of the nitrogen offshore export by the entire CanCS. At these distances, the nitrogen transport of waters stemming from the central subregion is at least twice as large as that from the southern subregion and 4 times as large as that from the northern subregion.
The magnitude of the offshore transport of nitrogen at any distance from the coast depends both on the volume of offshore transport and how efficiently nitrogen is stripped from the waters by biological productivity and the resulting organic nitrogen is exported to depth. It is thus instructive to assess the specific forms of nitrogen being transported offshore.
4.3 Nitrogen allocation
In the nearshore 50 km, phytoplankton is very efficient in taking up the inorganic nitrogen that is being upwelled and fixing it into organic forms of nitrogen (Fig. 5a). This results in nearly 100 % of the offshore transported nitrogen being in the form of organic nitrogen. But as additional nitrogen is being supplied from below, the fraction of the upwelled nitrogen that gets consumed decreases rapidly with increasing offshore distance. Furthermore, some of the fixed organic nitrogen is lost through sinking so that beyond the nearshore 50 km region, inorganic nitrogen in the form of nitrate dominates the nitrogen pool at all distances from the coast (Fig. 5a). Beyond 300 km, ammonia is the second largest pool. Overall, organic nitrogen contributes only 30 % to the total nitrogen pool. Within the organic nitrogen pool, small detritus contributes the most to the offshore transport, while the contribution of phyto- and zooplankton is much smaller and that of the large detritus particles is essentially negligible.

Figure 5The net offshore transport of each pool of nitrogen (phytoplankton, zooplankton, small and large detritus, nitrate, and ammonium) as a function of the distance to the coast in the three subregions (left axis). The fraction of organic nitrogen (in %) in the net offshore transport of nitrogen at each distance from the coast is shown on the right axis.
Given its dominance in terms of the total offshore transport, the southern subdomain is also the main region determining the whole CanCS pattern of nitrogen allocation (Fig. 5b). In this southern subdomain, the fraction of organic nitrogen is particularly low, being only 20 % at the peak of the offshore transport. With increasing distance, the fraction increases to 30 %. This indicates a much further offshore extension of the conversion of inorganic nutrients to organic matter in this domain. The central domain has a nitrogen allocation pattern that is similar to that of the whole CanCS (Fig. 5c), while the transport in the northern subdomain is not only weak but also the least dominated by the offshore transport of nitrate (Fig. 5d).
The different offshore gradients exhibited by the different pools of nitrogen can be largely explained by their position in the cycling of nitrogen within the euphotic zone and their susceptibility to sinking. Nitrate, being the dominant form of nitrogen being upwelled, comes first, followed by phytoplankton, zooplankton and small detritus. The latter two contribute then to the formation of ammonia by respiration and remineralization. Ammonia tends to accumulate, partially aided by its non-sinking nature, making this an important part of the offshore transport. In contrast, the very small contribution by the large detritus is largely a consequence of its rapid export to depth (see also Gruber et al., 2006).
4.4 Vertical and horizontal structure
Upwelled particles that are transported offshore are also subject to vertical circulation that distributes them vertically (Figs. 6 and S25). Subduction may potentially slow down offshore transport, since velocities deeper in the water column are smaller. However, subduction can also increase the efficiency of offshore transport by minimizing the depletion of nitrogen in surface waters.
For the northern and central subregions, upwelling particles are subject to moderate subduction at around 100 to 200 km from the coast (Fig. 6). In the southern subregion, however, upwelling particles are subject to very little subduction, while a strong open-ocean upwelling maintains them near the surface. Similarly to the water volume transport, subduction of nitrogen is strongest in the northern subregion and weakest in the southern subregion (Fig. S22). The stronger downward advective transport occurring in the central and northern subregions is due to a strong negative wind stress curl in these subregions, which is absent in the southern subregion (Lovecchio et al., 2017). Furthermore, persistent filaments associated with prominent capes in the central and northern subregions may contribute to enhanced subduction of upwelling water and nutrients there (Lovecchio et al., 2018).
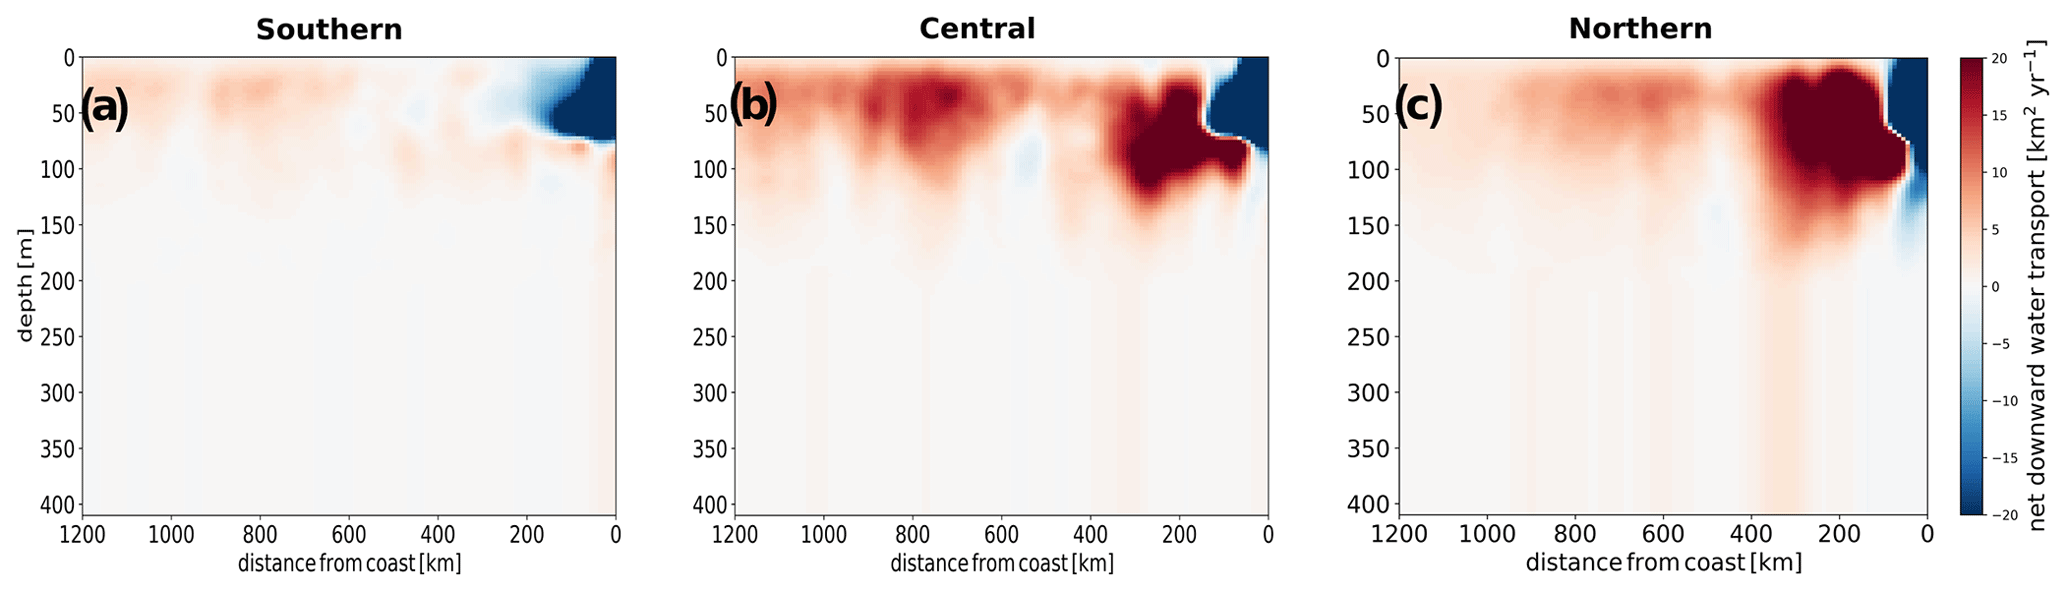
Figure 6Meridionally integrated net downward transport of water in the (a) southern, (b) central and (c) northern subregions. All values are in km3 of water per km of offshore distance per year.
The offshore transport of organic nitrogen is smaller in magnitude than that of inorganic nitrogen and is mostly limited to the near surface in all subregions (Figs. 7, S22 and S27). In contrast, the transport of inorganic nitrogen shows a subsurface secondary maximum at between 50 and 100 m in addition to the surface maximum (Figs. 7 and S22). Our analysis highlights the two opposing effects of subduction in not only slowing offshore transport speeds but also reducing biological uptake (and nitrogen loss due to sinking) and hence helping maintain high nitrogen content by upwelled water.
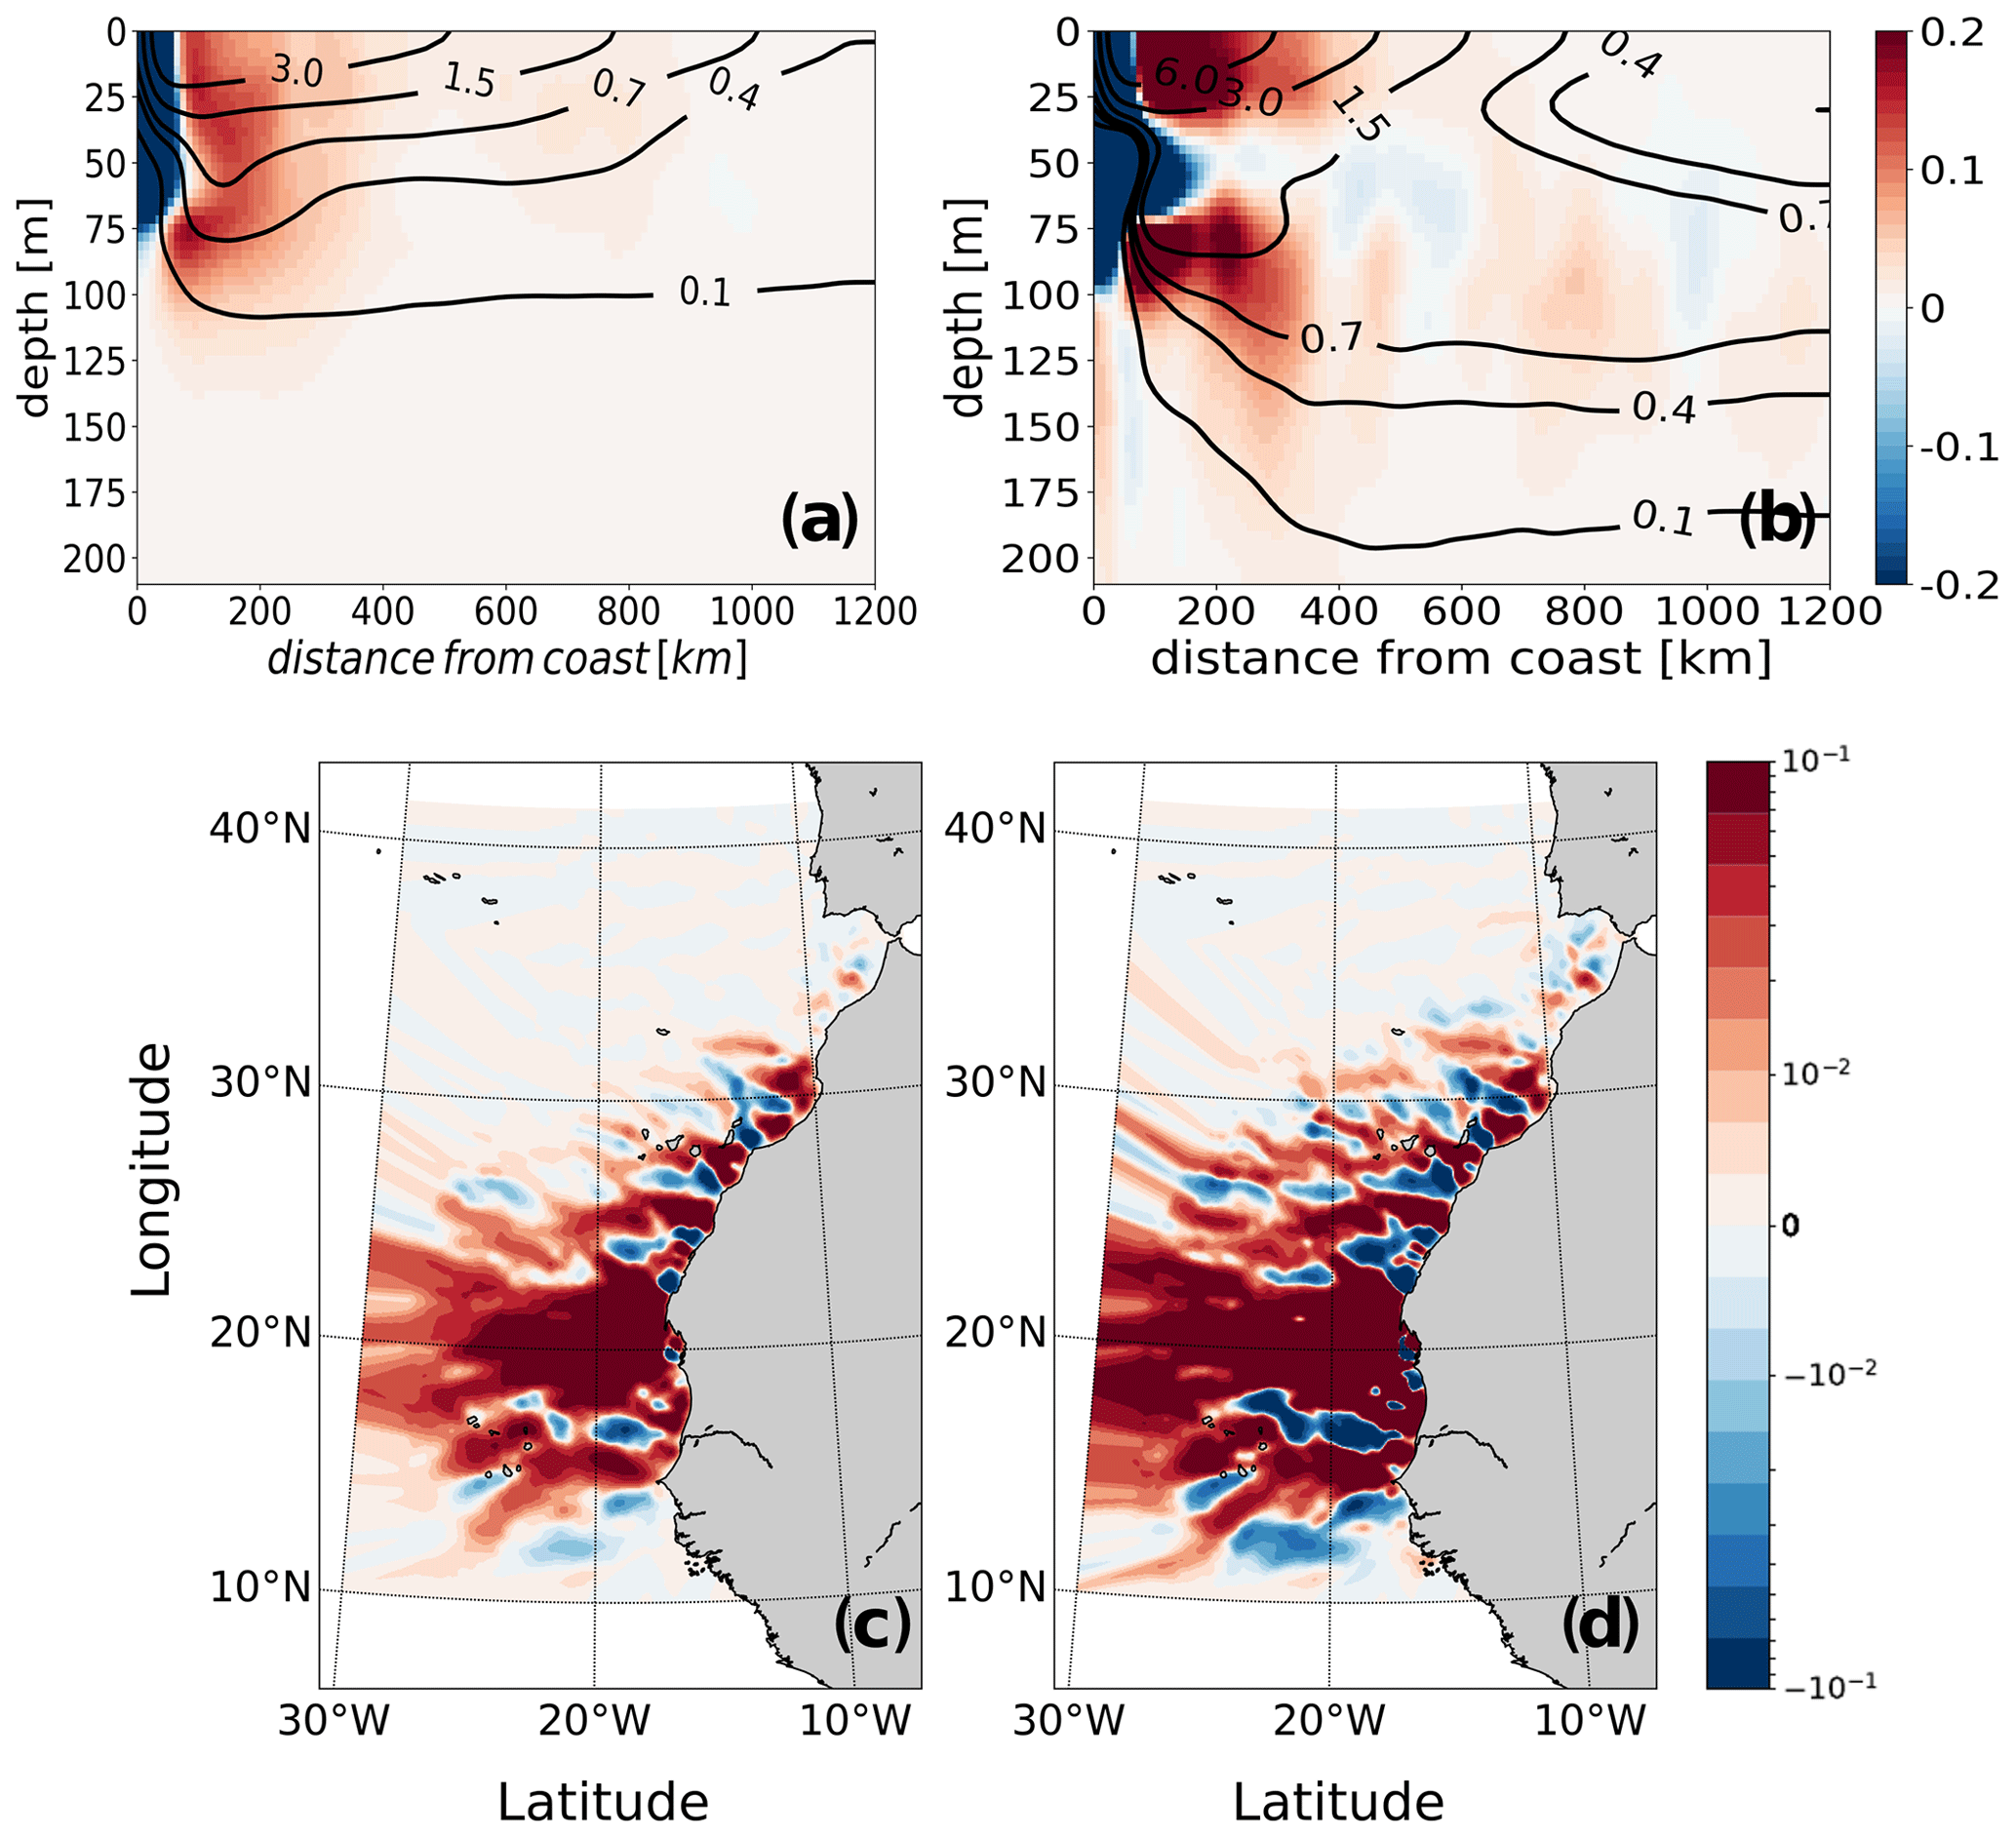
Figure 7Analysis of the structure of the offshore transport of nitrogen: (a, b) offshore sections of the meridionally integrated net downward and offshore transports of (a) organic and (b) inorganic nitrogen in the upper 200 m as a function of the distance to the coast. Positive (red) and negative (blue) shadings represent net downward and net upward transports (in Gmol N km−1 yr−1), respectively, and contours correspond to the offshore transport (in Gmol N m−1 yr−1). The fluxes were meridionally integrated throughout the domain. (c, d) Maps of the vertically integrated offshore transport of (c) organic and (d) inorganic nitrogen, where positive (red) and negative (blue) shadings represent net offshore and onshore transports, respectively (in Gmol N km−1 yr−1).
The convergence of the Canary Coastal Current flowing from the north and the Mauritanian current flowing from the south leads to a strong offshore transport of nitrogen around Cape Blanc (21∘ N) (Figs. 7 and S27). The nitrogen (both organic and inorganic) channeled through the confluence of the two currents originates predominantly from waters upwelling in the central and southern subregions, with a small contribution from particles upwelling in the northern subregion. This is consistent with the finding of Lovecchio et al. (2017), who – using a Eulerian approach – also found the Cabo Verde front to be a major channel of export of coastal waters and of the associated nitrogen into the open ocean. Although integrated vertically and averaged in time, the pattern of offshore transport captures a spatially averaged manifestation of mesoscale eddies in latitudinally alternating offshore–onshore corridors known as striations (Davis et al., 2014).
5.1 Enhancement of offshore transport around capes
The coastal upwelling front associated with the strong density gradient formed at the transition zone between the upwelling waters and the open-ocean waters limits the offshore transport. Yet, the cold coastal filaments that emerge from the instability of the upwelling front and its interaction with eddies can play a crucial role in transporting upwelling waters across the front against the mean density gradient. These filaments have been shown to be associated with a high export of organic material and nutrients into the open ocean, particularly in the nearshore. Àlvarez-Salgado et al. (2007) suggested the contribution of filaments to the transport of carbon off Iberia and northwestern Africa to be 2.5 to 4.5 times larger than the export driven by Ekman transport. Lovecchio et al. (2018) estimate that coastal filaments are responsible for 80 % of the offshore transport in the first 100 km offshore. Coastal filaments can occur anywhere on the coast in the CanCS, but previous studies have shown that capes can facilitate their formation (Meunier et al., 2010; Troupin et al., 2012). Lovecchio et al. (2018) demonstrated that in their analyses, 25 % of the time, the filaments were associated with capes. Many filaments originating at capes are so persistent and well known that they have been named after the cape, such as the Cabo Verde filament (Capet et al., 2017; Ndoye et al., 2017), the Cape Ghir filament (Troupin et al., 2012; Pelegri et al., 2005b) and the exceptionally large and extensive Cape Blanc–Cape Barbas filament that occurs at the confluence of the Canary and Mauritanian currents (Van Camp et al., 1991; Barton et al., 2004). Enhanced transport can also be seen at other capes such as Cape Bojador, where a persistent filament extending up to 500 km offshore can be observed (figure not shown).
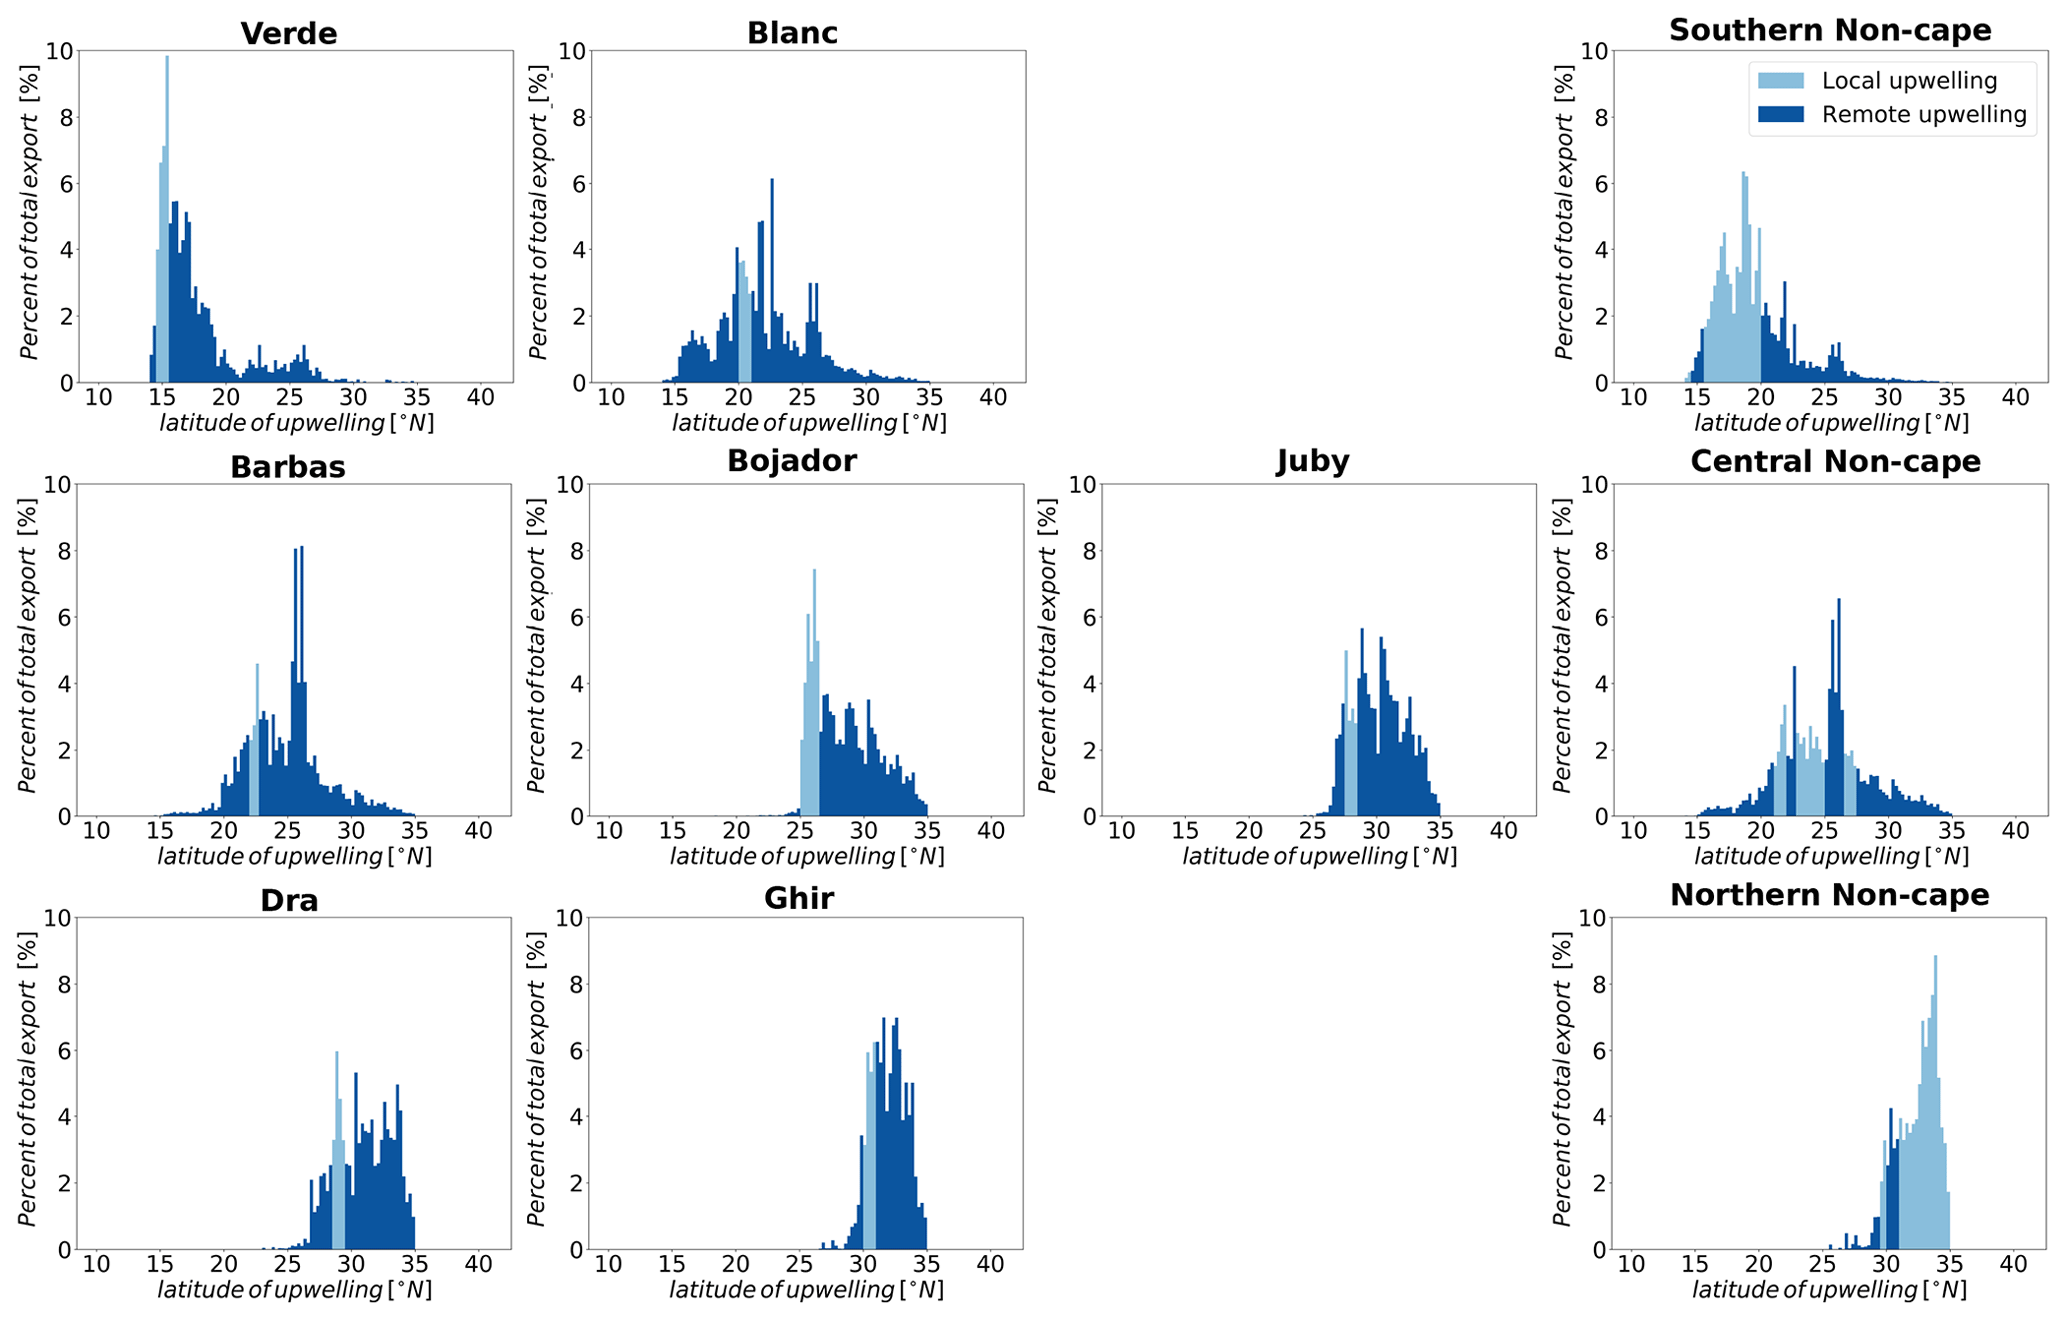
Here, we explore how areas around the major capes that are favorable to strong filamentary activity affect upwelling and offshore export of water and nitrogen. These are Cabo Verde (14.5–15.5∘ N) and Cape Blanc (20–21∘ N) in the southern subregion; Cape Barbas (22–22.75∘ N), Cape Bojador (25–26.5∘ N) and Cape Juby (27.5–28.5∘ N) in the central subregion; and Cape Dra (28.5–29.5∘ N) and Cape Ghir (30–31∘ N) in the northern subregion (Fig. 1a and Table S2). Previous studies of the Canary upwelling mostly stressed the role of filaments in locally enhancing offshore transport regardless of the source of upwelling. Similarly, we find an enhancement of offshore transport of upwelled particles in the first 200 km from the coast within the latitudinal range of all capes except Cabo Verde and Cape Juby (Fig. 8). Transport at latitudes of Cape Blanc, Cape Barbas, Cape Dra and Cape Ghir is larger than at the non-cape latitudes as far as 1000 km from the coast. We further separately consider the enhancement of offshore transport associated with (i) enhanced local upwelling around the capes and (ii) increased export of non-locally upwelled water at each cape, i.e., the export of waters that upwelled far away from the capes but are then transported along the coast toward the cape, from where they are exported toward the open ocean.
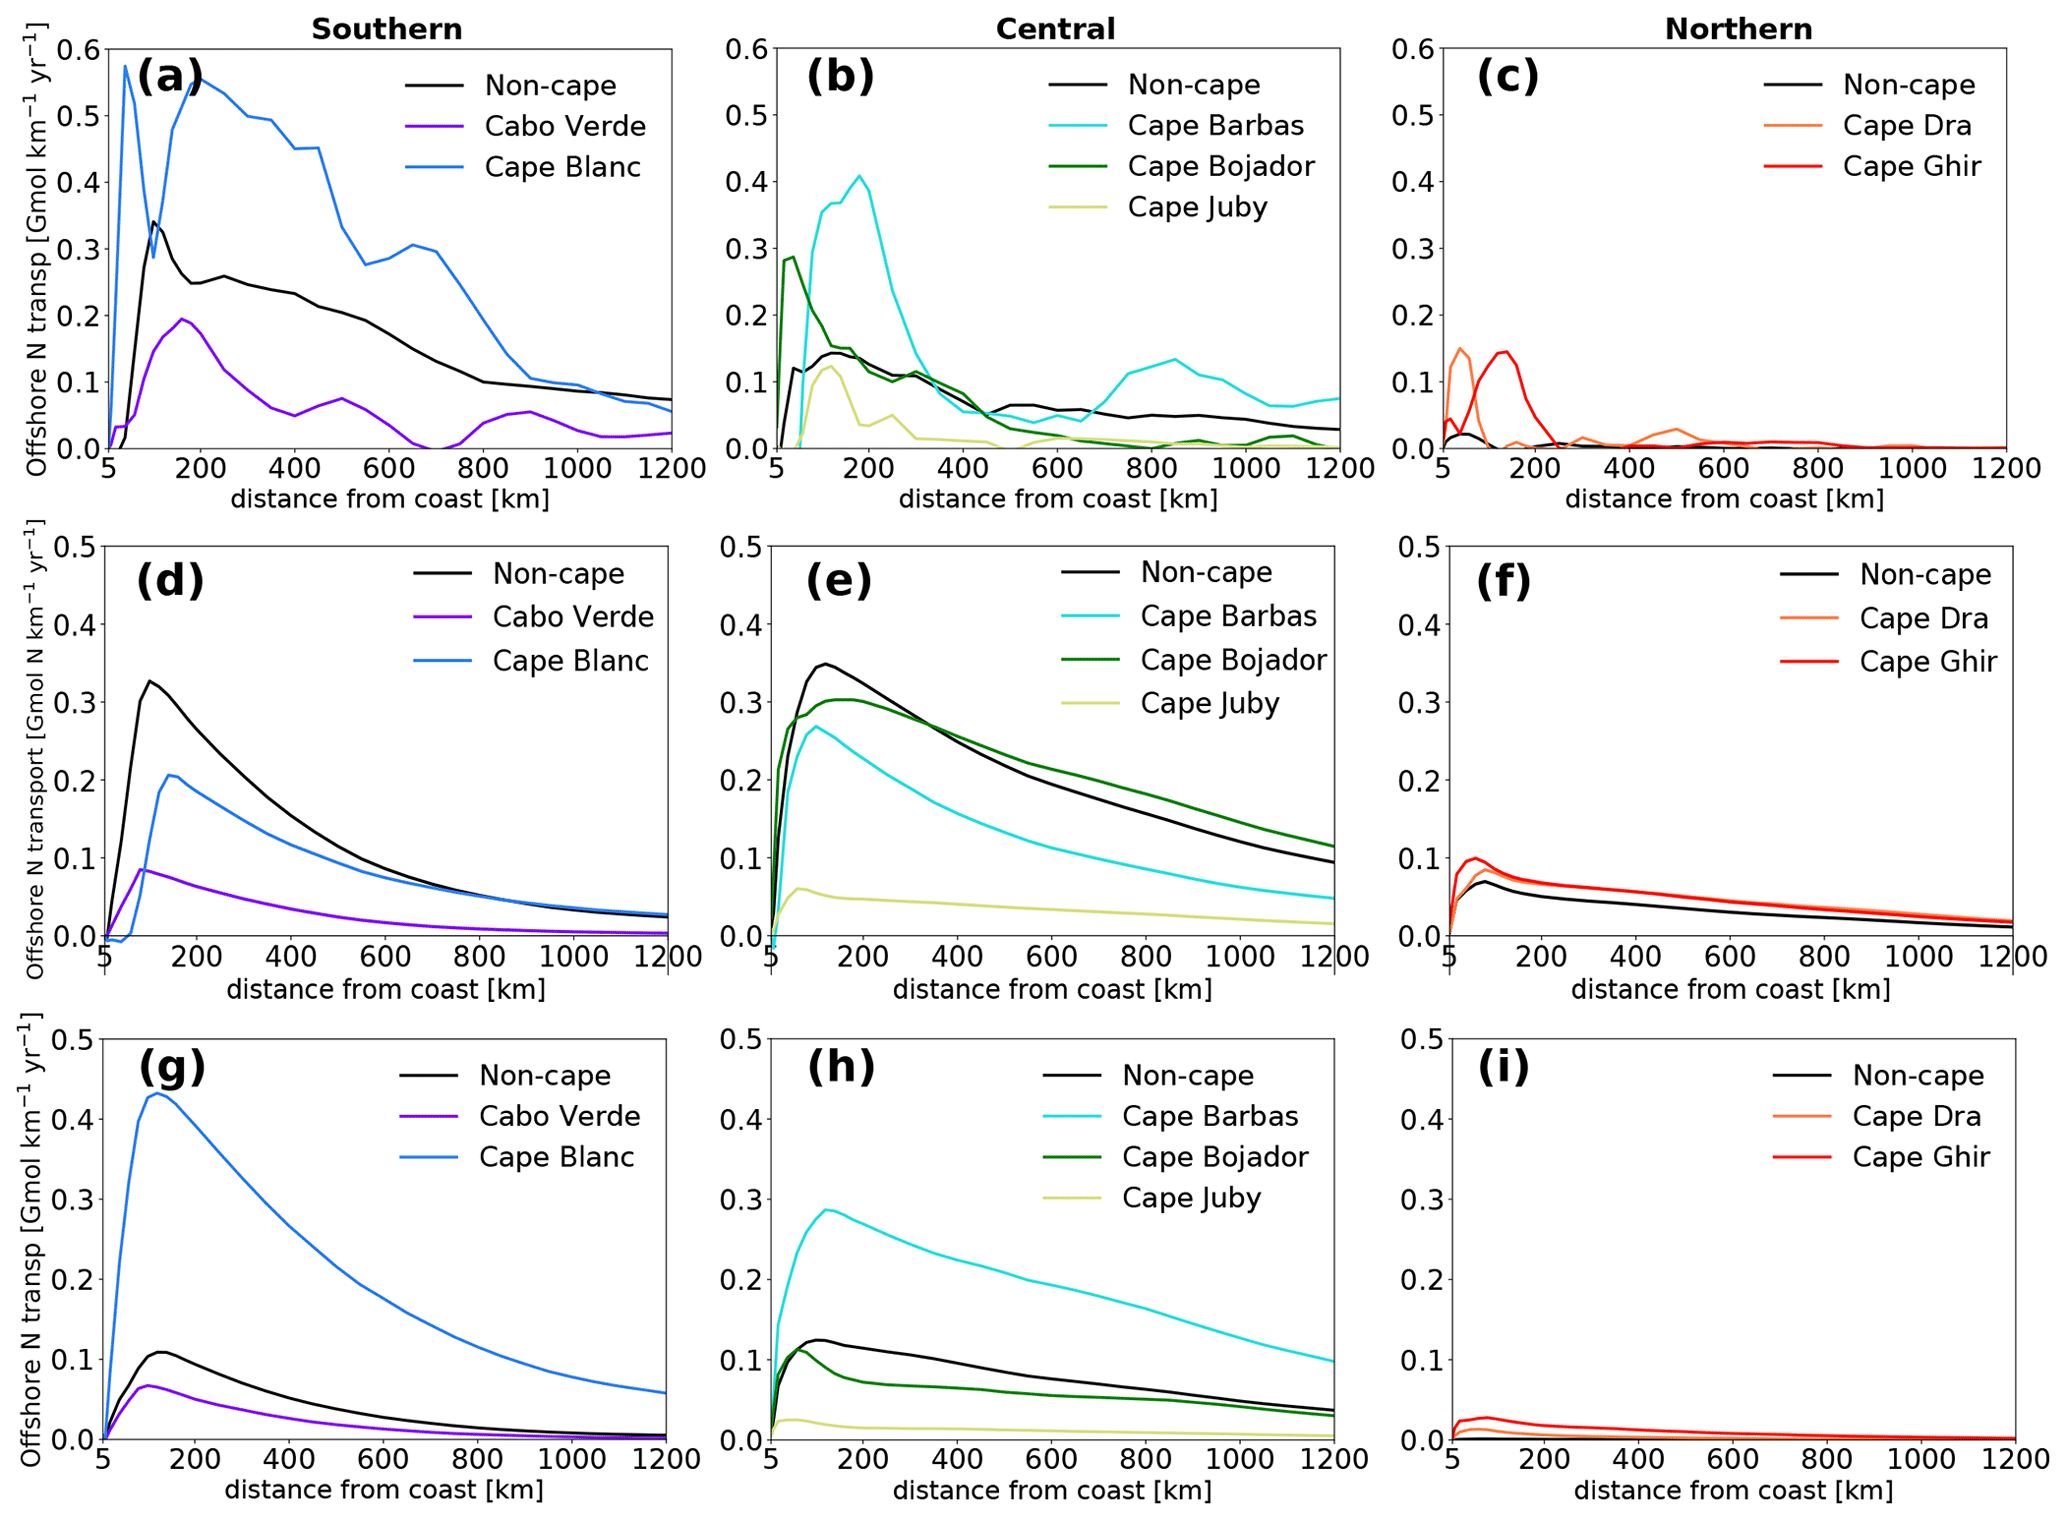
Figure 8Enhancement of net offshore transport of nitrogen by capes. (a, b, c) Transport within the latitudinal span of each cape or non-cape area. Transport occurring within each latitudinal span is considered at any distance from the coast irrespective of the location of upwelling or coastal export. (d, e, f) Transport associated with locally upwelled water in each cape or non-cape coast. (g, h, i) Transport associated with non-locally upwelled water at each cape or non-cape area. Note that the transport is normalized by coastal length (divided by the length of the coast at the respective cape or non-cape area).
The offshore transport of water upwelled around Cape Bojador in the central subregion and Cape Dra and Cape Ghir in the northern subregion is 20 % to 30 % larger than that originating from non-cape areas (per coastal length) (Fig. S28). Increased offshore transport of nitrogen due to increased local upwelling is seen only in Cape Dra and Cape Ghir out of the seven capes examined (Fig. 8). Cape Bojador does not show enhanced local nitrogen upwelling (although a slight enhancement is shown in its offshore export).
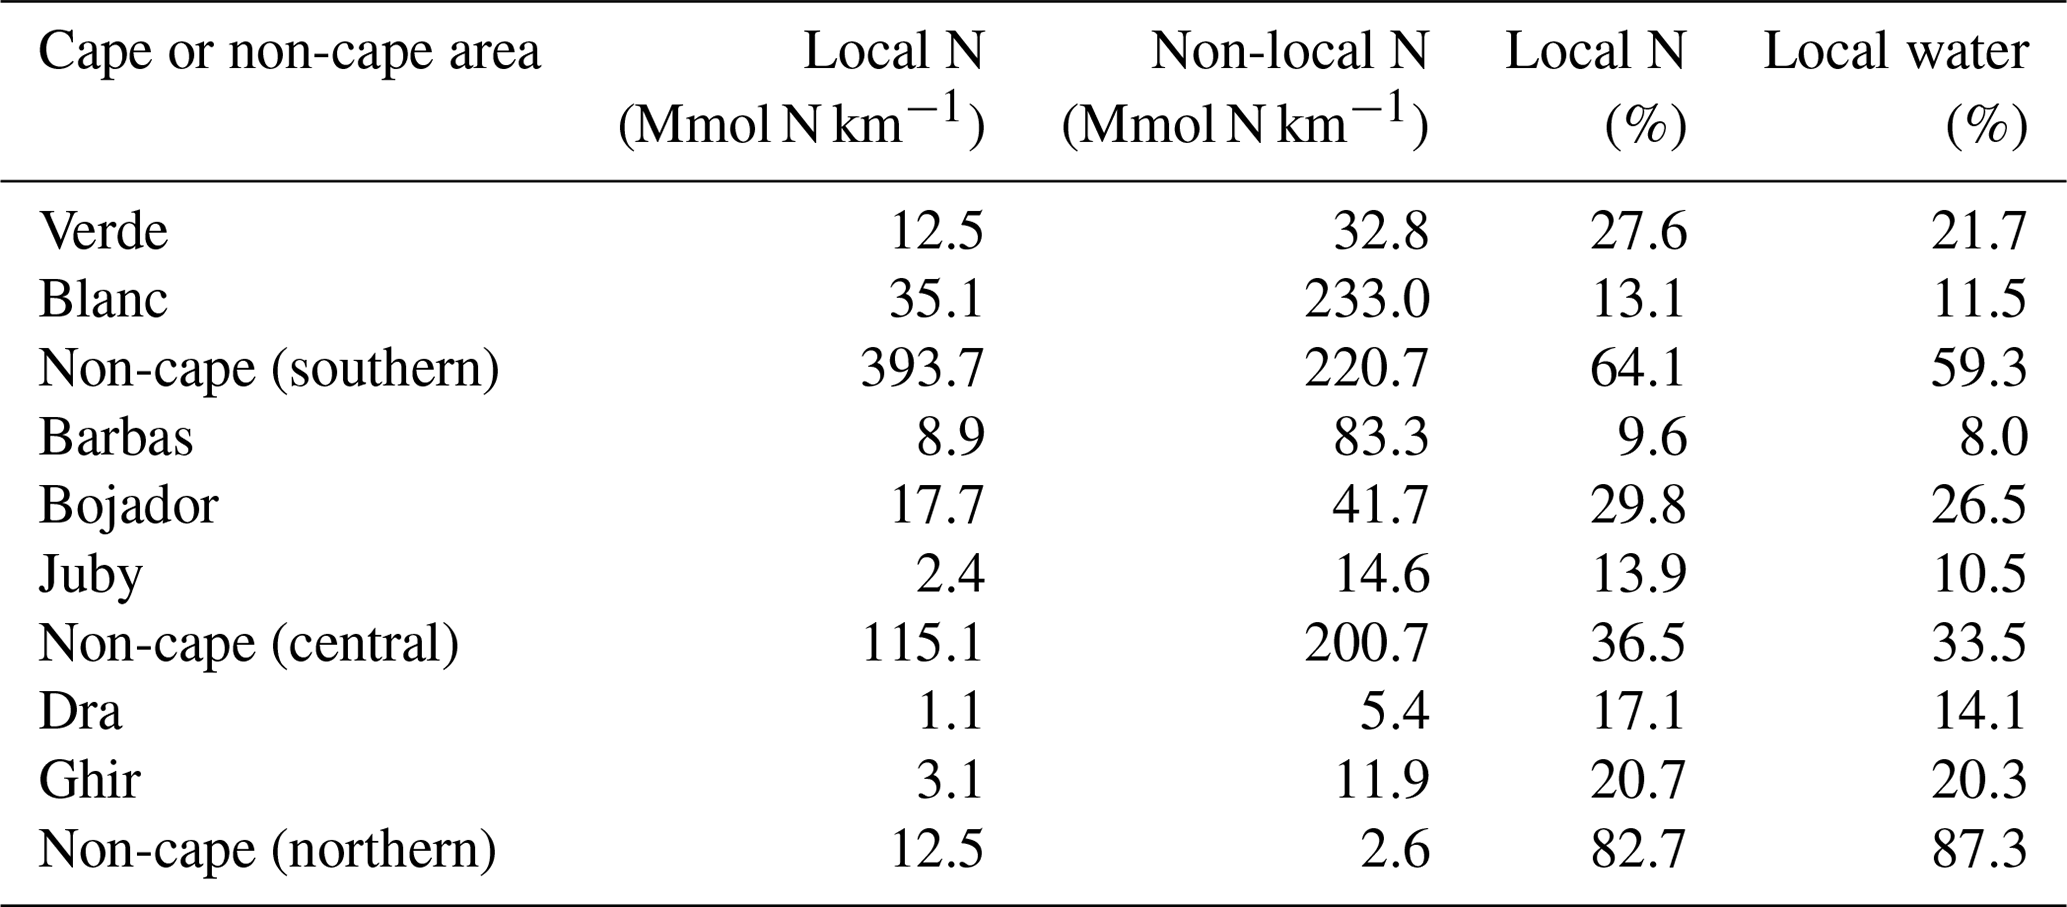
Cape Blanc, Cape Barbas and Cape Ghir are highly efficient in exporting non-locally upwelled waters to the open ocean (Fig. S29). Cape Blanc's enhancement of offshore export of nitrogen by non-local upwelling compared to the non-cape part of the central subregion is 350 %–400 % in the first 400 km then constantly increases further offshore to reach a 935 % enhancement at 1200 km. Similarly, Cape Barbas shows an enhancement of non-local upwelling of about 200 % for all distances from the coast, while Cape Ghir shows a 250 % enhancement from 100 to 800 km offshore (Fig. 8). Non-locally upwelled waters that are transported offshore around major capes represent more than 30 % of the total offshore transport at all distances from the coast (Figs. 4 and 8). Indeed, most of the water and nitrogen exported offshore around major capes is non-locally upwelled (Table 2). Each cape also sources more of its export from non-local upwelling than any of the non-cape coastal areas. Non-local upwelling accounts for over 75 % of the nitrogen export in all capes except Cabo Verde and Cape Bojador, while it accounts for a minority of the source of non-cape parts of the coast except in the central subregion (Table 2).
The analysis of the source waters for particles exported around the major capes reveals a strong alongshore transport of upwelled particles that connects upwelling between different coastal regions (Fig. 9). This is consistent with previous studies that found strong meridional alongshore advection of nutrients (Carr and Kearns, 2003; Pelegri et al., 2006; Meunier et al., 2010; Troupin et al., 2012; Pastor et al., 2013; Pelegri and Benazzouz, 2015; Auger et al., 2016; Lovecchio et al., 2017). The ability of capes to facilitate offshore export of coastal water through their interaction with alongshore advection has also been previously documented (Meunier et al., 2010; Troupin et al., 2012). With the exception of Cape Blanc and Cape Barbas, most capes export offshore water that mostly first upwells north of their latitude (Fig. 9). In the central and northern subregions, this is primarily due to the southward offshore flow by the Canary Current. In the southern subregion, both the Canary and Mauritanian currents are important sources for coastal upwelling, particularly during winter (Klenz et al., 2018). This is visible in the northern source of upwelling that leaves the coast at all capes in this subregion and the southern source of upwelling that leaves the coast at Cape Blanc and Cape Barbas (Fig. 9). We conclude that capes such as Cape Blanc and Cape Barbas act to concentrate and export non-locally upwelled waters and that this effect is much more important than the occurrence of enhanced local upwelling at the capes.
Table 2The first two columns show the daily contribution of local and non-local upwelling to nitrogen that leaves the coastal region at each cape (in Mmol N km−1) per km of coastal length. The last two columns show the contribution of local upwelling (in %) to total nitrogen and water exported at each cape or non-cape coast.
5.2 Role of recirculation
Particles that are transported offshore past a certain distance can return back to that same distance or never cross it again. We term the transport associated with the latter “direct transport”. Particles that cross the same distance multiple times can end up further offshore (an odd number of crossings) or closer to the coast (an even number of crossings). We term them “indirect transport” and “net recirculation”, respectively (Fig. 10a).
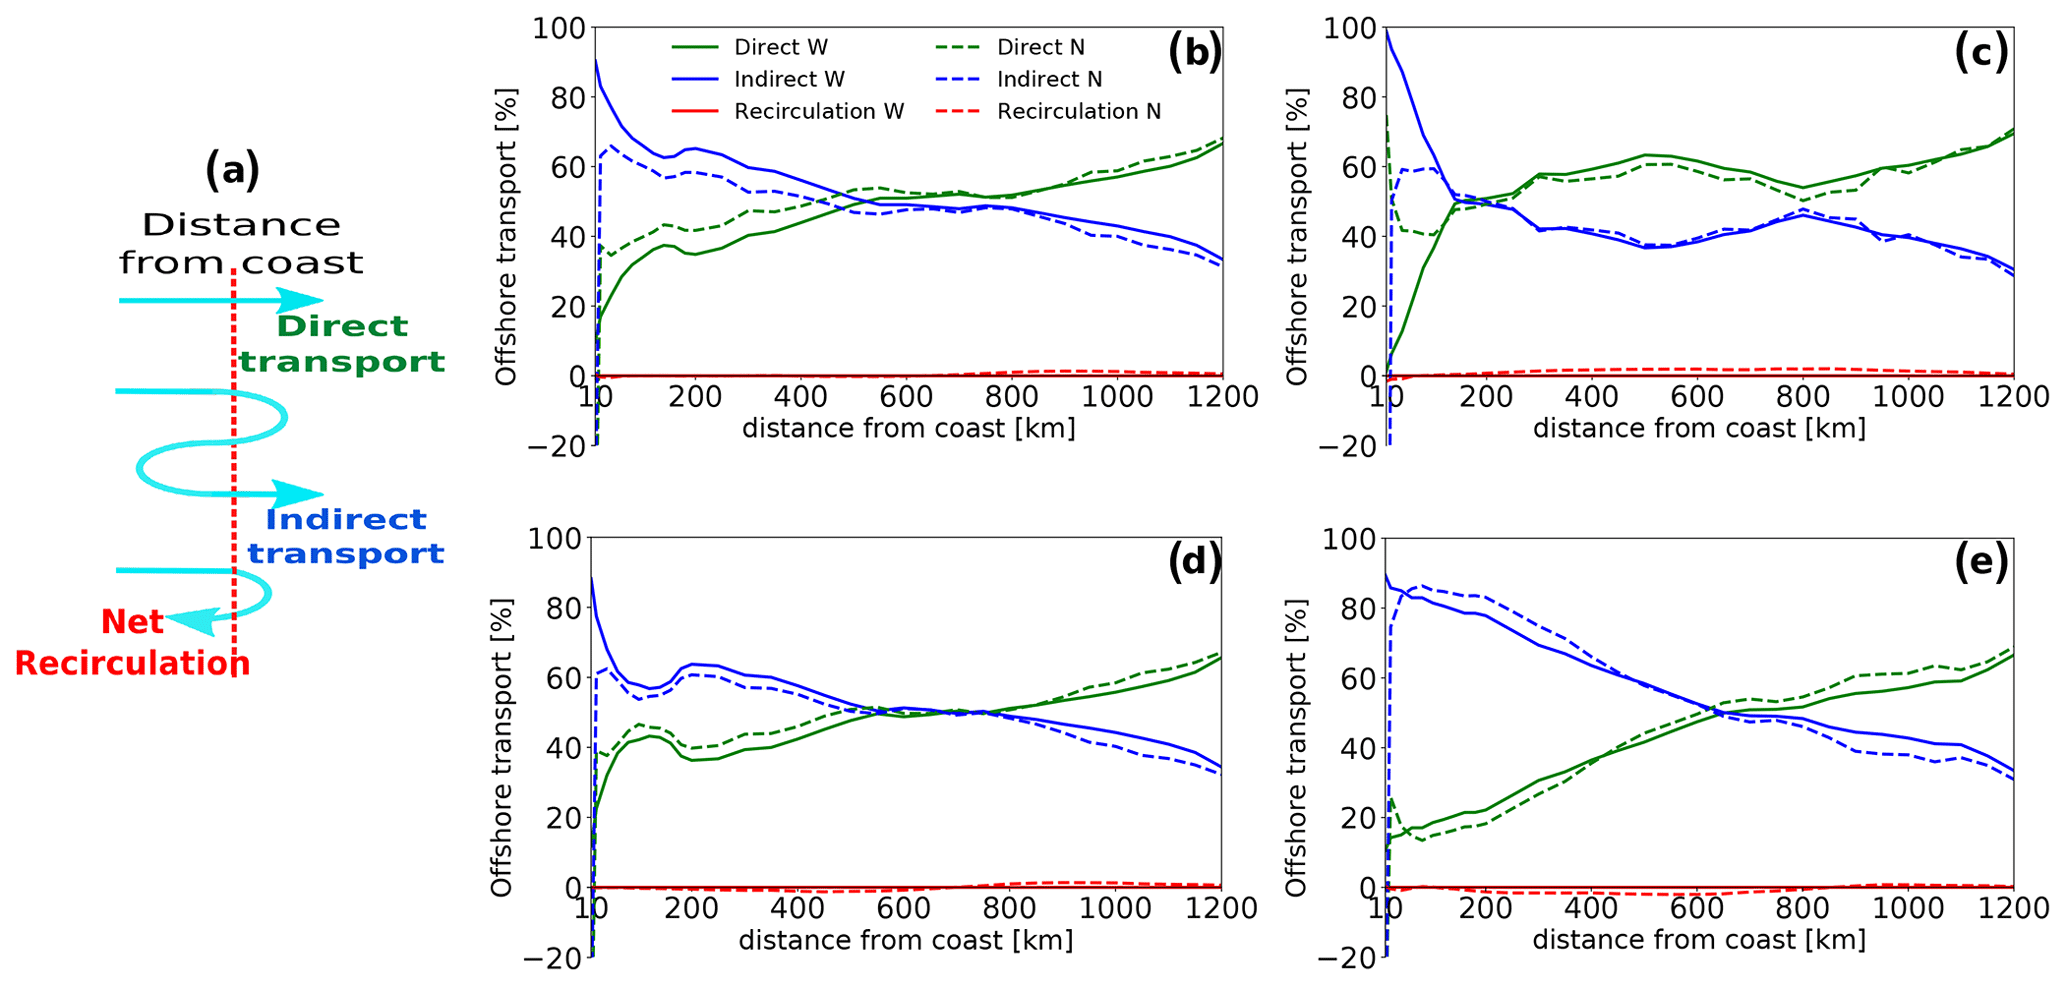
Figure 10(a) Schematic showing the three types of offshore transport trajectories. (b, c, d, e) Contribution (in %) of direct transport (green), indirect transport (blue) and net recirculation (red) to the total net offshore transport of water (solid) and nitrogen (dashed) at each distance to the coast in the entire CanCS region (b) as well as the southern (c), central (d) and northern (e) subregions. Note that the net recirculation has no contribution to net offshore water transport but contributes slightly to the net offshore transport of nitrogen.
It is worth noting that only direct and indirect transport contribute to the net offshore transport of water, while net recirculation does not (although it may slightly contribute to transport of nitrogen) (Fig. 10). The sum of direct and indirect transports adds up to give the net transport of water to each distance, while the sum of all three represents the total volume of water that has reached each distance at any point during the experiment. In the nearshore region, the meandering of the Canary Current as well as the coastal upwelling cell can cause upwelling particles to recirculate closer to the coast (Mittelstaedt and Hamann, 1981; Mittelstaedt, 1983; Estrade et al., 2008). But the leading cause of recirculation in the open ocean is the ubiquitous presence of mesoscale structures, particularly eddies (Barton and Arístegui, 2004; Mason et al., 2011, 2012; Schütte et al., 2016; Capet et al., 2017; Ndoye et al., 2017; Kounta et al., 2018). Therefore, contrasting the direct and indirect components of the transport can be used to gauge the relative importance of the mesoscale eddies and current meandering in the offshore transport.
Examining the three components of the offshore transport in the three subregions reveals that the direct and indirect components virtually explain all the transport of water and nitrogen at all latitudes and distances from the coast. Yet, important differences exist between the three subregions in terms of the relative importance of these two forms of transport (Fig. 10). For the southern subregion particles, direct transport contributes by a large share to the total transport of water and nitrogen at all distances except in the first 200 km offshore, where the indirect transport dominates. In contrast, for particles upwelled in the central and northern subregions, the direct transport has a greater share to transport only past 700 km offshore, while the indirect transport dominates closer to the coast. The relative importance of indirect transport is particularly strong between 100 and 400 km in these two subregions. For instance, at 200 km the indirect transport contributes by up to 65 % and 80 % to the total offshore transport of water in the central and northern subregions, respectively. For the transport of nitrogen, the share of the indirect transport at the same distance is 60 % and 85 % in the two subregions.
The importance of the indirect transport of upwelled waters in the central and northern subregions can be linked to the prominent role played by mesoscale eddies there. Indeed, eddies with a length scale of 100 to 300 km are known to be important at these latitudes (Mittelstaedt, 1991). These include a recurrent cyclonic eddy south of Cape Juby and the cyclonic and anticyclonic eddies entrained by the Canary Archipelago, forming the so-called Canary Eddy Corridor (CEC), which is located at 22–29∘ N (Arístegui et al., 1994; Piedeleu et al., 2009; Sangrá et al., 2009). This region of long-lived westward-propagating eddies is known to contribute strongly to the offshore transport of organic matter and carbon (Sangrá et al., 2009). Yet, the transport pathway of upwelling from the southern subregion has also been previously shown to feature significant eddy activity (Schütte et al., 2016; Capet et al., 2017; Ndoye et al., 2017; Kounta et al., 2018).
The prominence of water recirculation in the central and northern subregions – materialized by the dominance of the indirect transport – up to 600–800 km offshore is consistent with the longer cross-shore transit times characterizing these latitudes (Figs. 3 and S30). This suggests that recirculation acts to slow down the offshore transport and may explain the less efficient offshore transport of water upwelling from these regions (Fig. 4a).
The strong export of nutrients and organic matter from the CanCS to the oligotrophic open ocean fuels new production (NP) and contributes to heterotrophy there. Here we quantify this contribution in the North Atlantic Tropical Gyral (NATR) and the North Atlantic Subtropical Gyral East (NASE) provinces as defined by Longhurst (2007) (see Fig. S18). The Lagrangian approach allows for the isolating of the contribution of the upwelling particles to the transport of nitrogen into the NATR and NASE provinces, adjacent to the CanCS (see Fig. S18). We calculate the net offshore transport of nitrogen in the top 100 m at the precise boundaries between each CanCS subregion and each Longhurst province.
New production (NP) is estimated from the net primary production (NPP) and the available estimates of the f ratio (f ratio ) in the literature. Since new production and export production (EP) are numerically the same in a system in steady state (Dunne et al., 2007), we also use estimates of the e ratio (e ratio ). For NPP, we use the vertically generalized production model (VGPM) estimates, based on sea color data from 1997 to 2017, as well as a carbon-based productivity model (CbPM) by Westberry et al. (2008) to derive NPP for each province. We also use an in situ estimate of NPP for the NATR made by Tilstone et al. (2009) based on carbon-14 uptake (Table 3). We use estimates of the f ratio from Laws et al. (2000) (see their Plate 3) as well as previous estimates of the e ratio from Henson et al. (2011) and Siegel et al. (2014). The derived f-ratio values are typically low and vary from 4 % in the NATR according to Henson et al. (2011) to 15 % in the NASE following Laws et al. (2000) (Table 3).
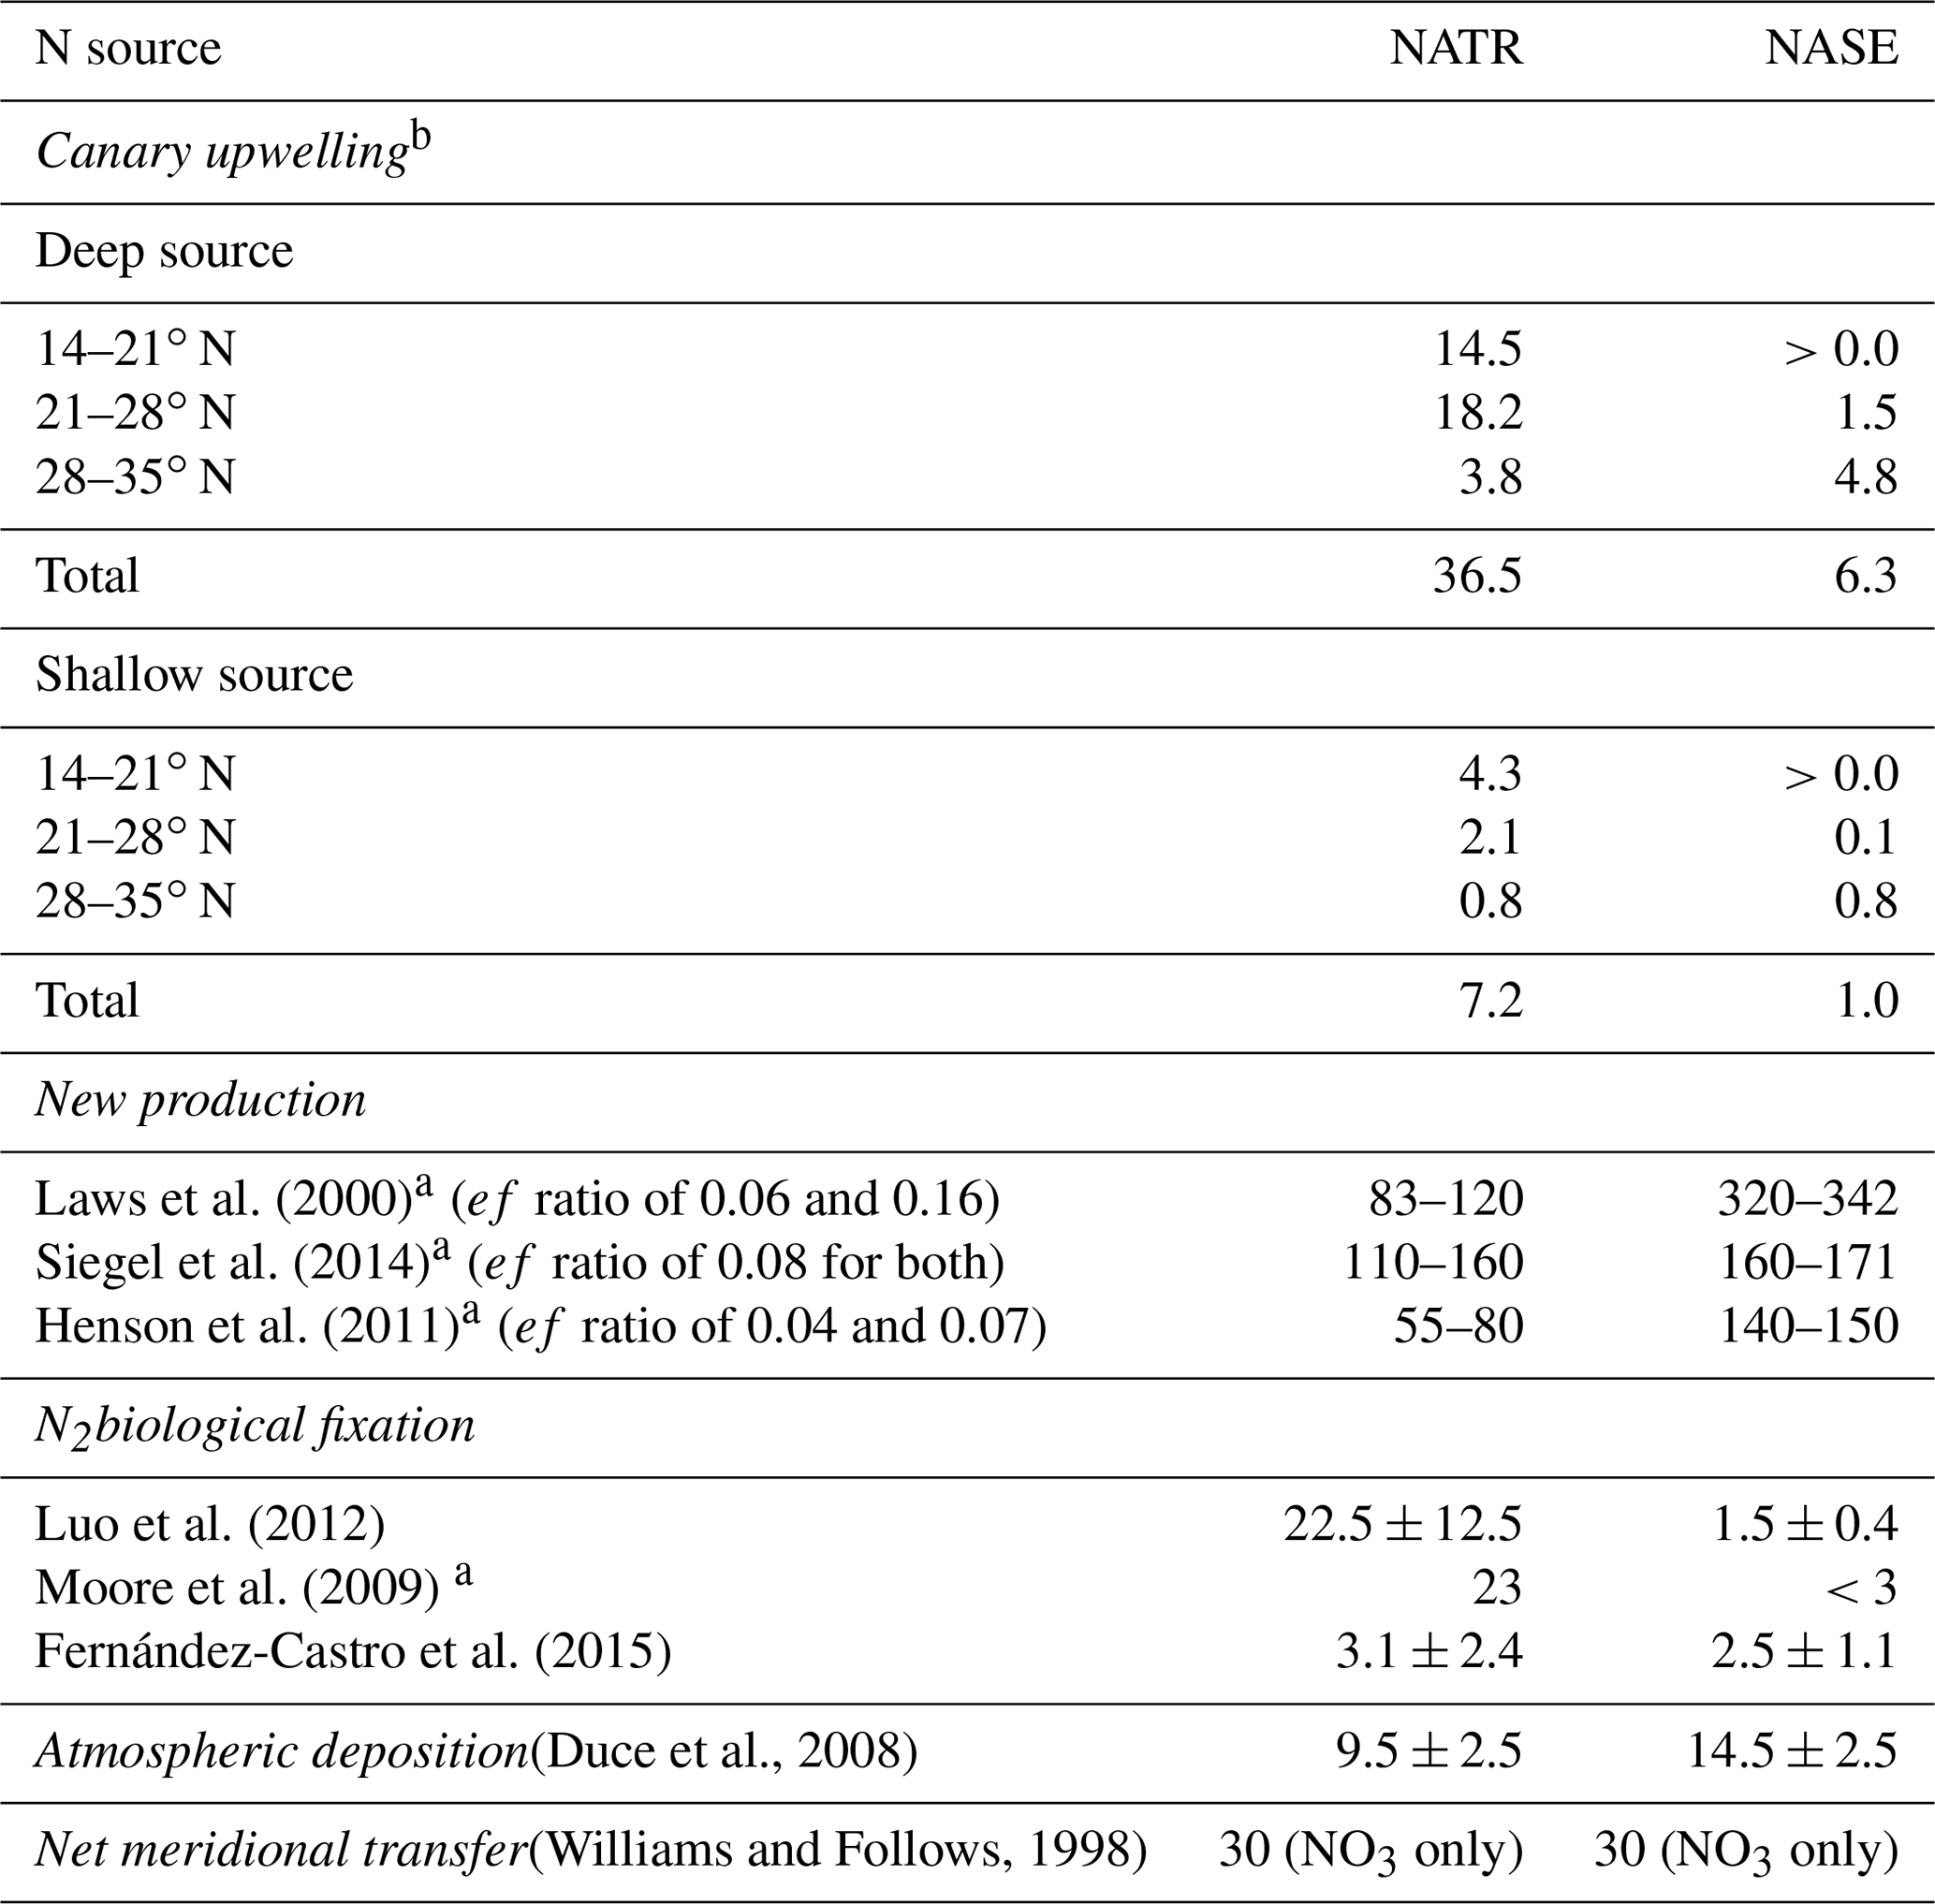
Laws et al. (2000)Siegel et al. (2014)Henson et al. (2011)Luo et al. (2012)Moore et al. (2009)Fernández-Castro et al. (2015)(Duce et al., 2008)(Williams and Follows, 1998)Table 3Nitrogen sources and sinks for the NATR and NASE provinces (in mmol N m−2 yr−1). Sources considered are the offshore transport by the Canary upwelling, the net meridional transfer of nitrogen through Ekman divergence, N2 fixation and atmospheric deposition. The only sink considered is new production (NP).
a Estimates are based on maps provided by the cited paper. b Contribution of upwelling by each subregion is calculated by adding the net amount of nitrogen upwelling particles carried to each province in the top 100 m by the end of the experiment. That is, whenever a particle enters a province within the top 100 m, the nitrogen it carries into the province is added to the particle's source subregion's contribution to the province. On the contrary, when a particle from a given subregion leaves a province within the top 100 m, the nitrogen it carries with it when it leaves the province is subtracted from the contribution of the subregion of the particle to the province.
The southern, central and northern coastal upwelling subregions in our study have total upwellings of 282.3, 200.9 and 79.2 Gmol N yr−1, respectively. A total of 563, 358 and 32 Gmol N yr−1 reach the upper 100 m of the NATR and the NASE, respectively. When normalized by the area of each province, the CanCS upwelling source corresponds to 44 and 7 mmol N m−2 yr−1 for the NATR and NASE, respectively (Table 3). Most of the upwelled nitrogen exported to the NATR originates from the central (46.5 %) and southern subregions (43 %), whereas the nitrogen upwelled in the northern subregion dominates (76.7 %) the nitrogen supplied to the NASE. Hence, the nitrogen transported (in the top 100 m) from the Canary coastal upwelling to the NATR and NASE provinces represents 27 %–79 % and 2 %–5 % of their total new production, respectively (Table 3).
Finally, the contribution of the Canary upwelling also appears significant in comparison to other major sources of new nitrogen to the oligotrophic open North Atlantic Ocean such as N2 fixation (Luo et al., 2012; Moore et al., 2009; Fernández-Castro et al., 2015), atmospheric deposition (Duce et al., 2008) and net meridional transfer through Ekman divergence (Williams and Follows, 1998). Indeed, the upwelling source seems to exceed contributions from N2 fixation, atmospheric deposition and meridional transfer in the NATR province. In the NASE province, the upwelling contribution is larger than the N2 fixation but weaker than the atmospheric deposition and the meridional transfer (Table 3).
Many previous studies reported higher estimates of POC (particulate organic carbon) offshore export in several portions of the CanCS (e.g., García-Muñoz et al., 2004, 2005; Alonso‐González et al., 2009; Santana-Falcón et al., 2016; Lovecchio et al., 2017) (more in Table S4). Our lower offshore transport estimates may at least partially result from our Lagrangian approach that focuses on coastally upwelled water only, disregarding non-upwelling waters and open-ocean upwelling. Furthermore, restricting the analysis to upwelling particles in our study limits offshore flux to near-surface waters, as most upwelled waters remain at very shallow depth (see the Supplement for more detail).
Previous model-based studies of the Benguela and California coastal upwelling systems suggest other EBUSs may also significantly contribute to the nitrogen budget of adjacent open oceans (Table S5). For instance, Gutknecht et al. (2013) found significant net offshore transport of nitrogen in the Benguela Current System (BenCS), with organic nitrogen exceeding inorganic nitrogen at far offshore distances. They estimated the contribution of the BenCS in the top 50 m amounts to 100 ± 40 mmol N m−2 yr−1 to the adjacent South Atlantic Subtropical Gyral province according to the classification by Longhurst (2007) (Gutknecht et al., 2013). This contribution, however, is likely overestimated, since results in the highly productive Walvis Bay area (22–24∘ S) were linearly extrapolated to the whole BenCS. Frischknecht et al. (2018) also found high offshore export of both organic and inorganic nitrogen from the productive central region of the California Current System (CalCS) to the open ocean as far as 500 km from the coast (Table S5). The efficiency of offshore transport of organic matter and dissolved inorganic nitrogen in the top 100 m between 100 and 500 km is almost identical between their study of the CalCS and the present study of the CanCS.
Our Lagrangian approach identified waters upwelling along the northwestern African coast and characterized the kinetics, structure and timescale of their offshore transport. Using a Lagrangian approach allowed us to assess the reach and fate of coastally upwelled nitrogen far from the coast as well as study its biogeochemical transformation along particle trajectories. Our estimate of offshore export of organic nitrogen and carbon by upwelling is lower than the estimate by Lovecchio et al. (2017), at all distances from the coast (Table S3). These differences can in particular stem from the differences in approaches (Lagrangian vs. Eulerian) and the studied parts of the CanCS (their budget is computed for the area between 9.5 and 32∘ N) that differ between the two studies. We found the offshore transport to be generally slowest in the first few hundreds of km from the coast and to increase in speed with increasing offshore distances (Fig. 3). This is particularly true for waters upwelling in the northern and the southern subregions of the CanCS. The existence of an inverse relationship between upwelling water recirculation and their cross-shore transit speeds (Fig. S30) suggests the slowdown of offshore transport in the first 300–500 km results from a larger role played by eddies that act to weaken the net offshore transport there. Previous studies have highlighted the role of eddies in contributing to organic carbon and nutrient offshore transport in EBUS (Nagai et al., 2015; Lovecchio et al., 2018). The findings of the present study reveal that enhanced water recirculation driven by intense eddy activity may reduce the efficiency of the offshore transport of water.
In the first 200 km, the offshore transport is fastest, and the water recirculation is weakest for particles that upwelled in the central CanCS subregion (Figs. 3 and S32). We show that this region is characterized by the presence of major filament-generating capes such as Cape Blanc and Cape Barbas that contribute strongly to offshore transport of water and nutrients. They act as concentrators that collect coastal water and nutrients and channel them to the open ocean, as most of the water exported (84 %) at the capes upwells non-locally. Lovecchio et al. (2018) have highlighted the role of persistent filaments in mediating more than 80 % of the offshore transport of organic carbon in the first 100 km from the coast. Here, we show that key capes along the CanCS represent hotspots of offshore transport of water and nitrogen, thanks to the intense filaments that develop around them. Our findings also highlight the importance of the alongshore transport, as most of the waters exported at capes have upwelled at latitudes far away from the location of the capes. This is consistent with the concept of the three-dimensional biological pump highlighted in previous studies, according to which strong offshore and alongshore lateral transports decouple the locations of upwelling and of biological export (Plattner et al., 2005; Lovecchio et al., 2017, 2018).
As the along-trajectories nitrogen depletion rates depend on the depth of the transport, the subduction of upwelling waters to deeper layers occurring mostly between 100 and 200 km offshore tends to affect the efficiency of the offshore transport of nitrogen. For instance, in the southern subregion, where the transport is the shallowest, the nitrogen depletion is large (because of biological uptake and sinking), thus resulting in a smaller supply of upwelled nitrogen to the North Atlantic gyre at large distances from the coast. Conversely, the northern and central subregions contribute relatively more to the open-ocean nitrogen supply due to deeper transport and weaker nitrogen depletion.
Finally, our study confirms the strong alongshore variations of the CanCS in terms of offshore transport reach and efficiency. Our results show that the offshore transport of nitrogen off the CanCS depends on many important factors, including the intensity of upwelling; the efficiency of the offshore transport, controlled by the kinetics of the transport; and the nitrogen depletion rates. In particular, factors such as eddies, filaments and alongshore transport all contribute to modulate the magnitude and reach of the water volume and nutrient content transported offshore. The complexity of these factors and their interactions explain the complexity of the offshore transport and its spatial diversity.
Yet, the study has several caveats that stem from the limitations of the experimental design or are inherent to the tools. The physical model underestimates EKE (eddy kinetic energy) in parts of the domain, including in the southernmost part. This may be in part due to the monthly climatology wind forcing we use, potentially leading to an underestimation of vertical mixing and an incomplete representation of the complex upwelling dynamics. However, our analysis shows that the model successfully captures much of the spatial and seasonal variations in upper-ocean mixing (Fig. S1) and reproduces upwelling distributions and pathways that are not inconsistent with previous findings. On the other hand, our biogeochemical model is based on nitrogen and has no representation of other potentially limiting nutrients such as iron and phosphate. Furthermore, the model lacks a representation of nitrogen fixation. Yet, previous studies indicate nitrogen to be the main limiting nutrient (e.g., Moore et al., 2013) and nitrogen fixation to be very low (Luo et al., 2012; Moreira-Coello et al., 2017) in the CanCS upwelling region. Also, the model only has one class of phytoplankton. However, the specific nature of the phytoplankton community appears to be of secondary importance, as our model reproduces quite well the mean vertical profiles of POC in different parts of the domain (Fig. S15). Therefore, we believe these limitations in the biogeochemical component of the model should not affect the study’s main conclusions.
A potentially more serious limitation stems from our Ariane-based Lagrangian analysis. First, Ariane includes resolved transport but does not explicitly take into account subgrid mixing in the computation of trajectories. This is a common problem in most Lagrangian-trajectory-based studies. We think including subgrid mixing should increase the vertical dispersion of upwelled water and nitrogen. While this may reduce the offshore transport efficiency (weaker offshore velocities at depth), it should also reduce along-trajectory nitrogen depletion. A compensation (even partial) between these two processes may lead to an overall small change in the estimated total supply of upwelled nitrogen to the open North Atlantic Ocean. Yet in contrast to water volume, tracing the transport of nitrogen is somewhat more difficult given the chemical transformations between inorganic and organic nitrogen. Yet, as has been shown also by Frischknecht et al. (2018), the Lagrangian method permits a lot of new insight into the offshore transport of nitrogen, since total nitrogen, i.e., the sum of inorganic and organic nitrogen, is conserved except for the part that is sinking. The component we lose through sinking does not affect our conclusions, since this component is lost to the ocean interior, from where it will not find its way back into the waters that are transported offshore. More important is our lack of consideration of the vertical mixing. We have good evidence that this component is relatively small. Given the relatively high spatial and temporal resolution of our velocity field, there is indeed some effective vertical mixing occurring as a result of vertical advection and resolved mesoscale and submesoscale dynamics (e.g., ageostrophic secondary circulation around fronts) that is captured by the Lagrangian experiment. This assessment is confirmed by the results of Frischknecht et al. (2018), who compared the results from an Eulerian and Lagrangian approach for the California Current System and were able to demonstrate highly consistent budgets. Moreover, if the supply of nitrogen from surrounding waters to upwelling waters due to unresolved mixing were large enough to cancel the loss due to organic matter sinking, there would be no such sharp decline in total nitrogen as a function of distance to the coast relative to that for water volume (Fig. 4). Moreover, this decline is larger for water particles originating from the southern subregion that are transported at the shallowest depths and that are subject to the strongest sinking loss (Fig. S21). This suggests that although the potential changes in nitrogen due to subgrid mixing can locally be important, they are unlikely to affect the large-scale transport estimates in a significant way.
Furthermore, our coastal upwelling sampling involves subjective choices that can in theory affect our results. For instance, the identification of upwelling waters based on the upward crossing of a constant depth (70 m) is a somewhat arbitrary choice. Some previous Lagrangian studies have used cold sea surface temperature to identify and track upwelling waters (e.g., Rivas and Samelson, 2011). However, such definitions can be misleading, as cold waters not necessarily associated with upwelling may also be sampled. In the present study, our approach is based on the use of vertical velocities to identify upwelling. More specifically, we use the crossing of the 70 m depth, as this corresponds to the average depth of the euphotic zone in the Canary coastal region. However, both upwelling depth and the depth of the euphotic zone vary in space and time. Yet, Drake et al. (2018) show that defining upwelling with varying depth criteria yields results that are also well captured by experiments that use fixed depths. Furthermore, a variable upwelling depth definition can make it difficult to distinguish between upwelling variations driven by the variability of atmospheric forcing and those caused by changes in the analysis depth.
It is worth noting that only coastal waters that originate from the open ocean are sampled, as particles are released at the western section of the coastal region only. However, we have found that only a very small amount of water, 1 % and 3 % of the total volume tracked in this study, enters the upwelling coastal region along the coast from the northern and southern boundaries, respectively. Furthermore, given the high rate of recirculation near the coast, a vast proportion of the particles that may have entered the coast alongshore, once upwelled and exported offshore, are likely to return to the coast from the open ocean, in which case they would be sampled in our particle release. Therefore, discarding particles entering the coastal ocean from the southern and northern boundaries of the upwelling strip is likely to cause only a limited error in our quantification of the offshore transport.
Due to a larger upwelling volume and a faster offshore transport in the nearshore region (up to 400 km offshore), the central CanCS subregion is responsible for the largest net offshore transport of water at any distance from the coast. Conversely, the southern CanCS is associated with the smallest offshore transport up to 800 km offshore due to a smaller volume of coastal upwelling. Yet, the southern subregion exports the highest amount of nitrogen offshore at 200 km because of a large upwelling flux of nitrogen associated with a shallower thermocline and higher subsurface nitrogen concentration. At larger distances from the coast, the offshore transport of nitrogen associated with the central subregion exceeds that originating from the southern subregion because of a lower nutrient depletion caused by a more frequent subduction of upwelled water into deeper layers where phytoplankton growth is light-limited. The analysis of nitrogen allocation along trajectories reveals that the offshore transport of organic nitrogen is generally less than half of that of inorganic nitrogen and is mostly limited to the near surface in all subregions.
The pattern of offshore transport is characterized by the presence of latitudinally alternating offshore–onshore corridors indicating a strong contribution of mesoscale eddies and filaments to the mean transport. Major capes along the CanCS that are favorable to the formation of persistent filaments are associated with an enhanced offshore export of water and nitrogen. This results primarily from an enhancement of local export of water and nitrogen non-locally upwelled (by up to a factor 4 to 9 for Cape Blanc) relative to non-cape areas. The offshore transport of nitrogen by non-local upwelling exported by all capes constitutes more than one-third of the total offshore transport of upwelling waters at all distances from the coast. All capes source the majority of water and nitrogen they export from non-local upwelling.
Finally, we found the supply of nitrogen by the Canary upwelling to the NATR and the NASE provinces amounts to 43.7 and 7.3 mmol N m−2 yr−1, respectively. This represents 53 ± 26 % and 3.5 ± 1.5 % of the total potential new production in the two provinces, respectively. The contribution of the Canary upwelling appears significant in comparison to other major sources of new nitrogen to the open North Atlantic Ocean. This emphasizes the importance of the CanCS upwelling in particular and EBUS in general as a key source of nutrients to the open ocean and the offshore transport as a mechanism of supply of these nutrients to the adjacent oligotrophic gyres. Our work thus stresses the need for improving their representation in global coarse-resolution models, as has been indicated by previous works (e.g., Large and Danabasoglu, 2006).
The data can be accessed and cited from the following DOI: https://doi.org/10.5281/zenodo.4384339 (Hailegeorgis et al., 2021).
The supplement related to this article is available online at: https://doi.org/10.5194/bg-18-303-2021-supplement.
DH and ZL designed the Lagrangian experiments and analyzed the results. DH and CR developed the Lagrangian budget code and performed the Lagrangian experiments. ZL performed the ROMS simulation and supervised the research. DH and ZL prepared the paper with contributions from all coauthors. NG contributed to the design of the study and participated in the interpretation of the results and the writing of the paper.
The authors declare that they have no conflict of interest
Computations were performed at the High Performance Computing (HPC) cluster of NYUAD, Dalma. The authors are also grateful to Michael Mehari for producing the Taylor diagrams presented in this work and thank the two reviewers for their constructive comments that helped to improve and focus the paper. The authors are grateful to Bruno Blanke and Nicolas Grima for making their Ariane code available and to the NYUAD HPC team for technical support. The authors declare that they have no competing financial interests. The model code can be accessed online (http://www.croco-ocean.org/, last access: 1 January 2018).
This research has been supported by the Center for Prototype Climate Modeling (CPCM), the New York University Abu Dhabi (NYUAD) Research Institute. NG acknowledges support by the Swiss National Science Foundation through the CALNEX project (grant no. 149384) and by the Swiss Federal Institute of Technology Zurich (ETH Zurich).
This paper was edited by Minhan Dai and reviewed by two anonymous referees.
Alonso‐González, I. J., Arístegui, J., Vilas, J. C., and Hernández‐Guerra, A.: Lateral POC transport and consumption in surface and deep waters of the Canary Current region: A box model study, Global Biogeochem. Cy., 23, , GB2007, https://doi.org/10.1029/2008GB003185, 2009. a
Àlvarez-Salgado, X. A., Arístegui, J., Barton, E. D., and Hansell, D. A.: Contribution of upwelling filaments to offshore carbon export in the subtropical Northeast Atlantic Ocean, Limnol. Oceanogr., 52, 1287–1292, https://doi.org/10.4319/lo.2007.52.3.1287, 2007. a
Arístegui, J., Sangrà, P., Hernández-León, S., Cantón, M., Hernández-Guerra, A., and Kerling, J. L.: Island-induced eddies in the Canary Islands, Deep-Sea Res., 49, 1087–1101, 1994. a
Arístegui, J., Tett, P., Hernández-Guerra, A., Basterretxea, G., Montero, M. F., Wild, K., Sangrá, P., Hernández-León, S., Canton, M., García-Braun, J. A., and Pacheco, M.: The influence of island-generated eddies on chlorophyll distribution: a study of mesoscale variation around Gran Canaria, Deep Sea Res. Pt. I, 44, 71–96, 1997.
Arístegui, J., Barton, E. D., Álvarez-Salgado, X. A., Santos, A. M. P., Figueiras, F. G., Kifani, S., Hernández-León, S., Mason, E., Machú, E., and Demarcq, H.: Sub-regional ecosystem variability in the Canary Current upwelling, Prog. Oceanogr., 83, 33–48, 2009. a, b
Auger, P.-A., Gorgues, T., Machu, E., Aumont, O., and Brehmer, P.: What drives the spatial variability of primary productivity and matter fluxes in the north-west African upwelling system? A modelling approach, Biogeosciences, 13, 6419–6440, https://doi.org/10.5194/bg-13-6419-2016, 2016. a, b
Aumont, O., Maier-Reimer, E., Blain, S., and Monfray, P.: An ecosystem model of the global ocean including Fe, Si, P colimitations, Global Biogeochem. Cy., 17, 1060, https://doi.org/10.1029/2001GB001745, 2003.
Baker, A. R., Lesworth, T., Adams, C., Jickells, T. D., and Ganzeveld, L.: Estimation of atmospheric nutrient inputs to the Atlantic Ocean from 50N to 50S based on large-scale field sampling: Fixed nitrogen and dry deposition of phosphorus, Global Biogeochem. Cy., 24, GB3006, https://doi.org/10.1029/2009GB003634, 2010.
Barnier, B., Siefridt, L., and Marchesiello, P.: Thermal forcing for a global ocean circulation model using a three-year climatology of ECMWF analyses, J. Marine Syst., 6, 363–380, 1995. a
Barton, E.: Meanders, eddies and intrusions in the thermohaline, Oceanol. Acta, 10, 267–283, 1987. a
Barton, E. D. and Arístegui, J.: The Canary Islands coastal transition zone-upwelling, eddies and filaments, Prog. Oceanogr., 62, 67–69, 2004. a
Barton, E. D.: The poleward undercurrent on the eastern boundary of the subtropical North Atlantic, in: Poleward Flows Along Eastern Ocean Boundaries, Coastal and Estuarine Studies, edited by: Neshyba, S. J., Mooers, C. N. K., Smith, R. L., and Barber, R. T., Vol. 34, Springer, New York, NY, 82–95, 1989. a, b
Barton, E., Arístegui, J., Tett, P., Canton, M., Garcia-Braun, J., Hernández-León, S., Nykjaer, L., Almeida, C., Almunia, J., Ballesteros, S., Basterretxea, G., Escanez, J., Garcia-Weill, L., Hernández-Guerra, A., LópezLaatzen, F., Molina, R., Montero, M., Navarro-Perez, E., Rodriguez, J., van Lenning, K., Vélez, H., and Wild, K.: The transition zone of the Canary Current upwelling region, Prog. Oceanogr., 41, 455–504, https://doi.org/10.1016/S0079-6611(98)00023-8, 1998.
Barton, E. D., Arístegui, J., Tett, P., and Navarro-Pérez, E.: Variability in the Canary Islands area of filament-eddy exchanges, Prog. Oceanogr., 62, 71–94, 2004. a
Basterretxea, G. and Aristegui, J.: Mesoscale variability in phytoplankton biomass distribution and photosynthetic parameters in the Canary-NW African coastal transition zone, Mar. Ecol. Prog. Ser., 197, 27–40, 2000.
Bettencourt, J. H., Rossi, V., Hernández‐García, E., Marta‐Almeida, M., and López, C.: Characterization of the structure and cross‐shore transport properties of a coastal upwelling filament using three‐dimensional finite-size Lyapunov exponents, J. Geophys. Res.-Oceans, 122, 7433–7448, 2017.
Blanke, B. and Raynaud, S.: Kinematics of the Pacific Equatorial Undercurrent: An Eulerian and Lagrangian Approach from GCM Results, J. Phys. Oceanogr., 27, 1038–1053, https://doi.org/10.1175/1520-0485(1997)027<1038:KOTPEU>2.0.CO;2, 1997. a
Bonnet, S., Caffin, M., Berthelot, H., and Moutin, T.: Hot spot of N2 fixation in the western tropical South Pacific pleads for a spatial decoupling between N2 fixation and denitrification, P. Natl. Acade. Sci., 114, 2800–2801, 2017.
Brink, K. H. and Cowles, T. J.: The coastal transition zone experiment, J. Geophys. Res., 96, 14637–14647, 1991.
Brochier, T., Mason, E., Moyano, M., Berraho, A., Colas, F., Sangrà, P., Hernández-León, S., Ettahiri, O., and Lett, C.: Ichthyoplankton transport from the African coast to the Canary Islands, J. Marine Syst., 87, 109–122, 2011. a
Bryden, H. L., Brady, E. C., and Pillsbury, R. D.: Flow through the Strait of Gibraltar, Seminario sobre la Oceanografia fisica del Estracho de Gibraltar, edited by: Almazán, J. L., Kinder, H., Bryden, H., and Parilla, G., Sociedad Española de estudios para la comunicaćion a traves del Estrecho de Gibraltar, Madrid, 166–194, 1988.
Capet, X. J., Marchesiello, P., and McWilliams, J. C.: Upwelling response to coastal wind profiles, Geophys. Res. Lett., 31, L13311, https://doi.org/10.1029/2004GL020123, 2004.
Capet, X., Estrade, P., Machu, É., Ndoye, S., Grelet, J., Lazar, A., Marié, L., Dausse, D., and Brehmer, P.: On the dynamics of the southern Senegal upwelling center: observed variability from synoptic to superinertial scales, J. Phys. Oceanogr., 47, 155–180, 2017. a, b, c, d
Carr, M.-E.: Estimation of potential productivity in Eastern Boundary Currents using remote sensing, Deep Sea Res. Pt. II, 49, 59–80, https://doi.org/10.1016/S0967-0645(01)00094-7, 2001. a
Carr, M.-E. and Kearns, E. J.: Production regimes in four Eastern Boundary Current systems, Deep-Sea Res., 50, 3199–3221, 2003. a
Chavez, F. P. and Messié, M.: A comparison of Eastern Boundary Upwelling Ecosystems, Prog. Oceanogr., 83, 80–96, https://doi.org/10.1016/j.pocean.2009.07.032, 2009. a
Cropper, T. E., Hanna, E., and Bigg, G. R.: Spatial and temporal seasonal trends in coastal upwelling off Northwest Africa, 1981–2012, Deep Sea Res. Pt I, 86, 94–111, 2014. a
da Silva, A. M., Young, C. C., and Levitus, S.: Atlas of surface marine data 1994, Vol. 3, Anomalies of heat and momentum fluxes, NOAA Atlas NESDIS, 8, 411, 1994. a
da Silva, A.M., Young, C.C. and Levitus, S., 1994. Atlas of surface marine data 1994, Vol. 4: Anomalies of fresh water fluxes, National Environmental Satellite Data and Information Service, Silver Spring, MD, USA, 1994. a
Davis, A., Di Lorenzo, E., Luo, H., Belmadani, A., Maximenko, N., Melnichenko, O., and Schneider, N.: Mechanisms for the emergence of ocean striations in the North Pacific, Geophys. Res. Lett., 41, 948–953, https://doi.org/10.1002/2013GL057956, 2014. a
Del Giorgio, P. A., Cole, J. J., and Cimbleris, A.: Respiration rates in bacteria exceed phytoplankton production in unproductive aquatic systems, Nature, 385, 148–151, 1997.
Del Giorgio, P. A. and Duarte, C. M.: Respiration in the open ocean, Nature, 420, 379–384, https://doi.org/10.1038/nature01165, 2002. a
Dentener, F., Drevet, J., Lamarque, J. F., Bey, I., Eickhout, B., Fiore, A. M., Hauglustaine, D., Horowitz, L. W., Krol, M., Kulshrestha, U. C., and Lawrence, M.: Nitrogen and sulfur deposition on regional and global scales: a multimodel evaluation, Global Biogeochem. Cy., 20, GB4003, https://doi.org/10.1029/2005GB002672, 2006.
Diaz, F. and Raimbault, P.: Nitrogen regeneration and dissolved organic nitrogen release during spring in a NW Mediterranean coast zone (Gulf of Lions): Implications for the estimation of new production, Mar. Ecol. Prog. Ser., 197, 51–65, https://doi.org/10.3354/meps197051, 2000.
Dore, J. E. and Karl, D. M.: Nitrification in the euphotic zone as a source for nitrite, nitrate and nitrous oxide at Station ALOHA, Limnol. Oceanogr., 41, 1619–1628, https://doi.org/10.4319/lo.1996.41.8.1619, 1996.
Drake, H. F., Morrison, A. K., Griffies, S. M., Sarmiento, J. L., Weijer, W., and Gray, A. R.: Lagrangian timescales of Southern Ocean upwelling in a hierarchy of model resolutions, Geophys. Res. Lett., 45, 891–898, https://doi.org/10.1002/2017GL076045, 2018. a
Duarte, C. M. and Agustí, S.: The CO2 Balance of Unproductive Aquatic Ecosystems, Science, 281, 234–236, https://doi.org/10.1126/science.281.5374.234, 1998. a, b
Duce, R. A., LaRoche, J., Altieri, K., Arrigo, K. R., Baker, A. R., Capone, D. G., Cornell, S., Dentener, F., Galloway, J., Ganeshram, R. S., and Geider, R. J.: Impacts of atmospheric anthropogenic nitrogen on the open ocean, Science, 320, 893–897, 2008. a, b
Ducklow, H. W. and McCallister, S. L.: The biogeochemistry of carbon dioxide in the coastal oceans, The Sea, 13, 269–315, 2004.
Dunne, J. P., Sarmiento, J. L., and Gnanadesikan, A.: A synthesis of global particle export from the surface ocean and cycling through the ocean interior and on the seafloor, Global Biogeochem. Cy., 21, GB4006, https://doi.org/10.1029/2006GB002907, 2007. a
Durand, M.-H., Cury, P., Mendelssohn, R., Roy, C., Bakun, A., and Pauly, D.: Global Versus Local Changes in Upwelling Systems, Orstom, Paris, France, 1998.
Emerson, S., Quay, P., Karl, D., Winn, C., Tupas, L., and Landry, M.: Experimental determination of the organic carbon flux from open-ocean surface waters, Nature, 389, 951–954, 1997.
Eppley, R. W. and Peterson, B. J.: Particulate organic matter flux and planktonic new production in the deep ocean, Nature, 282, 677–80, 1979.
Estrade, P., Marchesiello, P., De Verdière, A. C., and Roy, C.: Cross-shelf structure of coastal upwelling: A two dimensional extension of Ekman’s theory and a mechanism for inner shelf upwelling shut down, J. Mar. Res., 66, 589–616, https://doi.org/10.1357/002224008787536790, 2008. a
Fernández, C. and Raimbault, P.: Nitrogen regeneration in the NE Atlantic Ocean and its impact on seasonal new, regenerated and export production, Mar. Ecol. Prog. Ser., 337, 79–92, 2007.
Fernández-Castro, B., Mouriño-Carballido, B., Marañón, E., Chouciño, P., Gago, J., Ramírez, T., Vidal, M., Bode, A., Blasco, D., Royer, S. J., and Estrada, M.: Importance of salt fingering for new nitrogen supply in the oligotrophic ocean, Nat. Commun., 6, 1–10, 2015. a, b
Fischer, G. and Karakaş, G.: Sinking rates and ballast composition of particles in the Atlantic Ocean: implications for the organic carbon fluxes to the deep ocean, Biogeosciences, 6, 85–102, https://doi.org/10.5194/bg-6-85-2009, 2009. a
Fraile-Nuez, E., Machín, F., Vélez-Belchí, P., López-Laatzen, F., Borges, R., Benítez-Barrios, V., and Hernández-Guerra, A.: Nine years of mass transport data in the eastern boundary of the North Atlantic Subtropical Gyre, J. Geophys. Res., 115, C09009, https://doi.org/10.1029/2010JC006161, 2010.
Frischknecht, M., Münnich, M., and Gruber, N.: Origin, Transformation, and Fate: The Three‐Dimensional Biological Pump in the California Current System, J. Geophys. Res.-Oceans, 123, 7939–7962, 2018. a, b, c, d, e
Galbraith, E. D., Gnanadesikan, A., Dunne, J. P., and Hiscock, M. R.: Regional impacts of iron-light colimitation in a global biogeochemical model, Biogeosciences, 7, 1043–1064, https://doi.org/10.5194/bg-7-1043-2010, 2010.
Ganachaud, A. and Wunsch, C.: Oceanic nutrient and oxygen transports and bounds on export production during the World Ocean Circulation Experiment, Global Biogeochem. Cy., 16, 1057, https://doi.org/10.1029/2000GB001333, 2002.
García-Muñoz, M., Arístegui, J., Montero, M. F., and Barton, E. D.: Distribution and transport of organic matter along a filament-eddy system in the Canaries, NW Africa coastal transition zone region, Prog. Oceanogr., 62, 115–129, 2004. a
García-Muñoz, M., Arístegui, J., Pelegrí, J. L., Antoranz, A., Ojeda, A., and Torres, M.: Exchange of carbon by an upwelling filament off Cape Ghir (NW Africa), J. Marine Syst., 54, 83–95, 2005. a
Glessmer, M. S., Eden, C., and Oschlies, A.: Contribution of oxygen minimum zone waters to the coastal upwelling off Mauritania, Prog. Oceanogr., 83, 143–150, 2009. a
Gómez-Letona, M., Ramos, A. G., Coca, J., and Arístegui, J.: Trends in primary production in the canary current upwelling system – A regional perspective comparing remote sensing models, Front. Mar. Sci., 4, 370, https://doi.org/10.3389/fmars.2017.00370, 2017.
Gruber, N. and Sarmiento, J. L.: Large scale biogeochemical-physical interactions in elemental cycles, The Sea, 12, 337–99, 2002.
Gruber, N., Frenzel, H., Doney, S. C., Marchesiello, P., McWilliams, J. C., Moisan, J. R., Oram, J. J., Plattner, G.-K., and Stolzenbach, K. D.: Eddy-resolving simulation of plankton ecosystem dynamics in the California Current System, Deep Sea Res. Pt. I, 53, 1483–1516, https://doi.org/10.1016/j.dsr.2006.06.005, 2006. a, b, c
Gutknecht, E., Dadou, I., Marchesiello, P., Cambon, G., Le Vu, B., Sudre, J., Garçon, V., Machu, E., Rixen, T., Kock, A., Flohr, A., Paulmier, A., and Lavik, G.: Nitrogen transfers off Walvis Bay: a 3-D coupled physical/biogeochemical modeling approach in the Namibian upwelling system, Biogeosciences, 10, 4117–4135, https://doi.org/10.5194/bg-10-4117-2013, 2013. a, b
Hagen, E., Zülicke, C., and Feistel, R.: Near-surface structures in the Cape Ghir filament off Morocco, Oceanol. Acta, 19, 577–598, 1996.
Hansell, D. A.: DOC in the global ocean carbon cycle, in: Biogeochemistry of Marine Dissolved Organic Matter, edited by: Hansell, D. A. and Carlson, C. A., Academic Press, San Diego, USA, 685–715, 2002. a
Hansell, D. A. and Carlson, C. A.: Net community production of dissolved organic carbon, Global Biogeochem. Cy., 12, 443–453, https://doi.org/10.1029/98GB01928, 1998.
Henson, S. A., Sanders, R., Madsen, E., Morris, P. J., Le Moigne, F., and Quartly, G. D.: A reduced estimate of the strength of the ocean’s biological carbon pump, Geophys. Res. Lett., 38, L04606, https://doi.org/10.1029/2011GL046735, 2011. a, b, c
Hernández‐Guerra, A., Fraile‐Nuez, E., López‐Laatzen, F., Martínez, A., Parrilla, G., and Vélez‐Belchí, P.: Canary Current and North Equatorial Current from an inverse box model, J. Geophys. Res.-Oceans, 110, C12019, https://doi.org/10.1029/2005JC003032, 2005. a
Hailegeorgis, D., Lachkar, Z., Rieper, C., and Gruber, N.: A Lagrangian study of the contribution of the Canary coastal upwelling to the nitrogen budget of the open North Atlantic, Zenodo, https://doi.org/10.5281/zenodo.4384339, 2021.
Holzer, M. and Primeau, F. W.: The path‐density distribution of oceanic surface‐to‐surface transport, J. Geophys. Res.-Oceans, 113, C01018, https://doi.org/10.1029/2006JC003976, 2008.
Hyde, K., O’Reilly, J., and Oviatt, C.: Validation of SeaWiFS chlorophyll-a in Massachusetts Bay, Cont. Shelf Res., 27, 1677–1691, 2007.
Jahnke, R. A.: The global ocean flux of particulate organic carbon: areal distribution and magnitude, Global Biogeochem. Cy., 10, 71–88, 1996.
Jahnke, R. A., Reimers, C. E., and Craven, D. B.: Intensification of recycling of organic matter at the sea floor near ocean margins, Nature, 348, 50–53, 1990. a
Kämpf, J. and Chapman, P.: The Canary/Iberia Current Upwelling System, in: Upwelling Systems of the World, Springer, Cham, Switzerland, 203–250, 2016.
Klenz, T., Dengler, M., and Brandt, P.: Seasonal variability of the Mauritania Current and hydrography at 18∘ N. J. Geophys. Res.-Oceans, 123, 8122–8137, https://doi.org/10.1029/2018JC014264, 2018. a
Kounta, L., Capet, X., Jouanno, J., Kolodziejczyk, N., Sow, B., and Gaye, A. T.: A model perspective on the dynamics of the shadow zone of the eastern tropical North Atlantic – Part 1: the poleward slope currents along West Africa, Ocean Sci., 14, 971–997, https://doi.org/10.5194/os-14-971-2018, 2018. a, b, c
Lachkar, Z.: Effects of upwelling increase on ocean acidification in the California and Canary Current systems, Geophys. Res. Lett., 41, 90–95, https://doi.org/10.1002/2013GL058726, 2014.
Lachkar, Z. and Gruber, N.: What controls biological production in coastal upwelling systems? Insights from a comparative modeling study, Biogeosciences, 8, 2961–2976, https://doi.org/10.5194/bg-8-2961-2011, 2011. a
Lachkar, Z. and Gruber, N.: Response of biological production and air-sea CO2 fluxes to upwelling intensification in the California and Canary Current Systems, J. Marine Syst., 109/110, 149–160, https://doi.org/10.1016/j.jmarsys.2012.04.003, 2013.
Lachkar, Z., Smith, S., Lévy, M., and Pauluis, O.: Eddies reduce denitrification and compress habitats in the Arabian Sea, Geophys. Res. Lett., 43, 9148–9156, https://doi.org/10.1002/2016GL069876, 2016. a
Large, W. G. and Danabasoglu, G.: Attribution and Impacts of Upper-Ocean Biases in CCSM3, J. Climate, 19, 2325–2346, https://doi.org/10.1175/JCLI3740.1, 2006. a
Large, W. G., McWilliams, J. C., and Doney, S. C.: Oceanic vertical mixing: A review and a model with a nonlocal boundary layer parameterization, Rev. Geophys., 32, 363–403, 1994. a
Laws, E. A., Falkowski, P. G., Smith, W. O., Ducklow, H., and McCarthy, J. J.: Temperature effects on export production in the open ocean, Global Biogeochem. Cy., 14, 1231–1246, https://doi.org/10.1029/1999GB001229, 2000. a, b, c
Le Moigne, F. A. C., Henson, S. A., Sanders, R. J., and Madsen, E.: Global database of surface ocean particulate organic carbon export fluxes diagnosed from the 234Th technique, Earth Syst. Sci. Data, 5, 295–304, https://doi.org/10.5194/essd-5-295-2013, 2013.
Lin, J., Brunner, D., Gerbig, C., Stohl, A., Luhar, A., and Webley, P.: Lagrangian modeling of the atmosphere, Geophysical Monograph Series, American Geophysical Union, Washington DC, USA, 2012. a
Liu, K. K., Iseki, K., and Chao, S. Y.: Continental margin carbon fluxes, The changing ocean carbon cycle: a midterm synthesis of the Joint Global Ocean Flux Study, edited by: Hanson, R. B., Field, J. G., and Ducklow, H. W., Cambridge University Press, Cambridge, United Kingdom, 2000. a
Liu, K. K., Atkinson, L., Quinones, R., and Talaue-McManus, L.: Biogeochemistry of Continental Margins in a global Context, in: Carbon and Nutrient Fluxes in Continental Margins, edited by: Liu, K.-K., Atkinson, L., Quiñones, R., Talaue-McManus, L., Springer, Berlin, Heidelberg, 2–24, https://doi.org/10.1007/978-3-540-92735-8, 2010. a, b, c
Longhurst, A. R.: Ecological Geography of the Sea, Academic Press, San Diego, USA, 2007. a, b, c
Lovecchio, E., Gruber, N., Münnich, M., and Lachkar, Z.: On the long-range offshore transport of organic carbon from the Canary Upwelling System to the open North Atlantic, Biogeosciences, 14, 3337–3369, https://doi.org/10.5194/bg-14-3337-2017, 2017. a, b, c, d, e, f, g, h, i, j, k, l, m, n
Lovecchio, E., Gruber, N., and Münnich, M.: Mesoscale contribution to the long-range offshore transport of organic carbon from the Canary Upwelling System to the open North Atlantic, Biogeosciences, 15, 5061–5091, https://doi.org/10.5194/bg-15-5061-2018, 2018. a, b, c, d, e, f, g, h, i, j, k
Lozier, S. M., Owens, S. B., and Curry, R. G.: The climatology of the North Atlantic, Prog. Oceanogr., 36, 1–44, 1995.
Lumpkin, R. and Johnson, G. C.: Global ocean surface velocities from drifters: Mean, variance, El Niño-Southern Oscillation response, and seasonal cycle, J. Geophys. Res.-Oceans, 118, 2992–3006, 2013.
Luo, Y.-W., Doney, S. C., Anderson, L. A., Benavides, M., Berman-Frank, I., Bode, A., Bonnet, S., Boström, K. H., Böttjer, D., Capone, D. G., Carpenter, E. J., Chen, Y. L., Church, M. J., Dore, J. E., Falcón, L. I., Fernández, A., Foster, R. A., Furuya, K., Gómez, F., Gundersen, K., Hynes, A. M., Karl, D. M., Kitajima, S., Langlois, R. J., LaRoche, J., Letelier, R. M., Marañón, E., McGillicuddy Jr., D. J., Moisander, P. H., Moore, C. M., Mouriño-Carballido, B., Mulholland, M. R., Needoba, J. A., Orcutt, K. M., Poulton, A. J., Rahav, E., Raimbault, P., Rees, A. P., Riemann, L., Shiozaki, T., Subramaniam, A., Tyrrell, T., Turk-Kubo, K. A., Varela, M., Villareal, T. A., Webb, E. A., White, A. E., Wu, J., and Zehr, J. P.: Database of diazotrophs in global ocean: abundance, biomass and nitrogen fixation rates, Earth Syst. Sci. Data, 4, 47–73, https://doi.org/10.5194/essd-4-47-2012, 2012. a, b, c
Machín, F., Pelegrí, J. L., Marrero-Díaz, A., Laiz, I., and Ratsimandresy, A. W.: Near-surface circulation in the southern Gulf of Cádiz, Deep-Sea Res., 53, 1161–1181, 2006.
Mahaffey, C., Williams, R. G., Wolff, G. A., and Anderson, W. T.: Physical supply of nitrogen to phytoplankton in the Atlantic Ocean, Global Biogeochem. Cy., 18, GB1034, https://doi.org/10.1029/2003GB002129, 2004.
Marchesiello, P., McWilliams, J. C., and Shchepetkin, A.: Equilibrium Structure and Dynamics of the California Current System, J. Phys. Oceanogr., 33, 753–783, https://doi.org/10.1175/1520-0485(2003)33<753:ESADOT>2.0.CO;2, 2003.
Marchesiello, P., Debreu, L., and Couvelard, X.: Spurious diapycnal mixing in terrain-following coordinate models: The problem and a solution, Ocean Model., 26, 156–169, 2009. a
Martel, F. and Wunsch, C.: The North Atlantic circulation in the early 1980s – An estimate from inversion of a finite-difference model, J. Phys. Oceanogr., 23, 898–924, 1993.
Mason, E., Colas, F., Molemaker, J., Shchepetkin, A. F., Troupin, C., McWilliams, J. C., and Sangrà, P.: Seasonal variability of the Canary Current: a numerical study, J. Geophys. Res., 116, C06001, https://doi.org/10.1029/2010JC006665, 2011. a
Mason, E., Colas, F., and Pelegrí, J. L.: A Lagrangian study tracing water parcel origins in the Canary Upwelling System, Sci. Mar., 76, 79–94, 2012. a, b, c
Meunier, T., Rossi, V., Morel, Y., and Carton, X.: Influence of bottom topography on an upwelling current: Generation of long trapped filaments, Ocean Model., 35, 277–303, 2010. a, b, c
Mittelstaedt, E.: The upwelling area off Northwest Africa – A description of phenomena related to coastal upwelling, Prog. Oceanogr., 12, 307–331, https://doi.org/10.1016/0079-6611(83)90012-5, 1983. a
Mittelstaedt, E.: The ocean boundary along the northwest African coast: Circulation and oceanographic properties at the sea surface, Prog. Oceanogr., 26, 307–355, 1991. a
Mittelstaedt, E. and Hamann, I.: The coastal circulation off Mauritania, Deutsche Hydrographische Zeitschrift, 34, 81–118, https://doi.org/10.1007/BF02226483, 1981. a
Moore, J. K., Doney, S. C., and Lindsay, K.: Upper ocean ecosystem dynamics and iron cycling in a global three-dimensional model, Global Biogeochem. Cy., 18, GB4028, https://doi.org/10.1029/2004GB002220, 2004.
Moore, C. M., Mills, M. M., Achterberg, E. P., Geider, R. J., LaRoche, J., Lucas, M. I., McDonagh, E. L., Pan, X., Poulton, A. J., Rijkenberg, M. J., and Suggett, D. J.: Large-scale distribution of Atlantic nitrogen fixation controlled by iron availability, Nat. Geosci., 2, 867–871, 2009. a, b
Moore, C. M., Mills, M. M., Arrigo, K. R., Berman-Frank, I., Bopp, L., Boyd, P. W., Galbraith, E. D., Geider, R. J., Guieu, C., Jaccard, S. L., and Jickells, T. D.: Processes and patterns of oceanic nutrient limitation, Nat. Geosci., 6, 701–710, 2013. a
Moreira-Coello, V., Mouriño-Carballido, B., Marañón, E., Fernández-Carrera, A., Bode, A., and Varela, M. M.: Biological N2 fixation in the upwelling region off NW Iberia: magnitude, relevance, and players, Front. Mar. Sci., 4, 303, 303, https://doi.org/10.3389/fmars.2017.00303, 2017. a
Muller‐Karger, F. E., Varela, R., Thunell, R., Luerssen, R., Hu, C., and Walsh, J. J.: The importance of continental margins in the global carbon cycle, Geophys. Res. Lett., 32, L01602, https://doi.org/10.1029/2004GL021346, 2005. a
Nagai, T., Gruber, N., Frenzel, H., Lachkar, Z., McWilliams, J. C., and Plattner, G. K.: Dominant role of eddies and filaments in the offshore transport of carbon and nutrients in the C alifornia C urrent System, J. Geophys. Res.-Oceans, 120, 5318–5341, 2015. a
Ndoye, S., Capet, X., Estrade, P., Sow, B., Machu, E., Brochier, T., Döring, J., and Brehmer, P.: Dynamics of a “low-enrichment high-retention” upwelling center over the southern Senegal shelf, Geophys. Res. Lett., 44, 5034–5043, https://doi.org/10.1002/2017GL072789, 2017. a, b, c
Pastor, M. V., Palter, J. B., Pelegrí, J. L., and Dunne, J. P.: Physical drivers of interannual chlorophyll variability in the eastern subtropical North Atlantic, J. Geophys. Res.-Oceans, 118, 3871–3886, 2013. a, b
Pauly, D. and Christensen, V.: Primary production required to sustain global fisheries, Nature, 374, 255–257, 1995. a
Pelegri, J. L. and Benazzouz, A.: Coastal upwelling off North‐West Africa, in: Oceanographic and biological features in the Canary Current Large Marine Ecosystem, edited by: Valdés, L. and Déniz‐González, I., IOC‐UNESCO, Paris, IOC Technical Series, No. 115, 93–103, http://hdl.handle.net/1834/9180 (last access: 1 January 2018), 2015. a, b, c, d
Pelegri, J. L., Arístegui, J., Cana, L., González, M., Hernández-Guerra, A., Hernández-León, S., Marrero-Díaz, A., Montero, M. F., Sangrá, P., and Santana-Casiano, M.: Coupling between the open ocean and the coastal upwelling region off Northwest Africa: Water recirculation and offshore pumping of organic matter, J. Marine Syst., 54, 3–37, 2005a. a
Pelegri, J. L., Marrero-Dı́az, A., Ratsimandresy, A., Antoranz, A., Cisneros-Aguirre, J., Gordo, C., Grisolı́a, D., Hernández-Guerra, A., Láiz, I., Martı́nez, A., Parrilla1, G., Pérez-Rodrı́guez, P., Rodrı́guez-Santana, A., and Sangrà, P.: Hydrographic cruises off northwest Africa: the Canary Current and the Cape Ghir region, J. Marine Syst., 54, 39–63, 2005b. a
Pelegri, J. L., Marrero-Díaz, A., and Ratsimandresy, A. W.: Nutrient irrigation of the North Atlantic, Prog. Oceanogr., 70, 366–406, 2006. a, b, c
Peliz, Á., Santos, A. M. P., Oliveira, P. B., and Dubert, J.: Extreme cross‐shelf transport induced by eddy interactions southwest of Iberia in winter 2001, Geophys. Res. Lett., 31, L08301, https://doi.org/10.1029/2004GL019618, 2004.
Peña‐Izquierdo, J., van Sebille, E., Pelegrí, J. L., Sprintall, J., Mason, E., Llanillo, P. J., and Machín, F.: Water mass pathways to the North Atlantic oxygen minimum zone, J. Geophys. Res.-Oceans, 120, 3350–3372, 2015. a
Piedeleu, M., Sangrà, P., Sánchez-Vidal, A., Fabrés, J., Gordo, C., and Calafat, A.: An observational study of oceanic eddy generation mechanisms by tall deep-water islands (Gran Canaria), Geophys. Res. Lett., 36, L14605, https://doi.org/10.1029/2008GL037010, 2009. a
Plattner, G. K., Gruber, N., Frenzel, H., and McWilliams, J. C.: Decoupling marine export production from new production, Geophys. Res. Lett., 32, L11612, https://doi.org/10.1029/2005GL022660, 2005. a
Price, J. F., Baringer, M. O. N., Lueck, R. G., Johnson, G. C., Ambar, I., Parrilla, G., Cantos, A., Kennelly, M. A., and Sanford, T. B.: Mediterranean outflow mixing and dynamics, Science, 259, 1277–1282, 1993.
Risien, C. M. and Chelton, D. B.: A global climatology of surface wind and wind stress fields from eight years of QuikSCAT scatterometer data, J. Phys. Oceanogr., 38, 2379–2413, 2008. a
Rivas, D. and Samelson, R. M.: A numerical modeling study of the upwelling source waters along the Oregon coast during 2005, J. Phys. Oceanogr., 41, 88–112, 2011. a
Rykaczewski, R. R., Checkley Jr., D. M.: Influence of ocean winds on the pelagic ecosystem in upwelling regions, Proc. Natl. Acad. Sci, 105, 1965–1970, 2008.
Sangrà, P., Pascual, A., Rodríguez-Santana, Á., Machín, F., Mason, E., McWilliams, J. C., Pelegrí, J. L., Dong, C., Rubio, A., Arístegui, J., and Marrero-Díaz, Á.: The Canary Eddy Corridor: A major pathway for long-lived eddies in the subtropical North Atlantic, Deep Sea Res. Pt. I, 56, 2100–2114, 2009. a, b
Santana-Falcón, Y., Benavides, M., Sangrà, P., Mason, E., Barton, E. D., Orbi, A., and Arístegui, J.: Coastal-offshore exchange of organic matter across the Cape Ghir filament (NW Africa) during moderate upwelling, J. Marine Syst., 154, 233–242, 2016. a
Sarmiento, J. L., Herbert, T., and Toggweiler, J. R.: Mediterranean nutrient balance and episodes of anoxia, Global Biogeochem. Cy., 2, 427–444, 1988.
Schlitzer, R.: Export production in the equatorial and North Pacific derived from dissolved oxygen, nutrient and carbon data, J. Oceanogr., 60, 53–62, https://doi.org/10.1023/B:JOCE.0000038318.38916.e6, 2004.
Schollaert, S. E., Yoder, J. A., O’Reilly, J. E., and Westphal, D. L.: Influence of dust and sulfate aerosols on ocean color spectra and chlorophyll a concentrations derived from SeaWiFS off the US east coast, J. Geophys. Res., 108, 1–13, https://doi.org/10.1029/2000JC000555, 2003.
Schütte, F., Brandt, P., and Karstensen, J.: Occurrence and characteristics of mesoscale eddies in the tropical northeastern Atlantic Ocean, Ocean Sci., 12, 663–685, https://doi.org/10.5194/os-12-663-2016, 2016. a, b, c
Shchepetkin, A. F. and McWilliams, J. C.: The regional oceanic modeling system (ROMS): a split-explicit, free-surface, topography-following-coordinate oceanic model, Ocean Model., 9, 347–404, 2005. a
Shigemitsu, M., Okunishi, T., Nishioka, J., Sumata, H., Hashioka, T., Aita, M. N., Smith, S. L., Yoshie, N., Okada, N., and Yamanaka, Y.: Development of a one-dimensional ecosystem model including the iron cycle applied to the Oyashio region, western subarctic Pacific, J. Geophys. Res.-Oceans, 117, c06021, https://doi.org/10.1029/2011JC007689, 2012.
Siegel, D. A., Buesseler, K. O., Doney, S. C., Sailley, S. F., Behrenfeld, M. J., and Boyd, P. W.: Global assessment of ocean carbon export by combining satellite observations and food‐web models, Global Biogeochem. Cy., 28, 181–196, 2014. a, b
Smith, S. and Hollibaugh, J. T.: Coastal Metabolism and the Oceanic Organic Carbon Balance, Rev. Geophys., 31, 75–89, https://doi.org/10.1029/92RG02584, 1993. a, b
Smith, W. H. and Sandwell, D. T.: Global sea floor topography from satellite altimetry and ship depth soundings, Science, 277, 1956–1962, 1997. a
Smyth, T., Quartly, G., Jackson, T., Tarran, G., Woodward, M., Harris, C., Gallienne, C., Thomas, R., Airs, R., Cummings, D., and Brewin, R.: Determining Atlantic Ocean province contrasts and variations, Prog. Oceanogr., 158, 19–40, 2017.
Stramma, L.: Geostrophic transport in the warm water sphere of the eastern subtropical North Atlantic, J. Mar. Res., 42, 537–558, 1984.
Taylor, K. E.: Summarizing multiple aspects of model performance in a single diagram, J. Geophys. Res.-Atmos., 106, 7183–7192, 2001.
Tilstone, G., Smyth, T., Poulton, A., and Hutson, R.: Measured and remotely sensed estimates of primary production in the Atlantic Ocean from 1998 to 2005, Deep Sea Res. Pt II, 56, 918–930, 2009. a
Troupin, C., Mason, E., Beckers, J. M. and Sangrà, P.: Generation of the Cape Ghir upwelling filament: A numerical study, Ocean Model., 41, 1–15, 2012. a, b, c, d
Van Camp, L., Nykjaer, L., Mittelstaedt, E., and Schlittenhardt, P.: Upwelling and boundary circulation off northwest Africa as depicted by infrared and visible satellite observations, Prog. Oceanogr., 26, 357–402, 1991. a
Van Sebille, E., Griffies, S. M., Abernathey, R., Adams, T. P., Berloff, P., Biastoch, A., Blanke, B., Chassignet, E. P., Cheng, Y., Cotter, C. J., and Deleersnijder, E.: Lagrangian ocean analysis: Fundamentals and practices, Ocean Model., 121, 49–75, 2018. a
Varela, M., Bode, A., Fernandez, E., Gonzalez, N., Kitidis, V., and Woodward, E. M. S.: Nitrogen uptake and dissolved organic nitrogen release in planktonic communities characterised by phytoplankton size-structure in the Central Atlantic Ocean, Deep Sea Res. Pt I, 52, 1637–1661, 2005.
Walsh, J. J.: Importance of Continental Margins in the Marine Biogeochemical Cycling of Carbon and Nitrogen, Nature, 350, 53–55, https://doi.org/10.1038/350053a0, 1991. a, b
Westberry, T., Behrenfeld, M. J., Siegel, D. A., and Boss, E.: Carbon-based primary productivity modeling with vertically resolved photoacclimation, Global Biogeochem. Cy., 22, GB2024, https://doi.org/10.1029/2007GB003078, 2008. a
Williams, R. G. and Follows, M. J.: The Ekman transfer of nutrients and maintenance of new production over the North Atlantic, Deep Sea Res. Pt. I, 45, 461–489, 1998. a, b
Wollast, R.: Evaluation and comparison of the global carbon cycle in the coastal zone and in the open ocean, The Sea, 10, 213–252, 1998. a
Yool, A., Martin, A. P., Fernandez, C., and Clark, D. R.: The significance of nitrification for oceanic new production, Nature, 447, 999–1002, https://doi.org/10.1038/nature05885, 2007.
- Abstract
- Introduction
- Methods
- Upwelling patterns
- Offshore transport
- Mechanisms of transport
- Potential contribution to the open-ocean nitrogen budget
- Comparison with previous studies
- Implications and caveats
- Summary and conclusions
- Data availability
- Author contributions
- Competing interests
- Acknowledgements
- Financial support
- Review statement
- References
- Supplement