the Creative Commons Attribution 4.0 License.
the Creative Commons Attribution 4.0 License.
 | 15 Jan 2021
Denitrification by benthic foraminifera and their contribution to N-loss from a fjord environment
Constance Choquel
Emmanuelle Geslin
Edouard Metzger
Helena L. Filipsson
Nils Risgaard-Petersen
Patrick Launeau
Manuel Giraud
Thierry Jauffrais
Bruno Jesus
Aurélia Mouret
Oxygen and nitrate availabilities impact the marine nitrogen cycle at a range of spatial and temporal scales. Here, we demonstrate the impact of denitrifying foraminifera on the nitrogen cycle at two oxygen and nitrate contrasting stations in a fjord environment (Gullmar Fjord, Sweden). Denitrification by benthic foraminifera was determined through the combination of specific density counting per microhabitat and specific nitrate respiration rates obtained through incubation experiments using N2O microsensors. Benthic nitrate removal was calculated from submillimeter chemical gradients extracted from 2D porewater images of the porewater nitrate concentration. These were acquired by combining the DET technique (diffusive equilibrium in thin film) with chemical colorimetry and hyperspectral imagery. Sediments with high nitrate concentrations in the porewater and oxygenated overlying water were dominated by the non-indigenous species (NIS) Nonionella sp. T1. Denitrification by this species could account for 50 %–100 % of the nitrate loss estimated from the nitrate gradients. In contrast sediments below hypoxic bottom waters had low inventories of porewater nitrate, and denitrifying foraminifera were rare. Their contribution to benthic nitrate removal was negligible (< 5 %). Our study showed that benthic foraminifera can be a major contributor to nitrogen mitigation in oxic coastal ecosystems and should be included in ecological and diagenetic models aiming to understand biogeochemical cycles coupled to nitrogen.
- Article
(3970 KB) - Full-text XML
-
Supplement
(332 KB) - BibTeX
- EndNote


Hypoxic water (i.e., [O2] < 63 µmol L−1; Diaz et al., 2008; Breitburg et al., 2018) occurs frequently in bottom waters of shallow coastal seas, due to remineralization of organic matter and water stratification. Hypoxia may have large ecological effects (Levin et al., 2009; Rabalais et al., 2010; Zhang et al., 2010), such as an increase in fauna mortality (Stachowitsch et al., 1984; Diaz et al., 2001). However, certain microorganisms, e.g., bacteria and foraminifera, can perform denitrification by respiring nitrate (Risgaard-Petersen et al., 2006) and thereby survive in depleted oxygen environments.
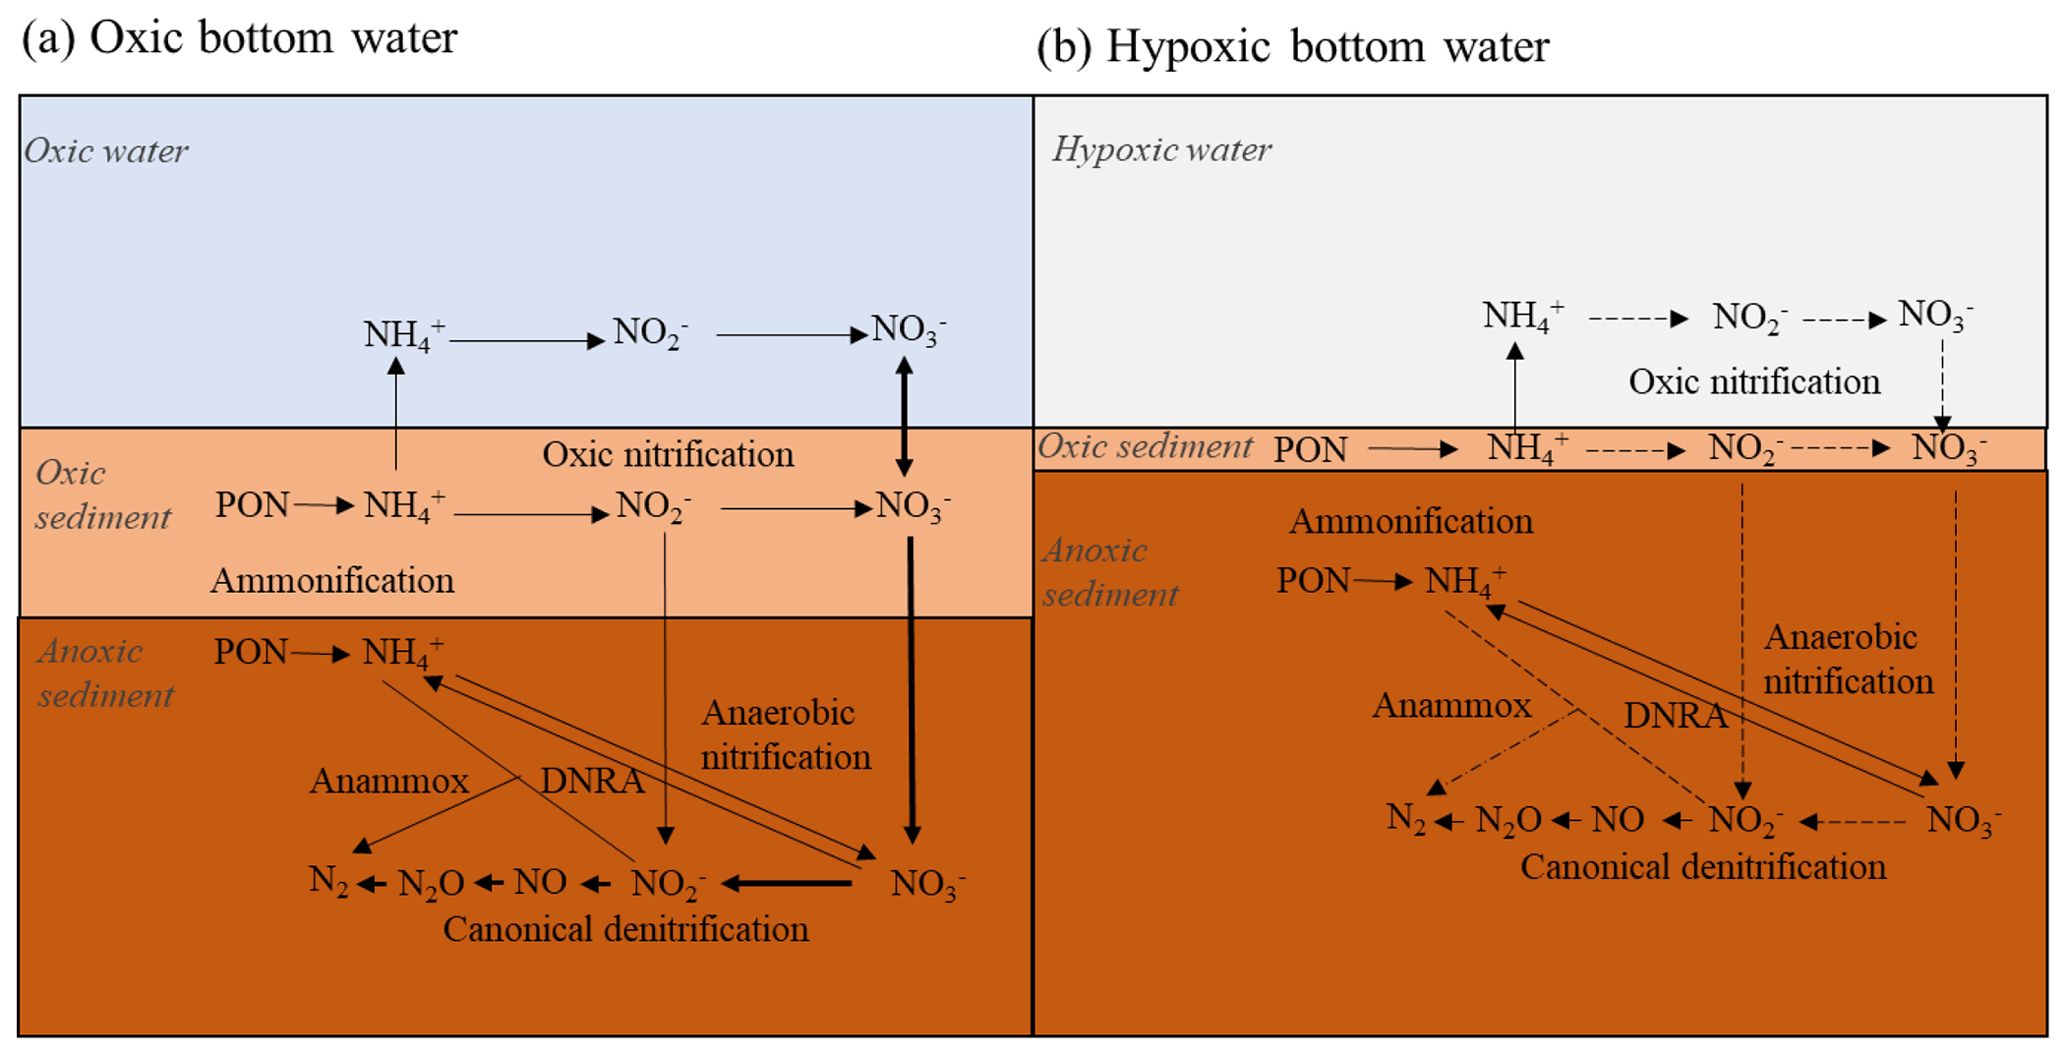
Figure 1Simplified nitrogen cycling in marine sediments when the bottom water is oxic (a) and hypoxic (b). Chemical formulae: PON (particulate organic nitrogen), (ammonium), (nitrate), (nitrite), NO (nitrogen oxide), N2O (nitrous oxide) and N2 (nitrogen). The bold (dotted) arrows indicate reactions advantaged (reduced) by oxygen and nitrate presence (depletion). See text for more details. Modified from Jantti and Hietanen (2012).
The effects of decreasing dissolved oxygen availability at spatial and temporal scales will impact biogeochemical cycles such as the nitrogen cycle (Childs et al., 2002; Kemp et al., 2005; Conley et al., 2007; Diaz et al., 2008; Neubacher et al., 2013; Breitburg et al., 2018). The nitrogen cycle in marine sediments is a perpetual balance between nitrogen inputs (e.g., terrestrial runoff, atmospheric precipitations) and outputs (e.g., denitrification from sediment and water column) (Galloway et al., 2004; Sigman et al., 2009). In most semi-enclosed marine environments such as the Baltic Sea, the nitrogen loss through benthic denitrification exceeds the inputs of nitrogen through nitrogen fixation. These nitrogen sink regions of the ocean are mostly associated with anoxic regions (Gruber and Sarmiento, 1997).
At oxic bottom-water conditions (Fig. 1a), ammonium () produced from remineralization of particulate organic nitrogen (PON) in sediments, diffuses toward the oxic-sediment–superficial layer and through the sediment–water interface (SWI). Nitrification is an aerobic process which converts to nitrate () in the oxic sediment and in the oxic water column (Rysgaard et al., 1994; Thamdrup and Dalsgaard, 2008). Total denitrification, the sum of “canonical denitrification” ( → → NO → N2O → N2) and anammox, is an anaerobic process that converts or to N gases, e.g., N2 (Brandes et al., 2007, and references within), generating N removal from the environment. The process typically occurs in sediment layers where oxygen is scarce (i.e., < 5 µmol L−1; Devol et al., 2008) and is the dominant process of nitrate reduction in coastal marine sediments (Thamdrup and Dalsgaard, 2008; Herbert, 1999). Denitrification depends on the nitrate transported from the water column and adjacent sedimentary nitrification zones. Nitrification and denitrification are thereby strongly coupled (Kemp et al., 1990; Cornwell et al., 1999). This dependency on nitrification can imply a reduction in denitrification rates as bottom water turns hypoxic (Fig. 1b), since nitrification rates are reduced as nitrification cannot proceed under low oxygen concentrations (∼ 0 µmol L−1; Rysgaard et al., 1994; Mortimer et al., 2004). The exception, however, is anoxic nitrification occurring through secondary reactions with oxidation by Mn and Fe oxides (Luther et al., 1997; Mortimer et al., 2004). In reduced sediment, dissimilatory nitrate reduction to ammonium (DNRA) can also contribute to nitrate depletion leading to conversion into instead of nitrogen (N2) (Christensen et al., 2000) and compete denitrification.
Benthic foraminifera were the first marine eukaryotes found to perform complete denitrification (Risgaard-Petersen et al., 2006), but not all foraminifera species can denitrify (Piña-Ochoa et al., 2010). Denitrifying foraminifera species are defined in our study as species able to perform denitrification proved by denitrification rate measurements. The denitrifying species have a facultative anaerobic metabolism and store nitrate in their cells, which can be used for denitrification. Nonionella cf. stella (Charrieau et al., 2019, and references therein) and Globobulimina turgida were identified as the first denitrifying foraminifera species (Risgaard-Petersen et al., 2006), but currently, 19 denitrifying species within nine genera are known (Glock et al., 2019). Their cell-specific rate ranges from 7 ± 1 to 2241 ± 1825 (Glock et al., 2019), and the contribution of benthic foraminiferal communities to benthic denitrification lies in the range from 1 % to 90 % (Kamp et al., 2015, Dale et al., 2016; Xu et al., 2017).
Recently, a non-indigenous and suspected invasive Nonionella stella morphotype: Nonionella sp. T1 was described in the North Sea region (Deldicq et al., 2019) and also reported from the Gullmar Fjord (Sweden) (< 5 %; Polovodova Asteman and Schönfeld, 2015). The genus Nonionella is potentially capable to denitrify as demonstrated for Nonionella cf. stella by Risgaard-Petersen et al. (2006). However, the non-indigenous species (NIS) Nonionella sp. T1 morphotype differs both morphologically and genetically from Nonionella stella specimens sampled previously at other localities, such as the Santa Barbara Basin (California, USA) (Charrieau et al., 2018) and the Kattegat and Oslo Fjord (Norway) (Deldicq et al., 2019). As a consequence, the denitrification capacity of the NIS Nonionella sp. T1 is unclear.
In the present study, we investigate if the suspected invasion of the NIS Nonionella sp. T1 has any implication for the nitrogen cycle in sections of the Gullmar Fjord (Sweden) that is subjected to hypoxic events. Several denitrifying foraminifera species are present in the Gullmar Fjord sediments: Globobulimina turgida (Risgaard-Petersen et al., 2006), Globobulimina auriculata (Woehle et al., 2018), Stainforthia fusiformis and Bolivina pseudopunctata (Gustafsson and Nordberg, 2001; Filipsson and Nordberg, 2004). The denitrification capacity of the last two species in the Gullmar Fjord is indicative from direct measurement on affiliated species sampled at the coast of Peru, Bay of Biscay (France) and Santa Barbara Basin (Glock et al., 2019; Piña-Ochoa et al., 2010; Bernhard et al., 2012). However, several species, which apparently lack the ability to denitrify but are able to survive anoxia, are also present in the sediments of the fjord. These include Bulimina marginata, Cassidulina laevigata, Hyalinea balthica, Leptohalysis scotti, Liebusella goesi, Nonionellina labradorica and Textularia earlandi. In the context of ecosystem function and service, it is therefore of interest to understand whether the NIS Nonionella sp. T1 can denitrify – and thereby if its invasion into the Gullmar Fjord maintains (or elevates) the denitrification capacity of the overall foraminifera community and thus the sediment – or, alternatively, if the organism shares a metabolism similar to the non-denitrifying specimens above. This would have the possible consequence that the suspected invasion of NIS Nonionella sp. T1 implies reduced contribution of foraminifera-based denitrification to the loss of N from the fjord.
Estimates of foraminiferal contribution to benthic denitrification are limited by the high spatial and temporal variability of sediment geochemistry and distribution of denitrifying foraminifera. Marine sediments often include chemical micro-heterogeneities (Aller et al., 1998; Stockdale et al., 2009), which can be averaged out within the volume of a sediment slice. Moreover, sediment core slicing or centrifugation can induce cell lysis, which can lead to a bias in porewater nitrate concentrations (Risgaard-Petersen et al., 2006). To obtain better estimates of the chemical microenvironments at relevant submillimeter or millimeter scales, new approaches have to be used. Recently, a 2D-DET (two-dimensional diffusive equilibrium in thin film) technique combined with colorimetry and hyperspectral imagery was developed to obtain the distribution of nitrite and nitrate in sediment porewater at millimeter resolution in two dimensions (Metzger et al., 2016). This method avoids mixing of intracellular nitrate and the nitrate contained in the sediment porewater. We will apply this technique here to get information about the distribution and concentration of nitrate at a scale relevant for modeling denitrification rates.
The general objectives of the study are (1) to characterize the density of the living, benthic foraminifera at two contrasting stations in the Gullmar Fjord: one with oxic bottom water and one with hypoxic bottom water. We will in particular focus on the relative abundance of the NIS Nonionella sp. T1 (2) to investigate if this NIS Nonionella sp. T1 can denitrify, and (3) we quantify its eventual contributions to benthic denitrification in the sediments. On the basis of the results, we will discuss the probable future impact of the NIS Nonionella sp. T1 on the foraminifera fauna and the nitrogen cycle in the Gullmar Fjord.
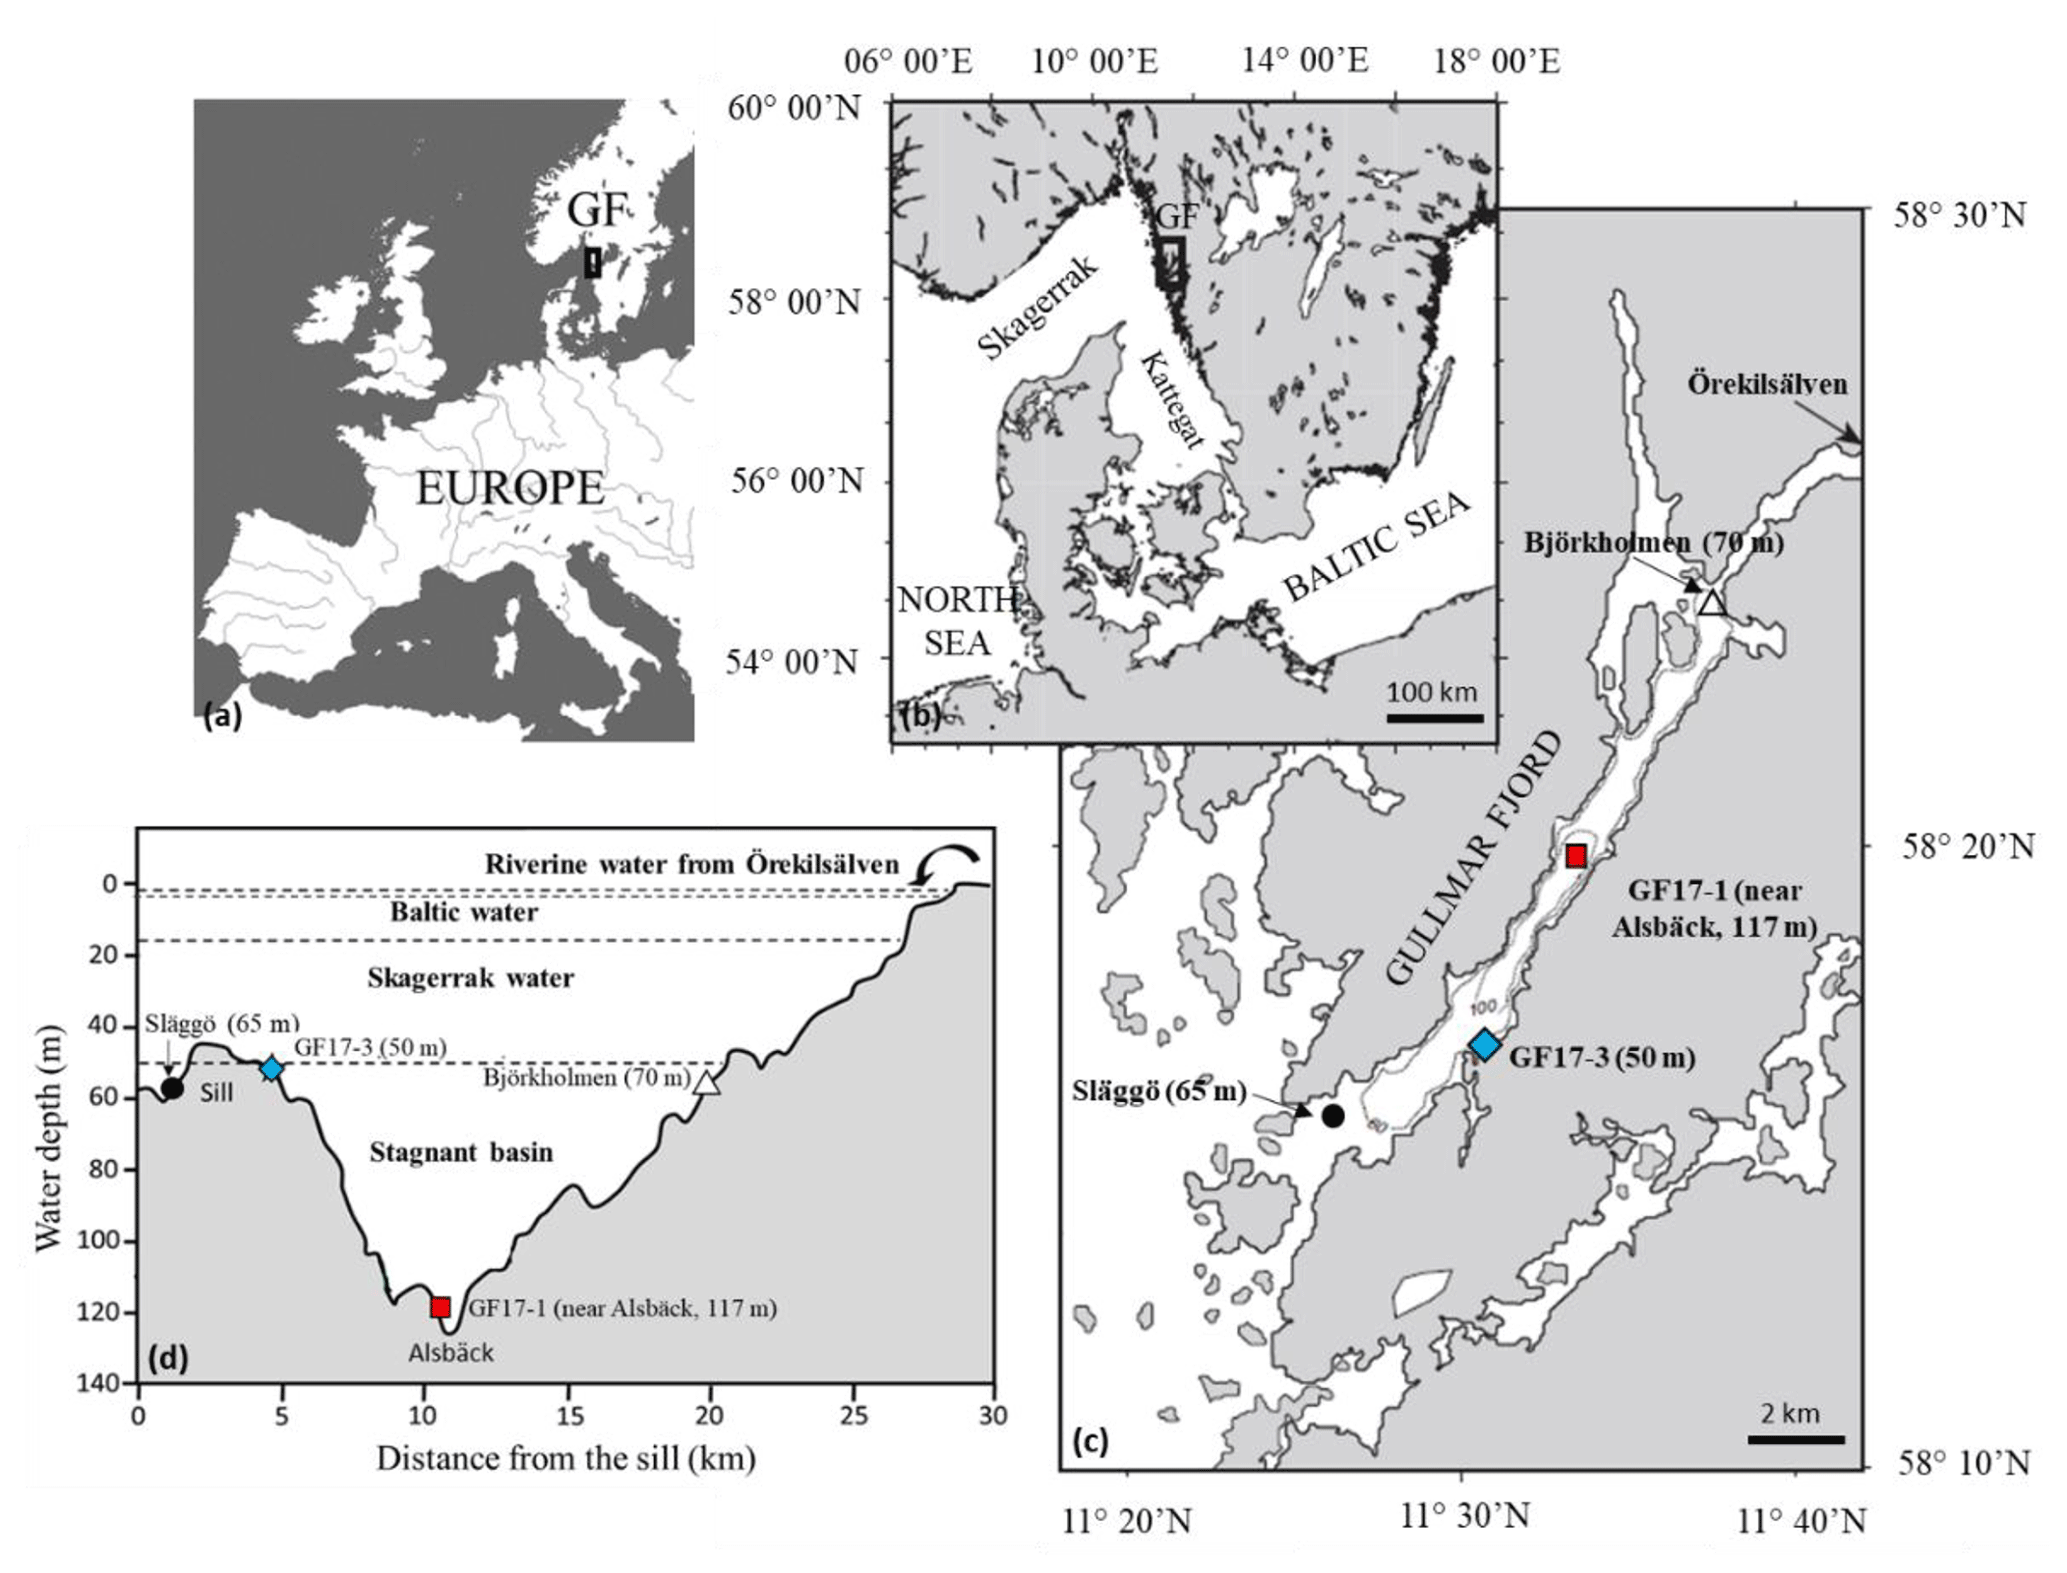
Figure 2(a–c) Location of studied stations in the Gullmar Fjord (Sweden); blue diamond: GF17-3 oxic station (50 m water depth); red square: GF17-1 hypoxic station (117 m water depth); dark circles: monitoring stations Släggö (65 m water depth) and Björkholmen (70 m water depth). (d) Transect from the sill with the four Gullmar Fjord water masses and the studied stations (modified from Arneborg et al., 2004).
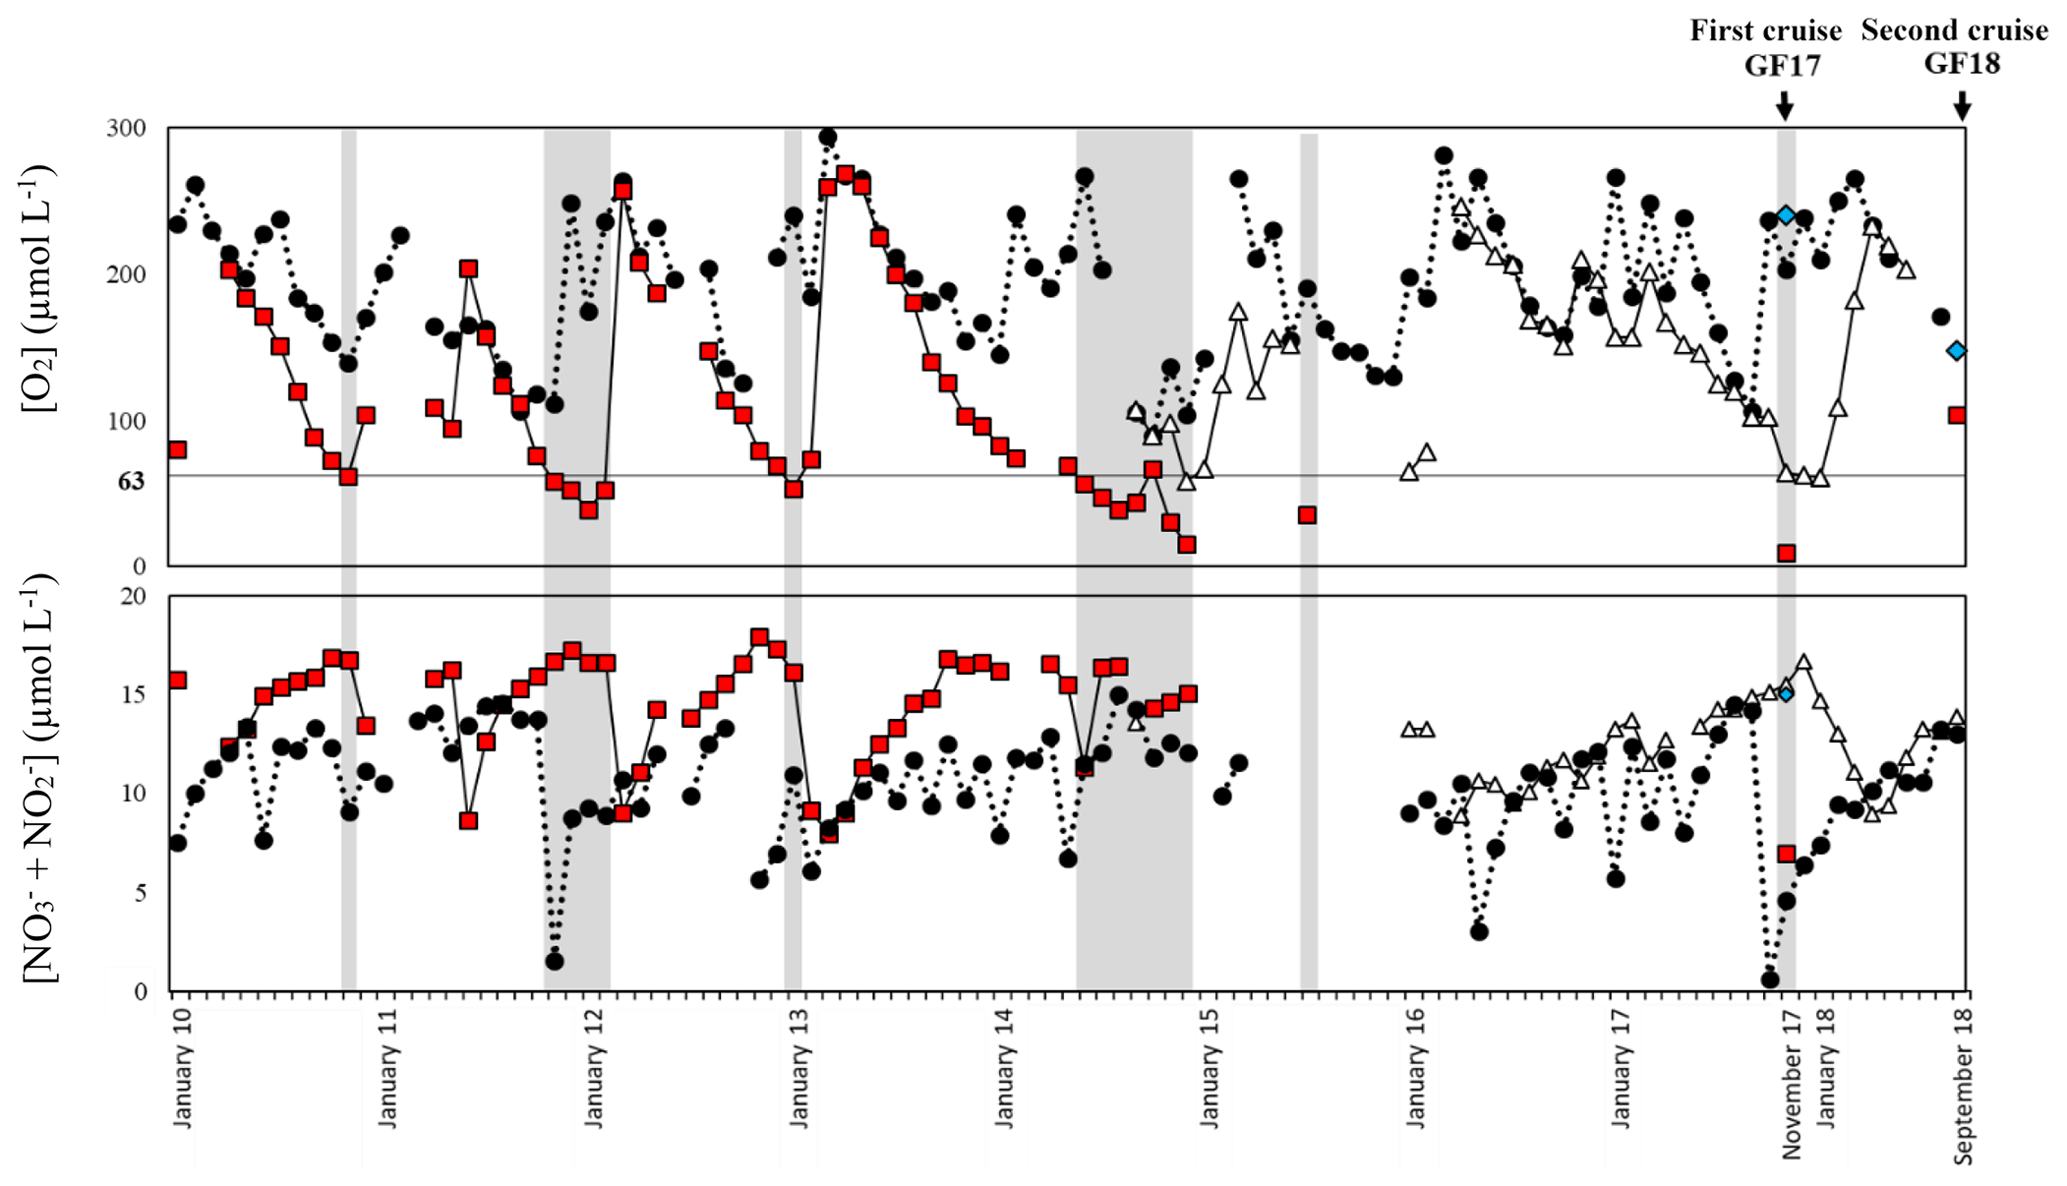
Figure 3Record from January 2010 to September 2018 of bottom-water oxygen ([O2]) and nitrite + nitrate ([ + ]) measurements from the monitoring stations Släggö (65 m water depth; black dot), Björkholmen (70 m water depth; white triangle) and the sampling stations GF17-1 (Alsbäck, 117 m water depth; red square) and GF17-3 (50 m water depth; blue diamond). The arrows indicate the date of the two sampling cruises: the 2017 cruise (14 and 15 November 2017) and the 2018 cruise (5 September 2018). The grey zones indicate hypoxic periods with a threshold of [O2] < 63 µmol L−1.
2.1 Site description and sampling conditions
The Gullmar Fjord is 28 km long, 1–2 km wide and located on the Swedish west coast (Fig. 2). The fjord undergoes fluctuations between cold and temperate climates (Svansson, 1975; Nordberg, 1991; Polovodova Asteman and Nordberg, 2013; Polovodova Asteman et al., 2018). The fjord is stratified (Fig. 2d) into four water masses (Svansson, 1984; Arneborg, 2004). Hypoxia events in the fjord have been linked to the influence of the North Atlantic Oscillation (NAO) (Nordberg et al., 2000; Björk and Nordberg, 2003; Filipsson and Nordberg, 2004). Several monitoring stations are located in the fjord: Släggö (65 m water depth), Björkholmen (70 m water depth) and Alsbäck (117 m water depth); the hydrographic and nutrient data were obtained from the Swedish Meteorological and Hydrological Institute's (SMHI's) publicly available database SHARK (SMHI, 2020). Since 2010, the threshold of hypoxia ([O2] < 2 mg L−1, i.e., 63 µmol L−1) in Alsbäck station (red squares, Fig. 3) is reached typically in late autumn and winter. Deep-water exchanges usually occur in late winter to early spring. However, the duration of hypoxia varies between years, and hypoxia events occurred in the summers of 2014 and 2015, due to a lack of deep-water exchange. The frequency of hypoxic events has increased in the fjord (Nordberg et al., 2000; Filipsson and Nordberg, 2004).
Two sampling cruises were conducted in the Gullmar Fjord with R/V Skagerak and R/V Oscar von Sydow. The 2017 cruise (GF17) took place between 14 and 15 November 2017, and two stations were sampled (GF17-3 and GF17-1, Fig. 2c and d) to define the living foraminiferal fauna and the sediment geochemistry at two contrasting stations. The 2018 cruise (GF18) took place on the 5 September 2018 with a focus to collect living Nonionella sp. T1 for O2 respiration and denitrification rate measurements. Only one station (at the same position as GF17-3) was sampled.
GF17-3 (50 m water depth) is located closest to the mouth of the fjord (58∘16′50.94′′ N, 11∘30′30.96′′ E) with bottom waters from the Skagerrak (blue diamond, Fig. 3), and GF17-1 (117 m water depth) is located close to the deepest part of the fjord (58∘19′41.40′′ N, 11∘33′8.40′′ E) near Alsbäck monitoring station in the middle of the stagnant basin (red square, Fig. 3). In November 2017, CTD (conductivity, temperature, depth) profiles indicated the water mass structures at both stations (Fig. S1 in the Supplement). Bottom water at GF17-3 station was oxic with a dissolved oxygen content of 234 µmol L−1. The dissolved oxygen content decreased strongly with depth at the GF17-1 station, reaching 9 µmol L−1 at the seafloor, which is below the severe hypoxia threshold.
2.2 Foraminifera sampling and processing
During the 2017 cruise, two sediment cores per station (1A and 1C for station GF17-1 and 3A and 3C for station GF17-3) were immediately subsampled with a smaller cylindrical core (∅ 8.2 cm). They were sliced every 2 mm from the sediment surface to 2 cm depth and every 5 mm from 2 to 5 cm depth to study the living-foraminifera distribution. The samples were incubated without light for 10–19 h in ambient seawater with CellTracker Green (CMFDA, 1 mM final concentration) at in situ temperature (Bernhard et al., 2006) and then fixed with ethanol 96 %. Fixed samples were sieved (> 355, 150, 125 and 100 µm), and the > 100 µm fraction, the most commonly used fraction for foraminiferal analyses in the Gullmar Fjord (see Charrieau et al., 2018, and references therein), was examined using an epifluorescence microscope equipped for fluorescein detection (i.e., 470 nm excitation; Olympus SZX13). In the present study, the foraminiferal distribution will be described, highlighting the NIS Nonionella sp. T1.
2.3 Geochemical sampling and processing
One core from the shallow GF17-3 station was reserved for O2 microelectrode profiling. Oxygen concentration was measured in the dark with a Clark electrode (50 µm tip diameter, Unisense®, Denmark) within the first 5 mm depth at a 100 µm vertical resolution. Due to technical problems, no oxygen profiling was done at the GF17-1 station.
One core per station was dedicated for geochemical analyses; they were carefully brought to Lund University (Sweden) and stored at in situ temperature (10 ∘C) until further analysis the next day. Overlaying water of the GF17-3 core was gently air bubbled to maintain the oxygenated conditions recorded at this station. Hypoxia in the overlaying water of the GF17-1 core was maintained by bubbling with N2 gas passed through a solution of carbonate/bicarbonate to avoid pH rise due to degassing of CO2.
Nitrite plus nitrate concentrations were analyzed using the 2D-DET method from Metzger et al. (2016). In brief, for each core, a DET (diffusive equilibrium in thin films) gel probe (16 cm × 6.5 cm and 0.1 cm thickness) was prepared by hand. The gel probe was inserted into the sediment and left for 5 h to allow for diffusive equilibration between the gel and porewaters. After equilibration, the gel was removed from the core and laid on a reagent gel first. After 15 min at ambient temperature, a pink coloration must appear where nitrite is detected. A reflectance image of the nitrite gels was taken with a hyperspectral camera (HySpex VNIR 1600). The next step was to convert existing nitrate into nitrite with the addition of a reagent gel of vanadium chloride (VCl3). After 20 min at 50 ∘C, additional pink coloration is interpreted as porewater nitrate concentration. Followed by the acquisition of another hyperspectral image and the conversion into false colors through a calibrated scale of concentrations, the final gel images were cropped to avoid border effects. Each pixel (190 µm × 190 µm) was decomposed as a linear combination of the logarithm of the different end-member spectra using ENVI software (unmixing function) (Cesbron et al., 2014; Metzger et al., 2016). Nitrite and nitrate detection limits are 1.7 µmol L−1 (Metzger et al., 2016).
2.4 Oxygen and nitrate respiration rate measurements of the NIS Nonionella sp. T1
The two cores sampled during the 2018 cruise (GF18) at the shallower GF17-3 station were carefully transported and stored at in situ temperature (8 ∘C) for 3 d at the Department of Geosciences, Aarhus University (Denmark). Nonionella sp. T1 specimens were picked at in situ temperature and collected in a Petri dish, containing a thin layer of sediment (32 µm), to check their vitality. Only living, active Nonionella sp. T1 specimens were picked using a brush and cleaned several times with micro-filtered, nitrate-free artificial seawater.
Oxygen respiration rates were measured, following the method developed by Høgslund et al. (2008) using a Clark-type oxygen microsensors (50 µm tip diameter, Unisense®, Denmark) (Revsbech, 1989). The O2 sensor was calibrated at in situ temperature (8 ∘C) in 0.7 M alkaline ascorbate solution (zero O2) and air-saturated sea water. Then, a pool of five living Nonionella sp. T1 was transferred into a glass microtube (inner diameter 0.5 mm, height 7.5 mm), that was fixed inside a 20 mL test tube mounted in a glass-cooling bath (8 ∘C). A motorized micromanipulator was used to measure O2 concentration profiles along a distance gradient that ranged from 200 µm of the foraminifera to 1200 µm using 100 µm steps. Seven O2 concentration profiles were generated with one incubation containing the pool of Nonionella sp. T1. Negative controls were done by measuring O2 rates from a microtube with empty foraminiferal shells and blanks with an empty microtube. Oxygen respiration rates were calculated with Fick's first law of diffusion: J = , where J is the flux, dC∕dx is the concentration gradient obtained by profiles and D is the free diffusion coefficient of oxygen at 8 ∘C for a salinity of 34 (1.382 × 10⁻⁵ , Ramsing and Gundersen, 1994). The seven O2 respiration rates were calculated as the product of the flux by the cross-sectional area of the microtube (0.196 mm2). Then, the average O2 respiration rate was divided by the number (n=5) of Nonionella sp. T1 present in the microtubes to obtain the respiration rate per individual.
The same pool of Nonionella sp. T1 specimens as for the O2 respiration measurements was used for denitrification measurements. These measurements were performed in the microtubes as described in Høgslund et al. (2017). A N2O microprobe (Andersen et al., 2001) with a 50 µm tip diameter was used to measure the N2O concentration profile, that developed in the chamber after acetylene inhibition of the final step in the denitrification process (N2O → N2). Calibration of the sensor was performed using the standard addition method by successive injections of a N2O-saturated solution in order to have 14 µM steps of final concentration. The cell-specific N2O production rate was calculated from the N2O flux (estimated from the concentration gradient and Fick's first law), the surface area of the microtube (0.25 mm2) and the number of Nonionella sp. T1 in the tubes (n=5) as described above. Rates are reported with the unit .

Figure 4Scanning electronic microscope images of a Nonionella sp. T1 from the GF17-3 oxic station in the Gullmar Fjord. White lines (labeled a and b) correspond to measured distances serving for a spheroid prolate volume model.
Since O2 respiration and denitrification rates are linked to cytoplasmic volumes or biovolumes (BVs) (Geslin et al., 2011; Glock et al., 2019), the specimens from the pool of Nonionella sp. T1 were measured (width (a) and length (b), Fig. 4) using a micrometer mounted on a Leica stereomicroscope (MZ 12.5) to estimate the average BV. The volume of each shell was estimated by using the best resembling geometric shape, a spheroid prolate . Then, according to Hannah et al. (1994), 75 % of the measured entire volume of the shell was used as the estimated cytoplasmic volume. Five Nonionella sp. T1 specimens sampled during the 2017 cruise (GF17, study of the fauna) were also measured to compare their average size with the size of the specimens sampled during the 2018 cruise (GF18, denitrification rate measurements).
2.5 Contributions of the NIS Nonionella sp. T1 to benthic denitrification
Benthic denitrification was estimated using the 2D nitrate concentrations obtained with the DET technique. An average 1D nitrate profile was obtained by calculating the mean of 290 vertical profiles ((5.5 cm width × 1 pixel)/0.019 cm for 1 pixel size) extracted from the 2D concentration image. Then, nitrate production and consumption zones were calculated with PROFILE software (Berg et al., 1998). With the assumption that nitrate consumption was equivalent to denitrification, the benthic denitrification rate was calculated by integrating nitrate consumption over the depth.
Table 1Total shell volume (µm3) and the biovolume (BV, µm3) corresponding to 75 % of the total shell volume measured on the pool of five Nonionella sp. T1 from the 2017 and the 2018 cruises in the Gullmar Fjord. Abbreviations: Ind. (individual).
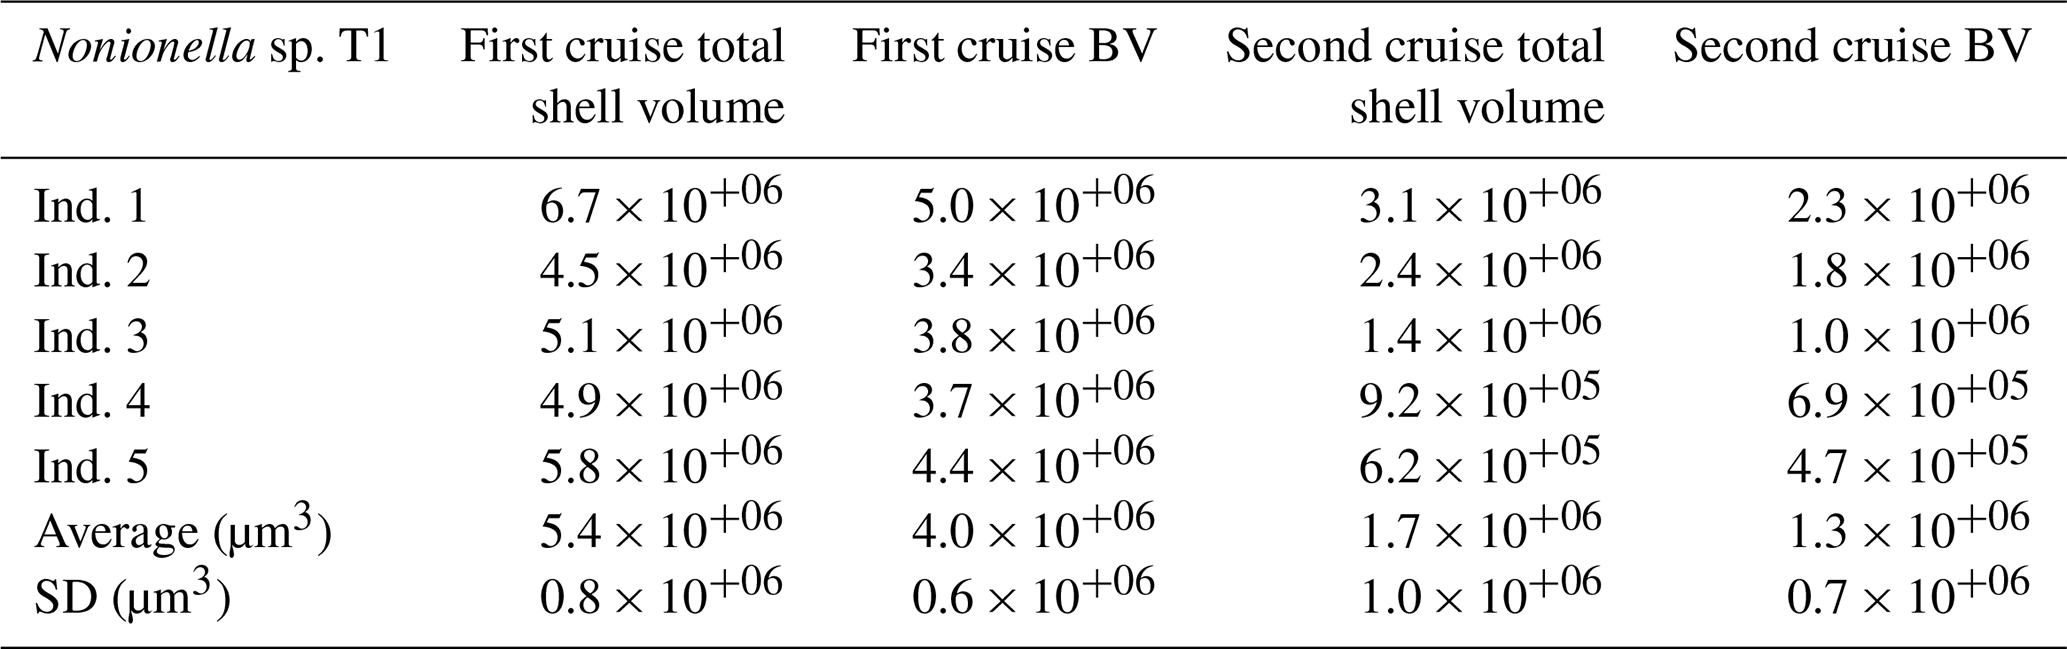
The denitrification activity of the NIS Nonionella sp. T1 population was calculated using the specimen abundances in the nitrate consumption zones and their cell-specific activity. The size of the Nonionella sp. T1 specimens sampled during the two cruises, however, differed markedly (Table 1). The cell-specific denitrification rate of denitrifying foraminifera is correlated with their size according to the following model: , where y is the denitrification rate () and x is the shell BV (µm3) (Geslin et al., 2011; Glock et al., 2019; Eq. S1 in the Supplement), and we therefore used this model to correct the denitrification estimates for size-specific variations.
A maximum estimate of the contribution of the NIS Nonionella sp. T1 population to benthic denitrification was obtained from the ratio of the denitrification activity of Nonionella sp. T1 population and the benthic denitrification rate estimated from the porewater nitrate concentration profiles. This presumes that Nonionella sp. T1 exclusively uses nitrate dissolved in the sediment porewater as a source for denitrification (calculation approach A). A minimum estimate of the contribution of Nonionella sp. T1 population to benthic denitrification was obtained from the ratio between the denitrification activity of Nonionella sp. T1 population and the benthic denitrification rate estimated from porewater nitrate concentration profiles plus the denitrification activity of Nonionella sp. T1 population. This presumes that Nonionella sp. T1 exclusively uses intracellular nitrate as a source for denitrification (calculation approach B).
3.1 The NIS Nonionella sp. T1 oxygen and nitrate respiration rates in the Gullmar Fjord
The O2 respiration rate measured from the pool of Nonionella sp. T1 specimens collected during the 2018 cruise (GF18) was 169 ± 11 with an average BV of 1.3 ± 0.7 × 10+06 µm3 (BV details, Table 1). The denitrification rate measured from the same pool of specimens was 21 ± 9 .
The Nonionella sp. T1 average BV of the specimens collected during the 2017 cruise (GF17-3) was 4.0 ± 0.6 × 10+06 µm3, i.e., more than 3 times the Nonionella sp. T1 average BV of the 2018 samples (1.3 ± 0.7 × 10+06 µm3). As denitrification rates and foraminiferal BVs are related (see “Material and methods” section), the measured denitrification rate was corrected using the BV of Nonionella sp. T1 from the 2017 cruise. Hence, the Nonionella sp. T1 corrected denitrification rate was 38 ± 8 (Eq. S1).
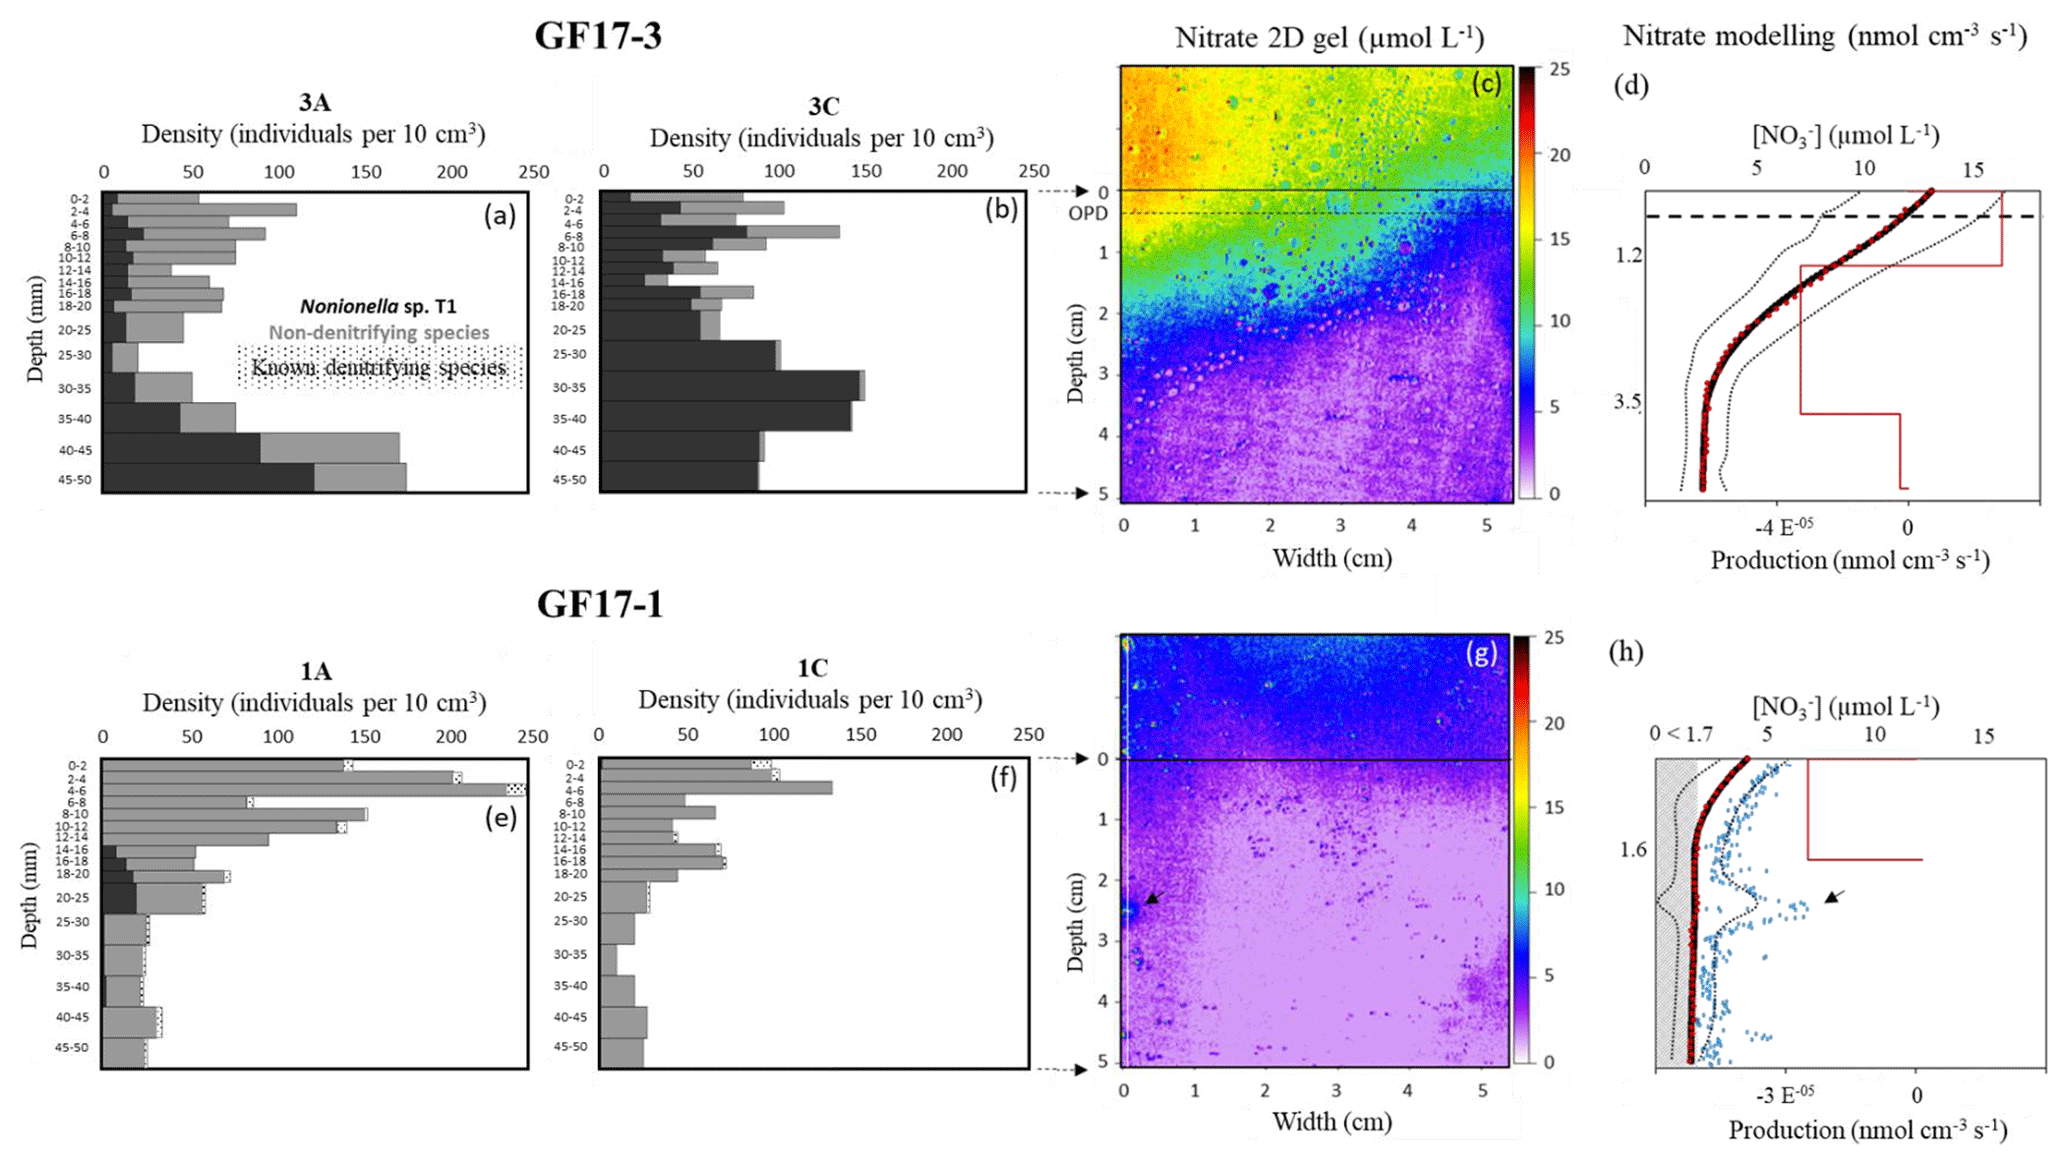
Figure 5Micro-distributions of living-foraminifera densities in GF17-3 oxic station (a, b) and in GF17-1 hypoxic station (e, f). Nonionella sp. T1 specimens are in black, the sum of the non-denitrifying species is in grey and the small dots (e, f) show the other denitrifying species (known and potential candidates). The maps of porewater nitrate 2D gels are presented for stations GF17-3 (c) and GF17-1 (g). The SWI is represented by a black line at 0 cm depth (c, g), and the OPD (oxygen penetration depth) is represented by the dashed line in bold at 4.7 ± 0.2 mm depth (c). Nitrate 1D profiles (d and h, black dots) are calculated using the average value of each pixel line of the nitrate distribution image (290 pixels wide); the SD is represented by two fine, dotted lines. The corresponding best-fitting concentration profiles (red dots, d and h) and the production zones (red line) are modeled with PROFILE software. The 1D profile corresponding to x = 1 mm (white line, g) is represented with a blue square profile (h), and the deep nitrate spot is indicated by a black arrow. The grey hatching zone (h) represents the detection limit of the nitrate 2D gel (< 1.7 µmol L−1).
3.2 The NIS Nonionella sp. T1 and foraminiferal fauna regarding porewater nitrate micro-distribution
The bottom water at GF17-3 station was oxic (Fig. S1, [O2] = 234 µmol L−1), and the measured oxygen penetration depth (OPD) in the sediment was 4.7 ± 0.2 mm (n=3). No nitrite was revealed on the gel (< 1.7 µmol L−1); only nitrate was detected. Bottom-water average concentration was 14.6 ± 2.3 µmol L−1 and nitrate concentration decreased with depth in the sediment (Fig. 5c and d). Nitrate concentrations ranged from 13.1 ± 3.2 to 11.7 ± 3.4 µmol L−1, from the SWI to the OPD. Nitrate concentrations decreased strongly under the OPD from 11.7 ± 3.4 to 2.8 ± 0.9 µmol L−1 at 4.0 cm depth. From 4.0 to 5.0 cm depth, concentration was very low with an average value of 2.7 ± 0.9 µmol L−1 (Fig. 5c and d). The PROFILE parameters (Berg et al., 1998) used on laterally averaged nitrate porewater vertical distribution of both stations are available in Table S1 in the Supplement. Thus, the PROFILE modeling of the averaged nitrate porewater profile revealed one nitrification zone from 0 to 1.2 cm depth and two denitrifying zones (red line, Fig. 5d). The first denitrification zone occurred between 1.2 and 3.5 cm depth with a nitrate consumption of 3.92 × 10−05 , and the second smaller consumption zone was from 3.5 to 5 cm depth (1.53 × 10−06 ). The total denitrification rate from 1.2 to 5 cm depth was 4.07 × 10−05 (Fig. 5d).
The total densities of living foraminifera were similar between cores GF17-3A and GF17-3C (∅ 8.2 cm, 5 cm depth) with 1256 individuals and 1428 individuals, respectively (Fig. 5a and b; Table S2 in the Supplement, GF17-3A and GF17-3C). Nonionella sp. T1 was the main denitrifying species, accounting for 34 % of the total living fauna in core GF17-3A and 74 % in GF17-3C (Fig. 5a and b; Table S3 in the Supplement). One other candidate for denitrification, Stainforthia fusiformis, was in minority: 1 % of the total fauna in both cores (Fig. 5a and b; Table S3, GF17-3A and GF17-3C). The other known denitrifying species previously reported in the Gullmar Fjord, Globobulimina turgida (Risgaard-Petersen et al., 2006) and Globobulimina auriculata (Whoele et al., 2018), were absent. Three non-denitrifying species (Piña-Ochoa et al., 2010; Xu et al., 2017; Glock et al., 2019) were dominant in cores GF17-3A and GF17-3C: Bulimina marginata (37 % and 5 %, respectively), Cassidulina laevigata (9 % and 5 %, respectively) and Leptohalysis scotti (11 % and 9 %, respectively).
The density and the micro-distribution of Nonionella sp. T1 differed between the two cores (Fig. 5a and b; Table S2, GF17-3A and 3C). Nonionella sp. T1 relative abundance accounted for 18 % and 50 % of the fauna in the nitrification zone (from the SWI to 1.2 cm depth) for cores GF17-3A and GF17-3C, respectively (Table S3). In the main denitrifying zone (from 1.2 to 3.5 cm), the Nonionella sp. T1 relative abundance represented 27 % of the fauna for core GF17-3A and 78 % for core GF17-3C. In the second denitrifying zone, the Nonionella sp. T1 relative abundance increased from 3.5 to 5 cm depth and dominated the fauna with relative abundances of 60 % and 98 % (GF17-3A and GF17-3C, respectively). The relative abundance of the denitrifying candidate, Stainforthia fusiformis, was a minor component in each zones of both cores and did not exceed 2 % (Table S3, GF17-3A and GF17-3C). The three non-denitrifying species (e.g., B. marginata, C. laevigata and L. scotti) also dominated the fauna of both cores (Tables S2 and S4 in the Supplement). From the SWI to 1.2 cm depth, B. marginata accounted for 42 % and 12 %, C. laevigata 16 % and 13 %, and L. scotti 6 % and 11 % for cores GF17-3A and GF17-3C, respectively. In the first denitrifying zone (1.2–3.5 cm depth), B. marginata accounted for 34 % and 2 %, C. laevigata for 7 % and 2 %, and L. scotti for 25 % and 13 % (GF17-3A and GF17-3C, respectively). In the second denitrifying zone (3.5–5 cm depth), B. marginata accounted for 34 % and 0 %, C. laevigata was absent, and L. scotti 5 % and 1 % (GF17-3A and GF17-3C, respectively).
Due to severe hypoxia at the GF17-1 station, oxygen was assumed to be below detection limit within the sediment. No nitrite was detected at this station (< 1.7 µmol L−1). Average concentration in the bottom water reached 5.7 ± 1.0 µmol L−1 (Fig. 5g and h). Nitrate concentrations decreased from the SWI (4.2 ± 1.0 µmol L−1) to 1.6 cm depth (1.8 ± 0.6 µmol L−1), and then average nitrate concentration remained below the detection limit (1.7 µmol L−1). However, a microenvironment with higher nitrate concentration was visible on the left part of the gel between 2.0 and 3.0 cm depth. A 1D vertical profile passing through this microenvironment (white line, Fig. 5g) was extracted from the 2D image, and the maximal nitrate concentration of this patch was above the detection limit with a value of 6.5 µmol L−1 at 2.3 cm depth (blue square profile, Fig. 5h). The PROFILE modeling (Table S1) of the laterally averaged nitrate vertical distribution revealed at the sampling time one denitrifying zone from the SWI to 1.6 cm depth with a nitrate consumption of 2.71 × 10−05 (red line, Fig. 5h). No PROFILE modeling was done under 1.6 cm depth, because nitrate concentration was below the detection limit (grey hatching zone, Fig. 5h).
Living foraminifera showed a large difference in both species distribution and total densities between the two cores GF17-1A and GF17-1C (Fig. 5e and f; Table S2) with 1457 individuals and 786 individuals, respectively (∅ 8.2, 5 cm depth). Nonionella sp. T1 represented a low relative abundance of the total fauna with 5 % for core GF17-1A and was almost absent (1 %) for core GF17-1 C (Table S3). The known denitrifying species G. auriculata was minor in the fauna with relative abundances of 1 % and 2 % (GF17-1A and GF17-1C, respectively). The denitrifying candidate S. fusiformis was also found in both cores, reaching only 3 % of the total fauna (Fig. 5e and f; Table S3). The other denitrifying candidate, B. pseudopunctata, was almost absent in the total fauna with relative abundances of 0 % and 2 % for cores GF17-1A and GF17-1C, respectively (Table S3). The same three non-denitrifying species observed in the oxic station were also dominant for both cores GF17-1A and GF17-1C: B. marginata (64 % and 30 %), C. laevigata (16 % and 15 %) and L. scotti (4 % and 36 %).
In the denitrifying zone (0–1.6 cm), Nonionella sp. T1 relative abundance was rare (2 %) for core GF17-1A and almost absent from the fauna for core GF17-1C. For core GF17-1A, Nonionella sp. T1 relative abundance reached 26 % of the fauna between 1.6 and 2.5 cm depth (Fig. 5e, GF17-1A), whereas it was almost absent from the rest of core GF17-1A and it was absent from core GF17-1C (Table S3). For cores GF17-1A and GF17-1C, S. fusiformis reached, respectively, 2 % and 3 % in the denitrifying zone (0–1.6 cm). Under the denitrifying zone (1.6–5 cm), S. fusiformis represented 4 % and 1 % of the fauna (GF17-1A and GF17-1C, respectively). The three other non-denitrifying species dominated both cores in the denitrifying zone (0–1.6 cm): B. marginata accounted for 66 % and 35 %, C. laevigata 19 % and 19 %, and L. scotti 4 % and 24 % for cores GF17-1A and GF17-1C, respectively. From 1.6 to 5 cm depth, B. marginata accounted for 61 % and 11 %, C. laevigatafor 5 % and 2 % and L. scotti for 6 % and 75 % (GF17-1A and GF17-1C, respectively).
4.1 The NIS Nonionella sp. T1 density in comparison with other species from the Gullmar Fjord
The presence and relative abundance of the NIS Nonionella sp. T1 in the Gullmar Fjord and in the Skagerrak–Kattegat strait have been documented during the last decades. The earliest SEM (scanning electron microscopy) observations of specimens resembling the Nonionella sp. T1 morphotype in the deepest part of the fjord date back to summer 1993 (identified as Nonionella turgida; Gustafsson and Nordberg, 2001). The invasive characteristics of Nonionella stella were firstly revealed by Polovodova Asteman and Schönfeld (2015). Then, Nonionella stella was identified as the Nonionella sp. T1 morphotype also described as a NIS and potentially invasive species in the Oslofjord by Deldicq et al. (2019). The estimated introduction date of Nonionella sp. T1 into the deepest part of the Gullmar Fjord is 1985 according to Polovodova Asteman and Schönfeld (2015). The relative abundance of Nonionella sp. T1 in the deepest fjord station was less than 5 % between 1985 and 2007 (Polovodova Asteman and Schönfeld, 2015, and references within). At the GF17-1 hypoxic station, the Nonionella sp. T1 relative abundance was between 1 %–5 % (Table S3, GF17-1A and GF17-1C). Thus, the Nonionella sp. T1 relative abundance in the deepest part of the fjord seems to have remained stable. In contrast to GF17-1 station, the GF17-3 oxic station was sampled for the first time in this study. In this station closer to the mouth of the fjord than GF17-1, the relative abundance of Nonionella sp. T1 varied between 34 % and 74 % (Table S3, GF17-3A and 3C). Previous studies showed an increase in the relative abundance of the Nonionella sp. T1 morphotype in the Skagerrak–Kattegat region (near the entrance of the Gullmar Fjord). The Nonionella sp. T1 represented 10 % of the fauna in June 2013 (Polovodova Asteman and Schönfeld, 2015). The Öresund strait linking north Skagerrak, the Kattegat and the Baltic Sea showed an increase in Nonionella sp. T1 relative abundance from 1 % to 14 % observed between 1998 and 2009 (Charrieau et al., 2019). The foraminiferal fauna in the Gullmar Fjord changed over the last decades, and Nonionella sp. T1 seems to have become an invasive species in the Gullmar Fjord oxic shallow water area.
The foraminiferal fauna found at the GF17-1 station in the deepest part of the fjord differed from previous studies (Nordberg et al., 2000; Filipsson and Nordberg, 2004; Risgaard-Petersen et al., 2006; Polovodova Asteman and Nordberg, 2013; Polovodova Asteman and Schönfeld, 2015). Indeed, until the early 1980s, the foraminiferal fauna in the deepest part of the fjord was dominated by a typical Skagerrak–Kattegat fauna (Bulimina marginata, Cassidulina laevigata, Hyalinea balthica, Liebusella goesi, Nonionellina labradorica and Textularia earlandi) (Nordberg et al., 2000). However, the fauna changed. S. fusiformis and B. pseudopunctata became the major species (Nordberg et al., 2000; Filipsson and Nordberg, 2004). Further studies by Polovodova Asteman and Nordberg (2013) demonstrated that at least until 2011 S. fusiformis, B. pseudopunctata and T. earlandi dominated the fauna. Foraminiferal fauna described in the present study differs. In November 2017 S. fusiformis did not exceed 3 % of the fauna (Table S3, GF17-1A and GF17-1C), B. pseudopunctata reached only 2 % in core GF17-1C (Table S3, GF17-1C) and T. earlandi was a minor species < 1 %. Then, in November 2017, B. marginata, C. laevigata and Leptohalysis scotti were the dominant species in the fjord. The Elphidium clavatum-selseyensis species complex (following the definition from Charrieau et al., 2018), H. baltica, N. labradorica, and T. earlandi were present with a low relative abundance (< 5 %, Table S3). Namely, G. turgida reached 37 % of the foraminiferal fauna in August 2005 at the deepest station (Risgaard-Petersen et al., 2006), whereas in November 2017 this species relative abundance decreased to become a minor species of the assemblage. However, such a trend for S. fusiformis and B. pseudopunctata must be interpreted with caution since our study used the > 100 µm fraction, whereas some of the previous studies used the > 63 µm fraction. We also wet picked the specimens and used CellTracker Green to identify living foraminifera, which might affect the results compared to Rose Bengal studies of dry sediment residuals.
The relative abundance of the potentially invasive Nonionella sp. T1 in 2017 increased compared to the study of Polovodova Asteman and Schönfeld (2015) in the oxic part of the fjord. It is also noteworthy that the two non-denitrifying species B. marginata and C. laevigata described as typical species of the Skagerrak–Kattegat fauna (Filipsson and Nordberg, 2004) increased markedly in the fjord as well. It is evident that the foraminiferal fauna in the Gullmar Fjord is presently very dynamic with considerable species composition shifts probably following seasonal water body stratification and consecutive oxygen depletion occurring in the fjord (Fig. 3).
4.2 Foraminifera ecology considering porewater nitrate micro-distribution
For the first time, a core sampled in the Gullmar Fjord shows Nonionella sp. T1 as a dominant species. This observation was made under oxic conditions at GF17-3 station (50 m depth) during November 2017 (Fig. 5a and b; Tables S2 and S4). The Nonionella sp. T1 density increased with sediment depth below the sedimentary oxic zone (Fig. 5a–d; Table S2), which could be explained by its preference to respire nitrate rather than oxygen. This would be in agreement with the hypothesis of using nitrate as the preferred electron acceptor as suggested by Glock et al. (2019). Nonionella sp. T1 distribution could be explained by its capacity to store nitrate intracellularly before porewater nitrate is denitrified by other organisms such as bacteria. In detail, in the upper part of the sediment, within the oxic zone, Nonionella sp. T1 would respire oxygen at the rate of 169 ± 11 (Fig. 5c and d). Below the oxygen penetration depth (from 4.7 ± 0.2 mm to 3.5 cm), Nonionella sp. T1 could store and respire the ambient nitrate at the rate of 38 ± 8 . Further down, where the nitrate porewater is depleted (Fig. 5c and d; from 3.5 to 5 cm depth), Nonionella sp. T1 would respire on its intracellular nitrate reserves to survive (Fig. 5a and b; from 3.5 to 5 cm depth). When the intracellular nitrate reserve runs out, Nonionella sp. T1 would be able to migrate to an upper zone where nitrate is still present in the sediment to regenerate its intracellular nitrate reserve (Fig. 5a and b; from 1.2 to 3.5 cm depth).
Hypoxia occurred approximately at least 1 month before the sampling cruise in the deepest part of the fjord (Fig. 3). When hypoxia is extended to the water column, nitrification both in the water column and the sediment is reduced or even stopped, as oxygen is almost absent (Fig. 1b; Childs et al., 2002; Kemp et al., 2005; Conley et al., 2007; Jäntti and Hietanen, 2012). Under this condition, the coupled nitrification–denitrification processes are strongly reduced (Kemp et al., 1990). At the GF17-1 station, no nitrification in superficial sediment was shown by our data, and nitrate was low but still detectable in the bottom water. Nitrate can diffuse from the water column into the sediment and thereby generate the denitrification zone as modeled by PROFILE between the SWI and 1.6 cm depth (Fig. 5h).
The rare presence of the NIS Nonionella sp. T1 and other denitrifying species such as Globobulimina auriculata, Bolivina pseudopunctata and Stainforthia fusiformis in the hypoxic station indicates that sediment chemical conditions turned unfavorable towards denitrification during prolonged hypoxia. Instead, the non-denitrifying species Bulimina marginata, Cassidulina laevigata, and Leptohalysis scotti dominated in this hypoxic environment. Their survival could be due to seasonal dormancy (Ross and Hallock, 2016; LeKieffre et al., 2017) and their ability to release propagules, which can disperse and grow when environmental conditions turn favorable again (Alve and Goldstein, 2003). The suspected deep nitrification zone (blue square profile, Fig. 5h) could indicate the presence of nitrate micro-niches deeper in the sediment and might explain the patchy distribution of Nonionella sp. T1 also at the hypoxic site (see Fig. 5e; Table S2, GF17-1A). Therefore, deep nitrate production in these microenvironments could favor the presence of Nonionella sp. T1, which can be attracted by this nitrate source of electron acceptor to respire (Nomaki et al., 2015; Koho et al., 2011). This deep nitrification zone could be the result of macrofaunal activity (burrowing activity) that introduces some oxygen deeper into anoxic sediment (Aller, 1982; Karlson et al., 2007; Nizzoli et al., 2007; Stief, 2013; Maire et al., 2016). This nitrification zone could also be due to an anaerobic process. The Gullmar Fjord is Mn rich (Goldberg et al., 2012), and metal-rich particles can be bio-transported into the anoxic sediment, thus allowing ammonium oxidation into by Mn and Fe oxides in the absence of oxygen deeper in the sediment (Aller, 1994; Luther et al., 1997).
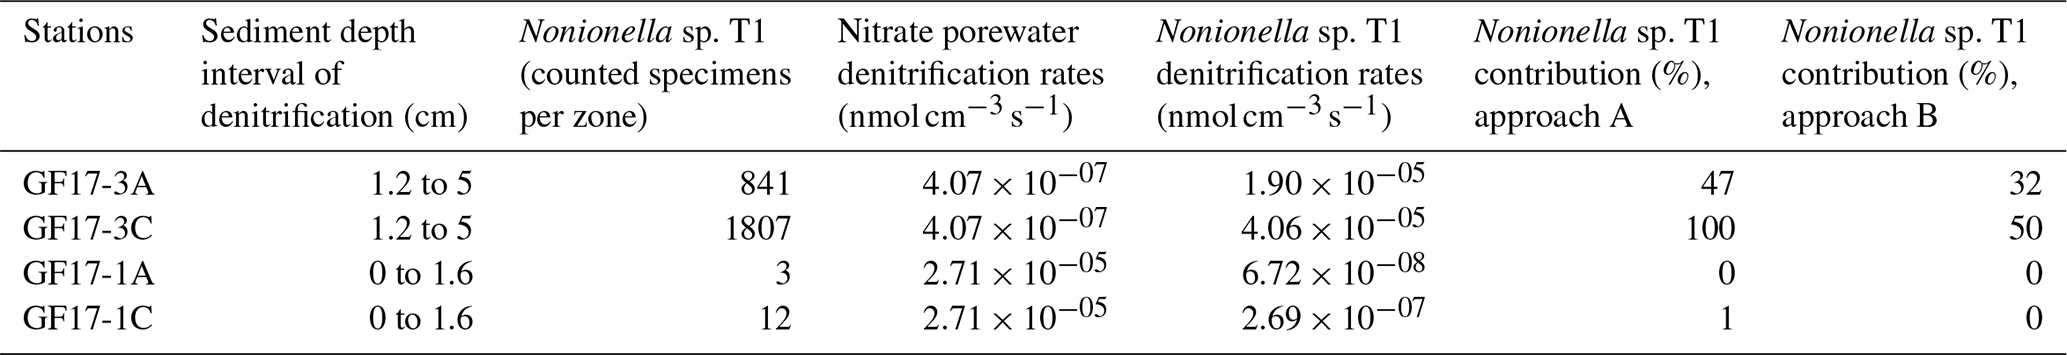
Table 2Summary of the NIS Nonionella sp. T1 contributions to benthic denitrification in the Gullmar Fjord. The porewater denitrification zones come from PROFILE modeling (Fig. 5d and h). To estimate the contributions of Nonionella sp. T1, the number of counted specimens per zone was used. Two different approaches were used to estimate the contribution of Nonionella sp. T1: (A) Nonionella sp. T1 denitrification rate divided by nitrate porewater denitrification rate and (B) Nonionella sp. T1 denitrification rate divided by nitrate porewater denitrification rate plus Nonionella sp. T1 denitrification rate. The calculations are detailed in Eq. (S2) in the Supplement.
4.3 Contributions and potential impacts of the NIS Nonionella sp. T1 to benthic denitrification in the Gullmar Fjord
Considering that Nonionella sp. T1 is denitrifying the nitrate from sediment porewater (approach A, Table 2; see method 2.5), its contribution to benthic denitrification in the oxic station would be 47 % in core GF17-3A and would reach 100 % in core GF17-3C. If we consider that Nonionella sp. T1 uses its intracellular nitrate pool for denitrification (approach B), its contribution to benthic denitrification would be 32 % in core GF17-3A and would reach 50 % in core GF17-3C (Table 2). These two calculation approaches highlight the difficulties and the importance of knowing the concentration of environmental nitrate and foraminiferal intracellular nitrate at the same time to estimate the contributions of foraminifera to benthic denitrification. Moreover, in this study there is no data on the anammox process which contributes also to the total denitrification (Brandes et al., 2007). The results reported in previous studies such as Engström et al. (2005) do not allow us to extrapolate their data at our oxic station, located at the entrance of the fjord. Thus, we assume that our estimate of denitrification is conservative since the possible contribution of anammox is not included in the calculation. However, despite these uncertainties , the Nonionella sp. T1 contribution to benthic denitrification supports the hypothesis that this non-indigenous denitrifying foraminifer plays a major role in the benthic nitrogen cycle.
At the hypoxic station, the opposite was shown where the estimated contribution of Nonionella sp. T1 to benthic denitrification was below 1 % whatever the calculation approach. The estimated contributions of the other denitrifying foraminifera found in this station were low. Foraminifera contributed to almost 5 % of benthic denitrification. Compared to the oxic station, the NIS Nonionella sp. T1 and the other denitrifying species contributions to benthic denitrification were weak in a prolonged hypoxic station of the Gullmar Fjord.
Overall, the Gullmar Fjord is well oxygenated except for the deepest basin where oxygen goes down when there is no deep-water exchange (Fig. 3c). Therefore, the GF17-3 oxic station could be considered representative of the Gullmar Fjord benthic ecosystem. Nonionella sp. T1 is not the most efficient denitrifying species compared to Globobulimina turgida (42 , with BV = 1.3 × 10+06 µm3) and also less efficient than Nonionella cf. stella from Peru. However, the high density of Nonionella sp. T1 could accelerate sediment denitrification and participate to increase the contrast between the two hydrographic conditions. Indeed, the increasing discrepancy of bottom-water oxygenation between stations induces a gap in the availability of nitrate for anaerobic facultative metabolisms in the sediment. In the oxygenated part of the fjord, high contribution to benthic denitrification (estimated between 50 % and 100 %) by Nonionella sp. T1 could take part to a potential de-eutrophication of the system by increasing the nitrogen loss. Primary production (PP) in the Gullmar Fjord is dominated by diatom blooms in spring and autumn (Lindahl and Hernroth, 1983). Since the 1990s, Lindahl et al. (2003) observed an increase in PP in the Gullmar Fjord, potentially changing its trophic status towards eutrophic. This increase in PP also shown in the adjacent Kattegat could be related to the nitrogen input loading from the land and atmosphere (Carstensen et al., 2003). Lindahl et al. (2003) argued that the PP in the Gullmar Fjord was due to climatic forces resulting from a strong positive North Atlantic Oscillation (NAO) index, which increased the availability of deep-water nutrients (Kattegat nitrate rich) through changes in the thermocline. The benthic denitrification of the Gullmar Fjord produces nitrogen unassimilable by primary producers. Moreover, foraminiferal nitrate uptake and intracellular storage act as an additional sink through bio-transportation and permanent sequestration in sediments (Glock et al., 2013; Prokopenko et al., 2011). Thus, denitrifying foraminifera including Nonionella sp. T1 could help counterbalance a potential eutrophication of the system via nitrogen loss (Seitzinger, 1988).
Contrastingly, in the hypoxic part of the fjord, nitrate and nitrite (rapidly exhausted) become scarce, resulting in a decrease in benthic denitrification including foraminiferal contribution. As a consequence of oxygen and nitrate scarcity, nitrification, denitrification and anammox processes are less intense, resulting in a decrease in nitrogen mitigation and accumulation of ammonium in the deeper part of the fjord subjected to prolonged severe hypoxia (Fig. 1). Moreover, the low availability of nitrate in the sediment would possibly increase the benthic transfer towards the water column of reduced compounds such as manganese and iron produced deeper in the sedimentary column by other anaerobic metabolisms (Hulth et al., 1999). These new results demonstrate that the role of denitrifying foraminifera is underestimated in the nitrogen cycle and that overlooking this part of the meiofauna may lead to a misunderstanding of environments subject to hydrographic changes.
This study revealed a drastic change in living foraminifera fauna due to several hypoxic events that occurred in the last decades in the Gullmar Fjord. For the first time, the non-indigenous species (NIS) Nonionella sp. T1 dominated up to 74 % the foraminiferal fauna at a station with oxygenated bottom waters and high nitrate content in sediment porewater. This NIS can denitrify up to 50 %–100 % of the nitrate porewater sediment under oxic conditions in the fjord. However, under prolonged hypoxia, nitrate depletion turns environmental conditions unfavorable for foraminiferal denitrification, resulting in a low density of Nonionella sp. T1 and other denitrifying species. The foraminiferal contribution to benthic denitrification was negligible (∼ 5 %) during prolonged seasonal hypoxia in the fjord. Moreover, the potentially invasive denitrifying Nonionella sp. T1 could impact the nitrogen cycle under oxic conditions by increasing the sediment denitrification and could counterbalance potential eutrophication of the Gullmar Fjord. Our study demonstrated that the role of denitrifying foraminifera is underestimated in the nitrogen cycle, especially in oxic environments.
All of the data are published within this paper and in the Supplement. The raw data used to make the figures are available on request.
The supplement related to this article is available online at: https://doi.org/10.5194/bg-18-327-2021-supplement.
CC participated in the sampling cruise, did the foraminiferal taxonomy, and contributed to 2D gel experiments and analyses by the hyperspectral camera. CC did the nitrate and oxygen respiration measurements and wrote the present article. EG participated in the sampling cruise and contributed to foraminiferal analysis and scientific discussions. EM participated in the sampling cruise; managed with AM the 2D gel experiments; and contributed to hyperspectral camera treatments, scientific discussions, and article rewriting. HLF managed with AM the sampling cruise and contributed to foraminiferal taxonomy, scientific discussions and article rewriting. NRP managed the oxygen and nitrate respiration measurements and contributed to the scientific discussions. PL managed hyperspectral treatments for 2D gels and contributed to the scientific discussion. MG participated in the 2D gel lab experiments and hyperspectral treatments. TJ participated in the sampling cruise and contributed to 2D gel experiments, scientific discussions and article rewriting. BJ contributed to scientific discussion and article rewriting. AM managed the sampling cruise and 2D gel experiments and contributed to hyperspectral camera treatments, scientific discussions and article rewriting.
The authors declare that they have no conflict of interest.
The authors gratefully acknowledge the crews of the R/V Skagerak and R/V Oscar von Sydow and the Kristineberg Marine Research Station; the hydrographic data used in the project are from SMHI's database – SHARK. The collection of data for SHARK is organized by the Swedish environmental monitoring program and funded by the Swedish Agency for Marine and Water Management (SWAM). Thanks to Charlotte LeKieffre, who helped during the sampling cruise, and the SCIAM (Service Commun d'Imagerie et d'Analyses Microscopiques) of Angers University for the SEM images. Helena L. Filipsson acknowledges funding from the Swedish Research Council VR (grant number 2017-04190). This project was funded by the French National Program MANGA-2D (CNRS-INSU) and by the FRESCO project supported by the Region Pays de la Loire and by University of Angers.
This research has been supported by the Aurélia Mouret (grant no. MANGA-2D (CNRS-INSU)) and the Emmanuelle Geslin (grant no. FRESCO project supported by the Region Pays de la Loire and by University of Angers), and the Swedish Research Council VR (grant number 2017-04190).
This paper was edited by Tina Treude and reviewed by two anonymous referees.
Aller, R. C.: The Effects of Macrobenthos on Chemical Properties of Marine Sediment and Overlying Water, in: Animal-Sediment Relations, edited by: McCall, P. L. and Tevesz, M. J. S., Springer US, 53–102, 1982.
Aller, R. C.: The sedimentary Mn cycle in Long Island Sound: Its role as intermediate oxidant and the influence of bioturbation, O2, and Corg flux on diagenetic reaction balances, J. Mar. Res., 52, 259–29, 1994.
Aller, R. C., Hall, P. O. J., Rude, P. D., and Aller, J. Y.: Biogeochemical heterogeneity and suboxic diagenesis in hemipelagic sediments of the Panama Basin, Deep-Sea Res. Pt. I, 45, 133–165, 1998.
Alve, E. and Goldstein, S. T.: Propagule transport as a key method of dispersal in benthic foraminifera (Protista), Limnol. Oceanogr., 48, 2163–2170, 2003.
Andersen, K., Kjær, T., and Revsbech, N. P.: An oxygen insensitive microsensor for nitrous oxide, Sensor. Actuat. B-Chem., 42–48, 2001.
Arneborg, L.: Turnover times for the water above sill level in Gullmar Fjord, Continent. Shelf Res., 24, 443–460, 2004.
Brandes, J. A., Devol, A. H., and Deutsch, C.: New Developments in the Marine Nitrogen Cycle, Chem. Rev., 107, 577–89, 2007.
Berg, P., Risgaard-Petersen, N., and Rysgaard, S.: Interpretation of Measured Concentration Profiles in Sediment Pore Water, Limnol. Oceanogr., 43, 1500–1510, 1998.
Bernhard, J. M., Ostermann, D. R., Williams, D. S., and Blanks, J. K.: Comparison of two methods to identify live benthic foraminifera: A test between Rose Bengal and CellTracker Green with implications for stable isotope paleoreconstructions: FORAMINIFERA VIABILITY METHOD COMPARISON, Paleoceanography, 21, PA4210, https://doi.org/10.1029/2006PA001290, 2006.
Bernhard, J. M., Edgcomb, V. P., Casciotti, K. L., McIlvin, M. R., and Beaudoin, D. J.: Denitrification likely catalyzed by endobionts in an allogromiid foraminifer, ISME J., 6, 951–960, 2012.
Björk, G. and Nordberg, K.: Upwelling along the Swedish west coast during the 20th century, Continent. Shelf Res., 23, 1143–1159, 2003.
Breitburg, D., Levin, L. A., Oschlies, A., Grégoire, M., Chavez, F. P., Conley, D. J., Garçon, V., Gilbert, D., Gutiérrez, D., Isensee, K., Jacinto, G. S., Limburg, K. E., Montes, I., Naqvi, S. W. A., Pitcher, G. C., Rabalais, N. N., Roman, M. R., Rose, K. A., Seibel, B. A., Telszewski, M., Yasuhara, M., and Zhang, J.: Declining oxygen in the global ocean and coastal waters, Science, 359, eaam7240, https://doi.org/10.1126/science.aam7240, 2018.
Carstensen, J., Conley, D., and Müller-Karulis, B.: Spatial and temporal resolution of carbon fluxes in a shallow coastal ecosystem, the Kattegat, Mar. Ecol. Prog. Ser., 252, 35–50, 2003.
Cesbron, F., Metzger, E., Launeau, P., Deflandre, B., Delgard, M.-L., Thibault de Chanvalon, A., Geslin, E., Anschutz, P., and Jézéquel, D.: Simultaneous 2D Imaging of Dissolved Iron and Reactive Phosphorus in Sediment Porewaters by Thin-Film and Hyperspectral Methods, Environ. Sci. Technol., 48, 2816–2826, 2014.
Charrieau, L., Filipsson, H. L., Ljung, K., Chierici, M., Knudsen, K. L., and Kritzberg, E.: The effects of multiple stressors on the distribution of coastal benthic foraminifera: A case study from the Skagerrak-Baltic Sea region, Mar. Micropaleontol., 139 (Supplement C), 42–56, 2018.
Charrieau, L. M., Ljung, K., Schenk, F., Daewel, U., Kritzberg, E., and Filipsson, H. L.: Rapid environmental responses to climate-induced hydrographic changes in the Baltic Sea entrance, Biogeosciences, 16, 3835–3852, https://doi.org/10.5194/bg-16-3835-2019, 2019.
Childs, C. R., Rabalais, N. N., Turner, R. E., and Proctor, L. M.: Sediment denitrification in the Gulf of Mexico zone of hypoxia, Mar. Ecol. Prog. Ser., 240, 285–290, https://doi.org/10.3354/meps240285, 2002.
Christensen, P. B., Rysgaard, S., Sloth, N. P., Dalsgaard, T., and Schwærter, S.: Sediment mineralization, nutrient fluxes, denitrification and dissimilatory nitrate reduction to ammonium in an estuarine fjord with sea cage trout farms, Aquat. Microb. Ecol., 21, 73–84, 2000.
Conley, D. J., Carstensen, J., Ærtebjerg, G., Christensen, P. B., Dalsgaard, T., Hansen, J. L. S., and Josefson, A. B.: Long-Term Changes and Impacts of Hypoxia in Danish Coastal Waters, Ecol. Appl., 17, 165–184, 2007.
Cornwell, J. C., Kemp, W. M., and Kana, T. M.: Denitrification in coastal ecosystems: methods, environmental controls, and ecosystem level controls, a review, Aquat. Ecol., 33, 41–54, 1999.
Dale, A. W., Sommer, S., Lomnitz, U., Bourbonnais, A., and Wallmann, K.: Biological nitrate transport in sediments on the Peruvian margin mitigates benthic sulfide emissions and drives pelagic N loss during stagnation events, Deep-Sea Res. Pt. I, 112, 123–136, 2016.
Deldicq, N., Alve, E., Schweizer, M., Asteman, I. P., Hess, S., Darling, K., and Bouchet, V. M. P.: History of the introduction of a species resembling the benthic foraminifera Nonionella stella in the Oslofjord (Norway): Morphological, molecular and paleo-ecological evidences, Aquat. Invasions, 14, 182–205, https://doi.org/10.3391/ai.2019.14.2.03, 2019.
Devol, A. H.: Denitrification including Anammox, Chapter 6, in: Nitrogen in the Marine Environment, edited by: Elsevier Inc, 2nd Edn., Oxford, 263–292, https://doi.org/10.1016/B978-0-12-372522-6.00006-2, 2008.
Diaz, R. J.: Overview of Hypoxia around the World, J. Environ. Qual., 30, 275–281, 2001.
Diaz, R. J. and Rosenberg, R.: Spreading Dead Zones and Consequences for Marine Ecosystems, Science, 321, 926–929, 2008.
Engström, P., Dalsgaard, T., Hulth, S., and Aller, R. C.: Anaerobic ammonium oxidation by nitrite (anammox): Implications for N2 production in coastal marine sediments, Geochim. Cosmochim. Ac., 69, 2057–65, 2005.
Filipsson, H. L., and Nordberg, K.: Climate variations, an overlooked factor influencing the recent marine environment. An example from Gullmar Fjord, Sweden, illustrated by benthic foraminifera and hydrographic data, Estuaries, 27, 867–881, 2004.
Galloway, J. N., Dentener, F. J., Capone, D. G., Boyer, E. W., Howarth, R. W., Seitzinger, S. P., Asner, G. P., Cleveland, C. C., Green, P. A., Holland, E. A., Karl, D. M., Michaels, A. F., Porter, J. H., Townsend, A. R., and Vöosmarty, C. J.: Nitrogen Cycles: Past, Present, and Future, Biogeochemistry, 70, 153–226, 2004.
Geslin, E., Risgaard-Petersen, N., Lombard, F., Metzger, E., Langlet, D., and Jorissen, F.: Oxygen respiration rates of benthic foraminifera as measured with oxygen microsensors, J. Exp. Mar. Biol. Ecol., 396, 108–114, 2011.
Glock, N., Schönfeld, J., Eisenhauer, A., Hensen, C., Mallon, J., and Sommer, S.: The role of benthic foraminifera in the benthic nitrogen cycle of the Peruvian oxygen minimum zone, Biogeosciences, 10, 4767–4783, https://doi.org/10.5194/bg-10-4767-2013, 2013.
Glock, N., Roy, A-S., Romero, D., Wein, T., Weissenbach, J., Revsbech, N. P., Høgslund, S., Clemens, D., Sommer, S., and Dagan, T.: Metabolic preference of nitrate over oxygen as an electron acceptor in foraminifera from the Peruvian oxygen minimum zone, P. Natl. Acad. Sci. USA, 116, 2860–2865, 2019.
Goldberg, T., Archer, C., Vance, D., Thamdrup, B., McAnena, A., and Poulton, S. W.: Controls on Mo isotope fractionations in a Mn-rich anoxic marine sediment, Gullmar Fjord, Sweden, Chem. Geol., 296–297, 73–82, 2012.
Gruber, N. and Sarmiento, J. L.: Global patterns of marine nitrogen fixation and denitrification, Global Biogeochem. Cy., 11, 235–266, 1997.
Gustafsson, M. and Nordberg, K.: Living (stained) benthic foraminiferal response to primary production and hydrography in the deepest part of the Gullmar Fjord, Swedish West Coast, with comparisons to Höglund's 1927 material, J. Foramin. Res., 31, 2–11, 2001.
Hannah, F., Rogerson, R., and Laybourn-Parry, J.: Respiration rates and biovolumes of common benthic Foraminifera (Protozoa), J. Mar. Biol. Assoc. UK, 74, 301–312, 1994.
Herbert, R. A.: Nitrogen cycling in coastal marine ecosystems, FEMS Microbiol. Rev., 23, 563–590, 1999.
Høgslund, S., Revsbech, N. P., Cedhagen, T., Nielsen, L. P., and Gallardo, V. A.: Denitrification, nitrate turnover, and aerobic respiration by benthic foraminiferans in the oxygen minimum zone off Chile, J. Exp. Mar. Biol. Ecol., 359, 85–91, 2008.
Høgslund, S., Cedhagen, T., Bowser, S., and Risgaard-Petersen, N.: Sinks and sources of intracellular nitrate in gromiids, Front. Microbiol., 8, 617, https://doi.org/10.3389/fmicb.2017.00617, 2017.
Hulth, S., Aller, R. C., and Gilbert. F.: Coupled anoxic nitrification/manganese reduction in marine sediments, Geochim. Cosmochim. Ac., 63, 49–66, 1999.
Jäntti, H. and Hietanen, S.: The Effects of Hypoxia on Sediment Nitrogen Cycling in the Baltic Sea, AMBIO, 41, 161–169, 2012.
Karlson, K., Bonsdorff, E., and Rosenberg, R.: The Impact of Benthic Macrofauna for Nutrient Fluxes from Baltic Sea Sediments, AMBIO, 36, 161–167, 2007.
Kamp, A., Høgslund, S., Risgaard-Petersen, N., and Stief, P.: Nitrate Storage and Dissimilatory Nitrate Reduction by Eukaryotic Microbes, Front. Microbiol., 6, 2015.
Kemp, W. M., Sampou, P., Caffrey, J., Mayer, M., Henriksen, K., and Boynton, W. R.: Ammonium recycling versus denitrification in Chesapeake Bay sediments, Limnol. Oceanogr., 35, 1545–1563, 1990.
Kemp, W. M., Boynton, W. R., Adolf, J. E., Boesch, D. F., Boicourt, W. C., Brush, G., Cornwell, J. C., Fisher, T. R., Glibert, P. M., Hagy, J. D., Harding, L. W., Houde, E. D., Kimmel, D. G., Miller, W. D., Newell, R. I. E., Roman, M. R., Smith, E. M., and Stevenson, J. C.: Eutrophication of Chesapeake Bay: Historical trends and ecological interactions, Mar. Ecol. Prog. Ser., 303, 1–29, 2005.
Koho, K. A., Piña-Ochoa, E., Geslin, E., and Risgaard-Petersen, N.: Vertical migration, nitrate uptake and denitrification: survival mechanisms of foraminifers (Globobulimina turgida) under low oxygen conditions, FEMS Microbiol. Ecol., 75, 273–283, 2011.
LeKieffre, C., Spangenberg, J. E., Mabilleau, G., Escrig, S., Meibom, A., and Geslin, E.: Surviving anoxia in marine sediments: The metabolic response of ubiquitous benthic foraminifera (Ammonia tepida), Plos ONE, 12, e0177604, https://doi.org/10.1371/journal.pone.0177604, 2017.
Levin, L. A., Ekau, W., Gooday, A. J., Jorissen, F., Middelburg, J. J., Naqvi, S. W. A., Neira, C., Rabalais, N. N., and Zhang, J.: Effects of natural and human-induced hypoxia on coastal benthos, Biogeosciences, 6, 2063–2098, https://doi.org/10.5194/bg-6-2063-2009, 2009.
Lindahl, O. and Hernroth, L.: Phyto-Zooplankton Community in Coastal Waters of Western Sweden – An Ecosystem Off Balance?, Mar. Ecol. Prog. Ser., 10, 119–126, 1983.
Lindahl, O., Belgrano, A., Davidsson, L., and Hernroth, B.: Primary production, climatic oscillations, and physico-chemical processes: The Gullmar Fjord time-series data set (1985–1996), ICES J. Mar. Sci., 55, 723–72, 2003.
Luther, G. W., Sundby, B., Lewis, B. L., Brendel, P. J., and Silverberg, N.: Interactions of manganese with the nitrogen cycle: Alternative pathways to dinitrogen, Geochim. Cosmochim. Ac., 61, 4043–4052, 1997.
Maire, O., Barras, C., Gestin, T., Nardelli, M., Romero-Ramirez, A., Duchêne, J., and Geslin, E.: How does macrofaunal bioturbation influence the vertical distribution of living benthic foraminifera?, Mar. Ecol. Prog. Ser., 561, 83–97, 2016.
Metzger, E., Thibault de Chanvalon, A., Cesbron, F., Barbe, A., Launeau, P., Jézéquel, D., and Mouret, A.: Simultaneous Nitrite/Nitrate Imagery at Millimeter Scale through the Water–Sediment Interface, Environ. Sci. Technol., 50, 8188–8195, https://doi.org/10.1021/acs.est.6b00187, 2016.
Mortimer, R. J. G., Harris, S. J., Krom, M. D., Freitag, T. E., Prosser, J. I., Barnes, J., Anschutz, P., Hayes, P. J., and Davies, I. M.: Anoxic nitrification in marine sediments, Mar. Ecol. Prog. Ser., 276, 37–51, 2004.
Neubacher, E. C., Parker, R. E., and Trimmer, M.: The potential effect of sustained hypoxia on nitrogen cycling in sediment from the southern North Sea: a mesocosm experiment, Biogeochemistry, 113, 69–84, https://doi.org/10.1007/s10533-012-9749-5, 2013.
Nizzoli, D., Bartoli, M., Cooper, M., Welsh, D. T., Underwood, G. J. C., and Viaroli, P.: Implications for oxygen, nutrient fluxes and denitrification rates during the early stage of sediment colonisation by the polychaete Nereis spp. in four estuaries, Estuar. Coast. Shelf S., 75, 125–134, 2007.
Nomaki, H., Chikaraishi, Y., Tsuchiya, M., Toyofuku, T., Suga, H., Sasaki, Y., Uematsu, K., Tame, A., and Ohkouchi, N.: Variation in the nitrogen isotopic composition of amino acids in benthic foraminifera: Implications for their adaptation to oxygen-depleted environments, Limnol. Oceanogr., 60, 1906–1916, 2015.
Nordberg, K.: Oceanography in the Kattegat and Skagerrak Over the Past 8000 Years, Paleoceanography, 6, 461–484, 1991.
Nordberg, K., Gustafsson, M., and Krantz, A.-L.: Decreasing oxygen concentrations in the Gullmar Fjord, Sweden, as confirmed by benthic foraminifera, and the possible association with NAO, J. Marine Syst., 23, 303–316, 2000.
Piña-Ochoa, E., Hogslund, S., Geslin, E., Cedhagen, T., Revsbech, N. P., Nielsen, L. P., Schweizer, M., Jorissen, F., Rysgaard, S., and Risgaard-Petersen, N.: Widespread occurrence of nitrate storage and denitrification among Foraminifera and Gromiida, P. Natl. Acad. Sci. USA, 107, 1148–1153, 2010.
Polovodova Asteman, I. and Nordberg, K.: Foraminiferal fauna from a deep basin in Gullmar Fjord: The influence of seasonal hypoxia and North Atlantic Oscillation, J. Sea Res., 79, 40–49, 2013.
Polovodova Asteman, I. and Schönfeld, J.: Recent invasion of the foraminifer Nonionella stella Cushman and Moyer, 1930 in northern European waters: evidence from the Skagerrak and its fjords, J. Micropalaeontol., 35, 20–25, 2015.
Polovodova Asteman, I., Filipsson, H. L., and Nordberg, K.: Tracing winter temperatures over the last two millennia using a north-east Atlantic coastal record, Clim. Past, 14, 1097–1118, https://doi.org/10.5194/cp-14-1097-2018, 2018.
Prokopenko, M. G., Sigman, D. M., Berelson, W. M., Hammond, D. E., Barnett, B., Chong, L., and Townsend-Small, A.: Denitrification in anoxic sediments supported by biological nitrate transport, Geochim. Cosmochim. Ac., 75, 7180–7199, 2011.
Rabalais, N. N., Díaz, R. J., Levin, L. A., Turner, R. E., Gilbert, D., and Zhang, J.: Dynamics and distribution of natural and human-caused hypoxia, Biogeosciences, 7, 585–619, https://doi.org/10.5194/bg-7-585-2010, 2010.
Ramsing, N. and Gundersen J.: Seawater and Gases-Tabulated Physical Parameters of Interest to People Working with Microsensors in Marine Systems, Version 2.0, Unisense Internal Report, 1994.
Revsbech, N. P.: An oxygen microsensor with a guard cathode, Limnol. Oceanogr., 34, 474–478, 1989.
Risgaard-Petersen, N., Langezaal, A. M., Ingvardsen, S., Schmid, M. C., Jetten, M. S. M., Op den Camp, H. J. M., Derksen, J. W. M., Piña-Ochoa, E., Eriksson, S. P., Peter Nielsen, L., Peter Revsbech, N., Cedhagen, T., and van der Zwaan, G. J.: Evidence for complete denitrification in a benthic foraminifer, Nature, 443, 7107, 93–96, 2006.
Ross, B. J. and Hallock, P.: Dormancy in the Foraminifera: a review, J. Foramin. Res., 46, 358–368, 2016.
Rysgaard, S., Risgaard-Petersen N., Sloth N. P., Jensen K., and L. P., Nielsen L. P.: Oxygen Regulation of Nitrification and Denitrification in Sediments, Limnol. Oceanogr., 39, 1643–1652, 1994.
Seitzinger, S. P.: Denitrification in freshwater and coastal marine ecosystems: Ecological and geochemical significance, Limnol. Oceanogr., 33, 702–724, 1988.
Sigman, D. M., Karsh, K. L., and Casciotti, K. L.: Nitrogen Isotopes in the Ocean, in: Encyclopedia of Ocean Sciences, Elsevier Ltd., 40–54, https://doi.org/10.1016/B978-012374473-9.00632-9, 2009.
Stachowitsch, M.: Mass Mortality in the Gulf of Trieste: The Course of Community Destruction, Mar. Ecol., 5, 243–264, 1984.
Stief, P.: Stimulation of microbial nitrogen cycling in aquatic ecosystems by benthic macrofauna: mechanisms and environmental implications, Biogeosciences, 10, 7829–7846, https://doi.org/10.5194/bg-10-7829-2013, 2013.
Stockdale, A., Davison, W., and Zhang, H.: Micro-scale biogeochemical heterogeneity in sediments: A review of available technology and observed evidence, Earth-Sci. Rev., 92, 81–97, 2009.
Svansson, A.: Physical and chemical oceanography of the Skagerrak and the Kattegat, Report No. 1, Institute of Marine Research, Göteborgs universitet, 1975.
Svansson, A.: Hydrography of the Gullmar fjord, Meddelande fran Havsfiskelaboratoriet, Lysekil, 23, 22 pp., 1984.
Swedish Meteorological and Hydrological Institute's (SMHI): Svenskt HavsARKivs webbplats (SHARKweb), https://sharkweb.smhi.se/ (last access: 13 July 2020), 2020.
Thamdrup, B. and Dalsgaard, T.: Microbial Ecology of the Oceans, John Wiley and Sons, Ltd, Hoboken, NJ 07030, USA, 2008.
Woehle, C., Roy, A-S., Glock, N., Wein, T., Weissenbach, J., Rosenstiel, P., Hiebenthal, C., Michels, J., Schönfeld, J., and Dagan, T.: A Novel Eukaryotic Denitrification Pathway in Foraminifera, Curr. Biol., 28, 1–8, https://doi.org/10.1016/j.cub.2018.06.027, 2018.
Xu, Z., Liu, S., Xiang, R., and Song, G.: Live benthic foraminifera in the Yellow Sea and the East China Sea: vertical distribution, nitrate storage, and potential denitrification, Mar. Ecol. Prog. Ser., 571, 65–81, 2017.
Zhang, J., Gilbert, D., Gooday, A. J., Levin, L., Naqvi, S. W. A., Middelburg, J. J., Scranton, M., Ekau, W., Peña, A., Dewitte, B., Oguz, T., Monteiro, P. M. S., Urban, E., Rabalais, N. N., Ittekkot, V., Kemp, W. M., Ulloa, O., Elmgren, R., Escobar-Briones, E., and Van der Plas, A. K.: Natural and human-induced hypoxia and consequences for coastal areas: synthesis and future development, Biogeosciences, 7, 1443–1467, https://doi.org/10.5194/bg-7-1443-2010, 2010.