the Creative Commons Attribution 4.0 License.
the Creative Commons Attribution 4.0 License.
 | 01 Jul 2021
Methane in the Danube Delta: the importance of spatial patterns and diel cycles for atmospheric emission estimates
Bernhard Wehrli
Arne Körtzinger
Methane (CH4) is one of the substantial greenhouse gases in our atmosphere, and its concentration has increased by ∼ 4 % over the last decade. Although sources driving these increases are not well constrained, one potential contribution comes from wetlands, which are usually intertwined with rivers, channels and lakes, creating a considerable need to acquire higher-resolution data to facilitate modelling and predictions. Here we took a fully contained sensor set-up to obtain measurements of CH4, O2 and auxiliary parameters, installed on a houseboat for accessibility, to assess and analyse surface water concentrations within the Danube Delta, Romania. During three expeditions in different seasons, we transected a ∼ 400 km route with concentration mapping and two additional stations for monitoring diel cycles. Overall, the delta was a source for CH4 throughout all seasons, with concentrations ranging between 0.113–15.6 µmol L−1. Calculated diffusive CH4 fluxes for the overall delta yielded an average of 49 ± 61 µmol m−2 h−1, corresponding to an extrapolated annual flux of 0.43 ± 0.53 mol m−2 yr−1. The dataset was split into three different subsystems – lakes, rivers and channels – with channels showing the highest variability. We found overlapping CH4 concentrations throughout each subsystem, with large inflows coming from reed beds and channels into the lakes. Seasonal variability and water flow direction also influenced the overall dynamics in each region. We found large to extreme diel cycles in both the lakes and channels, with concentrations varying by an order of magnitude between these two systems. The lake diel cycle showed a clear linear trend with an O2:CH4 molar ratio of during the phase of nocturnal convection, with the two water stratified bodies mixing during the night, suggesting daily vertical stratification allowing for macrophytes to create a temporal oxycline due to a lack of light and movement between the stems as previously suggested, and potentially incurring an uncertainty range of a factor of 4.5. Our data illustrate the importance of high-resolution spatio-temporal data collection throughout the entire delta and the increased need for diel cycles in different habitats to improve the concentration and emission estimates from wetland systems.
- Article
(5149 KB) - Full-text XML
-
Supplement
(1203 KB) - BibTeX
- EndNote


Methane (CH4) is one of the most relevant anthropogenic greenhouse gases following carbon dioxide (CO2), with an estimated global emission rate of 572 Tg CH4 yr−1 for the decade 2003–2012 (Saunois et al., 2020). More recently, we have seen an accelerated increase from 1775 ppb in 2006 to 1850 ppb in 2017, and over a 100-year interval, CH4 is 34 times more potent as a greenhouse gas than CO2 when including climate carbon feedbacks (28 times without feedbacks: Myhre et al., 2013; Schubert and Wehrli, 2019). This continued increase has the potential to reverse any progress made for climate mitigation by reducing CO2 emissions (Nisbet et al., 2019). Biogenic emissions from wetlands (Nisbet et al., 2019) contribute strongly to the overall estimate of 159 (117–212) Tg CH4 yr−1 from inland waters (Saunois et al., 2020). Although these emission numbers have high uncertainties, aquatic systems are known to act as net sources (Bastviken et al., 2011; Raymond et al., 2013). Inland waters are known to have a significant CH4 source strength and, therefore, have seen an increase in attention (see Abril and Borges, 2005; Panneer Selvam et al., 2014; Richey et al., 2002; Wang et al., 2009; Melton et al., 2013; Zhang et al., 2018).
Natural wetlands are one of the single largest sources of methane (125–218 Tg CH4 yr−1), accounting for roughly one-third of total (anthropogenic and natural) emissions (Dean et al., 2018; Saunois et al., 2020). They are usually intertwined with rivers, channels and lakes, making them highly diverse regions. Due to lakes being some of the easier systems to measure and compare, they are the most extensively covered components of inland waters, although they only cover 0.9 % of the Earth's surface. DelSontro et al. (2018) illustrate the large uncertainties in methane emission data. Depending on the upscaling methods, these authors arrive at global CH4 emission rates from lakes in the range of 78–248 Tg CH4 C yr−1. Specifically, shallow lakes are known to generally be hot spots in terms of CH4 emissions (Cole et al., 2007; Davidson et al., 2018).
Rivers emit around 26.8 Tg CH4 yr−1, excluding ebullition (Stanley et al., 2016); however, due to a lack of global data coverage and consistency, their role in both carbon transport and storage is not well constrained (Tranvik et al., 2009). In general, there is a need for more detailed assessment of the role of rivers and channels for methane emissions as they have been suggested to be more spatio-temporally variable for CH4 than CO2 (Stanley et al., 2016; Natchimuthu et al., 2017).
Methane is produced in anaerobic environments, mostly within sediments (Schubert and Wehrli, 2019). Transport mechanisms to the atmosphere include turbulent diffusion through the water column followed by diffusive gas exchange across the water–air interface. Methane-oxidizing bacteria in the water column reduce methane concentrations depending on the mixing regime. At high supersaturation and low hydrostatic pressure, bubbles can form, and depending on their size ebullition offers a direct pathway from the sediments to the atmosphere (DelSontro et al., 2015).
With climate warming, CH4 production is set to increase from lakes as well as through eutrophication (Marotta et al., 2014; DelSontro et al., 2018; Sepulveda-Jauregui et al., 2018). Bartosiewicz et al. (2019) suggest that global warming will increase surface water temperatures and strengthen lake stratification (Woolway et al., 2019). These authors suggest this may lead to an increase the CH4 production in bottom waters, potentially leading to +8 % of the current global lake emissions from shallow (< 5 m) lakes. Therefore, analysing the spatial and temporal (i.e. at least seasonal and diel) variability of methane emissions is important for future predictions and modelling efforts. Temporal variability, such as diel cycles of dissolved gases within inland waters, is driven by multiple processes including temporal variability of biological processes such as photosynthesis and respiration, transportation, vertical stratification, or temperature-dependent solubility (Nimick et al., 2011; Maher et al., 2015; Zhang et al., 2018; Sieczko et al., 2020). Although potentially substantial, these are rarely considered in studies of CH4 fluxes due to a general lack of data. Just as with overall data coverage of CH4, both spatially and temporally, there is also need for refined understanding of the contributions and the controls of CH4 production and sources (Bogard et al., 2014; Abril and Borges, 2019).
Given the complexity of inland water systems, especially wetland complexes, monitoring approaches were often focused on only one water type, such as a river reach or a lake. Here we deployed an on-site monitoring device throughout the Danube Delta, which measured gas concentrations continuously from a moving platform. The acquired high spatial and temporal resolution of methane concentrations and corresponding emissions formed a unique observational data basis. Continuous measurements across the delta allowed us to assess the importance of different systems (lakes, rivers and channels). The high-frequency data at specific sites yielded insights into diel cycles and the specific day–night dynamics of methane emissions.
The Danube Delta, as most river deltas, is known to be an important natural source of CH4 (Cuna et al., 2008; Durisch-Kaiser et al., 2008; Pavel et al., 2009). Recently, Maier et al. (2021) investigated the seasonal emission rates of CO2 and CH4 in parts of the Danube Delta, focusing on a set of stations that were analysed at monthly intervals. Here, we take a complementary approach with a measurement frequency up to 1 Hz. This allows not only for high-resolution data both in time and space but also for a detailed look at the diel variability timescale.
The objectives of this study are split into two main aspects: (1) to assess the differences between regions within the Danube Delta in regards to CH4 concentrations and fluxes, and (2) to use high-resolution data to explore the importance of a spatial variability and a diel cycle on local and regional concentrations and emission rates.
2.1 Set-up
A portable and versatile flow-through sensor set-up was placed aboard a small houseboat for continuous mapping throughout the Danube Delta. Campaigns took place over three seasons: May (17–26), August (3–12) and October (13–23) 2017. The set-up consisted of the HydroC® CH4 flow-through (FT) (CH4 partial pressure, pCH4, -4H-JENA engineering GmbH, Jena), HydroFlash® O2 (dissolved oxygen, O2, -4H-JENA) and a SBE 45 thermosalinograph (Sea-Bird Electronics, Bellevue, USA) to measure temperature and conductivity. All sensors ran simultaneously at a speed of up to 1 Hz on the same continuous water flow (submersible pump deployed over the side at a depth of approx. 40 cm). The HydroC® CH4 FT uses tunable diode laser absorption spectroscopy (TDLAS) technology, while the HydroFlash® O2 optode sensor uses the principle of dynamic fluorescence quenching (Bittig et al., 2018). Further details on the set-up, its calibration and validation can be found in Canning et al. (2021).
2.2 Study site
The Danube Delta is located on the Black Sea coast of Ukraine and Romania (44∘25′–45∘30′ N and 28∘45′–29∘46′ E). Originating in Germany, the Danube River travels across 2857 km, with a drainage basin of 817 000 km2 (Panin, 2003). The delta is a complex system of wetlands, lakes, rivers and channels, both man-made and natural, with the largest compact reed bed zone in the world (Oosterberg et al., 2000; Panin, 2003). The fluvio-marine delta system accounts for 51 % of the total area (Pavel et al., 2009) in which it sees salt intrusions and through-flow from the Black Sea into the delta. Since the 1970s, the Danube Delta has been subject to eutrophication, with its peak during 1987–1988 (Cristofor et al., 1993; Galatchi and Tudor, 2006; Enache et al., 2019). After a decrease in nutrient loads in the 1990s, due to socioeconomic changes in eastern Europe, a slow decline of nutrient levels was observed (Rîşnoveanu et al., 2004; Pavel et al., 2009); however, more recent levels comparable to those in 1988 were reported (Tudor et al., 2016; Spiridon et al., 2018).

Figure 1The Danube Delta, Romania, with the cruise tracks from the three seasonal campaigns split into rivers (blue), lakes (green) and channels (dark red). Systems of lake complexes in orange: Roşu–Puiu (b) and Gorgova–Uzlina (c). Panels (b) and (c) show lakes Puiu (b(i)), Roşu (b(ii)), Roşuleţ (b(iv)), Uzlina (c(v)) and Isac (c(vi)). Blue circles indicate the sites of the two diel cycles at Lake Roşu (b(b1)) and the hot spot channel (b(b2)), both during the August campaign. The Gorgova meteorological station is located in the middle of the delta (orange dot). More in-depth labelling can be found in Sect. S1.3.
The delta is within the temperate climate system but experiences broad annual ranges of air temperature from below freezing to more than 30 ∘C (ICDP, 2004). Deltas are continuously changing landscapes, with moving lake systems and floating islands. The overall Danube Delta is roughly 4423 km2, with a 67 %–81 % coverage in either aquatic ecosystems (rivers, lakes and channels) or wetlands (Cristofor et al., 1993). In the anthropogenically modified Danube Delta we refer to the internal connections between the main river reaches and the lakes as channels (Kasprak et al., 2016). Using the small houseboat, the set-up was fixed, and a transect throughout the delta was carried out with extensive lake transects completed in all three seasons for comparability (Fig. 1); further details can be found in Canning et al. (2021). The average total area covered was 380 km2 across the entire delta for each campaign, with an average measured distance of 107, 108 and 160 km2 for rivers, lakes and channels respectively. Due to blockages in the channel between Lake Puiu and Lake Roşu, the transect had to be changed slightly between seasonal campaigns. This study also featured two stationary diel cycle measurements (Fig. 1b: blue circles), one in Lake Roşu and the other in the channel, where we observed a major biogeochemical hot spot (Sect. S1.1).
2.3 Rivers, lakes and channels
Separation between rivers, lakes and channels was estimated visually where the border of the lake/channel/river starts and ends, ensuring the same regions were separated between the differing months. We classed channels as smaller bodies connecting between regions, with only the two larger branches as rivers, given their size, slightly faster flowing and greater depth. To statistically separate between rivers, lakes and channels, a Kruskal–Wallis test was conducted due to the data being non-normally distributed (see Sect. S1.1 for visualization of results). For CH4, all regions were statistically different (p<0.001). This was also the case between channels and the hot spot, which was assessed the same way (p<0.001). Regions classed as between water boundaries are areas such as channels leading into lakes – the mixing regimes between two systems. These occurred mainly in lakes where channels were entering and crossover of gas concentrations was observed (Fig. S4).
2.4 Computations of saturation and fluxes
The average global atmospheric CH4 concentration (ppb) was taken from the NOAA/ESRL Global Monitoring Division program (Dlugokencky, 2019) for May, August and October 2017 (1847, 1844.7 and 1858.1 ppb respectively). These values were used due to the negligible difference in the overall fluxes found when using other, more local values, due to the extreme waterside supersaturation. As the delta is practically sea level, barometric pressure and wind speed measured at the Gorgova station in the centre of the delta were used (Fig. 1 orange dot). Schmidt numbers (Sc) were calculated for temperature dependence following (Wanninkhof, 2014) for fresh water. The corrected Schmidt numbers varied between 296 and 824 in this study, consistent with the large temperature variance. Using CH4 solubility (Wiesenburg and Guinasso, 1979), CH4 equilibrium concentrations in water were calculated and employed in the flux calculation. Fluxes were calculated following Peeters et al. (2019; Sect. S3.2). Given slow stream velocities (with a maxima smaller than 30 cm s−1, excluding flooding events), we used the parameterization from Cole and Caraco (1998) with constant gas-transfer velocity of ∼ 2 cm h−1 in the absence of wind:
where U is wind speed at 10 m height in metres per second (m s−1), and k600 is the gas-transfer velocity normalized to a Schmidt number of 600, i.e. CO2 in fresh water at 20 ∘C (Jähne et al., 1987; Crusius and Wanninkhof, 2003):
where is the transfer velocity at , which is the Schmidt number of CH4 at a given temperature, and the exponential n reflects two wind speed regimes (Jähne et al., 1987). For rivers, due to differencing fetch and dynamics we used throughout, consistent with multiple river studies (Borges et al., 2004; Guérin et al., 2007; Bange et al., 2019). The flux was then calculated using the CH4 concentration in the water and air:
Given that the effect of spatial variability of is relatively small in lakes with surface areas of 5×10⁵ m2 or larger (Schilder et al., 2013), we disregarded size effects of lakes on emission fluxes noted by Schilder et al. (2013). It is to be noted that these fluxes are estimates, and although wind was measured within the delta, the k600 value may vary significantly from measured in situ wind values. Due to direct measurements collected previously in the years 2015 and 2016 (Maier et al., 2021), a comparison of k600 is shown in Sect. S1.2. In the following analyses, both day and night data will be shown unless stated otherwise for CH4.
3.1 Concentrations distribution and estimated fluxes
Our high spatio-temporal resolution CH4 data showed consistent supersaturation (CH4 concentration range 0.113 to 15.6 µmol L−1) throughout the delta. Both a strong systemical and seasonal variability was observed, with channels having the highest concentrations of up to 15.6 µmol L−1 (Table 1) and showing overall a magnitude higher values compared to rivers. The concentrations are within the lower ranges previously observed (0.02 to 280 µmol L−1) for CH4 in oxic fresh waters (Tang et al., 2016; Bižić-Ionescu et al., 2019).
Throughout the delta, high spatial variability was found across systems and water type boundaries (such as streams to lakes), which was also observed clearly by Crawford et al. (2017). More confined areas in closer proximity to the wetlands were found to have the highest concentrations (further discussed below). These boundary crossovers, where higher concentrations were visible to proceeding regions, were due to seasonal changes in concentrations and change of flow direction varying throughout the delta (Fig. S4). This generally led to highly skewed CH4 concentrations (Fig. 2), with generally rather low values, yet many larger more dispersed values. In each season, three specific locations stood out with extreme CH4 concentrations: the two channels joining Lake Puiu (Channel Caraorman: Sect. S1.3) and the hot spot channel anomaly (Fig. 1b2; see Sect. S1.1 for visualization of statistical significance p<0.001). Rivers and channels (including the anomaly) showed the highest variability during August and May (Fig. 2), consistent with the directional flow regime bringing in the water from the surrounding wetlands after the flood waters. The highest median was observed during October for rivers, lakes and channels (median: 0.559, 0.693 and 1.5 µmol L−1 respectively), potentially due to macrophyte senesce and decomposition.
Oxygen (O2) concentration in the water was mostly below saturation; however, measurements were not distributed proportionally throughout the delta, potentially leading to the lower median in May from more measurements collected in the hot spot. During August and October, O2 saturation (%) was generally above 60 %, with August showing the largest variability above 100 %, coinciding with both temperature and production. However, O2 saturation was frequently very low and undersaturated, indicating strong respiration in the water or flowing in from the reed belt. Wetland waters entering the fluvial systems are often de-oxygenated (Zuidgeest et al., 2016), and as the hot spot stations represents sites receiving water from the wetland, it is likely not the only such site in the delta.
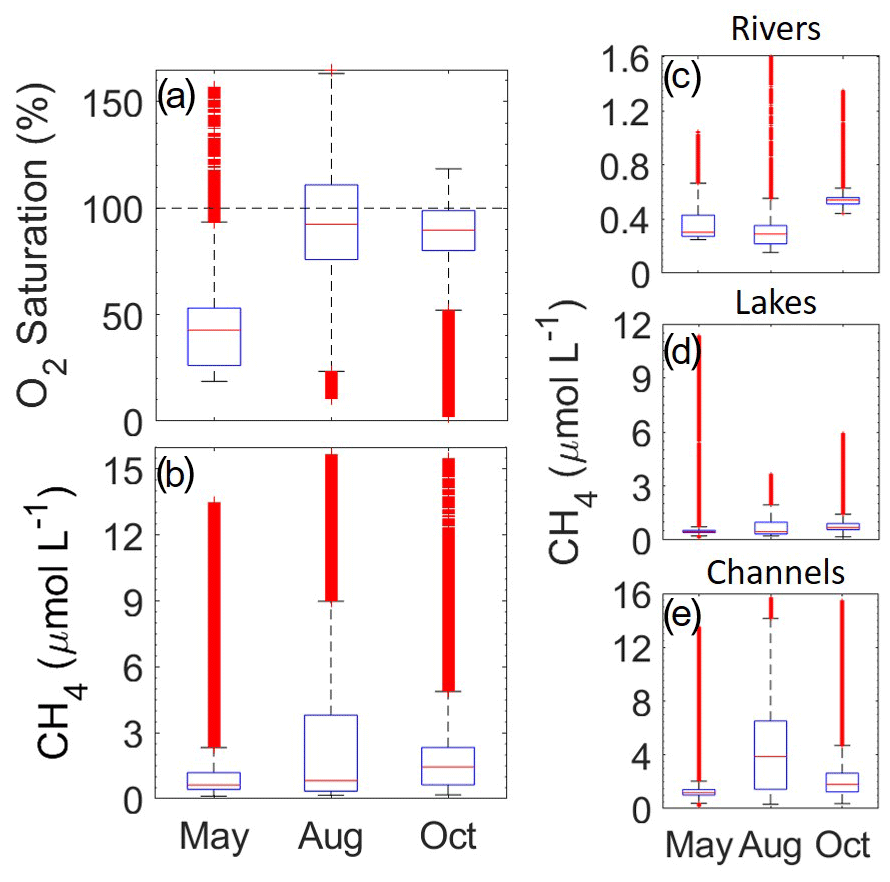
Figure 2(a, b) Oxygen saturation (%) and CH4 concentration (µmol L−1) data from the three seasonal campaigns: May, August and October. (c–e) CH4 concentrations split by water type (rivers, channels and lakes). The blue boxes represent lower (25 %) and upper (75 %) quartiles, with the whiskers marking the lowest and highest data point within a distance of 1.5 times the interquartile range from the respective quartile. Red “+” signifies points outside of these boundaries. Median values are shown as horizontal red lines. All data are included (n>200 000 for each season), including the hot spot and day–night cycle data.
Concentrations almost translate to the water–air fluxes (Fig. 3), which were calculated using wind data and therefore include the effect of wind speed. However, due to non-in situ measurements of the wind data, results should be seen as more of an estimate. We used the estimated area from Maier et al. (2021) for total area of rivers, channels and lakes (164, 33, 258 km2 respectively) and the average emission rates in Table 1. By taking the average flux for each region across all seasons combined (Table 1), annual estimates for methane emissions are 16.1, 81.9 and 24.9 µmol m−2 h−1 for rivers, channels and lakes, respectively. The combined overall mean outgassing flux is then 49 ± 61 µmol m−2 h−1. This gave an emission range of 2–5.4 t yr−1 CH4 for the combined region covered by rivers, lakes and streams (455 km2). To give an estimate of the Danube River on a global context, we used the mean estimated flux and applied this to the total area over the entire year. As the global overall average estimate for wetlands, lakes, streams and rivers of 117–212 Tg CH4 yr−1 (Saunois et al., 2020) from a total area of 596–894 million ha translates to an average global emission of 140–170 µmol m−2 h−1, this is about a factor of 3 higher than the flux rate obtained here for the Danube Delta. However, it should be noted that our estimates for diffuse fluxes were based on concentration measurements in the surface waters; therefore, the influence by different processes are eliminated.
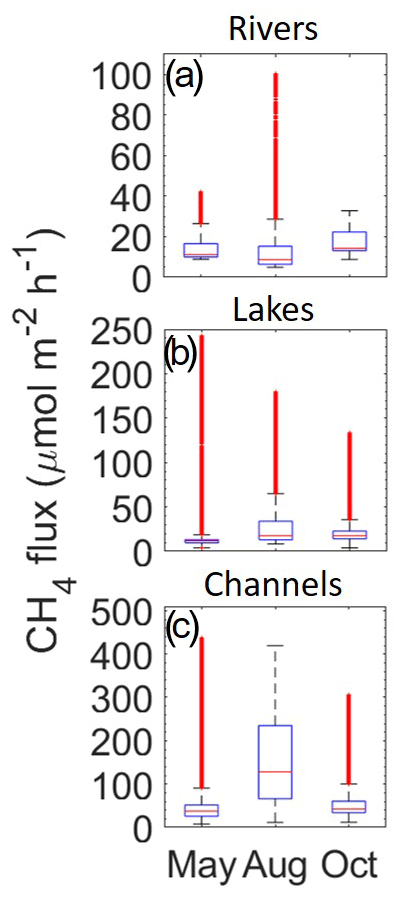
Figure 3Calculated CH4 flux (µmol m−2 h−1) data from the three seasonal campaigns: May, August and October for rivers (a), lakes (b) and channels (c). The blue boxes represent lower (25 %) and upper (75 %) quartiles, with the whiskers marking the lowest and highest data point within a distance of 1.5 times the interquartile range from the respective quartile. Red “+” signifies points outside of these boundaries. Median values are shown as horizontal red lines. All data are included (n>200 000 for each season), including the hot spot and day–night cycle data.
In their study over 2 years, however, Maier et al. (2021) found evidence that bubble emission of methane in the Danube Delta lakes and channels potentially accounted for ∼ 70 % . CH4 fluxes calculated in this study were within the ranges of diffusive flux measurements reported by Maier et al. (2021) for rivers and lakes, whereas channels were within the range observed using their total fluxes (diffusive and potential ebullition fluxes), exceeding that of purely diffusive flux measurements. Median lake measurements within this study were about 63 % lower than that reported by Maier et al. (2021), using total fluxes. This coincides well with the ∼ 70 % accountability for ebullition fluxes from lakes.
Although measured within the same regions, methods from both studies are not comparable due to the use of floating chambers at a few specific locations, potentially missing highly variable spatial variation and explaining the far larger diffusive fluxes found here in channels (Maier et al., 2021: 160–6200 µmol m−2 d−1, this study: 182–10 500 µmol m−2 d−1). Further more, chamber measurements are focused on picking up ebullition fluxes, which can be high, whereas this study estimates diffuse fluxes, based on concentration measurements in the surface waters. The two methods are therefore influenced by different processes; however, comparison of k600 can be found in Sect. S1.2.
Table 1Range (minimum: Min, maximum: Max) and median (Med) of CH4 concentrations (µmol L−1), CH4 saturation (%) and CH4 flux (µmol m−2 h−1) for rivers (R), channels (Ch) the hot spot channel (HS) and lakes (L) over the three seasons: May, August and October 2017.
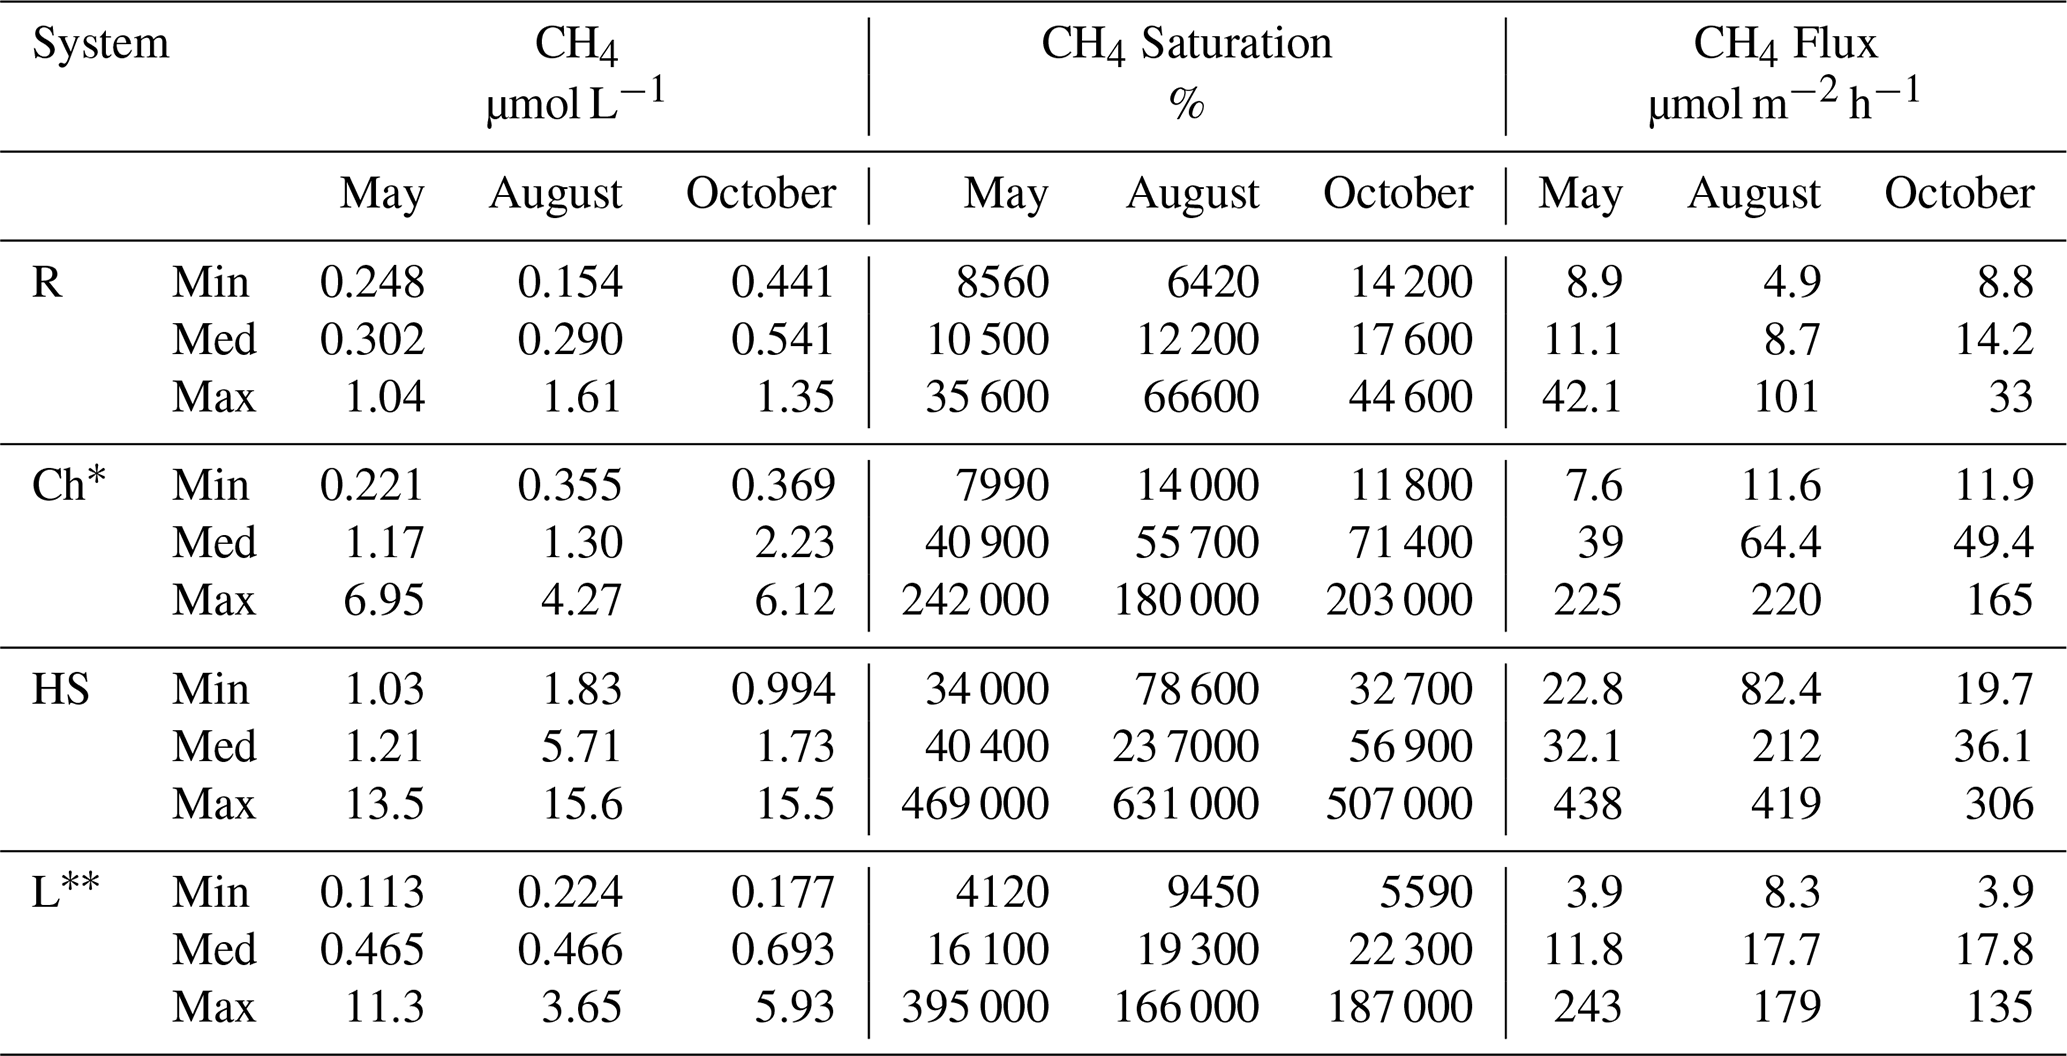
∗ Excluding the hot spot and connecting channels, due to this location experiencing extremely high concentrations as an anomaly within our full transect. Influence on edges from the channels into the lakes, across the border but meaning few metres of extreme concentrations.
3.1.1 Seasonality processes
Different processes influence the seasonal carbon turnover and methane production in the delta. High concentrations and therefore fluxes during May have previously been explained due to growth, temperature and biomass peak, linking plant biomass to CH4 emissions during growing season (Milberg et al., 2017). This can be further linked to the previous flood period just before the transect in May. Flooding will push oxygenated water into the reed stands and decrease emissions, while flood recession will move anoxic water from the reed into the channels and trigger ebullition (Gatland et al., 2014). Due to measuring following the flooding, this may potentially explain the elevated concentrations within the channel prior to the hot spot (Fig. 4a red box). The Danube Delta is known to have high levels of nutrients (Panin, 2003; Durisch-Kaiser et al., 2008; Spiridon et al., 2018) arriving from the Danube River. This could account for CH4 higher concentrations, as well as saturation due to enhanced plankton growth being a source of additional labile organic matter fuelling CH4 productivity in the sediments, which then outfluxes (Mendonça et al., 2012; Ward et al., 2017).
August had the lowest water levels of each season, and although it showed the largest CH4 range among the seasons, it had the lowest measured median values, coinciding with the hypothesis that there is an overall decrease in CH4 concentration values during lower water levels (Melack et al., 2004; Marín-Muñiz et al., 2015; McGinnis et al., 2016). However, during August and October, the process of macrophyte degradation within the delta in both lakes and channels was linked with elevated CH4 concentrations in specific locations (Fig. 4). This sharp increase in biodegradable organic matter could have been triggered anoxic decomposition of organic carbon, which could have been responsible for released CH4 (Segers, 1998). This is visible in Fig. 4d–f; although channels had higher CH4 concentration, in August and October higher concentrations within the lakes were more visible (Fig. S4).
The channels are highly influenced by the surrounding reed beds, which are known to produce high levels of CH4 (Bastviken et al., 2011), and have an influence on the surrounding systems they flow into (e.g. lakes). This could explain the high variability (Figs. 2 and 4) and higher overall concentrations and fluxes (Table 1). They are also influenced from river reaches, channels and lakes that are sources of labile organic carbon fuelling methanogenesis (Schubert and Wehrli, 2019). However, given methanogenesis was not measured, we can only make assumptions about this.
Given delta systems are highly diverse, each region has been split to give a more descriptive assessment of the dynamics in the Danube Delta.
3.1.2 Hot spot
The hot spot was classified as a small channel system receiving partially anoxic water from the reed stands (Fig. 1b(b1)). The highest conductivity was observed around the hot spot as 0.08 S m−1 (overall mean ± SD of 0.038 ± 0.005 S m−1), suggesting also the potential of ground water influences (see Harvey et al., 1997). The hot spot and adjacent channels were observed to be significantly different to other channels measured in this study (p<0.001, Sect. S1.1).
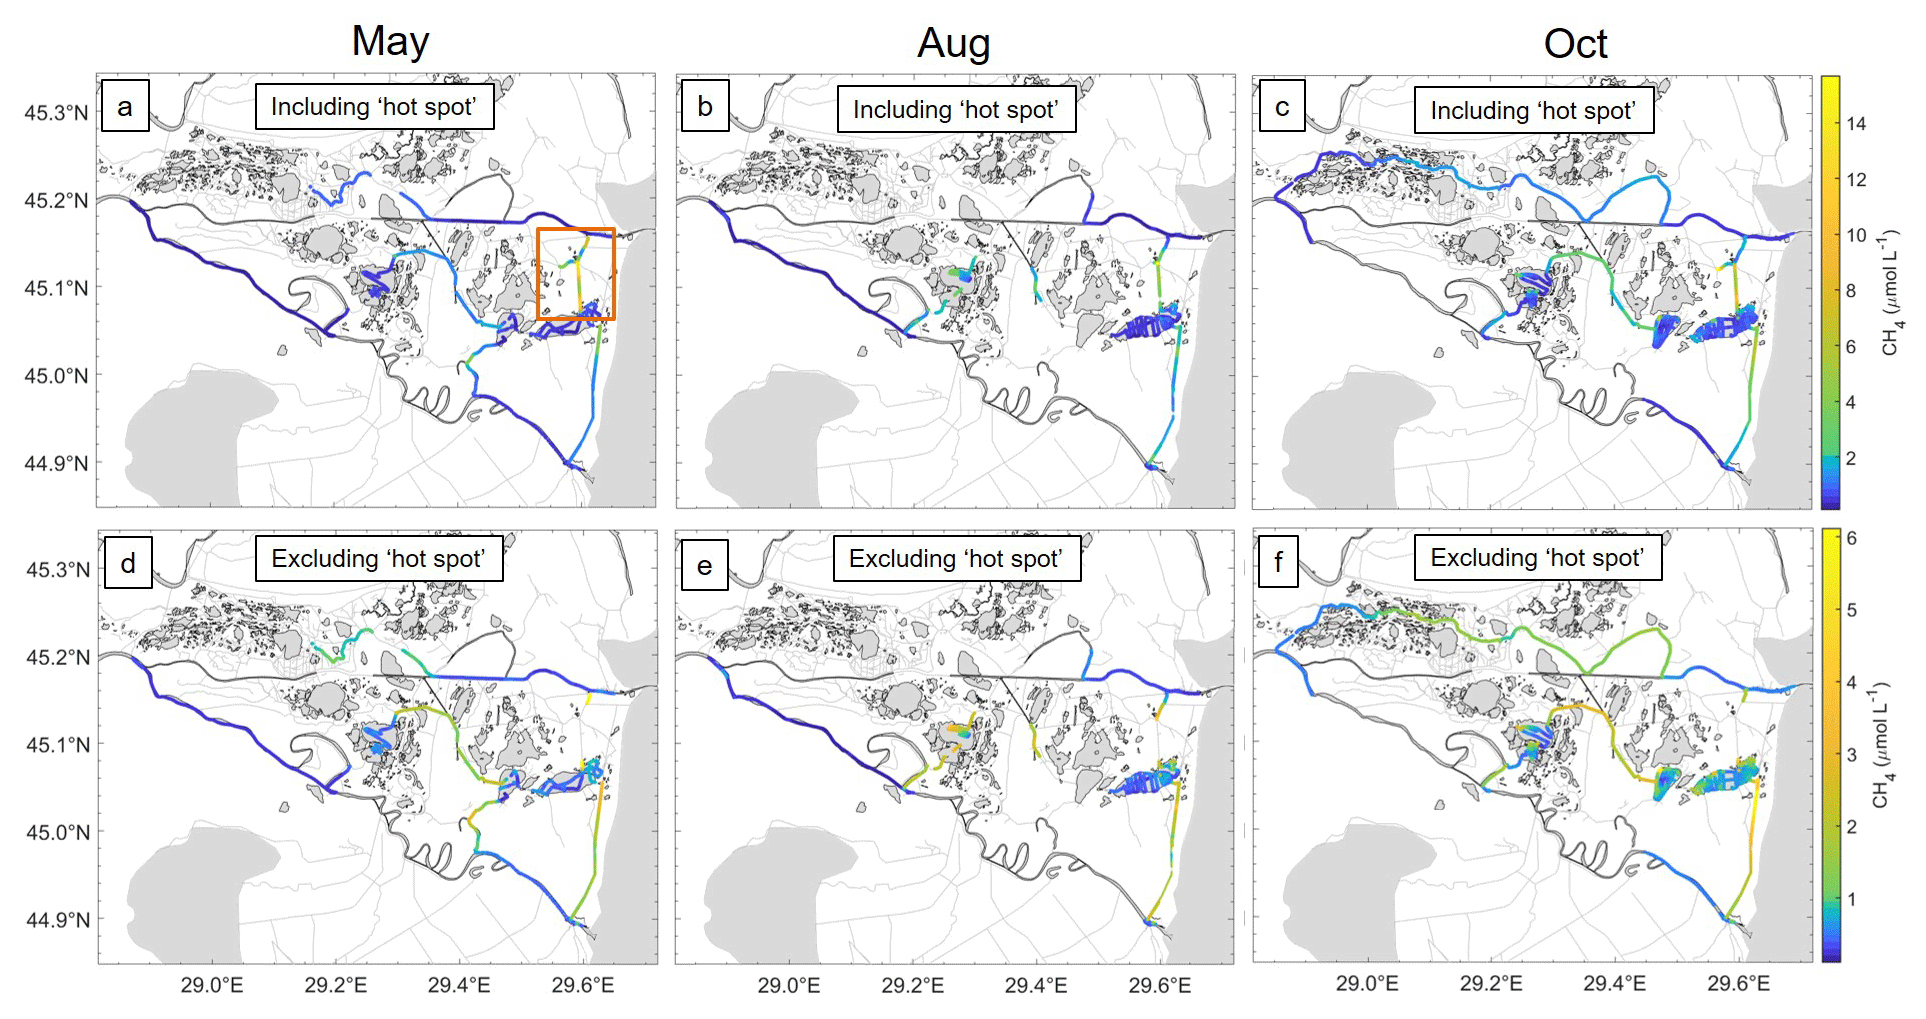
Figure 4Spatial variability of CH4 (µmol L−1) over the three campaigns (May, August and October). Due to the hot spot (Fig. 1b2) channel influencing the overall concentrations, panels (a)–(c) include the hot spot measurements, reaching a maximum of 15.6 (µmol L−1), with a red box in panel (a) showing region of the hot spot. (d–f) Spatial concentration of CH4 (µmol L−1) excluding the hot spot, with a maximum of 6.12 µmol L−1. Note the change and non-linear colouring of the colour bar for clearer overall CH4 representation.
Given the dramatic change within the concentrations and properties of the water, i.e. water temperature decreasing the further inwards we travelled, this would further provide evidence of influence from cooler groundwaters or potential waters from the reed beds also suggested by Maier et al. (2021). Groundwater can have an impact on overall gas supersaturation within the water column (Crawford et al., 2014a), potentially leading to increased CH4 concentrations within specific locations throughout the delta. This was highly visible during October (Fig. 5c), where the highest concentrations were found closest to the end of the channel, where concentrations increased strongly. The channel leading to the hot spot (Fig. 5) was adjacent to a large wetland with a more isolated lake within. The higher concentrations leading to the hot spot are likely a consequence of waters from this large reed bed. This is emphasized during May (Fig. 5a), potentially via flood waters from the reed beds.
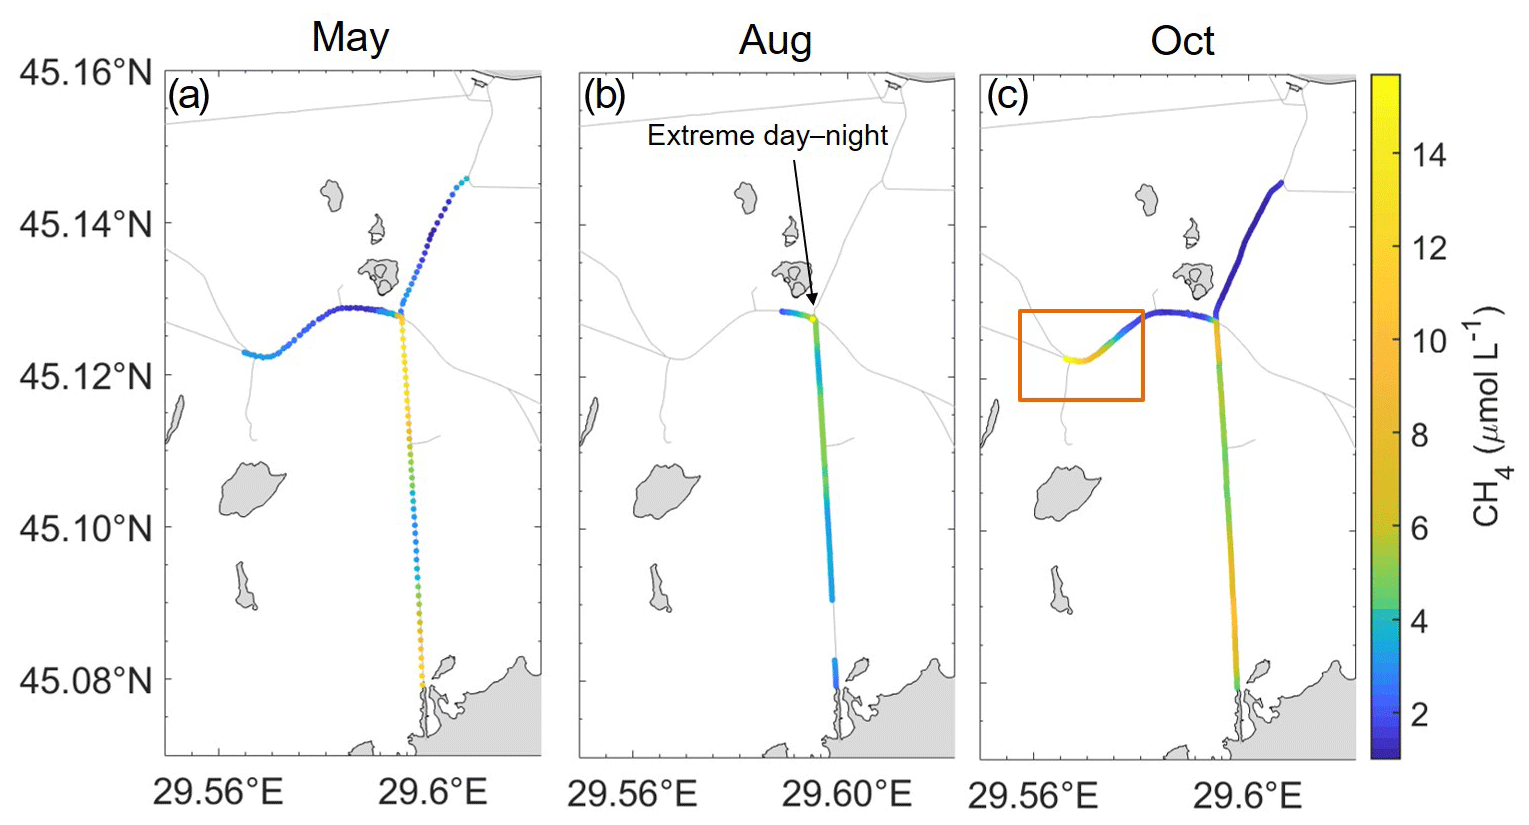
Figure 5Spatial variability of CH4 (µmol L−1) in the hot spot location (red box), over the three campaigns (May, August and October). These waters were shown to have an overall influence on concentrations (a–c), reaching a maximum of 15.68 (µmol L−1).
The hot spot showed seasonality in concentrations and dynamics (Fig. 5). This can be seen clearly from the overall median values. Although the CH4 median for both concentration and fluxes for May and October was similar to that of the channels, the ranges were almost doubled (Table 1). However, in August, fluxes measured a median of 212 ± 86.3 µmol m−2 h−1 and had a concentration median 4-fold that of channels. However, combining all months together, the median from the hot spot reduced to 54.9 ± 106 µmol m−2 h−1. The influence of the hot spot on the surrounding areas was shown to have a strong influence, with high concentrations tending to disperse into the following channels (Canning et al., 2021). However, the influence of the hot spot on the data as a whole system is more dependent on the extension of this location. In the recent study by Maier et al. (2021), it was estimated that due to other similar environments within the delta, areas of little water movement could account for 2 % of the total channel area or 20 % of CO2 and CH4 fluxes from the channels.
3.1.3 Fluvial CH4
The fluvial delta (rivers and channels) works as the supply of incoming water into the main part of the delta, accounting for the base level of CH4 concentrations being laterally transported. Based on continuous conductivity measurements, we found no evidence for saltwater intrusions from the Black Sea that could suppress methane production by high sulfate concentrations as suggested before (Durisch-Kaiser et al., 2008; Pavel et al., 2009). This would be important to explain reduced methane production as sulfate reduction becomes the dominating anaerobic mineralization pathway. Rivers had the lowest range of concentrations for CH4, with the smallest variability out of all systems and the delta (Figs. 2 and 4). When excluding the hot spot, median values for channels were larger than those for rivers and fairly consistent throughout May and August, while increasing during October. While in comparison, the largest concentration was measured during May and August respectively and thereby changed the overall channel dynamics during August by increasing the overall channel median. The influence of the hot spot showed what a strong influence one spot can have on a system, providing evidence that most of the CH4 production happens within the delta and not the river itself.
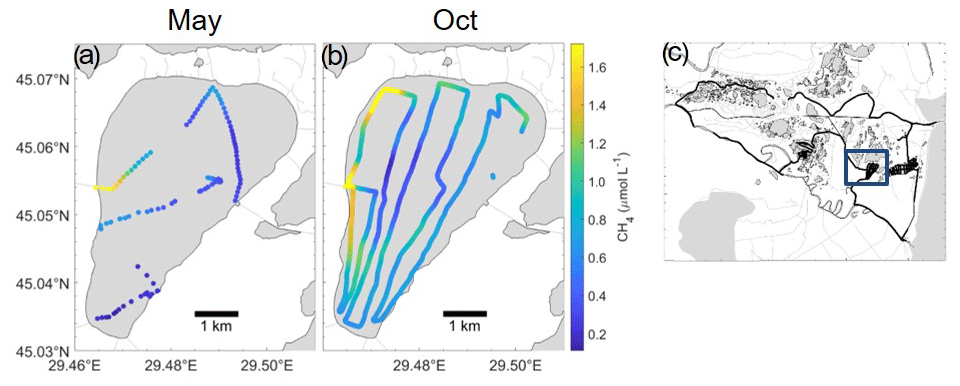
Figure 6Spatial variability of CH4 (µmol L−1) over Lake Puiu during May (a) and October (b) from transect mapping completed over the course of a day. (c) Location of Lake Puiu within the transect throughout the Danube Delta. Channel influence can be observed closer to the edges of the lake from one direction, with concentrations reducing closer to the middle of the lake.
As stated before, the estimated CH4 fluxes followed roughly the same trend as CH4 concentration, only moderately modulated by variable wind speed; therefore assessment of both will show a similar pattern. For rivers, such as with concentrations, August fluxes had the highest variability (Table 1 and Fig. 2), spanning from 4.9 to 101 µmol m−2 h−1 CH4, but had the lowest median of the seasons (8.7 µmol m−2 h−1). October, however, had the largest percentile range and median (14.2 µmol m−2 h−1) compared to May and August. Channel fluxes from all months combined had a median of 47.9 ± 70.6 µmol m−2 h−1, higher than both May and August alone (39.1 and 49.4 µmol m−2 d−1: excluding the hot spot). This was potentially linked to the increased degradation of macrophytes and other organic matter during October as stated before.
Overall our calculated mean flux for all months of the three campaigns from the fluvial delta was 594 ± 525 µmol m−2 h−1, within the diffusive mean from the overall literature (342.5 ± 1062.5 µmol m−2 h−1; Sanley et al., 2016), yet with a far higher median of 473 µmol m−2 h−1 (compared to 33.3 µmol m−2 h−1). The fluvial delta had a mean of 2030 ± 2.11 µmol L−1, with a median (1.52 µmol L−1) comparable to that of Stanley et al. (2016) with a mean of 1.35 ± 5.16 µmol L−1. When comparing within the fluvial system (rivers and channels separately), riverine CH4 concentration during May and August had a median comparable to channels and therefore showed overall homogeneity; however, channels appeared to have more extreme values and ranges than rivers. This difference would be due to less biological and physical processes occurring within the rivers due to depth, proximity to the wetlands and the flow generally being faster. However, both river and channel concentrations varied, showing large dependence on both seasonal changes and sample location.
From our meteorological data, we found little correlation with external factors such as wind; however, given these were not measured in situ, this cannot be fully quantified. We therefore suggest the observed distribution patterns over the entire delta are mostly more driven by both biological and physical processes affecting waterside CH4 concentrations instead of affected by external factors, as previously suggested (Bange et al., 2019; Sanches et al., 2019), where precipitation was potentially responsible for a decrease in concentrations. There is furthering evidence, just as with the hot spot, for strong spatio-temporal influence on CH4 fluxes.
3.1.4 CH4 dynamics in lakes
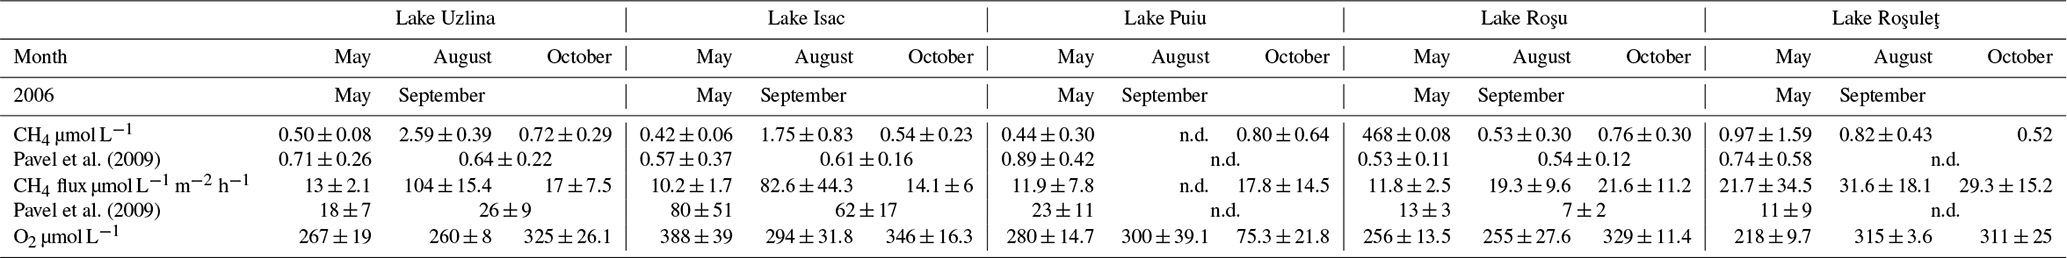
Lakes showed concentrations similar to those of Pavel et al. (2009) (see Table A1), although taken roughly 10 years later. The comparison to this earlier study indicates carbon turnover had not significantly changed during this period (Tudor et al., 2016; Spiridon et al., 2018). These concentrations ranged from the lowest 0.113 µmol L−1 to the highest 11.3 µmol L−1 both in May (largest concentration close to a channel). The median, however, stayed roughly the same for both May and August (465 and 466 nmol L−1 respectively), with October reaching 0.63 µmol L−1. We expect less productivity and more mineralization of macrophytes in October, leading to enhanced CH4 production. Before entering each lake complex, the water had to travel through either the channels or the reed beds, increasing the concentrations coming into the lakes (shown clearly in Fig. S4). The inflowing water, however, quickly dispersed (Fig. 6) and was soon oxidized as seen before (Crawford et al., 2017). This inflow was only visible on the edges of the lakes, and although it had an influence on the overall concentration, they were seen as outliers. This is due to the fact that CH4 appeared to potentially oxidize quickly as concentrations rapidly reduced (Fig. 6). In Fig. 6, there is a clear visual dispersion of CH4 from around the edges of the lake. This is specifically linked to an incoming channel and nearby wetland with inflowing water. Directional water flow is also visible, with only certain regions of the lake experiencing higher concentrations (further examples in Fig. S4). Due to the mapping technique, heightened concentrations are shown to be visible in a moving direction: such as from one side of the lake to another and not just a potential random CH4 high water parcel. The spatial differences and seasonal changes in the surface methane concentrations were far clearer in the lakes than the channels. The distribution of macrophytes in lakes could be linked to the map of O2, and decaying plant biomass explained the high CH4 levels in October (Milberg et al., 2017).
By using the average fluxes of the measured lakes, we obtained the total lake area fluxes of 2.9, 6.5 and 4.8 mol CH4 h−1 for May, August and October respectively. Diffusive release from sediments is usually the primary source of methane in surface waters (Peeters et al., 2019). Ebullition, however, adds a second pathway of CH4 emissions to the atmosphere which is much more variable between systems and locations (see Bastviken et al., 2008; McGinnis et al., 2016; Schubert and Wehrli, 2019; and van Bergen et al., 2019, for varying quantities). As it is not possible to capture ebullition through dissolved CH4 surface measurements, such as in this study, this can potentially lead to mild-significant underestimations (Maier et al., 2021). However, the benefit of this study was being able to pick up local dynamics, which is usually missed by just daily or spot sampling.
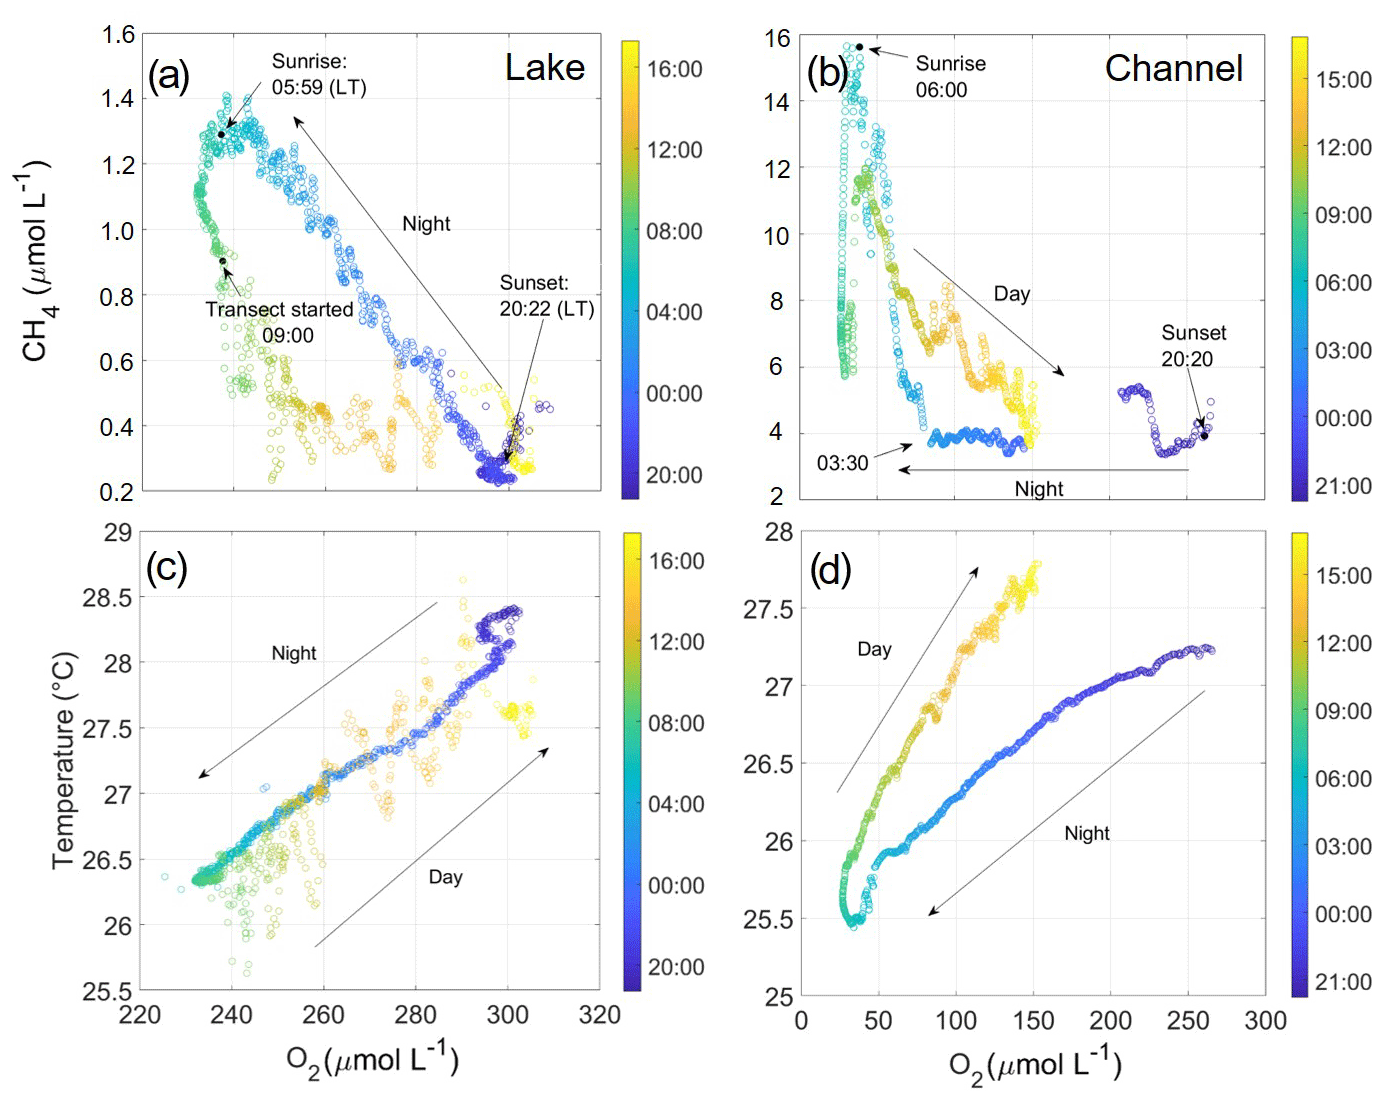
Figure 7CH4 (a, b) and temperature (c, d) against O2 concentration as measured during diel cycle experiments in Lake Roşu (a, c) and the hot spot (b, d). Colour bar denotes time of the day (hh:mm). Sunrise and sunset are also indicated. Both studies were carried out during the August (summer) campaign. During the night from just before 20:00 until 09:00, the boat was anchored and stationary. Transects through the following day continued to map the lake, whereas the channel was all in one anchored location.
3.2 Diel CH4 cycling
One advantage to measuring continuously at high resolution was the opportunity to observe diel cycles. These extractions of temporal variability (i.e. over nearly a full 24 h cycle (Fig. 7)) were successfully carried out at specific locations. For analyses and comparison, two diel cycles were recorded: one in Lake Roşu (Fig. 1b(ii)) and the other within the hot spot, with both locations at < 3 m depth. However it must be noted that in capturing the diel variability, few diel cycles were captured, and these may well be different at other times and locations and therefore not be representative of the overall situation in the delta.
Lake Roşu's diel cycle (Fig. 7a, c, e) showed clear indications of strong temporal variability on the diel timescale. The nocturnal buildup in CH4 was linearly correlated with the loss of oxygen (molar CH4:O2 ratio ). CH4 concentrations started from 0.4 µmol L−1 at sunset and reached 1.4 µmol L−1 at sunrise. During the diurnal period, CH4 concentrations quickly relaxed back to initial conditions. As the mapping transect in Lake Roşu started around 09:00, some spatial variability from varying concentrations due to proximity to the shoreline (Fig. 8) is superimposed onto the dominant diel cycle, causing CH4 concentrations to vary over the range 0.2–0.5 µmol L−1. Overall, the CH4 concentration showed a strong co-variation with oxygen. The diurnal relaxation of the CH4 and O2 concentrations to initial state had a more exponential shape. A possible explanation for this hysteresis is that the water column stratified during the day and underwent convective mixing as the surface water cooled during the night. This process progressively mixes the two formerly separated water bodies, resulting in the observed linear mixing line (Milberg et al., 2017). Diurnal warming then quickly re-stratified the water column so that the surface layer had no further entrainment from low-oxygen, high-methane waters below and underwent rapid CH4 loss due gas exchange (Fig. 7). In contrast to oxygen, CH4 did not reach equilibrium during the diurnal period. This could be due to continued supply from background sources of CH4 (e.g. from macrophytes, lateral transport, diffusive flux across the thermocline or production via photoautotrophs; Bižić et al., 2020). Given the rate and extent of the CH4 increase, this showed a potential CH4 production during the day in the bottom waters (Grasset et al., 2019), supporting the hypothesis of anoxic conditions close to the sediment and therefore intensified methanogenesis (Crawford et al., 2014b, 2017). This would be more likely to lead to other effective transport of CH4 such as ebullition, which could supply CH4 to the surface waters or the atmosphere. Oxygen, in contrast, relaxed back to equilibrium during the day as both air–water fluxes and in situ photosynthetic production of O2 would drive the system towards equilibrium. These concentrations, however, coincide with the mapping, with higher CH4 rates when closer to the lake edges due to inflowing water from the wetlands (Fig. 8).
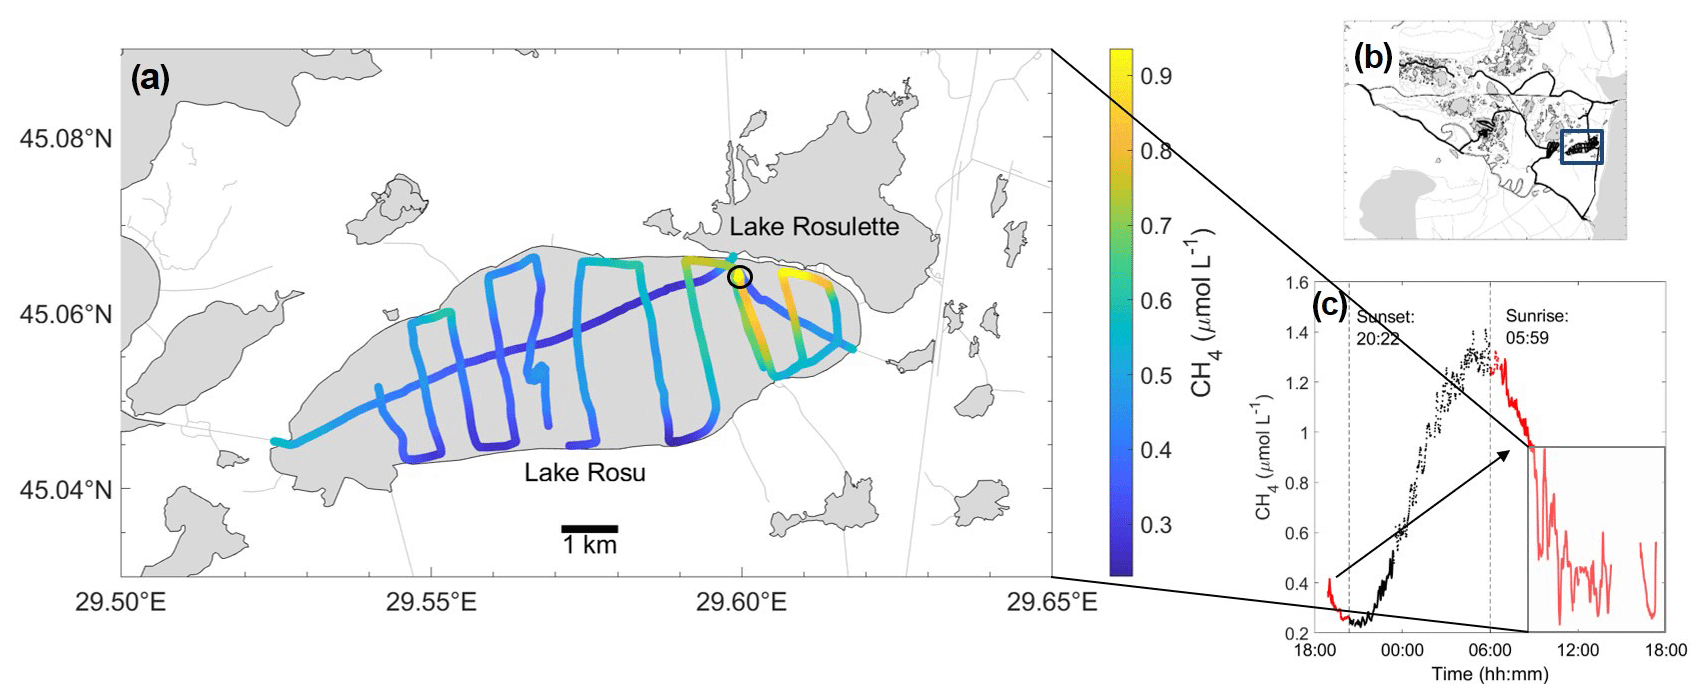
Figure 8Mapping transect of Lake Roşu (a), with the stationary location (a circle), map of the entire Danube Delta with Lake Roşu (b blue square) and CH4 concentration over time to show the distribution over the entire diel cycle (c; black shows between sunset and sunrise, red is daytime data, and the box shows the mapping transect). The data shown in panel (c) were used to calculate daylight data (red) and the full daily cycle (all data in c). Location of diel cycle during the night is shown by the black circle in panel (a).
During the day, Lake Roşu was supersaturated in O2, indicating high levels of productivity in the surface waters, with O2 moving away from equilibrium during the night. This is a potential indication for high rates of primary production during the day.
The hot spot (Fig. 7b, d) also showed a clear co-variation of CH4 with oxygen. Here CH4 increases from roughly 4 to 16 µmol L−1 over the nocturnal period (sunset to sunrise), followed by a rapid return to values around 6 µmol L−1 during the diurnal period (sunrise to sunset). O2 decreases while CH4 stays roughly the same until around 03:30, when it appeared to enter into hypoxic and even towards suboxic conditions as the ratio increased to about 1:3. This pronounced non-linearity is indicative of mixing with more than two endmembers, e.g. surface layer, sub-surface layer and a distinct bottom layer. The initial mixing encompassed only surface and sub-surface layer (similar to the lake situation), whereas later during the night near-bottom waters that have extremely elevated CH4 concentration (and no oxygen) as a consequence of anoxic methanogenesis in sediment pore waters were entrained. An alternative explanation would be groundwater or lateral injection of water from adjacent wetlands.
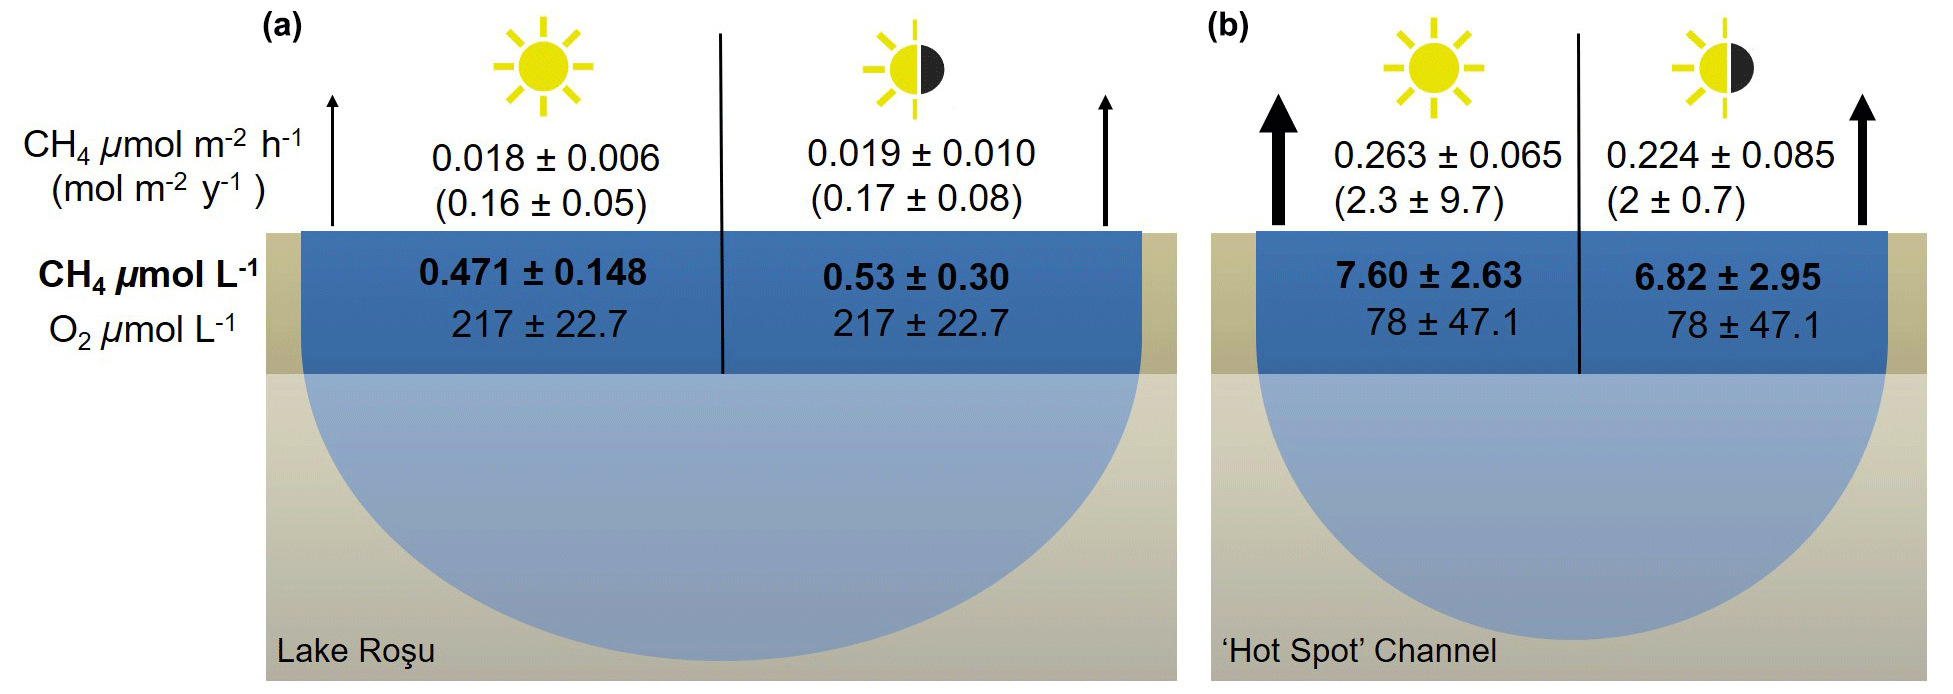
Figure 9Mean methane fluxes on an hourly and annual basis as well as average concentrations of CH4 and O2 in Lake Roşu (a) and the hot spot channel (b). The left half in each panel shows daylight data and the right half present 24 h coverage (Fig. 8c). The thickness of arrows is a visual representation of the flux scale: the thicker the arrow the relatively larger the flux compared to the other samples.
The diel changes in temperature were roughly the same for the two situations (± 2.5 ∘C: Fig. 7), showing influence on all variables and induced strong density variations. The observed strong density variations were potentially sourced by the mixing of the bottom waters over the course of the night (Fig. 7), when cooling of the warm surface layer mixed with the colder bottom waters. It could be argued that temperature could have had an effect within the diel variability as previously suggested (Yvon-Durocher et al., 2014), although temperature variability only causes a 3 % change in methane solubility. Compared with the variability over the night, the transect during the day that covered the entire lake showed CH4 generally staying consistent once the sun rose (∼ 0.2–0.4 µmol L−1 with peaks due to shorelines), which was roughly the same concentration as the previous day, such as with all other variables. Statistically we also found no correlation between temperature and CH4 flux (van Bergen et al., 2019) over the entire lake (p<0.05), therefore showing that our diffusive fluxes are more reliant on the internal processes of the water.
To show the impact of these diel cycles, Fig. 9 summarizes the mean CH4 concentrations and fluxes from the transect (∼ 09:00 until 17:20, Fig. 8) and from the entire diel cycle (almost 24 h: ∼ 18:55 on 8 August 2017 until 17:20 on 9 August 2017). The mapping route is representative of a high-spatial-resolution mapping routine (Fig. 8). The diel cycle was observed within the mapping transect, and therefore we were able to extract this section (Fig. 8c). Fluxes from the transect during the day (DL) and the full diel cycle (FD) were then scaled up to year averages showing an underestimation by just daylight data alone. For the hot spot, we used the day–night data (after sunrise) for this comparison due to no mapping transect following the diel cycle.
Overall, the values for the daylight (DL) period and full day (FD) showed little difference due to the fact that the daily extremes are encountered around sunrise and sunset, such that full coverage of the daylight hours captures the full dynamic range of the diel cycle (Fig. 9). Spot sampling without any knowledge of diel cycle variability therefore incurs an uncertainty range of a factor of 4.5 in this particular case, with the observed entire diel peak-to-peak amplitude approx. 0.3–1.3 µmol L−1 in Lake Roşu and 2.5–14.5 µmol L−1 in the hot spot channel.
Excluding all full diel cycles from the entire dataset, the mean CH4 flux decreased from 49 ± 61 to 34.9 ± 35.7 µmol m−2 h−1, or a factor of 1.4. Therefore, scaling this by year changes the fluxes for the entire Danube Delta from 0.4 ± 0.5 to 0.3 ± 0.3 mol m−2 h−1. August showed the largest variability when extracting diel cycles, with an uncertainty range of a factor of 2.27 from 84 ± 38 to 37 ± 33 µmol m−2 h−1. This greater variability can be linked to higher temperatures, greater stratification, and increased production and organic matter degradation, all leading to potential increases in CH4 (Duc et al., 2010; Fuchs et al., 2016). However, given diel cycles were not continuously measured throughout the entire system, these values merely illustrate the effect of neglecting or including diel cycle data. They do not represent ecosystem-wide fluxes because this analysis focuses only on diffusive fluxes and does not include the reed stands, with their own greenhouse gas dynamics.
There have been multiple studies looking into diel cycles (see Nimick et al., 2011; Zhang et al., 2018; van Bergen et al., 2019; Sieczko et al., 2020 for examples), yet these are usually undetected or not fully resolved and therefore ignored, particularly in studies with sampling during daylight hours. This can lead to substantial under- or overestimation of emissions, as has also been noticed in systems with high CH4 concentrations (Natchimuthu et al., 2017). Typically, delta systems tend to be either measured in specific regions (entrances or middle of lakes or channels) or with in situ measurements over time (e.g. Cuna et al., 2008; Wang et al., 2009; Olsson et al., 2015; Cunada et al., 2018). These measurements are then usually upscaled from single locations (e.g. Bouillon and Dehairs, 2007; Borges et al., 2015; Joesoef et al., 2017), failing to include spatial variability, system-specific impacts (such as the hot spot we observed here) and monthly changes. Here we can see that all of these impacts can have strong effects on the observed measurements.
To conclude, the overall Danube Delta surface waters were a source of CH4, at a mean concentration of 1.7 ± 1.93 µmol L−1 and calculated aquatic emission to the atmosphere of 0.43 ± 0.53 mol m−2 yr−1. This is comparable to concentrations and a diffusive flux mean of other systems of this type and size (see Stanley et al., 2016, for literature comparison: 1.35 ± 5.16 µmol L−1 and 3 ± 9.3 mol m−2 yr−1; and Maier et al., 2021). However, given that wetland systems (and therefore the reed beds) are known to be the significant in CH4 fluxes of high variability (Segers, 1998; Nisbet et al., 2019), our data only cover the water–air interface of channels, rivers, and lakes and therefore may be underestimating the overall fluxes that include the vegetation cover of the wetlands. Being able to measure extensively within the lake systems provided evidence that the reed bed concentrations were far higher than that of the lakes themselves. Our data have shown a need for increased recordings of spatial observations on an intimate scale, along with diel cycles in all systems. Channels and lakes show far lower concentrations and fluxes when excluding diel cycles, while concentrations intertwine over the borders. Of our three water types, rivers had the smallest concentrations and fluxes, showing that most of the CH4 production must come from further within the wetlands. Most calculated CH4 budgets stem from extrapolations and data-driven approaches due to lack of process-based models (Saunois et al., 2020); therefore, investigations of the interactions between reed stands and open water will be of high priority. Strong influences from inflowing reed bed and channel water were also shown throughout this study throughout the three campaigns. From mapping transects, the dispersion of the CH4 within the lake specifically was clearly seen, before oxidation would have occurred further into the lake.
With our analysis of diel cycles both in the channels and the lakes, we were able to further confirm the importance high-resolution, spatio-temporal data collection. The diel cycle within the lake was consistent with the potential stratification over the day, where potentially vast amounts of organic carbon from macrophytes created anoxic subsurface waters, which slowly and steadily mixed during the night. Far larger quantities of CH4 are released during the night due to daily stratification, and a similar diel cycle was also active at the hot spot site in a channel, where concentration changes varied 4-fold between 4–16 µmol L−1, indicating that the process of advective cooling during the night should also be considered in shallow systems.
In summary, spatial variability in and around lakes, reed bed edges, and within channels should be one of the main areas of focus in terms of CH4 release. On top of cross-boundary influences from high-CH4 regions, such as the reed beds, this is combined with comparing the overall peak-to-peak concentration ranges of observed diel cycles. We found there was a corresponding potential uncertainty of a factor of up to 4.5 within our measured lake (roughly 30 %) due to diel variation. Using our measured examples with the diel cycles removed accounted for a potential underestimation of up to 25 % for channels, whereas this accounted for an overestimation in lakes by 3.3 % CH4 concentration (µmol L−1). Including our measured diel cycle measurements accounted for roughly an increase of 20.4 % in lakes and a 4.2 % decrease in channel fluxes. From this one study, this shows compelling evidence that the spatial variability should be considered more especially in delta regions, with more focus on lake edges and channels, while potential diel cycles should be accounted for.
Table A1Mean (± SD) for CH4 concentration and flux (µmol L−1 and µmol m−2 h−1 respectively) and O2 concentration (µmol L−1) across all measured lakes during each expedition (May, August or October). Grey shows the comparison with Pavel et al. (2009), which was measured in 2006 as a comparison for CH4 concentration and flux, in the same units for May and September.
All data have been uploaded to PANGAEA, available at: https://doi.pangaea.de/10.1594/PANGAEA.925080 (last access: 9 May 2021, Canning and Maier, 2020).
The supplement related to this article is available online at: https://doi.org/10.5194/bg-18-3961-2021-supplement.
AC and AK developed the concept and ideas of the study together. AC collected and processed the sensor data and wrote the manuscript. AK and BW contributed ideas and clarifications of analyses. All authors reviewed and edited the manuscript.
The authors declare that they have no conflict of interest.
The research leading to these results has received funding from the European Union's Horizon 2020 research and innovation program under the Marie Skłodowska-Curie grant agreement no. 643052 (C-CASCADES project) and funding from Digital Earth, which is coordinated by the GEOMAR Helmholtz Centre for Ocean Research Kiel. We are grateful to Dennis Booge for assistance with the flux calculation; to the -4H-JENA team for their support and help throughout our time with them and while on field work both day and night; and to all those who assisted on the cruises: Marie-Sophie Maier and Christian Teodoru, who drove the campaigns.
This research has been supported by the H2020 Marie Skłodowska-Curie Actions (grant no. 643052).
The article processing charges for this open-access publication were covered by the GEOMAR Helmholtz Centre for Ocean Research Kiel.
This paper was edited by Fortunat Joos and reviewed by two anonymous referees.
Abril, G. and Borges, A. V. (Eds.): Carbon dioxide and methane emissions from estuaries, in: Greenhouse gas emissions – fluxes and processes, Springer, Berlin, Heidelberg, Germany, 187–207, https://doi.org/10.1007/978-3-540-26643-3_8, 2005.
Abril, G. and Borges, A. V.: Ideas and perspectives: Carbon leaks from flooded land: do we need to replumb the inland water active pipe?, Biogeosciences, 16, 769–784, https://doi.org/10.5194/bg-16-769-2019, 2019.
Bange, H. W., Sim, C. H., Bastian, D., Kallert, J., Kock, A., Mujahid, A., and Müller, M.: Nitrous oxide (N2O) and methane (CH4) in rivers and estuaries of northwestern Borneo, Biogeosciences, 16, 4321–4335, https://doi.org/10.5194/bg-16-4321-2019, 2019.
Bastviken, D., Cole, J. J., Pace, M. L., and Van de-Bogert, M. C.: Fates of methane from different lake habitats: Connecting whole-lake budgets and CH4 emissions, J. Geophys. Res.-Biogeo., 113, G02024, https://doi.org/10.1029/2007JG000608, 2008.
Bastviken, D., Tranvik, L. J., Downing, J. A., Crill, P. M., and Enrich-Prast, A.: Freshwater methane emissions offset the continental carbon sink, Science, 331, p. 50, https://doi.org/10.1126/science.1196808, 2011.
Bartosiewicz, M., Przytulska, A., Lapierre, J. F., Laurion, I., Lehmann, M. F., and Maranger, R.: Hot tops, cold bottoms: Synergistic climate warming and shielding effects increase carbon burial in lakes, Limnol. Oceanogr., 4, 132–144, https://doi.org/10.1002/lol2.10117, 2019.
Bittig, H. C., Körtzinger, A., Neill, C., van Ooijen, E., Plant, J. N., Hahn, J., Johnson, K. S., Yang, B., and Emerson, S. R.: Oxygen Optode Sensors: Principle, Characterization, Calibration, and Application in the Ocean, Front. Mar. Sci., 4, 429, https://doi.org/10.3389/fmars.2017.00429, 2018.
Bižić, M., Klintzsch, T., Ionescu, D., Hindiyeh, M.Y., Günthel, M., Muro-Pastor, A.M., Eckert, W., Urich, T., Keppler, F. and Grossart, H.P.: Aquatic and terrestrial cyanobacteria produce methane, Science Advances, 6, eaax5343, https://doi.org/10.1126/sciadv.aax5343, 2020.
Bižić-Ionescu, M., Ionescu, D., Günthel, M., Tang, K. W., and Grossart, H. P.: Oxic Methane Cycling: New Evidence for Methane Formation in Oxic Lake Water, in: Biogenesis of Hydrocarbons, Handbook of Hydrocarbon and Lipid Microbiology, edited by: Stams, A. and Sousa, D., Springer, Cham, Switzerland, 379–400, https://doi.org/10.1007/978-3-319-78108-2_10, 2019.
Bogard, M. J., Del Giorgio, P. A., Boutet, L., Chaves, M. C. G., Prairie, Y. T., Merante, A., and Derry, A. M.: Oxic water column methanogenesis as a major component of aquatic CH4 fluxes, Nat. Commun., 5, 5350, https://doi.org/10.1038/ncomms6350, 2014.
Borges, A. V., Delille, B., Schiettecatte, L. S., Gazeau, F., Abril, G., and Frankignoulle, M.: Gas transfer velocities of CO2 in three European estuaries (Randers Fjord, Scheldt and Thames), Limnol. Oceanogr., 49, 1630–1641, 2004.
Borges, A. V., Darchambeau, F., Teodoru, C. R., Marwick, T. R., Tamooh, F., Geeraert, N., Omengo, F. O., Guérin, F., Lambert, T., Morana, C., and Okuku, E.: Globally significant greenhouse-gas emissions from African inland waters, Nat. Geosci., 8, 637–642, https://doi.org/10.1038/ngeo2486, 2015.
Bouillon, S., Dehairs, F., Schiettecatte, L. S., and Borges, A. V.: Biogeochemistry of the Tana estuary and delta (northern Kenya), Limnol. Oceanogr., 52, 46–59, 2007.
Canning, A. and Maier, M.-S.: Seasonal high-resolution sensor data for pCO2, pCH4, O2 and temperature/salinity within the Danube Delta, Romania in May 2017 [data set], PANGAEA, https://doi.pangaea.de/10.1594/PANGAEA.925080 (last access: 9 May 2021), 2020.
Canning, A. R., Fietzek, P., Rehder, G., and Körtzinger, A.: Technical note: Seamless gas measurements across the land–ocean aquatic continuum – corrections and evaluation of sensor data for CO2, CH4 and O2 from field deployments in contrasting environments, Biogeosciences, 18, 1351–1373, https://doi.org/10.5194/bg-18-1351-2021, 2021.
Cole, J. J. and Caraco, N. F.: Atmospheric exchange of carbon dioxide in a low-wind oligotrophic lake measured by the addition of SF6, Limnol. Oceanogr., 43, 647–656, https://doi.org/10.4319/lo.1998.43.4.0647, 1998.
Cole, J. J., Prairie, Y. T., Caraco, N. F., McDowell, W. H., Tranvik, L. J., Striegl, R. G., Duarte, C. M., Kortelainen, P., Downing, J. A., Middelburg, J. J., and Melack, J.: Plumbing the Global Carbon Cycle: Integrating Inland Waters into the Terrestrial Carbon Budget, Ecosystems, 10, 172–185, https://doi.org/10.1007/s10021-006-9013-8, 2007.
Crawford, J. T., Lottig, N. R., Stanley, E. H., Walker, J. F., Hanson, P. C., Finlay, J. C., and Striegl, R. G.: CO2 and CH4 emissions from streams in a lake-rich landscape: Patterns, controls, and regional significance, Global Biogeochem. Cy., 28, 197–210, https://doi.org/10.1002/2013GB004661, 2014a.
Crawford, J. T., Stanley, E. H., Spawn, S. A., Finlay, J. C., Loken, L. C., and Striegl, R. G.: Ebullitive methane emissions from oxygenated wetland streams, Global Change Biol., 20, 3408–3422, https://doi.org/10.1111/gcb.12614, 2014b.
Crawford, J. T., Loken, L. C., West, W. E., Crary, B., Spawn, S. A., Gubbins, N., Jones, S. E., Striegl, R. G., and Stanley, E. H.: Spatial heterogeneity of within-stream methane concentrations, J. Geophys. Res.-Biogeo., 122, 1036–1048, https://doi.org/10.1002/2016JG003698, 2017.
Cristofor, S., Vadineanu, A., and Ignat, G.: Importance of flood zones for nitrogen and phosphorus dynamics in the Danube Delta, Hydrobiologia, 251, 143–148, https://doi.org/10.1007/BF00007174, 1993.
Crusius, J. and Wanninkhof, R.: Gas transfer velocities measured at low wind speed over a lake, Limnol. Oceanogr., 48, 1010–1017, https://doi.org/10.4319/lo.2003.48.3.1010, 2003.
Cuna, S., Pendall, E., Miller, J. B., Tans, P. P., Dlugokencky, E., and White, J. W.: Separating contributions from natural and anthropogenic sources in atmospheric methane from the Black Sea region, Romania, Appl. Geochem., 23, 2871–2879, https://doi.org/10.1016/ j.apgeochem.2008.04.019, 2008.
Cunada, C. L., Lesack, L. F. W., and Tank, S. E.: Seasonal Dynamics of Dissolved Methane in Lakes of the Mackenzie Delta and the Role of Carbon Substrate Quality, J. Geophys. Res.-Biogeo., 123, 591–609, https://doi.org/10.1002/2017JG004047, 2018.
Davidson, T. A., Audet, J., Jeppesen, E., Landkildehus, F., Lauridsen, T. L., Søndergaard, M., and Syväranta, J.: Synergy between nutrients and warming enhances methane ebullition from experimental lakes, Nat. Clim. Change, 8, 156–160, https://doi.org/10.1038/s41558-017-0063-z, 2018.
Dean, J. F., Middelburg, J. J., Röckmann, T., Aerts, R., Blauw, L. G., Egger, M., Jetten, M. S., de Jong, A. E., Meisel, O. H., Rasigraf, O., and Slomp, C. P.: Methane Feedbacks to the Global Climate System in a Warmer World, Rev. Geophys., 56, 207–250, https://doi.org/10.1002/2017RG000559, 2018.
DelSontro, T., Mcginnis, D. F., Wehrli, B., and Ostrovsky, I.: Size does matter: Importance of large bubbles and small-scale hot spots for methane transport, Environ. Sci. Technol., 49, 1268–1276, https://doi.org/10.1021/es5054286, 2015.
DelSontro, T., del Giorgio, P. A., and Prairie, Y. T.: No Longer a Paradox: The Interaction Between Physical Transport and Biological Processes Explains the Spatial Distribution of Surface Water Methane Within and Across Lakes, Ecosystems, 21, 1073–1087, https://doi.org/10.1007/s10021-017-0205-1, 2018.
Dlugokencky, E.: NOAA/ESRL: available at: https://gml.noaa.gov/ccgg/trends_ch4/, last access: 12 December 2019.
Duc, N. T., Crill, P., and Bastviken, D.: Implications of temperature and sediment characteristics on methane formation and oxidation in lake sediments, Biogeochemistry, 100, 185–196, https://doi.org/10.1007/s10533-010-9415-8, 2010.
Durisch-Kaiser, E., Pavel, A., Doberer, A., Reutimann, J., Balan, S., Sobek, S., Radan, S., and Wehrli, B.: Nutrient retention, total N and P export and greenhouse gas emission from the Danube Delta lakes, GeoEcoMarina, 14, 81–90, 2008.
Enache, I., Florescu, L. I., Moldoveanu, M., Moza, M. I., Parpală, L., Sandu, C., Turko, P., Rîșnoveanu, G., and Spaak, P.: Diversity and distribution of Daphnia across space and time in Danube Delta lakes explained by food quality and abundance, Hydrobiologia, 842, 39–54, https://doi.org/10.1007/s10750-019-04025-y, 2019.
Fuchs, A., Lyautey, E., Montuelle, B., and Casper, P.: Effects of increasing temperatures on methane concentrations and methanogenesis during experimental incubation of sediments from oligotrophic and mesotrophic lakes, J. Geophys. Res.-Biogeo., 121, 1394–1406, https://doi.org/10.1002/2016JG003328, 2016.
Galatchi, L. D. and Tudor, M.: Europe as a source of pollution – the main factor for the eutrophication of the Danube Delta and Black Sea, in: Chemicals as Intentional and Accidental Global Environmental Threats, Springer, Dordrecht, The Netherlands, 57–63, 2006.
Gatland, J. R., Santos, I. R., Maher, D. T., Duncan, T. M., and Erler, D. V.: Carbon dioxide and methane emissions from an artificially drained coastal wetland during a flood: Implications for wetland global warming potential, J. Geophys. Res.-Biogeo., 119, 1698–1716, https://doi.org/10.1002/2013JG002544, 2014.
Grasset, C., Abril, G., Mendonça, R., Roland, F., and Sobek, S.: The transformation of macrophyte-derived organic matter to methane relates to plant water and nutrient contents, Limnol. Oceanogr., 64, 1737–1749, https://doi.org/10.1002/lno.11148, 2019.
Guérin, F., Abril, G., Serça, D., Delon, C., Richard, S., Delmas, R., Tremblay, A., and Varfalvy, L.: Gas transfer velocities of CO2 and CH4 in a tropical reservoir and its river downstream, J. Marine Syst., 66, 161–172, https://doi.org/10.1016/j.jmarsys.2006.03.019, 2007.
Harvey, F. E., Lee, D. R., Rudolph, D. L., and Frape, S. K.: Locating groundwater discharge in large lakes using bottom sediment electrical conductivity mapping, Water Resour. Res., 33, 2609–2615, 1997.
Jähne, B., Münnich, K. O., Bösinger, R., Dutzi, A., Huber, W., and Libner, P.: On the parameters influencing air-water gas exchange, J. Geophys. Res.-Oceans, 92, 1937–1949, https://doi.org/10.1029/JC092iC02p01937, 1987.
Joesoef, A., Kirchman, D. L., Sommerfield, C. K., and Cai, W.-J.: Seasonal variability of the inorganic carbon system in a large coastal plain estuary, Biogeosciences, 14, 4949–4963, https://doi.org/10.5194/bg-14-4949-2017, 2017.
Kasprak, A., Hough-Snee, N., Beechie, T., Bouwes, N., Brierley, G., Camp, R., Fryirs, K., Imaki, H., Jensen, M., O’Brien, G., Rosgen, D., and Wheaton, J.: The blurred line between form and process: a comparison of stream channel classification frameworks, PLoS One, 11, e0150293, https://doi.org/10.1371/journal.pone.0150293, 2016.
Maher, D. T., Cowley, K., Santos, I. R., Macklin, P., and Eyre, B. D.: Methane and carbon dioxide dynamics in a subtropical estuary over a diel cycle: Insights from automated in situ radioactive and stable isotope measurements, Mar. Chem., 168, 69–79, https://doi.org/10.1016/j.marchem.2014.10.017, 2015.
Maier, M.-S., Teodoru, C. R., and Wehrli, B.: Spatio-temporal variations in lateral and atmospheric carbon fluxes from the Danube Delta, Biogeosciences, 18, 1417–1437, https://doi.org/10.5194/bg-18-1417-2021, 2021.
Marín-Muñiz, J. L., Hernández, M. E., and Moreno-Casasola, P.: Greenhouse gas emissions from coastal freshwater wetlands in Veracruz Mexico: Effect of plant community and seasonal dynamics, Atmos. Environ., 107, 107–117, https://doi.org/10.1016/j.atmosenv.2015.02.036, 2015.
Marotta, H., Pinho, L., Bastviken, D., Tranvik, L. J., and Enrich-Prast, A.: Greenhouse gas production in low-latitude lake sediments responds strongly to warming, Nat. Clim. Change, 4, 467–470, https://doi.org/10.1038/nclimate2222, 2014.
McGinnis, D. F., Bilsley, N., Schmidt, M., Fietzek, P., Bodmer, P., Premke, K., Lorke, A., and Flury, S.: Deconstructing Methane Emissions from a Small Northern European River: Hydrodynamics and Temperature as Key Drivers, Environ. Sci. Technol., 50, 11680–11687, https://doi.org/10.1021/acs.est.6b03268, 2016.
Melack, J. M., Hess, L. L., Gastil, M., Forsberg, B. R., Hamilton, S. K., Lima, I. B., and Novo, E. M.: Regionalization of methane emissions in the Amazon Basin with microwave remote sensing, Global Change Biol., 10, 530–544, https://doi.org/10.1111/j.1529-8817.2003.00763.x, 2004.
Melton, J. R., Wania, R., Hodson, E. L., Poulter, B., Ringeval, B., Spahni, R., Bohn, T., Avis, C. A., Beerling, D. J., Chen, G., Eliseev, A. V., Denisov, S. N., Hopcroft, P. O., Lettenmaier, D. P., Riley, W. J., Singarayer, J. S., Subin, Z. M., Tian, H., Zürcher, S., Brovkin, V., van Bodegom, P. M., Kleinen, T., Yu, Z. C., and Kaplan, J. O.: Present state of global wetland extent and wetland methane modelling: conclusions from a model inter-comparison project (WETCHIMP), Biogeosciences, 10, 753–788, https://doi.org/10.5194/bg-10-753-2013, 2013.
Mendonca, R., Kosten, S., Sobek, S., Barros, N., Cole, J. J., Tranvik, L., and Roland, F.: Hydroelectric carbon sequestration, Nat. Geosci., 5, 838–840, https://doi.org/10.1038/ngeo1653, 2012.
Milberg, P., Törnqvist, L., Westerberg, L. M., and Bastviken, D.: Temporal variations in methane emissions from emergent aquatic macrophytes in two boreonemoral lakes, AOB Plants, 9, https://doi.org/10.1093/aobpla/plx029, 2017.
Myhre, G., Shindell, D., Breìon, F. M., Collins, W., Fuglestvedt, J., Huang, J., Koch, D., Lamarque, J. F., Lee, D., Mendoza, B., Nakajima, T., Robock, A., Stephens, G., Takemura, T., and Zhang, H.: Anthropogenic and Natural Radiative Forcing, in: Climate Change 2013: The Physical Science Basis, Contribution of Working Group I to the Fifth Assessment Report of the Intergovernmental Panel on Climate Change, edited by: Stocker, T. F., Qin, D., Plattner, G.-K., Tignor, M., Allen, S. K., Boschung, J., Nauels, A., Xia, Y., Bex, V., and Midgley, P. M., Cambridge University Press, Cambridge, UK, New York, USA, 659–740, 2013.
Natchimuthu, S., Wallin, M. B., Klemedtsson, L., and Bastviken, D.: Spatio-temporal patterns of stream methane and carbon dioxide emissions in a hemiboreal catchment in Southwest Sweden, Sci. Rep.-UK, 7, 39729, https://doi.org/10.1038/srep39729, 2017.
Nimick, D. A., Gammons, C. H., and Parker, S. R.: Diel biogeochemical processes and their effect on the aqueous chemistry of streams: A review, Chem. Geol., 283, 3–17, https://doi.org/10.1016/j.chemgeo.2010.08.017, 2011.
Nisbet, E. G., Manning, M. R., Dlugokencky, E. J., Fisher, R. E., Lowry, D., Michel, S. E., Myhre, C. L., Platt, S. M., Allen, G., Bousquet, P., and Brownlow, R.: Very Strong Atmospheric Methane Growth in the 4 Years 2014–2017: Implications for the Paris Agreement, Global Biogeochem. Cy., 33, 318–342, https://doi.org/10.1029/2018GB006009, 2019.
Olsson, L., Ye, S., Yu, X., Wei, M., Krauss, K. W., and Brix, H.: Factors influencing CO2 and CH4 emissions from coastal wetlands in the Liaohe Delta, Northeast China, Biogeosciences, 12, 4965–4977, https://doi.org/10.5194/bg-12-4965-2015, 2015.
Oosterberg, W., Buijse, A. D., Coops, H., Ibelings, B. W., Menting, G. A. M., Navodaru, I., and Török, L.: Ecological gradients in the Danube Delta lakes: present state and man-induced changes, Institute for Inland Water Management and Waste Water Treatment RIZA, Lelystad, The Netherlands, 2000.
Panin, N.: The Danube Delta, Geomorphology and Holocene Evolution: a Synthesis/Le delta du Danube, Géomorphologie et évolution holocène: une synthèse, Geomorphologie, 9, 247–262, https://doi.org/10.3406/morfo.2003.1188, 2003
Panneer Selvam, B., Natchimuthu, S., Arunachalam, L., and Bastviken, D.: Methane and carbon dioxide emissions from inland waters in India – implications for large scale greenhouse gas balances, Global Change Biol., 20, 3397–3407, https://doi.org/10.1111/gcb.12575, 2014.
Pavel, A., Durisch-Kaiser, E., Balan, S., Radan, S., Sobek, S., and Wehrli, B.: Sources and emission of greenhouse gases in Danube Delta lakes, Environ. Sci. Pollut. R., 16, 86–91, https://doi.org/10.1007/s11356-009-0182-9, 2009.
Peeters, F., Fernandez, J. E., and Hofmann, H.: Sediment fluxes rather than oxic methanogenesis explain diffusive CH4 emissions from lakes and reservoirs, Sci. Rep.-UK, 9, 243, https://doi.org/10.1038/s41598-018-36530-w, 2019.
Raymond, P. A., Hartmann, J., Lauerwald, R., Sobek, S., McDonald, C., Hoover, M., Butman, D., Striegl, R., Mayorga, E., Humborg, C., and Kortelainen, P.: Global carbon dioxide emissions from inland waters, Nature, 503, 355–359, https://doi.org/10.1038/nature12760, 2013.
Richey, J. E., Melack, J. M., Aufdenkampe, A. K., Ballester, V. M., and Hess, L. L.: Outgassing from Amazonian rivers and wetlands as a large tropical source of atmospheric CO2, Nature, 416, 617–620, https://doi.org/10.1038/416617a, 2002.
Rîşnoveanu, G., Postolache, C., and Vădineanu, A.: Ecological significance of nitrogen cycling by tubificid communities in shallow eutrophic lakes of the Danube Delta, Hydrobiologia, 524, 193–202, https://doi.org/10.1023/B:HYDR.0000036133.92034.69, 2004.
Sanches, L. F., Guenet, B., Marinho, C. C., Barros, N., and de Assis Esteves, F.: Global regulation of methane emission from natural lakes, Sci. Rep.-UK, 9, 255, https://doi.org/10.1038/s41598-018-36519-5, 2019.
Saunois, M., Bousquet, P., Poulter, B., Peregon, A., Ciais, P., Canadell, J. G., Dlugokencky, E. J., Etiope, G., Bastviken, D., Houweling, S., Janssens-Maenhout, G., Tubiello, F. N., Castaldi, S., Jackson, R. B., Alexe, M., Arora, V. K., Beerling, D. J., Bergamaschi, P., Blake, D. R., Brailsford, G., Brovkin, V., Bruhwiler, L., Crevoisier, C., Crill, P., Covey, K., Curry, C., Frankenberg, C., Gedney, N., Höglund-Isaksson, L., Ishizawa, M., Ito, A., Joos, F., Kim, H.-S., Kleinen, T., Krummel, P., Lamarque, J.-F., Langenfelds, R., Locatelli, R., Machida, T., Maksyutov, S., McDonald, K. C., Marshall, J., Melton, J. R., Morino, I., Naik, V., O'Doherty, S., Parmentier, F.-J. W., Patra, P. K., Peng, C., Peng, S., Peters, G. P., Pison, I., Prigent, C., Prinn, R., Ramonet, M., Riley, W. J., Saito, M., Santini, M., Schroeder, R., Simpson, I. J., Spahni, R., Steele, P., Takizawa, A., Thornton, B. F., Tian, H., Tohjima, Y., Viovy, N., Voulgarakis, A., van Weele, M., van der Werf, G. R., Weiss, R., Wiedinmyer, C., Wilton, D. J., Wiltshire, A., Worthy, D., Wunch, D., Xu, X., Yoshida, Y., Zhang, B., Zhang, Z., and Zhu, Q.: The global methane budget 2000–2012, Earth Syst. Sci. Data, 8, 697–751, https://doi.org/10.5194/essd-8-697-2016, 2016.
Saunois, M., Stavert, A. R., Poulter, B., Bousquet, P., Canadell, J. G., Jackson, R. B., Raymond, P. A., Dlugokencky, E. J., Houweling, S., Patra, P. K., Ciais, P., Arora, V. K., Bastviken, D., Bergamaschi, P., Blake, D. R., Brailsford, G., Bruhwiler, L., Carlson, K. M., Carrol, M., Castaldi, S., Chandra, N., Crevoisier, C., Crill, P. M., Covey, K., Curry, C. L., Etiope, G., Frankenberg, C., Gedney, N., Hegglin, M. I., Höglund-Isaksson, L., Hugelius, G., Ishizawa, M., Ito, A., Janssens-Maenhout, G., Jensen, K. M., Joos, F., Kleinen, T., Krummel, P. B., Langenfelds, R. L., Laruelle, G. G., Liu, L., Machida, T., Maksyutov, S., McDonald, K. C., McNorton, J., Miller, P. A., Melton, J. R., Morino, I., Müller, J., Murguia-Flores, F., Naik, V., Niwa, Y., Noce, S., O'Doherty, S., Parker, R. J., Peng, C., Peng, S., Peters, G. P., Prigent, C., Prinn, R., Ramonet, M., Regnier, P., Riley, W. J., Rosentreter, J. A., Segers, A., Simpson, I. J., Shi, H., Smith, S. J., Steele, L. P., Thornton, B. F., Tian, H., Tohjima, Y., Tubiello, F. N., Tsuruta, A., Viovy, N., Voulgarakis, A., Weber, T. S., van Weele, M., van der Werf, G. R., Weiss, R. F., Worthy, D., Wunch, D., Yin, Y., Yoshida, Y., Zhang, W., Zhang, Z., Zhao, Y., Zheng, B., Zhu, Q., Zhu, Q., and Zhuang, Q.: The Global Methane Budget 2000–2017, Earth Syst. Sci. Data, 12, 1561–1623, https://doi.org/10.5194/essd-12-1561-2020, 2020.
Schilder, J., Bastviken, D., van Hardenbroek, M., Kankaala, P., Rinta, P., Stötter, T., and Heiri, O.: Spatial heterogeneity and lake morphology affect diffusive greenhouse gas emission estimates of lakes, Geophys. Res. Lett., 40, 5752–5756, https://doi.org/10.1002/2013GL057669, 2013.
Schubert, C. J. and Wehrli, B.: Contribution of Methane Formation and Methane Oxidation to Methane Emission from Freshwater Systems, in: Biogenesis of Hydrocarbons, edited by: Stams, A. J. M. and Sousa, D., Handbook of Hydrocarbon and Lipid Microbiology, Springer, Cham. 1–31, https://doi.org/10.1007/978-3-319-53114-4_18-1, 2019.
Segers, R.: Methane production and methane consumption: A review of processes underlying wetland methane fluxes, Biogeochemistry, 41, 23–51, https://doi.org/10.1023/A:1005929032764, 1998.
Sepulveda-Jauregui, A., Hoyos-Santillan, J., Martinez-Cruz, K., Walter Anthony, K. M., Casper, P., Belmonte-Izquierdo, Y., and Thalasso, F.: Eutrophication exacerbates the impact of climate warming on lake methane emission, Sci. Total Environ., 636, 411–419, https://doi.org/10.1016/j.scitotenv.2018.04.283, 2018.
Sieczko, A. K., Duc, N. T., Schenk, J., Pajala, G., Rudberg, D., Sawakuchi, H. O., and Bastviken, D.: Diel variability of methane emissions from lakes, P. Natl. Acad. Sci. USA, 117, 21488–21494, https://doi.org/10.1073/pnas.2006024117, 2020.
Spiridon, C., Teodorof, L., Burada, A., Despina, C., Seceleanu-Odor, D., Tudor, I. M., Ibram, O., and Georgescu, L. P.: Seasonal variations of nutrients concentration in aquatic ecosystems from Danube delta biosphere reserve, AACL Bioflux, 11, 1882–1891, 2018.
Stanley, E. H., Casson, N. J., Christel, S. T., Crawford, J. T., Loken, L. C., and Oliver, S. K.: The ecology of methane in streams and rivers: Patterns, controls, and global significance, Ecol. Monogr., 86, 146–171, https://doi.org/10.1890/15-1027, 2016.
Tang, K. W., McGinnis, D. F., Ionescu, D., and Grossart, H. P.: Methane production in oxic lake waters potentially increases aquatic methane flux to air, Environ. Sci. Tech. Let., 3, 227–233, https://doi.org/10.1021/acs.estlett.6b00150, 2016.
Tranvik, L. J., Downing, J. A., Cotner, J. B., Loiselle, S. A., Striegl, R. G., Ballatore, T. J., Dillon, P., Finlay, K., Fortino, K., Knoll, L. B., and Kortelainen, P. L.: Lakes and impoundments as regulators of carbon cycling and climate, Limnol. Oceanogr., 54, 2298–2314, 2009.
Tudor, I.-M., Teodorof, L., Burada, A., Tudor, M., Ibram, O., and Despina, C.: Long-term nutrients and heavy metals concentration dynamics in aquatic ecosystems of Danube Delta. Scientific Annals of the Danube Delta Institute, Tulcea, Romania, 22, 149–156, 2016.
van Bergen, T. J. H. M., Barros, N., Mendonça, R., Aben, R. C., Althuizen, I. H., Huszar, V., Lamers, L. P., Lürling, M., Roland, F., and Kosten, S.: Seasonal and diel variation in greenhouse gas emissions from an urban pond and its major drivers, Limnol. Oceanogr., 64, 2129–2139, https://doi.org/10.1002/lno.11173, 2019.
Wang, D., Chen, Z., Sun, W., Hu, B., and Xu, S.: Methane and nitrous oxide concentration and emission flux of Yangtze Delta plain river net, Sci. China Ser. B, 52, 652–661, https://doi.org/10.1007/s11426-009-0024-0, 2009.
Wanninkhof, R. H.: Relationship between wind speed and gas exchange, J. Geophys. Res., 97, 7373–7382, 1992.
Ward, N. D., Bianchi, T. S., Medeiros, P. M., Seidel, M., Richey, J. E., Keil, R. G., and Sawakuchi, H. O.: Where Carbon Goes When Water Flows: Carbon Cycling across the Aquatic Continuum, Front. Mar. Sci., 4, 7, https://doi.org/10.3389/fmars.2017.00007, 2017.
Wiesenburg, D. A. and Guinasso Jr., N. L.: Equilibrium solubilities of methane, carbon monoxide, and hydrogen in water and sea water, J. Chem. Eng. Data, 24, 356–360, 1979.
Woolway, R. I. and Merchant, C. J.: Worldwide alteration of lake mixing regimes in response to climate change, Nat. Geosci., 12, 271–276, https://doi.org/10.1038/s41561-019-0322-x, 2019.
Yvon-Durocher, G., Allen, A. P., Bastviken, D., Conrad, R., Gudasz, C., St-Pierre, A., Thanh-Duc, N., and Del Giorgio, P. A.: Methane fluxes show consistent temperature dependence across microbial to ecosystem scales, Nature, 507, 488–491, https://doi.org/10.1038/nature13164, 2014.
Zhang, C., Cheng, S., Long, L., Xie, H., Mu, X., and Zhang, W.: Diel and seasonal methane flux across water-air interface of a subtropic eutrophic pond, Toxicol. Environ. Chem., 100, 413–424, https://doi.org/10.1080/02772248.2018.1499231, 2018.
Zuidgeest, A., Baumgartner, S., and Wehrli, B.: Hysteresis effects in organic matter turnover in a tropical floodplain during a flood cycle, Biogeochemistry, 131, 49–63, https://doi.org/10.1007/s10533-016-0263-z, 2016.