the Creative Commons Attribution 4.0 License.
the Creative Commons Attribution 4.0 License.
 | 02 Jul 2021
Additional carbon inputs to reach a 4 per 1000 objective in Europe: feasibility and projected impacts of climate change based on Century simulations of long-term arable experiments
Bertrand Guenet
Yuanyuan Huang
Hugues Clivot
Iñigo Virto
Roberta Farina
Thomas Kätterer
Philippe Ciais
Manuel Martin
Claire Chenu
The 4 per 1000 initiative aims to maintain and increase soil organic carbon (SOC) stocks for soil fertility, food security, and climate change adaptation and mitigation. One way to enhance SOC stocks is to increase carbon (C) inputs to the soil.
In this study, we assessed the amount of organic C inputs that are necessary to reach a target of SOC stocks increase by 4 ‰ yr−1 on average, for 30 years, at 14 long-term agricultural sites in Europe. We used the Century model to simulate SOC stocks and assessed the required level of additional C inputs to reach the 4 per 1000 target at these sites. Then, we analyzed how this would change under future scenarios of temperature increase. Initial stocks were simulated assuming steady state. We compared modeled C inputs to different treatments of additional C used on the experimental sites (exogenous organic matter addition and one treatment with different crop rotations). The model was calibrated to fit the control plots, i.e. conventional management without additional C inputs from exogenous organic matter or changes in crop rotations, and was able to reproduce the SOC stock dynamics.
We found that, on average among the selected experimental sites, annual C inputs will have to increase by 43.15 ± 5.05 %, which is 0.66 ± 0.23 (mean ± standard error), with respect to the initial C inputs in the control treatment. The simulated amount of C input required to reach the 4 ‰ SOC increase was lower than or similar to the amount of C input actually used in the majority of the additional C input treatments of the long-term experiments. However, Century might be overestimating the effect of additional C inputs on SOC stocks. At the experimental sites, we found that treatments with additional C inputs were increasing by 0.25 % on average. This means that the C inputs required to reach the 4 per 1000 target might actually be much higher. Furthermore, we estimated that annual C inputs will have to increase even more due to climate warming, that is 54 % more and 120 % more for a 1 and 5 ∘C warming, respectively. We showed that modeled C inputs required to reach the target depended linearly on the initial SOC stocks, raising concern on the feasibility of the 4 per 1000 objective in soils with a higher potential contribution to C sequestration, that is soils with high SOC stocks. Our work highlights the challenge of increasing SOC stocks at a large scale and in a future with a warmer climate.
- Article
(3045 KB) - Full-text XML
-
Supplement
(124 KB) - BibTeX
- EndNote


Increasing organic carbon (C) stocks in agricultural soils is beneficial for soil fertility and crop production and for climate change adaptation and mitigation. This consideration was at the basis of the 4 per 1000 (4p1000) initiative, proposed by the French government during the 21st Conference of the Parties (COP21) on climate change. The 4p1000 initiative aims to promote agricultural practices that enable the conservation of organic carbon in the soil (https://www.4p1000.org, last access: 25 June 2021). Because soil organic carbon (SOC) stocks are 2 to 3 times higher than those in the atmosphere, even a small increase in the SOC pool can translate into significant changes in the atmospheric pool (Minasny et al., 2017). To demonstrate the importance of SOC, the initiative took as an example the fact that increasing global SOC stocks up to 0.4 m depth by 4p1000 (0.4 %) per year of their initial value could offset the net annual carbon dioxide (CO2) anthropogenic emissions to the atmosphere (Soussana, 2017). While increasing SOC stocks by 4p1000 annually is not a normative target of the initiative, this value can be taken as a reference to which current situations and alternative strategies are compared (e.g., Pellerin et al., 2019).
Strategies of conservation and expansion of existing SOC pools may be necessary but are not sufficient to mitigate climate change (Paustian et al., 2016). In this sense, increasing SOC stocks cannot be regarded as a dispensation to continue business as usual, but rather as a wedge of negative greenhouse gas (GHG) emissions (Wollenberg et al., 2016), as well as a strategy for improving most soils' resilience to changes in the climate.
The potential to increase SOC stocks is particularly relevant in cropped soils, where the depletion of organic matter with respect to the original non-cultivated situation has been demonstrated (Clivot et al., 2019; Goidts and van Wesemael, 2007; Meersmans et al., 2011; Saffih-Hdadi and Mary, 2008; Sanderman et al., 2017; Zinn et al., 2005) and where straightforward management practices can be implemented to promote the conservation or increment of SOC (Chenu et al., 2019; Guenet et al., 2020; Paustian et al., 2016). Moreover, increasing the organic C content in agricultural soils is known to improve their fertility and water retention capacity (Lal 2008), indirectly enhancing agricultural productivity and food security.
SOC stocks are a function of C inputs and C outputs. To increase SOC stocks, one can either increase C inputs to the soil (i.e. adding plant material or organic fertilizers) or reduce C outputs resulting from mineralization and, in some cases, soil erosion. Increasing SOC stocks can be achieved via agricultural practices such as retention of crop residue and organic amendments to the soil, cover cropping, diversified rotations and agroforestry systems (Chenu et al., 2019; Powlson et al., 2011). However, some of these practices only lead to local carbon storage at the field scale, rather than a net carbon sequestration from the atmosphere at larger scales (Chenu et al., 2019).
Assessing the evolution of SOC stocks over time is important to correctly estimate the potential of SOC storage in agricultural soils and evaluate management practices in terms of both SOC stock increase and sequestration potential. The dynamics of SOC stocks can be either measured in agricultural soils through long-term experiments (LTEs) and soil monitoring networks or estimated via biogeochemical models (Campbell and Paustian, 2015; Manzoni and Porporato, 2009). Combining measurements of SOC with models provides a wider applicability of the information collected in field trials, as it allows SOC stocks and their future trends to be estimated. However, validity of models in the studied areas has to be assessed, and models need to be initialized. This means that the initial status of SOC has to be set, either for lack of data on total initial stocks or to determine the allocation of C among the model's compartments that cannot be measured. This is commonly accomplished by assuming that SOC is at equilibrium at the beginning of the experiment (Luo et al., 2017; Xia et al., 2012).
The feasibility and applicability of a 4 ‰ increase target depend on biotechnical and socio-economic factors. As we mentioned earlier, a number of practices are known to increase SOC stocks in agricultural systems. However, it is still debated whether they will be sufficient to reach the 4p1000 objective. Minasny et al. (2017) described opportunities and limitations of a 4 ‰ SOC increase in 20 regions across the world. Several authors (e.g., Baveye et al., 2018; van Groenigen et al., 2017; VandenBygaart, 2018) argued that some of the examples described in Minasny et al. (2017) were not representative of wide-scale agriculture and suggested that a 4 ‰ rate is not attainable in many practical situations (Poulton et al., 2018). Implementing new agricultural practices that allow the maintenance and increase in SOC stocks might require structural land management changes that not all farmers will be willing to adopt. Incentivizing and sustaining virtuous practices to increase SOC stocks should be a strategy for policymakers to overcome socio-economic barriers (e.g., Lal, 2018; Soussana, 2017), and in order to do that, they need to be correctly informed. Recent works have assessed the biotechnical limitations of a SOC increase, studying the required and available biomass to reach a 4p1000 target in European soils (Wiesmeier et al., 2016; Martin et al., 2021; Riggers et al., 2021).
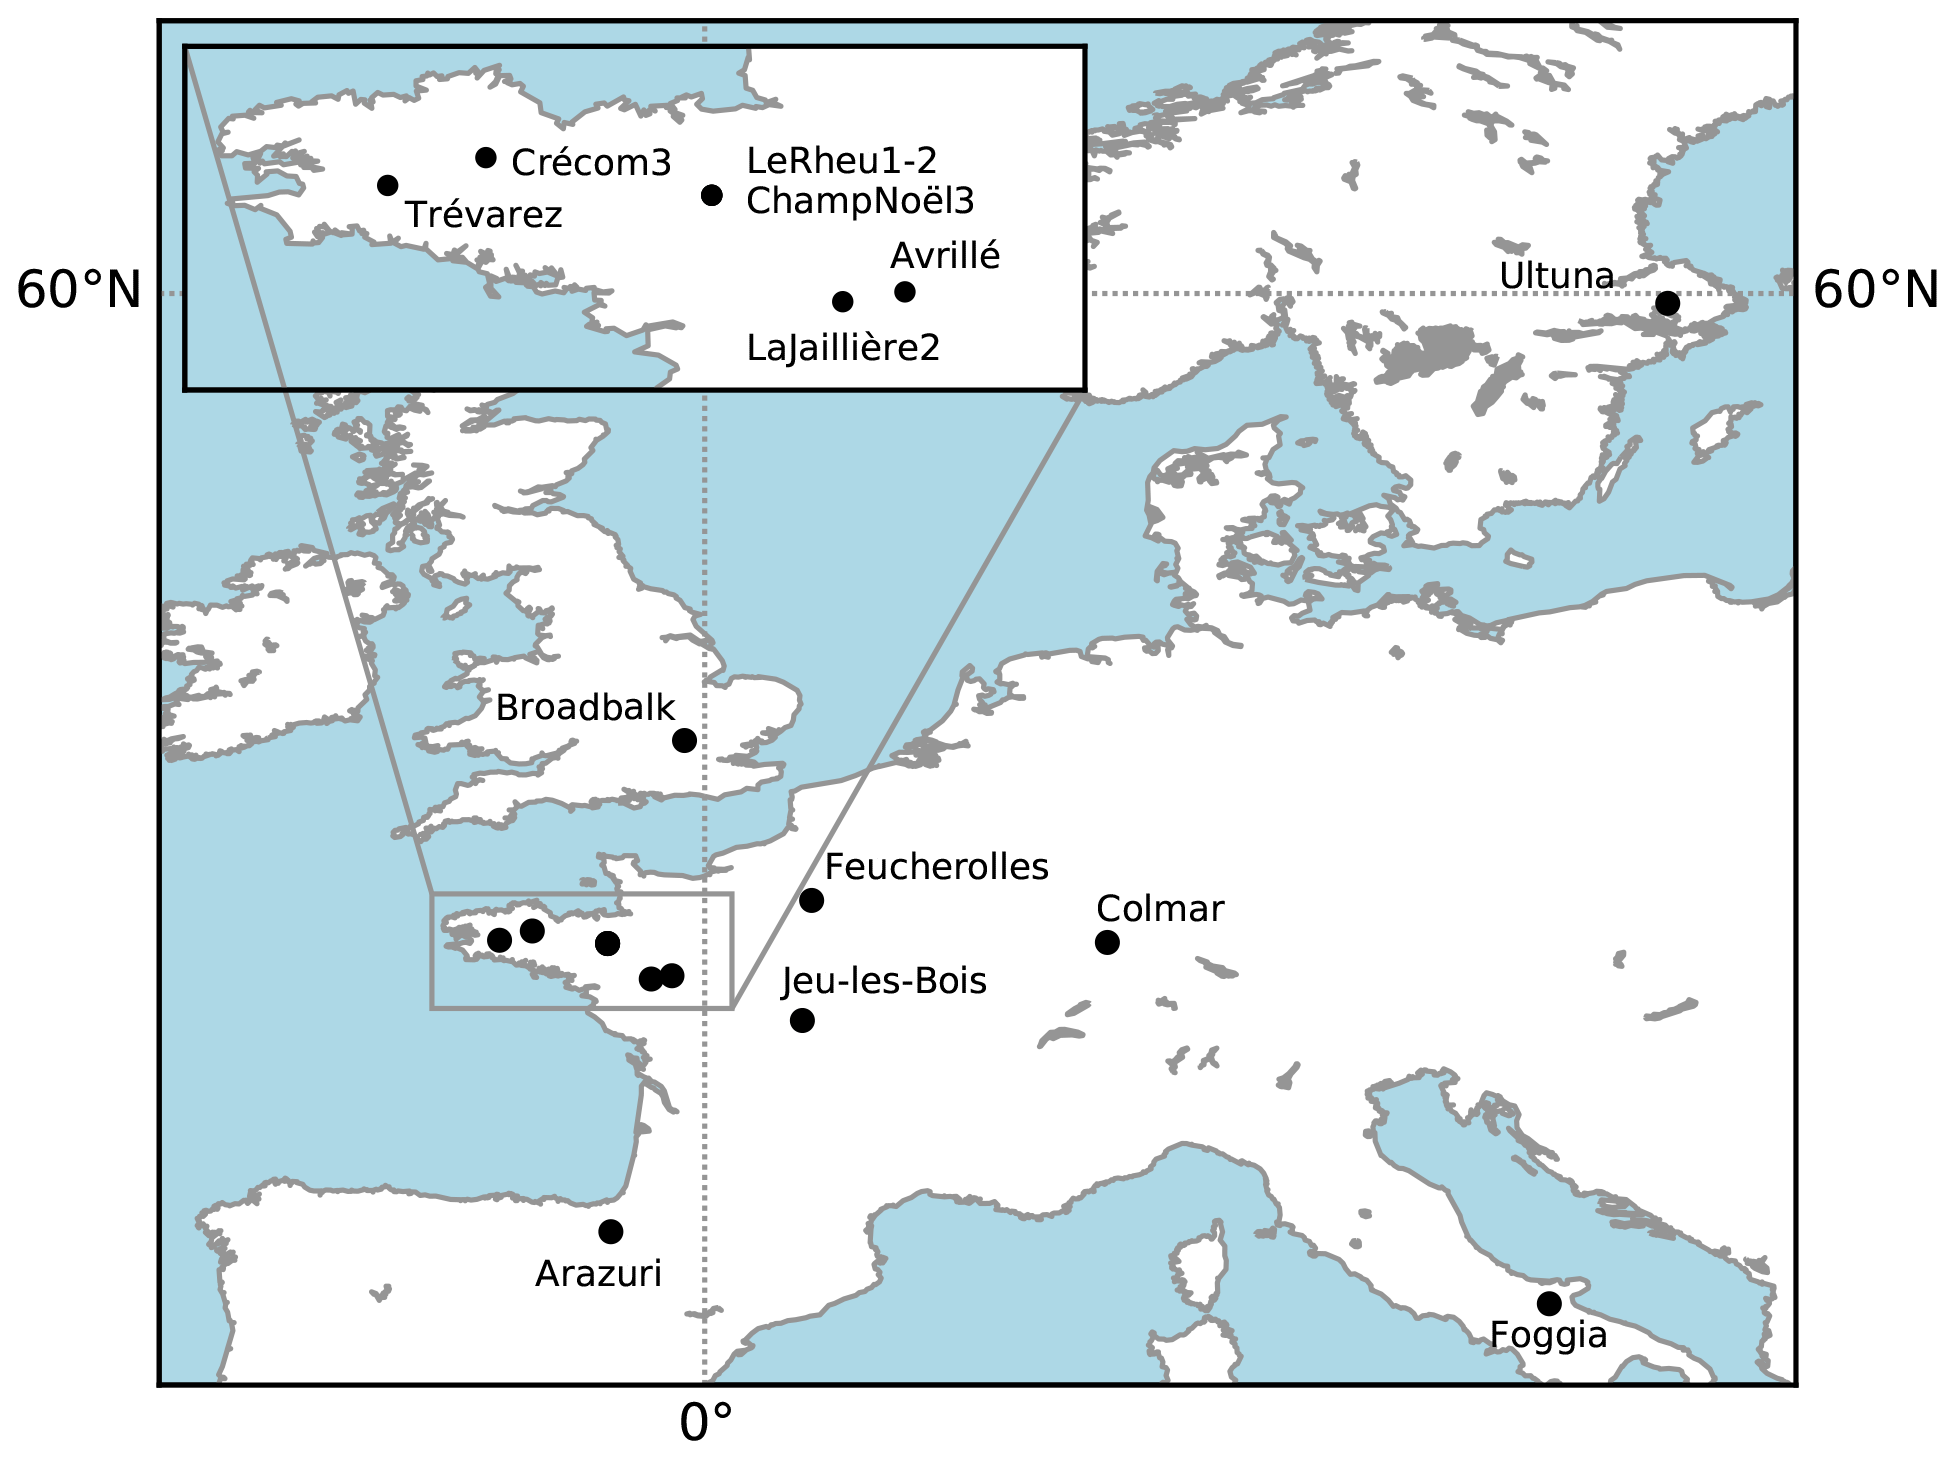
Figure 1Location of the 60 field trials distributed among the 14 cropland experiments around Europe.
Our work was set up in this context with the objectives to (1) estimate the amount of C inputs needed to increase SOC stocks by 4 ‰ yr−1, (2) investigate whether this amount is attainable with currently implemented soil practices (i.e. organic amendments and different crop rotations) and (3) study how the required C inputs are going to evolve in a future driven by climate change. We used the biogeochemistry SOC model Century, which is one of the most widely used and validated models (Smith et al., 1997a), to simulate SOC stocks in 14 different agricultural LTEs around Europe. We set the target of SOC stock increase to 4 ‰ yr−1 for 30 years, relative to the initial stocks in the reference treatments. With an inverse modeling approach, we estimated the amount of additional C inputs required to reach a 4p1000 target at these sites. Finally, we evaluated the dependency of the required additional C inputs on different scenarios of increased temperature.
Table 1Summary of the agricultural experiments included in the study: crop rotations grown at site, amount of carbon inputs () estimated from crop yields as in Bolinder et al. (2007), type of treatments, amount of additional organic carbon from organic treatments () and mean annual SOC stock variation (%).
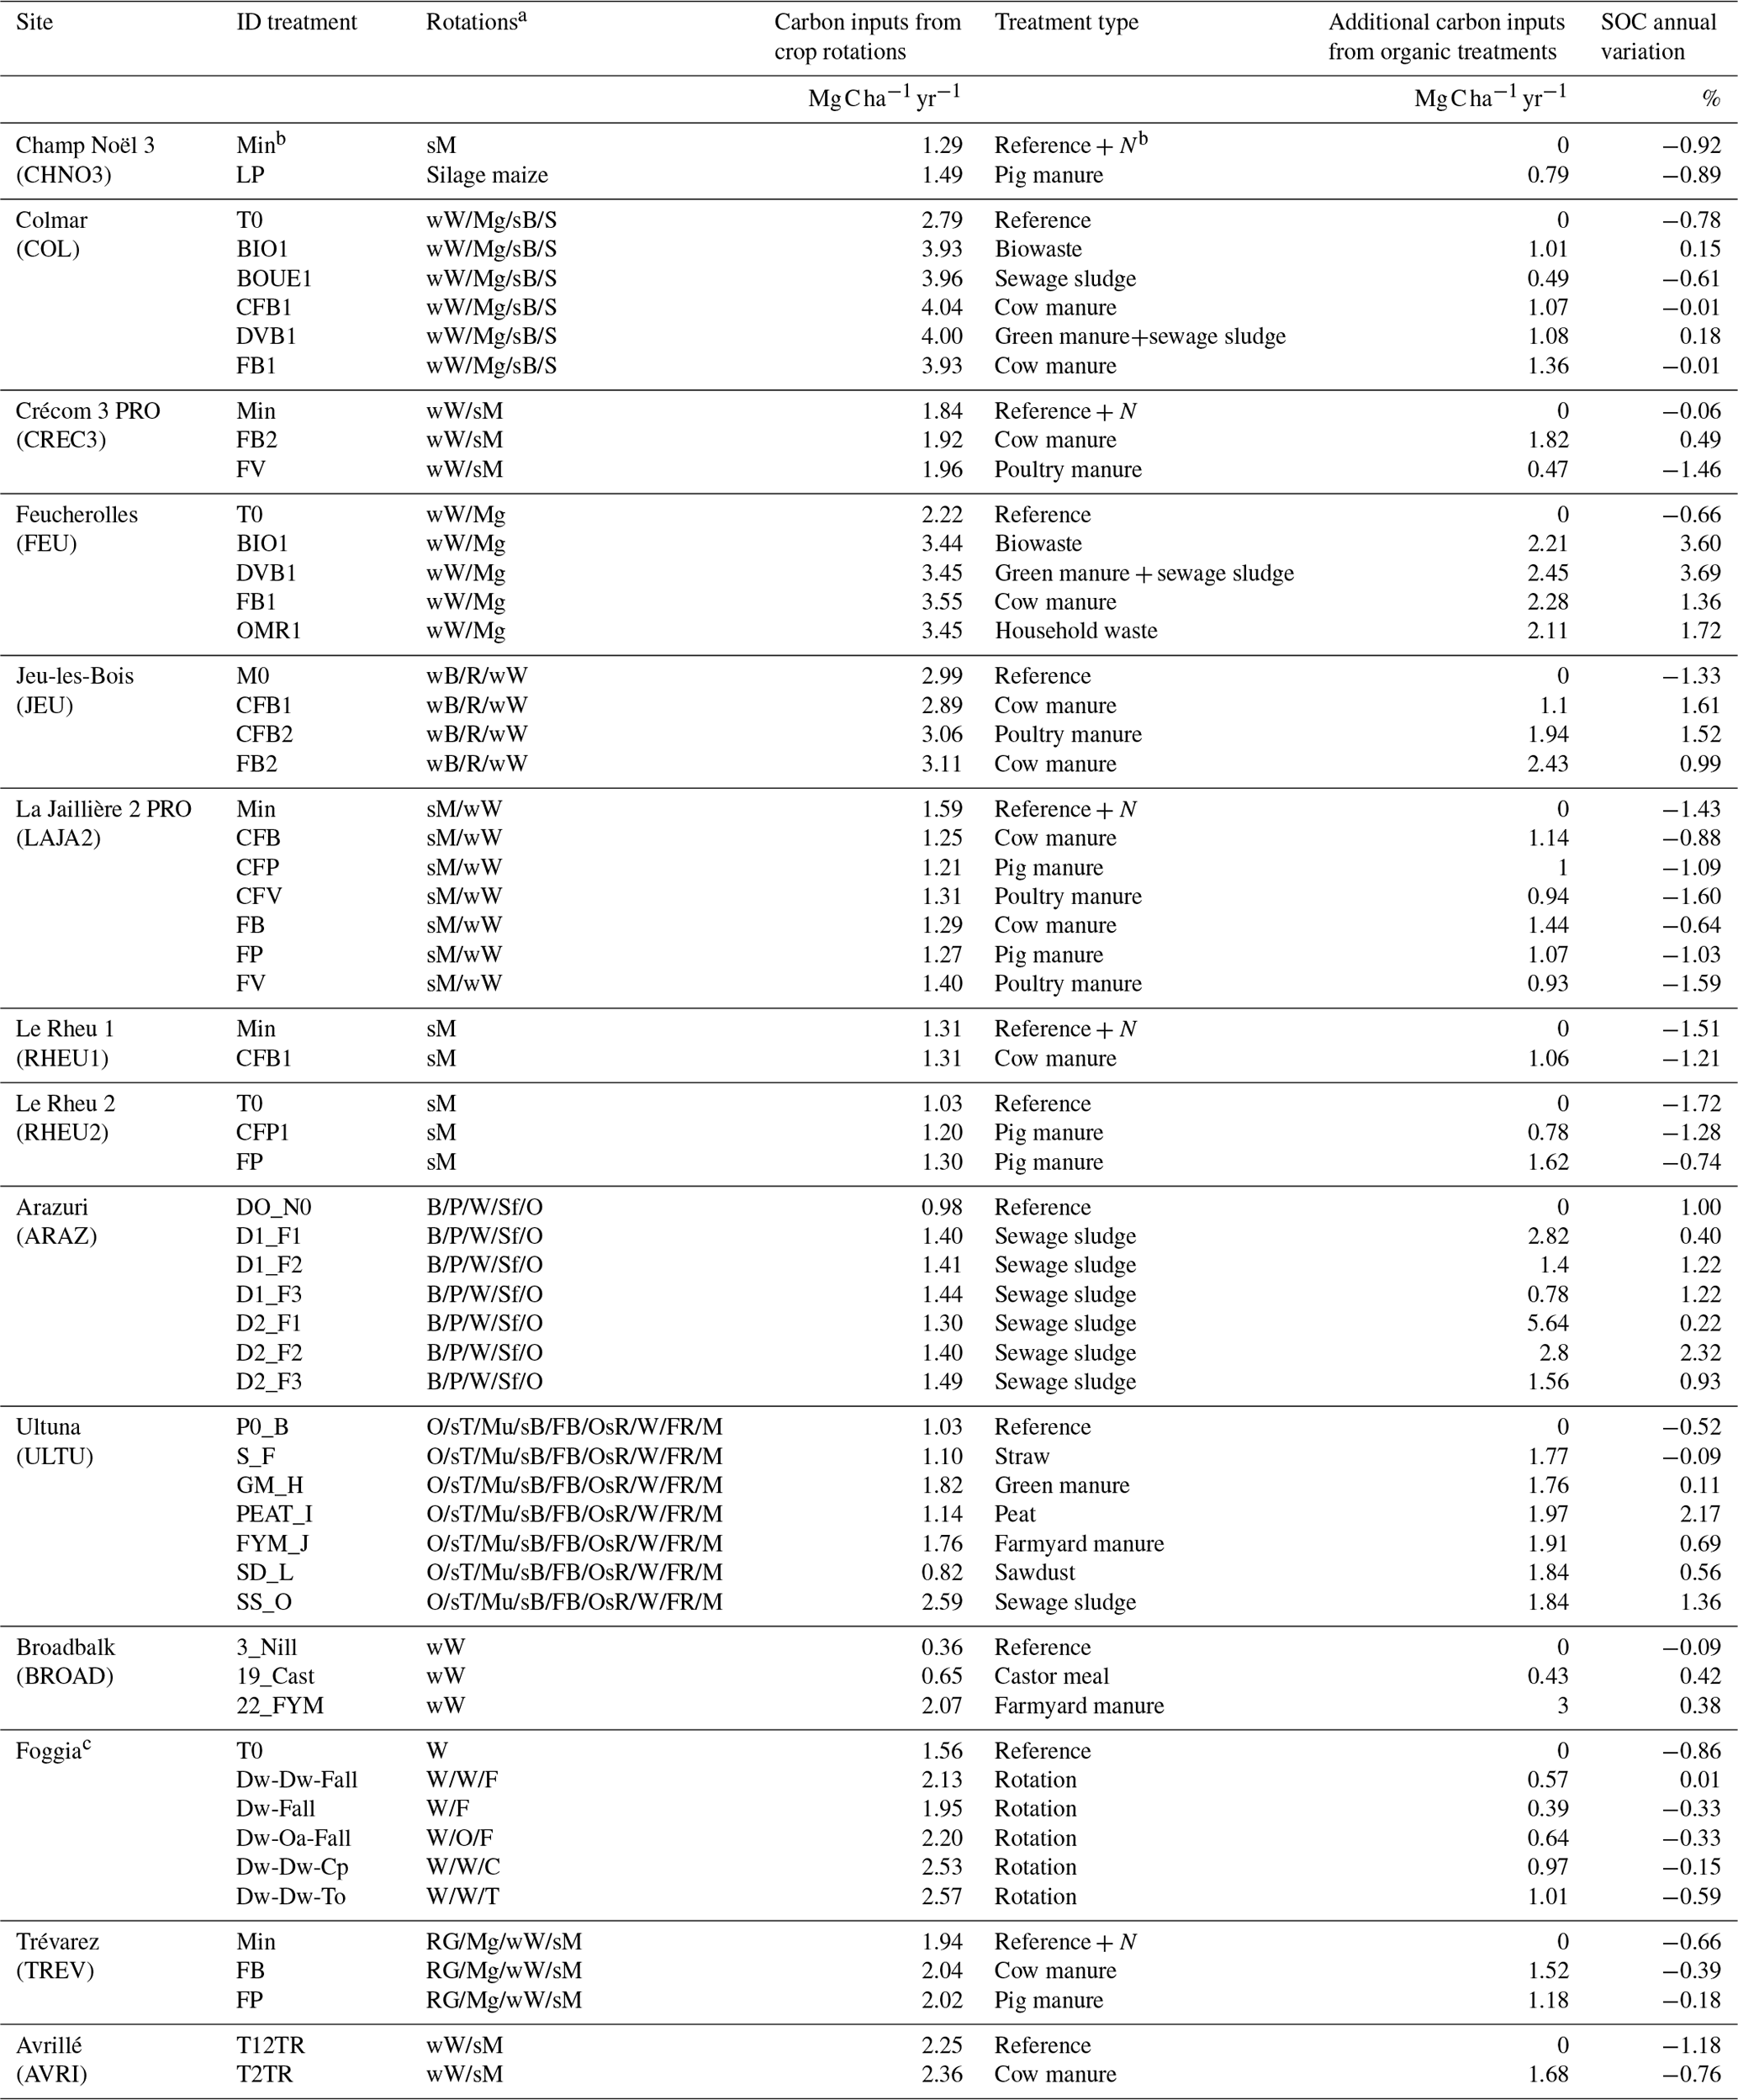
a Crops: sM: silage maize; Mg: maize grain; wW: winter wheat; W: wheat; sB: spring barley; wB: winter barley; B: barley; S: sugar beet; R: rapeseed; Sf: sunflower; O: oats; P: Pea; sT: Swedish turnip; Mu: mustard; DF: fodder beet; OsR: oilseed rapeseed; FR: fodder rapeseed; F: green fallow; C: chickpeas; T: tomato; RG: ray grass. b Optimal amounts of mineral fertilizers added to the control plot and to all other treatments in the experiment. c In Foggia, additional carbon inputs from organic treatments were calculated for each rotation as the difference between C inputs in the rotation and the reference wheat-only rotation.
2.1 Experimental sites
We compiled data from 14 LTEs in arable cropping systems across Europe (Fig. 1), where a total of 46 treatments with increased C inputs to the soil were performed, and one control plot in each experiment was implemented (Table 1). The experiments lasted between 11 and 53 years (median value of 16 years) in the period from 1956 to 2018. Most of the experiments had at least three replicates, except for the Italian site Foggia, the French site Champ Noël 3 and the British site Broadbalk, where no replicates were available. We selected experiments where dry matter (DM) yields and SOC had been measured at several dates. C inputs at all sites, except for control plots and all plots in Foggia, included exogenous organic matter (EOM) addition, e.g., animal manure, household waste, sewage sludge or compost additions. In Foggia, different rotations without organic matter addition were studied and compared to a wheat-only treatment, considered the control plot. The annual C inputs to the soil were substantially higher in the rotations compared to the control. More information on crop rotations and C inputs for each treatment can be found in Table 1.
Cropping systems in the 60 treatments (14 control plots and 46 additional C input treatments) were mainly cereal-dominated rotations (wheat, maize, barley and oat). In particular, four were cereal monocultures (silage maize in Champ Noël 3, Le Rheu 1 and Le Rheu 2 and winter wheat in Broadbalk), and four sites had rotations of different cereals (winter wheat and silage or grain maize in Crécom 3 PRO, Feucherolles, La Jaillière 2 PRO and Avrillé). The other sites rotated cereal crops with legumes (chickpea, pea) and/or root crops (fodder beet, fodder rapeseed and Swedish turnip), oilseed crops (sunflower and oilseed rapeseed) and cover crops (mustard and rapeseed), and one rotation included tomatoes. Straw residue was systematically exported except at French sites, where residue was sometimes incorporated into the soil as accounted for in the C input calculations. All LTEs were under conventional tillage, which was performed with a tractor, except in the case of Ultuna, where it was performed manually. All experiments were rainfed, except for Foggia, where tomatoes were irrigated in summer. The French sites Champ Noël 3, Crécom 3 PRO, La Jaillière 2 PRO, Le Rheu 1 and Trévarez received optimal amounts of mineral fertilizers both in the control plot and in the different organic matter treatments. All other experiments did not receive any mineral fertilization. All control plots, apart from Arazuri, had decreasing SOC stock trends (SOC approximated with a linear regression: SOC = , with average relative change: −0.76 %, R2 = 0.58). Over the 46 treatments of additional C input, 18 exhibited increasing SOC stocks at a higher rate than 4 ‰ yr−1 on average over the experiment length (Table 1). Six treatments had increasing SOC stocks, but at a lower ratio than 4p1000. The other 22 treatments with additional C inputs had decreasing SOC stocks (Mg C ha−1). However, the decreasing trend was, in these cases, lower than the decreasing trend in the respective control plot, in the majority of the treatments.
Table 2Information about experimental sites, including mean annual values of temperature (∘C) and soil humidity to approximately 20 cm depth () simulated with the ORCHIDEE model at each experimental site, measured pH, bulk density (g cm−3), clay (%) and initial SOC stocks in the control plots (Mg C ha−1) at the experimental sites. Reference papers for each site are indicated.
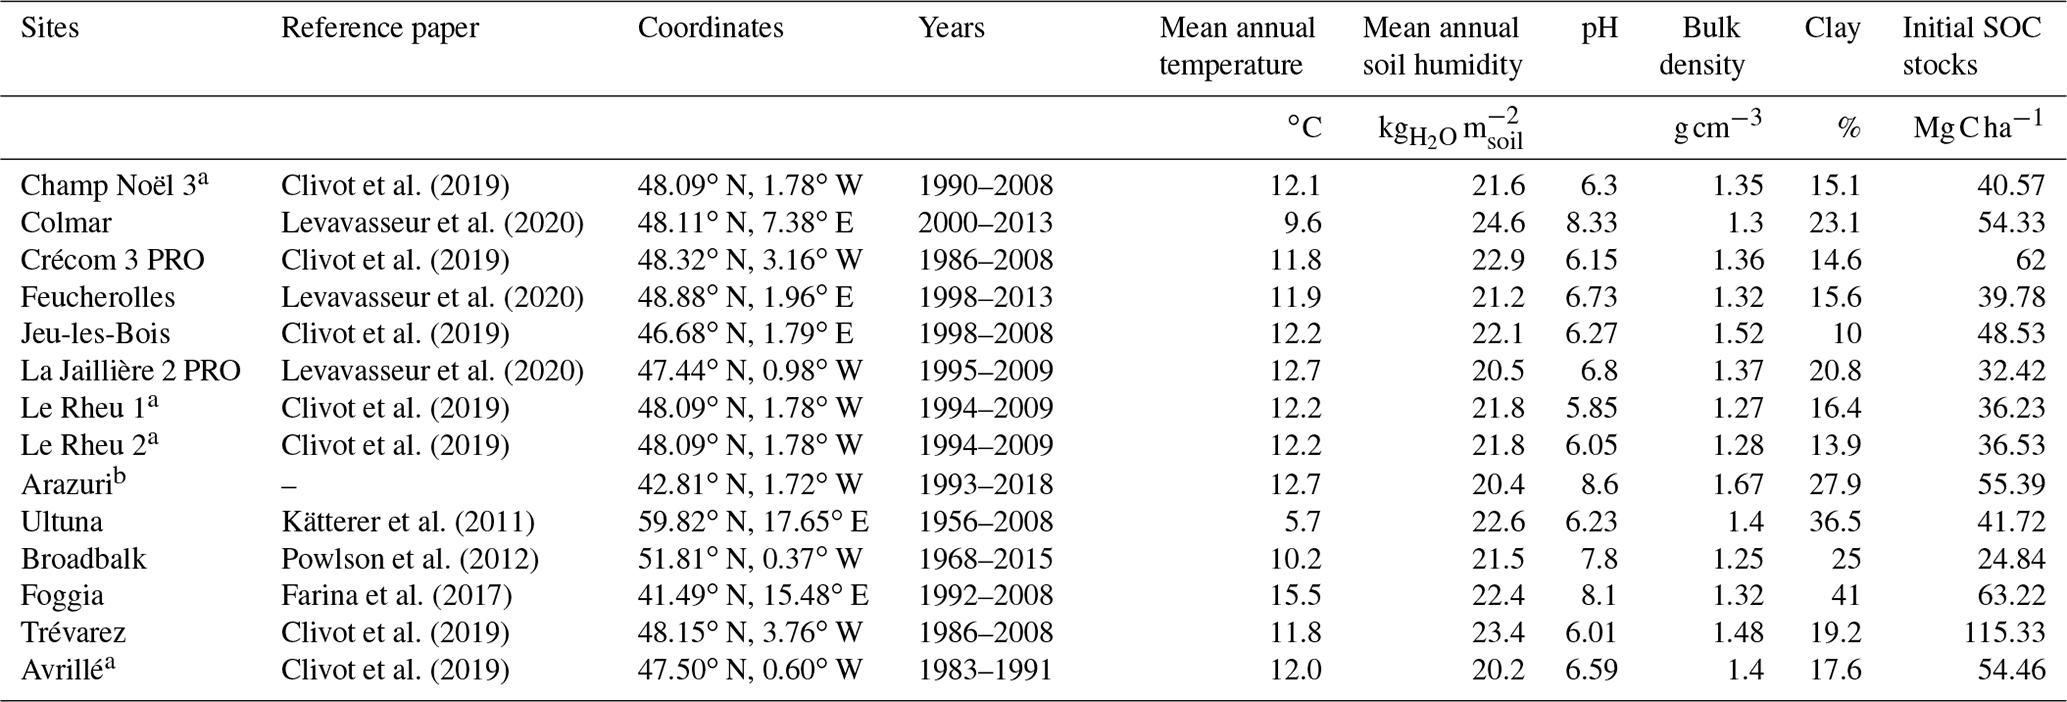
a These experiments were part of the initial French database (AIAL) described in Clivot et al. (2019), but they were not selected for the final modeling work of this latter study. For more information, see also Bouthier et al. (2014). b For Arazuri, data were directly provided by the Spanish Mancomunidad de la Comarca de Pamplona.
2.1.1 Climate forcing
Mean temperature of the sites ranged from a minimum of 5.7 ∘C to a maximum of 15.5 ∘C, while mean soil humidity to approximately 20 cm depth ranged between 20.2 and 24.6 in the dataset (Table 2). When available, observed daily air temperature was used as an approximation of soil temperature. Otherwise, the land–atmosphere model ORCHIDEE was used to simulate soil surface temperature and soil humidity at the site scale (Krinner et al., 2005). ORCHIDEE simulations were run over each site using a 3-hourly global climate dataset at 0.5∘ (GSWP3 http://hydro.iis.u-tokyo.ac.jp/GSWP3/, last access: 1 September 2020). Plant cover was set to C3 plant functional type (PFT) for agriculture.
2.1.2 Soil characteristics
The sampling depth of the experiments varied between 20 and 30 cm. SOC stocks were measured in three to four replicates, apart from the Foggia and Champ Noël 3 experiments, where no replicates were available, and Broadbalk. In this experiment, SOC was measured in each plot using a semi-cylindrical auger where 10–20 cores were taken from across the plot and bulked together (more details can be found on the e-RA website1). The clay content ranged from 10 % (Jeu-les-Bois) to 41 % (Foggia). Soil pH varied from a minimum of 5.85 in Le Rheu 1 to a maximum of 8.33 in Colmar. The average bulk density (BD) in the control plots was 1.38 g cm−3. SOC stocks (Mg C ha−1) were calculated at each site using the following equation:
where SOC (%) is the concentration of organic C in the soil, and BD is the average bulk density of the experimental plot. It should be noted that the application of EOMs might induce differences in BD with time, which in turn affects the calculations of SOC stocks. No adjustment was made in this sense, since data on the evolution of BD were available only for a few sites. This might explain differences between the SOC stocks calculated for Broadbalk in this paper and those found by Powlson et al. (2012) at the same site, by adjusting soil weights to observed decreases in top soil BD due to accumulating farmyard manure (FYM). Initial SOC stock values in the control plot and mean climate variables for each site are reported in Table 2.
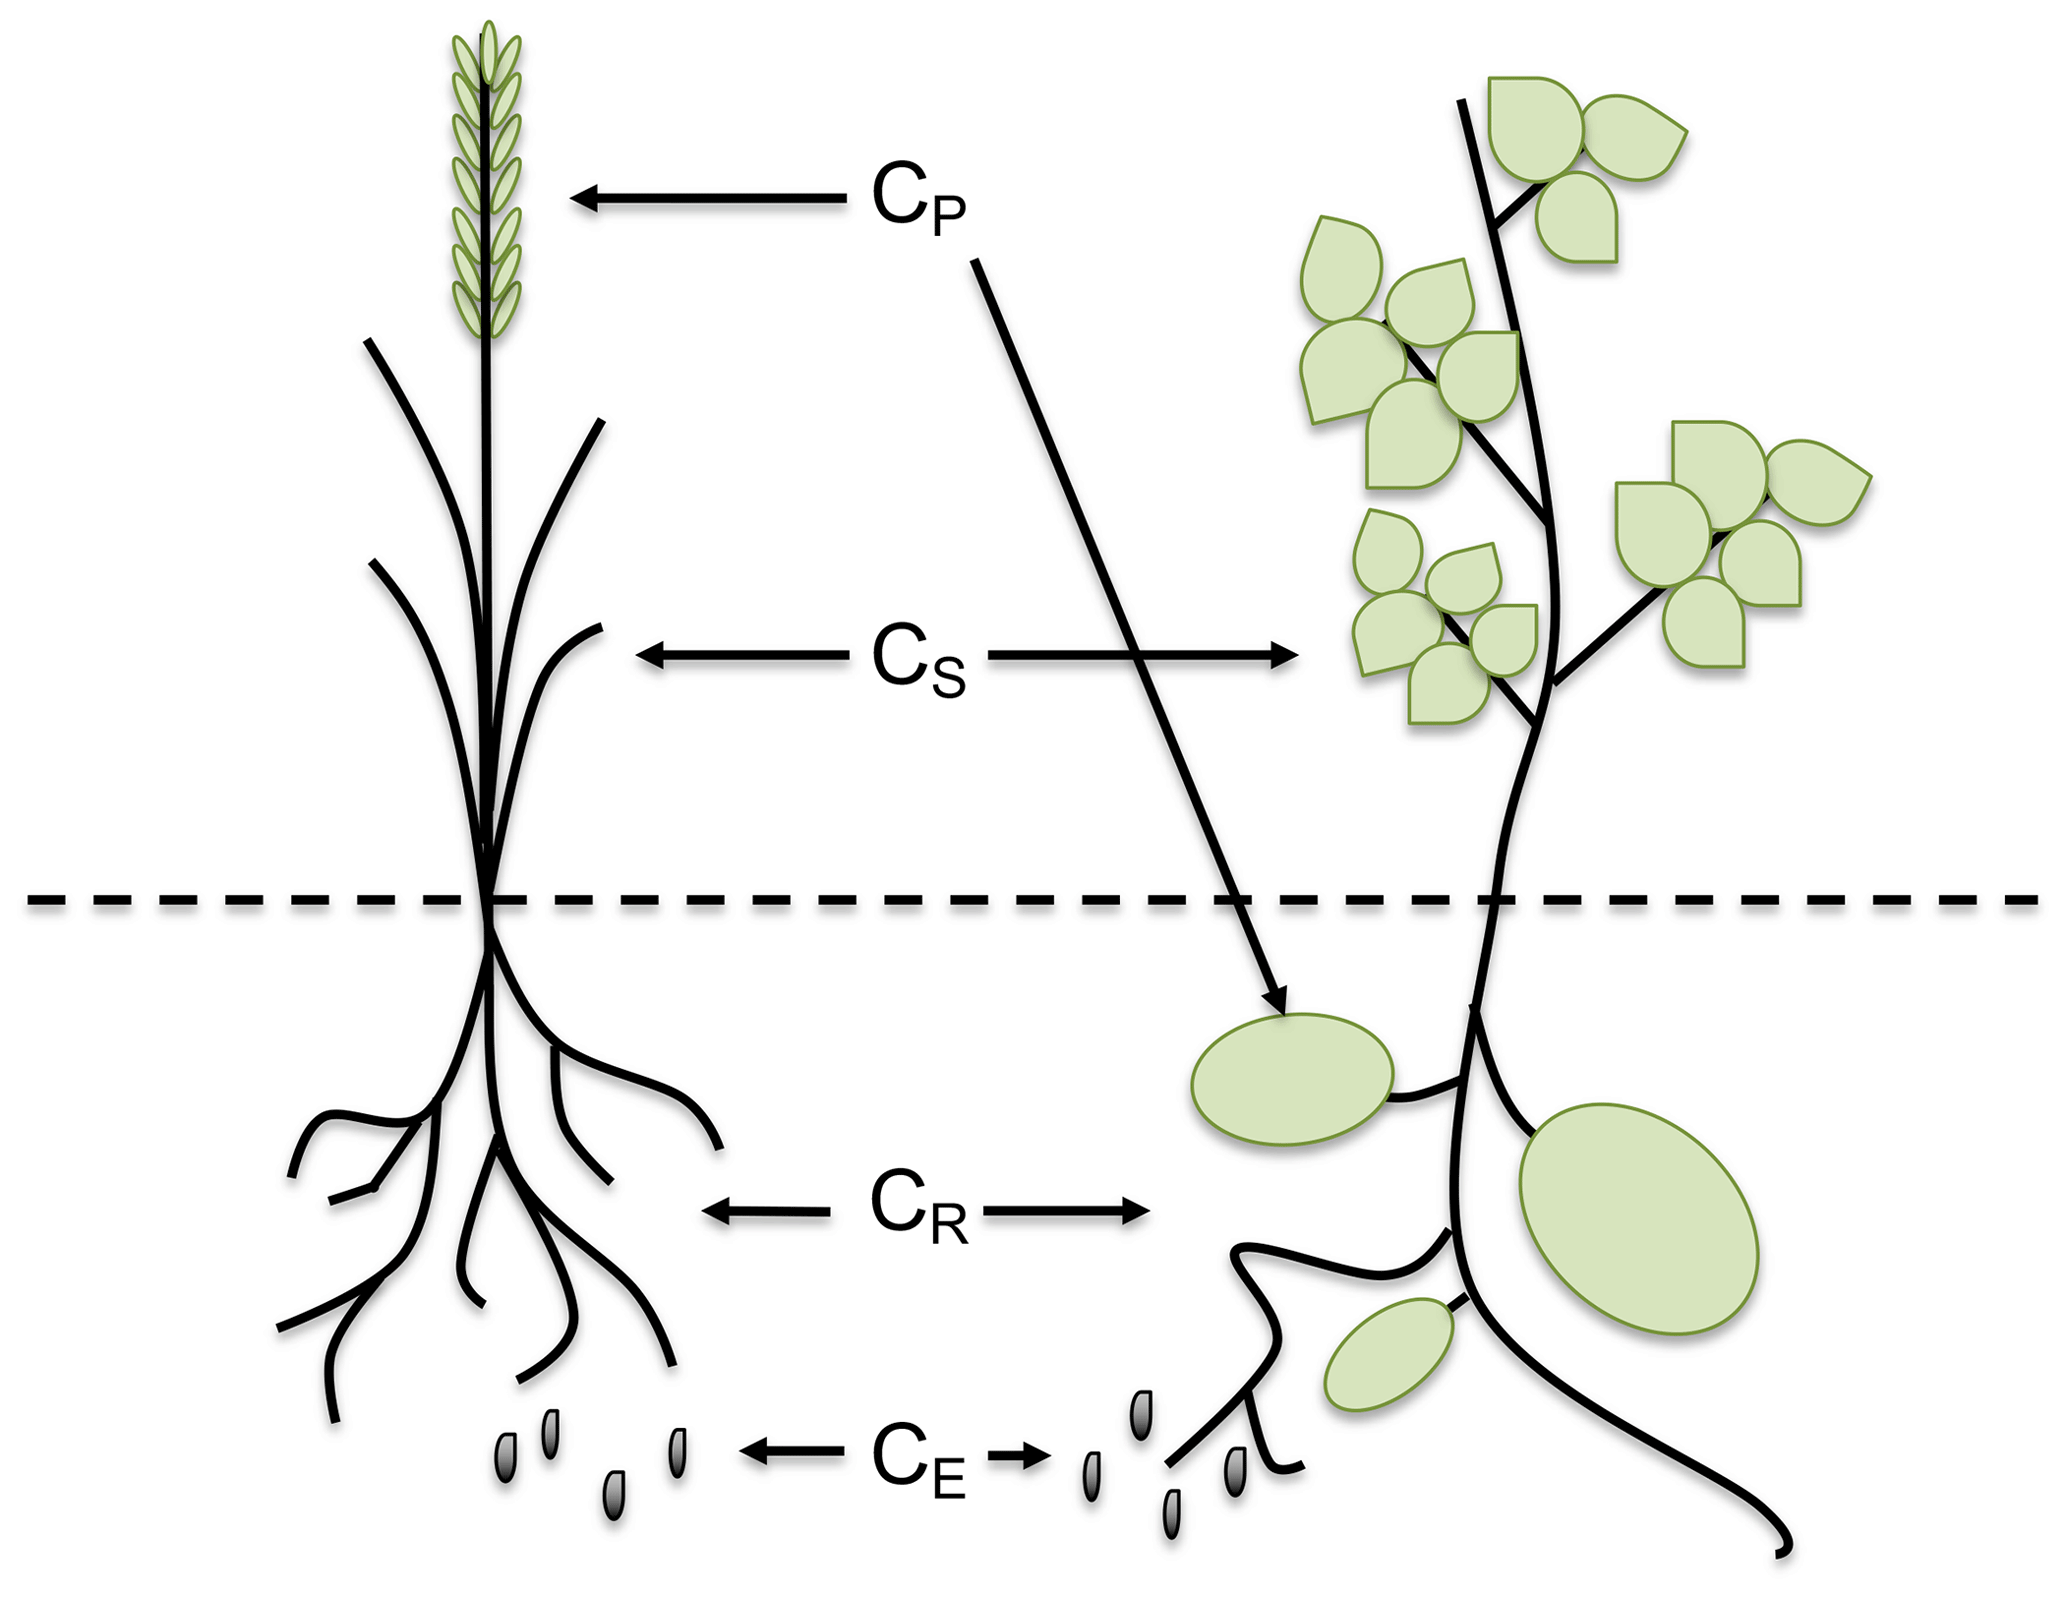
Figure 2Adapted from Bolinder et al. (2007). Representation of the distribution of carbon in the different parts of the plant: CP represents the carbon in the harvested product (grain, forage, tuber), CS is the carbon in the aboveground residue (straw, stover, chaff), CR is the carbon present in roots and CE represents all the extra-root carbon (including all root-derived materials not usually recovered in the root fraction).
2.1.3 Carbon inputs
The allocation of C in the aboveground and belowground parts of the plant was estimated with the approach first described by Bolinder et al. (2007) for Canadian experiments and then adapted by Clivot et al. (2019) to the same French sites we use in this study. This methodology allows the splitting of C inputs from crop residue after harvest into aboveground and belowground C inputs, using measured dry matter yields and estimations of the shoot-to-root ratio (S:R) and harvest indexes (HI) of the crops (see Fig. 2). The aboveground plant material is estimated as the harvested part of the plant (CP), which is exported from the soil, plus the straw and stubble that are left in the soil after harvest (CS). The harvested part consists of the measurements of DM yields (YP), while the straw and stubble are estimated using the HI coefficient of the different crops in the rotation (Bolinder et al., 2007). We assumed that the values used in Clivot et al. (2019) for the HI compiled from French experimental sites were applicable to all the sites in our dataset, which mainly include temperate sites over Europe. When these values were not available for some crops, they have been directly derived from Bolinder et al. (2007) or other sources in the literature (S:R ratio for fallow from Mekonnen et al., 1997, and tomato from Lovelli et al., 2012). When straw was exported from the field, we considered that only a fraction of CS was left on the soil. This fraction was set to 0.4 for all sites and to 0.2 in Ultuna, where almost no stubble was left on the soil, since plots were harvested by hand and crops were cut at the soil surface. We considered a C content of 0.44 g C (g DM)−1 in the aboveground (AG) plant material (Redin et al., 2014) and 0.4 g C (g DM)−1 in the belowground (BG) part material (Bolinder et al., 2007). We used the asymptotic equation of Gale and Grigal (1987) to determine the cumulative BG input fraction from the soil surface to a considered depth:
where β is a crop-specific parameter determined using the root distributions for temperate agricultural crops, reported in Fan et al. (2016) and Clivot et al. (2019). The depth was set to 30 cm, since it was the depth at which soil samples were taken at the majority of the sites. For more details on the C input allocation method and the allometric functions involved, see Bolinder et al. (2007) and Clivot et al. (2019).
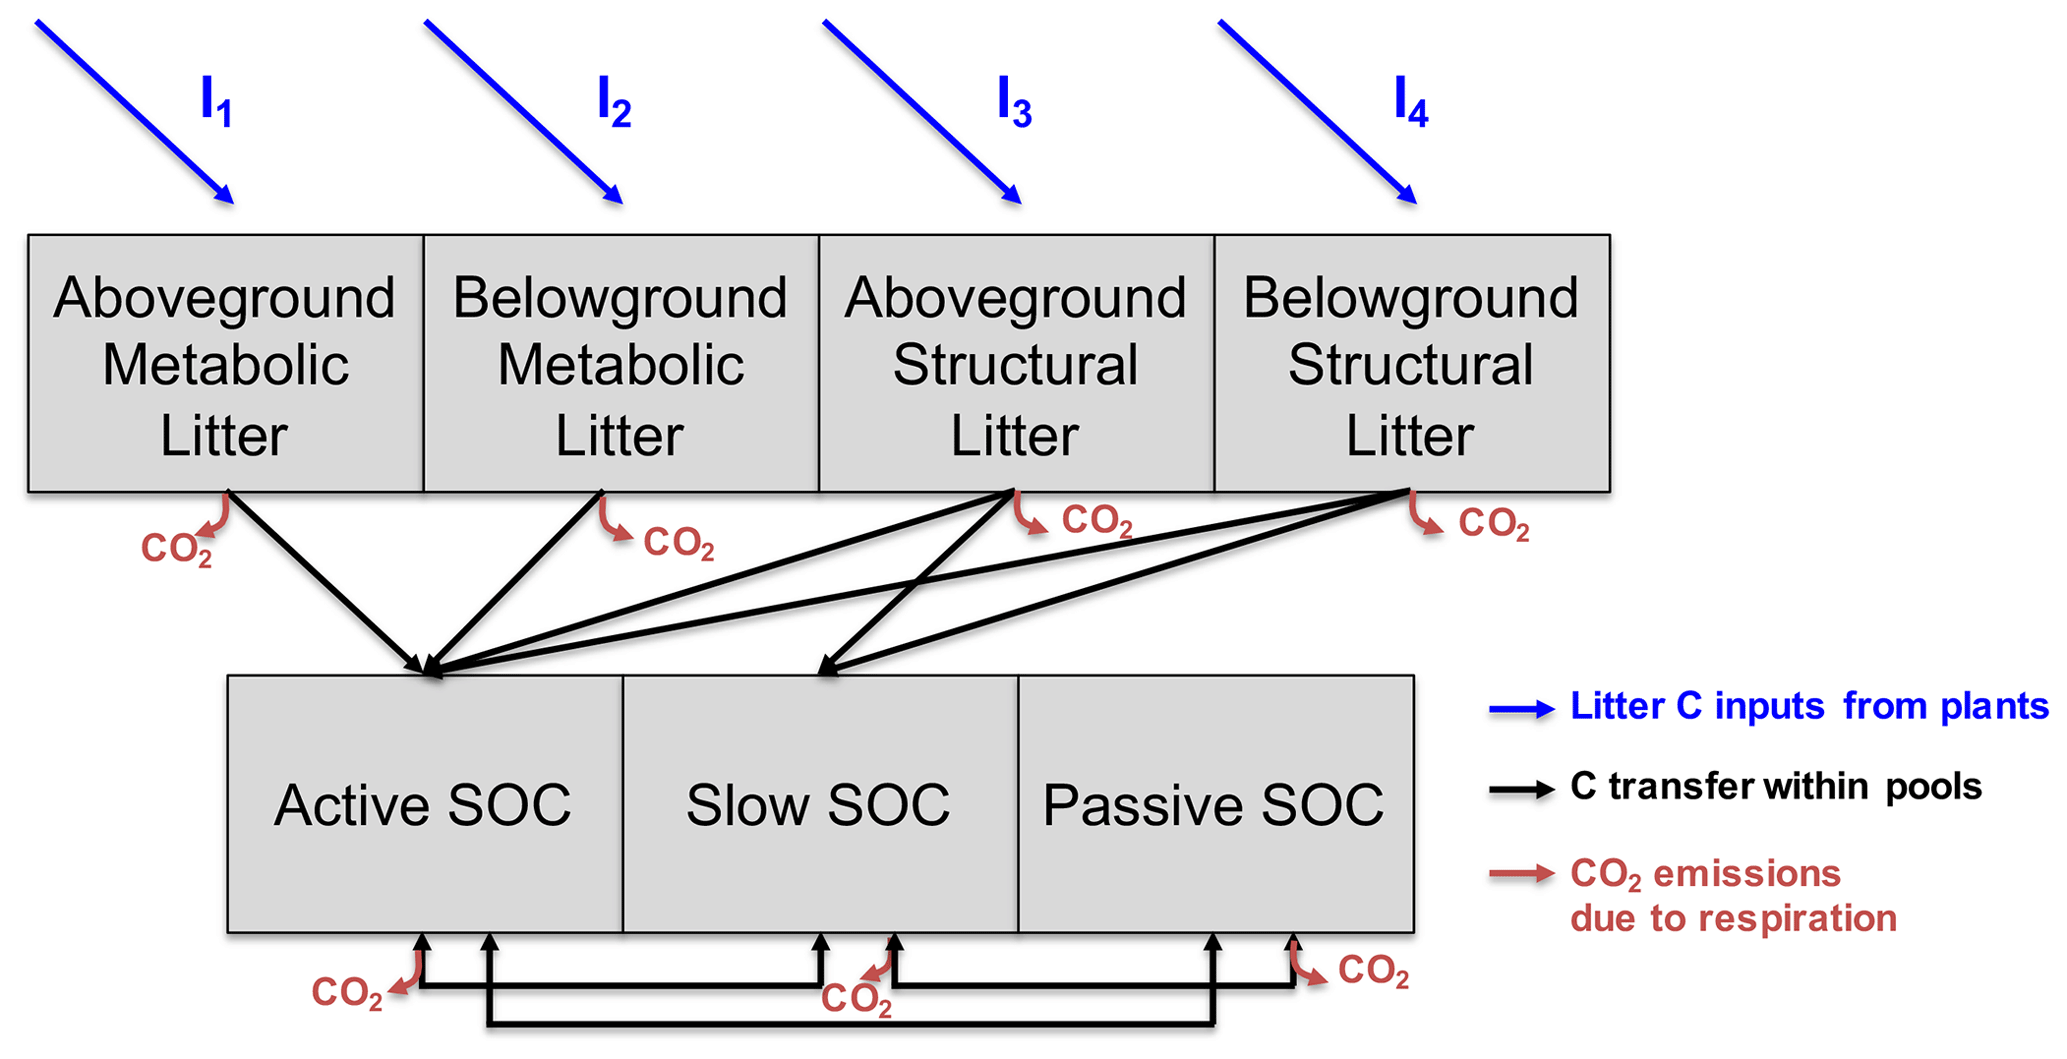
Figure 3Representation of litter and soil organic carbon (SOC) pools in Century. The model takes as input litter carbon from plants (aboveground metabolic (I1), belowground metabolic (I2), aboveground structural (I3) and belowground structural (I4)). A certain fraction of carbon can be transferred from one pool to another, and each time a transfer occurs, part of this carbon is respired and leaves the system to the atmosphere as CO2. The SOC active pool receives carbon from each litter pool, while only the structural material is transferred to the SOC slow pool. Litter material never goes directly to the SOC passive pool while the three SOC pools exchange C within each other.
2.2 Century model
2.2.1 Model description
For this study, we selected the Century model, which has proven to be well suited to accurately simulate the soil C dynamics in a range of pedoclimatic areas and cropping systems (Bortolon et al., 2011; Cong et al., 2014; Parton et al., 1993), and because we had the full command of the model for fine tuning of parameters. Soil C dynamics in a soil organic matter (SOM) model with first-order kinetics can be mathematically described by the following first-order differential matrix equation:
where I is the vector of the external C inputs to the soil system, with four nonzero elements (Fig. 3). The second term of the equation represents organic matter decomposition rates (diagonal matrix K), losses through respiration (ξTWLCl(t)), transfers of C among different SOC pools (A) and SOC evolution with time (SOC(t)) (see Appendix A). We used the daily time-step version of the SOM model Century (Parton et al., 1988) to simulate the amount of C inputs required to reach a 4 ‰ annual increase in SOC stocks over 30 years. In the version used, only SOC is modeled, and plant growth is directly accounted for as variations in C inputs. The original version of Century simulates the fluxes of SOC depending on soil relative humidity, temperature and texture (as a percentage of clay). As shown in Fig. 3, the model is discretized into seven compartments that exchange C with each other: four pools of litter (aboveground metabolic, belowground metabolic, aboveground structural and belowground structural) and three pools of SOC (active, slow and passive). The litter C is partially released to the atmosphere as respired CO2 and partially converted to SOM in the active, slow and passive pools (see Table S1 in Supplement for default Century parameters). The decomposition rate of C in the ith pool depends on climatic conditions and litter and soil characteristics and is calculated using environmental response functions, as follows:
where is one of the AG and BG metabolic and structural litter pools and the active, slow and passive SOC pools; Ki is the (K)ii element of the diagonal matrix K in Eq. (3); ki is the specific mineralization rate of pool i; fT(t) is a function of daily soil temperature; fW(t) is a function used as a proxy to describe the effects of soil moisture; fL i is a reduction rate parameter acting on the AG and BG structural pools only, depending on the lignin concentration in the litter; and fClay i is a reduction rate function of clay on SOC mineralization in the active pool. The temperature function fT(t) describes the exponential dependence of soil decomposition on surface temperature, through the Q10 relationship that was first presented by M. J. H. van 't Hoff (1884):
where Q10 is the temperature coefficient, usually set to 2, and Tref is the reference temperature of 30 ∘C. The Q10 factor is a measure of the soil respiration change rate as a consequence of increasing temperature by 10∘. The other environmental response functions are described in Appendix A.
2.2.2 Model initialization
The initialization of the model consists of specifying the sizes of the SOC pools at the beginning of the experiment. Here, we assumed initial pools are in equilibrium with C inputs before the experiments begin, in absence of knowledge about past land use and climate making initial pools different from steady state (Sanderman et al., 2017). Then, initialization can be done either by running the model iteratively for thousands of years to approximate the steady-state solution (numerical spin-up) or semi-analytically by solving the set of differential equations that describes the C transfers within model compartments (Xia et al., 2012). We solved the matrix equation by inverse calculations for determining pool sizes at steady state, as in Xia et al. (2012) and Huang et al. (2018). These authors demonstrated that the matrix inversion approach exactly reproduces the steady state and SOC dynamics of the model. By speeding up the performance of the simulations, this technique allowed us to perform the optimization of model parameters, the sensitivity analysis of SOC to climatic variables and the quantification of model output uncertainties through Monte Carlo (MC) iterative procedures. We solved the matrix equation by using its semi-analytical solution and the following algorithm: (1) calculating annual averages of matrix items obtained by Century simulations, driven by 30 years of climatic forcing, and (2) setting Eq. (3) to zero to solve the state vector SOC. For each agricultural site, the 30 years of climate forcing were set as the 30 years preceding the beginning of the experiment, and the litter input estimated from observed vegetation was set to be the average litter input in the control plot over the experiment duration.
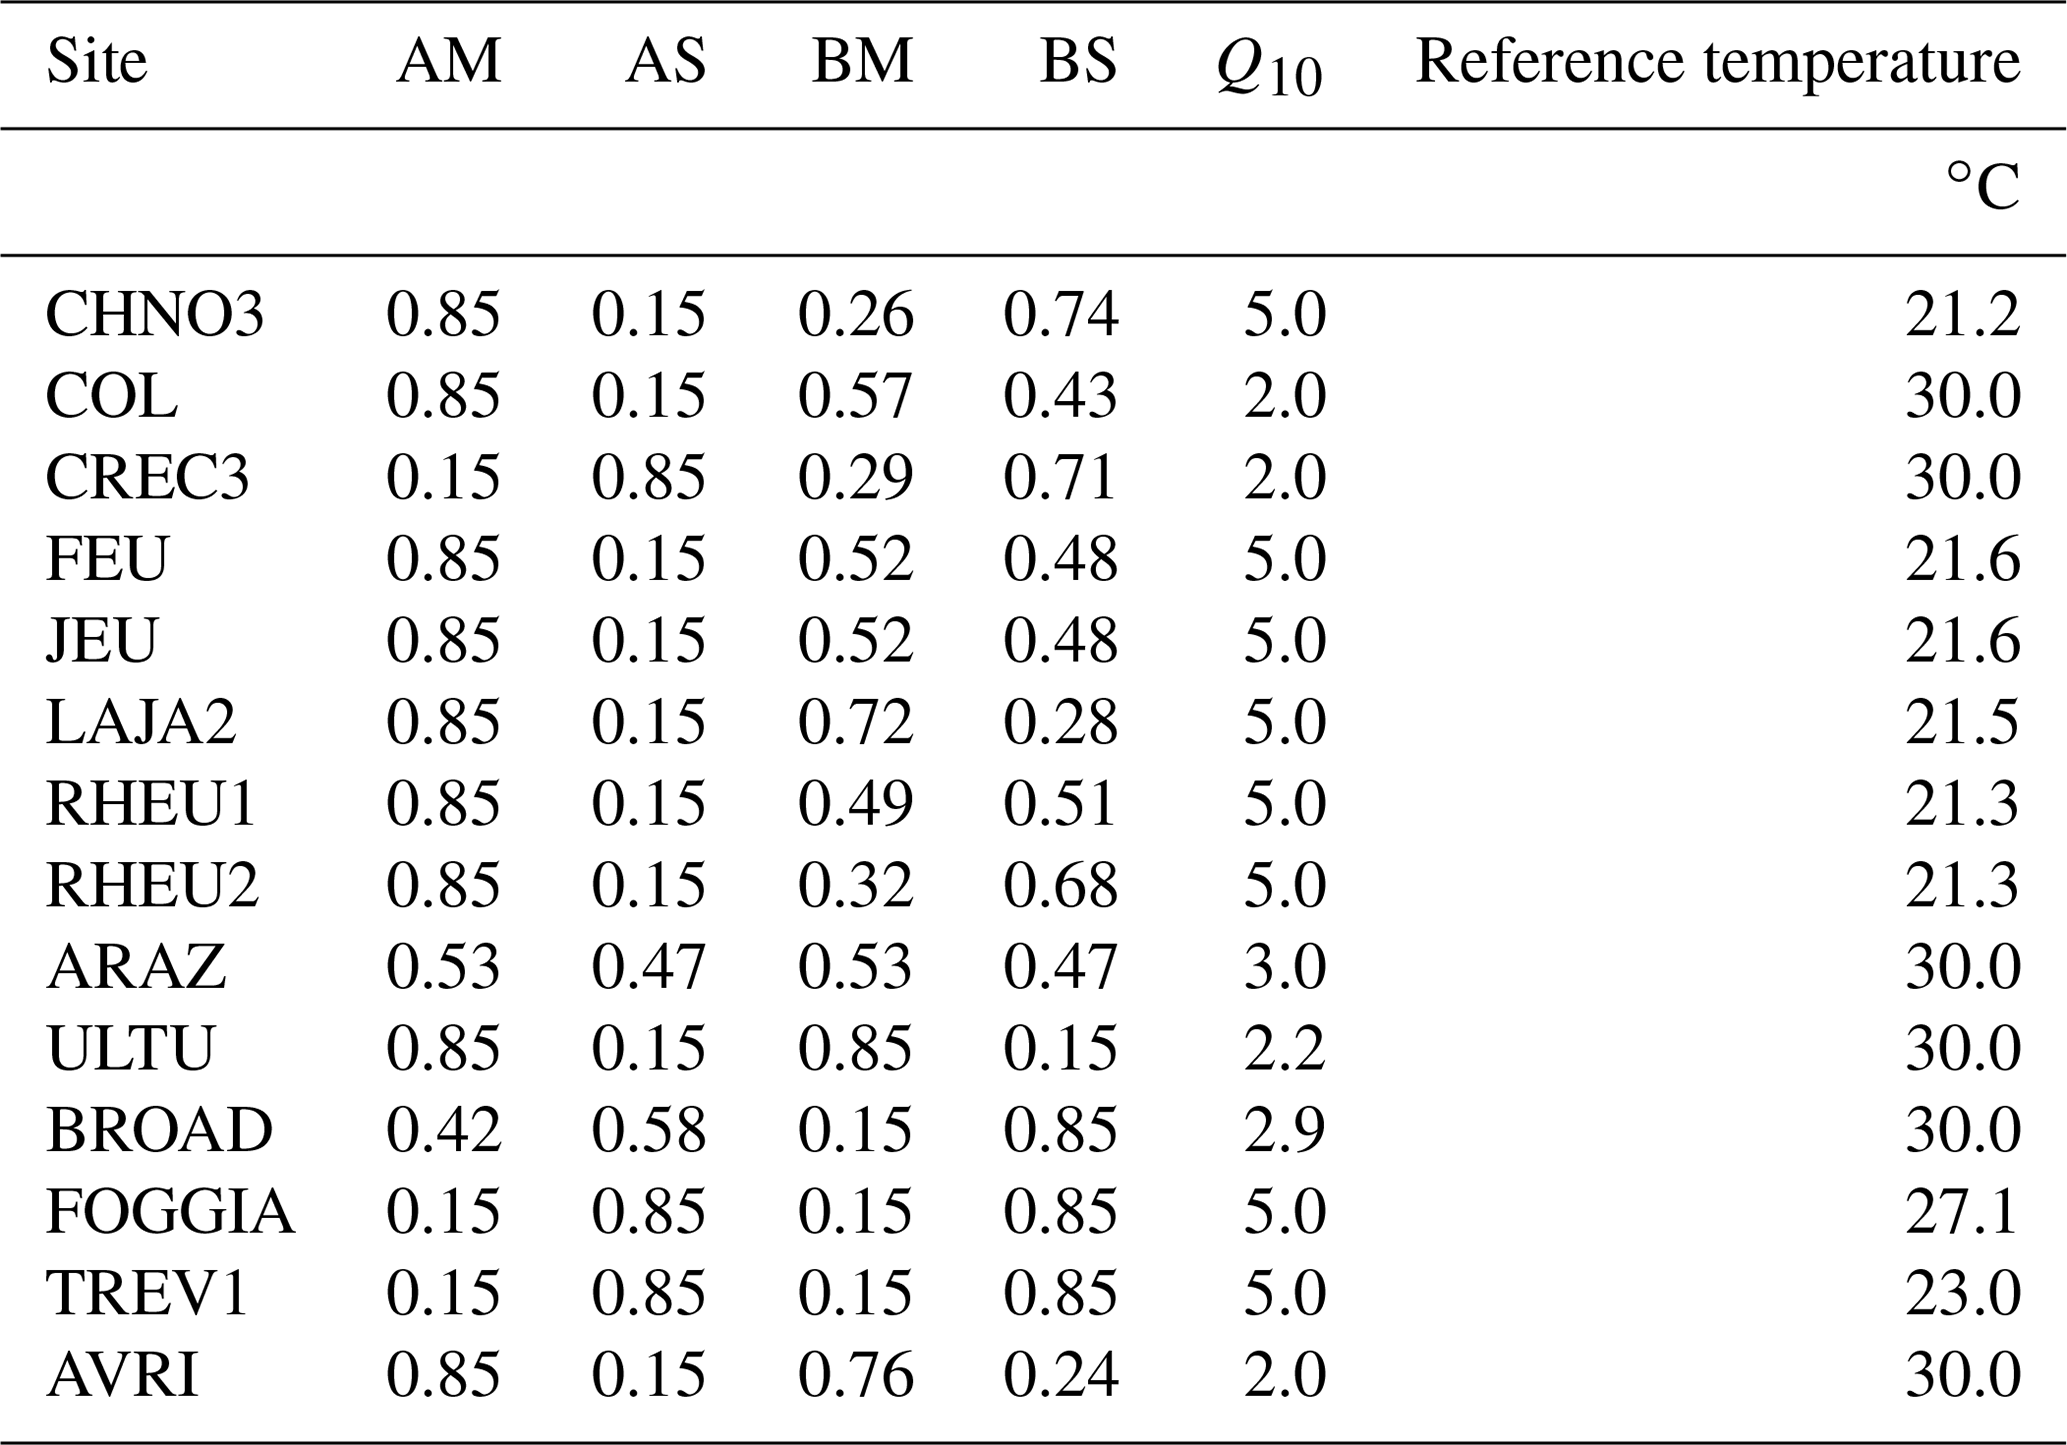
Table 3Optimized values of the aboveground metabolic (AM), aboveground structural (AS), belowground metabolic (BM) and belowground structural (BS) fractions of the litter inputs and the Q10 and reference temperature (∘C) parameters.
2.2.3 Model calibration: optimization of the metabolic : structural fractions of the litter inputs
In the Century model, AG and BG carbon inputs are further separated into metabolic and structural fractions, according to the lignin-to-nitrogen (L:N) ratio. Because the L:N ratio was not available for all the crops in the database, we fitted model simulations to observed SOC dynamics for the control plot of each site, i.e. the reference plot without additional C inputs, in order to get the metabolic : structural (M:S) fraction of the AG and BG carbon inputs. We used the sequential least-squares quadratic programming function in Python (SciPy v1.5.1, scipy.optimize package with method, SLSQP), a nonlinear constrained, gradient-based optimization algorithm (Fu et al., 2019). We successfully performed the optimization at 13 sites, where at least three measures of SOC stocks were available. For Jeu-les-Bois, which includes two SOC measurements only, we decided to use the same optimized values as for Feucherolles, which has similar pedoclimatic conditions and crop rotations. The optimization consisted in minimizing the following function:
where i = is the year of the experiment, (Mg C ha−1) is the SOC simulated with Century for year i, (Mg C ha−1) is the observed SOC for year i in the control plot and is the variance of the estimated from the different replicates. When replicates were not available, we recalculated as the variance amongst SOCobs samples of the whole experiment. The optimized M:S values are reported in Table 3 and represent the average quality of litter C in the rotating crops along the duration of the experiments that match control SOC data at each site.
2.2.4 Model calibration: optimization of temperature dependency parameters
We optimized the Q10 and daily soil reference temperature parameters, which affect SOC decomposition. The Q10 factor is fixed to 2 in Century. However, many authors have shown that Q10 measurements vary with pedoclimatic conditions and vegetation activity (Craine et al., 2010; Lefèvre et al., 2014; Meyer et al., 2018; Wang et al., 2010). For this reason, and to correctly reproduce interregional variations among the sites in the dataset, we optimized both the Q10 and reference temperature parameters to better fit the SOC dynamics ( Mg C ha−1) of each agricultural site at the control plot. We decided to bind the Q10 between 1 and 5, following the variation in Q10 found by Wang et al. (2010) over 384 samples collected in the Northern Hemisphere. The reference temperature ranged between 10 and 30 ∘C. We used the SLSQP optimization algorithm and the cost function of Eq. (6) to perform the optimization, which was successful at 13 sites, and we assigned the values obtained from the optimization of Feucherolles to Jeu-les-Bois, where SOC measurements were too sparse to perform a two-dimensional optimization. Optimized values of Q10 and reference temperature are reported in Table 3.
Model performance in the control plot was evaluated using two residual-based metrics. The first one is the mean squared deviation (MSD), decomposed into its three components to help locate the source of error of model simulations: the squared bias (SB), the non-unity slope (NU) and the lack of correlation (LC). The second metric used is the normalized root-mean-squared deviation (NRMSD) (see Appendix B).
2.3 4p1000 analysis
2.3.1 Optimization of C inputs to reach the 4p1000 target
After the spin-up to steady state, the model was set to calculate the SOC stock dynamics of the control plot and the C inputs for virtual treatments, assuming an average increase in SOC stocks by 4 ‰ yr−1 over 30 years. A total of 30 years is considered a period of time over which the variation in SOC can be detected correctly. During this period length, we supposed the soil was fed with constant amounts of C inputs from plant material. For the control, we derived C inputs from measurements of DM yields and calculated the annual mean over the whole experiment length. For the virtual treatments, we used an optimization algorithm to calculate the required amount of C inputs to reach a linear increase in SOC storage by 4 ‰ yr−1 above the SOC stock at the start of the simulation. Mathematically, we minimized the following function:
where I is the 1 × 4 vector of C inputs to minimize over, SOC0 is the initial SOC stock and is the SOC stock after 30 years of simulation. During the optimization, the M:S fractions were allowed to vary to estimate the quality of the optimal C inputs. Instead, we kept the AG : BG ratio of the C inputs fixed to its initial value, to bind the model in order to represent agronomically plausible C inputs. In fact, if not bound, the model tends to increase the BG C fraction to unrealistic values (assuming the same crop rotations persisted on site). On the other hand, keeping the AG : BG ratio fixed implies that the simulated additional C inputs will be spread equally on the surface and belowground. As for the previous optimizations, we used the Python function SLSQP to solve the minimization problem. The outcome of the optimization is a 4 × 1 vector (Iopt) representing the amount of C in the four litter input pools that matches the 4p1000 rate target.
2.3.2 Uncertainty quantification
Uncertainties of model outcomes were quantified using a Monte Carlo approach. We initially calculated the standard error (SE) of the mean C inputs derived from yield measurements for each experimental site:
where is the variance of the estimated C input from yield measurements and s is the length of the experiment. If not available, we calculated as the average relative variance of C inputs among the control plots. We therefore randomly generated N vectors of C inputs (I) around the calculated standard error and performed the 4p1000 optimization N times, each time using one of the generated vectors I as a prior for the optimization. To correctly assess the uncertainty over the required C inputs, we set N to 50 (Anderson, 1976). The SE of model outputs was calculated with Eq. (8), where the variance was set as the variance of the modeled carbon outputs and the experiment size (s) to 50.
2.3.3 Analysis of sensitivity to temperature
We tested the sensitivity of model outputs to temperature, running two simulations with increased temperatures. We considered two representative concentration pathways (RCPs) of global average surface temperature change projections (IPCC, 2015). The first scenario (RCP2.6) is the one that contemplates stringent mitigation policies and predicts that average global land temperature will increase by 1 ∘C during the period 2081–2100, compared to the mean temperature of 1986–2005. The second scenario (RCP8.5) estimates an average temperature increase of +4.8 ∘C, compared to the same period of time. We ran two simulations of increasing temperature scenarios with Century. We considered the same initial conditions as the standard simulations, hence running the spin-up with the average soil temperature and relative humidity of the 30 years preceding the experiments. Then, we increased daily temperature by 1 ∘C (AS1) and 5 ∘C (AS5) for the entire simulation length, to assess the sensitivity of modeled C inputs to increasing temperatures. Nevertheless, it must be noted that our simulations are running over a 30-year period, not the entire 21st century. Thus, the temperature sensitivity analysis should not be considered a test of climatic scenarios but a classical sensitivity analysis where the boundaries were defined following RCP2.6 and RCP8.5 predictions of increased temperatures.
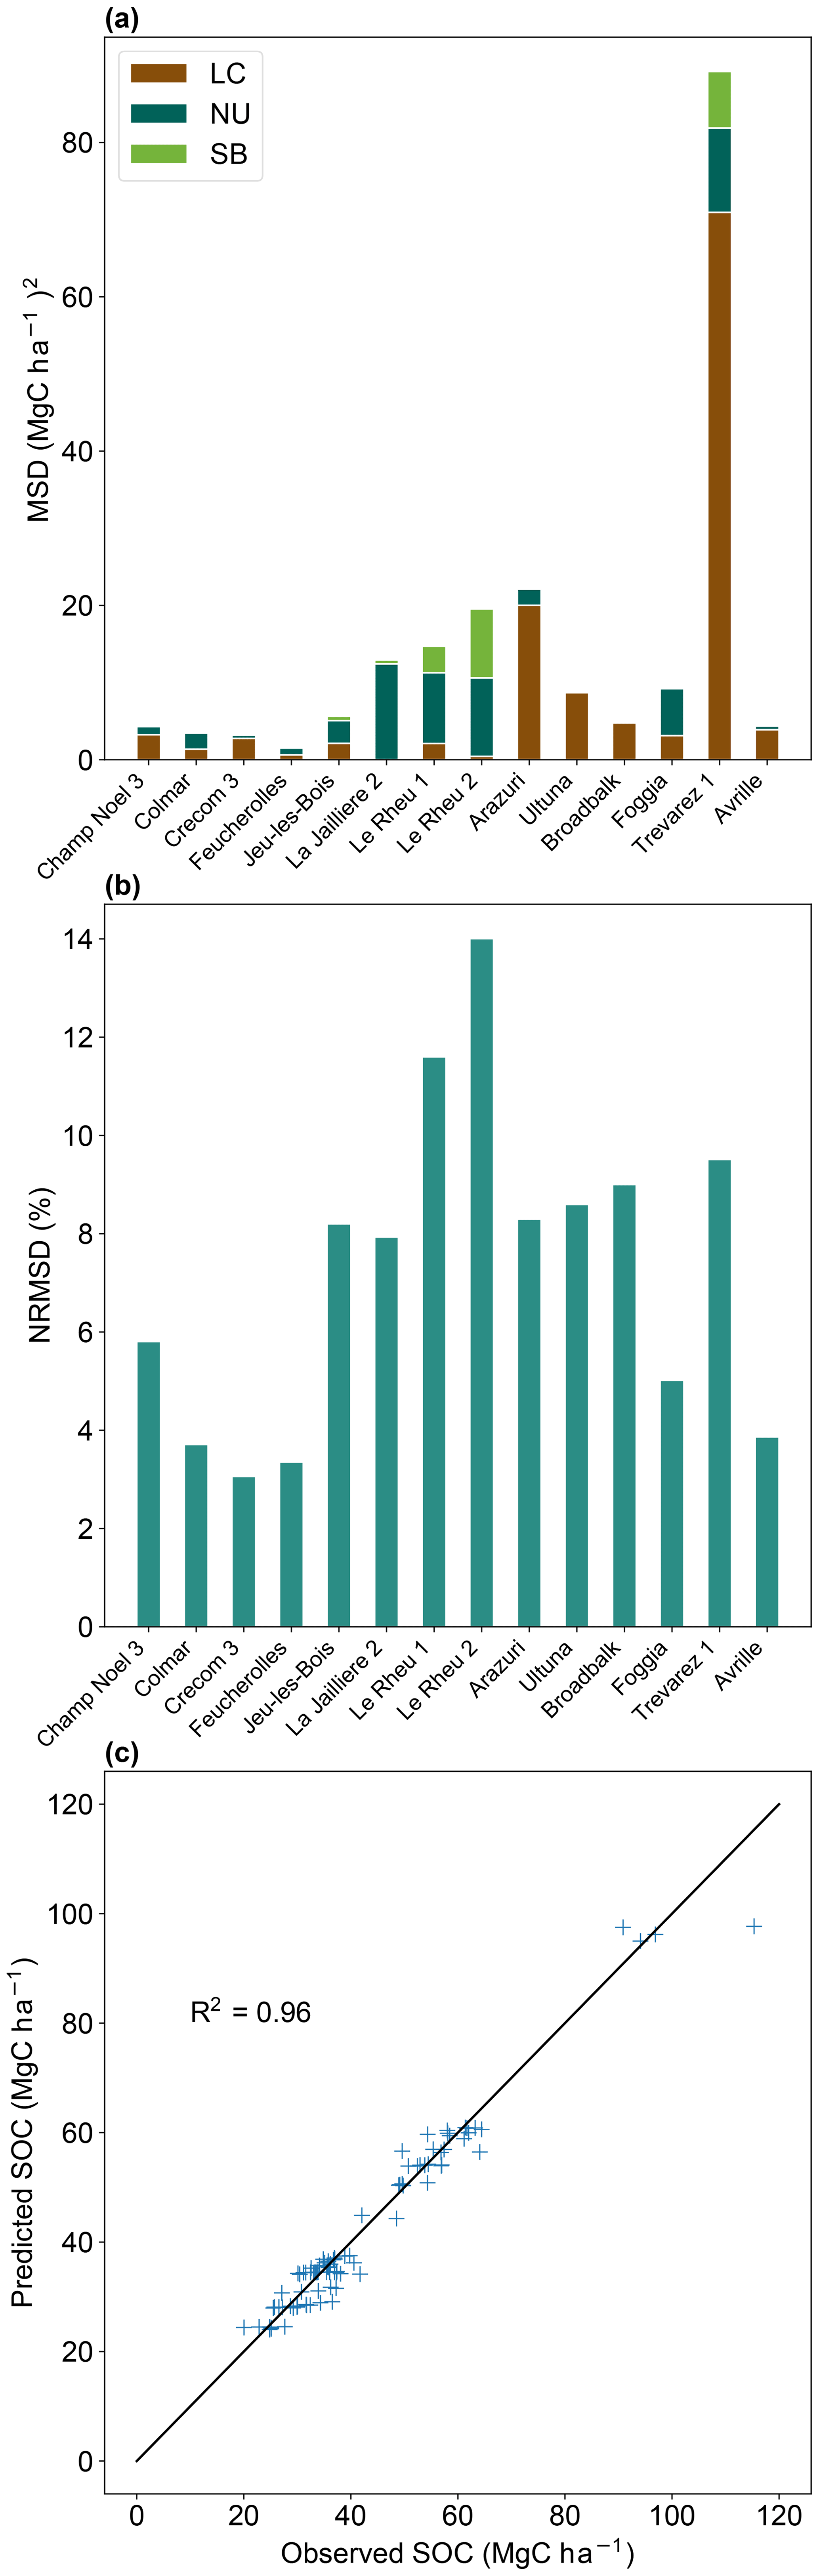
Figure 4(a) Decomposed mean squared deviation (Mg C ha−1)2 in control plots for all sites. LC: lack of correlation; NU: non-unity slope; SB: squared bias. (b) Normalized root squared deviation (%) in control plots for all sites. (c) Fit of predicted vs. observed SOC stocks (Mg C ha−1) to control plots for all sites (R2 = 0.96).
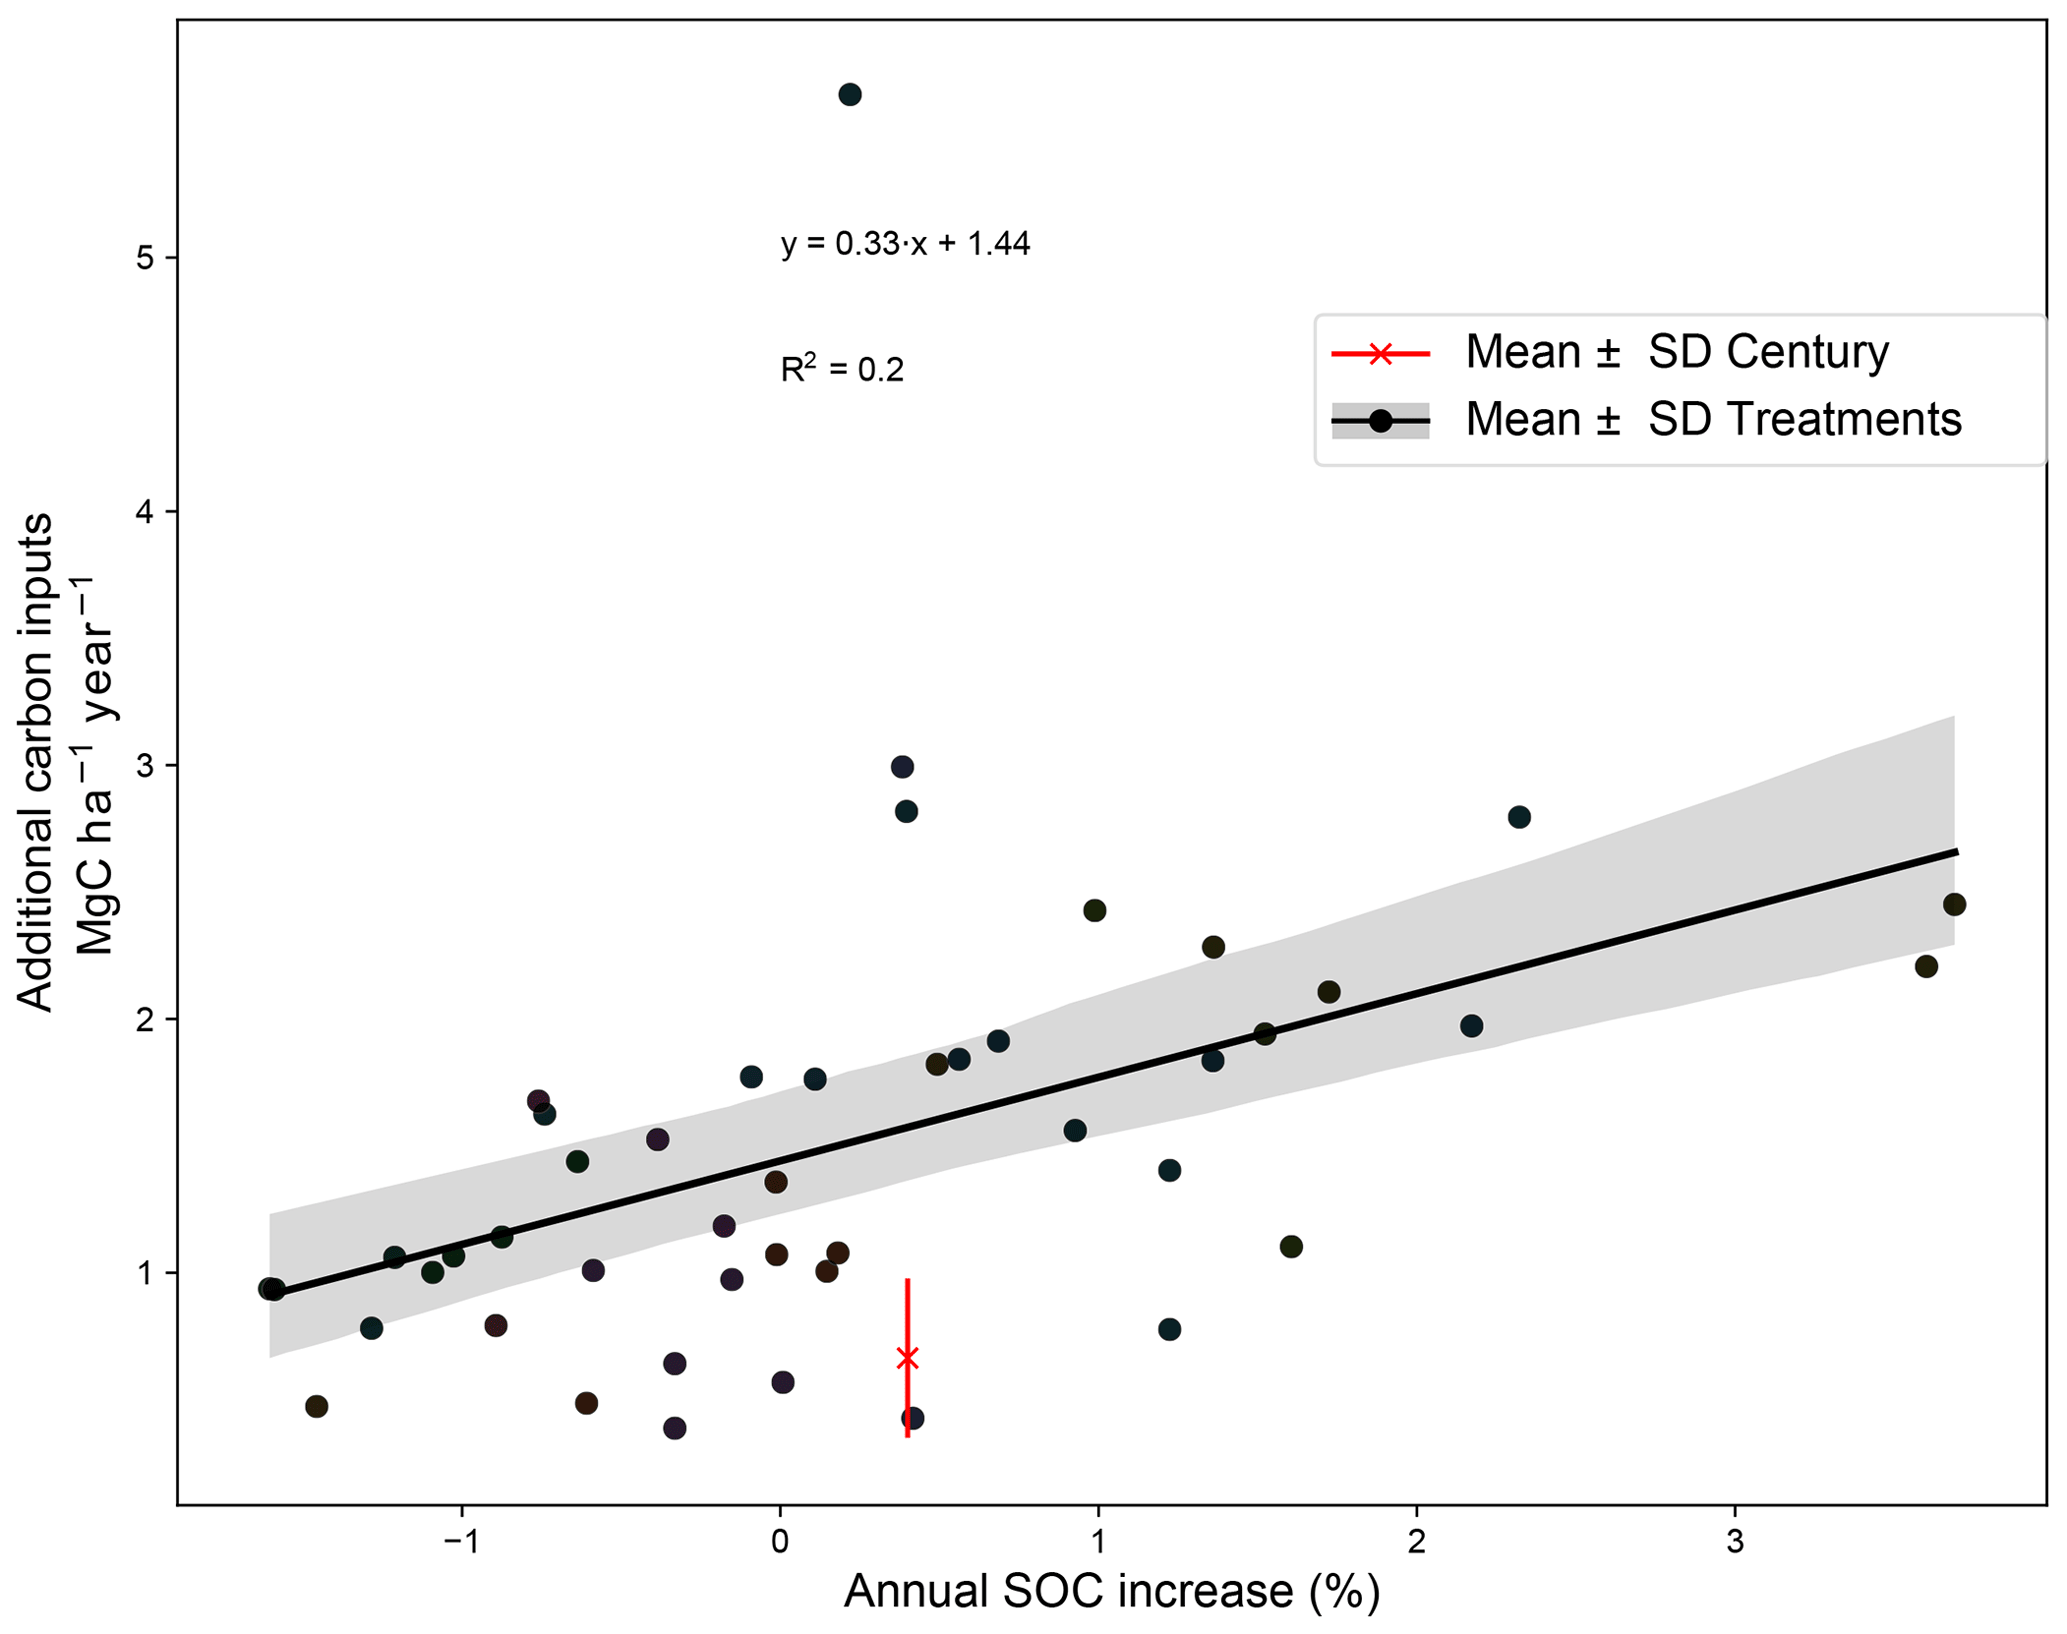
Figure 5Correlation between additional carbon inputs (Mg C ha−1 per year) and annual SOC stock increase (%) in the carbon input treatments and mean ± standard deviation of the additional carbon inputs to reach the 0.4 % target in Century.
3.1 Fit of calibrated model to control SOC values
Modeled and measured SOC stocks in the control plot were compared to evaluate the capability of the calibrated version of Century to reproduce the dynamics of SOC stocks at the selected sites (Fig. 4c). As shown in Fig. 4b, the NRMSD of the control plot SOC stocks is lower than 15 % for all the treatments, indicating that overall model simulations fitted the observed SOC stocks well (observed SOC stock variance was 16.3 % on average in the control plots). The correlation coefficient between modeled and observed SOC stocks in the control plots was 0.96 (Fig. 4c). Figure 4a provides the values of the three components of the MSD indicator for each site. It can be noticed that the LC and NU components are the highest contributors to MSD. This means that the major sources of error are the representation of the data shape and magnitude of fluctuation among the measurements. The highest NRMSD can be found at Le Rheu 1 and Le Rheu 2 (around 12 % and 14 %, respectively). At these sites the model seems to better capture the shape of the data (low LC compared to the other sites), but it misses the representation of mean SOC stock (high SB) and data scattering (high NU) of the experimental profiles. We tested the capability of Century to reproduce SOC stock increase in the additional C input treatments (Fig. 5). Figure 5 shows the correlation between additional C inputs and SOC stock increase in the C input treatments (R2 = 0.23). In the same graph, we can appreciate additional C inputs simulated by Century to reach the 4p1000 target being 0.66 ± 0.23 (mean ± standard deviation from the mean). This shows that Century generally overestimates the effect of additional C inputs on SOC stock increase. However, the effect of additional C inputs on observed SOC stock increase varies largely across different treatments.
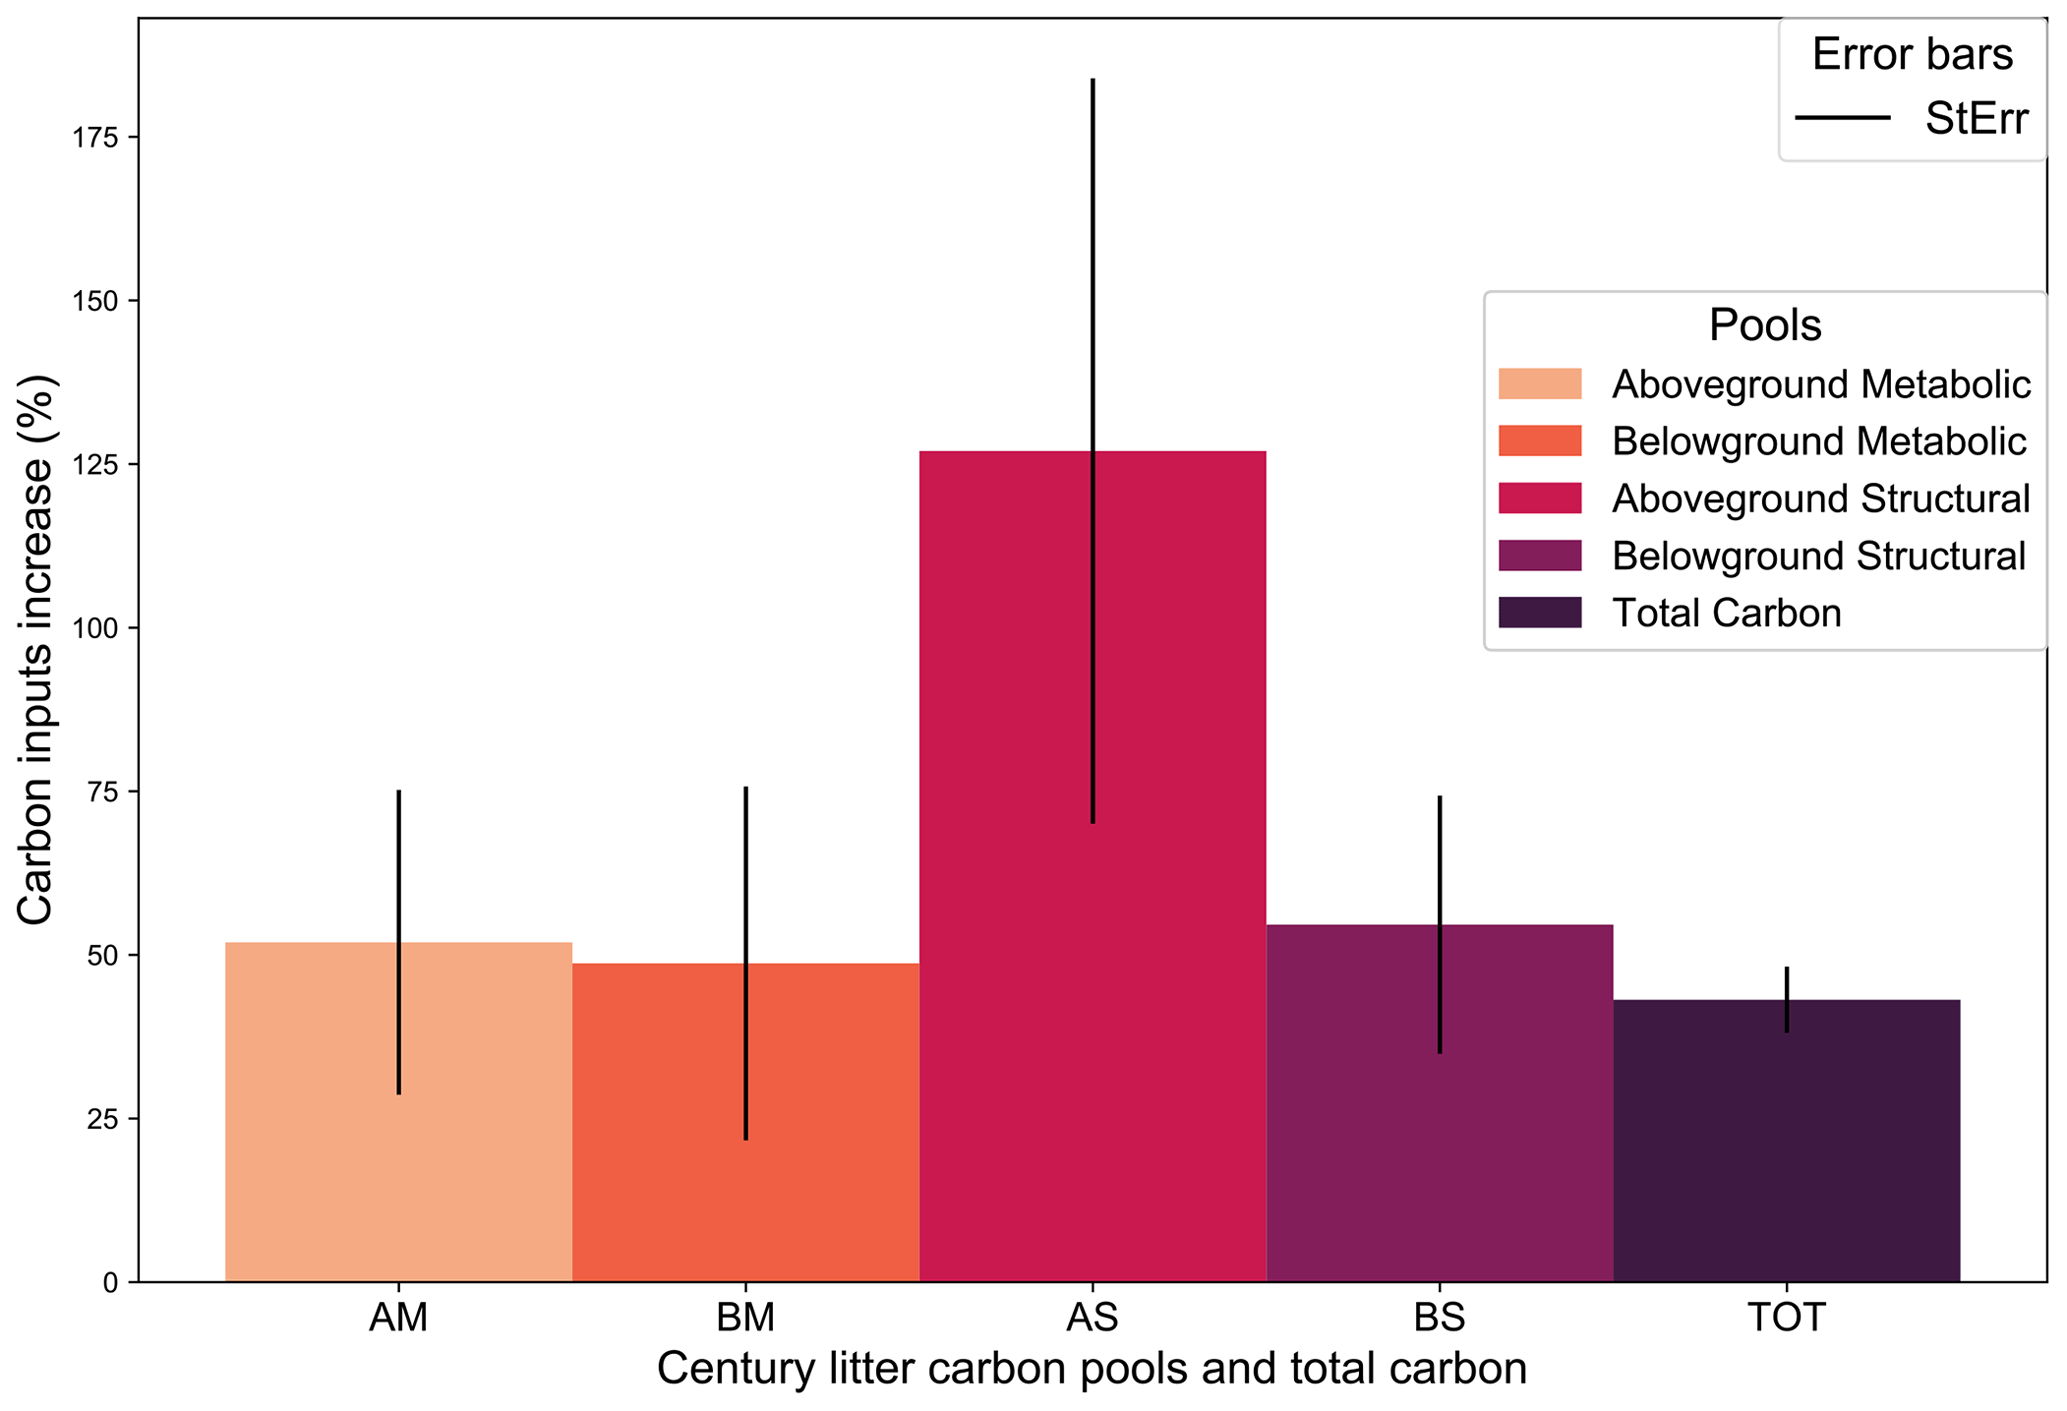
Figure 6Site average percentage change of carbon inputs needed to reach the 4p1000 (TOT), separated into the four litter input pools. AM: aboveground metabolic; BM: belowground metabolic; AS: aboveground structural; BS: belowground structural; TOT: total litter inputs. Error bars indicate the standard error. N.B: total change of carbon inputs (TOT) was calculated as the percentage change between the total amount of carbon inputs before and after the 4p1000 optimization, averaged across all sites.
3.2 Estimates of additional carbon inputs and SOC changes
3.2.1 Virtual C inputs to reach the 4p1000
Figure 6 represents the average percentage change of C inputs required to reach the 4 ‰ annual increase in SOC stocks, among all the sites. The increase in C inputs is given for each litter pool. On average, a 43.15 ± 5.05 % (mean ± SE across sites) increase in total annual C inputs compared to the current situation in the control plot is required to meet the 4p1000 target. In terms of absolute values, this represents an additional 0.66 ± 0.23 Mg C ha−1 inputs per year, i.e., 2.35 ± 0.21 Mg C ha−1 total inputs per year (equivalent to approximately 4.05 ± 0.36 ). What stands out in the graph is that, on average among the studied sites, the AG structural litter pool should be more than doubled, while the other pools need only to increase by about half of their initial value. In terms of absolute values, the structural AG biomass (which was initially 0.29 on average in the control treatments) would need an additional 0.18 to reach the 4p1000, the metabolic AG (initially 0.70 on average) needs an additional 0.14 and structural and metabolic BG biomass (initially 0.65 and 0.52 ) require an additional C input corresponding to 0.21 and 0.13 , respectively.
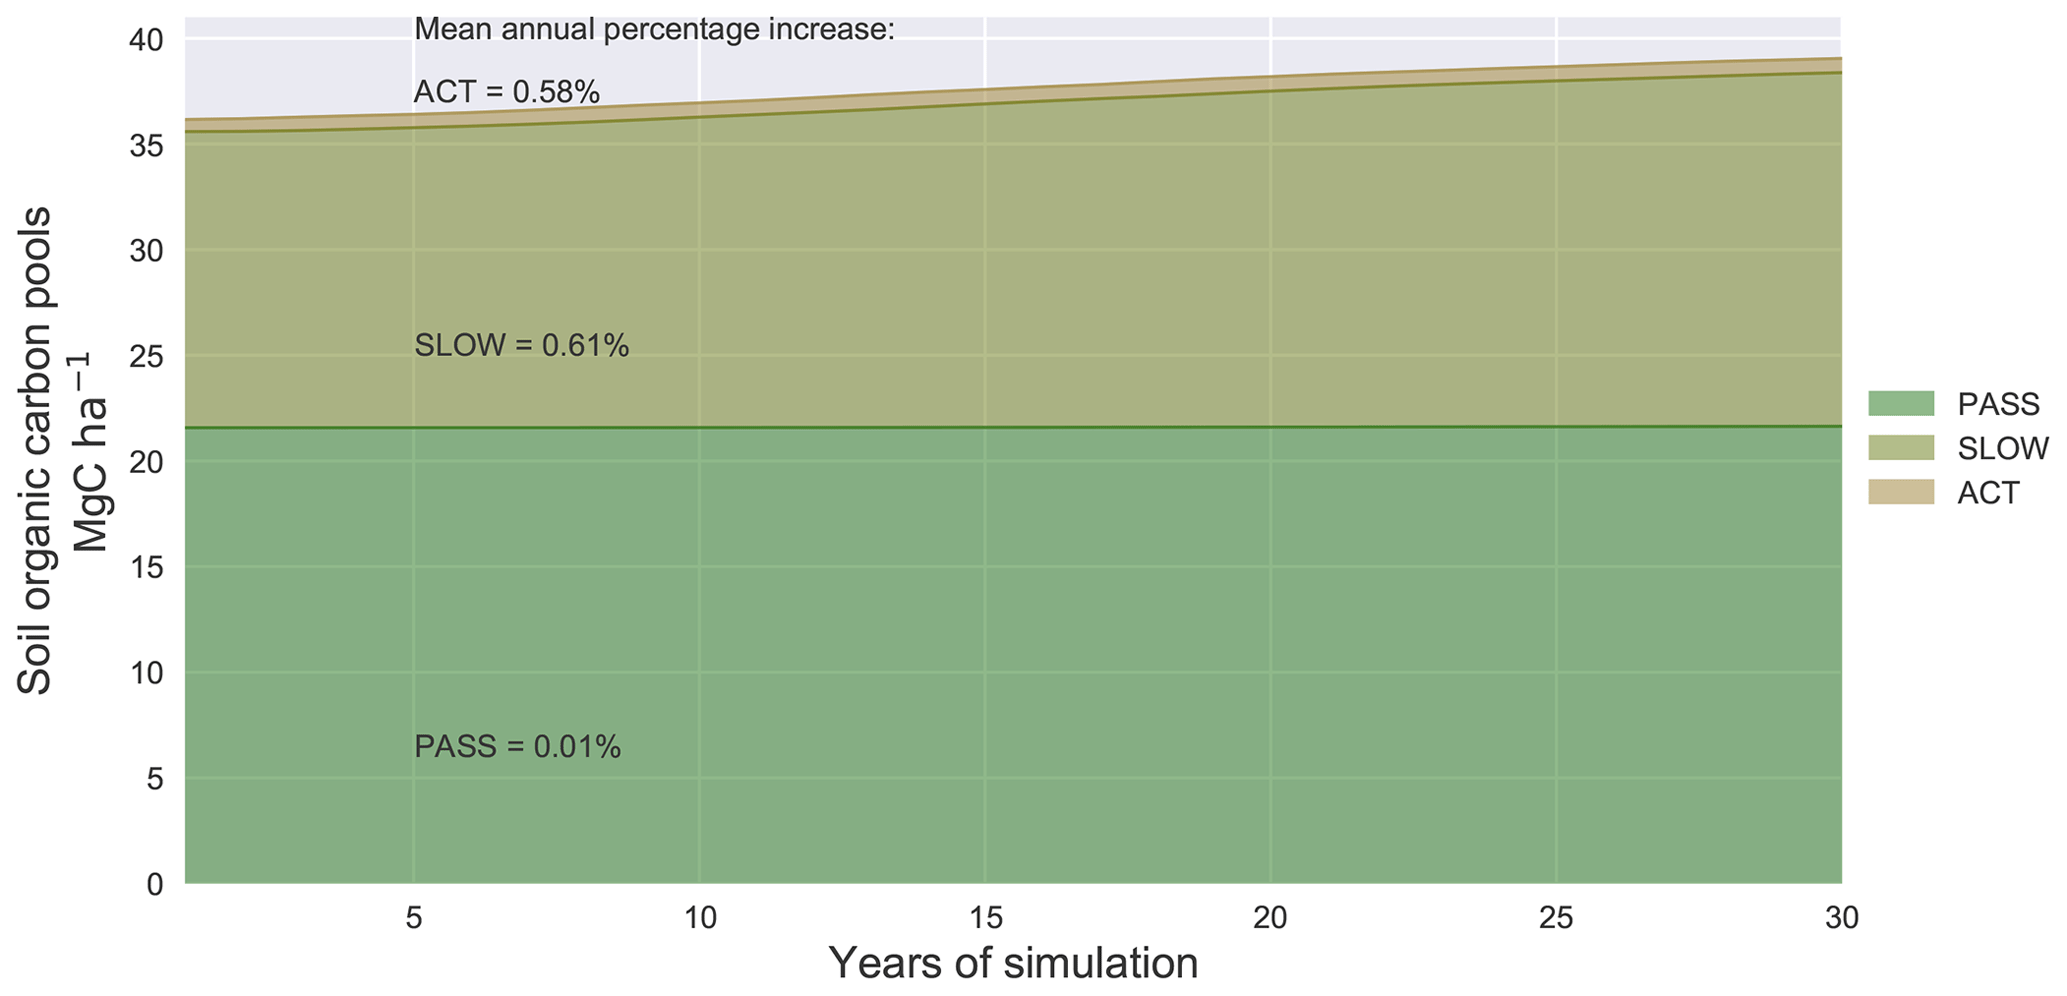
Figure 7Sites average soil organic carbon pools (ACT: active; SLOW: slow; PASS: passive) evolution (Mg C ha−1) over the 30 years of simulation to reach the 4p1000 target. In the graph the mean percentage increase is given for each SOC pool.
Analysis of the SOC pool evolution in the runs with optimized C inputs to match the 4p1000 increase rate indicates that the active and slow pools increased by 0.58 % yr−1 and 0.61 % yr−1, respectively, while the passive pool increased annually by 0.01 % (Fig. 7). In absolute values, the slow compartment contributed the most to the increase in SOC during the 30-year runs, as it increased by 2.7 Mg C ha−1 on average among the sites (against an increase of 0.1 and 0.06 Mg C ha−1 in the active and passive compartments, respectively). This corresponds to a storage efficiency for the 30 years of simulation of approximately 13.7 % in the slow pool, compared to a storage efficiency of 0.5 % and 0.34 % in the active and in the passive pools, respectively.
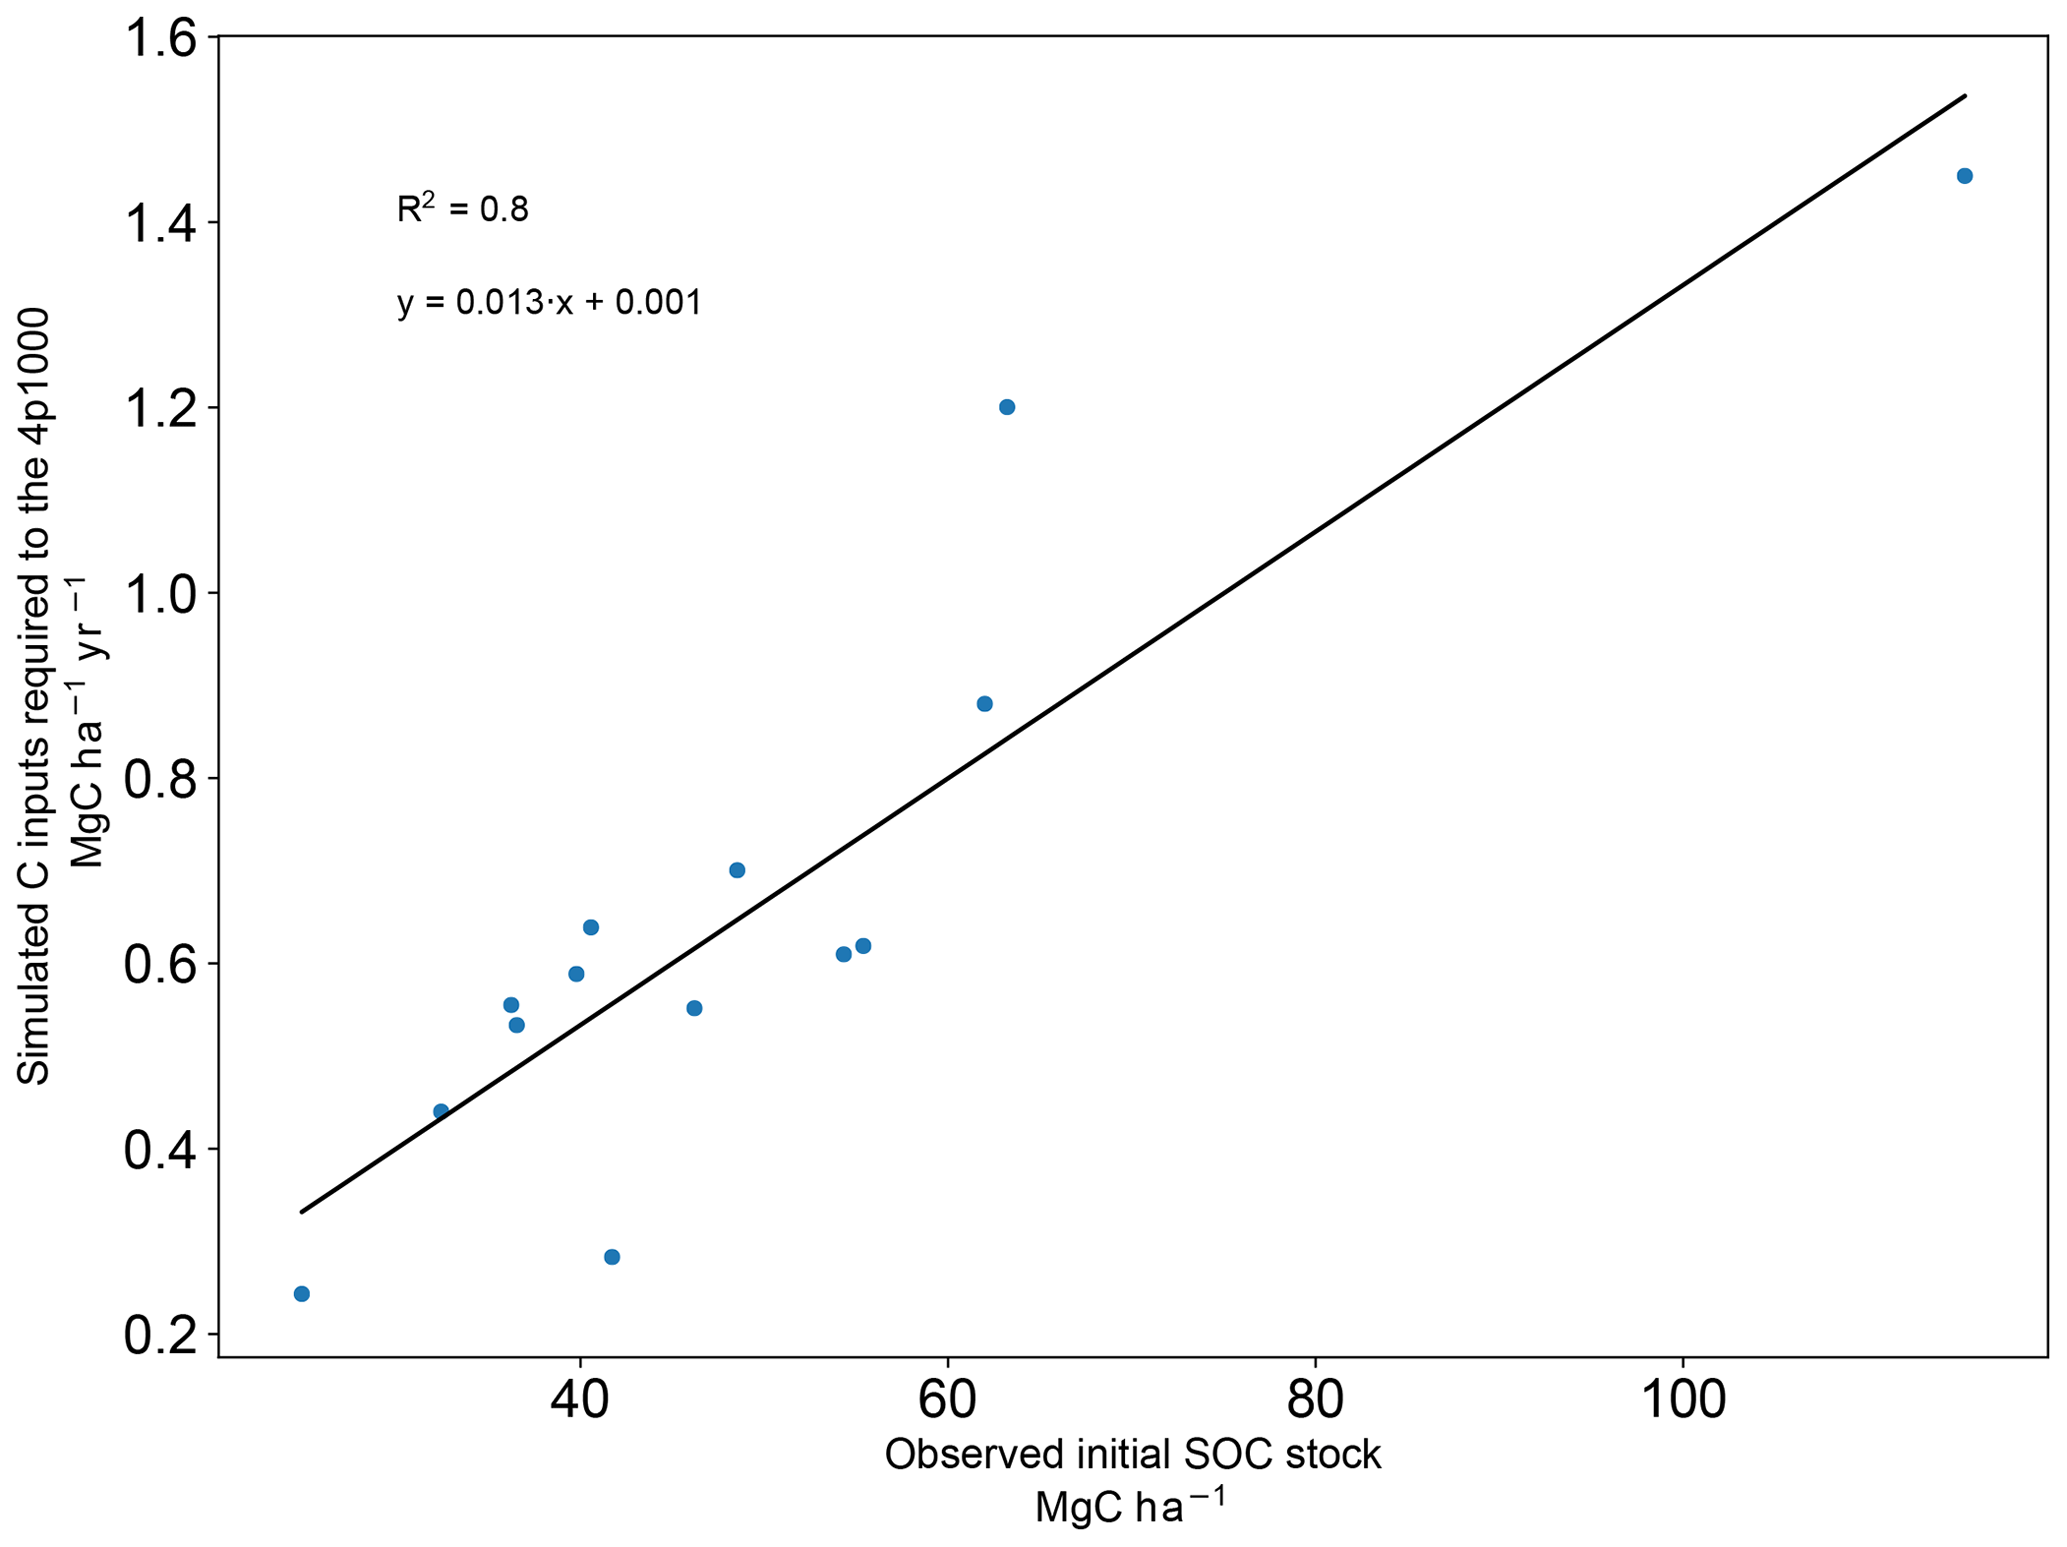
Figure 8Correlation between initial observed SOC stocks (Mg C ha−1) and modeled carbon inputs needed to reach the 4p1000 target (). The correlation coefficient (R2) is 0.80 and the regression line is y = .
We found a high linear correlation (R2 = 0.80) between observed initial SOC stocks and optimized C inputs (Fig. 8). It is logical and expected that for low initial SOC stocks in steady state, a small increase in C inputs is sufficient to reach the 4p1000 target. Conversely, when SOC is high at the beginning of the experiment (e.g., Trévarez) much higher C inputs must be employed since our target increase rate is a relative target. The regression line that emerges from the cross-site relationship can be written as
where I4p1000 represents the simulated C inputs needed to reach the 4p1000 target () and (Mg C ha−1) is the observed initial SOC stock.
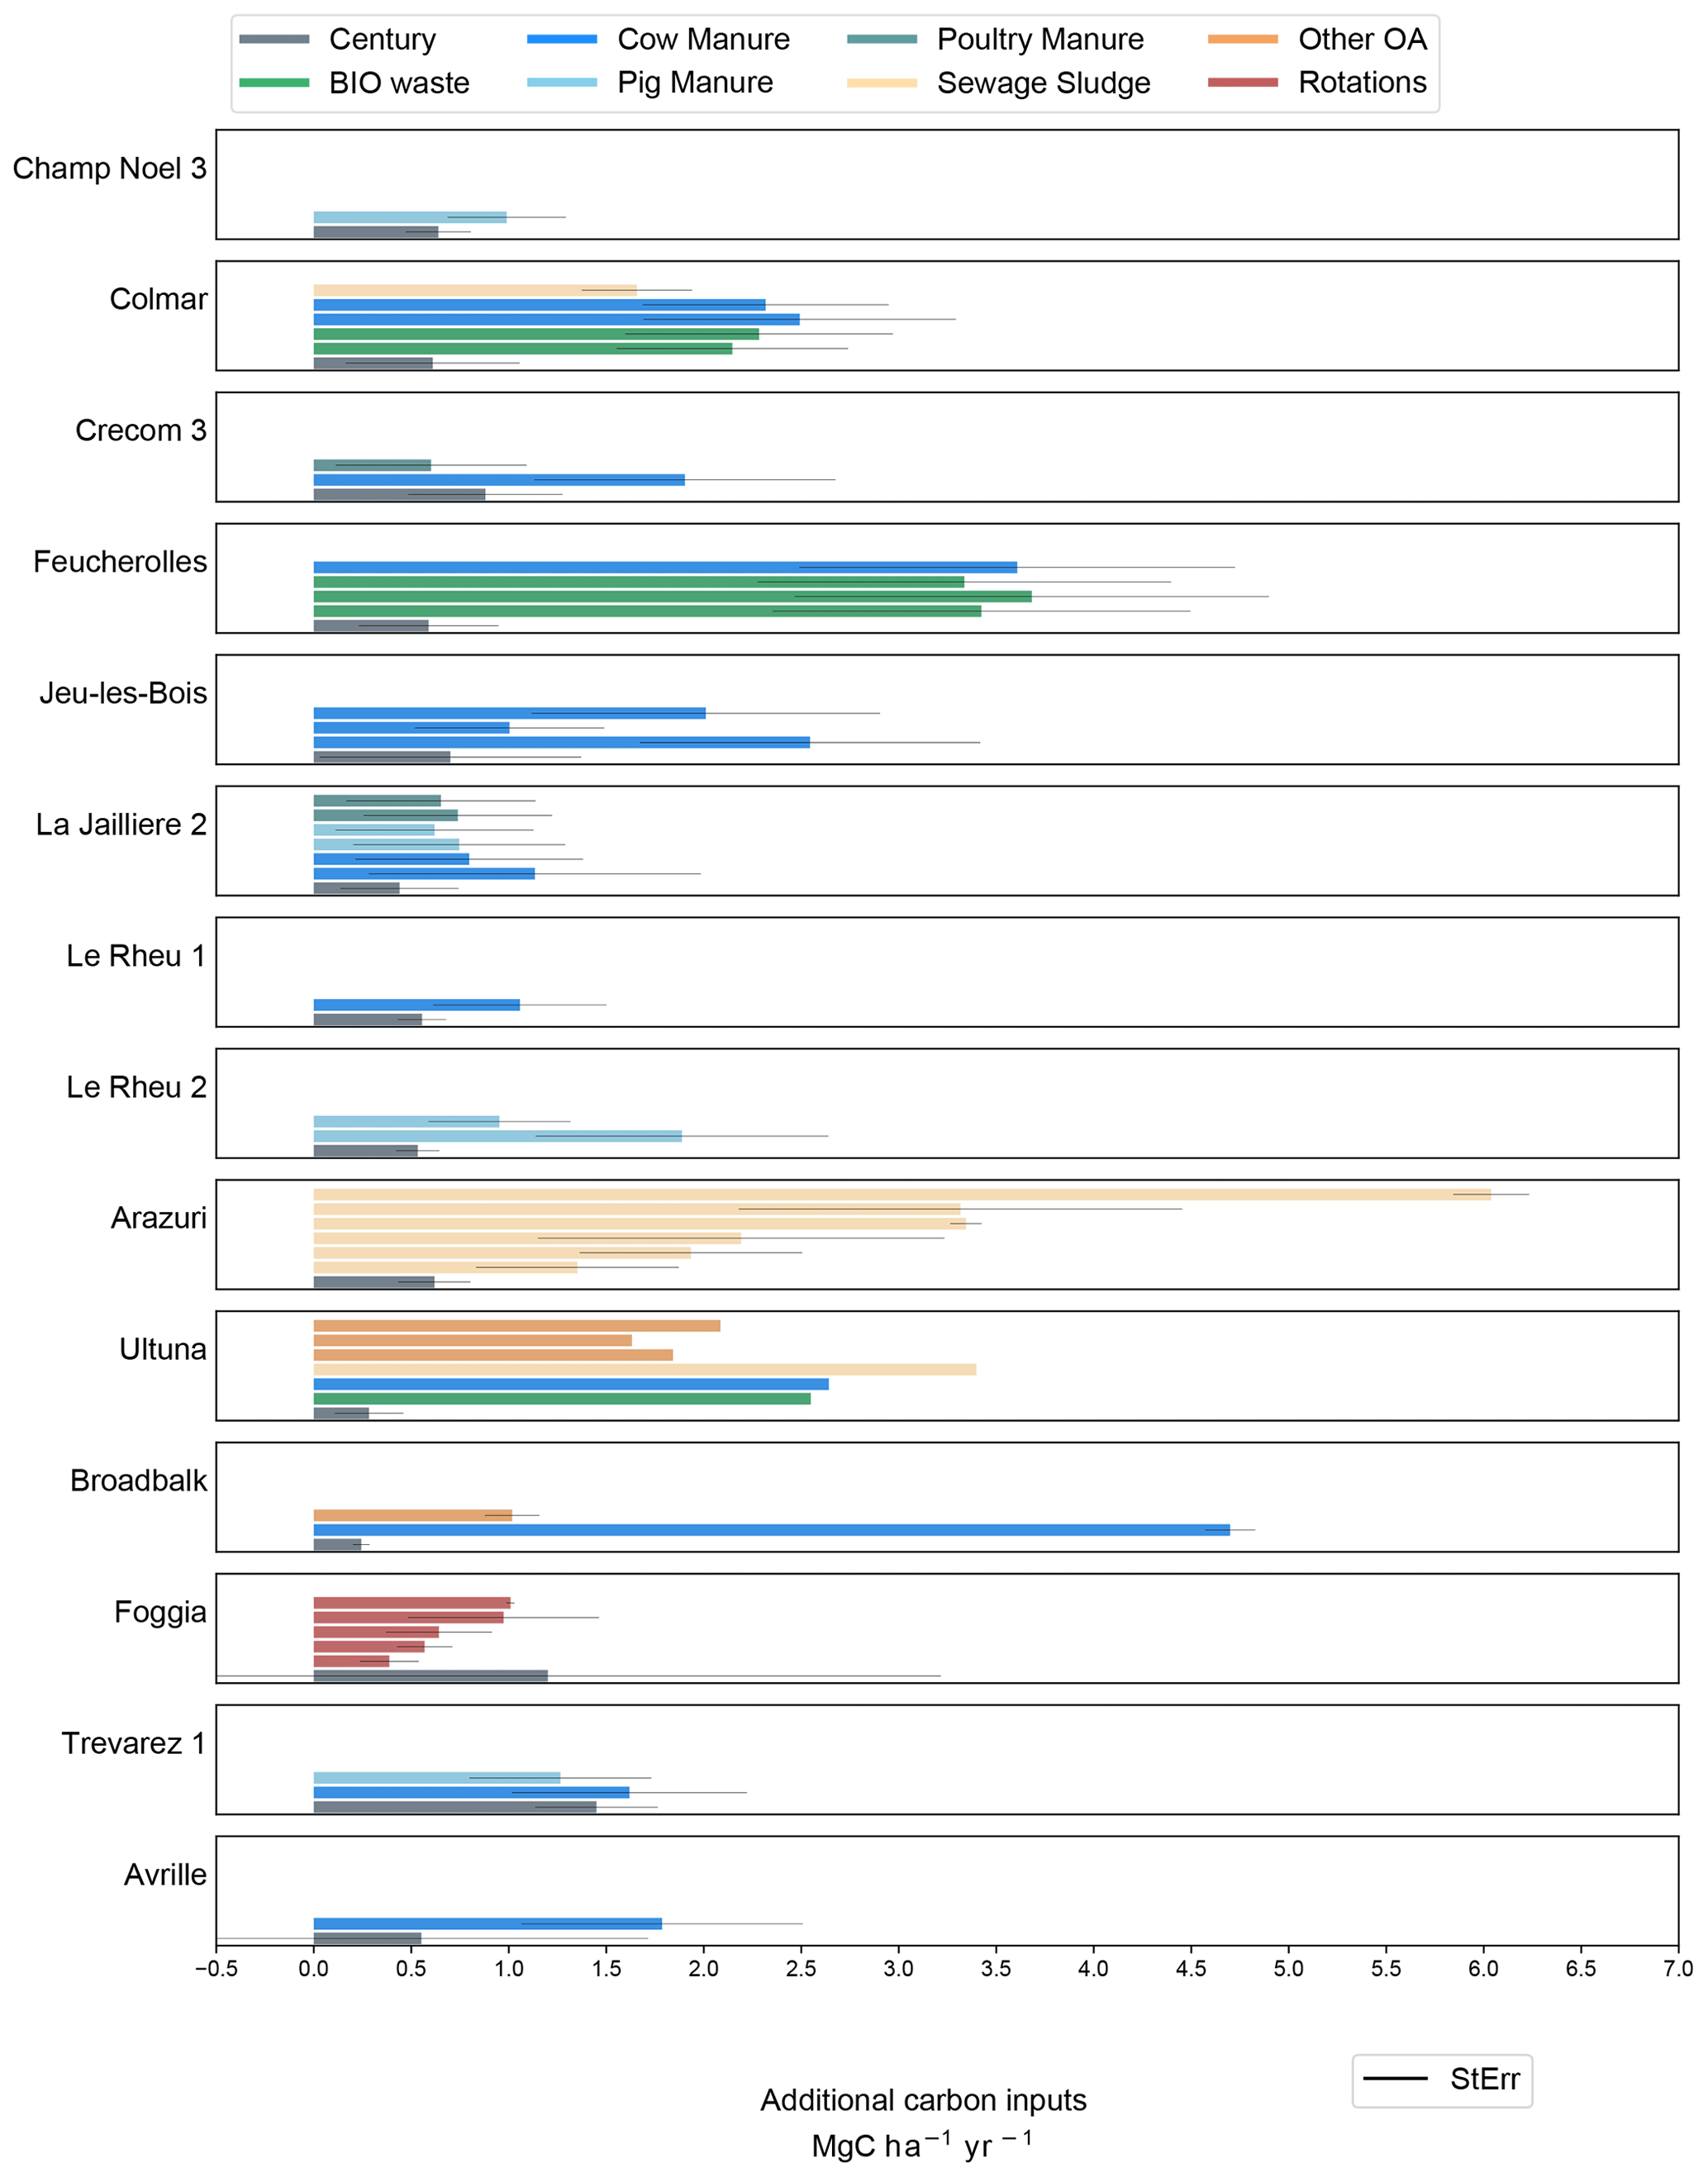
Figure 9Additional modeled carbon inputs () to reach the 4p1000 (grey bars) compared to additional carbon input treatments (colored bars) at each experimental site. Additional carbon inputs for field trials are calculated as the sum of organic fertilizers and the delta carbon inputs from crop yields (compared to the control plot). Additional carbon treatments are separated into different categories: BIO waste: biowaste compost, green manure, green manure and sewage sludge, and household waste; Cow manure: cow manure and farmyard manure (in Broadbalk and Ultuna), pig manure, poultry manure, sewage sludge; Rotations: different crop rotations, other organic amendments (OA): straw, sawdust, and peat (in Ultuna) and castor meal (in Broadbalk). The error bars shown are the standard errors computed with the Monte Carlo method.
3.2.2 Virtual vs. actual C inputs in the experimental carbon treatments
In Fig. 9 we compare the C inputs required to reach the 4p1000 target to the actual inputs used across the 46 treatments of additional C. The additional C () shown in the graph for all experimental treatments refers to exogenous organic amendments, plus additional C due to increased crop yields, relative to the control plot. The most striking result emerging from the data is that modeled additional C inputs are systematically lower or similar to at least one treatment of additional C at all sites, except for Foggia. In the Foggia experiment, different crop rotations were compared, and no additional EOM was incorporated to the soil. Here, none of the rotations had sufficient additional C content (compared to the control wheat-only treatment) to meet the required C input level predicted by Century for a 4p1000 increase rate. Overall, 86.91 % of the experimental treatments used higher amounts of C inputs compared to the modeled need of additional C inputs at the same site. For the other treatments, the difference between simulated and observed additional C input was not significant. In the experimental treatments 1.52 was applied on average, and SOC stocks were found to be increasing by 0.25 % yr−1 relative to initial stocks. Modeled additional C input to reach a 0.4 % increase was 0.66 , on average among the sites.
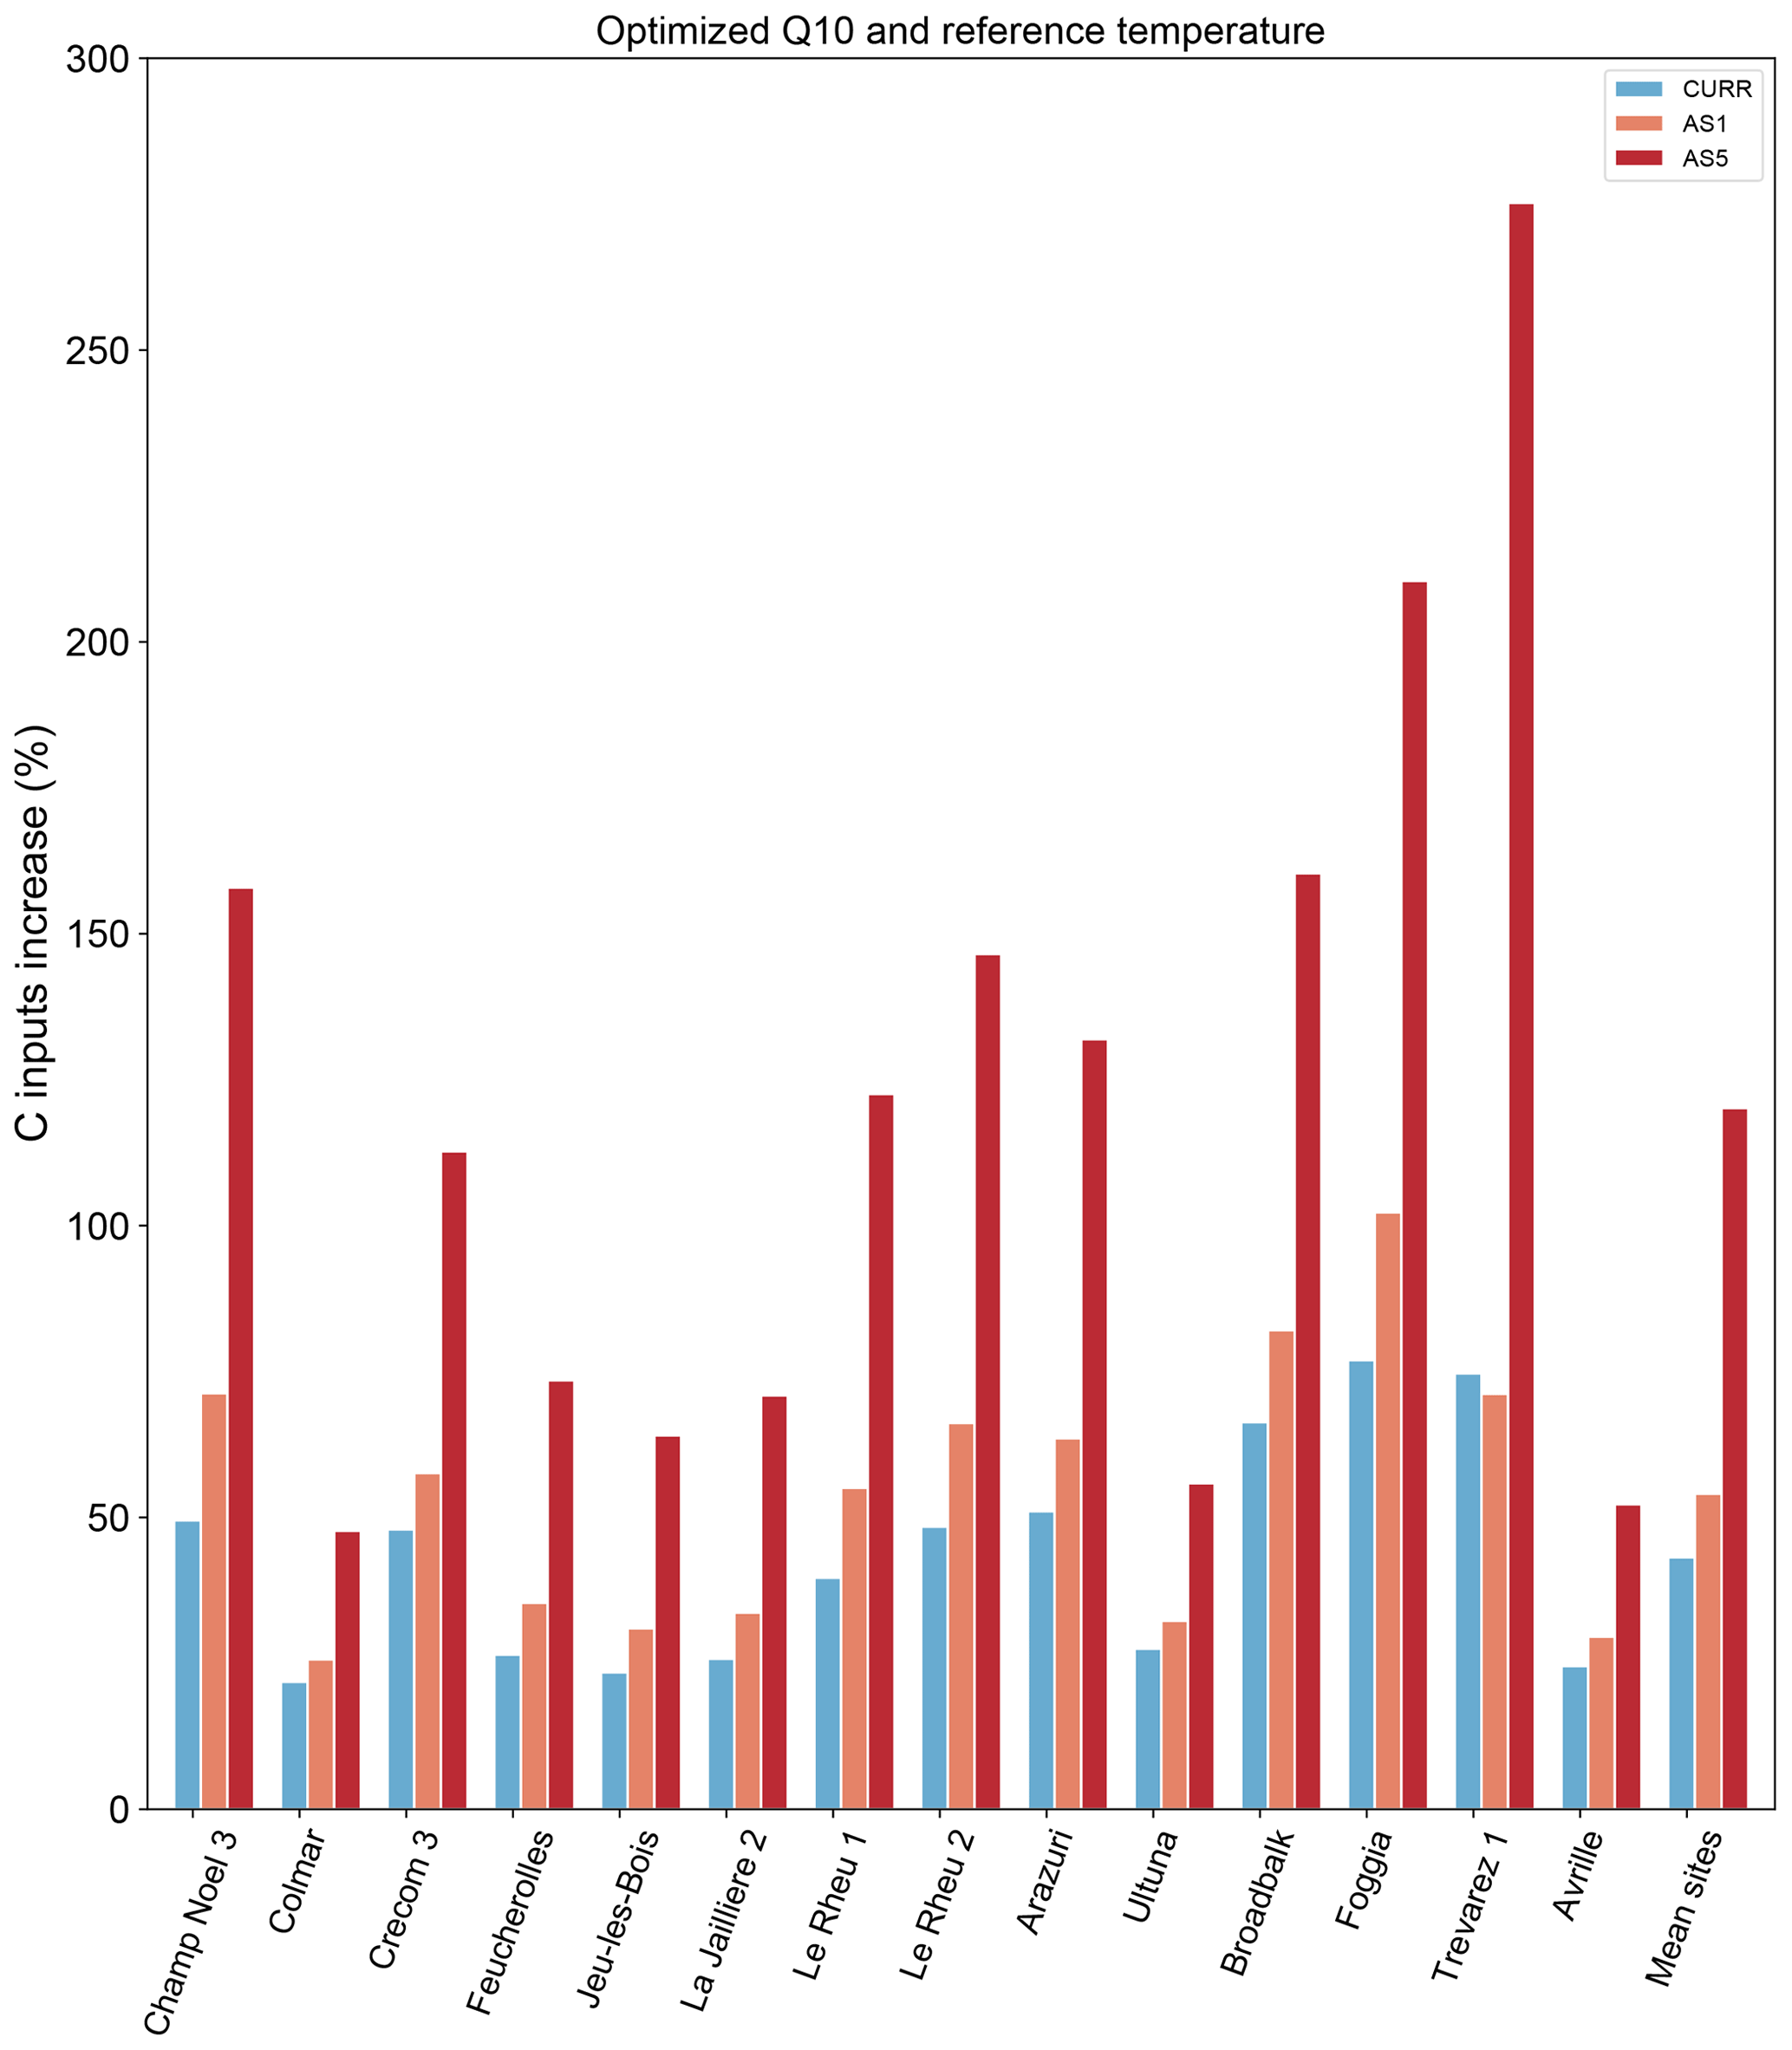
Figure 10Temperature sensitivity analysis of carbon input increase (%) to reach the 4p1000 objective. CURR: business-as-usual simulation; AS1: RCP2.6 scenario of +1 ∘C temperature increase; AS5: RCP8.5 scenario of +5 ∘C temperature change.
3.3 Carbon input requirements with temperature increase
The temperature sensitivity analysis of the Century model for the 4p1000 target framework is plotted in Fig. 10. The required amount of C inputs to reach the 4p1000 target is likely to increase with increasing temperature scenarios. In particular, C inputs will have to increase on average by 54 % in the AS1 scenario of +1 ∘C and 120 % in the AS5 scenario of +5 ∘C temperature change, relative to current C inputs in the control plots. This represents an additional C input increase of 11 % and 77 %, respectively, compared to the business-as-usual scenario with current temperature setup (CURR). What can be clearly seen in the graph is the increased amount of C inputs required in Trévarez, where C inputs should more than quadruple to reach the 4p1000 objective.
4.1 Reliability of the Century model
The Century model has been widely used to simulate SOC stock dynamics in arable cropping systems (Bortolon et al., 2011; Cong et al., 2014; Kelly et al., 1997; Xu et al., 2011). Optimizing the metabolic : structural ratio in the reference plots allowed us to initialize the C input compartments, since no measurement of the L:N ratio was available. This allowed us to (1) take into account the average C quality of the litter pools in the different crop rotations and (2) correctly estimate the initial values of SOC stocks at the majority of the sites. On the other hand, this could have influenced the predicted redistribution of C in the additional C inputs required to reach the 4p1000 (Fig. 6). We suggest that taking into account the historical site-specific land use could help initialize SOC stocks without requiring any assumption regarding the M:S ratio (e.g., with historically based equilibrium scenarios as in Lugato et al., 2014). To further improve SOC stock simulations, we optimized the Q10 and reference temperature parameters on the control plots to account for the different pedoclimatic conditions of the experimental sites and enhance model predictions of SOC stock dynamics (Craine et al., 2010; Lefèvre et al., 2014; Meyer et al., 2018; Wang et al., 2010). Although the dispersion of SOC stocks over time is not perfectly captured in the majority of the control plots (see the high LC component of the MSD in Fig. 4), the simulations of SOC dynamics were improved by the optimization of temperature-related parameters, and the NRMSD was found to be lower than 15 % at all sites. Figure C2 shows that the optimization of temperature-sensitive parameters did not significantly affect the required C input estimation for the current temperature scenario. This means that, although parameter optimization improved the simulation of SOC stocks in the control plots, the final results are not affected by it. The capability of Century to simulate SOC stocks in the simulations of additional C treatments might be a major shortcoming of modeling results. In fact, although SOC stocks were found to be increasing on average in the additional C treatments (0.25 % yr−1 with 1.52 Mg C ha−1 yearly additional C inputs), this increase rate is lower than the 0.4 % increase in SOC stocks predicted by Century with lower amounts of virtual C inputs (0.66 ). This is pointed out in Fig. 5, where we can see that predicted additional C inputs to reach the 4 ‰ are lower than the correlation line between additional C inputs and SOC stock increase in field treatments. The overestimation of the C input effect on SOC stocks in Century might be related to the assumption that SOC stocks are in equilibrium with C inputs at the onset of the experiment and to the high sensitivity of the model to C inputs.
4.2 Increasing annual SOC stocks by 4p1000
4.2.1 Modeled carbon inputs to reach the 4p1000
Century simulations estimated that annual C inputs should increase by 43 ± 5 % (SE) on average to reach the 4p1000 target at the selected experimental sites, under the condition that the additional C inputs are equally distributed among the surface and belowground, in order to maintain the same AG : BG ratio as at the beginning of the experiment. Martin et al. (2021) found similar values of required additional C inputs to reach a 4p1000 target in French croplands (i.e., 42 %, that is 0.88 ). This is higher than the values found by Chenu et al. (2019) using default RothC 26.3 parameters, who estimated a relative increase in C inputs in temperate sandy soils by 24 % and in temperate clayey soils by 29 %. Riggers et al. (2021) found that in 2095 a minimum increase in C inputs by 45 % will be required to maintain SOC stocks of German croplands at the level of 2014. However, they found that to increase SOC stocks by 4 ‰ yr−1, a much higher effort will be required. That is, C inputs in 2095 will have to increase by 213 % relative to current levels.
In our study, not only the quantity of C but also the quality will need to change according to Century predictions. In fact, the predicted AG structural litter change was 3-fold higher than all other pools on average, representing an additional 0.18 Mg C ha−1 each year. A way for the farmer to increase the structural fraction of the C inputs is to compost the organic amendments that will be spread on the soil surface. Increasing EOM in large quantities may not be possible everywhere. First of all, the amount of organic fertilizers is limited at the regional scale. If farmers source additional EOMs elsewhere, only those EOMs that otherwise would be mineralized (e.g., burned) and not applied to land account as sequestration. Second, farmers may be prevented from applying high amounts of EOM because of the risk of nitrate and phosphate pollution (Li et al., 2017; Piovesan et al., 2009). Moreover, producing additional animal manure implies larger GHG emissions through animal digestion and manure decomposition. Consequently, even if more manure is returned to the soil, it will not necessarily result in climate change mitigation.
4.2.2 Stability of the additional carbon stored
Another important aspect to take into consideration is the stability of the additional C. In fact, the duration and persistence of C in the soil might be very different depending on whether or not the proportion of stable C is important. In the Century model, this translates into questioning whether the fractions of the long-turnover-rate pools (the slow and passive SOC pools) have increased. In our simulations, a general pattern can be detected (Fig. 6) where both passive and slow pools increased, but at very different rates (0.1 ‰ and 6.1 ‰ yr−1, respectively). The active pool increased by 5.8 ‰ annually, with benefits for soil fertility and hence food security. The additional C is mainly stored in the slow pool (2.7 Mg C ha−1 in 30 years of simulations), meaning that it will be stored in the soil for around 20 to 30 years. The increase in C inputs must be sustained to increase SOC stocks at the desired rate, until a new equilibrium will be reached. To further increase SOC stocks after the new equilibrium, new strategies of additional C could be implemented later on. For instance, this could be achieved through the implementation of complementary management options to those considered in the long-term experiments described here, such as residue management, cover crops, conservation agriculture and agroforestry systems (Chenu et al., 2019; Lal, 1997; Smith et al., 1997b).
4.2.3 Simulated carbon inputs and experimental carbon addition treatments
Different types of organic C treatments were considered in this study and compared to Century simulations of C inputs required to reach the 4p1000. At all experimental sites with additional EOM inputs, at least one treatment employed higher amounts of C inputs compared to the simulated C inputs required for a 4 ‰ annual target. In Foggia, C inputs from different crop rotations were studied, but none employed sufficient amounts of additional C to reach the 4p1000, as predicted by Century. Model results in Foggia had a high standard error, mainly due to the fact that the variability of crop yields for this site was not available. Thus, for this site, we calculated model uncertainty using the average relative variability across the whole dataset, which could have increased the uncertainty of model outputs.
It is important to note that the amount of C inputs simulated by Century was constrained to have the same AG : BG ratio as at the beginning of the experiment. This means that the additional C inputs should be distributed equally on soil surface and belowground, not to change the initial allocation of C in the litter pools. Since all field treatments were performed under conventional tillage, the comparison between modeled and observed additional C inputs under this constraint holds well.
The annual SOC stock variation (0.25 %) estimated in the experimental C treatments across the 14 sites indicates that Century might be overestimating the effect of additional C inputs on SOC stocks. In particular, only 18 out of 46 field treatments (with average additional C inputs of 1.93 ) were found to be actually increasing SOC stocks at a higher rate than 4 ‰ yr−1, relative to their initial SOC stocks. This is similar to the values found by Poulton et al. (2018), who estimated that adding similar high amounts of C inputs increased SOC stocks at an annual rate higher than 4 ‰ in 16 long-term agricultural experiments. Thus, Century seems to be over-predicting the effect of adding C inputs in the virtual simulations. The overestimation of the Century model might be due to several factors. First of all, the C inputs prescribed to model simulations were constant through time, while C inputs from plant material actually vary annually and over the years because of agronomical and climatic factors. Historical land use and management practices such as tillage were not taken into account, although they affect SOC stocks (Pellerin et al., 2019). Another factor that the model is not taking into account is N and other nutrient availability, which might affect the SOC stock dynamics. This is especially true for treatments with different frequencies of application (e.g., Arazuri), where nutrient depletion is likely to be more evident when the application is sparser. The method used to estimate C inputs (i.e., the allometric functions from Bolinder et al. (2007) in our case) also influences the simulation of SOC stocks (Clivot et al., 2019). However, estimating the increase in C inputs relative to their initial value has likely canceled out uncertainties related to the C input estimation method in our analysis.
4.2.4 Organic carbon input use in Europe
Zhang et al. (2017) estimated that the amount of N inputs from livestock manure applied to European croplands was 3.9 Tg N in 2014, for a cropland area of 127 Mha in 2015 (Goldewijk et al., 2017). Cattle manure, which represents the highest proportion of manure produced and applied to croplands, has an average C:N ratio ranging between 10 and 30 (multiple sources from Fuchs et al., 2014, and Pellerin et al., 2019). With these data, we can roughly estimate the application of C manure from livestock in European agricultural soils as ranging between 0.30 and 0.92 MgC ha−1 each year. Most of the experiments used in this study used higher amounts of C input (1.52 on average). However, the C input requirement predicted by Century, which ranged between 0.24 ± 0.02 and 1.20 ± 1.00 , plus one site with 1.45 ± 0.16 , is in line with the average use of livestock manure in Europe. In terms of C sequestration, organic fertilizers coming from animal manure are usually applied to the soil at some location; hence they cannot account for additional climate mitigation potential (Poulton et al., 2018). Rather, they are considered to be a business-as-usual situation that can unlikely be significantly expanded. However, according to the estimation of Zhang et al. (2017), there is room for improvement since the fraction of livestock manure applied to cropland in the 2010s was approximately 26 % of total livestock production in Europe. The estimates from Zhang et al. (2017) refer to livestock manure only. In our study, we also considered treatments with other types of EOM addition, such as sewage sludge and household waste. In many countries, a significant proportion of food and urban waste is currently left in disposal areas, where C is lost to the atmosphere as CO2 or methane (CH4) emissions (Bijaya et al., 2006). Pellegrini et al. (2016) reported the amounts of sewage sludge disposed in landfills in Europe (EU26) from Eurostat (2014). In 2010, this was 0.914 TgDM. Using the van Bemmelen factor (1.724) to convert OM to OC (McBratney and Minasny, 2010; Rovira et al., 2015), we estimated that the sewage sludge disposed in landfills in Europe was around 0.004 in 2010. If applied to cropland, this could potentially increase C inputs to the soil and decrease GHG emissions associated with landfilled waste. However, in some countries social acceptability of spreading EOM such as sewage sludge is very low, limiting its actual potential. In Europe, landfilled municipal waste was 0.3 Mg C ha−1 in 2019 (estimated from Eurostat (2020) considering a C content in household waste of 71 %; Larsen et al., 2013). This is higher than the amount of municipal waste currently composted in Europe (i.e., 0.22 Mg C ha−1 in 2019, according to Eurostat, 2020), showing that additional efforts to improve the reutilization of municipal waste could help to increase C inputs in agriculture. A contribution to the sequestration of C from the atmosphere could also come from changing the treatment methods which affect the quality of C in crop residue and manure, so that their turnover time decreases, e.g., through fermentation or biochar. However, a full C cycle assessment should be considered to make sure that GHG emissions associated with such treatments do not exceed additional C storage (Guenet et al., 2020). In general, improving the use efficiency of EOM to the soil by managing it differently could contribute to some extent to climate change mitigation, increase soil quality, and reduce mineral fertilizer use (Chadwick et al., 2015). In this study, we did not include other potentially beneficial management practices, such as cover crops, reduced tillage, biochar application, improved soil pH, landscape differentiation and mineral amendments. Further research should investigate whether long-term experiments with these management practices would be able to increase SOC stocks by 4p1000, following Century predictions.
4.2.5 Reaching a 4p1000 target: only a matter of initial SOC stocks?
As we expected, the estimated amount of C inputs to reach the 4p1000 target was linearly correlated to the initial observed level of SOC stocks (Fig. 7). This result means that site differences in Q10 and decomposition rates are less influential than initial SOC in determining the optimal input increase to reach the 4 ‰ yr−1 target. The linearity between C inputs and initial SOC stocks is primarily due to the linear structure of the Century model. In fact, if we consider the stationary solution for which Eq. (2) is equal to 0, SOC depends linearly on the carbon inputs. Therefore, the opposite is also true (i.e., carbon inputs are linearly dependent on the initial amount of SOC stocks). Moreover, the 4p1000 target itself is defined as the increase in SOC by 0.4 % yr−1, relative to its initial value (Minasny et al., 2017). Hence, it implies a proportional contribution that depends on the initial SOC stocks. Wiesmeier et al. (2016) also observed a linear relationship between SOC increase and C inputs. This linear relationship means that soils with high SOC stocks will have to increase their carbon stocks more in absolute terms to meet this quantitative target. On the other hand, smaller amounts of C will have to be employed at sites with low levels of SOC stocks, to reach a 4p1000 target. However, increasing C inputs where SOC stocks are low might require substantial changes in the agricultural systems, and such a quantity of additional OM might not be available at a large scale. A counterpoint is also that the largest contribution of C sequestration will come from soils with medium or high SOC stocks (i.e., higher than 50 Mg C ha−1, such as grasslands and forests). In these soils, the required additional C inputs will have to be higher according to Century, raising concern about a compensation for CO2 emissions through improved SOC stocks at a global scale. This result depends on the quality of the simulated carbon inputs (i.e., the predicted metabolic : structural ratio) and does not take into account any notion of soil saturation. Before applying this trend to calculate the required C inputs from current SOC stocks, we should extend the database to cover different pedoclimatic regions and different ecosystems of the world. Moreover, inaccuracies in simulations outcomes, such as those found in this study, need to be reduced. As discussed in Sect. 4.2.3, a better representation of C input dynamics and management practices could improve the simulation of SOC stocks.
We suggest considering multi-model analysis for this type of work in the future (Farina et al., 2021), to acknowledge different representations of SOC and reduce the effect of single models' uncertainties. Furthermore, the likely increase in SOC mineralization due to future climate change (Wiesmeier et al., 2016) needs to be taken into account.
4.3 Sensitivity analysis
The predicted need of additional C inputs to reach the 4p1000 target is likely to be higher with future global warming, as a consequence of modified SOC decomposition rates. Considering the crucial role of soil as a land-use-based option for mitigating climate change, recent studies have shown a growing interest in temperature sensitivity of SOC stock decomposition (Dash et al., 2019; Koven et al., 2011; Parihar et al., 2019; Wiesmeier et al., 2016). We know that the decomposition rate of SOM is affected – generally increased – with increasing temperatures. However, the magnitude of expected feedbacks is still surrounded by controversy. In particular, this is mainly due to the diversity of organic compounds in the soil that are known to have inherent sensitivities to temperature (Davidson and Janssens, 2006). In fact, a myriad of responses of decomposition rates to future climates can be expected, including increases due to higher temperature as well as decreases due to water limitation. In this context, the study of the Century model response to predicted scenarios of temperature increase is of primary importance. We mimicked the most optimistic (+1 ∘C) and pessimistic (+5 ∘C) RCP scenarios of the 5th IPCC assessment report. Although these scenarios are calculated over ∼ 100 years, we used these values over a 30-year simulation to assess the sensitivity of Century to temperature increase. What is striking from our results is that with increasing temperatures all sites will have to provide considerably higher amounts of C input to reach the 4p1000 target (Fig. 9). In particular, the C input change needs to more than double at all sites, according to the worst-case scenario of +5 ∘C. It is important to point out that the optimization of the Q10 and reference temperature parameters is likely to influence the outcomes of the simulated SOC stocks and therefore the C input need. Nevertheless, comparing the carbon input change simulated with the optimized version of Century (Fig. 9) to that simulated with the default parameter setting (Fig. C1) shows that the predicted C input change follows the same pattern, even though the intensity of the increase is considerably higher in the optimized version. These results can be understood in two ways. Either the optimized version of Century is overestimating the effect of temperature on SOC stock decomposition, or SOC stock decomposition patterns are likely to increase even more intensively when considering the entire range of possible Q10 values. In either case, further research is needed to reduce the uncertainty around the impact of climate change on SOC decomposition. Studies should also examine moisture change, which we did not take into account here. This is likely to be impacted as a consequence of modified precipitation and temperature (IPCC, 2015), with consequences on root respiration and microbial decomposition (Davidson and Janssens, 2006). Additionally, increased temperature and CO2 concentration in the atmosphere, as well as changes in precipitation, are likely to influence net primary production and therefore C inputs to the soil. All these feedbacks are important and must be taken into account for a comprehensive evaluation of C cycle effects on climate change.
The Century model predicted an average increase in annual C inputs by 43 ± 5 % to reach a 4p1000 target over a range of 14 agricultural sites across Europe, with diverse soil types, climates, crop rotations and practices. The required simulated amount of additional C input was found to be systematically lower than or similar to the 46 treatments of C inputs carried out at these sites. However, Century might have overestimated the predicted effect of additional C inputs on the SOC stock variation rate, as the only field treatments that were found to increase SOC stocks by at least 4 ‰ annually were those using very high amounts of C input (∼ 1.93 ). The predicted amount of additional C input depended linearly on the initial amount of observed SOC stock in the control experiments, indicating that lower amounts of C inputs might be sufficient to reach the 4p1000 target where SOC stocks are low. However, increasing C inputs might require substantial changes in the agricultural systems, and high quantities of additional organic matter might not be available at a large scale. Furthermore, the required amount of additional C input was found to increase substantially with future scenarios of changes in temperature, raising concern about the feasibility of a 4p1000 target under climate change and beyond that the feasibility of SOC stock preservation. The magnitude of SOC storage potential in agricultural soils depends largely on site-specific conditions, such as climate, soil type and land use. In this study, we did not take into account the whole life cycle of C at the farm. However, compensating for CO2 emissions from human activities through SOC sequestration should also comprehend GHG emissions related to the management of additional EOM. In this study, we considered only temperate, sub-humid and Mediterranean climates. A broader evaluation of the required C inputs and associated agricultural practices to increase SOC stocks should be carried out at larger scales. Causes of biases in model simulations should be addressed in future studies, and the representation of C inputs should be improved. We also suggest that future research should include multiple models, to reduce the influence of extreme model outcomes on the representation of SOC stocks.
The temporal evolution of soil organic carbon is described in the Century model as a first-order differential matrix equation:
where SOC(t) is the vector describing the SOC state variables. The first term on the right side of the equation represents carbon inputs to the soil coming from plant residue and organic material. Carbon inputs are allocated into four different litter pools. Hence, I is a 1 × 7 matrix with four nonzero elements. The second term of the equation represents carbon outputs from the soil, following a first-order decay kinetics. A is a 7 × 7 carbon transfer matrix that quantifies the transfers of carbon among the different pools. The diagonal entries of A are equal to −1, denoting the entire decomposition flux that leaves each carbon pool. The non-diagonal elements represent the fraction of carbon that is transferred from one pool to another. K is a 7 × 7 diagonal matrix with the diagonal elements representing the potential decomposition rate of each carbon pool. ξTWLCI(t) is the environmental scalar matrix, a 7 × 7 diagonal matrix with each diagonal element denoting temperature (fT(t)), water (fW(t)) lignin (fL i) and clay (fClay i) scalars, which modify the potential decomposition rate. Temperature response function fT(t) is described by Eq. (4); the others are expressed as follows. The moisture function fW(t) is a polynomial function ranging from 0.25 to 1 and taking the form of
where w is the daily relative humidity coefficient, which varies between 0 and 1 and was calculated from soil moisture (), using the following function from Krinner et al. (2005):
where w is the estimated relative humidity, ranging between 0 and 1; texture is sand, silt and clay; conctexture is the concentration of the different textures; moisture is soil moisture (), WPtexture is the wilting point of the different textures (equivalent to 0.0657, 0.0884 and 0.1496 for sand, silt and clay, respectively); and FCtexture is the field capacity of texture (equivalent to 0.1218, 0.1654 and 0.2697 for sand, silt and clay, respectively).
The decomposition rate of structural litter pools is affected by their lignin content:
where lgc is the coefficient that regulates the lignin effect, while L is the lignin structural fraction of the AG and the BG litter pools.
Finally, the fraction of clay in the soil () influences the decomposition rate of the active pool:
Two residual-based metrics were used to evaluate the goodness of fit of modeled and observed SOC stocks for each site: the mean squared deviation (MSD) and the normalized root-mean-squared deviation (NRMSD). The MSD for each site is defined as
where is the year of the experiment, mi and oi are respectively modeled and observed values of SOC stocks and s is the number of observations in the experiment. Following Gauch et al. (2003), the MSD can be decomposed into three components: the squared bias (SB), the non-unity slope (NU) and the lack of correlation (LC). SB is calculated as
where and are the mean values of modeled and observed SOC stocks, respectively.
Calling and , we have
These three components add up to MSD and help locate the causes of error of model predictions, determining areas in the model that require further improvement (Bellocchi et al., 2010). In particular, SB provides information about the mean bias of the simulation from measurements, NU indicates the capacity of the model to correctly reproduce the magnitude of the fluctuation among the measurements and LC is an indication of the dispersion of the points over a scatterplot, i.e., the capacity of the model to reproduce the shape of the data (Kobayashi and Salam, 2000).
The second statistical measure we used was computed as the squared root of the MSD, normalized by the mean observed SOC stocks:
This indicator is expressed as a percentage and allows the evaluation of the model performance independently of the units of SOC stocks.
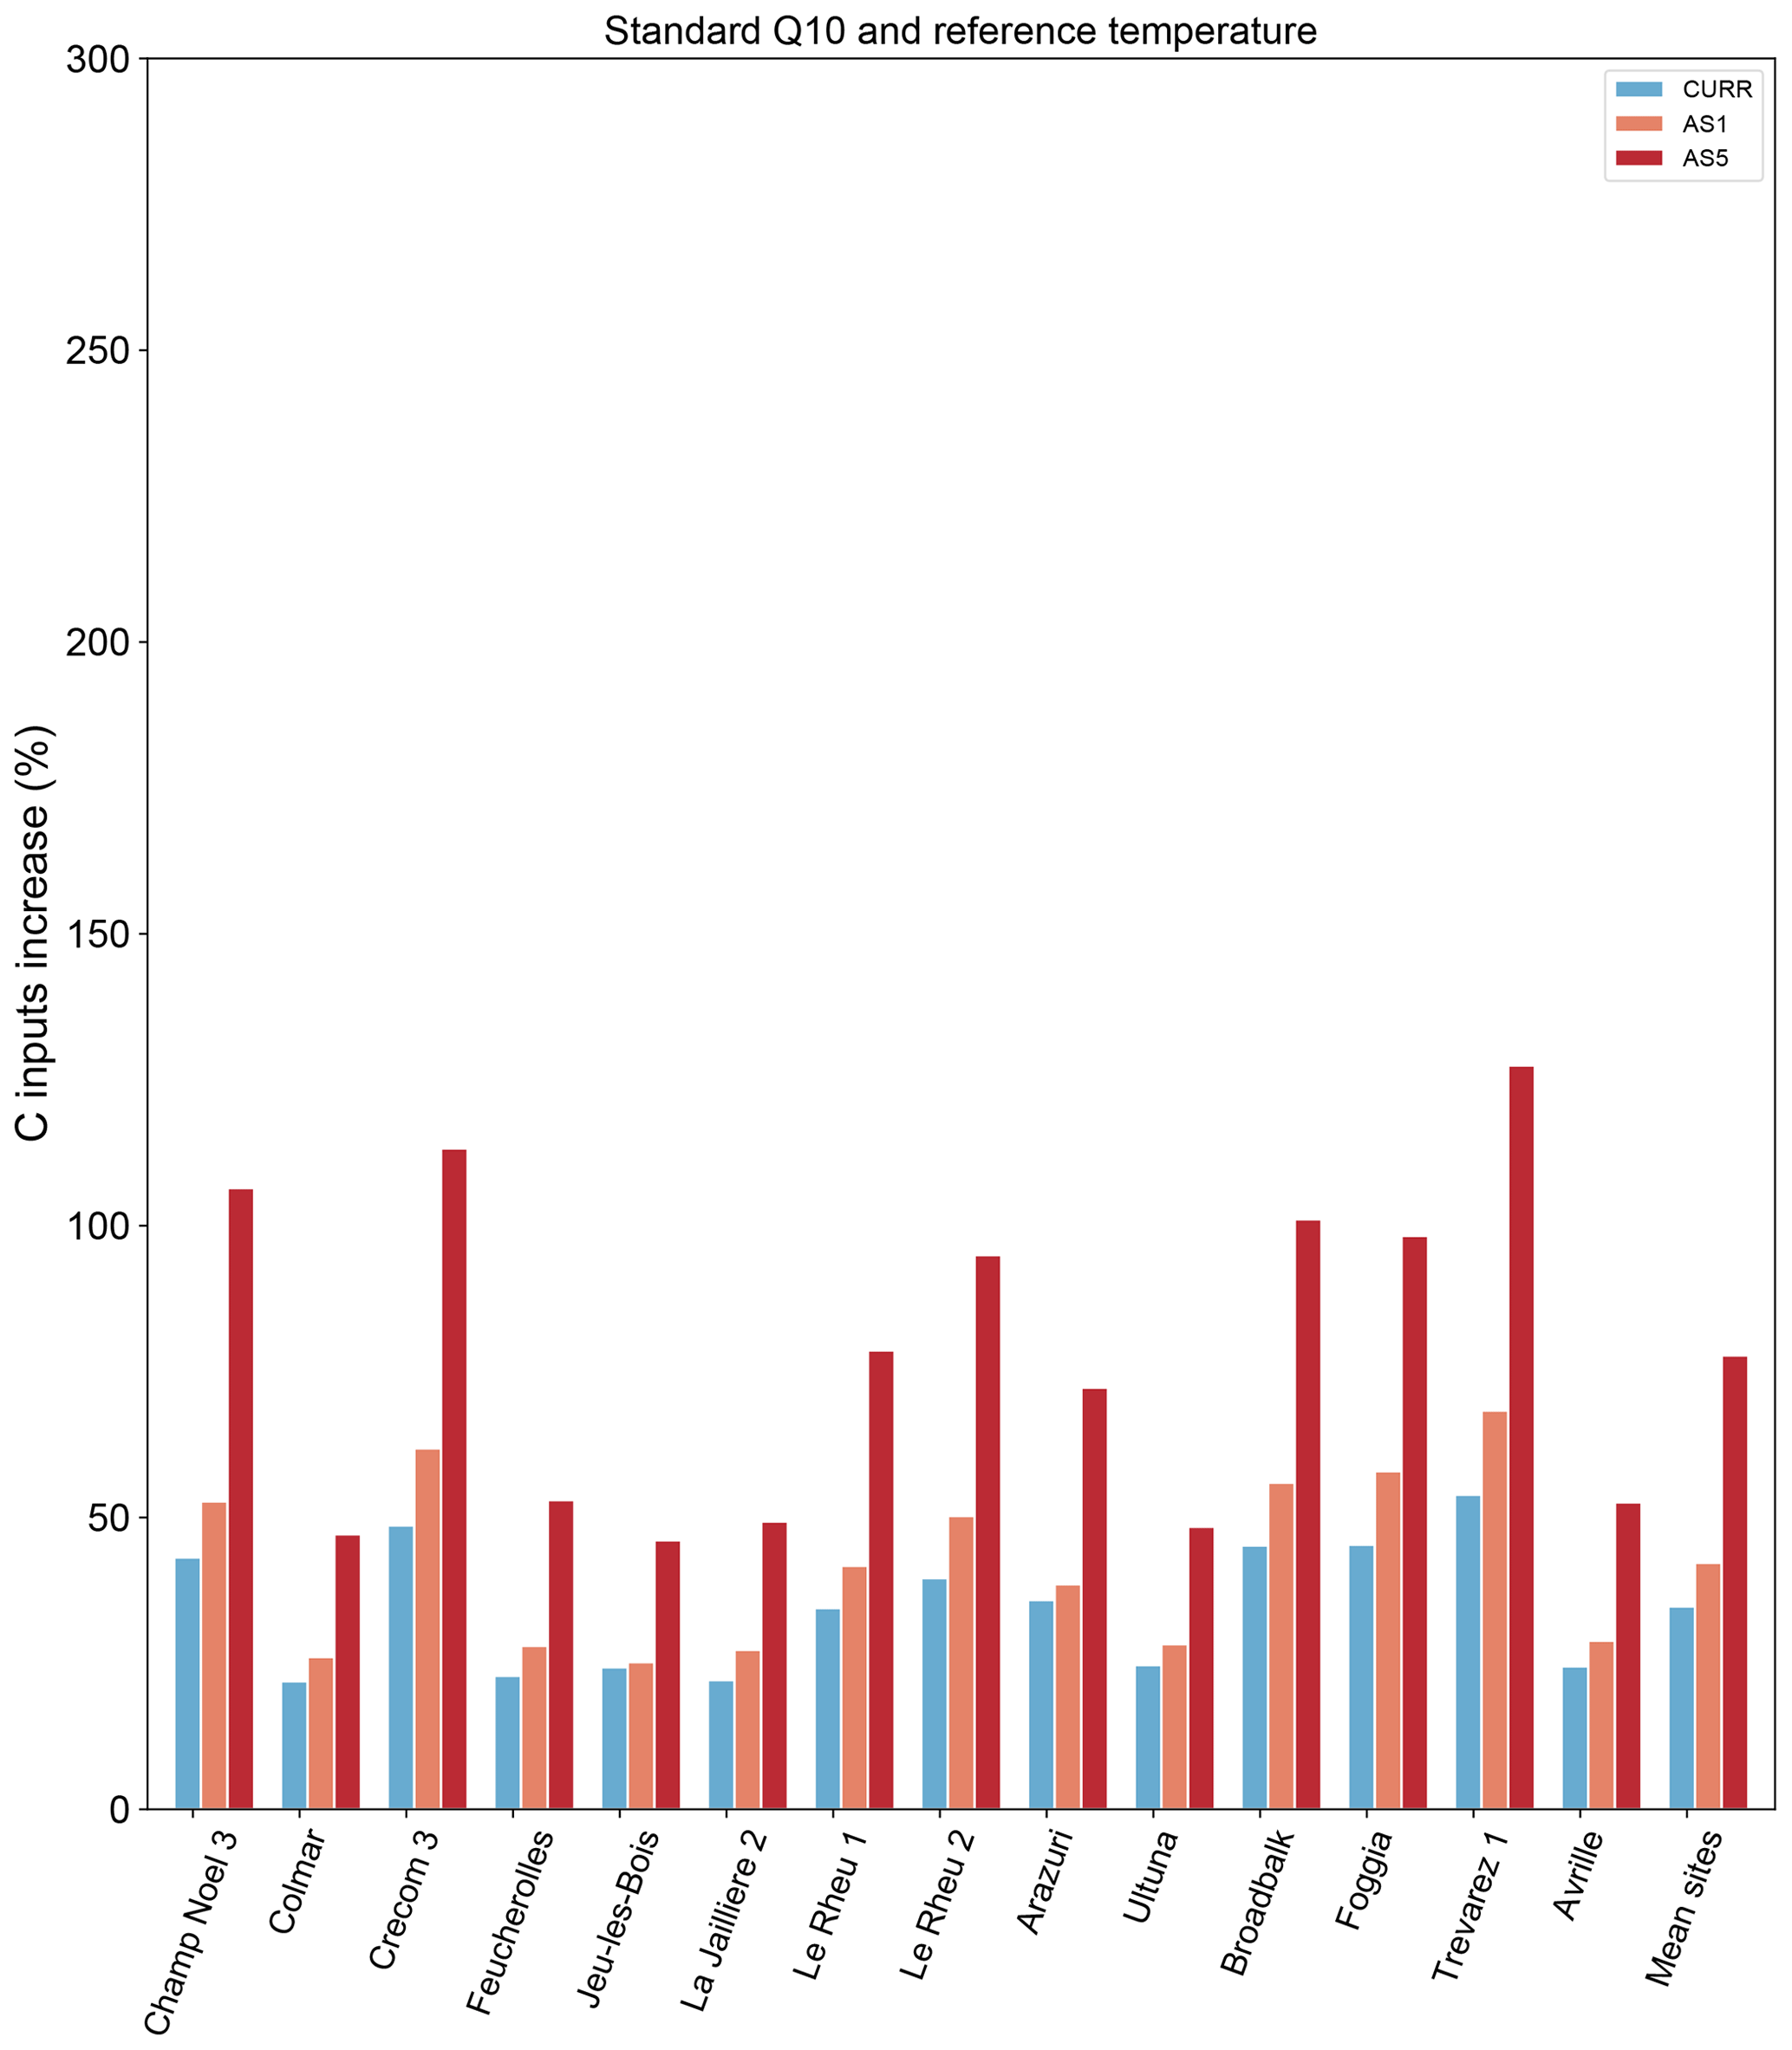
Figure C1Temperature sensitivity analysis of carbon input change (%) to reach the 4p1000 objective, using Century default Q10 and reference temperature parameters. CURR: business-as-usual simulation; AS1: RCP2.6 scenario of +1 ∘C temperature increase; AS5: RCP8.5 scenario of +5 ∘C temperature change.
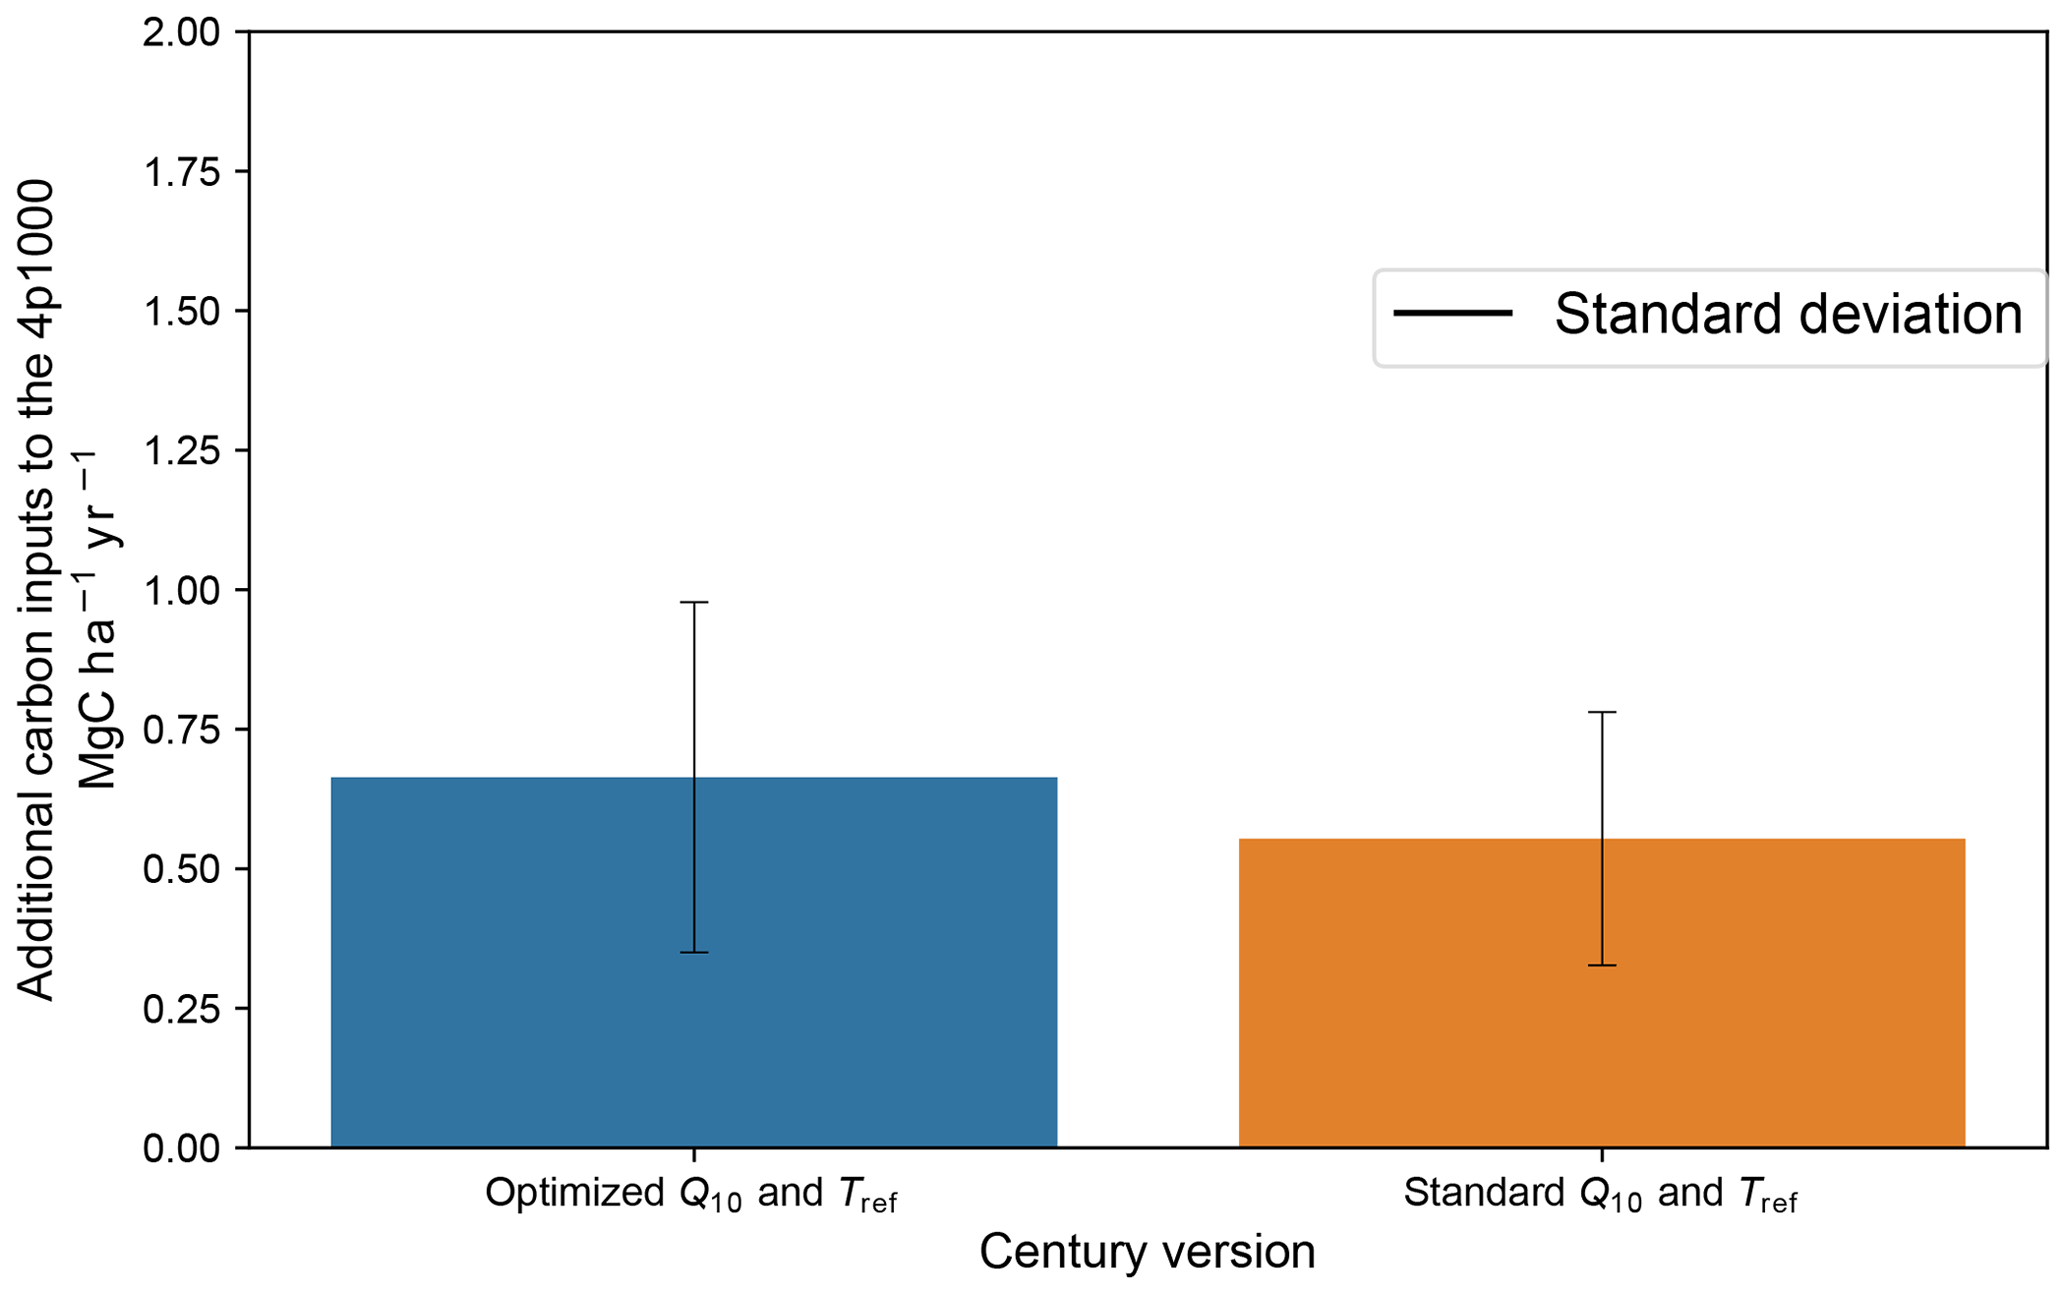
Figure C2Effect of the optimization of the Q10 and reference temperature (Tref) parameters on the additional carbon inputs to reach the 4p1000 predicted by Century (mean ± standard deviation).
The code used for simulations is publicly available and can be accessed at https://doi.org/10.5281/zenodo.5036268 (Bruni, 2021).
Data used for this work were provided by the data owners of the different long-term experiments. Please contact them to get access to the data (see Table 2).
The supplement related to this article is available online at: https://doi.org/10.5194/bg-18-3981-2021-supplement.
YH provided the initial model code. EB edited and developed the model code, performed the simulations, and prepared the manuscript with contributions from all co-authors. EB, CC, PC and BG designed the study. HC, IV, RF, TK and MM provided the data. All co-authors participated in result analysis and the writing.
The authors declare that they have no conflict of interest.
Publisher’s note: Copernicus Publications remains neutral with regard to jurisdictional claims in published maps and institutional affiliations.
We acknowledge Mancomunidad de la Comarca de Pamplona for maintenance and access to Arazuri site data. Research grant RTA2017-00088-C03-01 was received from the Instituto Nacional de Investigación Agraria y Alimentaria, INIA (Spanish Agency). We acknowledge Margaret Glendining, curator of the electronic Rothamsted Archive (e-RA), for providing the Broadbalk data. The Colmar and Feucherolles field experiments form part of the SOERE-PRO (network of long-term experiments dedicated to the study of impacts of organic waste product recycling) certified by ALLENVI (Alliance Nationale de Recherche pour l'Environnement) and integrated as a service of the “Investment for future” infrastructure AnaEE-France, overseen by the French National Research Agency (ANR-11-INBS-0001).
This work benefited from French state aid managed by the ANR under the “Investissements d’avenir” program (CLAND project (grant no. ANR-16-CONV-0003)).
This paper was edited by Yakov Kuzyakov and reviewed by four anonymous referees.
Anderson, G. M.: Error propagation by the Monte Carlo method in geochemical calculations, Geochim. Cosmochim. Ac., 40, 1533–1538, https://doi.org/10.1016/0016-7037(76)90092-2, 1976.
Baveye, P. C., Berthelin, J., Tessier, D., and Lemaire, G.: The “4 per 1000” initiative: A credibility issue for the soil science community?, Geoderma, 309, 118–123, https://doi.org/10.1016/j.geoderma.2017.05.005, 2018.
Bellocchi, G., Rivington, M., Donatelli, M., and Matthews, K.: Validation of biophysical models: issues and methodologies. A review, Agron. Sustain. Dev., 30, 109–130, https://doi.org/10.1051/agro/2009001, 2010.
Bijaya, M., Barrington, A., and Martinez, J.: Predicted growth of world urban food waste and methane production, Waste Manage Res., 24, 421–433, https://doi.org/10.1177/0734242X06067767, 2006.
Bolinder, M. A., Janzen, H. H., Gregorich, E. G., Angers, D. A., and VandenBygaart, A. J.: An approach for estimating net primary productivity and annual carbon inputs to soil for common agricultural crops in Canada, Agr. Ecosys. Environ., 118, 29–42, https://doi.org/10.1016/j.agee.2006.05.013, 2007.
Bortolon, E. S. O., Mielniczuk, J., Tornquist, C. G., Lopes, F., and Bergamaschi, H.: Validation of the Century model to estimate the impact of agriculture on soil organic carbon in Southern Brazil, Geoderma, 167–168, 156–166, https://doi.org/10.1016/j.geoderma.2011.08.008, 2011.
Bouthier, A., Duparque, A., Mary, B., Sagot, S., Trochard, R., Levert, M., Houot, S., Damay, N., Denoroy, P., Dinh, J.-L., Blin, B., and Ganteil, F.: Adaptation et mise en œuvre du modèle de calcul de bilan humique à long terme AMG dans une large gamme de systèmes de grandes cultures et de polyculture-élevage, Innovations Agronomiques, 34, 125–139, 2014.
Bruni, E.: elisabruni/Century_inverted_4per1000: Inverse modeling with Century (Version v1.0.0), Zenodo, https://doi.org/10.5281/zenodo.5036268, 2021.
Campbell, E. E. and Paustian, K.: Current developments in soil organic matter modeling and the expansion of model applications: a review, Environ. Res. Lett., 10, 123004, https://doi.org/10.1088/1748-9326/10/12/123004, 2015.
Chadwick, D., Wei, J., Yan'an, T., Guanghui, Y., Qirong, S., and Qing, C.: Improving manure nutrient management towards sustainable agricultural intensification in China, Agr. Ecosys. Environ., 209, 34–46, https://doi.org/10.1016/j.agee.2015.03.025, 2015.
Chenu, C., Angers, D. A., Barré, P., Derrien, D., Arrouays, D., and Balesdent, J.: Increasing organic stocks in agricultural soils: Knowledge gaps and potential innovations, Soil Till. Res., 188, 41–52, https://doi.org/10.1016/j.still.2018.04.011, 2019.
Clivot, H., Mouny, J.-C., Duparque, A., Dinh, J.-L., Denoroy, P., Houot, S., Vertès, F., Trochard, R., Bouthier, A., Sagot, S., and Mary, B.: Modeling soil organic carbon evolution in long-term arable experiments with AMG model, Environ. Modell. Softw., 118, 99–113, https://doi.org/10.1016/j.envsoft.2019.04.004, 2019.
Cong, R., Wang, X., Xu, M., Ogle, S. M., and Parton, W. J.: Evaluation of the CENTURY Model Using Long-Term Fertilization Trials under Corn-Wheat Cropping Systems in the Typical Croplands of China, edited by: Vera, J., University of Erlangen-Nuremberg, Erlangen and Nuremberg, Germany, PLoS ONE, 9, e95142, https://doi.org/10.1371/journal.pone.0095142, 2014.
Craine, J., Spurr, R., McLauchlan, K., and Fierer, N.: Landscape-level variation in temperature sensitivity of soil organic carbon decomposition, Soil Biol. Biochem., 42, 373–375, https://doi.org/10.1016/j.soilbio.2009.10.024, 2010.
Dash, P. K., Bhattacharyya, P., Roy, K. S., Neogi, S., and Nayak, A. K.: Environmental constraints' sensitivity of soil organic carbon decomposition to temperature, management practices and climate change, Ecological Indicators, 107, 105644, https://doi.org/10.1016/j.ecolind.2019.105644, 2019.
Davidson, E. A. and Janssens, I. A.: Temperature sensitivity of soil carbon decomposition and feedbacks to climate change, Nature, 440, 165–173, https://doi.org/10.1038/nature04514, 2006.
Eurostat: Sewage sludge production and disposal from urban wastewater, available at: http://ec.europa.eu/eurostat/web/products-datasets/-/ten00030 (last access: 20 December 2020), 2014.
Eurostat: Municipal waste landfilled, incinerated, recycled and composted, EU-27, 1995–2018, available at: https://ec.europa.eu/eurostat/statistics-explained/index.php?title=Municipal_waste_statistics (last access: 20 December 2020), 2020.
Fan, J., McConkey, B., Wang, H., and Janzen, H.: Root distribution by depth for temperate agricultural crops, Field Crops Res., 189, 68–74, https://doi.org/10.1016/j.fcr.2016.02.013, 2016.
Farina, R., Marchetti, A., Francaviglia, R., Napoli, R., and Bene, C. D.: Modeling regional soil C stocks and CO2 emissions under Mediterranean cropping systems and soil types, Agr. Ecosys. Environ., 238, 128–141, https://doi.org/10.1016/j.agee.2016.08.015, 2017.
Farina, R., Sándor, R., Abdalla, M., Álvaro-Fuentes, J., Bechini, L., Bolinder, M. A., Brilli, L., Chenu, C., Clivot, H., De Antoni Migliorati, M., Bene, C. D., Dorich, C. D., Ehrhardt, F., Ferchaud, F., Fitton, N., Francaviglia, R., Franko, U., Giltrap, D. L., Grant, B. B., Guenet, B., Harrison, M. T., Kirschbaum, M. U. F., Kuka, K., Kulmala, L., Liski, J., McGrath, M. J., Meier, E., Menichetti, L., Moyano, F., Nendel, C., Recous, S., Reibold, N., Shepherd, A., Smith, W. N., Smith, P., Soussana, J.-F., Stella, T., Taghizadeh-Toosi, A., Tsutskikh, E., and Bellocchi, G.: Ensemble modelling, uncertainty and robust predictions of organic carbon in long-term bare-fallow soils, Glob. Change Biol., 27, 904–928, https://doi.org/10.1111/gcb.15441, 2021.
Fu, Z., Liu, G., and Guo, L.: Sequential Quadratic Programming Method for Nonlinear Least Squares Estimation and Its Application, Math. Probl. Eng., 2019, 3087949, https://doi.org/10.1155/2019/3087949, 2019.
Fuchs, J., Génermont, S., Houot, S., Jardé, E., Ménasseri-Aubry, S., Mollier, A., Morel, C., Parnaudeau, V., Pradel, M., and Vieublé, L.: Effets agronomiques attendus de l'épandage des Mafor sur les écosystèmes agricoles et forestiers, hal-02796871, available at: https://hal.inrae.fr/hal-02796871 (last access: 20 December 2020), 2014.
Gale, M. R. and Grigal, D. F.: Vertical root distributions of northern tree species in relation to successional status, Can. J. Forest Res., 17, 829–834, https://doi.org/10.1139/x87-131, 1987.
Gauch, H. G., Hwang, J. T. G., and Fick, G. W.: Model Evaluation by Comparison of Model-Based Predictions and Measured Values, Agron. J., 95, 1442–1446, https://doi.org/10.2134/agronj2003.1442, 2003.
Goidts, E. and van Wesemael, B.: Regional assessment of soil organic carbon changes under agriculture in Southern Belgium (1955–2005), Geoderma, 141, 341–354, https://doi.org/10.1016/j.geoderma.2007.06.013, 2007.
Guenet, B., Gabrielle, B., Chenu, C., Arrouays, D., Balesdent, J., Bernoux, M., Bruni, E., Caliman, J., Cardinael, R., Chen, S., Ciais, P., Desbois, D., Fouche, J., Frank, S., Henault, C., Lugato, E., Naipal, V., Nesme, T., Obersteiner, M., Pellerin, S., Powlson, D. S., Rasse, D. P., Rees, F., Soussana, J., Su, Y., Tian, H., Valin, H., and Zhou, F.: Can N2O emissions offset the benefits from soil organic carbon storage?, Glob. Change Biol., 27, 237–256, https://doi.org/10.1111/gcb.15342, 2020.
Huang, Y., Lu, X., Shi, Z., Lawrence, D., Koven, C. D., Xia, J., Du, Z., Kluzek, E., and Luo, Y.: Matrix approach to land carbon cycle modeling: A case study with the Community Land Model, Glob. Change Biol., 24, 1394–1404, https://doi.org/10.1111/gcb.13948, 2018.
IPCC: Climate Change 2014: Synthesis Report. Contribution of Working Groups I, II and III to the Fifth Assessment Report of the Intergovernmental Panel on Climate Change, Core Writing Team, edited by: Pachauri, R. K. and Meyer, L. A., IPCC, Geneva, Switzerland, 151, 2015.
Kätterer, T., Bolinder, M. A., Andrén, O., Kirchmann, H., and Menichetti, L.: Roots contribute more to refractory soil organic matter than above-ground crop residues, as revealed by a long-term field experiment, Agr. Ecosys. Environ., 141, 184–192, https://doi.org/10.1016/j.agee.2011.02.029, 2011.
Kelly, R. H., Parton, W. J., Crocker, G. J., Graced, P. R., Klír, J., Körschens, M., Poulton, P. R., and Richter, D. D.: Simulating trends in soil organic carbon in long-term experiments using the century model, Geoderma, 81, 75–90, https://doi.org/10.1016/S0016-7061(97)00082-7, 1997.
Klein Goldewijk, K., Beusen, A., Doelman, J., and Stehfest, E.: Anthropogenic land use estimates for the Holocene – HYDE 3.2, Earth Syst. Sci. Data, 9, 927–953, https://doi.org/10.5194/essd-9-927-2017, 2017.
Kobayashi, K. and Salam, M. U.: Comparing Simulated and Measured Values Using Mean Squared Deviation and its Components, Agron. J., 92, 345–352, 2000.
Koven, C. D., Ringeval, B., Friedlingstein, P., Ciais, P., Cadule, P., Khvorostyanov, D., Krinner, G., and Tarnocai, C.: Permafrost carbon-climate feedbacks accelerate global warming, P. Natl. Acad. Sci. USA, 108, 14769–14774, https://doi.org/10.1073/pnas.1103910108, 2011.
Krinner, G., Viovy, N., de Noblet-Ducoudré, N., Ogée, J., Polcher, J., Friedlingstein, P., Ciais, P., Sitch, S., and Prentice, I. C.: A dynamic global vegetation model for studies of the coupled atmosphere-biosphere system, Global Biogeochem. Cy., 19, GB1015, https://doi.org/10.1029/2003GB002199, 2005.
Lal, R.: Residue management, conservation tillage and soil restoration for mitigating greenhouse effect by CO2-enrichment, Soil Till. Res., 43, 81–107, https://doi.org/10.1016/S0167-1987(97)00036-6, 1997.
Lal, R.: Carbon sequestration, Philos. T. R. Soc. B, 363, 815–830, https://doi.org/10.1098/rstb.2007.2185, 2008.
Lal, R.: Digging deeper: A holistic perspective of factors affecting soil organic carbon sequestration in agroecosystems, Glob. Change Biol., 24, 3285–3301, https://doi.org/10.1111/gcb.14054, 2018.
Larsen, A. W., Fuglsang, K., Pedersen, N. H., Fellner, J., Rechberger, H., and Astrup, T.: Biogenic carbon in combustible waste: Waste composition, variability and measurement uncertainty, Waste Manage. Res., 31, 56–66, https://doi.org/10.1177/0734242X13502387, 2013.
Lefèvre, R., Barré, P., Moyano, F. E., Christensen, B. T., Bardoux, G., Eglin, T., Girardin, C., Houot, S., Kätterer, T., van Oort, F., and Chenu, C.: Higher temperature sensitivity for stable than for labile soil organic carbon – Evidence from incubations of long-term bare fallow soils, Glob. Change Biol., 20, 633–640, https://doi.org/10.1111/gcb.12402, 2014.
Levavasseur, F., Mary, B., Christensen, B. T., Duparque, A., Ferchaud, F., Kätterer, T., Lagrange, H., Montenach, D., Resseguier, C., and Houot, S.: The simple AMG model accurately simulates organic carbon storage in soils after repeated application of exogenous organic matter, Nutr. Cycl. Agroecosys., 117, 215–229, https://doi.org/10.1007/s10705-020-10065-x, 2020.
Li, S., Li, J., Zhang, B., Li, D., Li, G., and Li, Y.: Effect of different organic fertilizers application on growth and environmental risk of nitrate under a vegetable field, Sci. Rep.-UK, 7, 17020, https://doi.org/10.1038/s41598-017-17219-y, 2017.
Lovelli, S., Scopa, A., Perniola, M., Di Tommaso, T., and Sofo, A.: Abscisic acid root and leaf concentration in relation to biomass partitioning in salinized tomato plants, J. Plant Physiol., 169, 226–233, https://doi.org/10.1016/j.jplph.2011.09.009, 2012.
Lugato, E., Bampa, F., Panagos, P., Montanarella, L., and Jones, A.: Potential carbon sequestration of European arable soils estimated by modelling a comprehensive set of management practices, Glob. Change Biol., 20, 3557–3567, https://doi.org/10.1111/gcb.12551, 2014.
Luo, Y., Shi, Z., Lu, X., Xia, J., Liang, J., Jiang, J., Wang, Y., Smith, M. J., Jiang, L., Ahlström, A., Chen, B., Hararuk, O., Hastings, A., Hoffman, F., Medlyn, B., Niu, S., Rasmussen, M., Todd-Brown, K., and Wang, Y.-P.: Transient dynamics of terrestrial carbon storage: mathematical foundation and its applications, Biogeosciences, 14, 145–161, https://doi.org/10.5194/bg-14-145-2017, 2017.
Manzoni, S. and Porporato, A.: Soil carbon and nitrogen mineralization: Theory and models across scales, Soil Biol. Biochem., 41, 1355–1379, https://doi.org/10.1016/j.soilbio.2009.02.031, 2009.
Martin, M. P., Dimassi, B., Ŕomàn Dobarco, M., Guenet, B., Arrouays, D., Angers, D. A., Blache, F., Huard, F., Soussana, J., and Pellerin, S.: Feasibility of the 4 per 1000 aspirational target for soil carbon. A case study for France, Glob. Change Biol., 27, 2458–2477, https://doi.org/10.1111/gcb.15547, 2021.
McBratney, A. B. and Minasny, B.: Comment on “Determining soil carbon stock changes: Simple bulk density corrections fail” [Agric. Ecosyst. Environ. 134 (2009) 251–256], Agr. Ecosys. Environ., 136, 185–186, https://doi.org/10.1016/j.agee.2009.12.010, 2010.
Meersmans, J., Van WESEMAEL, B., Goidts, E., Van Molle, M., De Baets, S., and De Ridder, F.: Spatial analysis of soil organic carbon evolution in Belgian croplands and grasslands, 1960–2006: Spatial analysis of soil organic carbon evolution, Glob. Change Biol., 17, 466–479, https://doi.org/10.1111/j.1365-2486.2010.02183.x, 2011.
Mekonnen, K., Buresh, R. J., and Jama, B.: Root and inorganic nitrogen distributions in sesbania fallow, natural fallow and maize fields, Plant Soil, 188, 319–327, 1997.
Meyer, N., Welp, G., and Amelung, W.: The Temperature Sensitivity (Q10) of Soil Respiration: Controlling Factors and Spatial Prediction at Regional Scale Based on Environmental Soil Classes, Global Biogeochem. Cy., 32, 306–323, https://doi.org/10.1002/2017GB005644, 2018.
Minasny, B., Malone, B. P., McBratney, A. B., Angers, D. A., Arrouays, D., Chambers, A., Chaplot, V., Chen, Z.-S., Cheng, K., Das, B. S., Field, D. J., Gimona, A., Hedley, C. B., Hong, S. Y., Mandal, B., Marchant, B. P., Martin, M., McConkey, B. G., Mulder, V. L., O'Rourke, S., Richer-de-Forges, A. C., Odeh, I., Padarian, J., Paustian, K., Pan, G., Poggio, L., Savin, I., Stolbovoy, V., Stockmann, U., Sulaeman, Y., Tsui, C.-C., Vågen, T.-G., van Wesemael, B., and Winowiecki, L.: Soil carbon 4 per mille, Geoderma, 292, 59–86, https://doi.org/10.1016/j.geoderma.2017.01.002, 2017.
Parihar, C. M., Singh, A. K., Jat, S. L., Ghosh, A., Dey, A., Nayak, H. S., Parihar, M. D., Mahala, D. M., Yadav, R. K., Rai, V., Satayanaryana, T., and Jat, M. L.: Dependence of Temperature Sensitivity of Soil Organic Carbon Decomposition on Nutrient Management Options under Conservation Agriculture in a Sub-Tropical Inceptisol, Soil Till. Res., 190, 50–60, https://doi.org/10.1016/j.still.2019.02.016, 2019.
Parton, W. J., Stewart, J. W. B., and Cole, C. V.: Dynamics of C, N, P and S in grassland soils: a model, Biogeochemistry, 5, 109–131, https://doi.org/10.1007/BF02180320, 1988.
Parton, W. J., Scurlock, J. M. O., Ojima, D. S., Gilmanov, T. G., Scholes, R. J., Schimel, D. S., Kirchner, T., Menaut, J.-C., Seastedt, T., Garcia Moya, E., Kamnalrut, A., and Kinyamario, J. I.: Observations and modeling of biomass and soil organic matter dynamics for the grassland biome worldwide, Global Biogeochem. Cy., 7, 785–809, https://doi.org/10.1029/93GB02042, 1993.
Paustian, K., Lehmann, J., Ogle, S., Reay, D., Robertson, G. P., and Smith, P.: Climate-smart soils, Nature, 532, 49–57, https://doi.org/10.1038/nature17174, 2016.
Pellegrini, M., Saccani, C., Bianchini, A., and Bonfiglioli, L.: Sewage sludge management in Europe: a critical analysis of data quality, International Journal of Environment and Waste Management, 18, 226–238, https://doi.org/10.1504/IJEWM.2016.10001645, 2016.
Pellerin, S., Bamière, L., Denis, A., Béline, F., Benoit, M., Butault, J.-P., Launay, C., Martin, R., Schiavo, M., Angers, D., Augusto, L., Balesdent, J., Basile-Doelsch, I., Bellassen, V., Cardinael, R., Cécillon, L., Ceschia, E., Chenu, C., Constantin, J., Darroussin, J., Delacote, P., Delame, N., Gastal, F., Gilbert, D., Graux, A.I., Guenet, B., Houot, S., Klumpp, K., Letort, E., Litrico, I., Martin, M., Menasseri, S., Mézière, D., Morvan, T., Mosnier, C., Roger-Estrade, J., Saint-André, L., Sierra, J., Thérond, O., Viaud, V., Grateau, R., Le Perchec, S., Savini, I., and Réchauchère O.: Stocker du carbone dans les sols français, Quel potentiel au regard de l’objectif 4 pour 1000 et à quel coût ? Synthèse du rapport d’étude, INRA, France, 114 p., 2019.
Piovesan, R. P., Favaretto, N., Pauletti, V., Motta, A. C. V., and Reissmann, C. B.: Perdas de nutrientes via subsuperfície em colunas de solo sob fertilização mineral e orgânica, Rev. Bras. Cienc. Solo, 33, 757–766, https://doi.org/10.1590/S0100-06832009000400002, 2009.
Poulton, P., Johnston, J., Macdonald, A., White, R., and Powlson, D.: Major limitations to achieving “4 per 1000” increases in soil organic carbon stock in temperate regions: Evidence from long-term experiments at Rothamsted Research, United Kingdom, Glob. Change Biol., 24, 2563–2584, https://doi.org/10.1111/gcb.14066, 2018.
Powlson, D. S., Whitmore, A. P., and Goulding, K. W. T.: Soil carbon sequestration to mitigate climate change: a critical re-examination to identify the true and the false, Eur. J. Soil Sci., 62, 42–55, https://doi.org/10.1111/j.1365-2389.2010.01342.x, 2011.
Powlson, D. S., Bhogal, A., Chambers, B. J., Coleman, K., Macdonald, A. J., Goulding, K. W. T., and Whitmore, A. P.: The potential to increase soil carbon stocks through reduced tillage or organic material additions in England and Wales: A case study, Agr. Ecosys. Environ., 146, 23–33, https://doi.org/10.1016/j.agee.2011.10.004, 2012.
Redin, M., Recous, S., Aita, C., Dietrich, G., Skolaude, A. C., Ludke, W. H., Schmatz, R., and Giacomini, S. J.: How the chemical composition and heterogeneity of crop residue mixtures decomposing at the soil surface affects C and N mineralization, Soil Biol. Biochem., 78, 65–75, https://doi.org/10.1016/j.soilbio.2014.07.014, 2014.
Riggers, C., Poeplau, C., Don, A., Frühauf, C., and Dechow, R.: How much carbon input is required to preserve or increase projected soil organic carbon stocks in German croplands under climate change?, Plant Soil, 460, 417–433, https://doi.org/10.1007/s11104-020-04806-8, 2021.
Rovira, P., Sauras, T., Salgado, J., and Merino, A.: Towards sound comparisons of soil carbon stocks: A proposal based on the cumulative coordinates approach, CATENA, 133, 420–431, https://doi.org/10.1016/j.catena.2015.05.020, 2015.
Saffih-Hdadi, K. and Mary, B.: Modeling consequences of straw residues export on soil organic carbon, Soil Biol. Biochem., 40, 594–607, https://doi.org/10.1016/j.soilbio.2007.08.022, 2008.
Sanderman, J., Hengl, T., and Fiske, G. J.: Soil carbon debt of 12,000 years of human land use, P. Natl. Acad. Sci. USA, 114, 9575–9580, https://doi.org/10.1073/pnas.1706103114, 2017.
Smith, P., Smith, J. U., Powlson, D. S., McGill, W. B., Arah, J. R. M., Chertov, O. G., Coleman, K., Franko, U., Frolking, S., Jenkinson, D. S., Jensen, L. S., Kelly, R. H., Klein-Gunnewiek, H., Komarov, A. S., Li, C., Molina, J. A. E., Mueller, T., Parton, W. J., Thornley, J. H. M., and Whitmore, A. P.: A comparison of the performance of nine soil organic matter models using datasets from seven long-term experiments, Geoderma, 81, 153–225, https://doi.org/10.1016/S0016-7061(97)00087-6, 1997a.
Smith, P., Powlson, D., Glendining, M., and Smith, J.: Potential for carbon sequestration in European soils: preliminary estimates for five scenarios using results from long-term experiments, Glob. Change Biol., 3, 67–79, https://doi.org/10.1046/j.1365-2486.1997.00055.x, 1997b.
Soussana, J.-F., Lutfalla, S., Ehrhardt, F., Rosenstock, T., Lamanna, C., Havlík, P., Richards, M., Wollenberg, E., Chotte, J.-L., Torquebiau, E., Ciais, P., Smith, P., and Lal R.: Matching policy and science_Rationale for the '4 per 1000 – soils for food security and climate' initiative, Soil Till. Res., 188, 3–15, https://doi.org/10.1016/j.still.2017.12.002, 2017.
VandenBygaart, A. J.: Comments on soil carbon 4 per mille by Minasny et al. 2017, Geoderma, 309, 113–114, https://doi.org/10.1016/j.geoderma.2017.05.024, 2018.
van Groenigen, J. W., van Kessel, C., Hungate, B. A., Oenema, O., Powlson, D. S., and van Groenigen, K. J.: Sequestering Soil Organic Carbon: A Nitrogen Dilemma, Environ. Sci. Technol., 51, 4738–4739, https://doi.org/10.1021/acs.est.7b01427, 2017.
van't Hoff, M. J. H.: Etudes de dynamique chimique, Frederik Muller & Co., Amsterdam, https://doi.org/10.1002/recl.18840031003, 1884.
Wang, X., Piao, S., Ciais, P., Janssens, I. A., Reichstein, M., Peng, S., and Wang, T.: Are ecological gradients in seasonal Q10 of soil respiration explained by climate or by vegetation seasonality?, Soil Biol. Biochem., 42, 1728–1734, https://doi.org/10.1016/j.soilbio.2010.06.008, 2010.
Wiesmeier, M., Poeplau, C., Sierra, C. A., Maier, H., Frühauf, C., Hübner, R., Kühnel, A., Spörlein, P., Geuß, U., Hangen, E., Schilling, B., von Lützow, M., and Kögel-Knabner, I.: Projected loss of soil organic carbon in temperate agricultural soils in the 21st century: effects of climate change and carbon input trends, Sci. Rep.-UK, 6, 32525, https://doi.org/10.1038/srep32525, 2016.
Wollenberg, E., Richards, M., Smith, P., Havlík, P., Obersteiner, M., Tubiello, F. N., Herold, M., Gerber, P., Carter, S., Reisinger, A., van Vuuren, D. P., Dickie, A., Neufeldt, H., Sander, B. O., Wassmann, R., Sommer, R., Amonette, J. E., Falcucci, A., Herrero, M., Opio, C., Roman-Cuesta, R. M., Stehfest, E., Westhoek, H., Ortiz-Monasterio, I., Sapkota, T., Rufino, M. C., Thornton, P. K., Verchot, L., West, P. C., Soussana, J.-F., Baedeker, T., Sadler, M., Vermeulen, S., and Campbell, B. M.: Reducing emissions from agriculture to meet the 2 ∘C target, Glob. Change Biol., 22, 3859–3864, https://doi.org/10.1111/gcb.13340, 2016.
Xia, J. Y., Luo, Y. Q., Wang, Y.-P., Weng, E. S., and Hararuk, O.: A semi-analytical solution to accelerate spin-up of a coupled carbon and nitrogen land model to steady state, Geosci. Model Dev., 5, 1259–1271, https://doi.org/10.5194/gmd-5-1259-2012, 2012.
Xu, W., Chen, X., Luo, G., and Lin, Q.: Using the CENTURY model to assess the impact of land reclamation and management practices in oasis agriculture on the dynamics of soil organic carbon in the arid region of North-western China, Ecol. Complex., 8, 30–37, https://doi.org/10.1016/j.ecocom.2010.11.003, 2011.
Zhang, B., Tian, H., Lu, C., Dangal, S. R. S., Yang, J., and Pan, S.: Global manure nitrogen production and application in cropland during 1860–2014: a 5 arcmin gridded global dataset for Earth system modeling, Earth Syst. Sci. Data, 9, 667–678, https://doi.org/10.5194/essd-9-667-2017, 2017.
Zinn, Y. L., Lal, R., and Resck, D. V. S.: Changes in soil organic carbon stocks under agriculture in Brazil, Soil Till. Res., 84, 28–40, https://doi.org/10.1016/j.still.2004.08.007, 2005.
http://www.era.rothamsted.ac.uk, last access: 20 February 2020.
- Abstract
- Introduction
- Materials and methods
- Results
- Discussion
- Conclusions
- Appendix A: Century model description and environmental functions used
- Appendix B: Model evaluation
- Appendix C: Sensitivity analysis with default Century parameters
- Code availability
- Data availability
- Author contributions
- Competing interests
- Disclaimer
- Acknowledgements
- Financial support
- Review statement
- References
- Supplement