the Creative Commons Attribution 4.0 License.
the Creative Commons Attribution 4.0 License.
 | 16 Jul 2021
Effects of clear-fell harvesting on soil CO2, CH4, and N2O fluxes in an upland Sitka spruce stand in England
Sirwan Yamulki
Jack Forster
Georgios Xenakis
Adam Ash
Jacqui Brunt
Mike Perks
James I. L. Morison
The effect of clear-fell harvesting on soil greenhouse gas (GHG) fluxes of carbon dioxide (CO2), methane (CH4), and nitrous oxide (N2O) was assessed in a Sitka spruce forest growing on a peaty gley organo-mineral soil in northern England. Fluxes from the soil and litter layer were measured monthly by the closed chamber method and gas chromatography over 4 years in two mature stands, with one area harvested after the first year. Concurrent measurements of soil temperature and moisture helped to elucidate reasons for the changes in fluxes. In the 3 years after felling, there was a significant increase in the soil temperature, particularly between June and November (3 to 5 ∘C higher), and in soil moisture, which was 62 % higher in the felled area, and these had pronounced effects on the GHG balance in addition to the removal of the trees and their carbon input to the soil. Annual soil CO2 effluxes reduced to almost a third in the first year after felling (a drop from 24.0 to 8.9 t CO2 ha−1 yr−1) and half in the second and third year (mean 11.8 t CO2 ha−1 yr−1) compared to before felling, while those from the unfelled area were little changed. Annual effluxes of N2O more than doubled in the first two years (from 1.0 to 2.3 and 2.5 t CO2e ha−1 yr−1, respectively), although by the third year they were only 20 % higher (1.2 t CO2e ha−1 yr−1). CH4 fluxes changed from a small net uptake of −0.03 t CO2e ha−1 yr−1 before felling to a small efflux increasing over the 3 years to 0.34 t CO2e ha−1 yr−1, presumably because of the wetter soil after felling.
Soil CO2 effluxes dominated the annual net GHG emission when the three gases were compared using their global warming potential (GWP), but N2O contributed up to 20 % of this. This study showed fluxes of CO2, CH4, and N2O responded differently to clear-felling due to the significant changes in soil biotic and abiotic factors and showed large variations between years. This demonstrates the need for multi-year measurements of all GHGs to enable a robust estimate of the effect of the clear-fell phase on the GHG balance of managed forests. This is one of very few multi-year monitoring studies to assess the effect of clear-fell harvesting on soil GHG fluxes.
- Article
(3706 KB) - Full-text XML
-
Supplement
(100 KB) - BibTeX
- EndNote


The works published in this journal are distributed under the Creative Commons Attribution 4.0 License. This license does not affect the Crown copyright work, which is re-usable under the Open Government Licence (OGL). The Creative Commons Attribution 4.0 License and the OGL are interoperable and do not conflict with, reduce or limit each other.
© Crown copyright 2021
Forests cover approximately 30 % (4.03 billion ha) of the Earth's land surface and play a major role in the cycling of soil carbon and greenhouse gases (GHGs) (Le Quéré et al., 2015). Afforestation and forest management can contribute to GHG net emission mitigation aims by increasing the land-based carbon sink (Grassi et al., 2017). In the UK, 3.2 million ha or 13.2 % of the land area (Forest Research, 2020) are covered by forests, a substantial proportion of which has been planted over the last 60 to 100 years on peat and peaty gley upland soils (Smith et al., 2018). The UK government has pledged to reach “net zero” emissions of GHGs by 2050, and to contribute to this goal the Committee on Climate Change (2019) has recommended afforestation targets of more than 30 000 ha per year. Forest harvesting is an important activity as part of normal forestry practice but also for conversion to other land uses such as part of the peatland restoration programmes. Approximately 20 000 ha of trees are felled annually in Great Britain for timber and other harvested wood products (Forestry Commission, 2016).
Forest clear-fell harvesting is the phase of the forest management cycle that produces the most disturbance, and therefore it is important that it does not impair long-term productivity and benefits. Clear-felling alters (typically increases) many soil factors that influence GHG fluxes. The physical factors include: soil water content and water table height owing to the absence of evapotranspiration from trees (Zerva and Mencuccini, 2005; Wu et al., 2011; Kulmala et al., 2014; Sundqvist et al., 2014; Korkiakoski et al., 2019), soil temperature through reduced shading (Zerva and Mencuccini, 2005; Wu et al., 2011; Kulmala et al., 2014), and soil bulk density due to soil disturbance and compaction caused particularly by mechanized harvesting equipment (Yashiro et al., 2008; Mojeremane et al., 2012). Chemical factors include: soil pH (Smolander et al., 1998; Kim, 2008; Kulmala et al., 2014; Sundqvist et al., 2014) and inputs of soil N and organic C (Smolander et al., 2015; Tate et al., 2006; Hyvönen et al., 2012; Kulmala et al., 2014; Sundqvist et al., 2014) due to nutrient release from the decomposition of residual organic matter and root biomass. Interactions between these factors, particularly with the loss of plant litter input and root activity after felling, will strongly affect soil biological processes responsible for production and consumption of GHGs. They will particularly affect nitrous oxide (N2O) production from aerobic nitrification and anaerobic denitrification, methane (CH4) production by methanogenic organisms from anaerobic decomposition in oxygen-poor environments or uptake by methanotrophs through oxidation in aerated soils, and carbon dioxide (CO2) efflux during respiration and decomposition and uptake during photosynthesis. The cessation of the autotrophic respiration (Ra) component of the total soil respiration (Rt) after felling should cause a large decline in CO2 efflux as a meta-analysis of soil respiration partitioning studies reported that the ratio in temperate forest soils ranges from 20 % to 59 % (Subke et al., 2006). In addition, the death of tree roots after felling will inhibit the microbial decomposition of root exudates, reducing the CO2 effluxes further. Conversely, the increased soil temperatures following tree removal and higher nutrient availability from decomposition of litter and other plant materials such as brash may increase soil heterotrophic respiration (Rh) (Yashiro et al., 2008).
There are a wide range of results published on the effects of forest clear-felling on soil GHG fluxes. Some studies have shown CO2 effluxes were reduced (Zerva and Mencuccini, 2005; Korkiakoski et al., 2019), increased (Tate et al., 2006; Kim, 2008; Kulmala et al., 2014), or unchanged (Butnor et al., 2006; Takakai et al., 2008; Yashiro et al., 2008). According to Lavoie et al. (2013), the impact is often site specific, affected by the severity of the disturbance or removal of surface organic matter or by the length of time following harvest. Goutal et al. (2012) examined the duration of physical, chemical, and biological disturbances in the soil following mechanized harvesting of an oak forest in north-east France. Their measurements showed that soil CO2 effluxes reduced, which they attributed to an increase in the frequency and duration of anoxic conditions resulting from poor soil gas diffusion after heavy forestry traffic. Similarly, Kulmala et al. (2014) observed a slight decrease in soil CO2 efflux in the first growing season after clear-cutting of a boreal Norway spruce stand, although this was probably due to decreased tree root respiration. However, during the following 2 years, CO2 efflux at their clear-cut site was significantly higher than in their mature stand, which was attributed to increased decomposition stimulated by higher soil moisture and temperature. They observed no significant difference in CH4 uptake due to clear-cutting. However, others have shown that after harvesting, forest soils turned from a CH4 sink to a source (Zerva and Mencuccini, 2005; Sundqvist et al., 2014; Korkiakoski et al., 2019), showed reduced CH4 uptake (Bradford et al., 2000; Wu et al., 2011; Yoshiro et al., 2008), or showed increased CH4 uptake (Lavoie et al., 2013). For N2O, some studies showed increased fluxes (Zerva and Mencuccini, 2005; Yoshiro et al., 2008; Takakai et al., 2008; Ullah et al., 2009; Korkiakoski et al., 2019) or had no clear change (Tate et al., 2006; Lavoie et al., 2013).
There is therefore a wide range of observed effects, making it difficult to predict the changes in the GHG balance caused by clear-felling in any particular situation, and very few multiple-year studies exist that characterize the timescale and duration of changes post-felling. Therefore, there is an urgent need to understand and quantify with long-term measurements the effect of forest clear-felling on the GHG budget and to incorporate these into analyses for the complete forest growth cycle for the main forest systems relevant to a country or region (Skiba et al., 2012). The objective of this study was to conduct a relatively long-term (4 year) assessment of the effect of clear-fell harvesting on soil (including the litter layer) fluxes of CO2, CH4, and N2O in a spruce plantation on organo-mineral soil that is typical of many British upland forests.
2.1 Site description and study layout
The study site was in Harwood Forest (55∘13.1′ N, 2∘1′ W), Northumberland, north-east England, and comprised a forest area of approximately 4000 ha with an elevation of 200 to 400 m above sea level (Fig. 1). The regional climate is temperate oceanic with a mean annual rainfall of 1472 mm and mean air temperature of 7.5 ∘C (min. −7 and max. 26.4 ∘C), measured by an automatic weather station (AWS) mounted above the tree stand during the period from April 2015 to April 2018. The tree cover consisted predominantly of even-aged Sitka spruce (Picea sitchensis, Bong. Carr.) stands. Sitka spruce is the most common conifer in Great Britain (GB) and represents 26 % of the total forested area in GB and 51 % of the conifer area (Forest Research, 2020). The main soil type is a seasonally waterlogged organic-rich peaty gley classified as histogleysol with a peat (O Horizon) thickness varying from 15 to 40 cm (Zerva and Mencuccini, 2005), developed in clayey glacial till derived from carboniferous sediments (Pyatt, 1970).
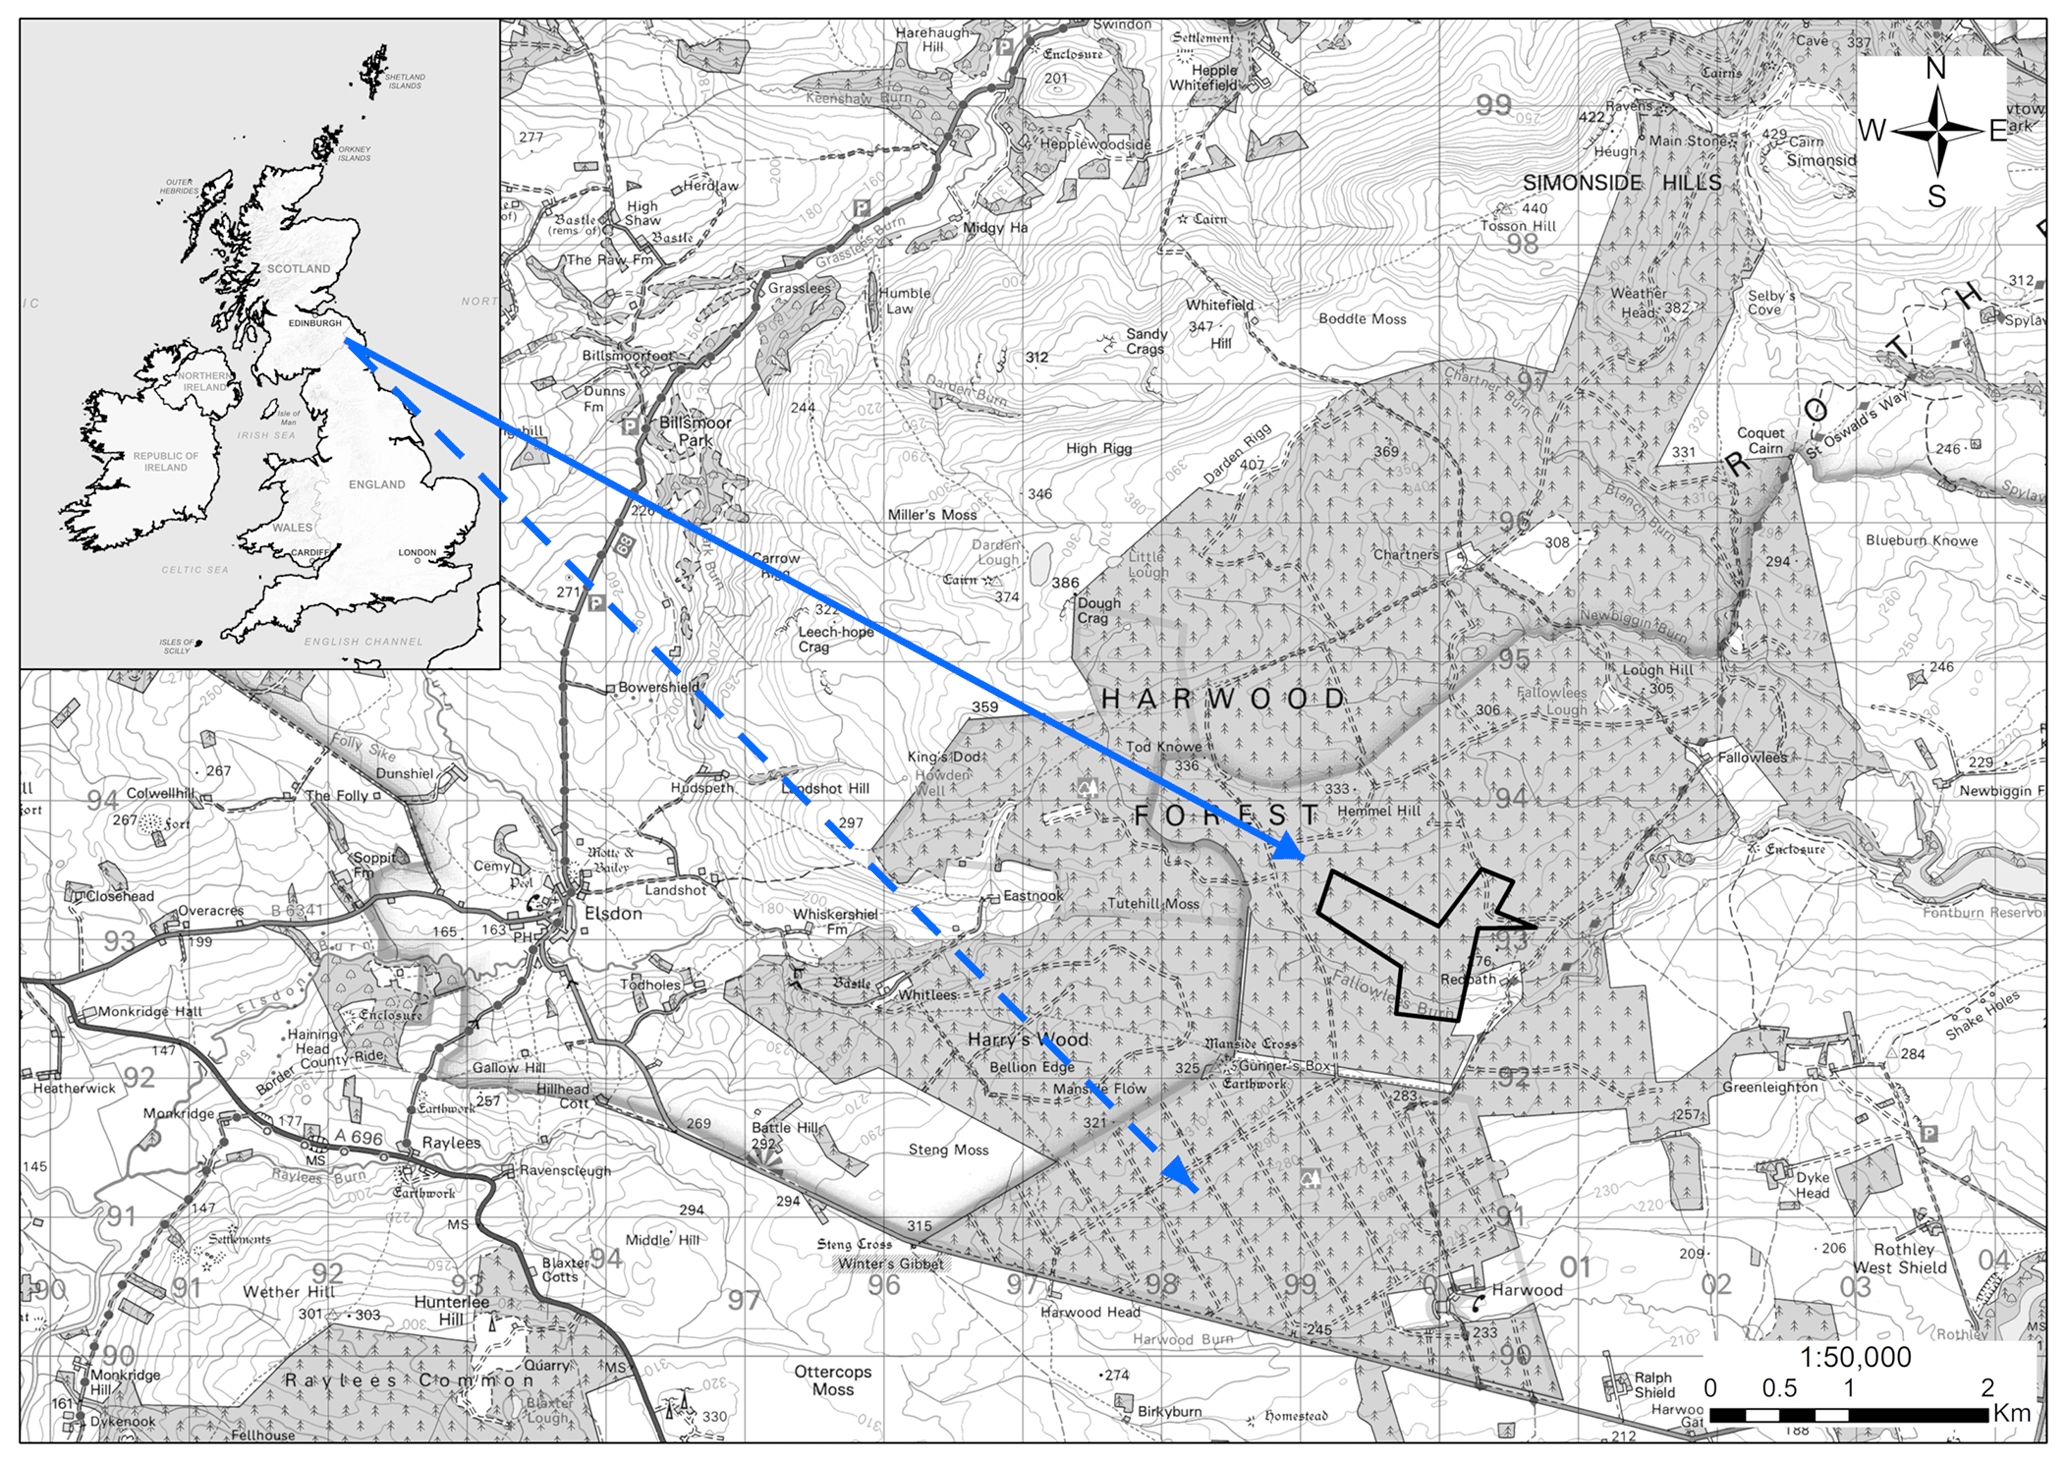
Figure 1Map of experimental areas at Harwood Forest, Northumberland, UK. The dotted arrow shows the unfelled mature spruce stand area (A) and the solid arrow shows the area that was clear-felled (outlined in black) after one year (B). Note: the map is according to © Crown copyright and database right 2021. Ordnance Survey Licence number 100021242.
For the purpose of this study, two nearby areas (A and B, 2 km apart) of mature stands within the forest with similar previous management, soil type, and elevation (280 to 290 m) were chosen to carry out measurements over 4 years between 18 February 2014 and 16 April 2018. During this period, one area (A) was left unfelled (A-year 1 to A-year 4) and the other (B) was clear-felled after one year (B-year 1 before felling and B-year 2 to B-year 4 after felling). In area A, the 40 ha stand was of second rotation, even-aged mature Sitka spruce planted in 1973, with yield class of 18 m3 ha−1 and mean tree density of 1348 trees ha−1. In area B the Sitka spruce stand was planted in 1958, with yield class of 16 m3 ha−1 and mean tree density of 1375 trees ha−1 prior to felling; the felled area covered 42 ha. Felling operations were carried out between late January and early March 2015 and followed standard practices of the Forestry Commission (Murgatroyd and Saunders, 2005). Only timber larger than 7 cm diameter was removed from site, leaving tree tops and branches on site in rows, with some used as brash-mats to prevent compaction of soil by the heavy harvesting machinery.
2.2 Gas flux measurements and analysis
Forest soil fluxes of CO2, CH4, and N2O were measured at approximately monthly intervals over the 4-year study period from the two areas of the forest. Flux measurements were made using a modified design of the manual static chamber method described by Yamulki et al. (2013). Each chamber was constructed of opaque PVC with dimensions of 40 cm × 40 cm × 25 cm height to provide a volume of 40 L and placed temporarily on permanently installed frames. The frames were inserted tightly into the ground to a depth of about 3 cm prior to the start of the measurements. The bottom of the chamber had a neoprene rubber foam gasket to ensure a gas-tight seal with the frame and the top of the chamber had a pressure vent.
Within each area, eight chambers were positioned randomly in a transect within a 100 m2 area. During each gas flux measurement, the chambers were placed on top of the frames for up to 60 min and duplicate gas samples of the chamber headspace were taken immediately after closure and then at three subsequent 20 min intervals. Gas samples were taken after the chamber was closed by connecting a polypropylene syringe to a chamber sampling port fitted with a three-way stopcock. The syringes were immediately used to fill (under atmospheric pressure) pre-evacuated 20 mL vials fitted with chlorobutyl rubber septa. Concentrations of CO2, CH4, and N2O were determined within a week using a headspace sampler (TurboMatrix 110) and gas chromatograph (GC; Clarus 500, PerkinElmer) equipped with an electron capture detector (ECD) for N2O analysis, a flame ionization detector (FID) for CH4 analysis, and a catalytic reactor (methanizer) for CO2 analysis by reducing CO2 to CH4 before analysis by the FID detector. The repeatability of the GC gas analysis (assessed as 3× the standard deviation of 20 repeated measurements of standard CO2, CH4, and N2O concentrations at ambient levels) was better than 4 % for all gases.
Gas fluxes were calculated based on linear increases of gas concentrations inside the chambers with time. For CO2, however, if the concentration increase was not linear then fluxes were determined using the R HMR package (version 1.0.1) to plot a best-fit line to the data (Pedersen, 2020) to correct for the non-linearity. We did not apply the HMR model for CH4 and N2O fluxes as the non-linear fitting plot is very sensitive to variability and outliers in the measured GHG concentrations, particularly for low fluxes and with only four data points per chamber (as also noted by Pihlatie et al., 2013; Brümmer et al., 2017; Korkiakoski et al., 2017), which results in large apparent “spikes”, failure to calculate the fluxes on many occasions, and likely overestimation of calculated GHG fluxes (Pavelka et al., 2018). If CO2 concentration changes with time were not significant, fluxes for all gases were rejected for that sample as this was judged to be indicative of gas leakage within the chamber headspace. Overall 18 samples were rejected, nine of which were during a snowfall period in January 2016.
Although most studies now measure soil CO2 fluxes with infrared gas analyser systems (IRGAs; as noted by Yashiro et al., 2008), which is viewed as more accurate than gas sampling and GC analysis, we needed to use the GC method to measure all three GHGs within the logistical constraints of the experiment. Therefore, to give further assurance in the gas flux calculations, CO2 effluxes were compared with those from another 25 static chambers (20 cm diameter, 4.2 L volume, LI-8100-103 Survey Chamber, Li-Cor Inc., Lincoln, Nebraska, USA) measured in situ in both areas by a closed loop IRGA (LI8100A, Li-Cor Inc.), each over a 2 min duration after chamber closure (Xenakis et al., 2021). These chambers were positioned over a much wider area than the GC chambers to characterize spatial variation, and effluxes were measured for 3 years but only after felling from February 2015. The results (Fig. S1 in the Supplement) showed a mean flux difference over the 3-year period of only 6.8 % higher by the IRGA method in the unfelled area and 19.5 % higher in the felled area compared with the fluxes measured by GC. These are relatively small differences between the two methods when considering the higher site heterogeneity in the felled area, the inherent differences in the analytical methodologies, and that the vegetation in the IRGA chambers was not cut as it was in the GC chambers.
There was no understorey vegetation in the forest stands and no visual evidence of vegetation growth within the chambers in the first 2 years of the study; the chamber ground surfaces were covered by dense Sitka spruce needle litter. However, in the third year there was growth of Juncus sp. in one chamber in the felled area B between May and September 2016 (maximum height was 40 cm before cutting but the total volume was <5 % of the chamber volume), so the Juncus was cut continually thereafter. The effect of the vegetation cut on the fluxes was assessed from the flux measurements in all eight chambers before and directly after the first cutting. The statistical analysis revealed no significant differences between mean chamber fluxes before and after cutting for all gases, indicating that variations between the chamber fluxes were greater than that due to cutting. In the third and fourth years there was a proliferation of moss in two of the chambers in area A. This could not be removed without substantial disturbance of the soil surface; comparison of chambers with and without moss showed no significant differences between mean fluxes. For CO2, the effluxes measured will therefore be from aerobic and anaerobic decomposition processes and respiration of soil organisms and roots.
2.3 Soil moisture and temperature measurements
During each flux sampling day, soil temperatures (∘C) at 2 and 10 cm depths were recorded from one point around each chamber and volumetric moisture content (m3 m−3) at 6 cm depth was recorded from three points around each chamber. Soil temperature was recorded by a digital temperature probe (Hanna model Checktemp 1) and the volumetric moisture content by a moisture sensor (SM 200 attached to a handheld HH2 moisture meter, Delta-T Devices Ltd, Cambridge, UK). The sensitivity of CO2 efflux to temperature was determined with a Q10 function (Shi and Jin, 2016), which is the proportional change in respiration resulting from a 10 ∘C increase in temperature, derived from mean daily values of CO2 efflux for each year using the equation
where b is the slope of the exponential relationship between soil CO2 effluxes and soil temperature at 2 cm depth, estimated from a log-linear fit. The apparent Q10 values were calculated from the temperature measured near the soil surface (at 2 cm) as recommended by Pavelka et al. (2007), because the strength of the CO2 efflux and temperature relationship decreases with soil depth.
2.4 Soil parameters and root biomass measurements
To assess changes in soil characteristics due to the felling, additional soil parameters that were likely to have an impact on GHG fluxes were measured between 21 and 23 July 2015, approximately 5 months after the end of felling. Three replicated soil samples were taken from 0–20 cm depth below the litter layer around each chamber at each site for bulk density, pH, total C content, and total N content. Soil pH was measured by mixing 5 g soil samples with 25 mL H2O with the analysis performed using a pH meter probe (Sentek). Soil C and N stocks were measured by the flash combustion method in an NC soil analyser (Flash EA, series 1112, Thermo Scientific). Soil bulk density was measured as the mass of oven-dried (at 105 ∘C until constant weight) soil samples divided by the volume of the cores taken. Live and dead fine root biomass, length, and diameter were measured from three replicated samples taken from 0–15 cm depth below the litter layer around each chamber in each site. As soil parameters were only measured on one occasion of post-felling, the differences between areas could be due to the sites rather than the felling.
2.5 Statistical analysis
Statistical analyses were made using statistical software R (version 3.5.2; R Core Team, 2020). Data were analysed separately for pre-felling and post-felling periods. As measurements were taken from the same eight chambers through time, the analysis was conducted as a repeated measures design, with the significance of felling and non-felling differences determined against the individual chamber data (n=16), not against individual observations. A linear and non-linear mixed-effects model (nlme; Pinheiro et al., 2018) was used to structure and analyse the data for all flux data. Where necessary, flux data were transformed to obtain a normal distribution. Management type (i.e. felled or unfelled), temperature at 2 and 10 cm, soil moisture (plus all two-way interactions), and date (plus interaction with management type) were treated as fixed effects. Chambers were treated as a random effect (for the repeated measures design). For post-felling data, residual analysis indicated that the variance was larger for chambers in the felled area and by individual chamber; therefore, weighted variance structures were incorporated within the mixed effects models to account for within-type and within-chamber heterogeneity.
A range of autoregressive moving average (corARMA; Pinheiro et al, 2018) models were applied to each model to account for temporal autocorrelation within chambers. Analysis of the (partial) autocorrelation function indicated potential temporal autocorrelation up to one previous time point; therefore, all combinations of corARMA structure (up to one previous time point) were applied and the best-fit model determined using Akaike's information criteria (AIC; R Core Team, 2020) applied to the maximum likelihood fits across each of the gas fluxes separately. The significance of the fixed effects were subsequently determined using analysis of deviance (ANOVA chi-square tests; Fox and Weisberg, 2011) with non-significant interactions and effects (p>0.05) removed from the final models.
Annual cumulative fluxes of CH4, N2O, and CO2 were estimated to assess the inter-annual variations in each area. Within each year, median flux values were calculated across the eight replicate chambers, along with lower and upper quartiles and maximum and minimum values. These values were then accumulated across the year by taking the mean of two consecutive flux values and multiplying it by the number of days between the measurements and summing over the monitoring period every 12 months (as indicated in Table S1 in the Supplement) and adjusting to 365 d. For year 1, where the felling interrupted the measurement in area B, the same cumulative time period was taken for both areas. Annual cumulative fluxes were converted into CO2 equivalent (CO2e) using the global warning potential (GWP) for a 100-year time horizon of 34 for CH4 and 298 for N2O (IPCC, 2013).
3.1 Soil temperature and moisture
Over the 4 years, soil temperature measured during gas sampling varied between 0.1 and 26.0 ∘C (mean 9.7 ∘C) at 2 cm soil depth (Fig. 2a) and 1.3 and 15.5 ∘C (mean 8.3 ∘C) at 10 cm depth (data not shown), although soil temperatures were never above 15 ∘C under the trees in area A. Before felling in year 1, there were only small differences (p<0.001) in mean soil temperature between areas A and B (7.1 and 8.5 ∘C, respectively) at 2 cm soil depth and at 10 cm soil depth (7.1 and 7.9 ∘C) (Table 1), probably caused by sampling the area B later in the day than A. Due to removal of the tree cover, the mean soil temperature increased in the felled area at 2 cm soil depth to a mean of 14.3 ∘C compared to 9.2 ∘C in the unfelled area (p<0.001) and at 10 cm depth to a mean of 10.2 ∘C compared to 8.4 ∘C. In the following two years, the soil temperature remained higher in the felled area by up to 3.4 ∘C compared to area A at 2 cm depth (1.6 ∘C at 10 cm) and was on average 2 ∘C higher than before felling (there was no change in the mean soil temperature in A).
Table 1Annual mean of eight replicate measurements (± SE) of soil temperatures at 2 and 10 cm depths and moisture at 6 cm depth measured close to the soil GHG flux chambers in area A (mature spruce stand, remaining) and area B (mature spruce stand, clear-felled after year 1) in Harwood Forest. Significance p values are all <0.01.
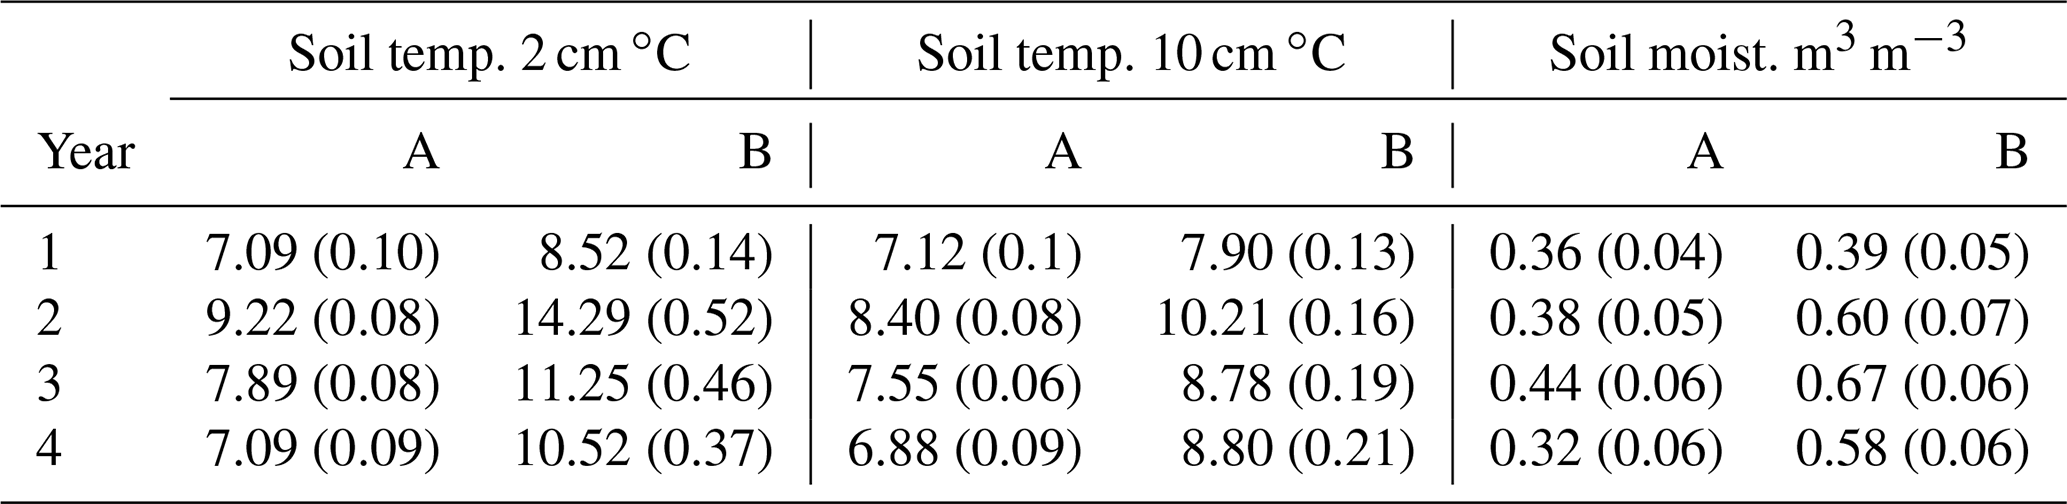
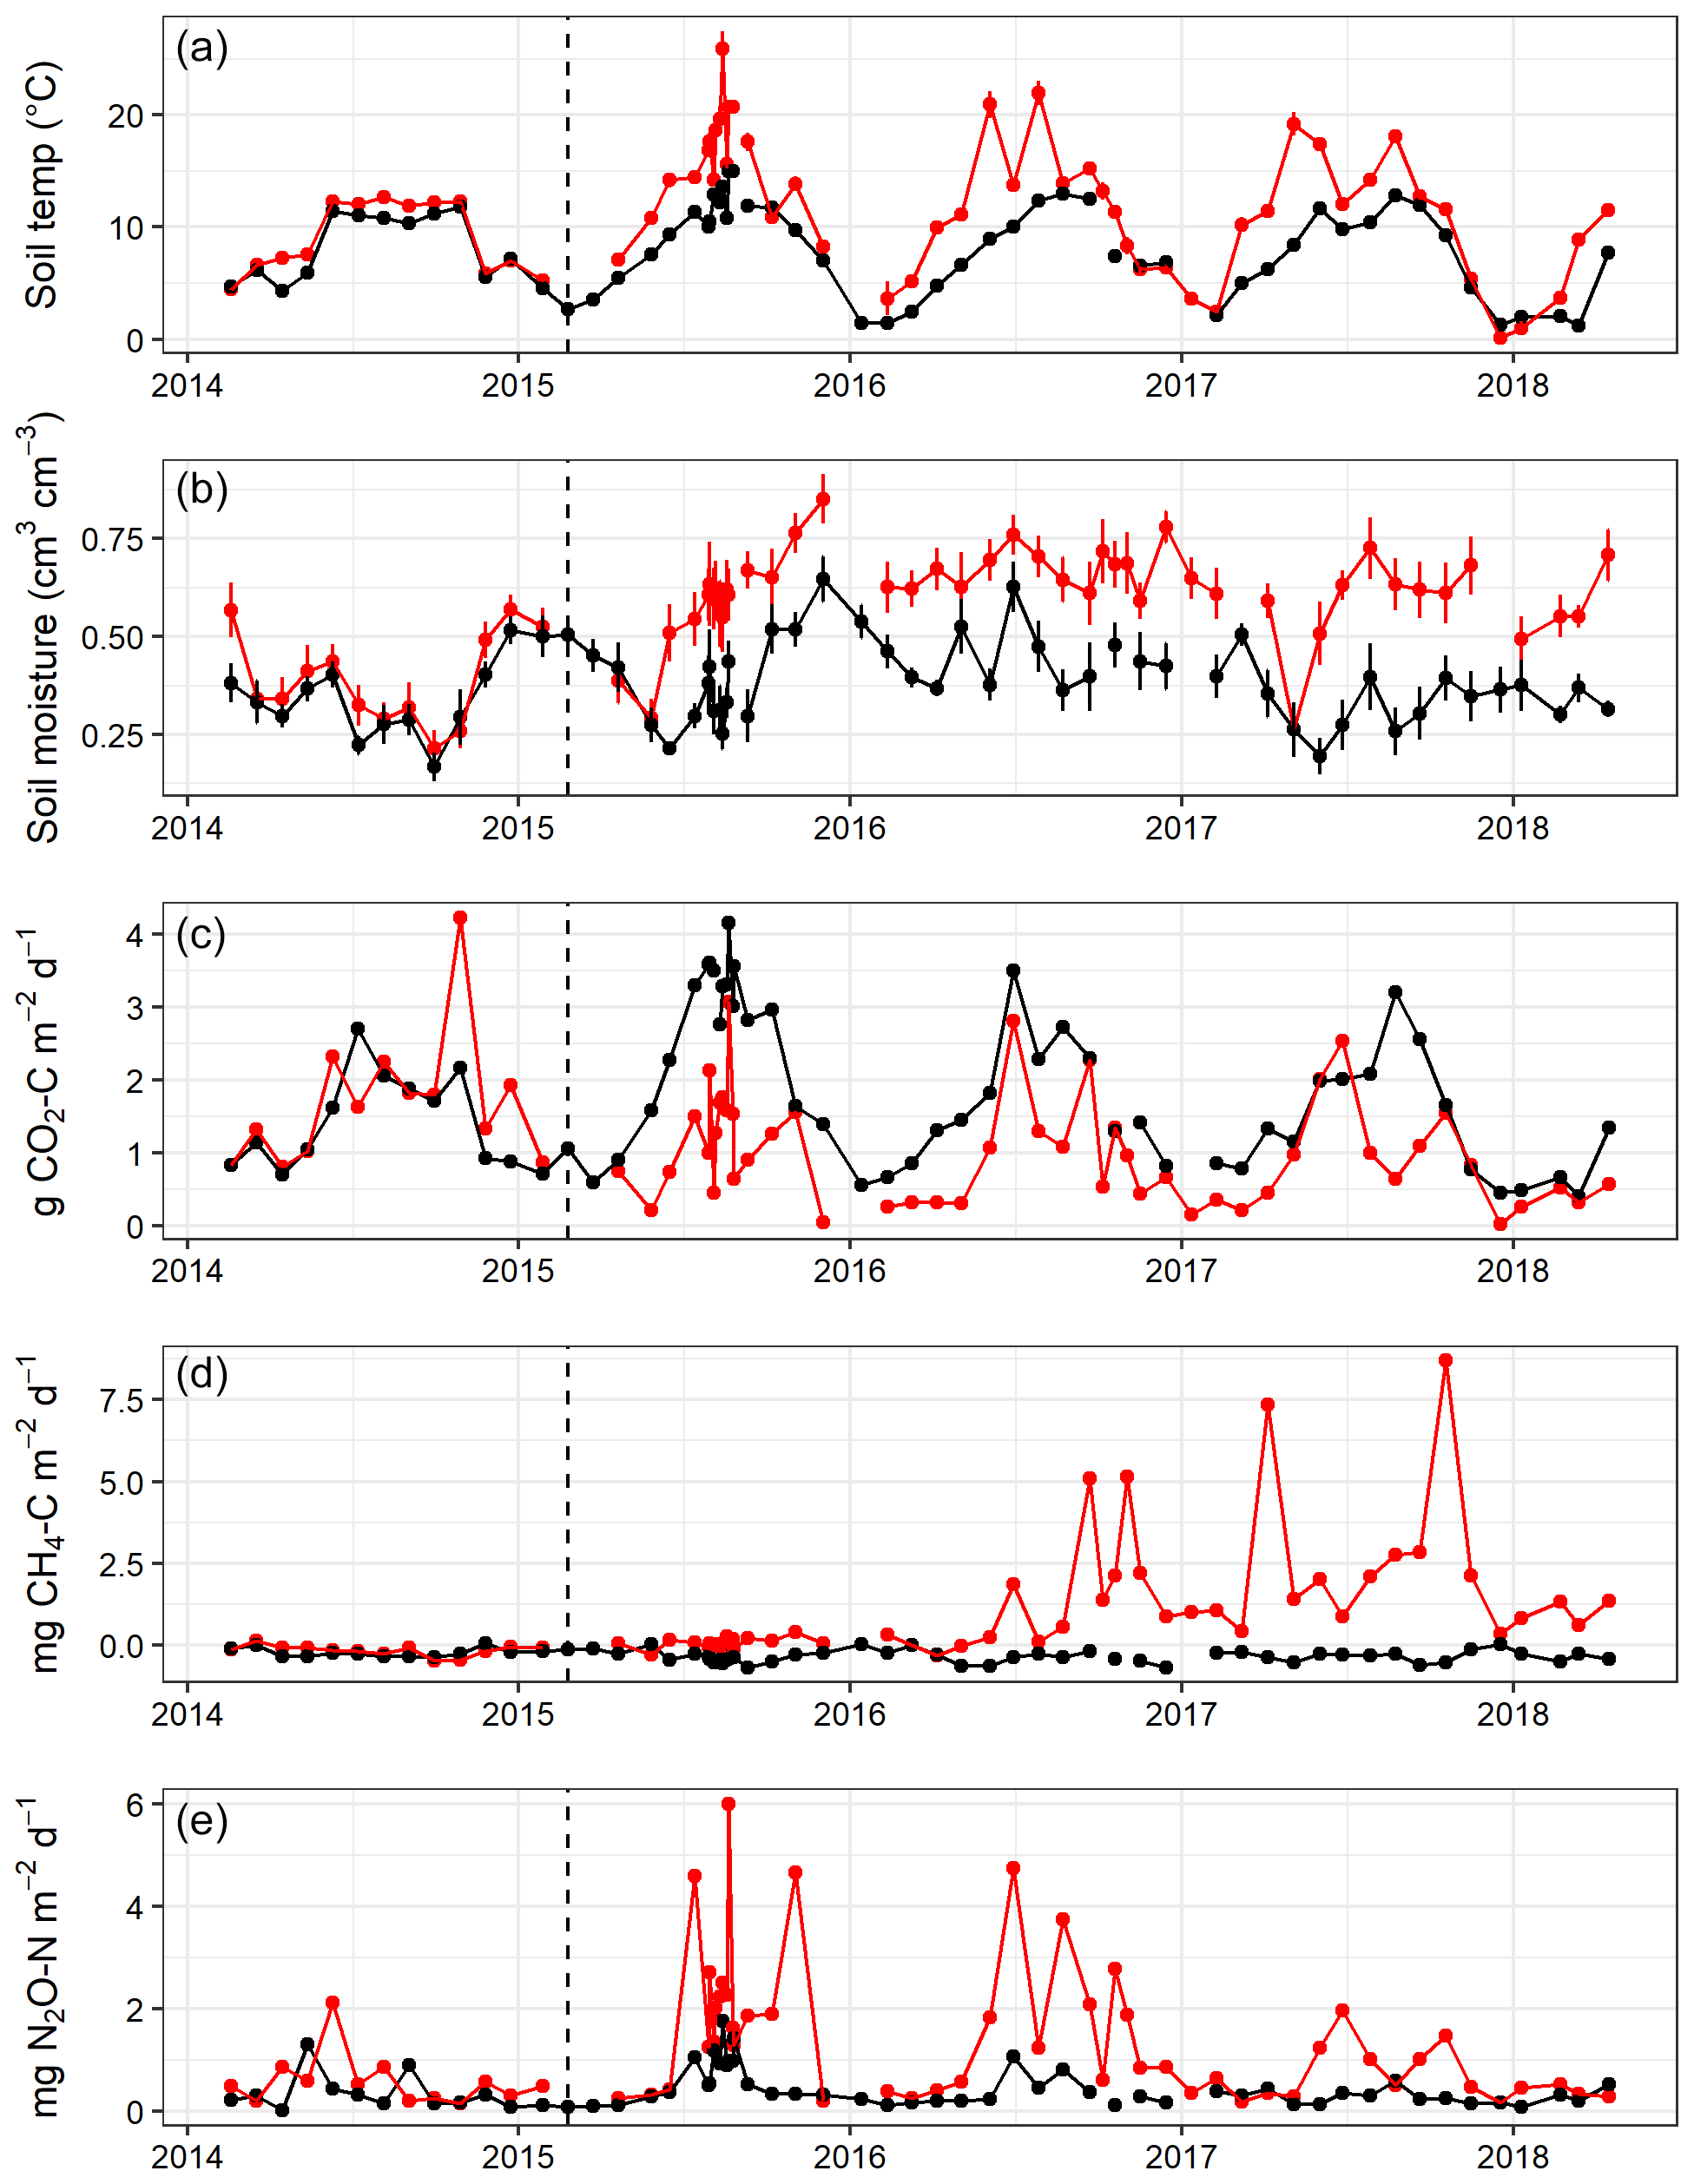
Figure 2Mean soil temperature (∘C) at 2 cm depth (a), volumetric soil moisture content (cm3 cm−3) (b), and median soil CO2 (c), CH4 (d), and N2O (e) fluxes measured from eight chambers per area approximately monthly throughout the experiment in Harwood Forest. Black symbols and lines are for area A (mature spruce stand, remaining) and red are for area B, (mature spruce stand, clear-felled after one year) as indicated by the dotted vertical line. Error bars are standard error of mean of eight replicate measurements of the soil temperatures and moisture.
No significant differences in soil moisture content (by volume) were observed between the two areas before felling with a mean of 0.36 in area A and 0.39 m3 m−3 in B in year 1 (Fig. 2b and Table 1). However, after felling the soil moisture content was significantly higher in the felled area than the unfelled (mean 0.62 m3 m−3 compared with 0.38 m3 m−3; p<0.001), due to the reduced evapotranspiration after tree removal (Xenakis et al., 2021). In both areas, there was a pronounced seasonal variation in soil moisture in the year before felling (2014) and in the first few months of 2015, with higher moisture in winter months than in summer, but this pattern was not clear thereafter because the rainfall was more evenly distributed during the last 2 years of this study (Fig. 3).
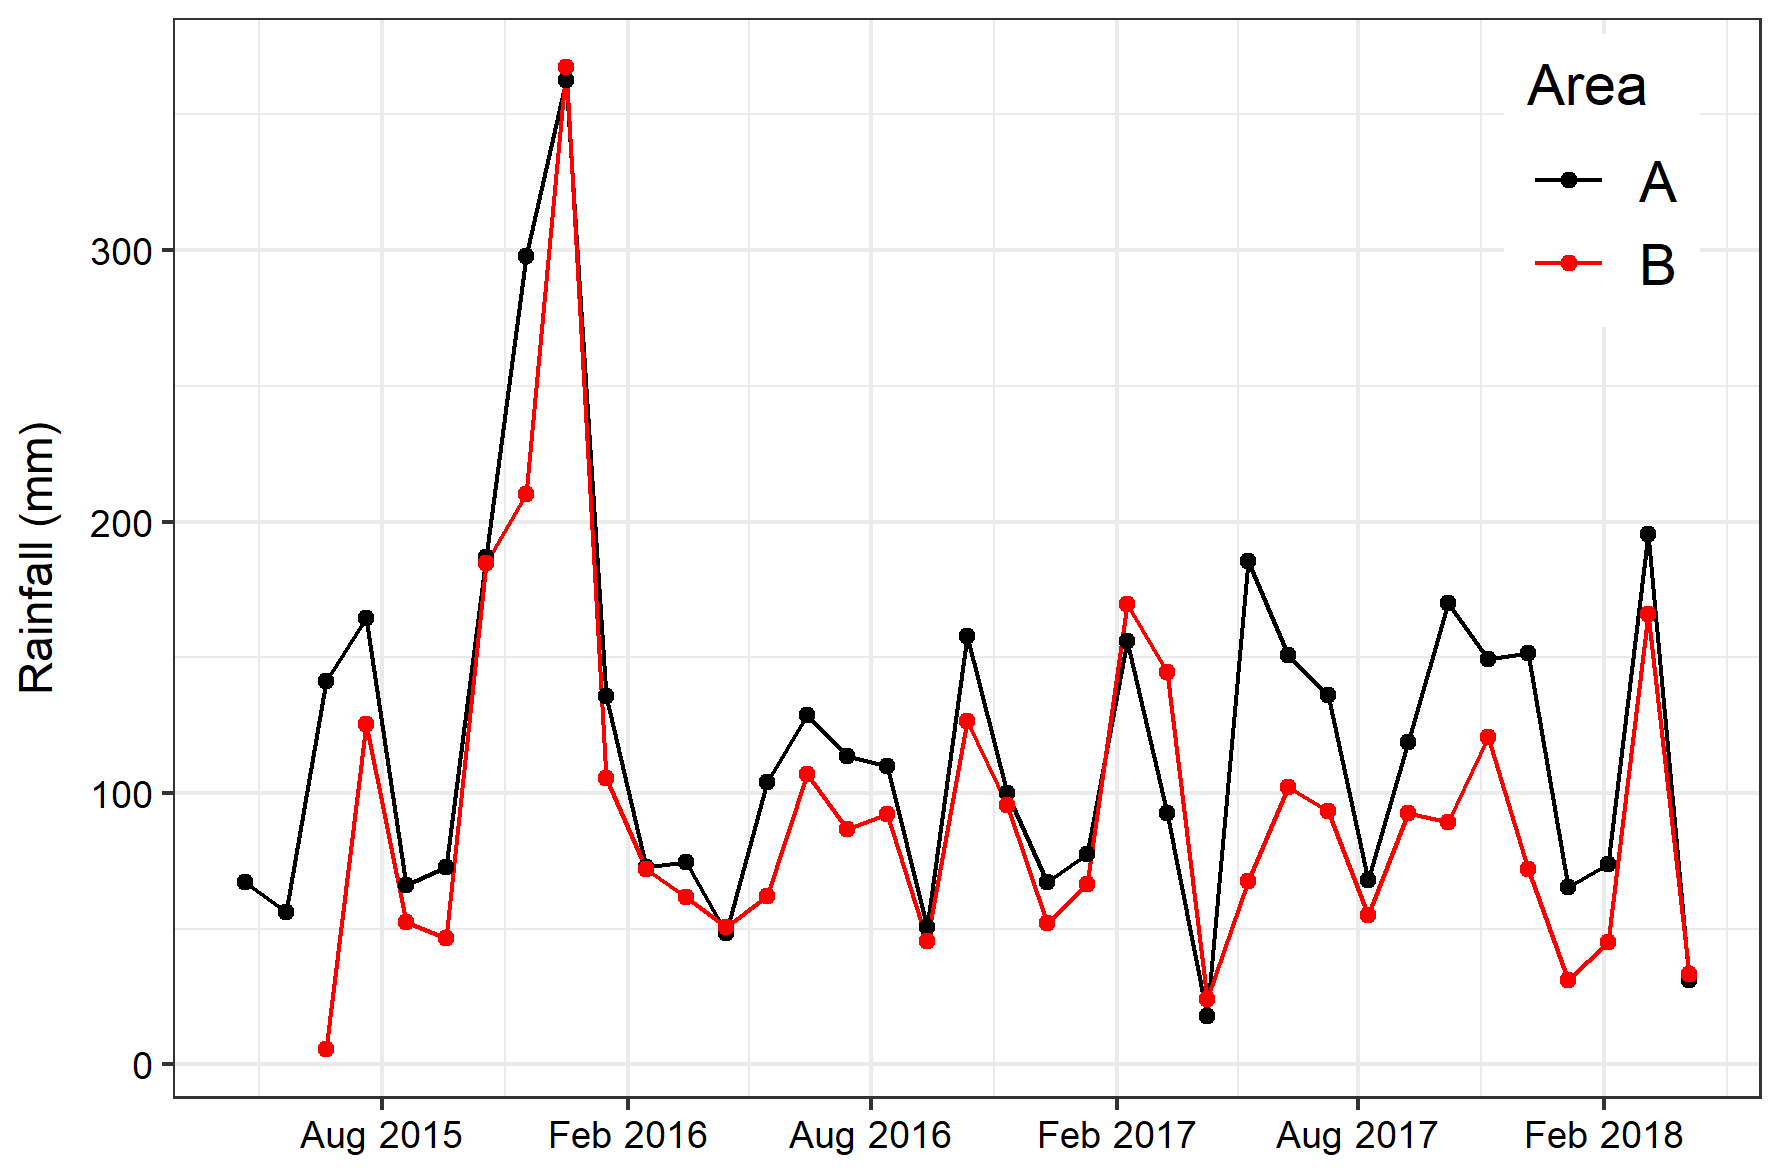
Figure 3Monthly total rainfall measured after felling in each area in Harwood Forest atop the 30 m tower in the mature spruce stand (area A; black) and on the ground in the clear-fell site (area B; red). Measurements only started in area B in June 2015.
3.2 Soil parameters and root biomass measurements
Soil parameters for the 0–15 cm layer measured 5 months after felling in year 2 showed no significant differences between the unfelled and felled areas in mean soil pH (3.6 and 3.8, respectively) and soil total N content (1.8 % and 1.95 %), but the mean soil total C content was about 17 % lower (p<0.001) in the felled area (52.0 % and 43.3 %). The soil bulk density was significantly (p<0.001) higher at 0.30 g cm−3 in the felled area compared with 0.22 g cm−3 in the unfelled, but both values are typical for peaty gley soils (Vanguelova et al., 2013). The higher bulk density and lower C content could be an effect of felling, although as no pre-felling measurements were taken it may be because of site differences. Mean fine (<2 mm) live root mass was much lower in the felled area, as expected (1.6 t ha−1 compared with 4.9 t ha−1), but the difference was smaller for the mean fine dead root mass (0.35 and 0.53 t ha−1, respectively), probably due to partial or complete decomposition during the 5 months after felling prior to the measurements.
3.3 GHG fluxes
Large variations were observed in the fluxes between the eight replicate chambers after felling with some high outliers, particularly for CH4 (Fig. 2c–e). Therefore, to reduce bias in the annual budget estimates of CO2, CH4, and N2O fluxes and enable a robust comparison between annual fluxes before and after felling, the annual and cumulative fluxes were based on the median of the replicate chambers as described in the statistical analysis section.
3.3.1 CO2 effluxes
In the first year before felling, there were no significant differences in soil CO2 effluxes between areas A and B (median 1.54 and 1.75 g CO2-C m−2 d−1, respectively; Fig. 2c). In the following 3 years after felling, CO2 effluxes became significantly (p<0.001; Table 2) lower in the felled area (median 1.10, 0.90, and 0.92 g CO2-C m−2 d−1 in year 2, 3, and 4, respectively) than in the unfelled area (2.44, 1.69, and 1.44 g CO2-C m−2 d−1). There was a clear seasonal variation in the CO2 effluxes at both areas, which as expected followed that of soil temperature with maximum effluxes during June to September.
Table 2Results from the analysis of deviance (chi-square tests) showing the probability (p) values for the effects of the explanatory factors and variables: felling, soil temperature (at two depths 2 and 10 cm), volumetric soil moisture measurement date, and their interactions (as fixed effects) on soil CO2, CH4, and N2O fluxes in Harwood Forest. Note: p<0.05 is deemed significant; pre-felling denotes the comparison between area A (mature spruce stand remaining) and area B (before clear-felling) in year 1; post-felling denotes comparisons between the areas for year 2 to 4.
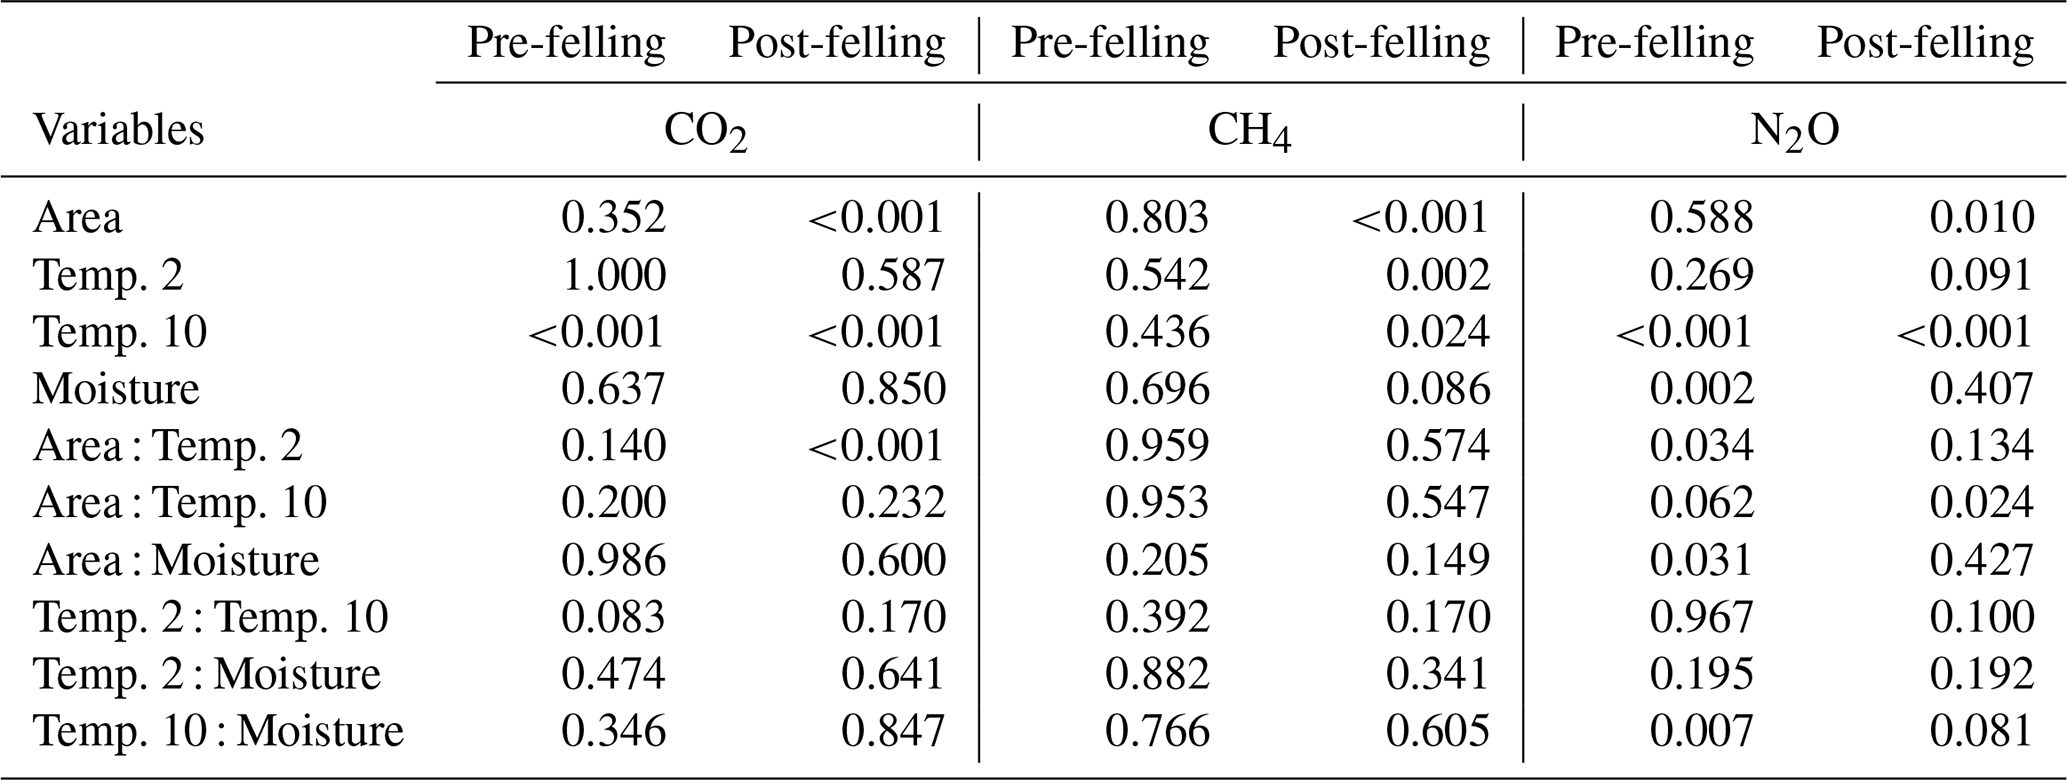
There was no significant correlation between CO2 effluxes and soil moisture, in part because in the felled area the moisture was high most of the time (Fig. 2b), although low CO2 effluxes were generally associated with high soil moisture (and lower temperatures) in the winter and the highest effluxes were observed during low soil moisture periods in the warmer temperatures of the summer, particularly in the unfelled area. CO2 effluxes increased (p≤0.002) with soil temperature at the 2 and 10 cm depths at both areas, which was best described by exponential correlation relationships as shown in Fig. 4 for the periods before and after felling. Before felling, the CO2 efflux response to soil temperature was not significantly different between area A and B, with comparable Q10 values (3.77 and 3.16, respectively; Table 3). However, in the years after felling, the Q10 values became much lower in the felled area B (mean Q10 = 2.7) than in the unfelled area A (mean Q10 = 4.23) with the lowest Q10 value of 2.1 in year 3.
Table 3Annual apparent Q10 values for soil CO2 effluxes in area A (mature spruce stand, remaining) and area B (mature spruce stand, clear-felled after year 1) in Harwood Forest during the study period (as defined in Table S1 in the Supplement).
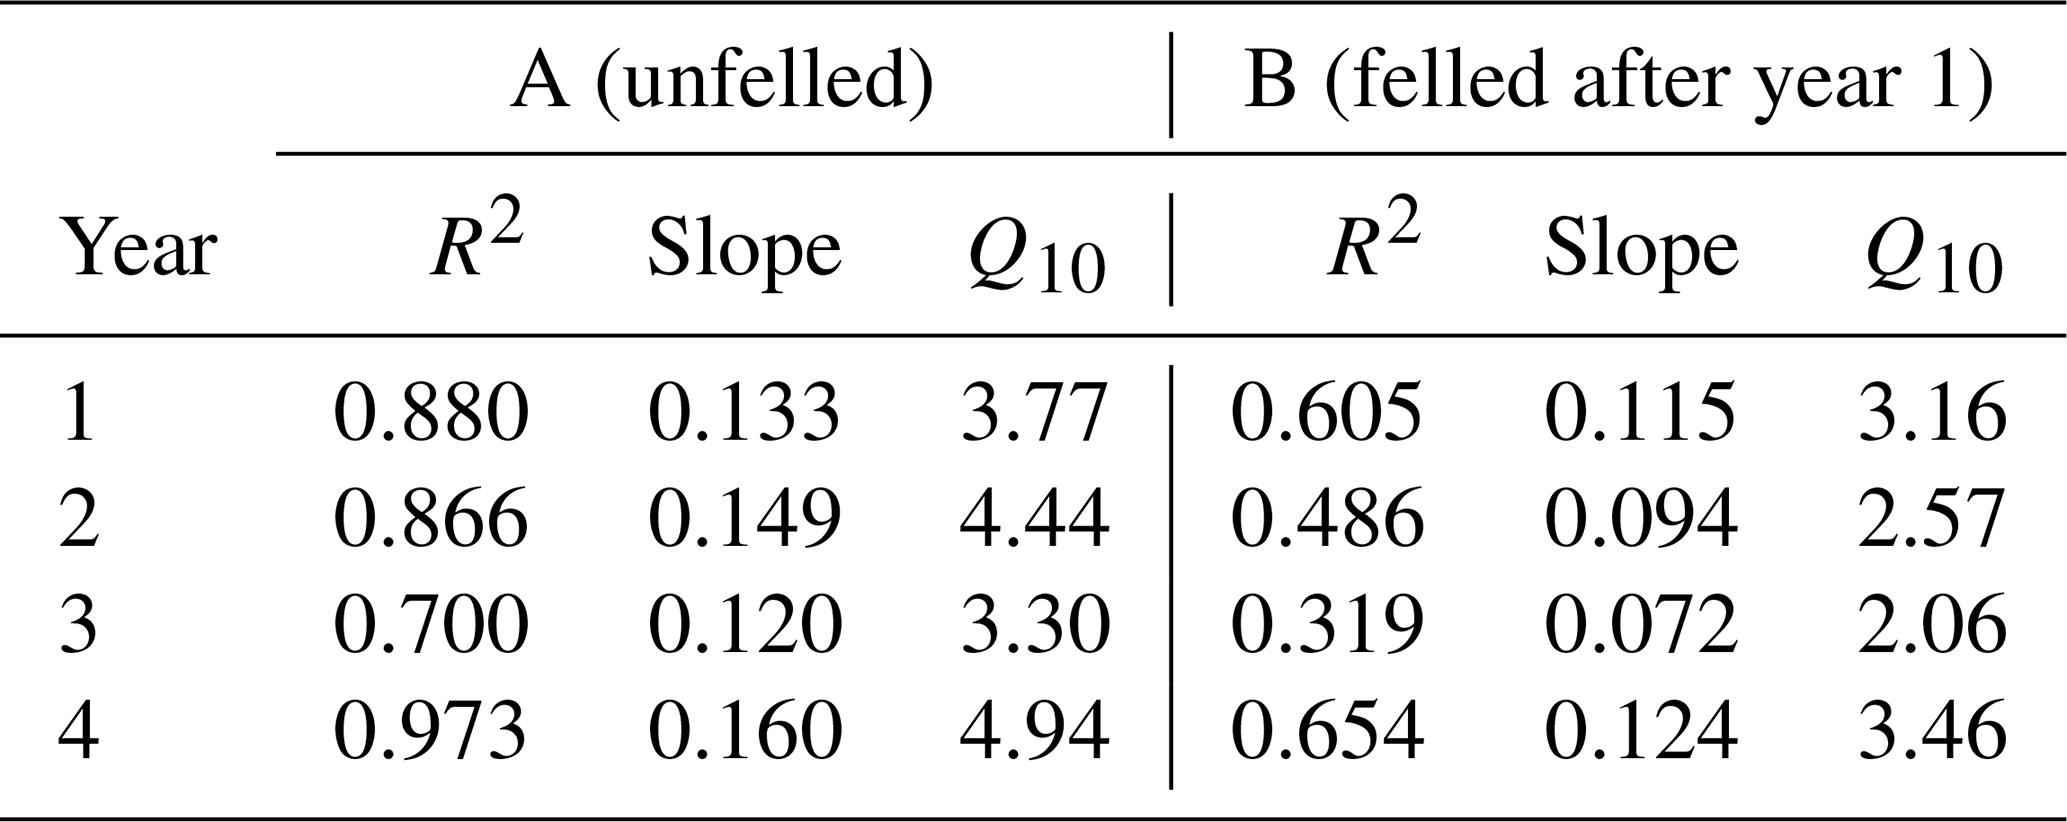

Figure 4Exponential relationship between soil CO2 effluxes and soil temperature at 2 cm depth measured from area A (mature spruce stand; black) and area B (clear-fell site; red) before (dashed lines; year 1) and after (solid lines; years 2–4) felling. Equations and R2 for fitted lines shown.
The annual cumulative CO2 effluxes from the felled and unfelled areas were not significantly different before felling with large overlap between the 95 % confidence intervals (Fig. 5a), and the annual CO2 effluxes were 19.8 and 24.0 t CO2e ha−1 yr−1 in areas A and B, respectively (Table 4). After felling, however, there was a clear divergence in the effluxes between the areas, with the CO2 efflux dropping sharply in the felled area (B). In the first year after felling, the annual CO2 efflux reduced to its minimum value of 8.9 compared with 23.0 t CO2e ha−1 yr−1 from the unfelled area A. In years 3 and 4 the annual effluxes in the felled area increased gradually to 11.3 and 12.2 t CO2e ha−1 yr−1, respectively, but was still lower than the unfelled area (20.3 and 18.4 t CO2e ha−1 yr−1).
Table 4Annual soil GHG fluxes expressed as CO2 equivalents (t CO2e ha−1 yr−1) using the IPCC global warming potential value for each gas in area A (mature spruce stand, remaining) and area B (mature spruce stand, clear-felled after year 1) in Harwood Forest. Values in brackets are the % contribution to total CO2 equivalent.
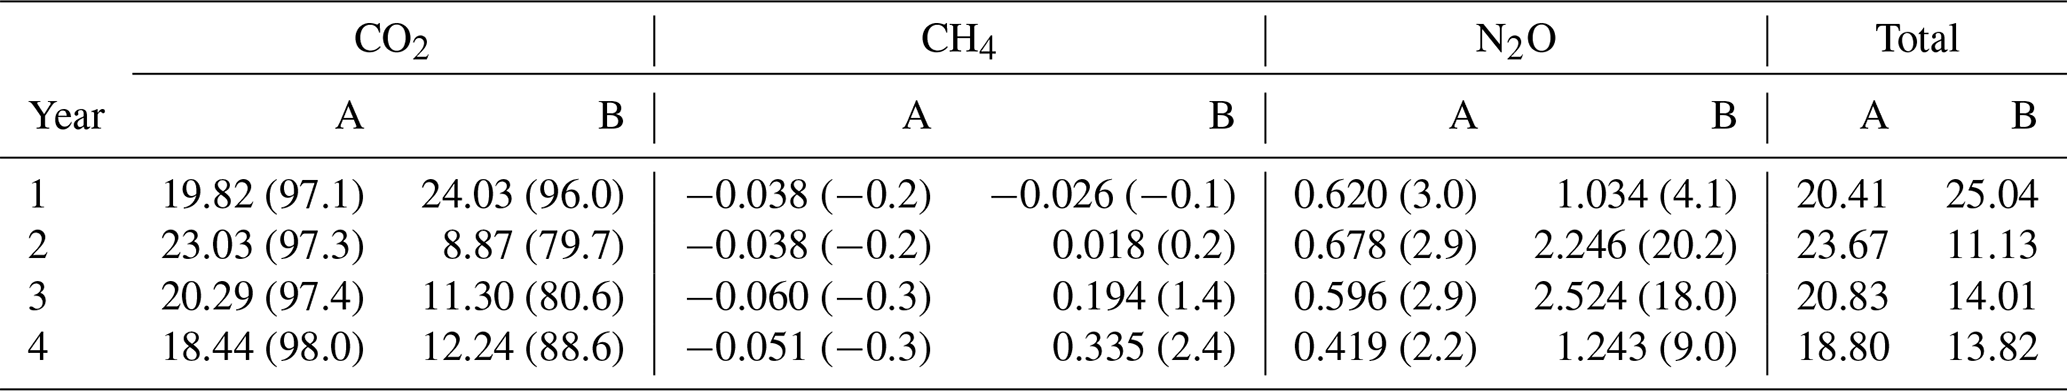

Figure 5Cumulative soil fluxes of CO2 (a), CH4 (b), and N2O (c) in Harwood Forest from area A (black; mature spruce stand, remaining) and area B (red; mature spruce stand, clear-felled after year 1) during each year, calculated from median fluxes of eight replicated chambers. Ribbons are the estimated 95 % confidence intervals.
3.3.2 CH4 fluxes
Soil fluxes of CH4 in both areas of the forest were generally low throughout the study period, particularly before felling with no significant differences (Fig. 2d). Fluxes were predominantly negative (i.e. removal from the atmosphere) in unfelled area A and before felling in area B with a median flux of −0.33 and −0.21 mg CH4-C m−2 d−1, respectively. After felling, area B became a significant (p<0.001) source of CH4 and fluxes increased rapidly in the following 2 years to its maximum in year 4 (2.48 mg CH4-C m−2 d−1) compared to the unfelled area, which remained unchanged with a small CH4 sink (−0.33 mg CH4-C m−2 d−1).
Fluxes of CH4 varied more between the flux chambers after felling particularly in year 3 and 4 (Fig. 5b). Although both soil moisture and CH4 fluxes increased in the felled area after felling, the increased fluxes and the variation between chambers cannot directly be related to the soil moisture as no significant overall correlation was observed. In addition, including interactions between soil moisture and temperature in the statistical model did not better explain the variation in CH4 fluxes and difference between areas (Table 2). However, the analysis showed that CH4 fluxes after felling were best explained by the soil temperature (negative association) at both the 2 cm and 10 cm depths.
Annual fluxes (expressed as CO2 equivalents using the global warming potential) of CH4 in the first period before felling were −0.038 and −0.026 t CO2e ha−1 yr−1 from areas A and B, respectively (Table 4). In the following years, the felled area (B) became a consistent source of CH4 with 0.018, 0.194, and 0.335 t CO2e ha−1 yr−1 in year 2, 3 and 4, respectively. In contrast, the unfelled area (A) remained a small CH4 sink with a mean flux value of −0.050 t CO2e ha−1 yr−1.
3.3.3 N2O fluxes
There were no significant differences in N2O fluxes between the two areas before felling (Fig. 2e), although the median flux was higher in B (0.33 and 0.55 mg N2O-N m−2 d−1 for A and B, respectively). Maximum N2O fluxes of 1.30 and 2.12 mg N2O-N m−2 d−1 were measured from area A and B, respectively, between May and June 2014. After felling, N2O fluxes in the felled area B became significantly (p=0.01) higher in year 2, 3, and 4 (median 1.83, 1.45, and 0.72 mg N2O-N m−2 d−1) than in the unfelled area A (0.63, 0.39, and 0.28 mg N2O-N m−2 d−1) with a maximum flux of 6.01 mg N2O-N m−2 d−1 measured in the first year after felling in August 2015.
There were no significant correlations between N2O fluxes and soil temperature before felling. However, after felling, N2O fluxes showed a seasonal pattern that followed (p<0.001) that of soil temperature at both depths in both areas with maximum fluxes during periods from June to October. Soil moisture and its interactions with soil temperature (at 10 cm) were the main driver for N2O fluxes before felling (p=0.002 and p=0.007, respectively). After felling, however, the soil moisture remained high (Fig. 2b) and no direct effect on N2O fluxes was observed. This could be due to the significant (p<0.01) negative correlation between soil temperature (at both depths) and moisture before felling, compared with after felling where the seasonal pattern in soil moisture was less clear (Figs. 2b and 3) and no significant correlation occurred, so that the soil temperature became the main driver of N2O fluxes.
There was a large variation between chambers in N2O fluxes throughout the study period in both areas of the forest (evident in the confidence intervals shown in Fig. 5c). Before felling, N2O annual fluxes (expressed as CO2 equivalents) were 0.62 and 1.03 t CO2e ha−1 yr−1 in areas A and B, respectively (Table 4), a much smaller contribution to the total GWP than the CO2 effluxes. After felling, the annual fluxes of N2O increased and the highest annual fluxes were measured from the felled area in the two consecutive years after felling with 2.25 and 2.52 t CO2e ha−1 yr−1 in year 2 and 3, respectively. However, at the end of the monitoring period in year 4, the annual flux of N2O returned to a rate similar to that before felling (1.24 t CO2e ha−1 yr−1).
4.1 Effect of felling on CO2 effluxes
Felling and removal of the trees reduced soil CO2 effluxes by 55 %, comparing the mean over the 3 years post-felling with the pre-felling value, or 47 %, comparing the clear-felled with the mature stand (Table 4). Presumably this was a consequence of the reduction in autotrophic root and rhizosphere respiration (e.g. Boone et al., 1998; Takakai et al., 2008), and measurements about 5 months after felling showed a reduction from 4.9 to 1.6 t ha−1 in the live fine root mass (i.e. diameter <2 mm). Living fine roots and their associated mycorrhizae can contribute up to 59 % of total respiration (Ewel et al., 1987; Irvine and Law, 2002; Subke et al., 2006), and for similar spruce stands in Harwood Forest about 40 % contribution has been estimated previously (Zerva and Mencuccini, 2005). However, CO2 effluxes might also increase directly after felling due to an increase in decomposition of fine roots and associated ectomycorrhizal biomass and litter. Therefore, the net CO2 efflux will be determined by the balance between the reduction in autotrophic root and rhizosphere respiration and the increased decomposition (Köster et al., 2014), which can be short-lived depending on environmental factors such as soil temperature and moisture (Davidson et al., 1998; Skopp et al., 1990).
Before felling and in the unfelled stand, CO2 effluxes showed a strong seasonal pattern that followed that of soil temperature with higher effluxes during summer, as expected, when fine root density and plant growth activity are highest. The apparent Q10 maximum values of these CO2 effluxes (Table 3) were at the higher end of those reported from temperate deciduous forests in the UK (1.60 to 3.92; Yamulki and Morison, 2017 and 2.2; Fenn et al., 2010). The response of CO2 efflux to temperature became weaker after felling (Fig. 4), even though the soil temperature was substantially higher (a decrease in the apparent Q10 values by up to 36 % over the 3-year period; Table 3). This agrees with the study of Zerva and Mencuccini, (2005) who also observed a weaker association of CO2 effluxes with soil temperature over a 10-month period after felling at another site in this forest. They noted that this was probably because of the increased water content (also evident in our study; Fig. 2b), the death of fine roots, and the disturbance of the soil caused by tree harvesting and suggested that autotrophic root respiration was more responsive to temperature than heterotrophic microbial respiration. However, this effect could also be because the apparent Q10 of soil CO2 efflux determined from field measurements like these with trees present is influenced by the seasonal changes in radiation and photosynthesis and their positive association with seasonal temperature, rather than an altered temperature sensitivity after felling. A larger reduction of 64 % in the Q10 value of soil CO2 efflux, compared to that found in this study, was reported from a larch forest in eastern Siberia comparing a disturbed clear-cut site with a forest site (2.1 compared with 5.9; Takakai et al., 2008). At the end of our study period in year 4, the Q10 value for soil CO2 efflux in the felled area (3.46) was close to that before felling (3.16 in B-year 1), which could be due to ground vegetation growth near but outside the gas flux chambers. It may also be a result of a drop in the rainfall and soil moisture in the period between May and June in year 4 (Figs. 2b, 3), so the response to soil temperature became stronger, as in the period before felling. There may also have been a recovery from any compaction effects during harvesting, as Epron et al. (2016) showed that compaction by timber forwarding machinery after harvesting a French oak forest on a mineral soil decreased the Q10 values of soil CO2 by 16 %–22 %. In contrast, Kulmala et al. (2014) found that the temperature dependency of the CO2 efflux was not affected by clear-cutting of a Norway spruce forest on organo-mineral soil in southern Finland.
The response of CO2 efflux to soil temperature is likely to have been affected by the substantial increase in soil moisture after felling (Fig. 2b) as noted by Zerva and Mencuccini (2005) and Kulmala et al. (2014). This increase in soil moisture (with values frequently >0.6 cm3 cm−3) could have affected soil respiration by limiting the diffusion of substrates and O2 to microorganisms (Skopp et al., 1990). Yamulki and Morison (2017) could not detect an effect of soil moisture alone on soil respiration in an oak forest in south-east England, but the combined model of soil temperature and moisture explained 73 % of the CO2 efflux variations. It is also possible that some of the CO2 produced may have dissolved in the soil water and gone undetected (Zerva and Mencuccini, 2005), but this effect was probably negligible here because of the low solubility of CO2 at the low soil pH (3.8).
4.2 Effect of felling on CH4 fluxes
Clear-felling changed the soil from a small annual sink of CH4 to a small net source over the 3-year monitoring period after felling, while the unfelled stand remained a sink in all years. The shift in CH4 fluxes from net uptake to net emissions by clear-felling has been reported in several other studies: Zerva and Mencuccini (2005) from another site within this spruce forest, Castro et al. (2000) from two slash pine plantations in Florida, Takakai et al. (2008) from a Siberian larch forest soil, Yashiro et al. (2008) from a tropical rain forest in Malaysia, Sundqvist et al. (2014) from a forest site in central Sweden, and more recently by Korkiakoski et al. (2019) from a Scots pine nutrient-rich peatland forest in southern Finland. As soil CH4 production requires anaerobic conditions (Conrad, 2007), this shift from sink to source was probably caused by the substantial increase in soil moisture (62 % higher) and soil temperature (6 ∘C) in the first year after felling. An increase in soil moisture can increase the anaerobic conditions that favour CH4 production by methanogenic archaea (e.g. Sundqvist et al., 2014) and therefore can change the direction of the CH4 flux. Generally, soil temperature and particularly moisture are considered to be good predictors for CH4 behaviour (Lavoie et al., 2013), but disentangling the two influences is difficult in field conditions.
In this study, CH4 fluxes and the flux variations between chambers increased significantly in the following years after felling. The increase in fluxes was modest in the first year after felling but more substantial in the second and third years (Fig. 5b), which may reflect a time lag in the microbial community changing and the fungal decomposition (Glassman et al., 2018). Although the increase in fluxes might be attributed to the substantial increase in the soil moisture, there was no direct correlation between CH4 fluxes and soil moisture. Some previous studies have also attributed the increase in CH4 fluxes after felling to an increase in soil moisture or rise in the water table (Sundqvist et al., 2014; Zerva and Mencuccini, 2005; Korkiakoski et al., 2019; Epron et al., 2016), while some reported no direct correlations between CH4 fluxes and soil moisture after felling (Lavoie et al., 2013; Takakai et al., 2008; Wu et al., 2011; Mäkiranta et al., 2012; Sundqvist et al., 2014; Zerva and Mencuccini, 2005). The lack of direct correlation between CH4 fluxes and soil moisture has previously been attributed to: (i) insensitivity of methanotrophic activity to small variations in soil moisture and temperature (Sjögersten and Wookey, 2002; Peichl et al., 2010; Wu et al., 2011; Mäkiranta et al., 2012) particularly when fluxes are relatively low such as in this study, (ii) CH4 being produced at a depth greater than that of the measured soil moisture (Zerva and Mencuccini, 2005), and (iii) to other overriding biological and physical factors (Lavoie et al., 2013).
Soil temperature determines CH4 fluxes by influencing methanogenic and methanotrophic activity differently (Luo et al., 2013; Aronson et al., 2013). Generally, CH4 consumption by methanotrophs is less responsive to temperature than CH4 production by methanogens as consumption is mainly limited by atmospheric CH4 diffusion (Dunfield et al., 1993; Kruse et al., 1996). This is in line with the results here, as the statistical analysis showed that soil temperature better explained CH4 fluxes after felling when it became a source than before when the soil was a CH4 sink. However, soil temperature can be positively related to CH4 uptake (Maljanen et al., 2003; Wu et al., 2011; Ullah and Moore, 2011; Yamulki and Morison, 2017), emissions (Zerva and Mencuccini, 2005; Dunfield et al., 1993; Ullah and Moore, 2011), or can have no correlation (Takakai et al., 2008, Sjögersten and Wookey, 2009; Lavoie et al., 2013) depending on soil moisture and other factors that affect microbial CH4 production and consumption. We found no significant interactive effect between temperature and moisture on CH4 fluxes here.
Clear-felling can also affect other factors that play a key role in microbial CH4 production or oxidation (and CO2 and N2O fluxes) by increasing the substrate availability and soil N (NH and NO) concentrations (e.g. Bradford et al., 2000; Wang and Ineson, 2003), for example, as a result of N release from litter or brash, or from reduced soil pH (Dalal and Allen, 2008). The higher bulk density in the felled area (0.30 g m−3 compared with 0.22 g m−3), which may have been caused by compaction as a result of the machinery traffic, may have contributed to reduced CH4 uptake, increased CH4 production, and/or CH4 release (Teepe et al., 2004; Frey et al., 2011). However, the change in soil substrates (organic matter and microorganisms) after felling was not measured in this study and the differences between the unfelled and felled area for total soil N content (1.95 % and 1.83 %, respectively) and soil pH (3.6 and 3.8, respectively) were small.
4.3 Effect of felling on N2O fluxes
N2O fluxes (Fig. 2e) increased after felling and there was an association with soil temperature at 10 cm depth (Table 2). Soil moisture was a significant driver for N2O fluxes before felling, but it became less significant after felling. The effect of clear-felling in increasing N2O fluxes by similar magnitudes has also been shown from forests on both mineral and peat soils (e.g. Saari et al., 2009; Zerva and Mencuccini, 2005; Mäkiranta et al., 2012; Pearson et al., 2012), but an order of magnitude higher N2O flux was measured after clear-felling a nutrient-rich drained peatland forest in southern Finland (Korkiakoski et al., 2019).
N2O fluxes in temperate forest soil are generally expected to be low because of the high C : N ratios in the litter and topsoil (Butterbach-Bahl and Kiese, 2005; Jarvis et al., 2009) but can have a high spatial variability because of the variability in the controlling environmental factors (Peichl et al., 2010; Fest et al., 2009). In this study, both areas of the forest showed large between-chamber variation in N2O fluxes throughout the study period. This could be due to variations in soil moisture within different flux chambers, particularly after rainfall, and the variability between chambers in soil characteristics, litter amount, mineral N availability, and microbial biomass, which were not measured. As the soil moisture was consistently higher after felling (Table 1), the lack of relationship with soil N2O fluxes may indicate that the moisture content was not limiting for soil N2O production by the main microbial nitrification and denitrification processes and that other factors were responsible for N2O flux variations.
As mentioned previously, the total soil N content measured some 5 months after felling was very similar to that in the unfelled area. However, microbial N2O production in the following years after felling was probably influenced by a declining slow N release into the soil from the decomposition of fresh tree harvest residues and roots (Zerva and Mencuccini, 2005; Yashiro et al., 2008; Saari et al., 2009) but stimulated by warmer soil temperatures in the summer (Kulmala et al., 2014). This is consistent with the significant relationship between N2O fluxes and soil temperature, particularly at the 10 cm depth, which might imply that N2O production was more prominent at the deeper, more anaerobic soil depth, probably caused by denitrification brought about by an increased respiratory sink for O2. In the absence of plants, there is no competition for this newly available N, thereby maximizing substrate availability for microbial N2O production and release (Skiba et al., 2012). Three-fold higher N2O emissions from Finnish drained peatland pine forest plots with logging residues have been reported (Mäkiranta et al., 2012). Such effects of increasing soil temperature combined with microbial activities and microbial biomass N in increasing N2O fluxes have also been reported by other studies (Ineson, et al., 1991; Smolander et al.,1998; Zerva and Mencuccini, 2005; Papen and Butterbach-Bahl, 1999; Smith et al., 2018).
It is pertinent to mention here the study of Liimatainen et al. (2018) from a range of afforested northern peat soils in Finland, Sweden, and Iceland, where they suggested that high N2O fluxes were linked to availability of peat phosphorus (P) and copper (Cu), which could be released with other nutrients by harvesting from soil disturbance and brash (Rodgers et al., 2010), and that low P and Cu concentrations can limit N2O production even with sufficient N availability.
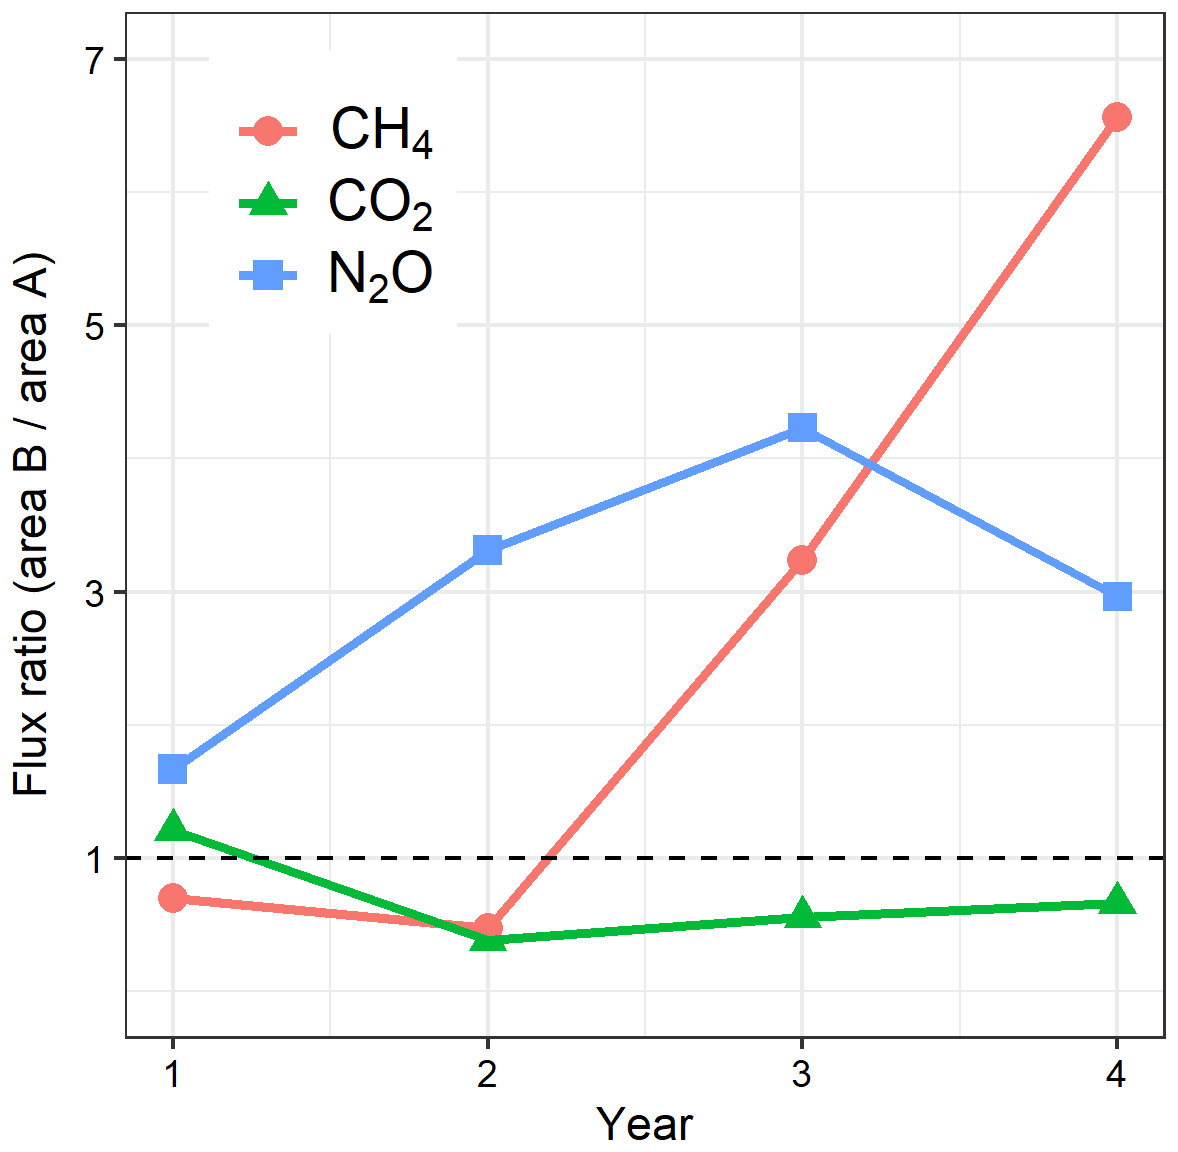
Figure 6Ratios of annual soil GHG fluxes in area B (mature stand, felled after year 1) to that in area A (mature spruce stand, remaining) in Harwood Forest. Note: CH4 fluxes are presented as absolute values. The dashed line represents ratio = 1 (no difference between areas).
4.4 Clear-fell harvesting effect on the GHG balance
Figure 6 summarizes the GHG flux changes by showing the ratio of the annual soil GHG fluxes in B to that in A, with the assumption that the year-to-year variation in the unfelled area A is an indicator equally of what conditions would have been for the mature stand in B if it had not been felled. The figure shows a clear annual GHG flux response to felling where: CO2 effluxes reduced directly after felling, increasing gradually thereafter; CH4 effluxes increased sharply in year 3 and 4 after felling; and N2O effluxes increased in year 2 and 3 after felling but decreased thereafter. In order to compare the contributions of each gas to the total GHG soil flux and the effect on emissions and therefore radiative balance, we expressed the fluxes in CO2 equivalents as normally done (using their global warming potential values (Table 4). Before felling, the total flux (sum of CO2, CH4, and N2O emissions in t CO2e ha−1) was 20.4 in the A area and 25.0 in the B area and CO2 effluxes dominated the total GWP, contributing up to 97 %. The total flux dropped in the first and second year after felling to approximately half (44 % and 56 % lower annual effluxes, respectively). The contribution of CO2 to the total GHG flux expressed as CO2 equivalents in the unfelled area remained constant at about 98 % throughout the study period but decreased in the felled area to ca. 80 % in the first and second year after felling. This was due to the doubling of N2O flux, which contributed up to 20 % of the total flux in the two years after felling. Although the felled site became a source of CH4, its contribution to the total flux was always small (<2 %). For the same periods, the contributions of N2O and CH4 to the total flux in the unfelled area were small and remained constant at 2.9 % and −0.2 %, respectively, similar to their values in year 1. In the last year, N2O annual efflux in the felled area halved to 1.2 t CO2e ha−1, still 20 % higher than before felling, but the efflux of CH4 continued to increase to 0.34 t CO2e ha−1. Over the 3 years since felling, the total soil GHG flux was reduced by 45 % (from 25.0 to 13.8 t CO2e ha−1) due to the much larger reduction in soil CO2 efflux than the increases in N2O and CH4 fluxes. In the unfelled area there was a reduction of approximately 8 %, presumably due to changing weather conditions.
This study is one of very few longer-term assessments of the impacts of clear-fell harvesting on the GHG balance of a Sitka spruce forest. However, because of the limitations of the periodic, manual, closed-chamber measurement technique used here, it does not take into account the daily temporal flux variations or cover fluxes from ground occupied by brash or stumps. Simultaneous eddy covariance (EC) measurements (Xenakis et al., 2021) over the 3-year period after clear-felling at this study area showed approximately 3 times higher ecosystem respiration (32.8 t CO2 ha−1 yr−1) than our estimated mean annual soil CO2 efflux (10.8 t CO2 ha−1 yr−1). As also suggested by Zerva and Mencuccini (2005), the difference presumably indicates high CO2 effluxes coming from the brash mats and stumps, which could not be measured by the small chambers used in this study, plus above- and belowground respiration of the colonizing vegetation, which was not included in the chambers. The differences could also be due to spatial heterogeneity over the site as the soil flux chambers are only partially sampling ground that is representative of the EC footprint. Moreover, it has been indicated that peat decomposition after felling is stimulated by nutrient release from brash (Vanguelova et al., 2010) and therefore higher N2O and CH4 fluxes may also be expected as a result of increasing mineral N release and the presence of more labile organic matter, respectively, from areas with brash. Mäkiranta et al. (2012) observed over 3-fold increase in seasonal average (over 3 years between May–October) soil N2O flux and 2-fold in CO2 efflux from plots with logging residues than without but observed no change in CH4 emissions. This indicates that brash removal post-harvesting (e.g. for biofuel as suggested by Mäkiranta et al., 2012) might be a way of limiting GHG effluxes from peat decomposition. More information on GHG fluxes from brash and stumps and the underlying soil processes that might be influenced by felling are priorities for future research.
In this upland Sitka spruce plantation on organic-rich peaty gley soil, clear-fell harvesting affected soil GHG fluxes by increasing soil temperature and moisture content and reducing fine root mass, which affected the soil nutrient and organic C supply and associated microbial populations, activities, and decomposition rates. Although soil moisture increased significantly after felling, there were no direct correlations with the soil GHG fluxes, probably because there was limited variation in the high soil moisture after felling. By contrast, there was a good correlation between GHG fluxes and the soil temperature, which exhibited much larger temporal variation. This study does not take into account fluxes from brash decomposition because of the small flux chamber areas; therefore, our total measured soil GHG efflux after felling probably underestimates that of the site as a whole. Over the 3-year measurement period after felling, soil CO2 effluxes reduced substantially (55 %) due to cessation of root respiration outweighing increased decomposition. For the same period, CH4 fluxes changed from a small net sink to a net source, increasing throughout, and N2O fluxes increased substantially in the 2 years after felling. Mean soil CO2, CH4, and N2O fluxes over the 3-year period after felling contributed 83 %, 1 %, and 16 %, respectively, to total GHG flux on a CO2 equivalents basis with an overall reduction of 45 % due to much larger soil CO2 flux reduction than the combined soil CH4 and N2O flux increases.
Codes have been uploaded to Zenodo, available at: https://doi.org/10.5281/zenodo.5081968 (Yamulki et al., 2021a).
Data have been uploaded to Zenodo, available at: https://doi.org/10.5281/zenodo.5082059 (Yamulki et al., 2021b).
The supplement related to this article is available online at: https://doi.org/10.5194/bg-18-4227-2021-supplement.
SY, JILM, GX, and MP designed the study. GX, AA, and SY carried out the gas sampling and soil environmental measurements. JB carried out the GC analyses and SY did all the data analyses. JF was responsible for statistical analysis and SY prepared the manuscript with contributions from JILM and GX.
The authors declare that they have no conflict of interest.
Publisher’s note: Copernicus Publications remains neutral with regard to jurisdictional claims in published maps and institutional affiliations.
We would like to thank Forest Research colleagues Elena Vanguelova, Ed Eaton, Sue Benham, and Vladimir Krivtsov for soil and vegetation sampling and analysis. We are indebted to the Forestry England staff who gave permission for the study in Harwood Forest and for their huge support throughout, particularly the late Jonathan Farries. We also thank Russell Anderson for his valuable comments on the paper.
The project was funded by the Forestry Commission and partly by the UKRI Natural Environment Research Council GREENHOUSE project (grant no. NE/K002619/1).
This paper was edited by Ben Bond-Lamberty and reviewed by two anonymous referees.
Aronson, E., Allison, S., and Helliker, B. R.: Environmental impacts on the diversity of methane-cycling microbes and their resultant function, Front. Microbiol., 4, 225, 1–15, 2013.
Boone, R. D., Nadelhoffer, K. J., Canary, J. D., and Kaye, J. P.: Roots exert a strong influence on the temperature sensitivity of soil respiration, Nature, 396, 570–572, 1998.
Bradford, M. A., Ineson, P., Wookey, P. A., and Lappin-Scott, H.M.: Soil CH4 oxidation: response to forest clearcutting and thinning, Soil Biol. Biochem., 32, 1035–1038, 2000.
Brümmer, C., Lyshede, B., Lempio, D., Delorme, J.-P., Rüffer, J. J., Fuß, R., Moffat, A. M., Hurkuck, M., Ibrom, A., Ambus, P., Flessa, H., and Kutsch, W. L.: Gas chromatography vs. quantum cascade laser-based N2O flux measurements using a novel chamber design, Biogeosciences, 14, 1365–1381, https://doi.org/10.5194/bg-14-1365-2017, 2017.
Butnor, J. R., Johnsen, K. H., and Sanchez, F. G.: Whole-tree and forest floor removal from a loblolly pine plantation have no effect on forest floor CO2 efflux 10 years after harvest, Forest Ecol. Manag., 227, 89–95, 2006.
Butterbach-Bahl, K. and Kiese, R.: Significance of forests as sources for N2O and NO, in: Tree Species Effects on Soils: Implications for Global Change, edited by: Binkley, D. and Menyailo, O. V., Springer, 173–192, 2005.
Castro, M. S., Gholz, H. L., Clark, K. K., and Steudler, P. A.: Effects of forest harvesting on soil methane fluxes in Florida slash pine plantations, Can. J. Forest Res., 30, 1534–1542, 2000.
Committee on Climate Change: Net zero: the UK's contribution to stopping global warming, London, 277 pp., available at: https://www.theccc.org.uk/publication/net-zero-the-uks-contribution-to-stopping-global-warming/ (last access: 5 July 2021), 2019.
Conrad, R.: Microbial Ecology of Methanogens and Methanotrophs, Adv. Agron., 96, 1–63, 2007.
Dalal, R. C. and Allen, D. E.: Greenhouse gas fluxes from natural ecosystems, Aust. J. Bot., 56, 369–407, 2008.
Davidson, E. A., Belk, E., and Boone, R. D.: Soil water content and temperature as independent or confounded factors controlling soil respiration in temperate mixed harwood forest, Global. Change Biol., 4, 217–227, 1998.
Dunfield, P., knowles, R., Dumont, R., and Moore, T. R.: Methane production and consumption in temperate and subarctic peat soils: Response to temperature and pH, Soil Biol. Biochem., 25, 321–326, 1993.
Epron, D., Plain, C., Ndiaye, F. K., Bonnaud, P., Pasquier, C., and Ranger, J.: Effects of compaction by heavy machine traffic on soil fluxes of methane and carbon dioxide in a temperate broadleaved forest, Forest. Ecol. Manag., 382, 1–9, 2016.
Ewel, K., Wendell Jr., P. C., and Gholz, H. L.: Soil CO2 evolution in Florida slash pine plantations, II. Importance of root respiration, Can. J. Forest Res., 17, 330–333, 1987.
Fenn, K. M., Malhi, Y., and Morecroft, M. D.: Soil CO2 efflux in a temperate deciduous forest: environmental drivers and component contributions, Soil Biol. Biochem., 42, 1685–1693, 2010.
Fest, B. J., Livesley, S. J., Drösler, M., van Gorsel, E., and Arndt, S. K.: Soil-atmosphere greenhouse gas exchange in a cool, temperate Eucalyptus delegatensis forest in south-eastern Australia, Agr. Forest Meteorol., 149, 393–406, 2009.
Forestry Commission: National Forest Inventory report, available at: https://www.forestresearch.gov.uk/documents/2716/ (last access: 5 July 2021), 2016.
Forest Research: Forestry statistics 2020, Woodland Area and Planting, available at: https://www.forestresearch.gov.uk/tools-and-resources/statistics/forestry-statistics/forestry-statistics-2020/1-woodland-area-and-planting/ (last access: 5 July 2021), 2020.
Fox, J. and Weisberg, S.: An {R} Companion to Applied Regression, Second Edition. Thousand Oaks, CA: Sage, 2011.
Frey, B., Niklaus, P. A., Kremer, J., Lüscher, P., and Zimmermann, S.: Heavy-machinery traffic impacts methane emissions as well as methanogen abundance and community structure in oxic forest soils, Appl. Environ. Microbiol., 77, 6060–6068, 2011.
Glassman, S. I., Weihe, C., Li, J., Albright, M. B., Looby, C. I., Martiny, A. C., Treseder, K. K., Allison, S. D., and Martiny, J. B.: Decomposition responses to climate depend on microbial community composition, P. Natl. Acad. Sci. USA, 115, 11994–11999, 2018.
Goutal, N., Parent, F., Bonnaud, P., Demaison, J., Nourrisson, G., Epron, D., and Ranger, J.: Soil CO2 concentration and efflux as affected by heavy traffic in forest in northeast France, Eur. J. Soil Sci., 63, 261–271, 2012.
Grassi, G., House, J., Dentener, F., Federici, S., den Elzen, M., and Penman, J.: The key role of forests in meeting climate targets requires science for credible mitigation, Nat. Clim. Change, 7, 220–226, 2017.
Hyvönen, R., Olsson, B. A., and Ågren, G. I.: Dynamics of soil C, N and Ca in four Swedish forests after removal of tops, branches and stumps as predicted by the Q model, Scand. J. For. Res., 27, 774–786, 2012.
Ineson, P., Dutch, J., and Killham, K. S.: Denitrification in a Sitka spruce plantation and the effect of clear-felling, Forest Ecol. Manag., 44, 77–92, 1991.
IPCC: Climate Change 2013: The Physical Science Basis, Contribution of Working Group I to the Fifth Assessment Report of the Intergovernmental Panel on Climate Change, edited by: Stocker, T. F., Qin, D., Plattner, G.-K., Tignor, M., Allen, S. K., Boschung, J., Nauels, A., and Xia, Y., Cambridge University Press, Cambridge, UK and New York, NY, USA, 2013.
Irvine, J. and Law, B. E.: Contrasting soil respiration in young and old-growth ponderosa pine forests, Glob. Change Biol., 8, 1183–1194, 2002.
Jarvis, Å., Sundberg, C., Milenkovski, S., Pell, M., Smårs, S., Lindgren, P. E., and Hallin, S.: Activity and composition of ammonia oxidizing bacterial communities and emission dynamics of NH3 and N2O in a compost reactor treating organic household waste, J. Appl. Microbiol., 106, 1502–1511, 2009.
Kim, C.: Soil CO2 efflux in clear-cut and uncut red pine (Pinus densiflora S. et Z.) stands in Korea, Forest Ecol. Manag. , 255, 8–9, 2008.
Korkiakoski, M., Tuovinen, J.-P., Aurela, M., Koskinen, M., Minkkinen, K., Ojanen, P., Penttilä, T., Rainne, J., Laurila, T., and Lohila, A.: Methane exchange at the peatland forest floor – automatic chamber system exposes the dynamics of small fluxes, Biogeosciences, 14, 1947–1967, https://doi.org/10.5194/bg-14-1947-2017, 2017.
Korkiakoski, M., Tuovinen, J.-P., Penttilä, T., Sarkkola, S., Ojanen, P., Minkkinen, K., Rainne, J., Laurila, T., and Lohila, A.: Greenhouse gas and energy fluxes in a boreal peatland forest after clear-cutting, Biogeosciences, 16, 3703–3723, https://doi.org/10.5194/bg-16-3703-2019, 2019.
Köster, K., Berninger, F., Lindén, A., Köster, E., and Pumpanen, J.: Recovery in fungal biomass is related to decrease in soil organic matter turnover time in a boreal fire chronosequence, Geoderma, 235, 74–82, 2014.
Kruse, C. W., Moldrup, P., and Iversen, N.: Modeling diffusion and reaction in soils: II. Atmospheric methane diffusion and consumption in a forest soil, Soil Sci., 161, 355–365, 1996.
Kulmala, L., Aaltonen, H., Berninger, F., Kieloaho, A. J., Levula, J., Bäck, J., Hari, P., Kolari, P., Korhonen, J. F. J., Kulmala, M., Nikinmaa, E., Pihlatie, M., Vesala, T., and Pumpanen, J.: Changes in biogeochemistry and carbon fluxes in a boreal forest after the clear-cutting and partial burning of slash, Agr. Forest Meteorol., 188, 33–44, 2014.
Lavoie, M., Kellman, L., and Risk, D.: The effects of clear-cutting on soil CO2, CH4, and N2O flux, storage and concentration in two Atlantic temperate forests in Nova Scotia, Canada, Forest Ecol. Manag., 304, 355–369, 2013.
Le Quéré, C., Moriarty, R., Andrew, R. M., Canadell, J. G., Sitch, S., Korsbakken, J. I., Friedlingstein, P., Peters, G. P., Andres, R. J., Boden, T. A., Houghton, R. A., House, J. I., Keeling, R. F., Tans, P., Arneth, A., Bakker, D. C. E., Barbero, L., Bopp, L., Chang, J., Chevallier, F., Chini, L. P., Ciais, P., Fader, M., Feely, R. A., Gkritzalis, T., Harris, I., Hauck, J., Ilyina, T., Jain, A. K., Kato, E., Kitidis, V., Klein Goldewijk, K., Koven, C., Landschützer, P., Lauvset, S. K., Lefèvre, N., Lenton, A., Lima, I. D., Metzl, N., Millero, F., Munro, D. R., Murata, A., Nabel, J. E. M. S., Nakaoka, S., Nojiri, Y., O'Brien, K., Olsen, A., Ono, T., Pérez, F. F., Pfeil, B., Pierrot, D., Poulter, B., Rehder, G., Rödenbeck, C., Saito, S., Schuster, U., Schwinger, J., Séférian, R., Steinhoff, T., Stocker, B. D., Sutton, A. J., Takahashi, T., Tilbrook, B., van der Laan-Luijkx, I. T., van der Werf, G. R., van Heuven, S., Vandemark, D., Viovy, N., Wiltshire, A., Zaehle, S., and Zeng, N.: Global Carbon Budget 2015, Earth Syst. Sci. Data, 7, 349–396, https://doi.org/10.5194/essd-7-349-2015, 2015.
Liimatainen, M., Voigt, C., Martikainen, P. J., Hytönen, J., Regina, K., Oskarsson, H., and Maljanen, M.: Factors controlling nitrous oxide emissions from managed northern peat soils with low carbon to nitrogen ratio, Soil Biol. Biochem., 122, 186–195, 2018.
Luo, J., Li, H., Liu, T., Polle, A., Peng, C., and Luo, Z. B.: Nitrogen metabolism of two contrasting poplar species during acclimation to limiting nitrogen availability, J. Exp. Bot., 64, 4207–4224, 2013.
Mäkiranta, P., Laiho, R., Penttilä, T., and Minkkinen, K.: The impact of logging residue on soil GHG fluxes in a drained peatland forest, Soil Biol. Biochem., 48, 1–9, 2012.
Maljanen, M., Liikanen, A., Silvola, J., and Martikainen, P. J.: Methane fluxes on agricultural and forested boreal organic soils, Soil Use Manag., 19, 73–79, 2003.
Mojeremane, W., Rees, R. M., and Mencuccini, M.: The effects of site preparation practices on carbon dioxide, methane and nitrous oxide fluxes from a peaty gley soil, Forestry, 85, 1–15, 2012.
Murgatroyd, I. and Saunders, C.: Protecting the environment during mechanised harvesting operations, Forestry Commission Technical Note 011, Edinburgh, 2005.
Papen, H. and Butterbach-Bahl, K.: A 3-year continuous record of nitrogen trace gas fluxes from untreated and limed soil of a N-saturated spruce and beech forest ecosystem in Germany: 1. N2O emissions, J. Geophys. Res.-Atmos., 104, 18487–18503, 1999.
Pavelka, M., Acosta, M., Marek, M. V., Kutsch, W., and Janous, D.: Dependence of the Q10 values on the depth of the soil temperature measuring point, Plant. Soil., 292, 171–179, 2007.
Pavelka, M., Acosta, M., Kiese, R., Altimir, N., Brümmer, C., Crill, P., Darenova, E., Fuß, R., Gielen, B., Graf, A., Klemedtsson, L., Lohila, A., Longdoz, B., Lindroth, A., Nilsson, M., Marañon-Jimenez, S., Merbold, L., Montagnani, L., Peichl, M., Pihlatie, M., Pumpanen, J., Serrano Ortiz, P., Silvennoinen, H., Skiba, U., Vestin, P., Weslien, P., Janouš, D., and Kutsch, W.: Standardisation of chamber technique for CO2, N2O and CH4 fluxes measurements from terrestrial ecosystems, Int. Agrophys., 32, 569–587, https://doi.org/10.1515/intag-2017-0045, 2018.
Pearson, M., Saarinen, M., Minkkinen, K., Silvan, N., and Laine, J.: Short-term impacts of soil preparation on greenhouse gas fluxes: A case study in nutrient-poor, clearcut peatland forest, Forest Ecol. Manag., 283, 10–26, 2012.
Peichl, M., Arain, M. A., Ullah, S., and Moore, T. R.: Carbon dioxide, methane, and nitrous oxide exchanges in an age-sequence of temperate pine forests, Glob. Change Biol., 16, 2198–2212, 2010.
Pedersen, A. R.: HMR: Flux Estimation with Static Chamber Data, R package version 1.0.1, available at: https://CRAN.R-project.org/package=HMR (last access: 5 July 2021), 2020.
Pihlatie, M. K., Christiansen, J. R., Aaltonen, H., Korhonen, J. F. J., Nordbo, A., Rasilo, T., Benanti, G., Giebels, M., Helmy, M., Sheehy, J., Jones, S., Juszczak, R., Klefoth, R., Lobo-do-Vale, R., Rosa, A. P., Schreiber, P., Serça, D., Vicca, S., Wolf, B., and Pumpanen, J.: Comparison of static chambers to measure CH4 emissions from soils, Agr. Forest Meteorol., 171/172, 124–136, 2013.
Pinheiro, J., Bates, D., DebRoy, S., Sarkar, D., Heisterkamp, S., Van Willigen, B., and Maintainer, R.: Package “nlme”, Linear and nonlinear mixed effects models, version 3.1-137, 2018.
Pyatt, D. G.: Soil groups of upland forests, Forestry Commission, forest record No. 71, 1970.
R Core Team: R: A language and environment for statistical computing, R Foundation for Statistical Computing, Vienna, Austria, 2020.
Rodgers, M., O'Connor, M., Healy, M.G., O'Driscoll, C., Nieminen, M., Poole, R., Müller, M., and Xiao, L.: Phosphorus release from forest harvesting on an upland blanket peat catchment, Forest Ecol. Manag., 260, 2241–2248, 2010.
Saari, P., Saarnio, S., Kukkonen, J. V., Akkanen, J., Heinonen, J., Saari, V., and Alm, J.: DOC and N2O dynamics in upland and peatland forest soils after clear-cutting and soil preparation, Biogeochemistry, 94, 217–231, 2009.
Shi, B. and Jin, G.: Variability of soil respiration at different spatial scales in temperate forests, Biol. Fert. Soils, 52, 561–571, 2016.
Sjögersten, S. and Wookey, P. A.: Spatio-temporal variability and environmental controls of methane fluxes at the forest–tundra ecotone in the Fennoscandian mountains, Glob. Change Biol., 8, 885–894, 2002.
Sjögersten, S. and Wookey, P. A.: The impact of climate change on ecosystem carbon dynamics at the Scandinavian mountain birch forest–tundra heath ecotone, AMBIO, 38, 2–10, 2009.
Skiba, U., Jones, S. K., Dragosits, U., Drewer, J., Fowler, D., Rees, R. M., Pappa, V. A., Cardenas, L., Chadwick, D., Yamulki, S., and Manning, A. J.: UK emissions of the greenhouse gas nitrous oxide, Philos. T. R. Soc. B, 367, 1175–1185, 2012.
Skopp, J., Jawson, M. D., and Doran, J. W.: Steady-state aerobic microbial activity as a function of soil water content, Soil Sci. Soc. Am. J., 54, 1619–1625, 1990.
Smith, K. A., Ball, T., Conen, F., Dobbie, K. E., Massheder, J., and Rey, A.: Exchange of greenhouse gases between soil and atmosphere: interactions of soil physical factors and biological processes, Eur. J. Soil Sci., 69, 10–20, 2018.
Smolander, A., Priha, O., Paavolainen, L., Steer, J., and Mälkönen, E.: Nitrogen and carbon transformations before and after clear-cutting in repeatedlyN-fertilized and limed forest soil, Soil Biol. Biochem., 30, 477–490, 1998.
Smolander, A., Saarsalmi, A., and Tamminen, P.: Response of soil nutrient content, organic matter characteristics and growth of pine and spruce seedlings to logging residues, Forest Ecol. Manag., 357, 117–125, 2015.
Subke, J. A., Inglima, I., and Cotrufo, M. F.: Trends and methodological impacts in soil CO2 efflux partitioning: A metaanalytical review, Glob. Change Biol., 12, 921–943, 2006.
Sundqvist, E., Vestin, P., Crill, P., Persson, T., and Lindroth, A.: Short-term effects of thinning, clear-cutting and stump harvesting on methane exchange in a boreal forest, Biogeosciences, 11, 6095–6105, https://doi.org/10.5194/bg-11-6095-2014, 2014.
Takakai, F., Desyatkin, A. R., Lopez, C. M. L., Fedorov, A. N., Desyatkin, R. V., and Hatano, R.: Influence of forest disturbance on CO2, CH4 and N2O fluxes from larch forest soil in the permafrost taiga region of eastern Siberia, Soil Sci. Plant Nutr., 54, 938–949, 2008.
Tate, K. R., Ross, D. J., Scott, N. A., Rodda, N. J., Townsend, J. A., and Arnold, G. C.: Post-harvest patterns of carbon dioxide production, methane uptake and nitrous oxide production in a Pinus radiata D. Don plantation, Forest Ecol. Manag., 228, 40–50, 2006.
Teepe, R., Brumme, R., Beese, F., and Ludwig, B.: Nitrous oxide emission and methane consumption following compaction of forest soils, Soil Sci. Soc. Am. J., 68, 605–611, 2004.
Ullah, S. and Moore, T. R.: Biogeochemical controls on methane, nitrous oxide, and carbon dioxide fluxes from deciduous forest soils in eastern Canada, J. Geophys. Res., 116, 1–15, 2011.
Ullah, S., Frasier, R., Pelletier, L., and Moore, T. R.: Greenhouse gas fluxes from boreal forest soils during the snow-free period in Quebec, Canada, Can. J. Forest Res., 39, 666–680, 2009.
Vanguelova, E., Pitman R., Luiro, J., and Helmisaari, H.S.: Long term effects of whole tree harvesting on soil carbon and nutrient sustainability in the UK, Biogeochemistry, 101, 43–59, 2010.
Vanguelova, E. I., Nisbet, T. R., Moffat, A. J., Broadmeadow, S., Sanders, T. G. M., and Morison, J. I. L.: A new evaluation of carbon stocks in British forest soils, Soil Use Manag., 29, 169–181, 2013.
Wang, Z. P. and Ineson, P.: Methane oxidation in a temperate coniferous forest soil: effects of inorganic N, Soil Biol. Biochem., 35, 427–433, 2003.
Wu, X., Brüggemann, N., Gasche, R., Papen, H., Willibald, G., and Butterbach-Bahl, K.: Long-term effects of clear-cutting and selective cutting on soil methane fluxes in a temperate spruce forest in southern Germany, Environ. Pollut., 159, 2467–2475, 2011.
Xenakis, G., Ash, A., Siebicke, L., Perks, M., and Morison, J. I. L.: Comparison of the carbon, water and energy balances of mature stand and clear-fell stages in a British Sitka spruce forests and the impact of the 2018 drought, Agr. Forest Meteorol., 306, 108437, https://doi.org/10.1016/j.agrformet.2021.108437, 2021.
Yamulki, S. and Morison, J. I. L.: Annual greenhouse gas fluxes from a temperate deciduous oak forest floor, Forestry, 90, 541–552, 2017.
Yamulki, S., Anderson, R., Peace, A., and Morison, J. I. L.: Soil CO2 CH4 and N2O fluxes from an afforested lowland raised peatbog in Scotland: implications for drainage and restoration, Biogeosciences, 10, 1051–1065, https://doi.org/10.5194/bg-10-1051-2013, 2013.
Yamulki, S., Forster, J., Xenakis, G., Ash, A., Brunt, J., Perks, M., and Morison, J.: Effects of clear-fell harvesting on soil CO2, CH4, and N2O fluxes in an upland Sitka spruce stand in England, Zenodo [R Codes], https://doi.org/10.5281/zenodo.5081968, 2021a.
Yamulki, S., Forster, J., Xenakis, G., Ash, A., Brunt, J., Perks, M., and Morison, J.: Effects of clear-fell harvesting on soil CO2, CH4, and N2O fluxes in an upland Sitka spruce stand in England, Zenodo [Dataset], https://doi.org/10.5281/zenodo.5082059, 2021b.
Yashiro, Y., Kadir, W. R., Okuda, T., and Koizumi, H.: The effects of logging on soil greenhouse gas (CO2, CH4, N2O) flux in a tropical rain forest, Peninsular Malaysia, Agr. Forest Meteorol., 148, 799–806, 2008.
Zerva, A. and Mencuccini, M.: Short-term effects of clearfelling on soil CO2, CH4, and N2O fluxes in a Sitka spruce plantation, Soil Biol. Biochem., 37, 2025–2036, 2005.