the Creative Commons Attribution 4.0 License.
the Creative Commons Attribution 4.0 License.
 | 27 Jul 2021
Determining the hierarchical order by which the variables of sampling period, dust outbreak occurrence, and sampling location can shape the airborne bacterial communities in the Mediterranean basin
Riccardo Rosselli
Maura Fiamma
Massimo Deligios
Gabriella Pintus
Grazia Pellizzaro
Annalisa Canu
Pierpaolo Duce
Rosella Muresu
Pietro Cappuccinelli
A next-generation sequencing (NGS)-based taxonomic analysis was carried out on airborne bacteria sampled at ground level in two periods (May and September) and two opposite locations on the north–south axis of the island of Sardinia. Located in a central position of the Mediterranean basin, Sardinia constitutes a suitable outpost for revealing possible immigration of bacterial taxa during transcontinental particle discharge between Africa and Europe. With the aim of verifying relative effects of dust outbreaks, sampling period, and sampling site on the airborne bacterial community composition, we compared air collected during dust-carrying meteorological events to that coming from wind regimes not associated with long-distance particle lifting. Results indicated that (a) higher microbial diversity and richness (118 vs. 65 orders) and increased community evenness were observed in the campaign carried out in September in comparison to the one in May, irrespective of the place of collection and of the presence or absence of dust outbreaks; (b) during the period of standard wind regimes without transcontinental outbreaks, a synchronous concerted turnover of bacterial communities across distant locations of the same island, accompanied as mentioned by a parallel rise in bacterial diversity and community evenness, appears to have occurred; (c) changes in wind provenance could transiently change community composition in the locality placed on the coast facing the incoming wind but not in the one located at the opposite side of the island, and for this reason the community changes brought from dust outbreaks of African origin are observed only in the sampling station exposed to the south; (d) the same winds, once proceeding over land, appear to uplift bacteria belonging to a common core already present over the region, which dilute or replace those that were associated with the air coming from the sea or conveyed by the dust particulates, explaining the two prior points; and (e) the hierarchy of the variables tested in determining bacterial assemblages composition results is as follows: sampling period≫ongoing meteorological events>sampling location within the island.
- Article
(3020 KB) - Full-text XML
-
Supplement
(4071 KB) - BibTeX
- EndNote


With a total volume evaluated of 4.5×10¹⁸ m3, the terrestrial lower atmosphere represents the most extended potential biome, followed by water, 1.3×10¹⁸ m3 (Gleick, 1993), and by soil with 6.2×10¹⁶ m3 (estimated on the basis of the deeper subsurface-living bacteria currently described by Szewzyk et al., 1993). Concerning atmosphere, microbial cells and propagules embody a particularly suitable conformation to take advantage of air utilization as an environment for survival and dispersal. Their movement can be favored by a natural mobile reservoir of physical solid carriers represented by the air-dispersed particulate matter. Such particles range between 0.2 and 100 µm in size (Bernstein et al., 2004; Ryder et al., 2018) and average loads of 1–100 µg m−3 (Williams et al., 2002; Van Dingenen et al., 2004). It has been estimated that more than 5000 Tg of sea salt (Tegen et al., 1997) and 1000–2000 Tg of soil particles, passively uplifting and transporting live cells, are released every year in the atmosphere giving rise to a widely heterogeneous material conveyed from different sources (Guang et al., 2004; McTainsh, 1989; Knippertz et al., 2009).
The tropical African and Asiatic belts represent two of the major airlifted dust sources (Prospero, 2002; Schepansky et al., 2007). Several studies underline that the phenomenon of dust airlift strongly contributes to a cosmopolitan microbial distribution (Favet et al., 2013; Griffin, 2008; Yang et al., 2008; Wainwright et al., 2003; Smith et al., 2010).
Moreover, the correlation between specific bacterial clades and particle size (Polymenakou et al., 2008) has given rise to new hypotheses on differential dispersal of taxa in relation to the dust features. A high number of bacterial “newcomers” have been pointed out in air samples collected on occasions of foreign dust outbreaks (Maki et al., 2014; Rosselli et al., 2015). Immigrant microorganisms' classification (Sànchez de la Campa et al., 2013) and their effects on an autochthonous ecosystem have also been reported (Peter et al., 2014; Shine et al., 2000). Evidence of a correlation between aerosol-related biodiversity and seasons (Gandolfi et al., 2015) underlines the natural complexity related to this process, suggesting that effects may also vary depending on climatic periodicity. The impact of desert dust in transiently changing the airborne microbiota in cities has been described (Mazar et al., 2016). In other works, the origin of dust has been compared and storms from different origins have been shown to exhibit distinct bacterial communities, with signature bacterial taxa (Gat et al., 2017). Marked seasonal patterns in airborne microbiota have also been reported in long-term studies (Cáliz et al., 2018). Fungal taxa have also been analyzed along with their relationships with the chemical composition of the particulates (Lang-Yona et al., 2020). The genes whose presence has been suggested to enable bacterial survival in the atmosphere, referred to as eolian lifestyle, have been studied by metagenomic approaches, and their effects include UV-induced DNA damage repair, cell aerosolization, aerotaxis, and thermal resistance (Aalismail et al., 2019).
European Mediterranean air circulation routes offer an interesting case study when focusing on airborne bacteria. The system can be represented as a multidirectional network in which biological components and weather conditions are closely related (Lelived et al., 2002).
Extending for more than 30∘ of latitude above the subtropical belt, Europe is crossed by middle-latitude and equatorial atmospheric systems. Mathematical models suggest that a considerable part of the air mass movements has a Northern Atlantic source in response to the pressure generated by the Azores high (Littmann, 2000). Southern winds from Africa, prone to carrying desert sand and potentially microbes, can be determined by specific climate conditions (Kostopoulou and Jones, 2007; Benkhalifa et al., 2019). It has been estimated that, as a consequence, 80–120 Tg dust yr−1 is transported across the Mediterranean towards Europe (d'Almeida, 1986; Dulac et al., 1996), reaching the higher troposphere layers (Alpert et al., 2004) and spilling over up to the far northern sides of the continent (Franzén et al., 1991).
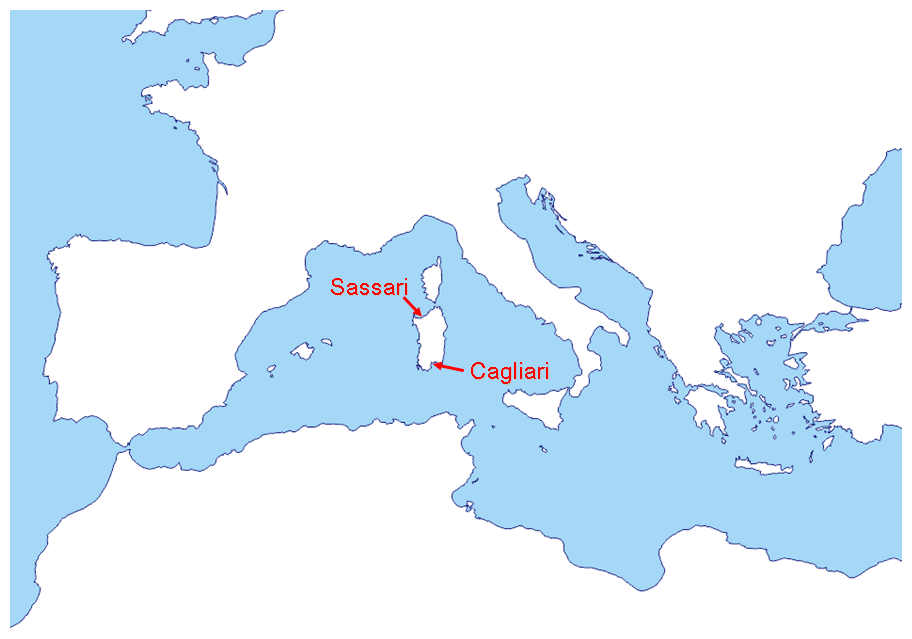
Figure 1Mediterranean area with Sardinia detail and sampling locations Sassari and Cagliari.
In order to track the biodiversity of these airways, the Italian island of Sardinia was chosen as an ideal observatory point to collect airborne bacteria moving inside and outside Europe. Located in the middle of the Mediterranean Sea, this landmass is separated from Italy, France, Spain, and Africa coastal baselines by distances of 120, 150, 230, and 100 nautical miles (NM; 1 NM is equal to 1852 m), respectively (Fig. 1). Its geographical position facilitates the displacement of western high- and low-pressure air masses coming from Gibraltar and becoming the first and the last frontier for microbes entering or leaving Europe, respectively. In a prior study (Rosselli et al., 2015), we described a core microbiome in the bacteria cast upon the island of Sardinia under different wind regimes through analyses of DNA from deposited particles. The analysis compared the trans-Mediterranean airflow with that of winds from Europe and pinpointed a number of taxa which have records in clinical infections. In that investigation the sampling dates were all concentrated in a single period of 6 d (in February) and some variations in the airborne biota were observed in response to the opposite wind directions.
However, the most remarkable evidence was a prevailing constancy of the microbial composition in spite of the changing wind provenances. In the present study instead we analyzed a series of events featuring a starting dust outbreak, a 109 d long period devoid of dust-carrying winds, and a second dust outbreak. The analyses were performed in two oppositely located stations: Cagliari, on the southeast side of Sardinia, facing the African side, and Sassari in the northwest, i.e., farthest from the dust-carrying winds. The sampled particulates were analyzed by next-generation sequencing (NGS) of the amplified 16S rRNA genes. The main goal of the project was to verify in which hierarchical order the different variables of (a) sampling period, (b) occurrence of dust-carrying outbreaks, and (c) sampling location could act in determining airborne bacterial community composition.
2.1 Meteorological monitoring
Surveillance of the weather trends and conditions for anticipating dust outbreaks from Africa towards Sardinia and winds of interest was performed by routine checking of MODIS satellite data (https://modis.gsfc.nasa.gov/data/, last access: 20 September 2014) and Meteosat imagery combined with the SKIRON (https://forecast.uoa.gr/en/forecast-maps/skiron, last access: 20 September 2014) forecasting model (Nickovic et al., 2001). European daily synoptic conditions were analyzed on the weather charts available from http://www.eurometeo.com, last access: 20 September 2014 and https://www.metoffice.gov.uk, last access: 20 September 2014. The origin and the trajectory of the dust carried by winds towards Italy were inferred by the NOAA HYSPLIT model (Hybrid Single-Particle Lagrangian Integrated Trajectory model) (Draxler and Rolph, 2014; Rolph, 2014).
Monitoring was aimed at predicting two distinct conditions: (i) north African high-pressure nuclei favoring southern winds suitable for carrying and depositing dust over Sardinia (dust-enriched events) and (ii) north European high-pressure nuclei, determining northern winds referred to as “controls” (dust-negative events).
In addition, PM10 concentration (particulate matter with a diameter of less than 10 µm) and meteorological data registered by the ARPAS (Regional Environmental Protection Agency of Sardinia) monitoring stations were taken into consideration in relation to the arrival of African air masses.
Information about wind direction and intensity (every 10 min) and temperature and humidity (once per hour) was downloaded via the ISPRA website (http://www.mareografico.it/, last access: 20 September 2014) and two sampling stations located in Cagliari (39.21∘ N, 9.11∘ E) and Sassari–Porto Torres (40.84∘ N, 8.40∘ E). Data covered a 7-month time lapse, from March to September 2014, in order to obtain a nearly annual view to focus within the main weather instability period.
2.2 Sampling
The experimental design involved two sampling sites at the opposite corners of the island of Sardinia (Sassari vs. Cagliari), two sampling periods (May vs. September), and two meteorological conditions (absence vs. presence of a dust outbreak). In each of these situations, two replicate samples were taken and processed independently throughout the DNA extraction step to be pooled before sequencing. Samples were collected on Teflon filters (Sartorius Stedim Biotech) by using Skypost Tecora apparatus (compliant with the European legislation 96/62/gmeCE) processing 39 L air min−1. To constitute “a sample” a continuous 24 h long air intake through the filters was performed.
In the case of the dust outbreaks the 24 h sampling was further divided into two periods, by considering independently the first 12 h and the second 12 h. The number of resulting samples was therefore 12, namely the module of three conditions – (a) control, (b) dust hours 1–12, (c) dust hours 12–24 – multiplied by two sampling periods and by the two sampling places, resulting in 12 samples ().
As a technical note, the scope and meaning of controls here was that of samples that could allow us to individuate the shift between one condition and its adjacent one. In our cases, that meant catching the sudden change in wind regime by sampling immediately before or after a dust outbreak. Therefore, the controls were thus defined as single 24 h time points preceding or following the key dust events.
For each sample, dates and atmospheric conditions are reported and fully described in the Results section and Supplement.
2.3 DNA extraction and sequencing
DNA was extracted using the E.Z.N.A.® Soil DNA Kit (Omega Bio-tek Inc.) as described by the manufacturer. The quality and quantity of the extracted nucleic acid were measured using a NanoDrop 2000 spectrophotometer (Thermo Fisher Scientific Inc.).
Amplification of the 16S rRNA genes for sequencing was performed using the universal primers 27F and 1492R (AGAGTTTGATYMTGGCTCAG and TACGGYTACCTTGTTACGACTT, respectively). PCR was carried out using Platinum® Taq DNA Polymerase High Fidelity (Life Technologies) in a PTC-200 Thermal Cycler (MJ Research Inc.) set as follows: 95 ∘C for 5 min (95 ∘C for 0.5 min, 51 ∘C for 0.5 min, 72 ∘C for 2 min for 30 cycles), 72 ∘C for 10 min, and 4 ∘C on hold. The amplification of the no template control (NTC) was negative. Next-generation sequencing was carried out at the facilities of the Porto Conte Ricerche Srl (Alghero, Italy). Briefly, amplicons were quality-checked on an agarose gel and purified using the Agencourt® AMPure® XP PCR purification kit. Using the Nextera XT DNA Sample Preparation Kit (Illumina Inc.), 1 ng of DNA was processed, and it was sequenced using HiScanSQ (Illumina Inc.) with 93 bp×2 paired-end reads. Sequences were submitted to the European Nucleotide Archive (ENA) inside the Dust Metagenome BioProject with the accession number ERX836645-56.
2.4 Data analysis
Reads were cleaned on the basis of quality, and fragments of Nextera adapters were removed by Trimmomatic (Bolger et al., 2014) set at the value of 3 for leading and trailing trimming and with bases lower than 20 on a four-base wide sliding window. Quality was confirmed by FastQC (http://www.bioinformatics.babraham.ac.uk/projects/fastqc/, last access: 3 July 2016), and reads were analyzed with QIIME 1.9.0 (Caporaso et al., 2010). The operational taxonomic unit (OTU) table was created using the pick_otus script with the closed-reference OTU picking strategy with the Greengenes reference OTU database clustered at 97 % (ver. gg_13_8). The same script checked chimeric sequences using the Broad Institute Microbiome Utilities 16S Gold reference database (version microbiomeutil-r20110519). The OTU table was filtered based on the total observation count of an OTU of at least 3 and low-abundance filtering of 0.005 %. Finally, the OTU table was rarefied (subsampled) at 1 109 571 counts (equal to the sample with a lowest depth) for all the samples. Perl and the R package vegan were subsequently used for cladograms and distance-based clustering analyses; ggplot, plotrix, and windRose provided graphic support.
Molecular data regarding bacterial species compositional differences across different treatments were analyzed by multivariate analyses (principal coordinate analysis, PCoA; principal component analysis, PCA; discriminant analysis of principal components, DAPC) and ecological index calculation, using the Calypso online software tool (Zakrzewski et al., 2017). Prior to the analyses, the relative abundances of OTUs were equalized by applying the total sum of squares scaling (TSS) normalization followed by square root transformation. The resulting ordination results were also compared with those yielded by the alternative centered log ratio (CLR) data transformation.
3.1 Meteorological events
To capture the air microbiota of Sardinia and to put in evidence taxa that could be associated with specific events, weather forecasts and other data on air circulation were regularly browsed to select suitable dates for the sampling. Such events were intended to be winds in the northbound direction prone to carrying dust from shores across the Mediterranean as opposed to calm air or slow flows from the opposite quadrant. This allowed us to integrate boundary conditions and environmental variables to assess possible correlations between these and microbial community fluctuations (Fiamma, 2016).
Dust-carrying air masses moved over the Mediterranean on 21 through 22 May 2014 towards the northeast, covering the entire island of Sardinia. PM10 concentrations throughout the second half of May at both the north and the south collection sites displayed increases in correspondence of the dust event (Fig. S1 in the Supplement). Incoming dust of African origin was equally evidenced by charts reporting wind fronts and pressure (Fig. S2 in the Supplement) and images from satellite (Fig. S3 in the Supplement). The itinerary of particles was reconstructed by plotting 3 d backward trajectories of the air mass using a NOAA HYSPLIT model (Fig. 2) which tracked the north African zone as the source of the convective motion responsible for the dust discharge on Italy observed on 21 and 22 May.
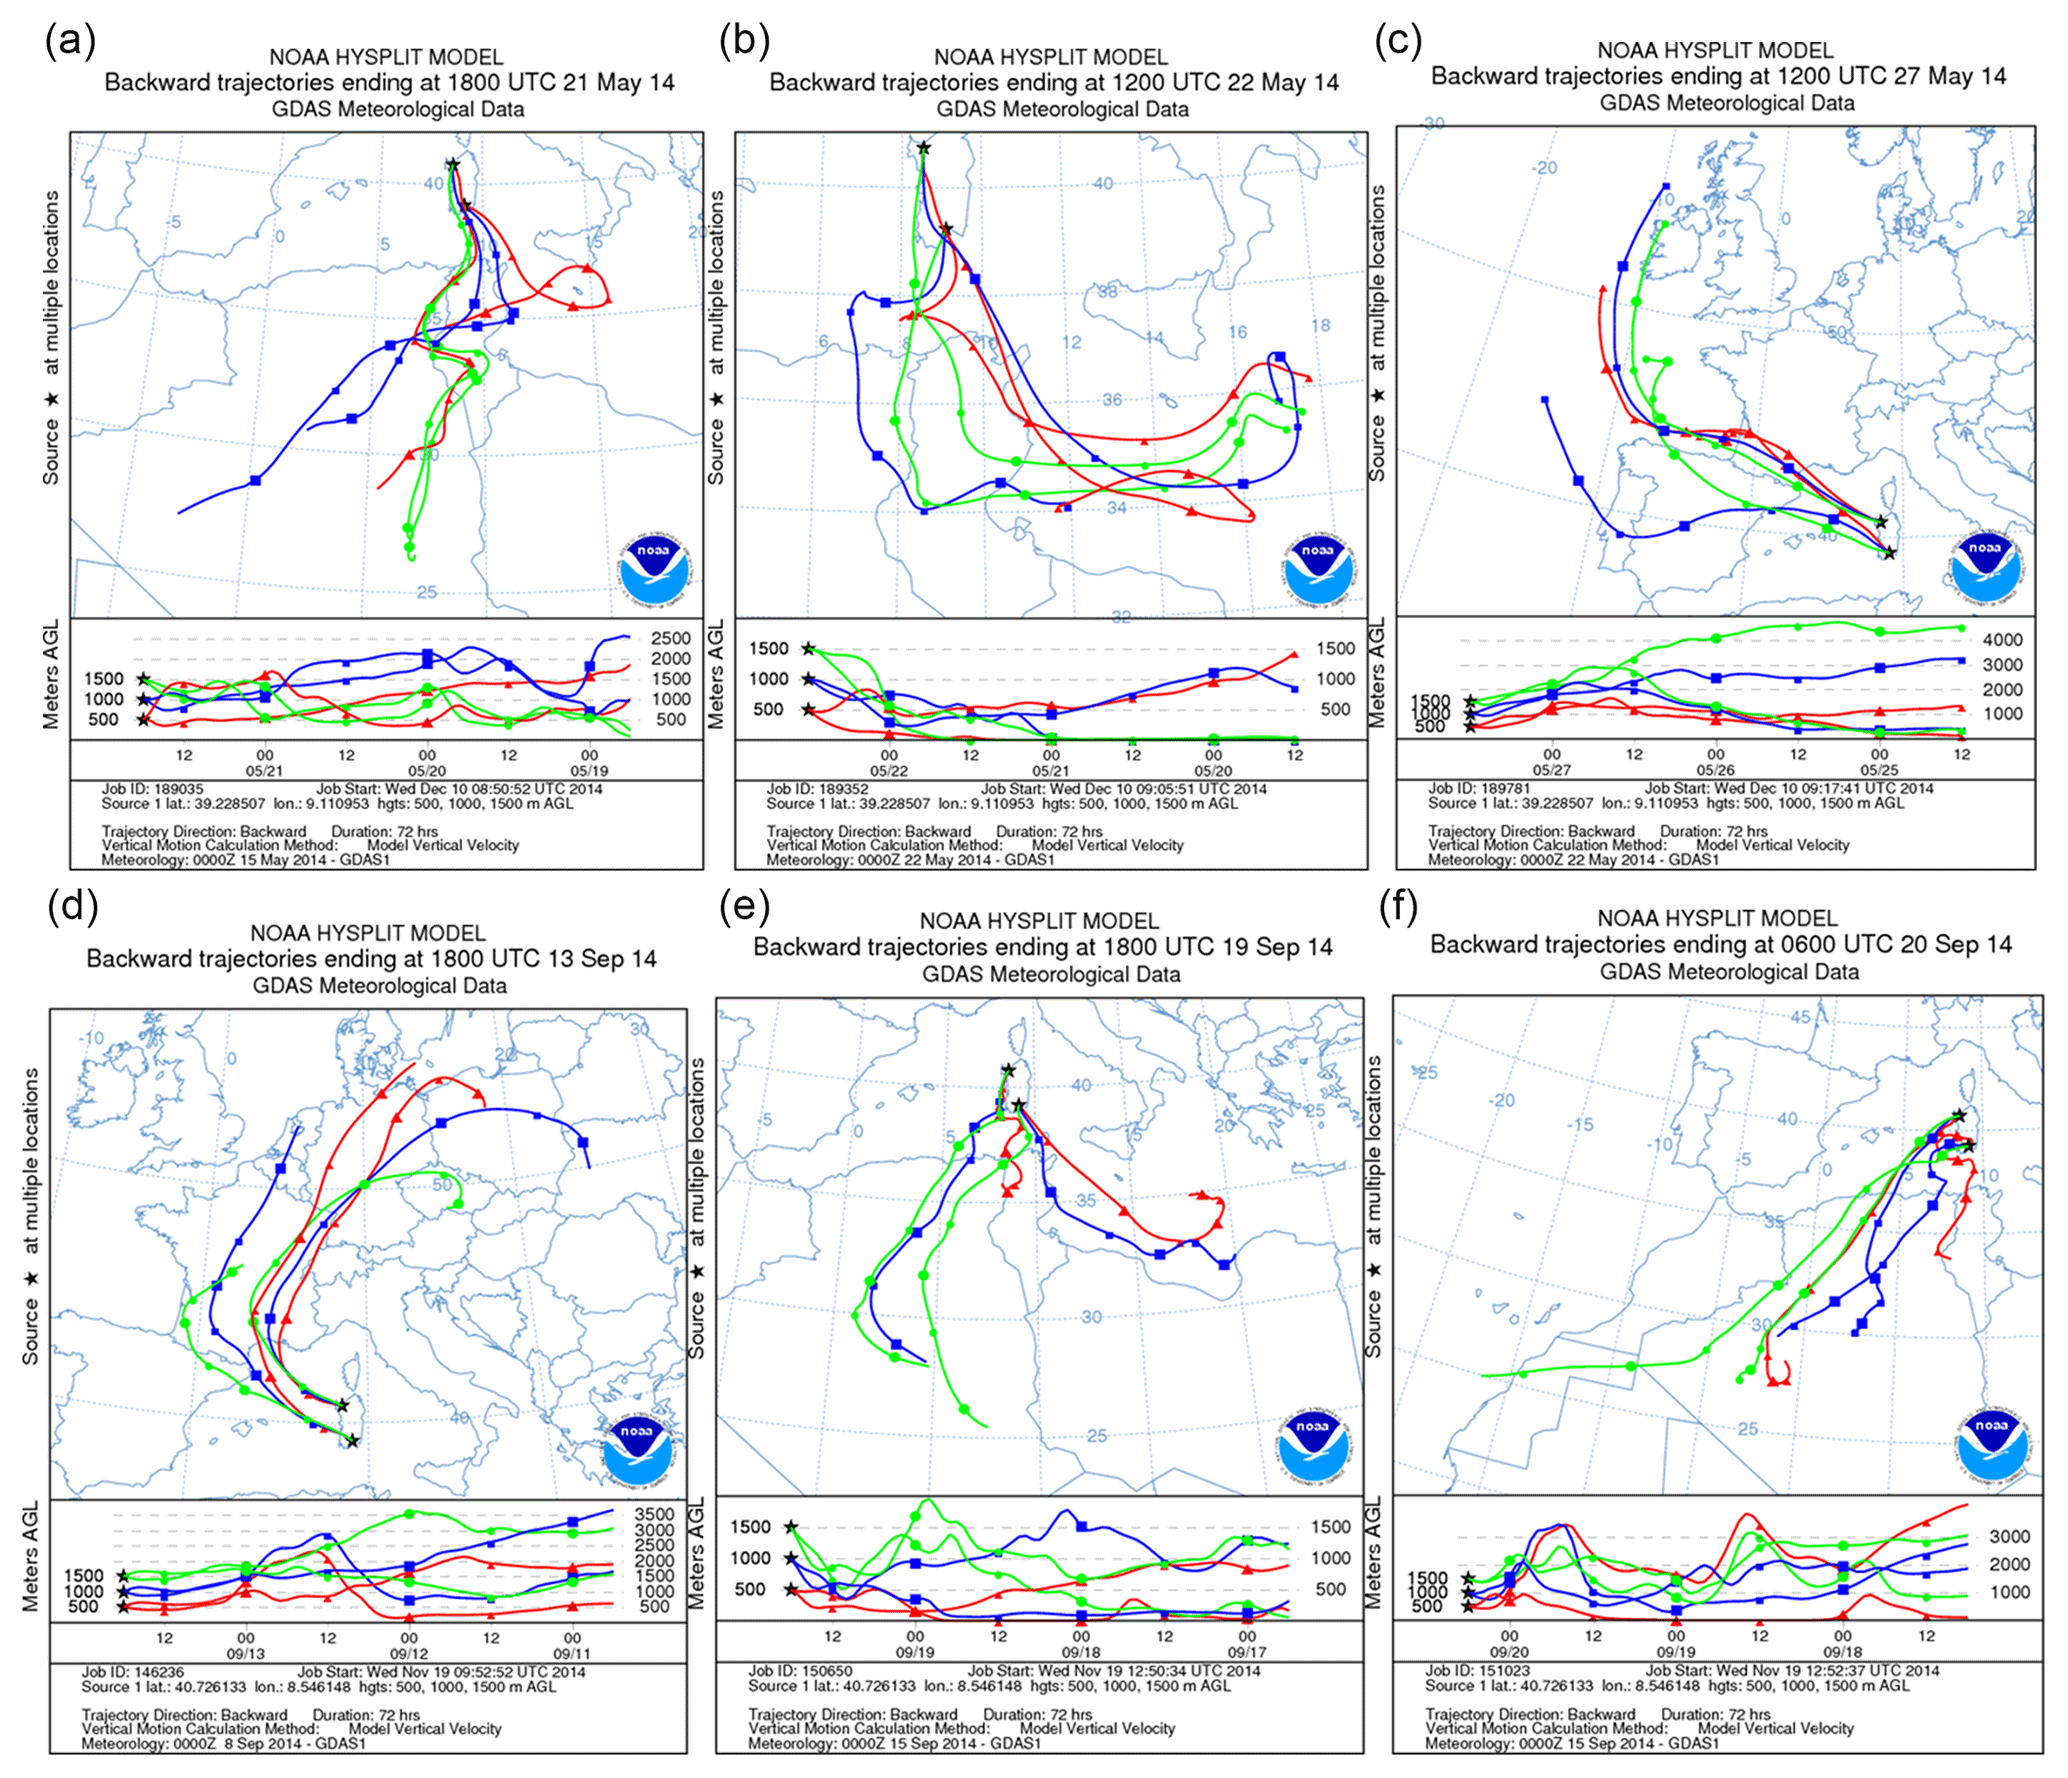
Figure 2(a–c) The 3 d air mass backward trajectories calculated by the NOAA HYSPLIT model ending at 18:00 UTC 21 May, 12:00 UTC 22 May, and 12:00 UTC 27 May 2014 at both sampling sites. (d–f) The 3 d air mass backward trajectories calculated as above, ending at 18:00 UTC 13 September, 18:00 UTC 19 September, and 06:00 UTC 20 September 2014 at both sampling sites (credit to https://www.ready.arl.noaa.gov/HYSPLIT.php).
The date of 27 May was selected as a “clear day” featuring weather no longer conducive to air convection from Africa to Sardinia. Such conditions consisted in overall European low pressures as opposed to high pressures over Mauritania, Mali, Libya, and Algeria (Figs. S2 and S3). Particle back-tracking supported the evidence of a slow flow of air masses only from northwestern corners on 27 May (Fig. 2c).
An outbreak of dust on Sardinia was recorded again in 2014 during the second fortnight of September. Low pressure from the northwestern coast of Spain to Morocco was opposed to a parallel high-pressure system that extended over north Africa (Libya, Algeria, and Tunisia) through Sicily. This circumstance caused the flow of dust-carrying air masses over the Mediterranean basin, reaching in particular southern Italy and Sardinia. Air movement from the African continent made air temperature rise to values above the usual September means, with a peak on 20 September in Sassari (northern sampling site) and on 21 September in Cagliari (southern sampling site) (Fig. S4a and b). In relation to this condition, from 19 through 21 September a dust outbreak from the Sahara flew over the Mediterranean and entirely covered Sardinia. The relative wind fronts and pressure values are shown in Fig. S5 in the Supplement. Patterns of PM10 from daily records taken at both Sardinian sampling stations also displayed a rise during the dust outbreak (Fig. S4c). Satellite imagery confirmed again the occurrence of incoming dust-loaded air masses from northern Africa (Fig. S6 in the Supplement) consistent with their 3 d back trajectories (Fig. 2d–f). Those confirmed that on 19 and 20 September airflows were of north African origin. In contrast, about a week earlier, 13 September had featured low pressures over Italy while high pressures were recorded over the southern part of Morocco, Algeria, and Mauritania. This picture was not permissive for any transport of air loads from Africa to Sardinia, and the day was therefore considered the clear-day reference of the period. Air representative of the dust outbreak condition was thence sampled from 19 through 20 September, while the corresponding control air was collected on 13 September.
3.2 Bacterial community composition
A synoptic view of the results at the phylum/class level is shown in Fig. 3. Details on orders are shown in Table 1. Complete data are available in Datasheet S1 in the Supplement.

Figure 3Pie charts of percent relative abundance and cluster analysis dendrograms (Euclidean distance method, complete linkage) constructed on the identified bacteria grouped at the phylum/class rank level, as stemming from the OTU annotation of the DNA sequencing from the filtered atmosphere sampling. SS: Sassari station, northern Sardinia; CA: Cagliari station, southern Sardinia; Dust: collection during dust outbreaks brought by winds from Africa; Ctrl: control, collection upon opposite wind front change, following (May) or preceding (September) the dust outbreak. The data available from the two 12 h sub-periods (hours 0–12 and hours 12–24) collected during the dust events were merged together in the corresponding pie charts to be compared at an equal sampling duration with the 24 h control samples. The Sardinia contour map in white (control) or black (dust) and the red dot, pointing at the sampling site, are shown. The squares providing a color legend to the taxa names follow a corresponding clockwise order of their possible presence on each pie chart.
Table 1Percent frequency of sequences belonging to the indicated orders in the averaged data of all samplings (dust and control) of each sampling period (May or September). Data in which frequencies were higher than 1 % in at least one of the two seasons are reported. These represent 91.1 % of the total sequences for the May sampling (on a total of 65 orders found) and 79.4 % of the September sampling (on a total of 118 orders found). Means±standard deviation are shown.

In terms of conserved taxa the core of those observed more regularly included classes such as Gammaproteobacteria and Bacilli (Firmicutes phylum) and orders such as Actinomycetales (Actinobacteria phylum); for each of these their maxima were seen in the May samples where they reached percentages above 90 %, while their minima appeared in the Sassari controls in September with values around 50 %.
The Actinomycetales order was found in all samples; in particular it was featured in the south-facing station (Cagliari), and its numbers tended to double in relation to the dust events. The overall levels of relative abundance as well as richness within members of the Actinobacteria phylum increased from 5.66 %, observed in May, to 13 % in September. Particularly enriched were the Gaiellales and Solirubrobacterales orders within the Thermoleophilia class. The orders within the Firmicutes phylum, which dominated the May samples, were Lactobacillales and Bacillales. Their relative abundances were higher in the Sassari (northern Sardinia) control samples than in those collected at the southern point of Cagliari, with values of 37 % vs. 12 %, respectively. At the same time an unchanging level of 25 % was recorded in both control and dust samples in the south-facing location. In the September samples the situation was different as in both controls those orders were below 15 %, while during the dust outbreak it was 25 % in both Cagliari and Sassari stations.
The May sampling was also characterized by a large share of Gammaproteobacteria, a class reaching 75 % of the dust-related spring samples in Sassari. In particular, Pseudomonadales and Enterobacteriales were constantly observed. Some taxa appearing as spring-signature cases were detected in the Alteromonadales with Marinimicrobium, Marinobacter, and taxon OM-60. For the fall period instead, Xanthomonadales recurred with some genera in the Sinobacteraceae family, amounting to 1.2 % and 2 % in the dust-free controls of Cagliari and Sassari, respectively. Within the Alphaproteobacteria class, Caulobacterales, with genera related to Brevundimonas, were at a 1 % relative abundance level in the Cagliari samples collected during the dust episode of May. The Rhizobiales order was present in both seasons with a 3 % peak in spring (Cagliari, dust-related), dropping to 1.5 % in all fall analyses. In the same period Rhodospirillales showed a relative increase, particularly in the controls in Sassari where they reached 3.4 %. The Burkholderiales (class Betaproteobacteria) of the population were found at 1 % in May within the dust-related sequences and at higher values, reaching 2.7 % in Cagliari and 4 % in Sassari, in the controls of September. Some groups appeared rather period-specific such as the Mollicutes for May, while the Pirellulales order (in the Planctomycetes phylum) and the classes of Nitrospira and Gemmatimonadetes characterized the September sampling.
The numerical effect of the different sampling period on bacterial communities is visible in Table 1, comparing in this case the mean relative abundances of the main orders in the 2 sampling months, grouped independently from site and meteorology events. Among the most evident phenomena confirmed by this single-variable grouping, the September campaign shows the enrichment in the Actinomycetales order and in a number of others that were below detection in the May sampling. In parallel, the diminution of the formerly dominant Enterobacteriales and Pseudomonadales and the substantial stability of the Bacilli across the compared times were observed.
Besides the comparisons that included all OTUs to put in evidence community variations,we exploited in parallel an additional opportunity to detect possible dust-specific taxa. The rationale was to seek differential enrichment within the dust storm, by dissecting the process, during its progression, splitting its onset from its fully established stage. To this aim, we collected separately the filters of the first 12 h of the event and replaced them with new ones that collected air during the second lapse (hours 12 to 24). Thus the availability of two timeframes, both within the dust event, allowed us to verify which OTUs would be incrementally enriched along with the progression of the stormy condition.
This allowed us to better refine the bacterial deposition dynamics during the outbreaks. From the visual and physical points of view, an increase in the inflow of air particulates was observed for the 12–24 h period, confirming the differential level of deposition occurring in the maturity stage of the meteorological phenomenon.
This within-outbreak setup was essentially aiming at individuating OTUs that would display high variation in relation to dust events in comparison to those that would not. The latter were considered to represent the common core of bacteria that were constantly present in samples, irrespective of the changing meteorological events. To apply this distinction, the criterion was to set a cutoff value with respect to the percent of variation occurring between the first 12 h of the collection time and the second half of it. The choice of this threshold was considered critical, and, in order to ensure robust conclusions, we deemed it necessary to require a considerable consistency of variation. Pointing at this objective, only the taxa which displayed a mean variation higher than one-half of the corresponding standard deviation were taken into account. The resulting level of variation in the two sampling stations is reported in Table 2, and the corresponding number of orders is displayed in Table 3. The Sassari (north-facing) collection site was the one that in both seasons resulted in featuring the highest number of significantly changing taxa. The identities of these are shown in Fig. S7 (May event) and Fig. S8 in the Supplement (September event). In the graphs, the first 12 h lapse is plotted above the baseline, and the second (12–24 h) is in the specular position below.
Table 2Extent of OTU change across cell harvesting time during the same dust outbreak sampling. The percent variation (either increase or decrease) of a given OTU's abundance between the values found in the community obtained by the first 12 h sampling and the ones resulting from the following 12 h lapse was computed. The average, minimum, and maximum percent variations between counts are shown. Only taxa displaying a difference in percentages higher than half of their standard deviation were selected for the present comparison.
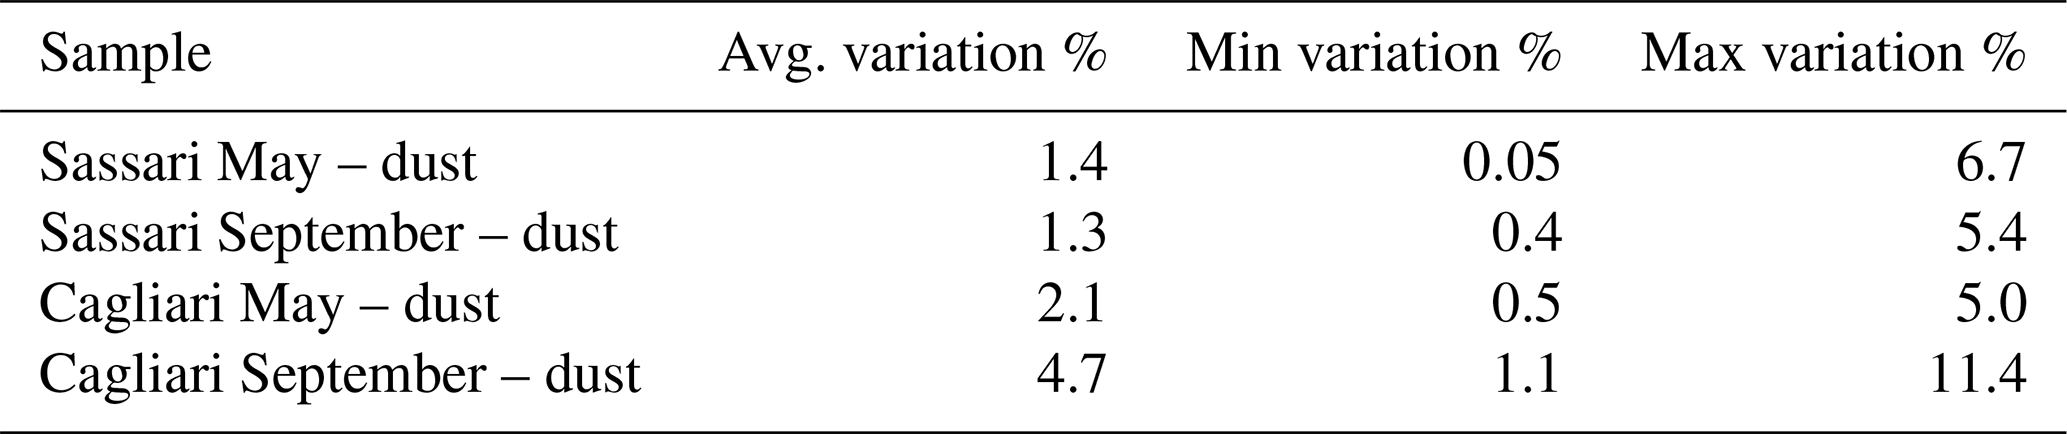
Table 3Community richness at order level of taxa occurring during dust events and of those displaying variations higher than half the standard deviation between the first 12 h and the second 12 h sampling period (selected orders). The orders selected upon this criterion as a percentage of the total of the orders observed in samples collected during the dust events is indicated.

Table 4Ecological diversity and evenness indexes resulting from the sequence checklist analysis in the different samplings.
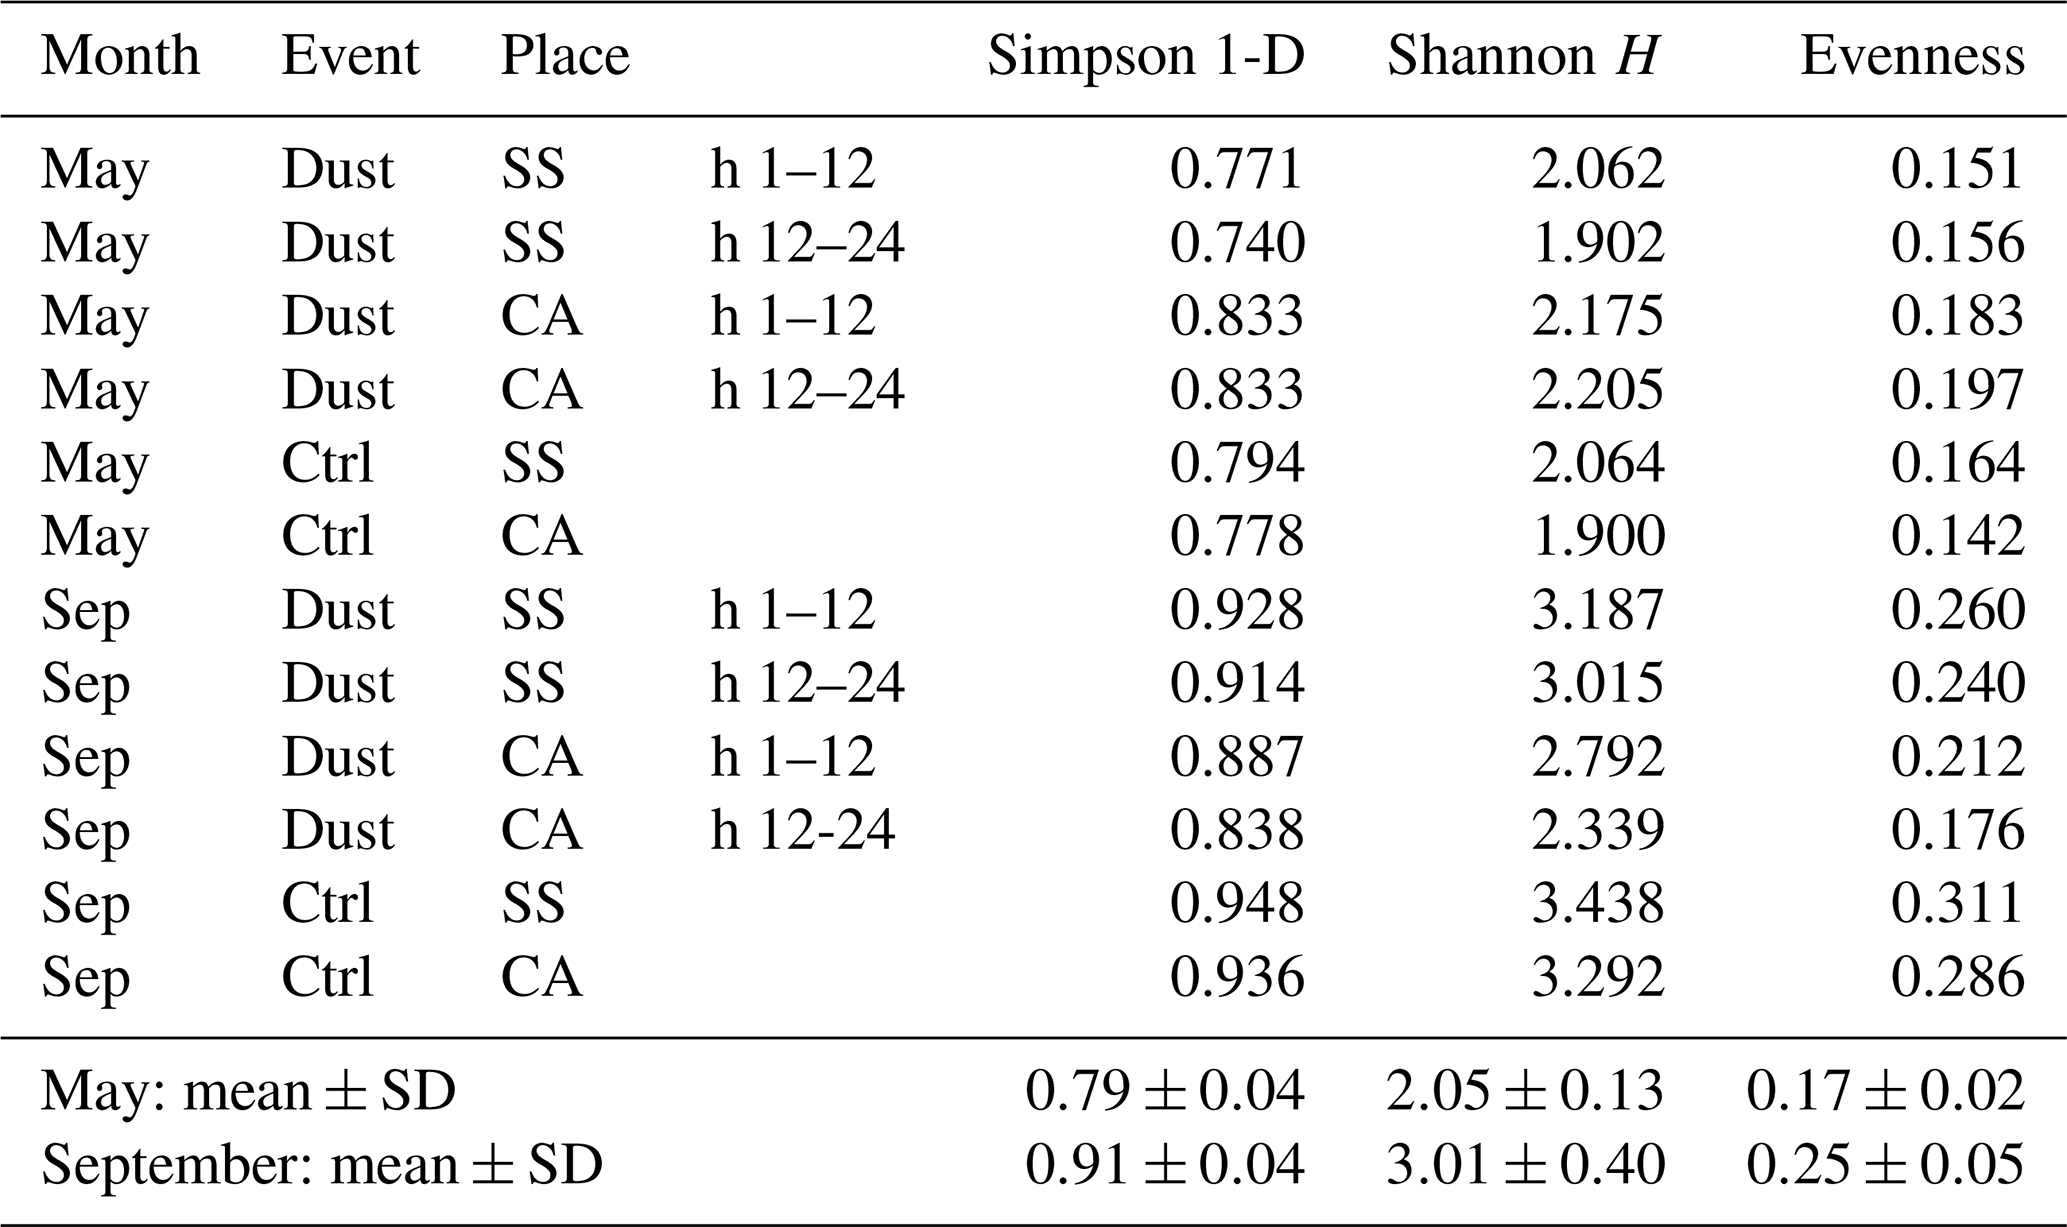
As regards the ecological indexes characterizing the communities, species diversity and evenness values were calculated, and results are shown in Table 4. The difference that can be appreciated is mainly relative to the series of September samples, in which all had higher values for each of the indexes when compared to the May ones. Conversely, neither the presence of dust events nor the sampling location appeared to confer relevant differences in this respect.
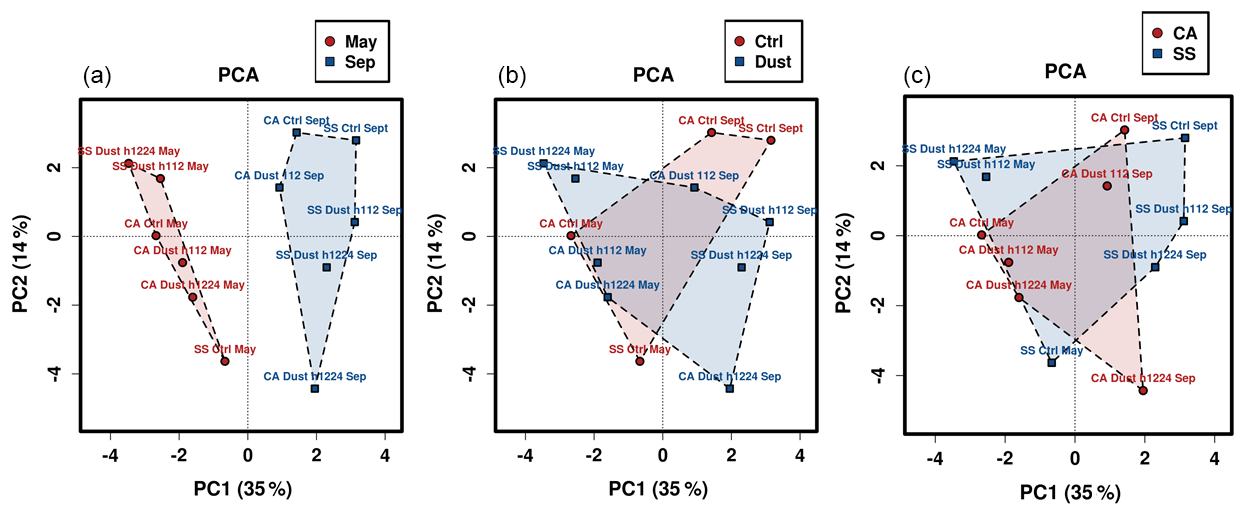
Figure 4Principal component analysis (PCA) ordination plot of the bacterial community compositional data. Polygons encompassing the positions of three different variables are drawn to visualize sampling month (a), ongoing meteorological event (b), or sampling location (c).
The patterns of conservation and diversity involving the bacterial communities analyzed were subsequently inspected by multivariate approaches. Principal component analysis yielded an output (Fig. 4) that confirms how a separation of communities can be viewed only when considering the temporal factor (Fig. 4a), while the variables of dust vs. calm air or the sampling location led to plots with heavily overlapping patterns. The May vs. September divide occurs along the horizontal axis, i.e., the one explaining the highest fraction of variation (35 %). The same phenomenon is reproduced with higher support (54 %) in a parallel ordination approach, the principal coordinate analysis (Fig. S9a in the Supplement). In the same figure the main differences occurring in community structure between the two sampling periods are further explored by reporting the ecological indexes of Shannon species diversity (Fig. S9b) and community evenness (Fig. S9c) resulting from grouping the data and separating them only in relation to the sampling period variable, irrespective of meteorology events and collection sites. The superiority of the September values in both indexes, particularly for the taxa diversity, is supported by the significance of the p values of discrimination between samples thereby reported (p=0.00584 for species diversity, and p=0.026 for community evenness).
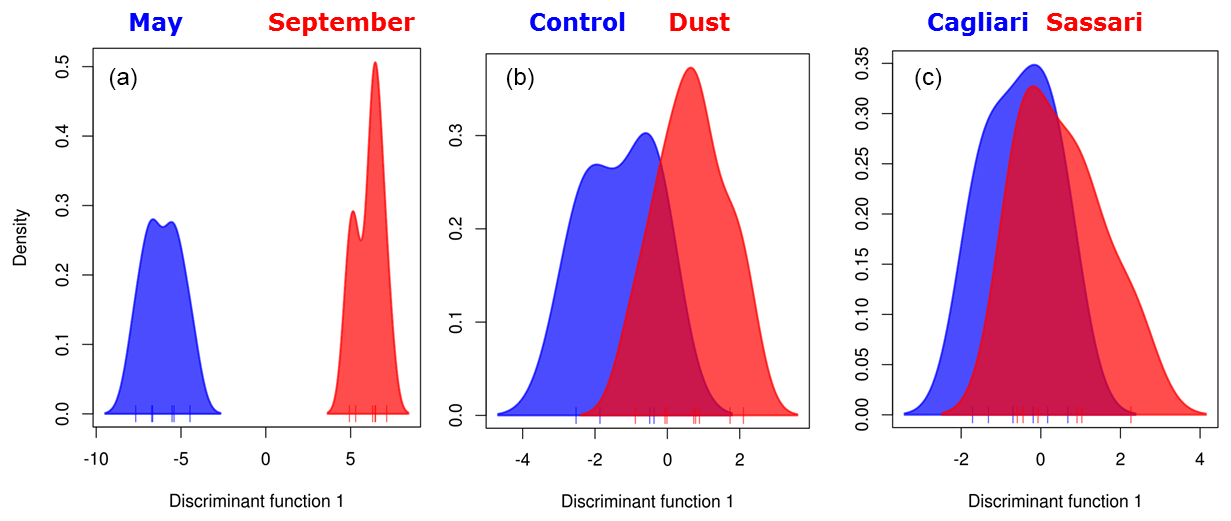
Figure 5Discriminant analysis of principal components analysis. Group partitioning involved (a) sampling month, (b) ongoing meteorological event, and (c) sampling location.
The higher strength of clustering of the sampling date groups with respect to the alternative ones (meteorological or geographical) was verified by running a discriminant analysis on the principal component ordination (DAPC) in which the data are first transformed by PCA, from which clusters are subsequently identified using discriminant analysis, thus partitioning sample variance into the between-group and within-group components. Results are shown in Fig. 5. Besides confirming the sampling period as the strongest driver of community change, the analysis further shows that the dust vs. control clustering is acting more efficiently than the Sassari vs. Cagliari sampling site comparison. This allows us to draw a hierarchical ranking of the three variables in shaping the bacterial airborne communities, in which, noting also the different scale of the horizontal axis (discriminant function 1) adopted for the three graphs, the following order results: .
In order to determine which bacterial taxa were mostly accompanying/causing those changes in a statistically significant manner and to rank their individual importance in this phenomenon, we run an analysis of the differentially featured taxa, testing both an ANOVA and a non-parametric Wilcoxon rank test verification of the ranking. The two tools gave coherent scores, and the results of the ANOVA output are shown in Table S1 in the Supplement. A total of 76 taxa were found featuring p values<0.05, of which, upon applying a stringent Bonferroni-adjusted p-value correction, 6 stood above the significance cutoff and all were within minimal false discovery rate values (FDR<0.005). All of them were cases which were highly reduced in September in comparison to May. The taxon included as the most effective in explaining the differences (p value=0.000019) is the order Oceanospirillales, known as marine oil-spill-associated bacteria (Cao et al., 2013), followed by known animal parasites such as the Coxiellaceae family (Lory, 2014); marine extremophiles such as Thiohalorhabdales (Tian et al., 2017); and three species of Pseudomonas, including the pathogenic P. viridiflava (Hu et al., 1998), the decontamination-associated P. nitritireducens (Wang et al., 2012), and P. alcaligenes which is also reported to be a human pathogen (Suzuki et al., 2013). The two corresponding analyses of differentially represented taxa by meteorology or by geography, i.e., grouping dust vs. calm air or Cagliari vs. Sassari sites, did not yield any significantly supported cases under the Bonferroni-adjusted p-value stringent condition (data not shown).
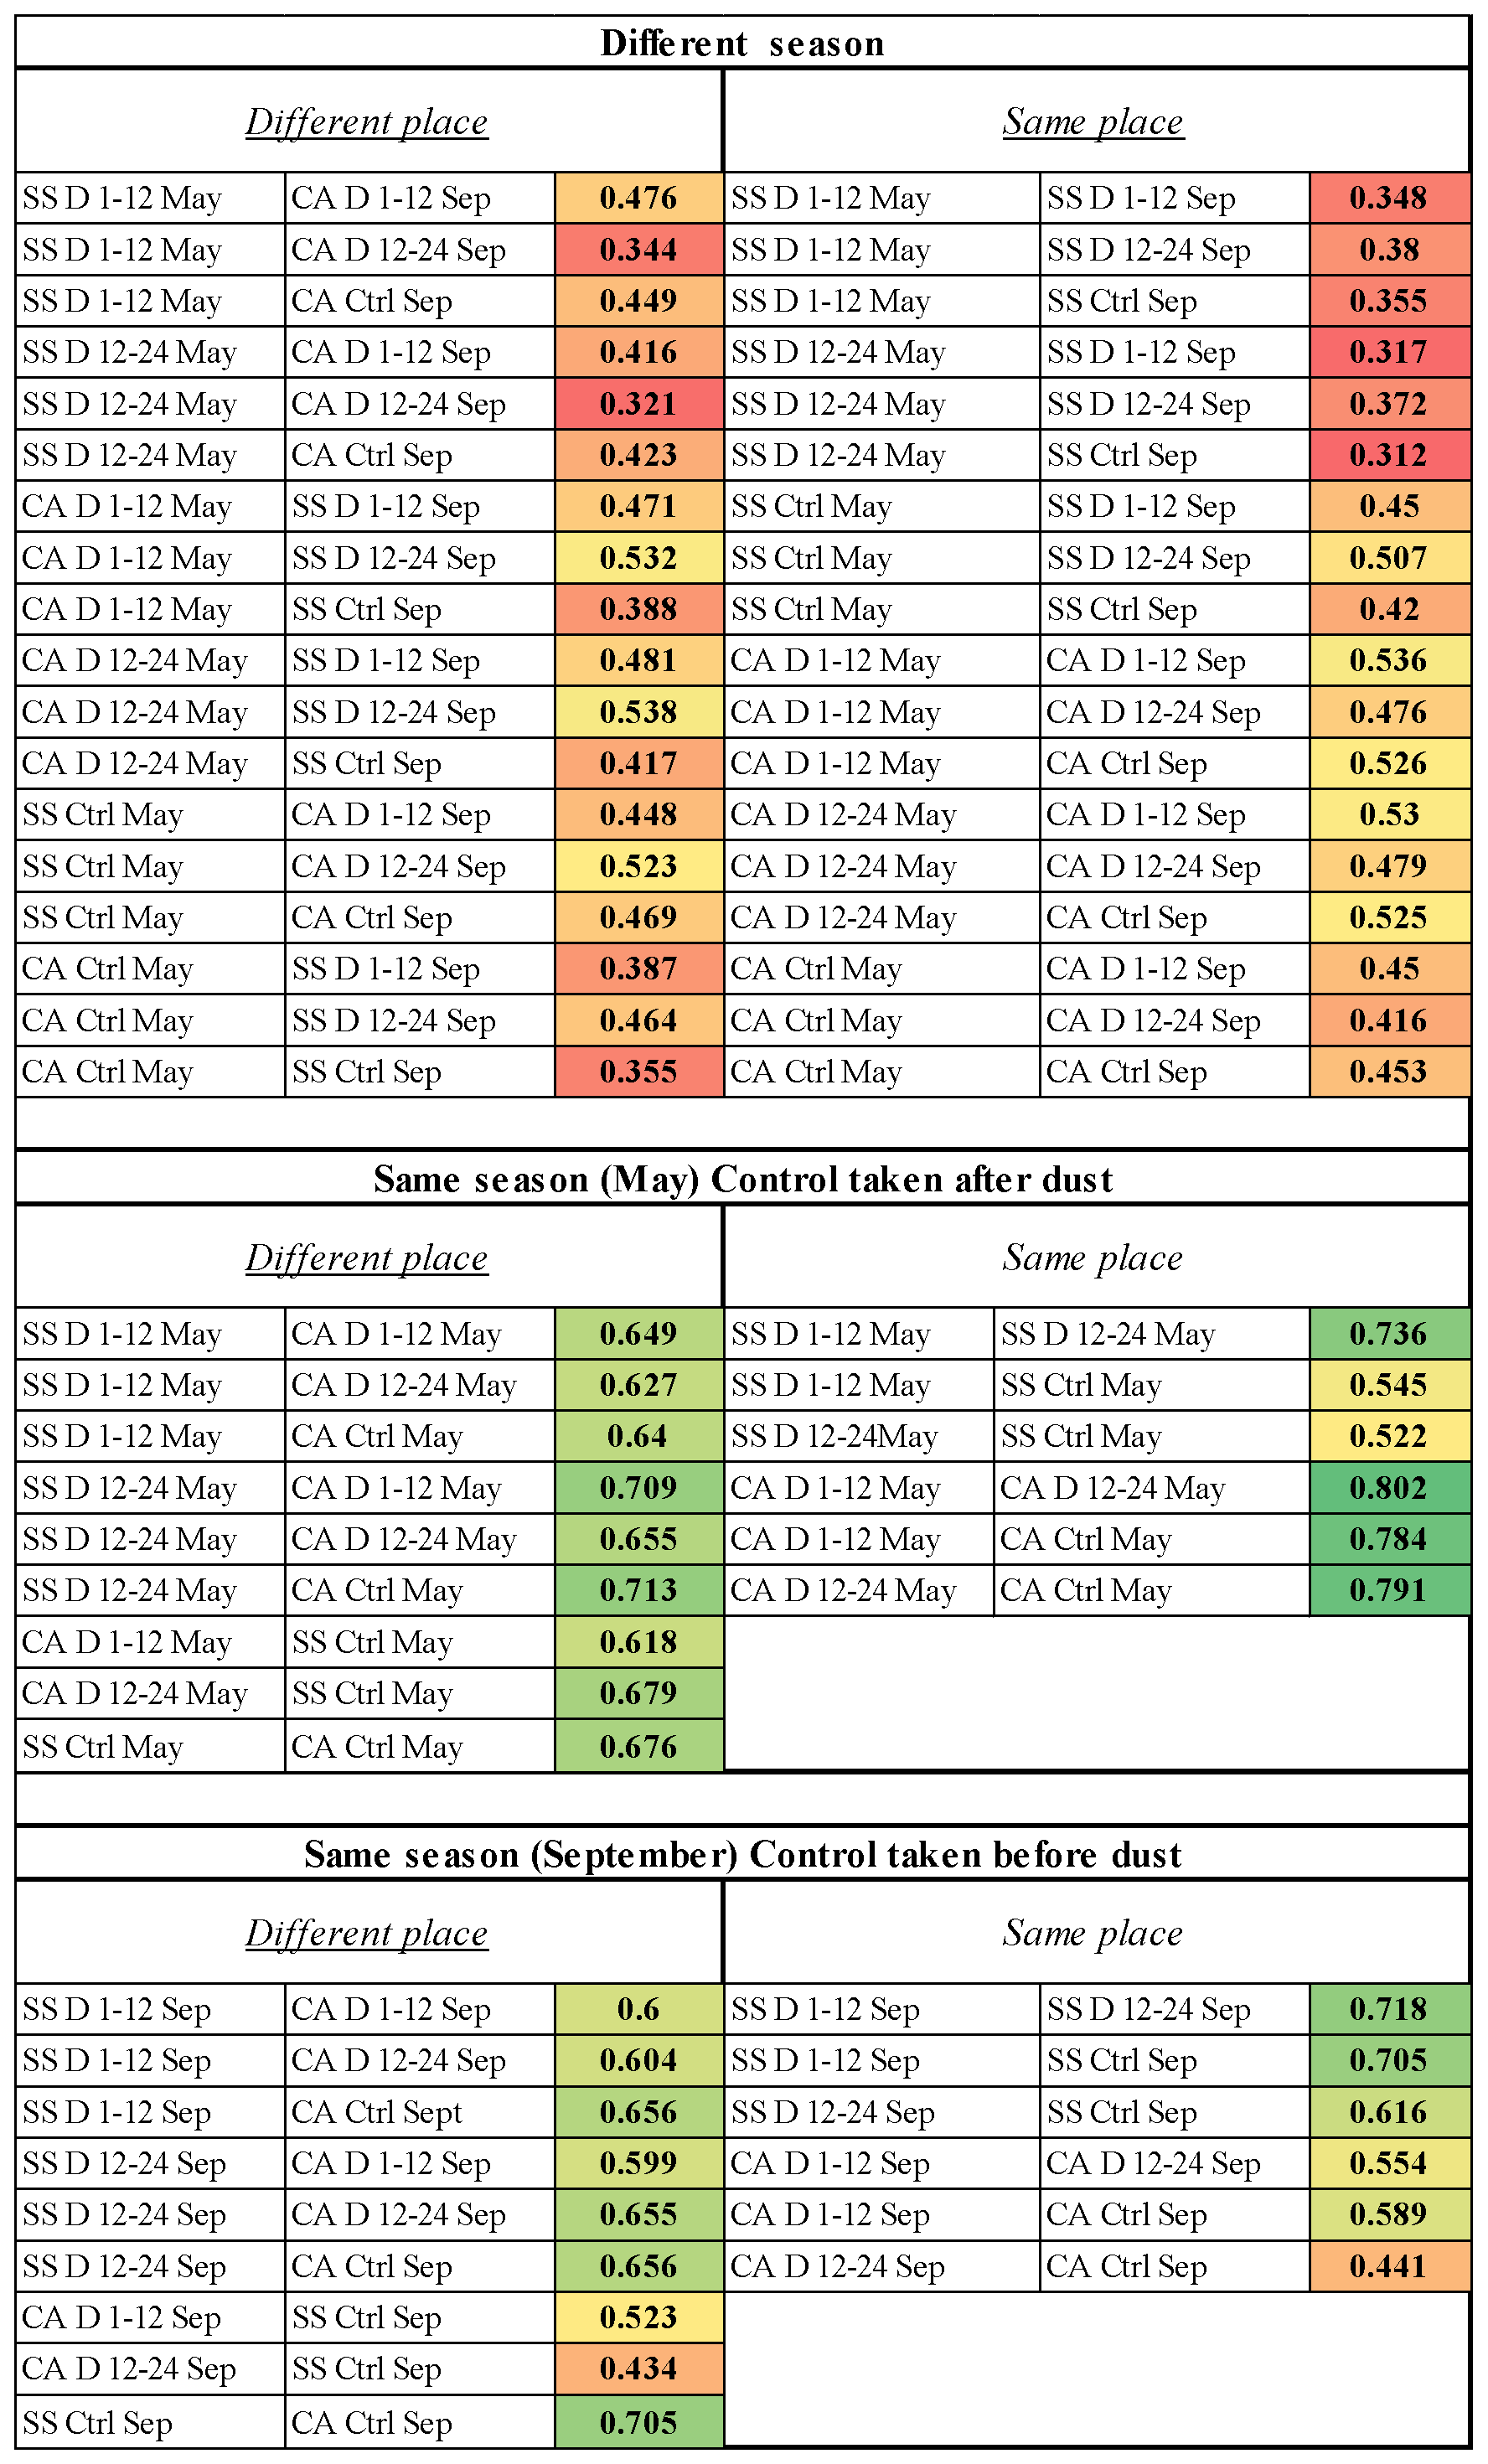
Figure 6Bray–Curtis similarity values between the bacterial community composition resulting from pairwise comparisons of all samples. SS: Sassari; CA: Cagliari; D1–12: dust event, first 12 h period; D12–24: dust event, second 12 h period; Ctrl: control conditions (absence of dust events); Sep: September.
In order to compare all communities with each other and extract further information on their degrees of divergence, the sequencing data were analyzed by individual comparisons across sites and dates. The results of each of the 66 pairwise combinations are shown in Fig. 6, displaying the Bray–Curtis similarity values between each couple of communities. Color-based conditional formatting applied to the values allows us to appreciate how all the comparisons involving different seasons show the most divergent scores (red shades) in comparison to those within the same season, which show much more similarity, with a few exceptions related to dust events and depending on the aspect faced by the collecting site with respect to the incoming wind direction.
Two technical aspects to be defined beforehand are the definitions of “sample” and “control” that apply to this type of study. An atmospheric sampling is not to be regarded with the same conceptual metrics that would apply if one were to study water or soil environments, in whose cases, a sample could correspond to 1 L or 1 g, respectively, taken from those milieus. In air filtering the operation is carried out continuously for days, and one sample, in our tests, accumulated the content of 56 160 L of continuously changing atmosphere, which takes into account the variations that occur during all those hours, inclusive of the day–night shifts. One sample is therefore not a “point” but a built-in averaged replication protocol for the chosen window of events.
Second, as regards the definition of control in our study, it is not meant to represent a supposedly stable community that could apply to a hypothetical average dust-free local scenario. As several studies cited in the introduction showed, even in the absence of dust outbreaks, the ambient state of the atmosphere is not stable either. Our goal therefore was not to compare a hypothetical status quo with an altered one. Since the airborne community composition changes daily even during periods that do not feature the dust-carrying episodes, there is not a stable condition that could be considered a durable control community. Even the evening and morning opposite breeze regimes that occur daily in coastal locations impart modifications in local airborne communities. The meaning of the control here was instead meant to catch (1) the first possible timeframe after the stopping of a northbound dusty wind outbreak (it occurred in May) or (2) the latest possible timeframe of a situation before the onset of a dust-carrying change in wind regime (it occurred in September). Hence, in the latter event the control is not intended as a situation of calm that could represent a period of unknown length but rather as the time-zero sample of the dust event itself. In contrast for the former case in May, the control was symmetrically defined as the earliest stage of quiet after the storm.
In the present study the filtered air particulates were analyzed in different seasons and under different wind regimes, using culture-independent DNA-sequencing-based approaches targeting the species-diagnostic 16S rRNA genes from the air-carried bacterial community and an Illumina next-generation sequencing platform. Sites were also selected because of their opposite positions facing Africa (Cagliari) or continental Europe (Sassari). The whole analysis was performed within a 7-month time lapse, March to September, also chosen as it offers higher probabilities of weather shifts favoring both northern and southern winds (Israelevich et al., 2012). This timeframe proved suitable to the scope as it was possible to exploit two episodes in which dust outbreaks carried by winds of African origin occurred and were preceded and followed by inversions of the air circulation, offering control sampling periods with opposite features.
Commenting on the taxonomical abundance shifts observed between May and September and trying to interpret the rise of some phyla and the drop of others (Fig. 3; Table 1), a preliminary consideration needs to be recalled. The issue has to do with the distinction between actual population dynamics (ecologically ruled) and mathematical effects of sampling from a “ballot box” of objects, all of which compete for the constrained 100 % format of results (probability-ruled). This caveat was put forward as early as statistics itself was born as a discipline (Pearson, 1897). There is in this respect a general problem in comparing communities at different time points (and even more with DNA-based methods with fixed total DNA amount processed) whose results are based on percent values (relative abundance of taxa). In that condition the multiplication of any taxon obviously determines a reduction in the relative abundance of others, when those do not grow at an equal or higher rate. Therefore, one given group could have been increasing, but its share in the sum could appear as if it had instead decreased if a different group has increased faster. This consideration applies inevitably for all metagenomic/metabarcoding surveys and should be kept in mind for all kinds of interpretation about increases and decreases, which could be either real or apparent (when driven by a stronger change in a different group). As a consequence, comparing different sampling points through time is linked to this inevitable constraint: the compositional nature of the datasets binds all relative frequencies to each other (Gloor et al., 2017). Therefore, since, as mentioned, the sum of them is bound to always give 100 %, the decrease in a given species could be either apparent (driven by the increase in another) or real (due to its actual negative population dynamics). The problem is that the two causes can not be uncoupled by just comparing species frequencies at the two sampling periods. Moreover, as mentioned, even an actual increase in a given species could be masked by the parallel increase in another at a faster pace (or by its net immigration into the scene). For this reason, we consider with caution the possibility of looking at taxa fluctuations as indicative of their actual ecological outcomes. In order to explore the extent of this possible bias, we compared the results of the ordination plots yielded by two data transformation procedures; in addition to the TSS square root transformation, we also checked Aitchison's centered log ratio (CLR) transformation. Notwithstanding some slight changes in the shape of the ordination plots, observed phenomena and ensuing trends that we point out and describe in this report were found to be the same. The reasons for which we opted for showing the former transformation procedure (TSS) is that the combination of total sum scaling with square root transformation is the renowned “Hellinger transformation”. This has been praised as a preferable choice in ecological community comparisons, (Legendre and Legendre, 1998), as it offers the best trade-off between linearity and resolution in comparison to chi-square metrics and other approaches. It is also recognized as more balanced for the weight given to rare species.
Having clarified the risks in comparing metabarcoding surveys across time, we will therefore limit ourselves to commenting on only the major phenomena that stand out from the comparison. The largest taxa trade-off that is apparent when comparing the two periods is the decline in Proteobacteria and the parallel rise in Actinobacteria. Trying to frame this within possibly seasonal parameters, we can consider that the latter typically rely on profuse spore formation from colonial growth, while the former are non-spore-forming bacteria that are motile via either flagella or gliding/swarming mechanisms. The basic life forms of the two groups predict therefore that Proteobacteria would be more suited to wet seasons and vice versa for the soil-dwelling Actinobacteria. This phylum has been reported by other authors to reach its peaks in fall (Glöckner et al., 2000). Being also a group of major litter decomposers, its rise along with the end of the plants' vegetative season can be seen as compliant with its landscape and ecosystem cycles.
A further ecological aspect that can be commented on is the higher diversity of the communities during the September sampling in comparison to May, independently from the dust events and from the sampling station location.
This phenomenon, besides the ecological value differences (Tables 2, 4 and S1, Fig. S9), can be also appreciated visually, by comparing the left and the right pie charts in Fig. 3 (featuring community composition at order-rank level and the corresponding cluster analysis based on their relative percentages) and noticing the more complex color-coded pattern of the latter sampling, also showing a consistent similarity of most color sectors' presence and proportions. It is not possible from these single-year data to deduce whether such an increase could be part of a recurring seasonal phenomenon causing, cyclically, higher species richness after summer periods or if what we observe could be part of a different pattern of stochastic variability.
Nevertheless, the overall partitions of systematic groups observed in a given sampling time, irrespective of dust outbreaks or sampling corner of Sardinia, share much more similarity within the samples of that period than with any of those collected in the other season. It appears that in general, air collected during dust discharge from a Saharan wind can account for less variation over its reference control sampling than the choice of sampling that site 4 months apart.
In our prior work (Rosselli et al., 2015) we had studied community composition in the same Sardinian stations in a short period of winter (in late February) during and after a single dust-carrying event. In that study the main feature evidenced was the existence of a conserved core microbiome, encompassing 86 %–95 % of the taxa, to which the incoming dust would cause some detectable diversity variation but on a rather limited proportional scale. Such a minor effect of the dust-lifting storms observed in winter is in fact confirmed in the present work in which the time of the year factor appears as the variable of major order in shaping community structure and richness. In that prior analysis of ours the existence of a common core microbiome of the investigated area was one of the suggested pieces of evidence. That concept stemmed from the analysis run in February and therefore towards the end of a winter period throughout which Europe experiences its minima in terms of temperature-driven air turbulence events and as a consequence receives more limited influxes of air traveling from seas to land. In the present analysis, we observe that, in spite of the major changes brought about by the temporal factor, the two sampling stations at opposite corners of the 270 km long island shared the closest level of community composition when they were compared at the same time (see CA Ctrl vs. SS Ctrl in Figs. 3, 4, S9, and 6). Moreover, this similarity was maintained in May even though the two control stations were compared after the dust outbreak. Foremost, those two distant sites achieved the maximum of community overlap in September, when controls were compared immediately before the next outbreak, after a 109 d long period without such events. During that time the air microbiome of the whole area appears to have changed profoundly but in a concerted fashion, leading to high uniformity across the island. These data confirm the view of the prevalence of a core microbiome, as emerged in our 2015 report and add the evidence that such an extended core community also undergoes a temporally related concerted turnover. Whether or not this could be also a seasonal (regularly recurrent) phenomenon will have to be demonstrated by further research on this subject.
Literature reports have in this sense pointed out differences in airborne microbial composition between seasons; peaks of fungi causing invasive infections in humans were signaled in spring, whereas higher proportions of allergenic fungi were observed in fall (Yamamoto et al., 2012).
Consistent with the present data, a higher diversity of both fungal and bacterial airborne cells in late summer and early fall has been observed in United States-based surveys (Bowers et al., 2012, 2013).
Hypotheses to explain the increase in circulating taxa widely observed in the fall sampling campaign can be formulated. In the first instance one should consider whether there could have been a change in the prevailing wind origin or direction across the period that encompasses the two sampling seasons. This can be evaluated upon inspecting publicly available meteorology records showing the wind roses for the two sampled localities. These data, from March to November, for the Cagliari and Sassari weather stations, are shown in Figs. S10 and S13 in the Supplement, respectively. In the Cagliari plots (southern Sardinia) it can be observed that between May and September there was basically no variation in the wind patterns, with the prevailing ones blowing towards the northwest with stable intensities. Likewise in the Sassari area (Fig. S13), although some fluctuations in the strength of the westbound winds can be seen, the dominant air motion throughout the period remained the one heading south. In essence these data allow us to rule out that the change in community patterns could be due to major air-driven events of taxa immigration from other insular or continental sources.
In addition to the wind orientation and force, data from the two stations regarding temperature and humidity of the same winds can be analyzed (Figs. S11, S12, S14, and S15 in the Supplement). Humidity values from May to September winds tend to be rather similar, whereas air temperatures increase in line with the summer progression. These data do not account by themselves for events of species enrichment either.
Another aspect that can be verified is to compare the two periods in terms of PM10 particulate concentration; these periods are reported in Figs. S1c (May) and S4c (September). Although there are obvious peaks of PM10 in correspondence with the dust outbreaks dates, the basal levels of PM10 concentrations before and after those peaks are rather similar in the spring and fall period. This rules out the possibility of a diversity rise linked to a general increase in such small particles traveling over the areas.
The observed data reveal that, while dust-associated winds can account for some specific limited ingression of taxa, a far more noticeable pattern appears consisting in a successional rise in taxa diversity. It is not yet possible to establish whether this occurrence could be linked to late summer in relation to the climatic conditions of the season. The second part of the summer, especially in the Mediterranean regions, is characterized by prolonged drought alternated with irregular thunderstorms. The incoming of a thunderstorm is accompanied by convective instability of the atmosphere, and this phenomenon has already been pointed out as conducive to the emission and transport of fungal spore plumes (Burch and Levetin, 2002). A possible explanation for a richer pattern of airborne microbes after several weeks of a prevailingly dry climate can be sought in the acknowledged fact that those seasonal conditions enhance the daytime height of the planetary boundary layer over Europe and the continental USA (Seidel et al., 2012) and that the ensuing low pressures foster the turbulence near the ground and the overall convection, resulting in a frequent uplift of particles from land surfaces. In addition, it could also be postulated that the drier and warmer summer conditions can eventually lead to partial cell dehydration in microbes lying at the soil or vegetation surface, resulting in lighter cell weights more prone to being advantageously lifted by the local low-layer air turbulence.
A further factor that can be hypothesized to have played a role in reducing the diversity of airborne community samples in May comes from the analysis of the differentially featured taxa between the spring and the fall samplings (Table S1) where the strongest statistically significant differences were six taxa that were highly enriched in the former period and that, as cited above, included marine bacteria associated with oil-spill-related oleovorous phenotypes, extremophiles, and potential pathogens. These occurrences can be interpreted as possible clues to a transient event of water pollution around the sampled areas that could have also impacted on the overall airlifted microbial diversity.
In addition to the above, a series of considerations can be drawn upon by inspecting the pairwise community difference analysis, whose similarity values are shown in Fig. 6. It also needs to be recalled that, in order to examine the effect of a dust-free period, in May the control (27 May) was sampled after the dust event (21 and 22 May), while in September the control (13 September) was taken before the new dust outbreak (19 and 20 September). Therefore, the summer, within which communities could undergo dust-independent changes, is in fact framed between the two control points, chosen as representative of dust-free atmosphere following a wind direction reversal. Within those months there were no dust-carrying wind outbreaks from the African land. This also enabled us to verify whether a relatively long period without dust intrusions could have allowed an overall homogenization of the bacterial airborne communities over the island of Sardinia. Regarding Fig. 6, we can point out the main message that this color table is meant to convey, which is just the fact that the low-similarity pairwise comparisons (conditionally formatted as red- and yellow-shaded cells) are almost all observed in the upper table, i.e., the between-season comparisons, while the green ones (higher similarities) are all distributed in the two same-period comparisons. The first consideration that stems from the global view of these data is once again that the most distant communities are those compared from different seasons (Fig. 6, upper section). It is worth noticing in this respect that no particular difference appears when comparing communities between those collected from the same site (right panel in the upper section) or between the two different places. Moreover, in these samplings from different seasons, the effects of the dust events in comparison to calm air with dust-free wind regimes are not apparent, being diluted in the major time-related divergence of the communities.
When inspecting cases of the same season, the situation in May represents a comparison picturing the recovery after the dust event, as the control follows the outbreak. One evident aspect in that is how the juxtapositions within the same place feature the most similar cases (darkest shades of green) with the notable exceptions linked to the dust outbreak in Sassari, which is the north-facing station (notice the two yellow-shaded values). On the contrary, such divergence does not appear at all in the south-facing Cagliari site. One interpretation of this interesting difference is that in the May control, when the air flux reversed after the dust event, the wind blowing from the northern quadrant in Sassari was conveying air masses that came straight from the sea, while at the opposite corner (Cagliari), the same air had passed over the whole of Sardinia. Thus, the northern collection station received sea-sweeping air, bringing “fresh” taxa, i.e., not belonging to the Sardinian land-related common bacterial core of the period, while the southern station of Cagliari received instead land-sweeping air that had traveled all the way over the island latitudinal extension, and that therefore would have become mixed with the island-related core of biota. Thus, the sea-related entries would bring little contribution to the southern site communities after more than 160 km of traveling and being diluted through the terra firma atmosphere. This would explain why, in May, shifting from dust outbreak to control in the southern location did not bring community divergence as it did in the northern one.
The imprint of the common Sardinian core on homogenizing communities when the dust preceded the control is also testified by the left panel (same month of May but different places) resulting in all green shades of medium values, showing that in such a situation there was also little difference between different places.
An independent and indirect confirmation of this interpretation is given by the situation in September. In that case, the African dust-carrying event was set to be taken after the control; this originated a reversed situation in comparison to the one observed in May; this time the place where the dust outbreak did not bring particular change was the northern site, Sassari, as the northbound wind of African origin had supposedly already discharged its load while passing over the land of the island from which, at the same time, it would have lifted a vast portion of land-related common biota. Vice versa, in Cagliari, appreciable changes occurred in relation to the dust arrival, which support the view of air blown over the sea plus dust as the elements causing changes due to the new kinds of bacteria that hit this side at the frontal south-facing port of entry of the island. The left panel of the section (same season, September, different place) further confirms this as the strongest drivers of community divergence (yellow to orange colors) are flagged by the two comparisons between the Sassari control and the Cagliari dust situations, and the second of those, in the 12–24 h window of the dust event, is progressively more divergent then that recorded during the first 12 h (0.434 vs. 0.523 similarity value). Moreover, the comparison between the two sites in the September control before dust shows a rather high similarity (0.705), which is the highest among the September comparisons of different sites, which confirms that, before the dust outbreak, when both localities had experienced a long period devoid of such phenomena, the two places had achieved a high degree of uniformity in spite of their distance. In that status, both communities were also profoundly different from their composition in May. A period of over 100 d without intrusions of dust-carrying northbound winds appears to have accompanied an appreciable concerted change in the air-associated bacteria upon the Sardinian territory.
Essentially it appears that when airborne dust has to cross the entire large island longitudinally, it reaches the northern sampling site (Sassari) less charged with community-changing potential and/or it must have lifted bacteria from the Sardinian common core, thus causing little variation upon its discharge over a station on the same island. On the contrary, when landing on the south-facing outpost of Cagliari, coming straight from Africa and, until that moment, having traveled over the sea only with air-lifted transcontinental dust, those air masses delivered in the south outpost of Cagliari an appreciably novel community. The geographic position of the sampling sites in relation to the wind origin appears therefore to play a major role in the pattern outcome. This supports the view that, in the case of dust outbreaks, Cagliari, in the south, is at the forefront of changes that are substantially attenuated before they reach Sassari and vice versa in the case of reversed winds. A distance of >160 km appears sufficient to absorb and buffer wind-borne taxa immigration in quantitative terms, from either side.
In conclusion, the central goal of this study was to assess which variables (sampling period, dust outbreak vs. calm atmosphere, and north-facing vs. south-facing collection site) would be most effective in determining airborne community divergence or homogenization. Data are supportive of time-related turnover phenomena, involving a pattern of diffuse contemporary colonization over large portions of land, whose effect in shaping and homogenizing communities is stronger than the one conferred by occasional transcontinental discharges.
These clues entail novel aspects for our better understanding of microbial transport and spread across territories, as well as of the epidemiological patterns for clinically relevant taxa, and can foster the predictive modeling of overall environmental microbiology dynamics.
Sequences were submitted to the European Nucleotide Archive (ENA) inside the Dust Metagenome BioProject with the accession number ERX836645-56 (https://www.ebi.ac.uk/ena/browser/home, EMBL-EBI, last access: 1 June 2021).
The supplement related to this article is available online at: https://doi.org/10.5194/bg-18-4351-2021-supplement.
PC conceived the project; RM, AS, AC, and PD designed the experiments and supervised the project. RR, MF, MD, GaP, and GrP carried out the analyses and interpreted the data. AS wrote the manuscript.
The authors declare that they have no conflict of interest.
Publisher's note: Copernicus Publications remains neutral with regard to jurisdictional claims in published maps and institutional affiliations.
This work was supported by a grant from Regione Autonoma della Sardegna, Legge 7/2007, Project D.U.S.T. (Desert Upon Sardinian Territory), CRP-17664.
This research has been supported by the Regione Autonoma della Sardegna (grant no. Legge 7/2007, Project D.U.S.T. (Desert Upon Sardinian Territory), CRP-17664).
This paper was edited by Ivonne Trebs and reviewed by Youssef Yanni and three anonymous referees.
Aalismail, N. A., Ngugi, D. K., Díaz-Rúa, R., Alam, I., Cusack M., and Duarte C. M.: Functional metagenomic analysis of dust-associated microbiomes above the Red Sea, Sci. Rep., 9, 13741, https://doi.org/10.1038/s41598-019-50194-0, 2019.
Alpert, P., Kishcha, P., Shtivelman, A., Krichak, S. O., and Joseph, J. H.: Vertical distribution of Saharan dust based on 2.5 year model predictions, Atmos. Res., 70, 109–130, 2004.
Benkhalifa, J., Léon, J. F., and Chaabane, M.: Aerosol vertical distribution, optical properties and dust transport in the Western Mediterranean basin (case study: Summer, 2012), Atmos. Pollut. Res., 10, 1291–1298, 2019.
Bernstein, J. A., Alexis, N., Barnes, C., Bernstein, I. L., Nel, A., Peden. D., Diaz-Sanchez, D., Tarlo, S. M., and Williams, P. B.: Health effects of air pollution, J. Allergy Clin. Immun., 114, 1116–23, 2004.
Bolger, A. M., Lohse, M., and Usadel, B.: Trimmomatic: a flexible trimmer for Illumina sequence data, Bioinformatics, 30, 2114–2120, https://doi.org/10.1093/bioinformatics/btu170, 2014.
Bowers, R. M., McCubbin, I. B., Hallar, A. G., and Fierer, N.: Seasonal variability in airborne bacterial communities at a high-elevation site, Atmos. Environ., 50, 41e49, https://doi.org/10.1016/j.atmosenv.2012.01.005, 2012.
Bowers, R. M., Clements, N., Emerson, J. B., Wiedinmyer, C., Hannigan, M. P., and Fierer, N.: Seasonal Variability in Bacterial and Fungal Diversity of the Near-Surface Atmosphere, Environ. Sci. Technol., 47, 12097–12106, https://doi.org/10.1021/es402970s, 2013.
Burch, M. and Levetin, E.: Effects of meteorological conditions on spore plumes, Int. J. Biometeorol., 46, 107–117, 2002.
Cáliz, J., Triadó-Margarit, X., Camarero, L., and Casamayor, E. O.: A long-term survey unveils strong seasonal patterns in the airborne microbiome coupled to general and regional atmospheric circulations, Proc. Natl. Acad. Sci. USA, 115, 12229–12234, https://doi.org/10.1073/pnas.1812826115, 2018.
Cao, Y., Chastain, R. A., Eloe, E. A., Nogi, Y., Kato, C., and Bartlett, D. H.: Novel Psychropiezophilic Oceanospirillales Species Profundimonas piezophila gen. nov., sp. nov., Isolated from the Deep-Sea Environment of the Puerto Rico Trench, Appl. Environ. Microb., 80, 54–60, https://doi.org/10.1128/AEM.02288-13, 2013.
Caporaso, J. G., Kuczynski, J., Stombaugh, J., Bittinger, K., Bushman, F. D., Costello, E. K., Fierer, N., Peña, A. G., Goodrich, J. K., Gordon, J. I., Huttley, G. A., Kelley, S. T., Knights, D., Koenig, J. E., Ley, R. E., Lozupone, C. A., McDonald D., Muegge, B. D., Pirrung, M., Reeder, J., Sevinsky, J. R., Turnbaugh, P. J., Walters, W. A., Widmann, J., Yatsunenko, T., Zaneveld, J., and Knight, R.: QIIME allows analysis of high-throughput community sequencing data, Nat. Methods, 7, 335–336, 2010.
D'Almeida, G. A.: A Model for Saharan Dust Transport, J. Clim. Appl. Meteorol., 25, 903–916, 1986.
Draxler, R. R. and Rolph, G. D.: HYSPLIT (HYbrid Single-Particle Lagrangian Integrated Trajectory) Model access via NOAA ARL READY, available at: https://www.arl.noaa.gov/HYSPLIT/ (last access: 21 September 2014), NOAA Air Resources Laboratory, College Park, MD, 2014.
Dulac, F., Moulin, C., Lambert, C. E., Guillard, F., Poitou, J., Guelle, W., Quetel, C. R., Schneider, X., and Ezal, U.: Quantitative remote sensing of African dust transport in the Mediterranean, in: The Impact of Desert Dust Across the Mediterranean, Springer Netherlands, Dordrecht, 1996.
EMBL-EBI: Wellcome Genome Campus, Hinxton, Cambridgeshire, UK, available at: https://www.ebi.ac.uk/ena/browser/home [data set], last access: 1 June 2021.
Favet, J., Lapanje, A., Giongo, A., Kennedy, S., Aung, Y.-Y., Cattaneo, A., Davis-Richardson, A. G., Brown, C. T., Kort, R., Brumsack, H.-J., Schnetger, B., Chappell, A., Kroijenga, J., Beck, A., Schwibbert, K., Mohamed, A. H., Kirchner, T., de Quadros, P. D., Triplett, E. W., Broughton ,W. J., and Gorbushina, A. A.: Microbial hitchhikers on intercontinental dust: catching a lift in Chad, ISME J., 7, 850–867, 2013.
Fiamma, M.: D.U.S.T., Desert Upon Sardinian Territory, PhD Thesis, University of Sassari, Sassari, Italy, 2016.
Franzén, L. G., Mervi, H., and Per, K.: The Saharan dust episode of south and central Europe, and northern Scandinavia, Weather, 50, 313–318, https://doi.org/10.1002/j.1477-8696.1995.tb06139.x, 1995.
Gandolfi, I., Bertolini, V., Bestetti, G., Ambrosini, R., Innocente, E., Rampazzo, G., Papacchini, M., and Franzetti, A.: Spatio-temporal variability of airborne bacterial communities and their correlation with particulate matter chemical composition across two urban areas, Appl. Microbiol. Biot., 99, 4867–4877, 2015.
Gat, D., Mazar, Y., Cytryn, E., and Rudich, Y.: Origin-dependent variations in the atmospheric microbiome community in Eastern Mediterranean Dust Storms, Environ. Sci. Technol., 51, 6709–6718, 2017.
Gleick, P. H.: Water and Conflict: Fresh Water Resources and International Security, Project MUSE, Int. Security, 18, 79–112, available at: https://muse.jhu.edu/article/447074 (last access: 3 July 2016), 1993.
Glöckner, F. O., Zaichikov, E., Belkova, N., Denissova, L., Pernthaler, J., Pernthaler, A., and Amann R.: Comparative 16S rRNA analysis of lake bacterioplankton reveals globally distributed phylogenetic clusters including an abundant group of Actinobacteria, Appl. Environ. Microb., 66, 5053–5065, 2000.
Gloor, G. B., Macklaim, J. M., Pawlowsky-Glahn, V., and Egozcue, J. J.: Microbiome Datasets Are Compositional: And This Is Not Optional, Front. Microbiol., 8, 2224, https://doi.org/10.3389/fmicb.2017.02224, 2017.
Griffin, D. W.: Non-spore forming eubacteria isolated at an altitude of 20,000 m in Earth's atmosphere: Extended incubation periods needed for culture-based assays, Aerobiologia, 24, 19–25, 2008.
Guang, H., Guifang, Z., and Wenbin, Y.: A quantitative analysis on the sources of dune sand in the Hulun Buir sandy land, J. Geogr. Sci., 14, 177–186, 2004.
Hu, F.-P., Young, J. M., and Fletcher, M. J.: Preliminary description of biocidal (syringomycin) activity in fluorescent plant pathogenic Pseudomonas species, J. Appl. Microbiol., 85, 365–371, https://doi.org/10.1046/j.1365-2672.1998.00516.x, 1998.
Israelevich, P., Ganor, E., Alpert, P., Kishcha, P., and Stupp, A.: Predominant transport paths of Saharan dust over the Mediterranean Sea to Europe, J. Geophys. Res.-Atmos., 117, D02205, 2012.
Knippertz P., Ansmann, A., Althausen, D., Müller, D., Tesche, M., Bierwirth, E., Dinter, T., Müller, T., Von Hoyningen-Huene, W., Schepanski, K., Wendisch, M., Heinold, B., Kandler, K., Petzold, A., Schütz, L., and Tegen, I.: Dust mobilization and transport in the northern sahara during samum 2006 – a meteorological overview, Tellus, 61, 12–31, 2009.
Kostopoulou, E. and Jones, P. D.: Empirical orthogonal functions and related techniques in atmospheric science: A review, Int. J. Climatol., 1214, 1189–1214, 2007.
Lang-Yona, N., Öztürk, F., Gat, D., Aktürk, M., Dikmen, E., Zarmpas, P., Tsagkaraki, M., Mihalopoulos, N., Birgül, A., Kurt-Karakuş, P. B., and Rudich, Y.: Links between airborne microbiome, meteorology, and chemical composition in northwestern Turkey, Sci. Total Environ., 725, 138227, https://doi.org/10.1016/j.scitotenv.2020.138227, 2020.
Legendre P. and Legendre L.: Numerical ecology, 2nd English edn., Elsevier, Amsterdam, 1998.
Lelieveld, J., Berresheim, H., Borrmann, S., Crutzen, P. J., Dentener, F. J., Fischer, H., Feichter, J., Flatau, P. J., Heland, J., Holzinger, R., Korrmann, R., Lawrence, M. G., Levin, Z., Markowicz, K. M., Mihalopoulos, N., Minikin, A., Ramanathan, V., de Reus, M., Roelofs, G. J., Scheeren, H. A., Sciare, J., Schlager, H., Schultz, M., Siegmund, P., Steil, B., Stephanou, E. G., Stier, P., Traub, M., Warneke, C., Williams, J., and Ziereis, H.: Global air pollution crossroads over the Mediterranean, Science, 298, 794–799, 2002.
Littmann, T.: An empirical classification of weather types in the Mediterranean Basin and their interrelation with rainfall, Theor. Appl. Climatol., 66, 161–171, 2000.
Lory, S.: The Family Coxiellaceae, in: The Prokaryotes, edited by: Rosenberg, E., DeLong, E. F., Lory, S., Stackebrandt, E., and Thompson, F., Springer, Berlin, Heidelberg, https://doi.org/10.1007/978-3-642-38922-1_371, 2014,
Maki, T., Puspitasari, F., Hara, K., Yamada, M., Kobayashi, F., Hasegawa, H., and Iwasaka, Y.: Variations in the structure of airborne bacterial communities in a downwind area during an Asian dust (Kosa) event, Sci. Total Environ., 488–489C, 75–84, 2014.
Mazar, Y., Cytryn, E., Erel, Y., and Rudich, Y.: Effect of Dust Storms on the Atmospheric Microbiome in the Eastern Mediterranean, Environ. Sci. Technol., 50, 4194–4202, 27001166, https://doi.org/10.1021/acs.est.5b06348, 2016.
McTainsh, G. H.: Quaternary aeolian dust processes and sediments in the Australian region, Quaternary Sci. Rev., 8, 235–253, 1989.
Nickovic, S., Kallos, G., Papadopoulos, A., and Kakaliagou, O.: A model for prediction of desert dust cycle in the atmosphere, J. Geophys. Res., 106, 18113, https://doi.org/10.1029/2000JD900794, 2001.
Pearson, K.: Mathematical contributions to the theory of evolution – on a form of spurious correlation which may arise when indices are used in the measurement of organs, P. R. Soc. London, 60, 489–498, 1897.
Peter, H., Hörtnagl, P., Reche, I., and Sommaruga, R.: Bacterial diversity and composition during rain events with and without Saharan dust influence reaching a high mountain lake in the Alps, Environ. Microbiol., 6, 618–624, https://doi.org/10.1111/1758-2229.12175, 2014.
Polymenakou, P. N., Mandalakis, M., Stephanou, E. G., and Tselepides, A.: Particle size distribution of airborne microorganisms and pathogens during an intense African dust event in the eastern Mediterranean, Environ. Health Persp., 116, 292–296, 2008.
Prospero, J. M.: Environmental characterization of global sources of atmospheric soil dust identified with the NIMBUS 7 Total Ozone Mapping Spectrometer (TOMS) absorbing aerosol product, Rev. Geophys., 40, 1–31, 2002.
Rolph, G. D.: Real-time Environmental Applications and Display sYstem (READY), NOAA Air Resources Laboratory, available at: http://ready.arl.noaa.gov (last access: 22 September 2014), 2014.
Rosselli, R., Fiamma, M., Deligios, M., Pintus, G., Pellizzaro, G., Canu, A., Duce, P., Squartini, A., Muresu, R., and Cappuccinelli, P.: Microbial immigration across the Mediterranean via airborne dust, Sci. Rep., 5, 16306, https://doi.org/10.1038/srep16306, 2015.
Ryder, C. L., Marenco, F., Brooke, J. K., Estelles, V., Cotton, R., Formenti, P., McQuaid, J. B., Price, H. C., Liu, D., Ausset, P., Rosenberg, P. D., Taylor, J. W., Choularton, T., Bower, K., Coe, H., Gallagher, M., Crosier, J., Lloyd, G., Highwood, E. J., and Murray, B. J.: Coarse-mode mineral dust size distributions, composition and optical properties from AER-D aircraft measurements over the tropical eastern Atlantic, Atmos. Chem. Phys., 18, 17225–17257, https://doi.org/10.5194/acp-18-17225-2018, 2018.
Sánchez De La Campa, A., García-Salamanca, A., Solano, J., De La Rosa, J., and Ramos, J. L.: Chemical and microbiological characterization of atmospheric particulate matter during an intense african dust event in Southern Spain, Environ. Sci. Technol., 47, 3630–3638, 2013.
Schepanski, K., Tegen, I., Laurent. B., Heinold, B., and Macke, A.: A new Saharan dust source activation frequency map derived from MSG-SEVIRI IR-channels, Geophys. Res. Lett., 34, 1–5, 2007.
Seidel, D. J., Zhang, Y., Beljaars, A., Golaz, J.-C. Jacobson, A. R., and Medeiro, B.: Climatology of the planetary boundary layer over the continental United States and Europe, J. Geophys. Res., 117, D17106, https://doi.org/10.1029/2012JD018143, 2012.
Shine, C., Williams, N., and Gündling, L.: A guide to designing legal and institutional frameworks on alien invasive species, Environmental Policy and Law Paper No. 40, IUCN: Environmental Law Centre, Gland, Switzerland and Cambridge, UK, available at: https://www.iucn.org/theme/environmental-law (last access: 3 July 2016), 2000.
Smith, D. J., Griffin, D. W., and Schuerger, A. C.: Stratospheric microbiology at 20 km over the Pacific Ocean, Aerobiologia, 26, 35–46, 2010.
Suzuki, M., Suzuki, S., Matsui, M., Hiraki, Y., Kawano, F., and Shibayama, K.: Genome Sequence of a Strain of the Human Pathogenic Bacterium Pseudomonas alcaligenes That Caused Bloodstream Infection, Genome Announcements, 1, e00919-13, https://doi.org/10.1128/genomeA.00919-13, 2013.
Szewzyk, U., Szewzyk, R., and Stenström ,T. A.: Thermophilic, anaerobic bacteria isolated from a deep borehole in granite in Sweden, Proc. Natl. Acad. Sci. USA, 91, 1810–1813, 1993.
Tegen, I., Hollrig, P., Chin, M., Fung, I., Jacob, D., and Penner, J.: Contribution of different aerosol species to the global aerosol extinction optical thickness: Estimates from model results, J. Geophys. Res., 102, 23895, https://doi.org/10.1029/97JD01864, 1997.
Tian, R.-M., Zhang, W. P., Cai, L., Wong, Y.-H., Ding, W., and Qian, P.-Y.: Genome Reduction and Microbe-Host Interactions Drive Adaptation of a Sulfur-Oxidizing Bacterium Associated with a Cold Seep Sponge, mSystems, 2, e00184-16, https://doi.org/10.1128/mSystems.00184-16, 2017.
Van Dingenen, R., Raes, F., Putaud, J.-P., Baltensperger, U., Charron, A., Facchini, M.-C., Decesari, S., Fuzzi, S., Gehrig, R., Hansson, H.-C., Harrison, R. M., Hüglin, C., Jones, A. M., Laj,.P., Lorbeer, G., Maenhaut, W., Palmgren, F., Querol, X., Rodriguez, S., Schneider, J., Ten Brink, H., Tunved, P., Tørseth, K., Wehner, B., Weingartner, E., Wiedensohler, A., and Wåhlin, P.: A European aerosol phenomenology – 1: physical characteristics of particulate matter at kerbside, urban, rural and background sites in Europe, Atmos. Environ., 38, 2561–2577, 2004.
Wainwright, M., Wickramasinghe, N. C., Narlikar, J. V., and Rajaratnam, P.: Microorganisms cultured from stratospheric air samples obtained at 41 km, FEMS Microbiol. Lett., 218, 161–165, 2003.
Wang, Y. N., He, W. H., He, H., Du, X., Jia, B., Zeng, Z. P., An, M. L., and Chen, G. C.: Pseudomonas nitritireducens sp. nov., a nitrite reduction bacterium isolated from wheat soil, Arch. Microbiol., 194, 809–813, https://doi.org/10.1007/s00203-012-0838-6, 2012.
Williams, J., de Reus, M., Krejci, R., Fischer, H., and Ström, J.: Application of the variability-size relationship to atmospheric aerosol studies: estimating aerosol lifetimes and ages, Atmos. Chem. Phys., 2, 133–145, https://doi.org/10.5194/acp-2-133-2002, 2002.
Yamamoto, N., Bibby, K., Qian, J., Hospodsky, D., Rismani-Yazdi, H., Nazaroff, W. W., and Peccia, J.: Particle-size distributions and seasonal diversity of allergenic and pathogenic fungi in outdoor air, ISME J., 6, 1801–1811, 2012.
Yang, Y., Itahashi, S., Yokobori, S., and Yamagishi, A.: UV-resistant bacteria isolated from upper troposphere and lower stratosphere, Biological Sciences in Space, 22, 18–25, 2008.
Zakrzewski, M., Proietti, C., Ellis, J. J., Hasan, S., Brion, M. J., Berger, B., and Krause, L.: Calypso: a user-friendly web-server for mining and visualizing microbiome–environment interactions, Bioinformatics, 33, 782–783, 2017.