the Creative Commons Attribution 4.0 License.
the Creative Commons Attribution 4.0 License.
 | 06 Sep 2021
Bioaerosols in the Amazon rain forest: temporal variations and vertical profiles of Eukarya, Bacteria, and Archaea
Meinrat O. Andreae
Alessandro C. de Araùjo
Paulo Artaxo
Florian Ditas
Wolfgang Elbert
Jan-David Förster
Marco Aurélio Franco
Isabella Hrabe de Angelis
Jürgen Kesselmeier
Thomas Klimach
Leslie Ann Kremper
Eckhard Thines
David Walter
Jens Weber
Bettina Weber
Bernhard M. Fuchs
Ulrich Pöschl
The Amazon rain forest plays a major role in global hydrological cycling, and biogenic aerosols are likely to influence the formation of clouds and precipitation. Information about the sources and altitude profiles of primary biological aerosol particles, however, is sparse. We used fluorescence in situ hybridization (FISH), a molecular biological staining technique largely unexplored in aerosol research, to investigate the sources and spatiotemporal distribution of Amazonian bioaerosols on the domain level. We found wet season bioaerosol number concentrations in the range of 1–5 × 10⁵ m−3 accounting for > 70 % of the coarse mode aerosol. Eukaryotic and bacterial particles predominated, with fractions of ∼ 56 % and ∼ 26 % of the intact airborne cells. Archaea occurred at very low concentrations. Vertical profiles exhibit a steep decrease in bioaerosol numbers from the understory to 325 m height on the Amazon Tall Tower Observatory (ATTO), with a stronger decrease in Eukarya compared to Bacteria. Considering earlier investigations, our results can be regarded as representative for near-pristine Amazonian wet season conditions. The observed concentrations and profiles provide new insights into the sources and dispersion of different types of Amazonian bioaerosols as a solid basis for model studies on biosphere–atmosphere interactions such as bioprecipitation cycling.
- Article
(6335 KB) - Full-text XML
-
Supplement
(1173 KB) - BibTeX
- EndNote


The study of atmospheric bioaerosols represents a challenging field in aerosol research because of their diverse particle properties, including size, morphology, mixing state, hygroscopic behavior, and metabolic activity. Bioaerosols are ubiquitous in the atmosphere worldwide and comprise prokaryotic (Bacteria and Archaea) and eukaryotic (e.g., fungi and algae) cells, various reproductive entities (e.g., spores and pollen), and fragments of biological material (Andreae and Crutzen, 1997; Jaenicke, 2005; Després et al., 2012). The scientific and socioeconomic attention that bioaerosols have received can be explained by their manifold and fundamental roles in atmospheric chemistry and physics, biogeography, public health, ecology, and agriculture (e.g., Pöschl et al., 2010; Morris et al., 2014; Fröhlich-Nowoisky et al., 2016; Reinmuth-Selzle et al., 2017). To date, central aspects of their mechanistic roles and relevance in these fields are not fully understood, and they are even largely unexplored. Progress in our understanding is hampered by analytical limitations in resolving the complexity, diversity, and highly dynamic life cycle of bioaerosols in the atmosphere (Morris et al., 2011; Šantl-Temkiv et al., 2019). Particularly scarce are techniques that provide atmospheric number concentrations for specific and clearly defined organism groups within the bioaerosol population (e.g., Mbareche et al., 2017; Kabir et al., 2020; Sect. S1.4 in the Supplement).
The number of bioaerosol field observations worldwide is constantly increasing (Després et al., 2012; Fröhlich-Nowoisky et al., 2016; Šantl-Temkiv et al., 2019, and references therein) with bioaerosol studies in regions that are essential for the climate system being particularly relevant. This refers to the oceans and forested ecosystems which cover large areas of the Earth and entail intense surface–atmosphere interactions (e.g., Bonan, 2008; Mayol et al., 2014; Artaxo et al., 2021). Moreover, certain (though increasingly few) regions of the oceans and the large forests are still sufficiently unperturbed by human emissions and activities to approximate a preindustrial and thus pristine state of the atmosphere (Hamilton et al., 2014; Pöhlker et al., 2018). Along these lines, it has remained largely unknown which mechanistic roles “[bio]aerosols before pollution” (Andreae, 2007) have played in biogeochemical and hydrological cycles and to what extent such processes have been perturbed by the nowadays pervasive anthropogenic emissions and activities. One important topic in this context is the ability of certain bioaerosols to act as efficient ice nuclei (IN) at comparatively warm temperatures (i.e., > −10 ∘C) with important implications for cloud microphysics and precipitation formation (e.g., Delort et al., 2010; Morris et al., 2014).
The analytical and scientific novelty of this study is threefold. First, it widens the spectrum of techniques for bioaerosol investigations in environmental samples by exploring the analytical potential of fluorescence in situ hybridization (FISH) in this field. FISH is a molecular genetic technique for the specific staining of cells by targeting characteristic RNA or DNA sequences with complementary and fluorescently labeled nucleotide probes (e.g., Amann and Fuchs, 2008). In terrestrial and marine microbiology, FISH has become an important technique in identification and enumeration of microbial organisms with numerous applications (e.g., Christensen et al., 1999; Pernthaler et al., 2004). However, applications in bioaerosol research have remained remarkably sparse (Lange et al., 1997; Harrison et al., 2005; Yoo et al., 2017). Our results demonstrate that FISH has potential in bioaerosol analysis as it provides number concentrations of specific organism classes (i.e., from domain down to species level) and, therefore, combines bioaerosol identification, enumeration, and visualization. Second, this study provides number concentrations for prokaryotic and eukaryotic cells in the Amazonian rain forest atmosphere under almost pristine conditions, which is unique data for this globally important ecosystem. In fact, the atmospheric Bacteria and Archaea concentrations are the first published results of this type for a tropical rain forest environment (Table S3 in the Supplement). The concentrations obtained here can serve as a reference for modeling and process studies on climate-relevant forest–atmosphere interactions such as bioprecipitation cycles. Third, this study has utilized the tall tower at the remote Amazon Tall Tower Observatory (ATTO) site to obtain vertical gradients of Bacteria, Archaea, and Eukarya concentrations over the rain forest (with sampling heights at 5, 60, and 325 m). These gradients allow us to estimate concentration ranges for bacterial, archaeal, and eukaryotic cells touching the cloud base and thus to assess their potential relevance for cloud microphysics.
The samples analyzed in this study were collected during prevailing clean wet season conditions in the Amazon. The 6 d sampling period was chosen for detailed analysis as the aerosol mixture approximated a pre-industrial state with the bioaerosol population originating from the primary rain forest region within the ATTO site's footprint. A detailed characterization of the conditions can be found in the Supplement. The FISH protocol used in this work is an adaptation of pre-existing protocols (Glöckner et al., 1996; Pernthaler et al., 2004) with modifications and optimizations for the specific requirements of bioaerosol analysis. The main experimental steps of the FISH protocol are illustrated and (briefly) explained in Fig. 1. A focal point of this study has been the careful cross-validation and comparison of the obtained FISH results with online aerosol data, as well as a synthesis with existing literature knowledge. This validation is important since FISH is experimentally demanding and prone to various artifacts (i.e., false positive or false negative counts) and thus may yield biased results (Thiele et al., 2011). A comparison with data from different locations or obtained by different methods is meaningful only within certain limits (for details see Sect. S1.4 in the Supplement). We overall found a high consistency with complementary online data from the ATTO site, as well as from previous studies, which underlines that the obtained organism concentrations are a solid representation of the Amazonian wet season bioaerosol population.
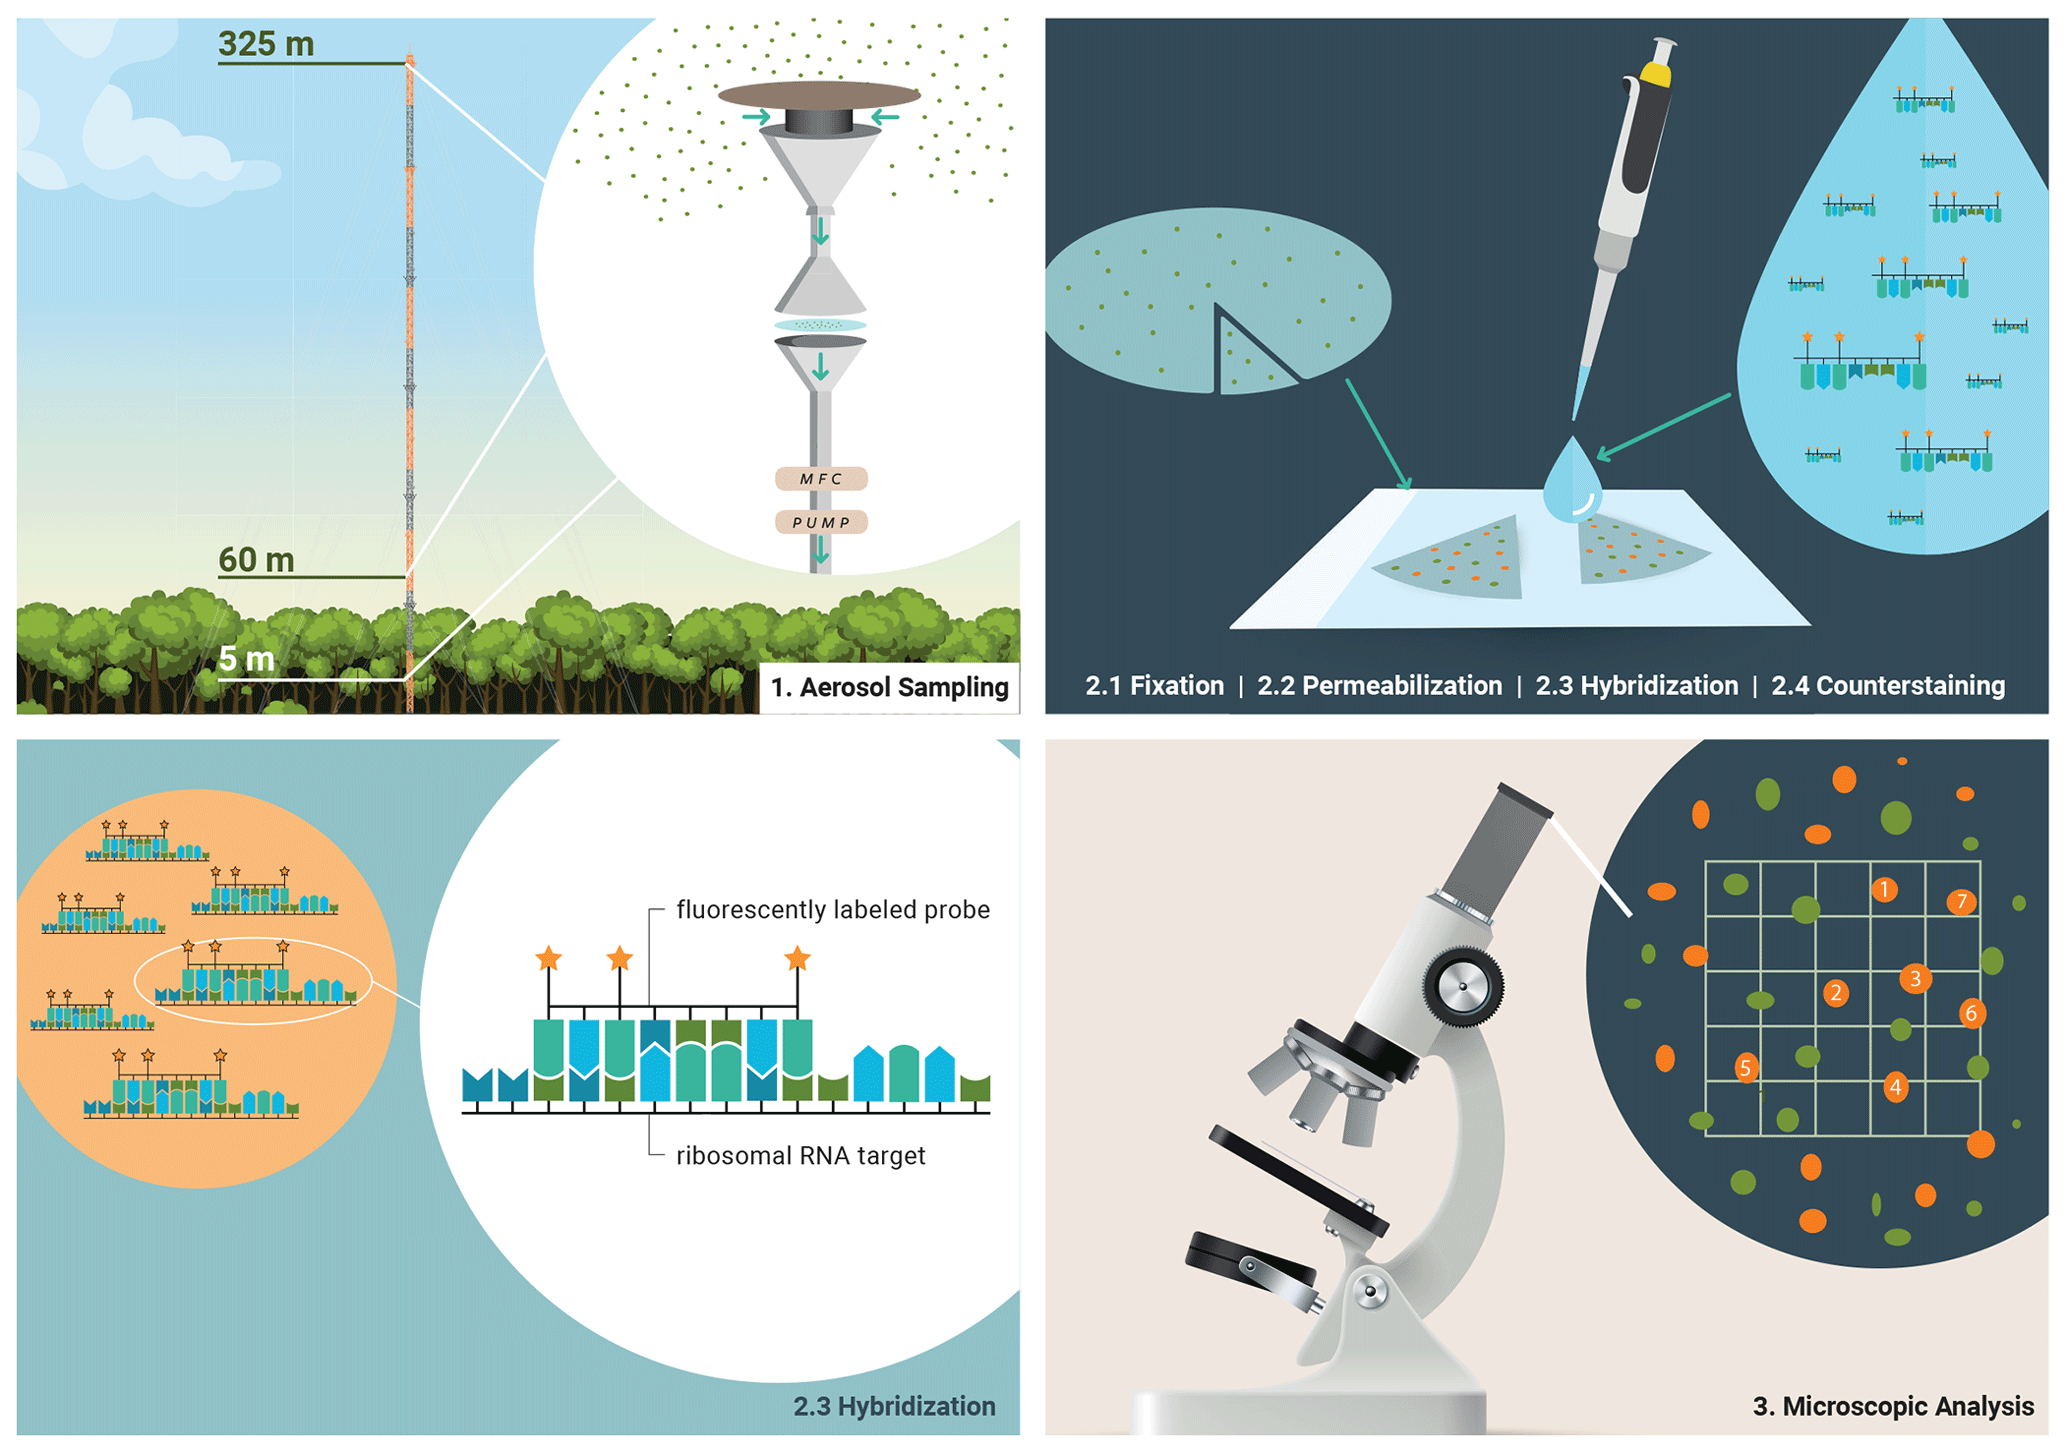
Figure 1Bioaerosol sampling strategy in the Amazon rain forest and molecular genetic staining for microscopic identification and quantification. (1) Bioaerosols were collected on polycarbonate membranes at three different sampling heights at ATTO. (2) Biological material on the filters was prepared for staining by fixation and cell wall permeabilization. Then, fluorescently labeled oligonucleotide probes were used to assign bioaerosols at the domain level in a hybridization step. Overall bioaerosol numbers were obtained by DNA staining with DAPI, the so-called counterstaining. (3) Fluorescence signals were systematically enumerated and converted into atmospheric bioaerosol number concentrations.
2.1 Measurement location: the Amazon Tall Tower Observatory
The Amazon Tall Tower Observatory is a research site located in the Uatumã Sustainable Development Reserve, Amazonas State, Brazil (Andreae et al., 2015). It comprises several ground-based containers and three towers of different heights (80 m height: “triangular mast” and “walk-up tower”; 325 m height: “tall tower”) equipped with state-of-the-art instrumentation to analyze biosphere–atmosphere exchange processes in this remote continental location. The forest ecosystem is driven by alternating wet and dry seasons inducing conditions that temporarily resemble a pre-industrial and thus pristine state. Hundreds of square kilometers of untouched primary forest surround the research station, forming its biogeochemical footprint region (Pöhlker et al., 2019). Further information on the sampling location can be found in the Supplement.
2.2 Aerosol sampling at ATTO
This study focuses on seven aerosol samples collected during the wet season from 25 February to 3 March 2018 with an approximate sampling duration of 23 h each. Samples at 5 and 60 m height were collected at the triangular mast and those at 325 m at the tall tower. At 5 m, the filter holder was connected directly to a total suspended particle (TSP) inlet. At 60 and 325 m heights, filter holders were mounted in a ground-based container and connected to a TSP inlet via stainless steel inlet lines. Aerosols were filtered onto white polycarbonate membranes (Isopore PC membrane, 0.2 µm pore size, 47 mm diameter, GTTP04700, Merck, Darmstadt, Germany) by applying a vacuum. Filters were autoclaved at 121 ∘C and 220 kPa for 15 min before use. The sample airflow rate was set to 9 L min−1 by a digital mass flow controller (D-6341-FGD-22-AV-99-D-S-DR, Wagner Mess- und Regeltechnik, Offenbach am Main, Germany) installed between the pump (N840.3FT.18, KNF Neuberger, Freiburg im Breisgau, Germany) and a custom-made filter holder.
2.3 Complementary online measurements at ATTO
During filter sampling, three instruments measured aerosol number concentrations in parallel at 60 m height: an optical particle sizer (OPS; model 3330, size range 0.3–10 µm, TSI Inc., Shoreview, MN, USA) and a scanning mobility particle sizer (SMPS; classifier 3080, detector 3722, DMA 3081, size range: 0.01–0.42 µm, TSI Inc., Shoreview, USA). Both detected aerosols in a size resolved manner, and a condensation particle counter (CPC; model 5412, GRIMM Aerosol, Ainring, Germany) measured total aerosol concentrations. Detailed information on OPS, SMPS, and CPC measurements can be found in Andreae et al. (2015) and Moran-Zuloaga et al. (2018). Stained bioaerosols could only be detected and identified as such by microscopy if their diameter was ∼ 0.7 µm or larger. For a comparison between NFISH and total aerosol numbers, only OPS data detected in the according channels were considered (0.74–10 µm, N0.7–10). Several sensors monitored meteorological conditions at ATTO such as incoming shortwave radiation (pyranometer, CMP21, Kipp & Zonen, Netherlands) and rainfall (rain gauge, TB4, Hydrological Services Pty. Ltd., Australia). Further information on micrometeorological sensors and instrumentation at ATTO can be found in Andreae et al. (2015).
2.4 Fluorescence in situ hybridization
Several previous studies containing fluorescence in situ hybridization (FISH) protocols were considered in terms of buffer ingredients, incubation times, and further details to obtain reliable results in bioaerosol analysis. Original references can be found in Glöckner et al. (1996, 1999), Pernthaler et al. (2004), Fuchs et al. (2007), and Schmidt et al. (2012). The chemicals used for fixation, permeabilization, hybridization, staining, and mounting are listed in the Supplement (Table S4). Best results were obtained by applying the following procedure. Directly after sampling, bioaerosols on the filters were fixed by an incubation in a freshly prepared solution of 2 % formaldehyde in phosphate-buffered saline (PBS). For this purpose, filters were inserted into glass filtration towers (item number 16309, Sartorius, Göttingen, Germany) and covered with ∼ 15 mL of the solution. The liquid was removed after 1 h at 28 ∘C ambient temperature by applying a gentle vacuum. Subsequently, filters were flushed by covering them with 20 mL deionized water (Milli-Q water) and applying vacuum again. The same procedure was repeated with 20 mL ethanol 70 %. Filters were air-dried and stored in Analyslide® petri dishes (7231, Pall corporation, New York, USA) at −20 ∘C in the freezer. Filters were transported to Germany frozen and stored in the freezer at −20 ∘C until further processing.
The filters were then cut into sections and numbered with a pencil at room temperature. For each sample, one fixed, cut, and numbered filter section was directly mounted in Citifluor AF1 (Citifluor Ltd., Canterbury, UK) containing 4 µg mL−1 DAPI (4′,6-diamidino-2-phenylindole; SERVA, Heidelberg, Germany) for total cell number detection.
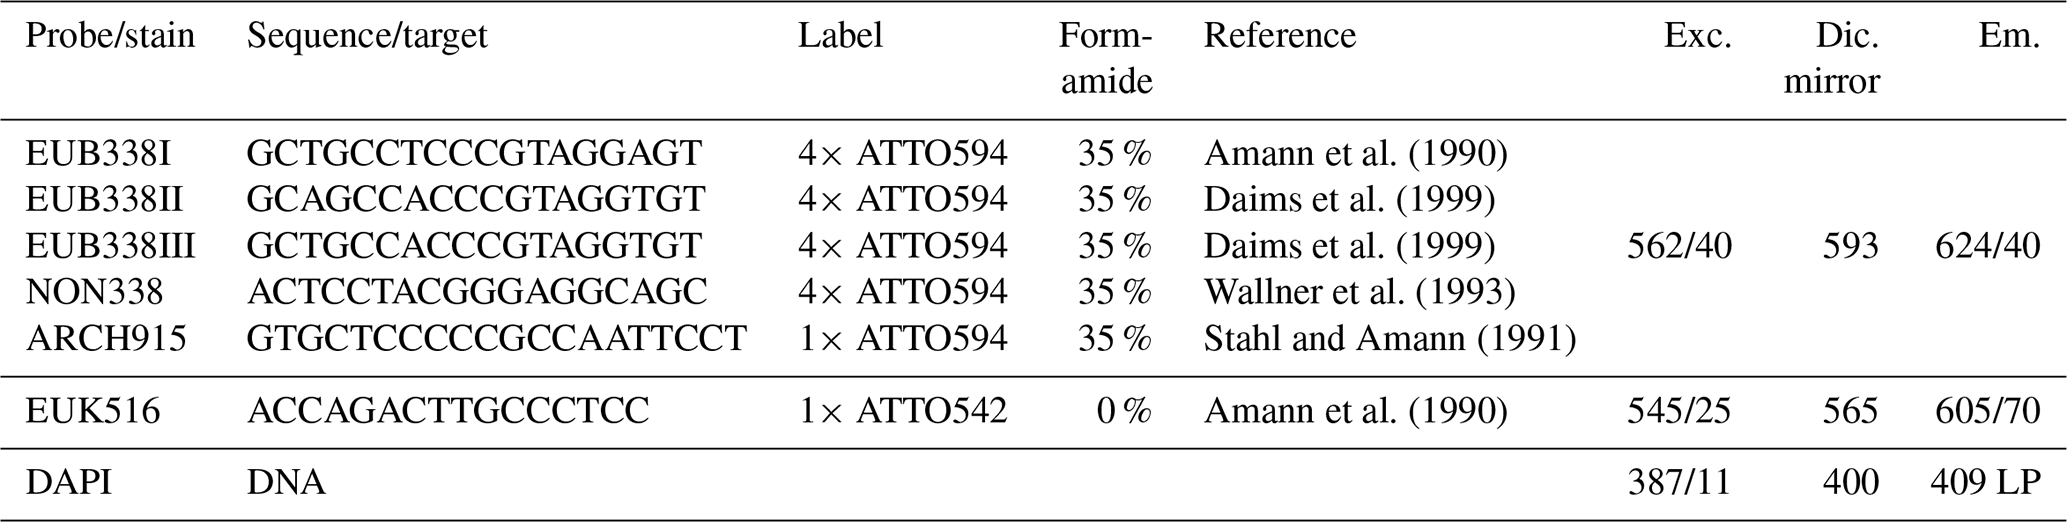
To prevent cell loss during FISH, filter sections were covered with a thin layer of low gelling point agarose (0.2 % in MILLI-Q water). Cell wall permeabilization by means of incubation in lysozyme solution (10 mg mL−1; 60 min for EUK516 and 45 min for EUB338-I-III (EUB-mix), ARCH915, and NON338) and achromopeptidase solution (60 U mL−1, 20 min for EUB338-mix, ARCH915, and 338), both at 37 ∘C, enabled the entrance of oligonucleotide probes during hybridization. To remove all enzymes, filter sections were washed in excess MILLI-Q water. Subsequently, the filter sections were incubated in 30 µL hybridization buffer – 900 mM NaCl, 20 mM Tris HCl, 1 % blocking reagent, 0.01 % SDS (sodium dodecyl sulfate), and formamide depending on probe – containing 2 µL probe working solution (8.4 pmol µL−1) at 46 ∘C for 120 min. Oligonucleotide probes targeting bacterial, eukaryotic, and archaeal cells were used. The probe NON338 served as negative control. Probe sequences, labels, and the respective formamide concentrations are presented in Table 1. After hybridization, filter sections were directly transferred into 50 mL preheated washing buffer – 0.9 M (EUK516) or 0.08 M (EUB338-mix, ARCH915, NON338) NaCl, 20 mM Tris HCl (pH 7.4), 5 mM EDTA (ethylenediaminetetraacetic acid), and 0.01 % SDS – and incubated floating freely for 15 min at 48 ∘C in the dark. The 50 mL tubes containing washing buffer and filter sections were gently inverted when the incubation started and ended. Subsequently, filter sections were rinsed in a Petri dish containing MILLI-Q water and a second Petri dish containing 70 % ethanol. Filter sections were dried on Kim wipes at room temperature for 15–30 min. Dry filter sections were mounted in Citifluor AF1 containing 4 µg mL−1 DAPI.
Table 1Technical details of rRNA targeting probes and corresponding microscopic filters (excitation, Exc., dichroic mirror, Dic., and emission, Em.) used for FISH. As described in Daims et al. (1999), a mixture of EUB338 I, II, and III (referred to as EUB-mix) was applied for identification of Bacteria. By use of ARCH915, Archaea were identified, and EUK516 was applied to hybridize Eukarya. NON338 served as negative control. DAPI stains all particles containing DNA by attaching preferably to adenine- and thymine-rich sequences. For our experiments, fluorescent labels in the reddish wavelength range were chosen to avoid overlap with the autofluorescence of bioaerosols which is typically strong in the green wavelength range (Pöhlker et al., 2012).
2.5 Epifluorescent microscopic enumeration and bioaerosol projection
Filter sections were inspected with a Nikon Ti2-E inverse epifluorescence microscope (Nikon, Microscope Solutions, Minato, Japan) at 600× magnification (objective: Apo Lambda S 60× oil with 1.4 numerical aperture and a 10× wide-field ocular). Epifluorescence filter cubes were chosen according to the fluorescent dye properties as summarized in Table 1. Fluorescence signals derived from DAPI staining or FISH were counted manually using an ocular grid (Zeder et al., 2011). One person examined all filter samples for FISH and DAPI signals to ensure consistent counting procedure. As in previous studies, the examiner rested regularly to avoid eye fatigue leading to decreasing signal detection. FISH and DAPI signals were detected by taking their color, fluorescence intensity, size, shape, and surface structure into account. Raw counts were documented with the help of a mechanical counter. In a first step, filter sections that were embedded in a mix of Citifluor and DAPI were analyzed. The atmospheric number concentrations of bioaerosols that were stained with the DNA dye were calculated by extrapolating DAPI raw counts with respect to the grid size, covered filter area, and sampled air volume following Eq. (1):
where NDAPI = atmospheric bioaerosol number concentration stained with DAPI (m−3), Ngrid = number of DAPI stained cells counted per grid, Af = area filter (mm2), Agrid = area grid (mm2), and Vair = sampled air volume (m3).
Afterwards, filter sections treated with the FISH technique were inspected. The FISH signals were enumerated first (NFISH), and consecutively DAPI counterstaining signals were quantified in the same field of view to avoid bleaching of the former. Ratios of hybridized bioaerosols were calculated and multiplied with the bioaerosol number concentrations obtained by DAPI staining only. To achieve robust statistics at least 500 DAPI stained cells per filter sample and probe were inspected, and often more than 1000 were counted. According to Pernthaler et al. (2003) this reduces the counting error to <5 %. Raw counts of hybridized and DAPI stained cells for each filter sample are presented in the Supplement (Table S1).
2.6 Quantification of atmospheric DNA concentration
Airborne DNA mass was calculated by the multiplication of mean bioaerosol numbers obtained by FISH with the typical DNA mass of a bacterial, eukaryotic, or archaeal cell following Eq. (2):
where mDNA = airborne DNA mass (g m−3), NFISH = bioaerosol number concentration obtained by FISH (1 m−3), bp = genome size (base pair cell−1), 609.7 g mol−1 = average mass of a base pair in bound form, and NA = Avogadro constant.
The genome sizes were determined as follows. Souza et al. (2019) found Proteobacteria and Actinobacteria to be the dominant phyla within the airborne Amazonian bacterial population. The median genome sizes found in the National Center for Biotechnology Information (NCBI) database were ∼ 4.8 and ∼ 4.3 Mb for Proteobacteria and Actinobacteria, respectively (https://www.ncbi.nlm.nih.gov/genome/browse#!/prokaryotes/proteobacteria, last access: 10 April 2021). By comparing these numbers to results by Landenmark et al. (2015) and Trevors (1996), the approximate bacterial and archaeal genome size were defined as 4 Mb for bioaerosols. The genome size of fungi was used as a representative value for Eukaryotes since coarse mode bioaerosols in the Amazon were reported to mainly consist of fungal spores (Graham et al., 2003a; Huffman et al., 2012). As these genome sizes are several orders of magnitude smaller compared to those of higher plants, we consider airborne DNA mass obtained this way and presented here as a lower limit for the Amazon forest bioaerosol. In NCBI the typical genome size for basidiomycetes and ascomycetes is indicated as 30 Mb.
In the wet season atmosphere at the ATTO site, Eukarya and Bacteria accounted for the majority of cells, whereas Archaea occurred at lower numbers and appeared to be rather rare in the investigated bioaerosols. At all sampling heights, the number concentration of eukaryotic cells (NEUK) was highest ranging from ∼ 3.5–38 × 104 m−3, followed by Bacteria (NBAC) ranging from ∼ 3.0–7.0 × 10⁴ m−3, and Archaea (NARC) ranging from ∼ 0.1–1.3 × 10⁴ m−3 (Table 2, Fig. 2). These numbers are in good agreement with estimated and measured concentrations in previous bioaerosol studies (e.g., Burrows et al., 2009b; Fröhlich-Nowoisky et al., 2016). For instance, the measured NBAC values fall within the estimated range of bacterial cell concentrations for forest ecosystems (i.e., 3.3–8.8 × 10⁴ m−3) according to Burrows et al. (2009a). Furthermore, a predominance of Eukaryotes in the Amazon was shown by Souza et al. (2019) and Elbert et al. (2007), which is consistent with our results. Of further atmospheric relevance is the number concentration of all airborne cells that were determined by staining the intracellular DNA with the fluorescent dye DAPI1 (NDAPI). Here, NDAPI ranged on average from ∼ 12–53 × 104 m−3 (Tables 2 and 3). Due to the given specificity of the FISH probes (∼ 80 %–90 % of all target cells according to the SILVAref138.1 database, https://www.arb-silva.de, last access 8 December 2020), a certain fraction of cells remains unclassified (i.e., NFISH<NDAPI with ). In this study, NFISH accounted for ∼ 60 %–90 % of NDAPI (Tables 2, S1), which indicates a good performance of the FISH protocol (Thiele et al., 2011, and references therein).
Table 2Bioaerosol number concentrations at different heights (avg ± SD; n = 5–6, samples for ∼ 23 h at each height) on the domain level (Archaea, Bacteria, and Eukarya) obtained by FISH. In addition, overall bioaerosol concentrations obtained by DAPI staining. The last column shows the fraction of cells that could be assigned to one of the domains by FISH in relation to the DAPI-derived concentration.
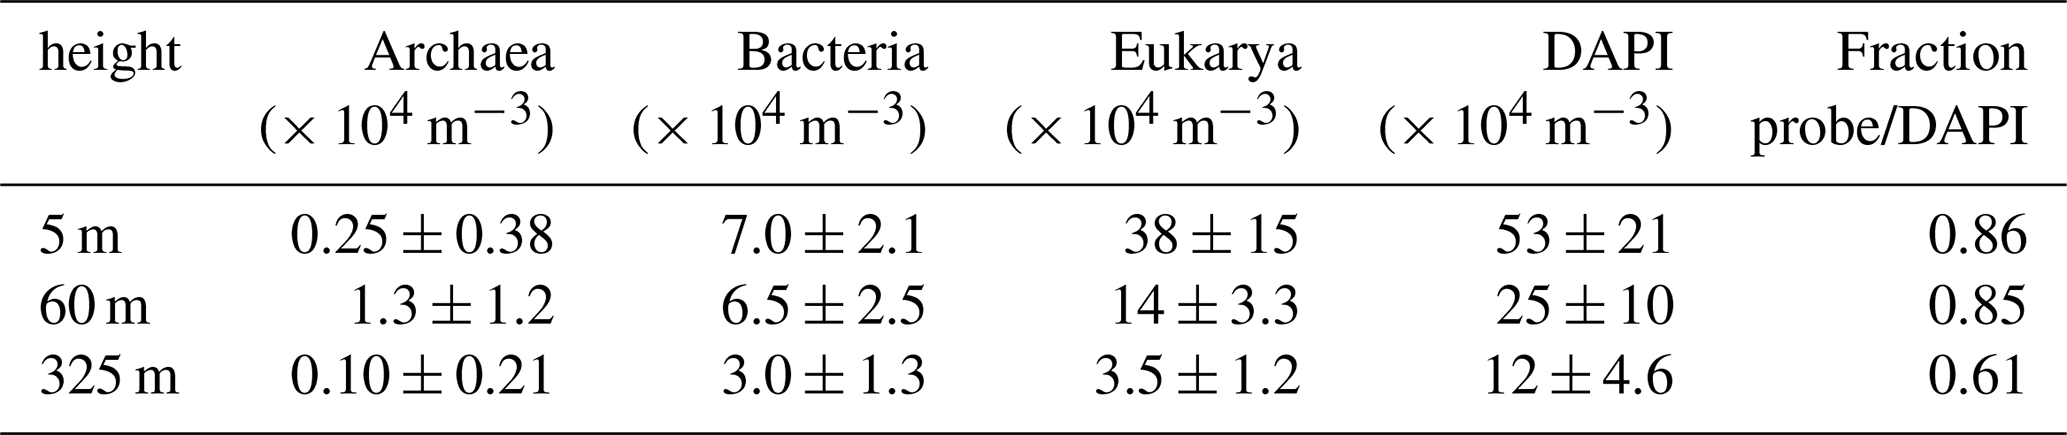
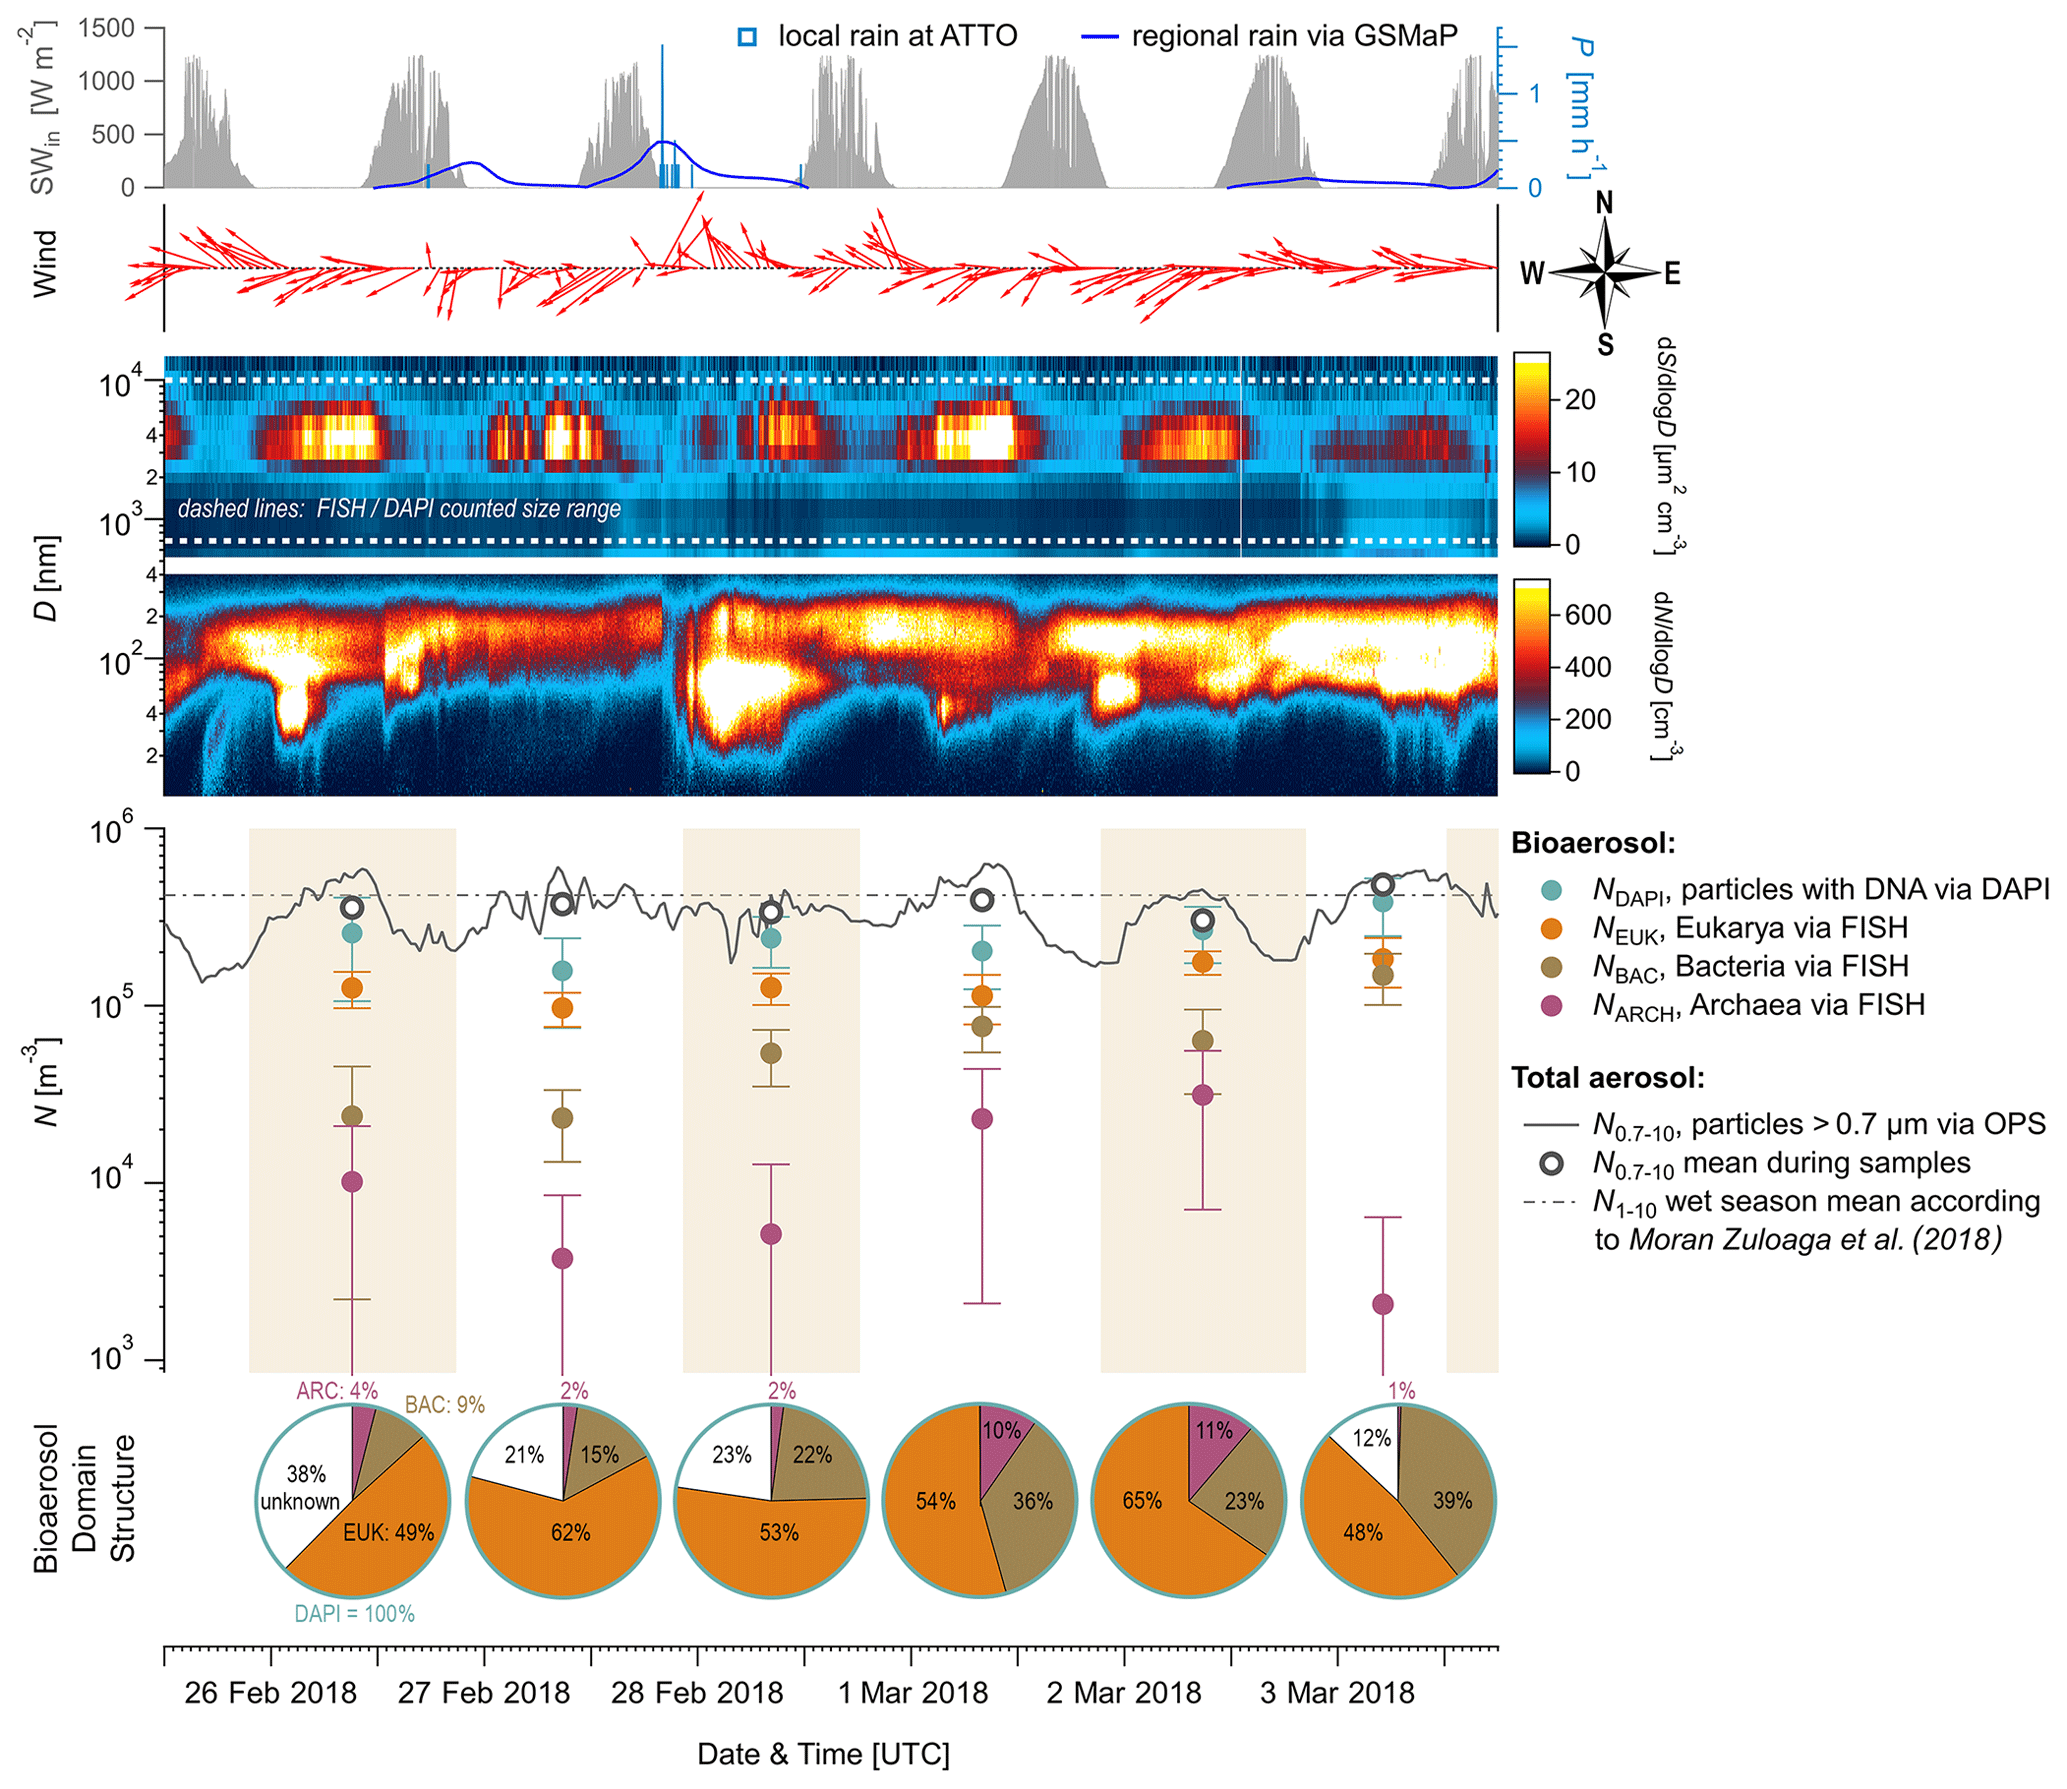
Figure 2Time series of aerosol number concentrations and complementary aerosol and meteorological data at 60 m height, observed over 6 d during the wet season 2018. From top to bottom: (i) meteorological data including incoming solar radiation (SWin, grey shaded), precipitation rates (P, blue curve and bars), and wind vectors (red arrows), (ii) contour plots displaying total aerosol number size distributions obtained by a scanning mobility particle sizer (0.01 to 0.4 µm) and an optical particle sizer (0.5 to 10 µm), (iii) bioaerosol number concentrations at the domain level from FISH and DAPI staining (markers as mean and error bars as 1 standard deviation) with shaded areas as filter sampling periods (each approx. 23 h), and (iv) pie charts showing daily bioaerosol mixture based on number concentrations at the domain level.
Figure 2 shows the time series of NEUK, NBAC, NARC, and NDAPI at 60 m height with complementary meteorological and aerosol data under pristine rain forest conditions. Here, the total aerosol particle count between ∼ 0.7 and 10 µm (N0.7–10) – corresponding to the effectively DAPI- and FISH-counted size range – serves as a reference number concentration and ranges from ∼ 30–48 × 104 m−3 (Table 3). Relative to NDAPI, Eukaryotes accounted on average for ∼ 56 %, Bacteria for ∼ 26 %, and Archaea for ∼ 5 % of the cells. The bioaerosol number concentrations NEUK, NBAC, NARC, and NDAPI show a clear day-to-day variability. For instance, NEUK varies by a factor of 2, whereas NBAC varies by a factor of 4 (Table S1). NARC shows even larger variations, although the low counting statistics here require caution in interpreting these results2. Along these lines, the bioaerosol mixture – i.e., the ratios of NEUK, NBAC, and NARC relative to NDAPI as represented by the pie charts in Fig. 2 – also shows a clear variability. Here the days from 1 to 3 March 2018 stand out as they are characterized by a rather high abundance of NBAC. This increase in NBAC, might be related to the strong rain event in the night from 27 to 28 February 2018. Bacterial cells on the leaf surfaces might have been emitted through mechanical momentum of the raindrop impaction according to Joung et al. (2017) and/or might be related to a “post-rain” bioaerosol enhancement according to Huffman et al. (2013). While the results presented here emphasize such potential links between the variability in bioaerosol concentrations and meteorological environmental parameters (which are speculative so far), the statistical basis of these initial FISH results is too small to constrain these relationships. Accordingly, an investigation of bioaerosol emission mechanisms in relation to the local and regional meteorology requires more extended follow-up FISH studies. In contrast to the bioaerosol burden mainly originating from forest emission during clean wet season conditions, an investigation of long-range-transport-related changes in the air microbiome might be of interest, for instance with respect to dust-associated bacteria as found by Prospero et al. (2005) and Yamaguchi et al. (2012).
Table 3Mean diel aerosol number concentrations at 60 m height obtained by an optical particle sizer (OPS) and by bioaerosol staining with DAPI (avg ± SD). The fraction of DAPI-stained particles in relation to total aerosol numbers in the same size range provides an estimation of presumably intact cells vs. degraded biological material.
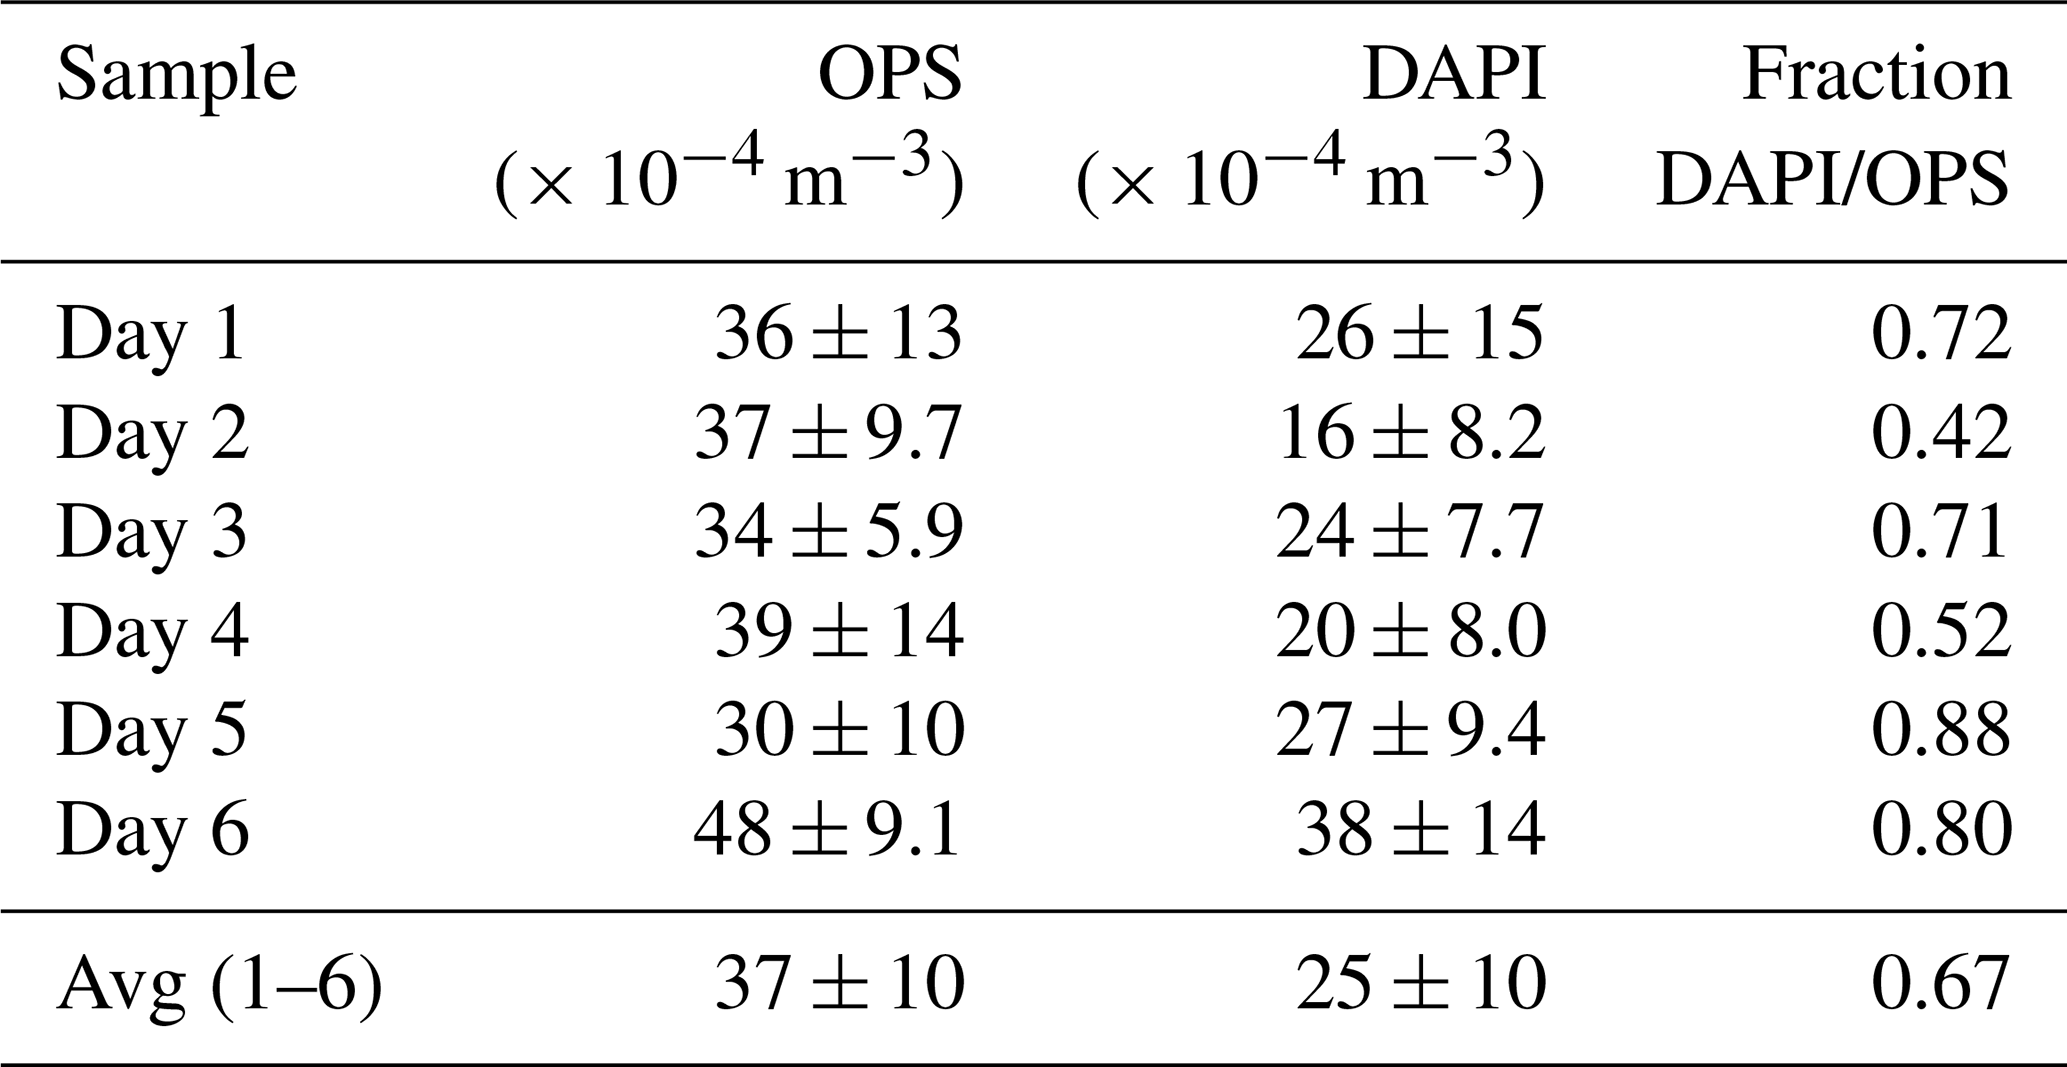
In addition to intact airborne cells, bioaerosol definitions also include biological fragments (Després et al., 2012). These fragments – a complex mixture of biological material in a continuum of degradation states, e.g., from mechanical fragmentation, cell rupture, or cytosol release – can be of significant atmospheric relevance as they may comprise (high) ice activity or allergenic potential (Šantl-Temkiv et al., 2015; Steiner et al., 2015; Reinmuth-Selzle et al., 2017). However, a direct analysis of these fragments is often notoriously difficult because of their morphologically and biologically undefined state. Both the DAPI and FISH quantifications predominantly target intact cells since upon cell rupture or damage, the contained nucleic acids might be released and degraded. Therefore, the ratio of NDAPI vs. N0.7–10 provides a valuable estimate of the presumably intact cell fraction vs. the fraction of fragments within the size range from 0.7 to 10 µm of the Amazonian bioaerosol population. This estimate relies on the assumption that under unperturbed wet season conditions the vast majority of coarse mode particles originates more or less directly from primary emissions of the rain forest (compare Moran-Zuloaga et al., 2018; Pöhlker et al., 2018). This assumption is justified here since other potential coarse mode sources (i.e., Saharan dust, Atlantic sea salt, and ash from biomass burning) can be largely excluded during the sampling period. On average, intact cells accounted for the majority of coarse mode particles with values of ∼ 70 %, which is in good agreement with previous studies (Tables 3 and S3). Accordingly, we obtained ∼ 30 % on average as an upper limit estimate for the fraction of fragments and degraded biological material in this size range. The estimated concentration (3–19 × 104 m−3) and fraction (12 %–58 %) of fragments is quite variable, which points at interesting open questions for follow-up studies on potential degradation pathways in the Amazonian bioaerosol cycling.
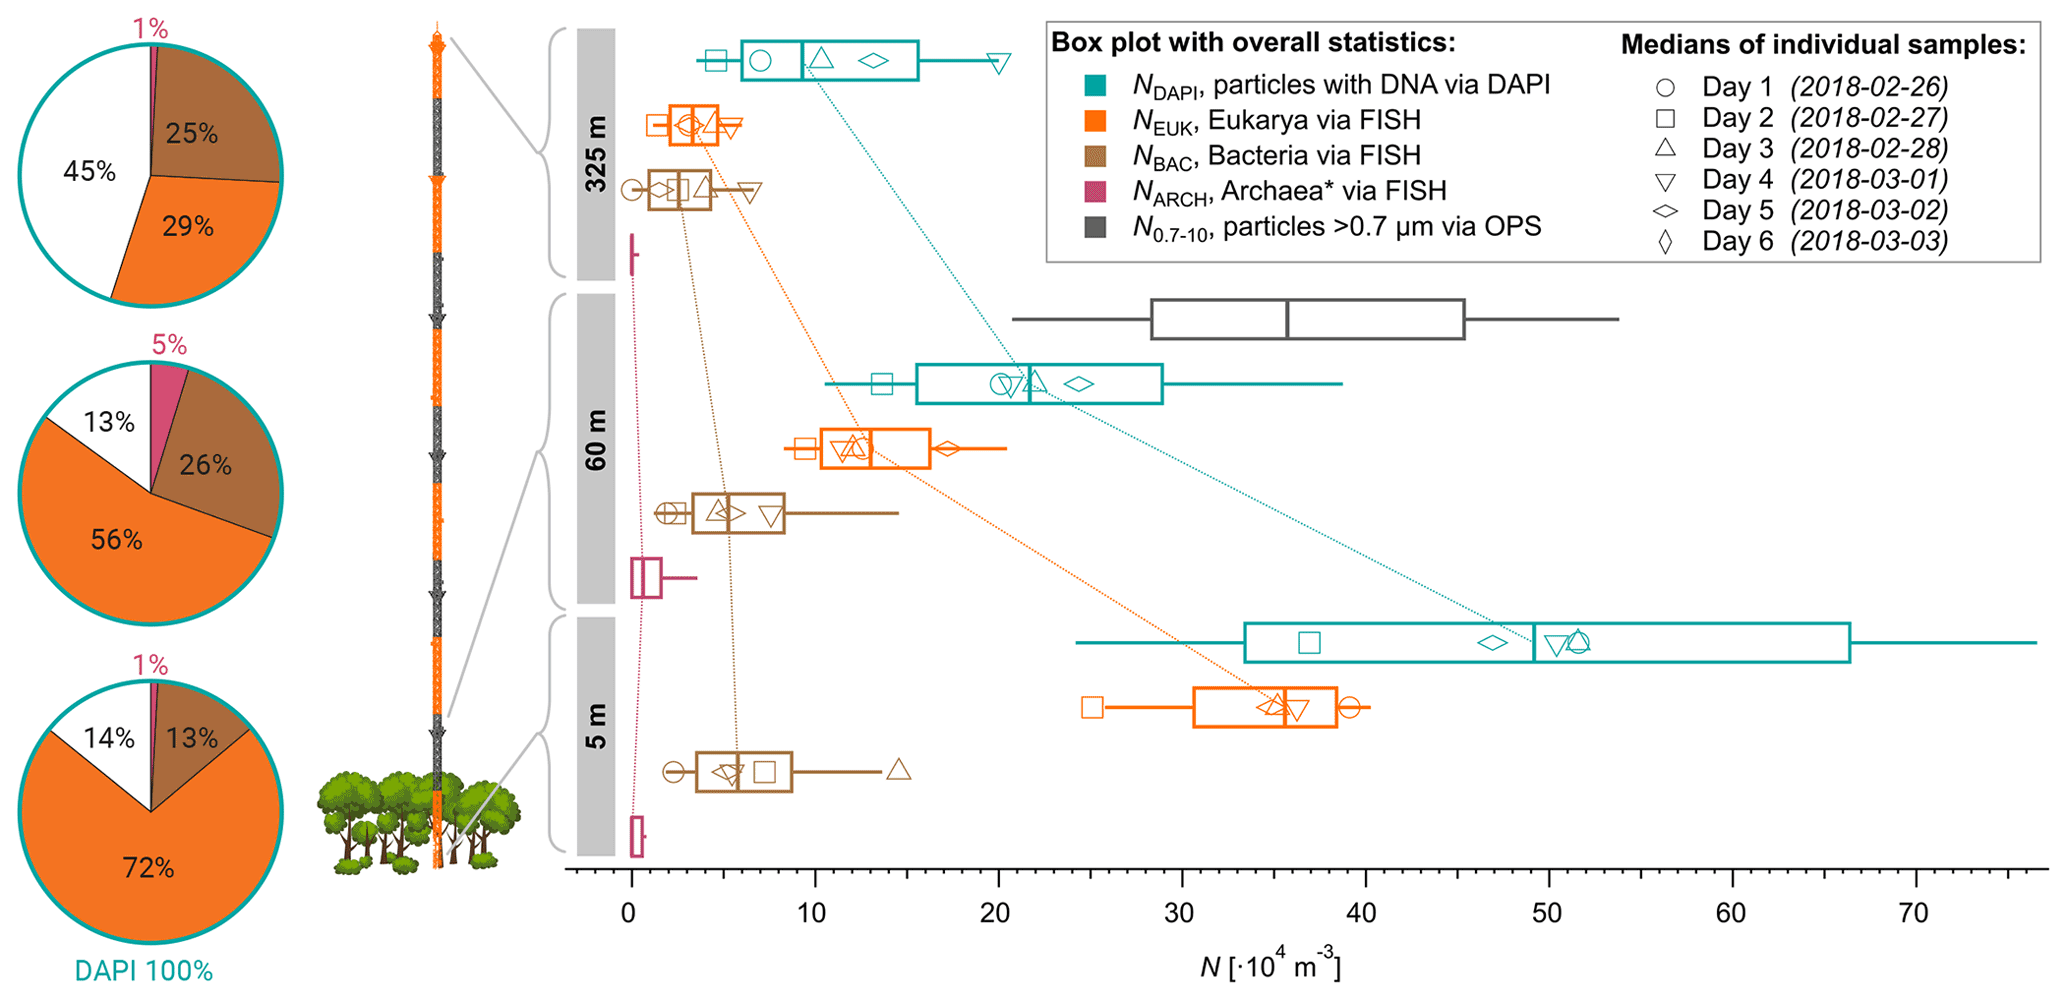
Figure 3Height profiles of aerosol number concentrations observed at 5, 60, and 325 m above ground at the ATTO-tower. The median concentrations of all daily samples are displayed as vertical box and whisker plots with 25 and 75 quartiles as boxes and 10 and 90 percentiles as whiskers. Daily median values are shown as markers according to the legend. Bioaerosols were quantified with FISH and DAPI staining. The total aerosol number concentration at 60 m was determined by an optical particle sizer (OPS) in the corresponding size range.
Furthermore, we investigated the bioaerosol variability with height across the lower 325 m of the boundary layer to assess the gradients of specific organism classes in this particularly important part of the atmospheric vertical structure. As expected, the vertical profiles displayed in Fig. 3 show a general and rather steep decrease in the average cell concentrations ranging from m−3 at 5 m and 25 ×104 m−3 at 60 m (a 52 % reduction) to 12×104 m−3 at 325 m (77 % reduction compared to 5 m). The eukaryotic cell concentration, NEUK, shows a similarly steep decrease in its profile. For bacterial cells, however, we found a less steep vertical trend with similar concentrations at 5 and 60 m (∼ 7.1×10⁴ m−3 vs. 6.5×10⁴ m−3), followed by a 54 % reduction from 60 to 325 m (∼ 3×10⁴ m−3). For Archaea, the highest concentrations were found at 60 m, although the low concentrations and counting statistics do not allow robust conclusions on the vertical profile of this organism class. All concentrations are summarized in Table 2. As an additional aspect, we also calculated airborne DNA mass concentrations based on the aforementioned FISH number concentrations in combination with typical mean genome sizes of fungi, Bacteria, and Archaea3. Such results on atmospheric DNA concentrations are sparse and typically based on photometric DNA quantification after extraction from aerosol filters. We obtained average airborne DNA mass concentrations of 11.9 ng m−3 at 5 m, 4.5 ng m−3 at 60 m, and 1.2 ng m−3 at 325 m (Table S2). In general, these results are comparable to studies conducted at an urban site yielding 7 ng m−3 (Després et al., 2007), a boreal forest yielding 8.60±11.1 ng m−3 (Helin et al., 2017), and the tropical region of Singapore yielding 0.69 to 6.9 ng m−3 (Gusareva et al., 2019). The Amazonian DNA concentrations presented here can be considered as a lower limit. Our data suggest that the Amazonian air microbiome hosts larger quantities of DNA mass concentration than reported for other ecosystems before.
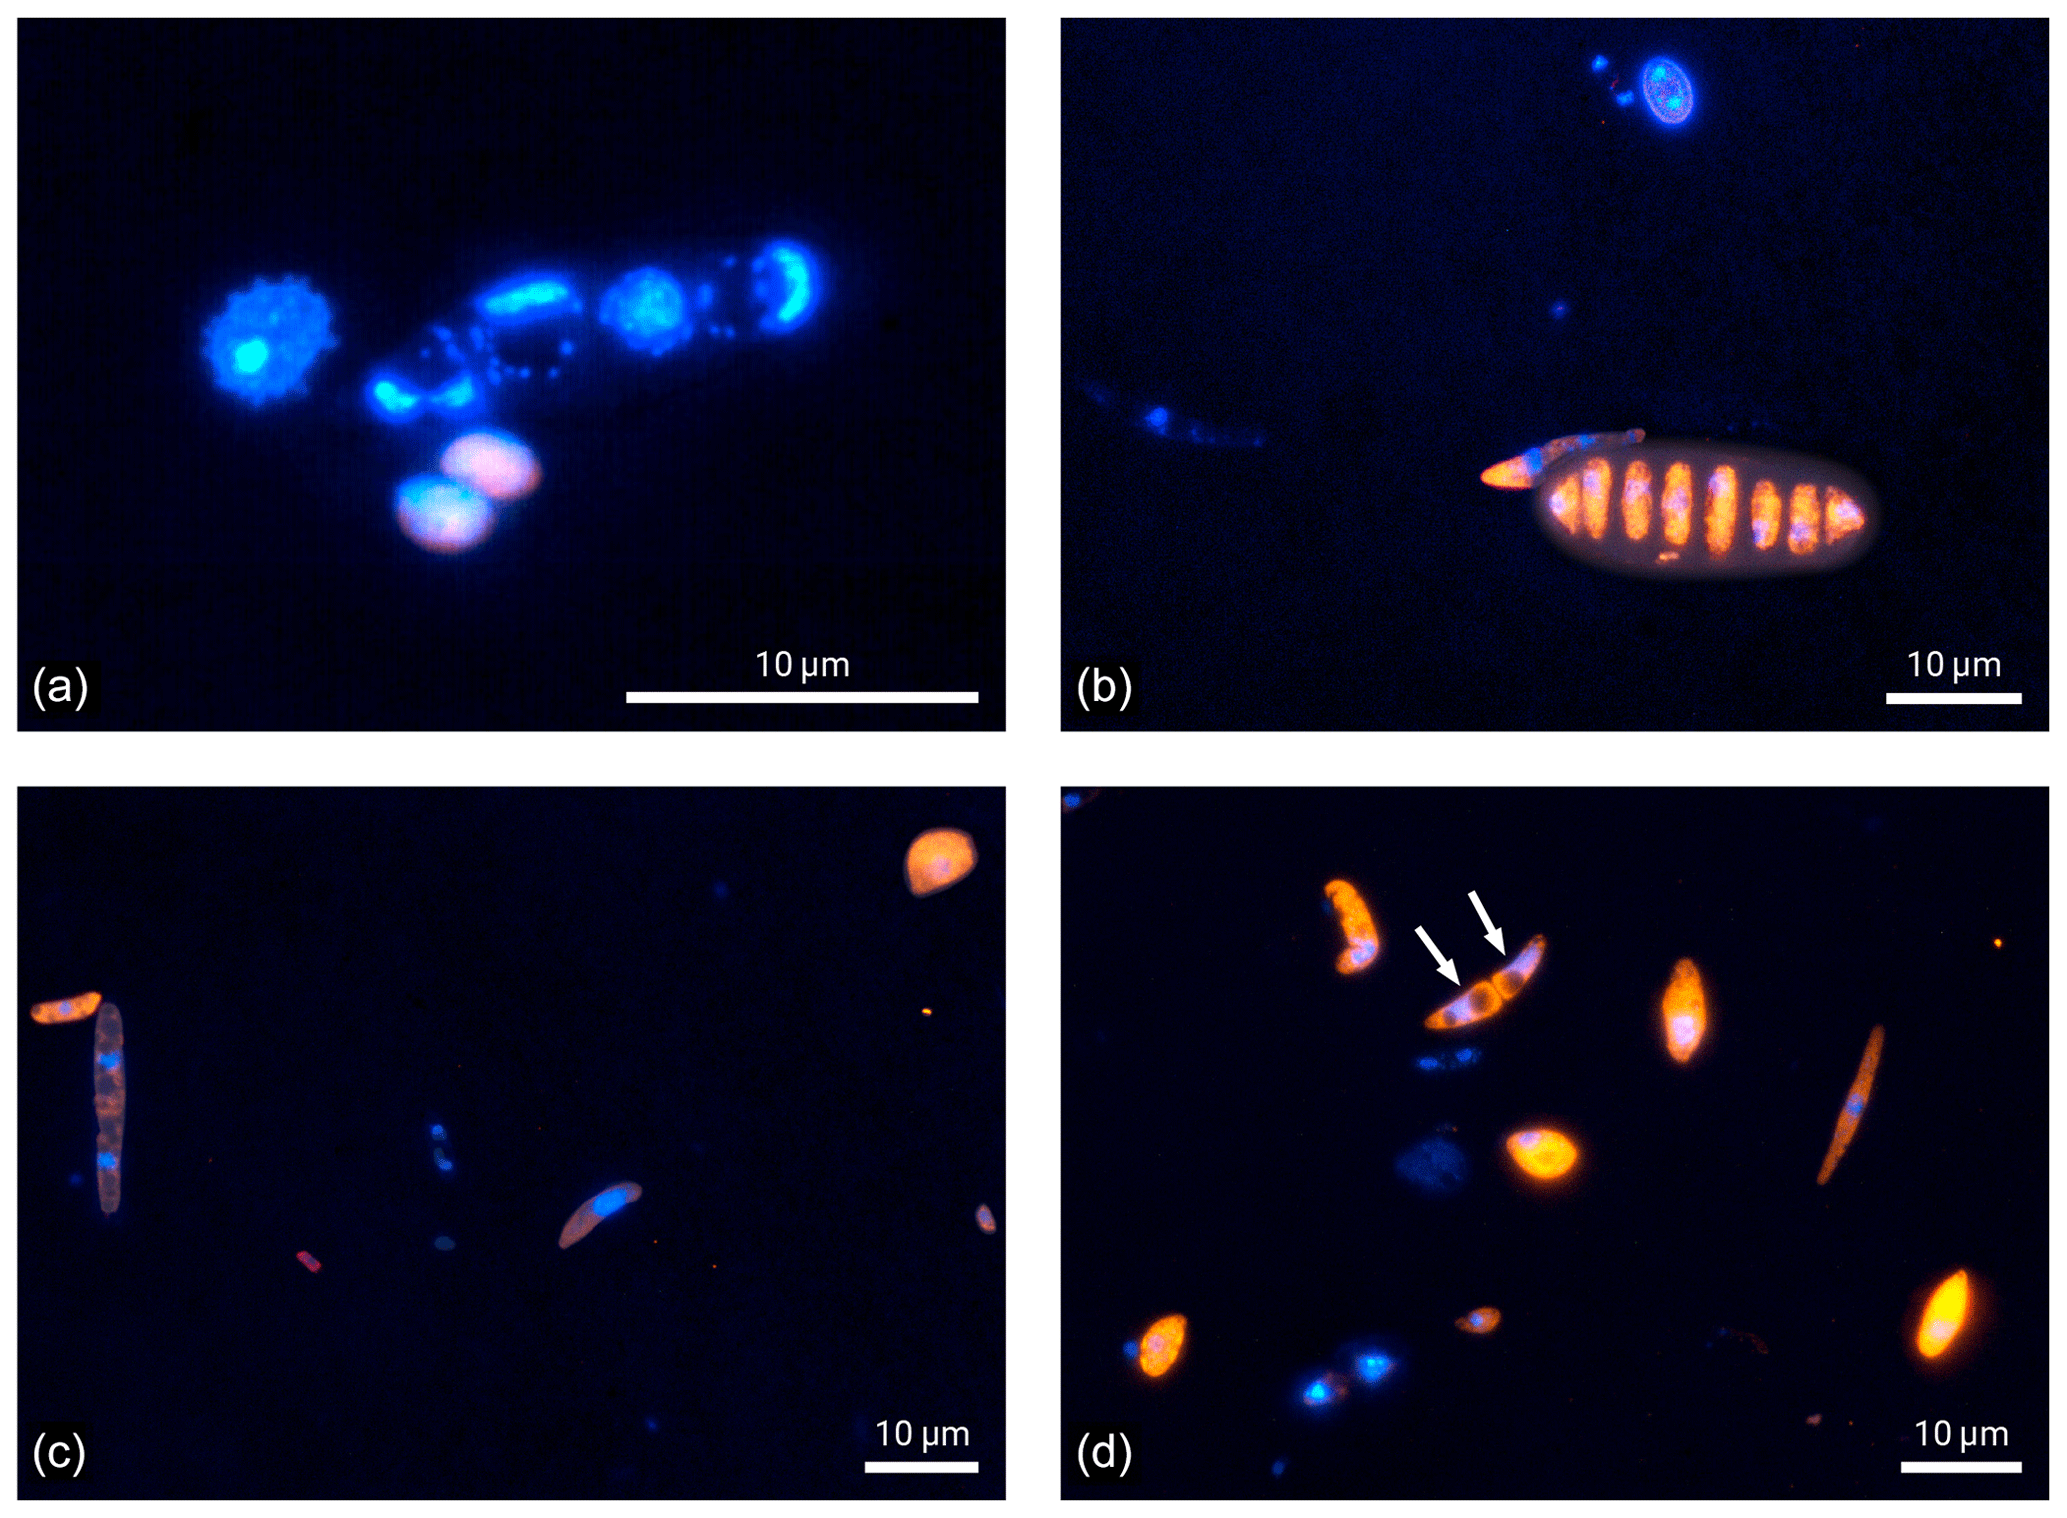
Figure 4Microscopic images of fluorescence signals after DNA staining with DAPI (blue) and FISH (eukaryotes in orange and bacteria in red). Bioaerosol samples were collected at 5 m height. Except for one bacterial bioaerosol in (c), all other fluorescent bioaerosol signals in these panels were attributed to the eukaryotic domain.
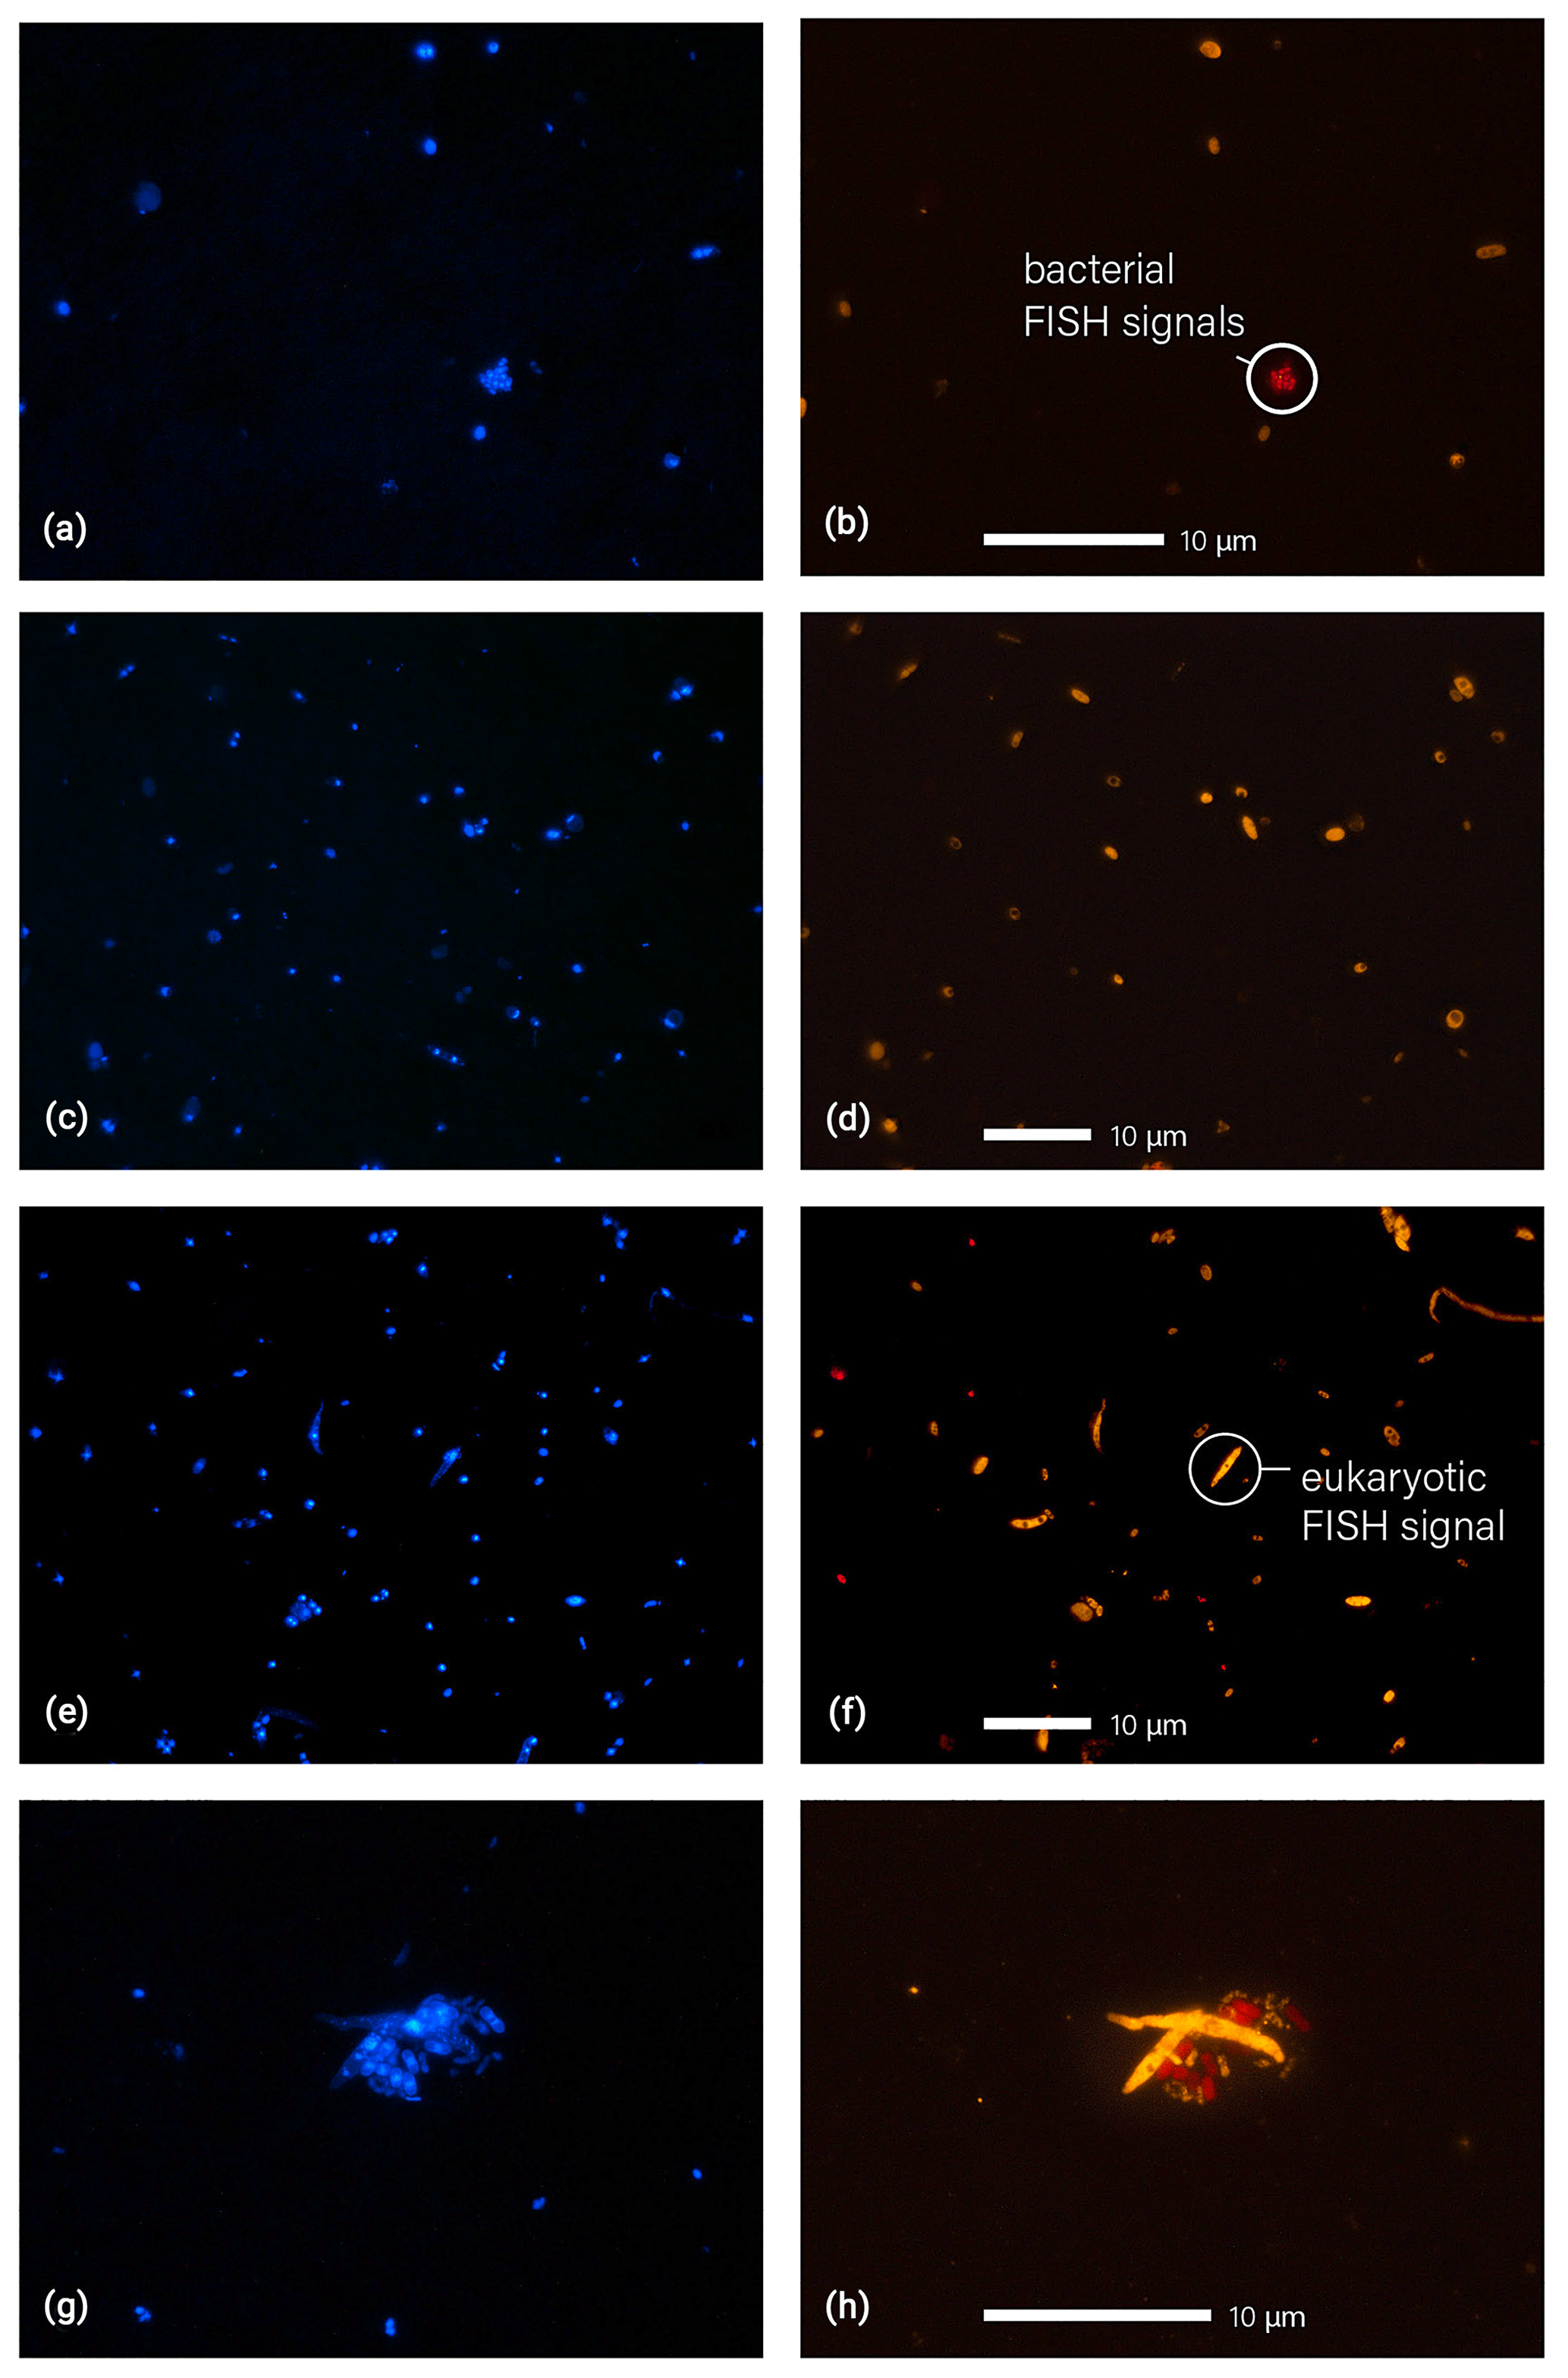
Figure 5Microscopic images of fluorescence signals after DNA staining with DAPI (a, c, e, g, blue) and FISH (b, d, f, h, eukaryotes in orange and bacteria in red). Filter samples displayed here were collected at 325 m (a, b), 60 m (c, d), and 5 m (e, f, g, h). Particle agglomerates, as shown in (g) and (h), were found rather rarely. The agglomerate here shows a cluster of fungal spores and bacterial cells.
The clear difference in the NEUK vs. NBAC profile structures might be due to different distributions of the organism sources inside and below the canopy space (i.e., biofilms on leaves according to Morris et al., 1997, vs. pronounced fungal spore emission at the ground according to Elbert et al., 2007, and Löbs et al., 2020). Another reason might be the different sedimentation velocities and thus airborne residence times due to widely different particle mass. Further, please note that the fraction of unclassified particles increased substantially towards 325 m, which may be related to enhanced cell aging due to radiation and/or atmospheric oxidation upon upward transport. Typical cloud base heights in the central Amazon range between 500 and 1500 m (Oliver Lauer, personal communication, 2020), which is substantially higher than the 325 m sampling height used here. Still, the measured values for NEUK, NBAC, NARC, and NDAPI at 325 m can serve as a solid upper limit estimate for cell concentrations being convectively lifted to cloud base. This estimate may be of value for cloud microphysical process studies in combination with Amazonian IN observations and parameterizations (e.g., Prenni et al., 2009; Schrod et al., 2020).
Finally, the microscopic visualization of cells after staining also provides qualitative insights into the Amazonian bioaerosol population, which is a strength of the FISH approach. Figure 4 shows selected examples of bioaerosols typically found at 5 m height at the ATTO site. Most of the bioaerosols visualized in Fig. 4 belong to the eukaryotic domain. Some of them could also be identified as spores based on morphological criteria (Gregory, 1973; Lacey and West, 2007). Figure 4a further illustrates the importance of a careful fixation and permeabilization prior to hybridization to enable the entrance of the FISH probe into the cells. Here, bioaerosol that are most likely fern spores according to their typical spike-like surface structure as shown in Lacey and West (2007) emit nearly no orange fluorescence, indicating a lack of hybridized eukaryotic probe due to insufficient cell lysis. In comparison, the ascospore in Fig. 4b shows intense orange fluorescence as a sign of successful hybridization. However, signal intensities may vary also due to different rRNA contents as a matter of metabolic activity (e.g., positive signal but overall low fluorescent intensity of the spore on the left side in Fig. 4c). Here, the manual microscopic inspection is of advantage as parameters such as particle size, morphology, surface structure, and fluorescent color can be considered beyond fluorescence intensity to discriminate biological from non-biological and potentially autofluorescent particles. In terms of counting statistics, the manual enumeration can be beneficial as particles yielding two or more DAPI stained cores can be identified as a single bioaerosol as shown in the form of an ascospore (white arrows) in Fig. 4d.
Additionally, the microscopic identification of the Amazonian bioaerosol population can provide insights into the bioaerosol mixing and vertical dispersion, which is an important aspect of the Amazonian bioaerosol cycling (Pöschl et al., 2010). Figure 5 shows typical fluorescence images after DAPI and FISH staining obtained from the three different sampling heights. Figure 5g and h show an example of a cell agglomerate comprising multiple eukaryotic and bacterial cells. In the course of the microscopic analysis, Archaea were found as single particles only. Fungal spores were found occasionally in physical association with bacteria (as shown in Fig. 5g and h) or with other fungal spores. The vast majority of cells, however, was observed as separated cells, which suggests that under the given wet season conditions the bioaerosol components are largely externally mixed. Another (qualitative) observation worth noting is a decrease in average cell size with height (i.e., more larger particles with > 2 µm at 5 and 60 m relative to 325 m). Several of the large cells could be identified as fungal and fern spores based on morphological criteria. An enrichment of larger particles at the lower heights is likely a result of the high abundance sources within and under the canopy in combination with higher sedimentation tendency and lower atmospheric residence times of large particles. The decreasing size with height corresponds well to the increasing fraction of bacterial cells which are typically smaller than eukaryotic cells. A systematic retrieval of bioaerosol number size distributions from the FISH micrographs to investigate such trends in detail, however, is rather challenging and thus will be subject of a follow-up study.
Our study showed that FISH has analytical potential in bioaerosol analysis. It combines bioaerosol identification, quantification, and visualization and thus provides insights into the concentration levels and spatiotemporal variability of specific and clearly defined organism groups within the bioaerosol population. Besides airborne abundances, only a little is known about single particle properties such as identity, mixture, or size. Here, we propose FISH to be an interesting tool to complement the methods currently established for environmental bioaerosol analysis (Sect. S1.4). As this is the first study using FISH for Amazonian bioaerosol analysis, we applied three broad taxonomic probes to obtain a first overview on the domain level before exploring the bioaerosol population at a higher taxonomic resolution. The Amazonian bioaerosols were investigated on the domain level by quantifying eukaryotic, bacterial, and archaeal cells, as well as the overall concentrations of airborne cells as a function of time and height within and above the forest canopy. These bioaerosol abundances are characteristic for natural and clean background aerosol conditions as during the analyzed sampling period local emissions from the primary rain forest dominated. Eukarya (29 %–72 %) and Bacteria (13 %–26 %) dominated the bioaerosol population and variability, whereas Archaea (0.5 %–5 %) played numerically only a minor role. On average ∼ 70 % of the coarse mode particles (i.e., 0.7–10 µm) were attributed to presumably intact cells, whereas the remaining ∼ 30 % can be regarded as an upper limit estimate for biological fragments and degenerated biological material in this size fraction under the given conditions. The bioaerosol concentrations decreased substantially with height with ∼ 2 times less Bacteria and even ∼ 10 times less Eukaryotes at 325 m than under the canopy. This emphasizes the importance of the sampling height as a variable for bioaerosol observations in the Amazon. The different shapes of the bacterial vs. eukaryotic concentration profiles may be attributed to different source locations in and below the canopy and/or differences in aerodynamic mobility of the cells upon vertical transport. Overall, the results of this study extend the knowledge on the life cycle of the Amazonian aerosols and provide a solid experimental basis for model investigations of bioaerosol-related processes, such as the role of biological ice nuclei or giant cloud condensation nuclei in cloud microphysics and potential bio-precipitation cycling.
Pronounced diurnal patterns with a maximum of coarse mode particle abundance during the night represent a characteristic feature of Amazonian aerosol cycling (Fig. 2). The current study demonstrates that a dedicated FISH analysis with separated day vs. night sampling promises to resolve and quantify the organism classes that constitute the diurnal pattern. This further relates to the open question on the main meteorological drivers for bioaerosol emissions in the rain forest ecosystem. For this purpose, a broader statistical basis of FISH results and comparisons with bioaerosol analysis techniques (such as next generation sequencing or quantitative polymerase chain reaction) along with meteorological observations are needed. Essential for microphysical bioaerosol analyses is a retrieval of the number size distributions from the DAPI and FISH data sets. Fluxes of specific organism classes from the forest could potentially be determined with a dedicated FISH sampling during periods of strong convection. In addition, the wet season characterization presented here requires a complementary dry season sampling to resolve potential seasonal differences in the bioaerosol abundance and mixture. Finally, the taxonomic resolution of this study operates exclusively on the domain level. Future studies should use the analytical potential of FISH by targeting organism classes on lower taxonomic levels (e.g., theoretically down to species level) in combination with sequencing-based techniques. This is of particular interest in terms of differences in IN activity influencing the formation of clouds. In the bigger picture, we envision that dedicated FISH studies may be conducted in close relation to cloud microphysical process studies. Targeted bioaerosol characterizations during periods of climate extremes, such as El-Niño-related droughts in the Amazon, would be of great importance to study the response and resilience of the bioaerosol population in the Amazon under warmer and presumably drier climatic conditions in the future.
All essential results from FISH and DAPI staining are provided in the main text and the tables in the Supplement. Online ATTO data can be found in the ATTO data portal under https://www.attodata.org/ (ATTO, 2020) with data ID 130 for the OPS measurements and data ID 202 for meteorological data. For data requests beyond the available data, please refer to the corresponding authors.
The supplement related to this article is available online at: https://doi.org/10.5194/bg-18-4873-2021-supplement.
MP and CP developed the research and the experiments. MP conducted the sampling, the sample analysis, and manuscript preparation with contributions from all co-authors. FD, LAK, MAF, and ACdA supported the sample collection, data acquisition at the ATTO site, and online data analysis. IHdA, JW, and JDF supported the laboratory filter analysis and microscopic visualization. BMF provided advice and guidance for the adaptation of FISH protocols for bioaerosol analysis. DW and TK developed data analysis routines. MOA, JK, BW, PA, and ET provided valuable ideas to the data analysis and interpretation. WE contributed to the literature research and comparison with earlier studies. CP and UP supervised the work. All the authors contributed to the interpretation of the results and writing of the paper.
The authors declare that they have no conflict of interest.
This paper contains results of
research conducted under the technical and scientific cooperation agreement
between the National Institute for Amazonian Research, the Amazonas State University, and the Max-Planck-Gesellschaft e.V.; the opinions expressed
are the entire responsibility of the authors and not of the participating
institutions.
Publisher’s note: Copernicus Publications remains neutral with regard to jurisdictional claims in published maps and institutional affiliations.
We would like to thank Reiner Ditz, Stefan Wolff, Susan Trumbore, Alberto Quesada, Hermes Braga Xavier, Andrew Crozier, Nagib Alberto de Castro Souza, Thiago de Lima Xavier, Thomas Disper, Josué Ferreira de Souza, Feliciano de Souza Coelho, Antonio Huxley Melo Nascimento, André Luiz Matos, Elton Mendes da Silva, Björn Nillius, Antonio Ocimar Manzi, Roberta Pereira de Souza, Wallace Rabelo Costa Amauri Rodriguês Perreira, Steffen Schmidt, Uwe Schulz, Bruno Takeshi, and Adir Vasconcelos Brandão for technical, logistical, and scientific support within the ATTO project. We thank Annemarie Zahn and Dominic Jack for graphical support with figure design. We thank especially Jörg Wulf, Andreas Ellrott, Stefan Thiele, Jan Brüwer, and Rudolf Amann for substantial scientific and technical support with the FISH analysis. Moreover, we thank Viviane Després, Janine Fröhlich-Nowoisky, Cybelli Barbosa, Ricardo Godoi, Thomas Behrendt, Anna Kunert, Ovid Krüger, Oliver Lauer, Bruna A. Holanda, Matthias Sörgel, and Luiz A. T. Machado for scientific support and stimulating discussions.
This research work has been supported by the Max Planck Society (MPG), the Max Planck Graduate Center with the Johannes Gutenberg University Mainz (MPGC), the German Federal Ministry of Education and Research (BMBF contract
nos. 01LB1001A and 01LK1602B), the Brazilian Ministério da Ciência, Tecnologia e Inovação (MCTI/FINEP contract 01.11.01248.00), the Amazonas State University (UEA), FAPEAM, LBA/INPA, and SDS/CEUC/RDS Uatumã.
The article processing charges for this open-access publication were covered by the Max Planck Society.
This paper was edited by Tina Treude and reviewed by Boris Vinatzer and two anonymous referees.
Amann, R. and Fuchs, B. M.: Single-cell identification in microbial communities by improved fluorescence in situ hybridization techniques, Nat. Rev. Microbiol., 6, 339–348, 2008.
Amann, R. I., Krumholz, L., and Stahl, D. A.: Fluorescent-oligonucleotide probing of whole cells for determinative, phylogenetic, and environmental studies in microbiology, J. Bacteriol., 172, 762–770, 1990.
Andreae, M. O.: Aerosols before pollution, Science, 315, 50–51, https://doi.org/10.1126/science.1136529, 2007.
Andreae, M. O. and Crutzen, P. J.: Atmospheric aerosols: Biogeochemical sources and role in atmospheric chemistry, Science, 276, 1052–1058, 1997.
Andreae, M. O., Acevedo, O. C., Araùjo, A., Artaxo, P., Barbosa, C. G. G., Barbosa, H. M. J., Brito, J., Carbone, S., Chi, X., Cintra, B. B. L., da Silva, N. F., Dias, N. L., Dias-Júnior, C. Q., Ditas, F., Ditz, R., Godoi, A. F. L., Godoi, R. H. M., Heimann, M., Hoffmann, T., Kesselmeier, J., Könemann, T., Krüger, M. L., Lavric, J. V., Manzi, A. O., Lopes, A. P., Martins, D. L., Mikhailov, E. F., Moran-Zuloaga, D., Nelson, B. W., Nölscher, A. C., Santos Nogueira, D., Piedade, M. T. F., Pöhlker, C., Pöschl, U., Quesada, C. A., Rizzo, L. V., Ro, C.-U., Ruckteschler, N., Sá, L. D. A., de Oliveira Sá, M., Sales, C. B., dos Santos, R. M. N., Saturno, J., Schöngart, J., Sörgel, M., de Souza, C. M., de Souza, R. A. F., Su, H., Targhetta, N., Tóta, J., Trebs, I., Trumbore, S., van Eijck, A., Walter, D., Wang, Z., Weber, B., Williams, J., Winderlich, J., Wittmann, F., Wolff, S., and Yáñez-Serrano, A. M.: The Amazon Tall Tower Observatory (ATTO): overview of pilot measurements on ecosystem ecology, meteorology, trace gases, and aerosols, Atmos. Chem. Phys., 15, 10723–10776, https://doi.org/10.5194/acp-15-10723-2015, 2015.
Artaxo, P., Hansson, H. C., Andreae, M. O., Bäck, J., Alves, E. G., Barbosa, H. M. J., Bender, F., Bourtsoukidis, E., Carbone, S., Chi, J., Decesari, S., Després, V. R., Ditas, F., Ezhova, E., Fuzzi, S., Hasselquist, N. J., Heintzenberg, J., Holanda, B. A., Guenther, A., Hakola, H., Heikkinen, L., Kerminen, V. M., Kontkanen, J., Krejci, R., Kulmala, M., Lavric, J. V., de Leeuw, G., Lehtipalo, K., Machado, L. A. T., McFiggans, G., Franco, M. A. M., Mohr, C., Morgan, W., Nilsson, M. B., Peichl, M., Petäjä, T., Praß, M., Pöhlker, C., Pöhlker, M. L., Pöschl, U., Von Randow, C., Riipinen, I., Rinne, J., Rizzo, L. V., Rosenfeld, D., Assunção Faus da Silva Dias, M., Sogacheva, L., Stier, P., Swietlicki, E., Sörgel, M., Tunved, P., Virkkula, A., Wang, J., Weber, B., Yáñez-Serrano, A. M., and Zieger, P., Eugene Mikhailov, E., Smith, J. N., and Kesselmeier, J.: Tropical and boreal forests – Atmosphere interactions, a review, under revision, 2021.
ATTO (Amazon Tall Tower Observatory): Data portal, available at: https://www.attodata.org/ (last access: 16 July 2021), 2020.
Bonan, G. B.: Forests and climate change: forcings, feedbacks, and the climate benefits of forests, Science, 320, 1444–1449, 2008.
Burrows, S. M., Butler, T., Jöckel, P., Tost, H., Kerkweg, A., Pöschl, U., and Lawrence, M. G.: Bacteria in the global atmosphere – Part 2: Modeling of emissions and transport between different ecosystems, Atmos. Chem. Phys., 9, 9281–9297, https://doi.org/10.5194/acp-9-9281-2009, 2009a.
Burrows, S. M., Elbert, W., Lawrence, M. G., and Pöschl, U.: Bacteria in the global atmosphere – Part 1: Review and synthesis of literature data for different ecosystems, Atmos. Chem. Phys., 9, 9263–9280, https://doi.org/10.5194/acp-9-9263-2009, 2009b.
Christensen, H., Hansen, M., and Sørensen, J.: Counting and size classification of active soil bacteria by fluorescence in situ hybridization with an rRNA oligonucleotide probe, Appl. Environ. Microb., 65, 1753–1761, 1999.
Daims, H., Brühl, A., Amann, R., Schleifer, K.-H., and Wagner, M.: The Domain-specific Probe EUB338 is Insufficient for the Detection of all Bacteria: Development and Evaluation of a more Comprehensive Probe Set, Syst. Appl. Microbiol., 22, 434–444, https://doi.org/10.1016/S0723-2020(99)80053-8, 1999.
Delort, A.-M., Vaïtilingom, M., Amato, P., Sancelme, M., Parazols, M., Mailhot, G., Laj, P., and Deguillaume, L.: A short overview of the microbial population in clouds: potential roles in atmospheric chemistry and nucleation processes, Atmos. Res., 98, 249–260, 2010.
Després, V. R., Nowoisky, J. F., Klose, M., Conrad, R., Andreae, M. O., and Pöschl, U.: Characterization of primary biogenic aerosol particles in urban, rural, and high-alpine air by DNA sequence and restriction fragment analysis of ribosomal RNA genes, Biogeosciences, 4, 1127–1141, https://doi.org/10.5194/bg-4-1127-2007, 2007.
Després, V. R., Huffman, J. A., Burrows, S. M., Hoose, C., Safatov, A. S., Buryak, G., Fröhlich-Nowoisky, J., Elbert, W., Andreae, M. O., Pöschl, U., and Jaenicke, R.: Primary biological aerosol particles in the atmosphere: a review, Tellus B, 64, 1–58, https://doi.org/10.3402/tellusb.v64i0.15598, 2012.
Elbert, W., Taylor, P. E., Andreae, M. O., and Pöschl, U.: Contribution of fungi to primary biogenic aerosols in the atmosphere: wet and dry discharged spores, carbohydrates, and inorganic ions, Atmos. Chem. Phys., 7, 4569–4588, https://doi.org/10.5194/acp-7-4569-2007, 2007.
Fröhlich-Nowoisky, J., Kampf, C. J., Weber, B., Huffman, J. A., Pöhlker, C., Andreae, M. O., Lang-Yona, N., Burrows, S. M., Gunthe, S. S., Elbert, W., Su, H., Hoor, P., Thines, E., Hoffmann, T., Després, V. R., and Pöschl, U.: Bioaerosols in the earth system: climate, health, and ecosystem interactions, Atmos. Res., 182, 346–376, 2016.
Fuchs, B., Pernthaler, J., and Amann, R.: Single cell identification by fluorescence in situ hybridization, Methods for General and Molecular Microbiology, 3, 886–896, 2007.
Glöckner, F. O., Amann, R., Alfreider, A., Pernthaler, J., Psenner, R., Trebesius, K., and Schleifer, K.-H.: An in situ hybridization protocol for detection and identification of planktonic bacteria, Syst. Appl. Microbiol., 19, 403–406, https://doi.org/10.1016/S0723-2020(96)80069-5, 1996.
Glöckner, F. O., Fuchs, B. M., and Amann, R.: Bacterioplankton compositions of lakes and oceans: a first comparison based on fluorescence in situ hybridization, Appl. Environ. Microbiol., 65, 3721–3726, 1999.
Graham, B., Guyon, P., Maenhaut, W., Taylor, P. E., Ebert, M., Matthias-Maser, S., Mayol-Bracero, O. L., Godoi, R. H. M., Artaxo, P., Meixner, F. X., Moura, M. A. L., Rocha, C., Van Grieken, R., Glovsky, M. M., Flagan, R. C., and Andreae, M. O.: Composition and diurnal variability of the natural Amazonian aerosol, J. Geophys. Res.-Atmos., 108, 4765, https://doi.org/10.1029/2003jd004049, 2003a.
Graham, B., Guyon, P., Taylor, P. E., Artaxo, P., Maenhaut, W., Glovsky, M. M., Flagan, R. C., and Andreae, M. O.: Organic compounds present in the natural Amazonian aerosol: Characterization by gas chromatography-mass spectrometry, J. Geophys. Res.-Atmos., 108, 4766, https://doi.org/10.1029/2003jd003990, 2003b.
Gregory, P. H.: The Microbiology of the Atmosphere, Wiley, New York, 1973.
Gusareva, E. S., Acerbi, E., Lau, K. J., Luhung, I., Premkrishnan, B. N., Kolundžija, S., Purbojati, R. W., Wong, A., Houghton, J. N., and Miller, D.: Microbial communities in the tropical air ecosystem follow a precise diel cycle, P. Natl. Acad. Sci. USA, 116, 23299–23308, 2019.
Hamilton, D. S., Lee, L. A., Pringle, K. J., Reddington, C. L., Spracklen, D. V., and Carslaw, K. S.: Occurrence of pristine aerosol environments on a polluted planet, P. Natl. Acad. Sci. USA, 111, 18466–18471, 2014.
Harrison, R. M., Jones, A. M., Biggins, P. D. E., Pomeroy, N., Cox, C. S., Kidd, S. P., Hobman, J. L., Brown, N. L., and Beswick, A.: Climate factors influencing bacterial count in background air samples, Int. J. Biometeorol., 49, 167–178, https://doi.org/10.1007/s00484-004-0225-3, 2005.
Helin, A., Sietiö, O. M., Heinonsalo, J., Bäck, J., Riekkola, M. L., and Parshintsev, J.: Characterization of free amino acids, bacteria and fungi in size-segregated atmospheric aerosols in boreal forest: seasonal patterns, abundances and size distributions, Atmos. Chem. Phys., 17, 13089–13101, https://doi.org/10.5194/acp-17-13089-2017, 2017.
Huffman, J. A., Sinha, B., Garland, R. M., Snee-Pollmann, A., Gunthe, S. S., Artaxo, P., Martin, S. T., Andreae, M. O., and Pöschl, U.: Size distributions and temporal variations of biological aerosol particles in the Amazon rainforest characterized by microscopy and real-time UV-APS fluorescence techniques during AMAZE-08, Atmos. Chem. Phys., 12, 11997–12019, https://doi.org/10.5194/acp-12-11997-2012, 2012.
Huffman, J. A., Prenni, A. J., DeMott, P. J., Pöhlker, C., Mason, R. H., Robinson, N. H., Fröhlich-Nowoisky, J., Tobo, Y., Després, V. R., Garcia, E., Gochis, D. J., Harris, E., Müller-Germann, I., Ruzene, C., Schmer, B., Sinha, B., Day, D. A., Andreae, M. O., Jimenez, J. L., Gallagher, M., Kreidenweis, S. M., Bertram, A. K., and Pöschl, U.: High concentrations of biological aerosol particles and ice nuclei during and after rain, Atmos. Chem. Phys., 13, 6151–6164, https://doi.org/10.5194/acp-13-6151-2013, 2013.
Jaenicke, R.: Abundance of cellular material and proteins in the atmosphere, Science, 308, 73–73, https://doi.org/10.1126/science.1106335, 2005.
Kabir, E., Azzouz, A., Raza, N., Bhardwaj, S. K., Kim, K.-H., Tabatabaei, M., and Kukkar, D.: Recent Advances in Monitoring, Sampling, and Sensing Techniques for Bioaerosols in the Atmosphere, ACS Sensors, 5, 1254–1267, https://doi.org/10.1021/acssensors.9b02585, 2020.
Lacey, M. E. and West, J. S.: The air spora: a manual for catching and identifying airborne biological particles, Springer, Dordrecht, the Netherlands, 2007.
Landenmark, H. K., Forgan, D. H., and Cockell, C. S.: An estimate of the total DNA in the biosphere, PLOS Biology, 13, e1002168, https://doi.org/10.1371/journal.pbio.1002168, 2015.
Lange, J. L., Thorne, P. S., and Lynch, N.: Application of flow cytometry and fluorescent in situ hybridization for assesment of exposures to airborne bacteria, Appl. Environ. Microb., 63, 1557, https://doi.org/10.1128/aem.63.4.1557-1563.1997, 1997.
Löbs, N., Barbosa, C. G. G., Brill, S., Walter, D., Ditas, F., de Oliveira Sá, M., de Araújo, A. C., de Oliveira, L. R., Godoi, R. H. M., Wolff, S., Piepenbring, M., Kesselmeier, J., Artaxo, P., Andreae, M. O., Pöschl, U., Pöhlker, C., and Weber, B.: Aerosol measurement methods to quantify spore emissions from fungi and cryptogamic covers in the Amazon, Atmos. Meas. Tech., 13, 153–164, https://doi.org/10.5194/amt-13-153-2020, 2020.
Mayol, E., Jiménez, M. A., Herndl, G. J., Duarte, C. M., and Arrieta, J. M.: Resolving the abundance and air-sea fluxes of airborne microorganisms in the North Atlantic Ocean, Front. Microbiol., 5, 557, https://doi.org/10.3389/fmicb.2014.00557, 2014.
Mbareche, H., Brisebois, E., Veillette, M., and Duchaine, C.: Bioaerosol sampling and detection methods based on molecular approaches: No pain no gain, Sci. Total Environ., 599/600, 2095–2104, https://doi.org/10.1016/j.scitotenv.2017.05.076, 2017.
Moran-Zuloaga, D., Ditas, F., Walter, D., Saturno, J., Brito, J., Carbone, S., Chi, X., Hrabě de Angelis, I., Baars, H., Godoi, R. H. M., Heese, B., Holanda, B. A., Lavrič, J. V., Martin, S. T., Ming, J., Pöhlker, M. L., Ruckteschler, N., Su, H., Wang, Y., Wang, Q., Wang, Z., Weber, B., Wolff, S., Artaxo, P., Pöschl, U., Andreae, M. O., and Pöhlker, C.: Long-term study on coarse mode aerosols in the Amazon rain forest with the frequent intrusion of Saharan dust plumes, Atmos. Chem. Phys., 18, 10055–10088, https://doi.org/10.5194/acp-18-10055-2018, 2018.
Morris, C. E., Monier, J., and Jacques, M.: Methods for observing microbial biofilms directly on leaf surfaces and recovering them for isolation of culturable microorganisms, Appl. Environ. Microbiol., 63, 1570–1576, 1997.
Morris, C. E., Sands, D. C., Bardin, M., Jaenicke, R., Vogel, B., Leyronas, C., Ariya, P. A., and Psenner, R.: Microbiology and atmospheric processes: research challenges concerning the impact of airborne micro-organisms on the atmosphere and climate, Biogeosciences, 8, 17–25, https://doi.org/10.5194/bg-8-17-2011, 2011.
Morris, C. E., Conen, F., Alex Huffman, J., Phillips, V., Pöschl, U., and Sands, D. C.: Bioprecipitation: a feedback cycle linking Earth history, ecosystem dynamics and land use through biological ice nucleators in the atmosphere, Glob. Change Biol., 20, 341–351, https://doi.org/10.1111/gcb.12447, 2014.
Pernthaler, A., Pernthaler, J., Amann, R., Kowalchuk, G., de Bruijn, F., Head, I., Akkermans, A., and van Elsas, J.: Sensitive multi-color fluorescence in situ hybridization for the identification of environmental microorganisms, Molecular Microbial Ecology Manual, 1–2, 711–725, 2004.
Pernthaler, J., Pernthaler, A., and Amann, R.: Automated enumeration of groups of marine picoplankton after fluorescence in situ hybridization, Appl. Environ. Microb., 69, 2631–2637, 2003.
Pöhlker, C., Huffman, J. A., and Pöschl, U.: Autofluorescence of atmospheric bioaerosols – fluorescent biomolecules and potential interferences, Atmos. Meas. Tech., 5, 37–71, https://doi.org/10.5194/amt-5-37-2012, 2012.
Pöhlker, M. L., Ditas, F., Saturno, J., Klimach, T., Hrabě de Angelis, I., Araùjo, A. C., Brito, J., Carbone, S., Cheng, Y., Chi, X., Ditz, R., Gunthe, S. S., Holanda, B. A., Kandler, K., Kesselmeier, J., Könemann, T., Krüger, O. O., Lavrič, J. V., Martin, S. T., Mikhailov, E., Moran-Zuloaga, D., Rizzo, L. V., Rose, D., Su, H., Thalman, R., Walter, D., Wang, J., Wolff, S., Barbosa, H. M. J., Artaxo, P., Andreae, M. O., Pöschl, U., and Pöhlker, C.: Long-term observations of cloud condensation nuclei over the Amazon rain forest – Part 2: Variability and characteristics of biomass burning, long-range transport, and pristine rain forest aerosols, Atmos. Chem. Phys., 18, 10289–10331, https://doi.org/10.5194/acp-18-10289-2018, 2018.
Pöhlker, C., Walter, D., Paulsen, H., Könemann, T., Rodríguez-Caballero, E., Moran-Zuloaga, D., Brito, J., Carbone, S., Degrendele, C., Després, V. R., Ditas, F., Holanda, B. A., Kaiser, J. W., Lammel, G., Lavrič, J. V., Ming, J., Pickersgill, D., Pöhlker, M. L., Praß, M., Löbs, N., Saturno, J., Sörgel, M., Wang, Q., Weber, B., Wolff, S., Artaxo, P., Pöschl, U., and Andreae, M. O.: Land cover and its transformation in the backward trajectory footprint region of the Amazon Tall Tower Observatory, Atmos. Chem. Phys., 19, 8425–8470, https://doi.org/10.5194/acp-19-8425-2019, 2019.
Pöschl, U., Martin, S. T., Sinha, B., Chen, Q., Gunthe, S. S., Huffman, J. A., Borrmann, S., Farmer, D. K., Garland, R. M., Helas, G., Jimenez, J. L., King, S. M., Manzi, A., Mikhailov, E., Pauliquevis, T., Petters, M. D., Prenni, A. J., Roldin, P., Rose, D., Schneider, J., Su, H., Zorn, S. R., Artaxo, P., and Andreae, M. O.: Rainforest aerosols as biogenic nuclei of clouds and precipitation in the Amazon, Science, 329, 1513–1516, https://doi.org/10.1126/science.1191056, 2010.
Prenni, A. J., Petters, M. D., Kreidenweis, S. M., Heald, C. L., Martin, S. T., Artaxo, P., Garland, R. M., Wollny, A. G., and Pöschl, U.: Relative roles of biogenic emissions and Saharan dust as ice nuclei in the Amazon basin, Nat. Geosci., 2, 401–404, https://doi.org/10.1038/ngeo517, 2009.
Prospero, J. M., Blades, E., Mathison, G., and Naidu, R.: Interhemispheric transport of viable fungi and bacteria from Africa to the Caribbean with soil dust, Aerobiologia, 21, 1–19, https://doi.org/10.1007/s10453-004-5872-7, 2005.
Reinmuth-Selzle, K., Kampf, C. J., Lucas, K., Lang-Yona, N., Fröhlich-Nowoisky, J., Shiraiwa, M., Lakey, P. S., Lai, S., Liu, F., and Kunert, A. T.: Air pollution and climate change effects on allergies in the anthropocene: Abundance, interaction, and modification of allergens and adjuvants, Environ. Sci. Technol., 51, 4119–4141, 2017.
Šantl-Temkiv, T., Sahyoun, M., Finster, K., Hartmann, S., Augustin-Bauditz, S., Stratmann, F., Wex, H., Clauss, T., Nielsen, N. W., Sørensen, J. H., Korsholm, U. S., Wick, L. Y., and Karlson, U. G.: Characterization of airborne ice-nucleation-active bacteria and bacterial fragments, Atmos. Environ., 109, 105–117, https://doi.org/10.1016/j.atmosenv.2015.02.060, 2015.
Šantl-Temkiv, T., Sikoparija, B., Maki, T., Carotenuto, F., Amato, P., Yao, M., Morris, C. E., Schnell, R., Jaenicke, R., Pöhlker, C., DeMott, P. J., Hill, T. C. J., and Huffman, J. A.: Bioaerosol field measurements: Challenges and perspectives in outdoor studies, Aerosol Sci. Technol., 54, 520–546, https://doi.org/10.1080/02786826.2019.1676395, 2019.
Schmidt, H., Eickhorst, T., and Mußmann, M.: Gold-FISH: A new approach for the in situ detection of single microbial cells combining fluorescence and scanning electron microscopy, Syst. Appl. Microbiol., 35, 518–525, https://doi.org/10.1016/j.syapm.2012.04.006, 2012.
Schrod, J., Thomson, E. S., Weber, D., Kossmann, J., Pöhlker, C., Saturno, J., Ditas, F., Artaxo, P., Clouard, V., Saurel, J.-M., Ebert, M., Curtius, J., and Bingemer, H. G.: Long-term deposition and condensation ice-nucleating particle measurements from four stations across the globe, Atmos. Chem. Phys., 20, 15983–16006, https://doi.org/10.5194/acp-20-15983-2020, 2020.
Souza, F. F., Rissi, D. V., Pedrosa, F. O., Souza, E. M., Baura, V. A., Monteiro, R. A., Balsanelli, E., Cruz, L. M., Souza, R. A., and Andreae, M. O.: Uncovering prokaryotic biodiversity within aerosols of the pristine Amazon forest, Sci. Total Environ., 688, 83–86, 2019.
Stahl, D. A. and Amann, R.: Development and application of nucleic acid probes, in: Nucleic acid techniques in bacterial systematics, edited by: Stackebrandt, E. and Goodfellow, M., Chichester, UK, John Wiley&Sons Ltd, 205–248, 1991.
Steiner, A. L., Brooks, S. D., Deng, C., Thornton, D. C. O., Pendleton, M. W., and Bryant, V.: Pollen as atmospheric cloud condensation nuclei, Geophys. Res. Lett., 42, 3596–3602, https://doi.org/10.1002/2015gl064060, 2015.
Thiele, S., Fuchs, B., and Amann, R.: Identification of microorganisms using the ribosomal RNA approach and fluorescence in situ hybridization, Treatise on Water Science, 3, 171–189, 2011.
Trevors, J. T.: Genome size in bacteria, Antonie van Leeuwenhoek, 69, 293–303, https://doi.org/10.1007/BF00399618, 1996.
Wallner, G., Amann, R., and Beisker, W.: Optimizing fluorescent in situ hybridization with rRNA-targeted oligonucleotide probes for flow cytometric identification of microorganisms, Cytometry, 14, 136–143, https://doi.org/10.1002/cyto.990140205, 1993.
Yamaguchi, N., Ichijo, T., Sakotani, A., Baba, T., and Nasu, M.: Global dispersion of bacterial cells on Asian dust, Sci. Rep.-UK, 2, 525, https://doi.org/10.1038/srep00525, 2012.
Yoo, K., Lee, T. K., Choi, E. J., Yang, J., Shukla, S. K., Hwang, S.-I., and Park, J.: Molecular approaches for the detection and monitoring of microbial communities in bioaerosols: A review, J. Environ. Sci., 51, 234–247, https://doi.org/10.1016/j.jes.2016.07.002, 2017.
Joung, Y. S., Ge, Z. F., and Buie, C. R.: Bioaerosol generation by raindrops on soil, Nat. Commun., 8, 14668, https://doi.org/10.1038/ncomms14668, 2017.
Zeder, M., Ellrott, A., and Amann, R.: Automated sample area definition for high-throughput microscopy, Cytom. Part A, 79, 306–310, 2011.
DAPI = 4′,6-diamidino-2-phenylindole is a widely used fluorescent stain for DNA.
In fact, we refrain from interpreting NARC in great detail in this work due to the low statistics. Furthermore, the probe ARCH915 used here was found to hybridize with some Bacteria, which could lead to false-positive signals. We assume that this could have been the case on 1 and 2 March at 60 m sampling height, leading to no “unknowns” with respect to DAPI numbers.
With the chosen approach, this quantification exclusively accounts for intracellular DNA and omits the fraction of extracellular DNA.