the Creative Commons Attribution 4.0 License.
the Creative Commons Attribution 4.0 License.
 | 22 Sep 2021
Spatial patterns of aboveground phytogenic Si stocks in a grass-dominated catchment – results from UAS-based high-resolution remote sensing
Marc Wehrhan
Daniel Puppe
Danuta Kaczorek
Michael Sommer
Various studies have been performed to quantify silicon (Si) stocks in plant biomass and related Si fluxes in terrestrial biogeosystems. Most studies are deliberately designed on the plot scale to ensure low heterogeneity in soils and plant composition, hence similar environmental conditions. Due to the immanent spatial soil variability, the transferability of results to larger areas, such as catchments, is therefore limited. However, the emergence of new technical features and increasing knowledge on details in Si cycling lead to a more complex picture at landscape and catchment scales. Dynamic and static soil properties change along the soil continuum and might influence not only the species composition of natural vegetation but also its biomass distribution and related Si stocks. Maximum likelihood (ML) classification was applied to multispectral imagery captured by an unmanned aerial system (UAS) aiming at the identification of land cover classes (LCCs). Subsequently, the normalized difference vegetation index (NDVI) and ground-based measurements of biomass were used to quantify aboveground Si stocks in two Si-accumulating plants (Calamagrostis epigejos and Phragmites australis) in a heterogeneous catchment and related corresponding spatial patterns of these stocks to soil properties. We found aboveground Si stocks of C. epigejos and P. australis to be surprisingly high (maxima of Si stocks reach values up to 98 g Si m−2), i.e. comparable to or markedly exceeding reported values for the Si storage in aboveground vegetation of various terrestrial ecosystems. We further found spatial patterns of plant aboveground Si stocks to reflect spatial heterogeneities in soil properties. From our results, we concluded that (i) aboveground biomass of plants seems to be the main factor of corresponding phytogenic Si stock quantities, and (ii) a detection of biomass heterogeneities via UAS-based remote sensing represents a promising tool for the quantification of lifelike phytogenic Si pools at landscape scales.
- Article
(7128 KB) - Full-text XML
- BibTeX
- EndNote


Biogenic silicon (BSi), i.e. silica precipitates (SiO2⋅nH2O) synthesized by various organisms, has been recognized as a key factor controlling Si fluxes from terrestrial to aquatic ecosystems (Dürr et al., 2011; Street-Perrott and Barker, 2008; Struyf and Conley, 2012), which mainly results from its pool size and a larger solubility compared to silicate minerals (e.g. Cornelis and Delvaux, 2016). Eukaryotic and prokaryotic organisms, i.a., plants, bacteria, fungi, diatoms, testate amoebae, and sponges, are able to synthesize BSi (Clarke, 2003; Ehrlich et al., 2010), and corresponding BSi pools can be found in terrestrial biogeosystems (Puppe et al., 2015; Puppe, 2020; Sommer et al., 2006). BSi structures of different origin indicate differences in their physicochemical surface properties (Puppe and Leue, 2018), which in turn control their dissolution kinetics (Bartoli, 1983; Fraysse et al., 2006, 2009). In most terrestrial ecosystems phytogenic Si, i.e. BSi synthesized by plants, generally represents the largest BSi pool in soil–plant systems, hence exerting the strongest influence on Si fluxes into soils (reviewed by Schaller et al., 2021). In agricultural soil–plant systems the recycling of phytogenic Si has been found to boost the biological Si feedback loop and to compensate for Si losses by crop harvest (Alexandre et al., 1997; Blecker et al., 2006; Cornelis et al., 2010; Yang et al., 2020; Li et al., 2020; Puppe et al., 2021).
For the majority of higher plants Si is considered a beneficial element, because various positive effects of Si accumulation in plants have been revealed, i.e. increased plant growth and resistance against abiotic and biotic stresses (e.g. Epstein, 2009; Ma and Yamaji, 2006; Puppe and Sommer, 2018). In this context, in particular grasses of the family Poaceae (or Gramineae) are known as strong Si accumulators (Hodson et al., 2005; Katz et al., 2021), and corresponding Si storage in aboveground vegetation, e.g. in the Great Plains or the tropical humid grass savanna, has been found to be an important driver in Si cycling (Blecker et al., 2006; Alexandre et al., 2011). Various studies have been performed to quantify Si stocks and fluxes in/from the above- and belowground plant biomass (e.g. Alexandre et al., 1997; Bartoli, 1983; Cornelis et al., 2010; Sommer et al., 2013; Turpault et al., 2018). Most of these studies were performed at (sequences of) small-scale plots (<102 m2) with intended low heterogeneity in soils and plant canopy composition. Often results were extrapolated to larger spatial units up to the global scale implicitly assuming similar environmental conditions (e.g. Carey and Fulweiler, 2012). However, the emergence of new technical features and increasing knowledge on details in Si cycling (e.g. the role of lateral fluxes) leads to a more complex picture at landscape and catchment scales. Dynamic and static soil properties change along the soil continuum and might influence not only the species composition of natural vegetation but also its biomass distribution and related Si stocks. In fact, changes in soil properties have been found to affect Si bioavailability in soils, leading to changes in plant Si concentrations (e.g. Li et al., 2019) with consequences for plant performance and ecosystem functioning (reviewed by Katz et al., 2021).
Remote sensing represents an efficient tool to provide spatially consistent information on environmental objects, conditions and properties. To identify different land covers or to assess biodiversity indicators, supervised classification techniques such as maximum likelihood (ML) have found wide acceptance (Fuller et al., 1998; Otukei et al., 2010; Shafri et al., 2007; Strecha et al., 2012; Gonzáles et al., 2015). A widespread method for the derivation of quantitative canopy properties is the use of vegetation indices (VIs) in combination with ground-based measurements (Thenkabail et al., 2002; Lelong et al., 2008; Zarco-Tejada et al., 2012). VIs are linear, orthogonal or ratio combinations of reflectance calculated from different wavelengths ranging from the visible (VIS) to the near-infrared (NIR) part of the electromagnetic spectrum (Bouman, 1992) and found to be appropriate proxies for temporal and spatial variation in vegetation canopies and biophysical parameters (Gao et al., 2000; Haboudane et al., 2004). In particular, the normalized difference vegetation index (NDVI), as the most commonly used VI, relates reflectance in red (sensitive to chlorophyll absorption) and near-infrared (sensitive to canopy and leaf structure) wavebands (Rouse, 1974). Numerous satellite-based studies applied VIs to quantify biophysical vegetation parameters of crops (Moran et al., 1995; Kross et al., 2015), grassland (Gammon et al., 1995; Wang et al., 2005), pristine or near-natural ecosystems (Cui et al., 2013; Kim et al., 2015). The recent development of unmanned aerial systems (UAS) offers new options for high-resolution observations at landscape and catchment scales.
Numerous missions have been conducted over hardly accessible areas or protected ecosystems such as wetlands (Strecha et al., 2012; Zweig et al., 2015), riparian zones of lakes and rivers (Husson et al., 2014, 2016), estuarine tidal flats (Kaneko and Nohara, 2014), riparian forests (Dunford et al., 2009), and Antarctic moss beds (Turner et al. 2014). Most of the studies delineated the patchy and small-scale distribution of plant communities and identified individual species by using off-the-shelf (partly modified) compact digital cameras providing an adequate sub-decimetre resolution in VIS and NIR spectral wavelengths. Successful preprocessing workflows were developed for UAS imagery as a prerequisite for accurate image interpretation (Laliberte et al., 2011; Berni et al., 2009; Kelcey and Lucieer, 2012; Lelong et al., 2008; Wehrhan et al., 2016). However, none of these studies addressed both the classification of species composition and the quantification of respective aboveground biomass fractions. To the best of our knowledge there has been no study published until now that finally quantifies aboveground plant Si accumulation and its spatial distribution using UAS remote sensing in a heterogeneous catchment and relates the spatial patterns to relevant soil properties.
In the current study, we apply UAS-based remote sensing to the grass-dominated, artificial catchment “Chicken Creek”. It represents an ideal study site for Si cycling at catchment scale for several reasons. Firstly, the vegetation dynamics and soil development have been intensively monitored ab initio (e.g. Elmer et al., 2013; Zaplata et al., 2011a, b). From this database the site-specific appearance and spread of two predominant Si accumulators, Calamagrostis epigejos and Phragmites australis (both belonging to the Poaceae family), can be derived, which allows an estimation of mean annual Si uptake rates.
Secondly, extensive soil data (repetitive sampling campaigns) are available at a 20 m×20 m grid (Gerwin et al., 2011). Potentially important drivers for the observed spatial patterns of plants, such as the soil texture and nutrients, can be withdrawn from these data. Thirdly, previous studies already clarified the BSi pool dynamics in soils at Chicken Creek during initial pedogenesis (Puppe et al., 2014, 2016, 2017, 2018). Here, we present a methodological approach to quantify the Si stocks of two Si accumulators (i.e. C. epigejos and P. australis) at catchment scale and their relationship to soil-related drivers. In detail we want to answer three major research questions:
- i.
How large are aboveground phytogenic Si stocks?
- ii.
To what extent are spatial patterns of C. epigejos and P. australis and corresponding Si stocks driven by initial soil properties?
- iii.
What are the benefits and limitations of UAS-based remote sensing of phytogenic Si stocks?
2.1 Study area
The artificial catchment “Chicken Creek” (6 ha in size, thereof 5.3 ha fenced) was constructed in an open-cast mining area of Lusatia, Germany (51.6049∘ N, 14.2667∘ E), in 2004–2005 (construction finished in September 2005). A 2–4 m thick, surficial layer of Quaternary sandy sediment was dumped on a 1–2 m pan-shaped layer of Tertiary clays, which seals the whole catchment at its base. In the lower part of the catchment, additional clay dams were constructed on top of the clay layer (transverse to the slope). These dams act as a stabilization barrier preventing the sandy substrate from sliding downhill and serve as a funnel to direct groundwater flow into the artificial pond downstream (Gerwin et al., 2010). Due to the artificial construction, the lower boundary conditions of the catchment site are clearly defined including knowledge about the 3D sediment structures (Gerke et al., 2013; Schneider et al., 2011). The construction work left a bare land surface on which natural vegetation could develop without disturbance (natural succession) but also created a zonal pattern of soil properties caused by the natural heterogeneity of the parent material taken from different areas in the fore-field according to the progression of the mine (Gerwin et al., 2009) (Fig. 1).
C. epigejos has been present since the very beginning and belonged to the most dominating species since 2010, especially in the western part of the catchment. P. australis has also been present from the beginning of vegetation development in 2006, but it was mainly restricted to the area around the pond in the southern part of the catchment (Elmer et al., 2011; Schaaf et al., 2010). The sub-continental climate is characterized by a mean annual precipitation of 563 mm and a mean annual temperature of 8.9 ∘C.
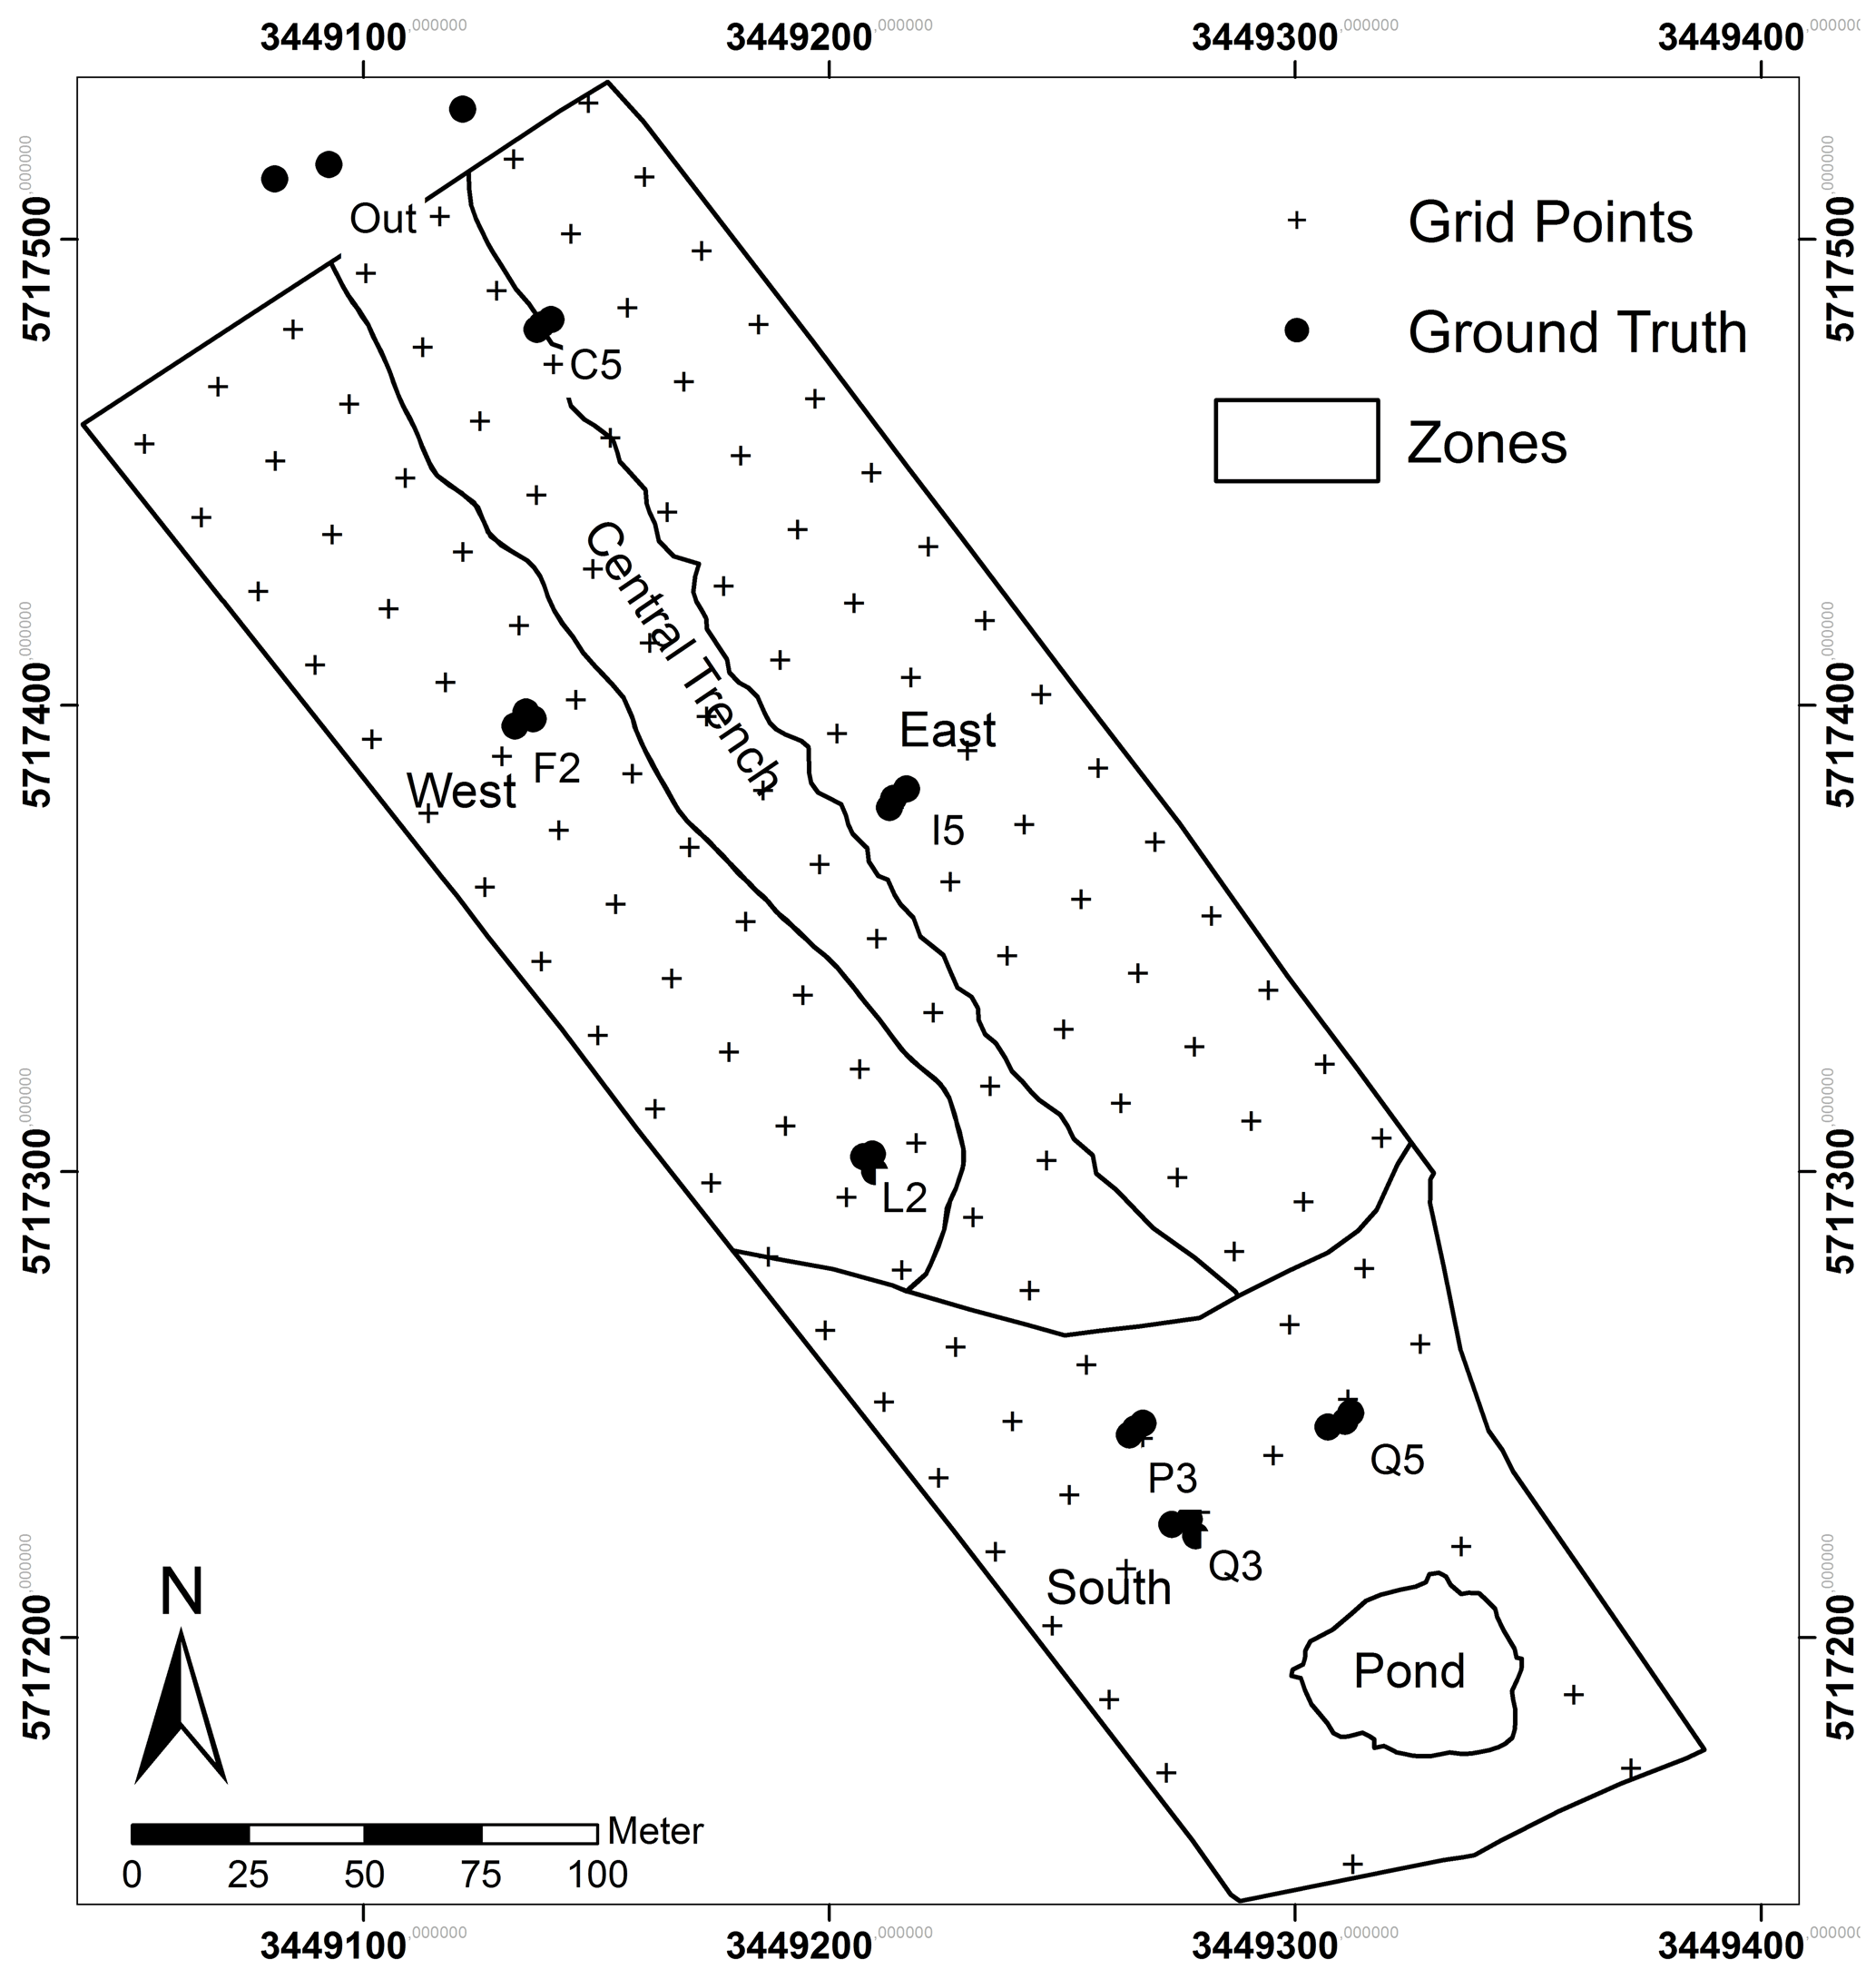
Figure 1Schematic map of the artificial catchment “Chicken Creek” showing grid points, ground truth sites and zones, delineating areas with slightly different soil properties.
2.2 Ground-based measurements
2.2.1 Aboveground biomass
Ground-based measurements were carried out on 22 August 2014, 1 d after the UAS mission. Shoot biomass (include stems, leaves and inflorescence) with a dominance of C. epigejos was sampled at sites C5, F2, I5 and L2, which represent raster points equipped for extensive soil moisture and temperature monitoring. Three additional sites (CA1 to CA3) were sampled outside of the fenced area to include sites of high population densities (Fig. 1). At each site plants were cut within an area of 50 cm×50 cm (0.25 m2) from three locations, which represent a (local) gradient of low, medium and high population densities. Analogously, three sites close to raster points P3, Q2 and Q5 with a dominant occurrence of P. australis were sampled. The dead, tufted biomass of C. epigejos and the brown shoots including the litter of P. australis were sampled separately within the same areas. This material of the preceding seasons is referred to as litter hereafter. A subset of the brown P. australis shoots have been retained for further analysis in order to find out whether the Si content is different from green shoots or not. All plant samples were oven-dried at 105 ∘C for 48 h to further determine the Si content.
2.2.2 Si analysis of plant material
An aliquot of 5 g from the dried plant material was used to determine the Si content. The collected plant material was carefully washed with distilled water to remove adhering soil particles and oven-dried at 45 ∘C. Subsequently the samples were milled using a knife mill (Grindomix GM 200, Retsch) in two steps: 4000 rpm for 1 min and then 10 000 rpm for 3 min. Sample aliquots of approximately 100 mg were digested under pressure in PFA digestion vessels using a mixture of 4mL distilled water, 5 mL nitric acid (65 %) and 1 mL hydrofluoric acid (40 %) at 190 ∘C using a microwave digestion system (Mars 6, CEM). A second digestion step was used to neutralize the hydrofluoric acid with 10 mL of a 4 % boric acid solution at 150 ∘C. Silicon was measured by ICP-OES (ICP-iCAP 6300 Duo, Thermo Fisher Scientific GmbH) with an internal standard. To avoid contamination, only plastic equipment was used during the complete procedure. Analyses were performed in three lab replicates.
2.2.3 Soil sampling and soil analysis
Soil sampling of the upper 30 cm was carried out subsequent to catchment completion in 2005 at 124 grid points in a 20 m×20 m grid (see Fig. 1). Soil samples were analysed for various physicochemical properties (for details see Gerwin et al., 2010). From these we used data of clay and nitrogen (N), which are known as important drivers for vegetation development at Chicken Creek (Elmer et al., 2013; Zaplata et al., 2011a, b). In addition, we analysed the plant-available potassium (K), phosphorus (P) and Si content in retained samples from 2005 to evaluate their effects on spatial patterns of C. epigejos and P. australis and corresponding aboveground phytogenic Si stocks.
The plant-available K and P were determined with the double-lactate method, which is used in Germany for the determination of plant-available potassium and phosphorus. The extraction solution comprises a 0.04 m calcium lactate solution buffered with 0.02 m hydrochloric acid at pH of 3.6 using a soil-to-solution ratio of 1:50 (VDLUFA, 1991). A total of 4 g of air-dried soil (<2 mm) was weighed into polyethylene laboratory bottles. Afterwards, 200 mL of extraction solution was added into those bottles and placed on a mechanical shaker for 90 min. After filtration, the phosphorus concentration was determined by colorimetry (Gallery Plus, Microgenics), and the potassium concentration was measured using flame atomic absorption spectroscopy (AAS-iCE 3300, Thermo Fisher). The reported values are in mg K or P per 100 g dry soil.
Plant-available Si (water-extractable Si; see Sauer et al., 2006) was determined as described in Puppe et al. (2017). In short, 10 g of dry soil (<2 mm) was weighed and put into 80 mL centrifuge tubes, and 50 mL distilled water was added into it with three drops of a 0.1 % NaN3 solution to prevent microbial activity. Total extraction time was 7 d. Twice a day tubes were gently shaken for 20 s by hand to prevent abrasion of mineral particles from colliding during constant (mechanical) shaking by using, e.g. a roll mixer. After extraction, solutions were centrifuged (4000 rpm, 20 min) and filtrated (0.45 µm polyamide membrane filters), and Si was measured via ICP–OES (ICP-iCAP 6300 DUO, Thermo Fisher Scientific Inc). Only plastic equipment was used during the complete extraction procedure to exclude any Si contamination. Analyses of water-extractable Si were performed at a minimum of two lab replicates per sample.
The alkaline extractant Tiron (C6H4Na2O8S2⋅H2O) was used for the detection of potential differences in the amorphous silica stocks (as a proxy of synthesized biogenic and pedogenic siliceous structures representing the main source for plant-available Si), although a partial dissolution of primary minerals is well known (Sauer et al., 2006). However, due to the fact that the suitability of the so-called DeMaster technique (which represents the de facto standard method) for quantification of amorphous biogenic Si has been recently questioned (Meunier et al., 2014; Li et al., 2019), we performed no time-course extraction using a short time extraction (1 h) for all samples. Based on the short extraction time of only 1 h, we excluded extensive extraction of mineral Si forms (see Kaczorek et al., 2019). The Tiron-extractable Si (SiTiron) was determined according to the method developed by Biermans and Baert (1977), modified by Kodama and Ross (1991). The extraction solution was produced by dilution of 31.42 g Tiron with 800 mL of distilled water, followed by addition of 100 mL sodium carbonate solution (5.3 g Na2CO3+100 mL distilled water) under constant stirring. The final pH of 10.5 was reached by adding small volumes of a 4 M NaOH solution. For the extraction, 30 mg of dry soil was weighed into 80 mL centrifuge tubes, and a 30 mL aliquot of the Tiron solution was added into it. The tubes were then heated at 80 ∘C in a water bath for 1 h. The extracted solutions were centrifuged at 4000 rpm for 30 min and filtrated (0.45 µm polyamide membrane filters, Whatman NL 17), and Si concentrations were measured by ICP-OES. To avoid contamination, only plastic equipment was used during the complete procedure. Analyses of Tiron-extractable Si were performed in three lab replicates per sample.

Figure 2Unmanned aerial system (UAS) Carolo P360 with multi-camera array Mini-MCA 12 (visible lenses at the underside of the camera).
2.3 UAS remote sensing
We used a fixed-wing UAS Carolo P360 (Fig. 2) with a wingspan of 3.6 m and a take-off weight of 22.5 kg. The UAS is equipped with a 12-band multi-camera array Mini-MCA 12 (MCA hereafter) (Tetracam Inc., CA, USA). The 12 narrow-band filters (between 10 and 40 nm bandwidth) cover the spectral range from visible to near-infrared wavelengths with focus on the characteristic reflectance features of healthy vegetation (chlorophyll absorption band around 660 nm, the red-edge region between 680 and 750 nm) and one of the water absorption bands around 950 nm. Hereafter, bands are denoted according to their respective centre wavelength in nanometres (e.g. b713 for the red-edge band).
The UAS mission was conducted during the flowering period of C. epigejos on 21 August 2014 under acceptable flight conditions (moderate wind speed and little cloud shadow). A small negligible area was covered in the southeast part with no or little occurrence of C. epigejos and P. australis. At this time, the foliage is medium green and the large inflorescences are clearly visible. This facilitates the (i) spatial delineation and (ii) spectral distinction between C. epigejos populations and dozens of other existing grass-like species. Due to camera specifications a unique flight altitude of 163 m above ground is required to achieve the desired ultrahigh ground sampling distance (GSD) of ∼0.1 m. Details about UAS, camera specifications and mission settings are presented in Appendix A1. The post-processing chain including radiometric corrections, mosaicking and geo-referencing is described in more detail in Appendix A2.
2.4 Image classification
A supervised ML classification was applied to identify individual dominant plant species or communities. The ML classifier requires a proper selected set of training areas for all objects visible in the image. For this purpose we used field inspections and available botanical mappings at grid points (data provided by Markus Zaplata, personal communication, 2016). Details regarding conditions and constraints of the ML classifier are given in Appendix B1.
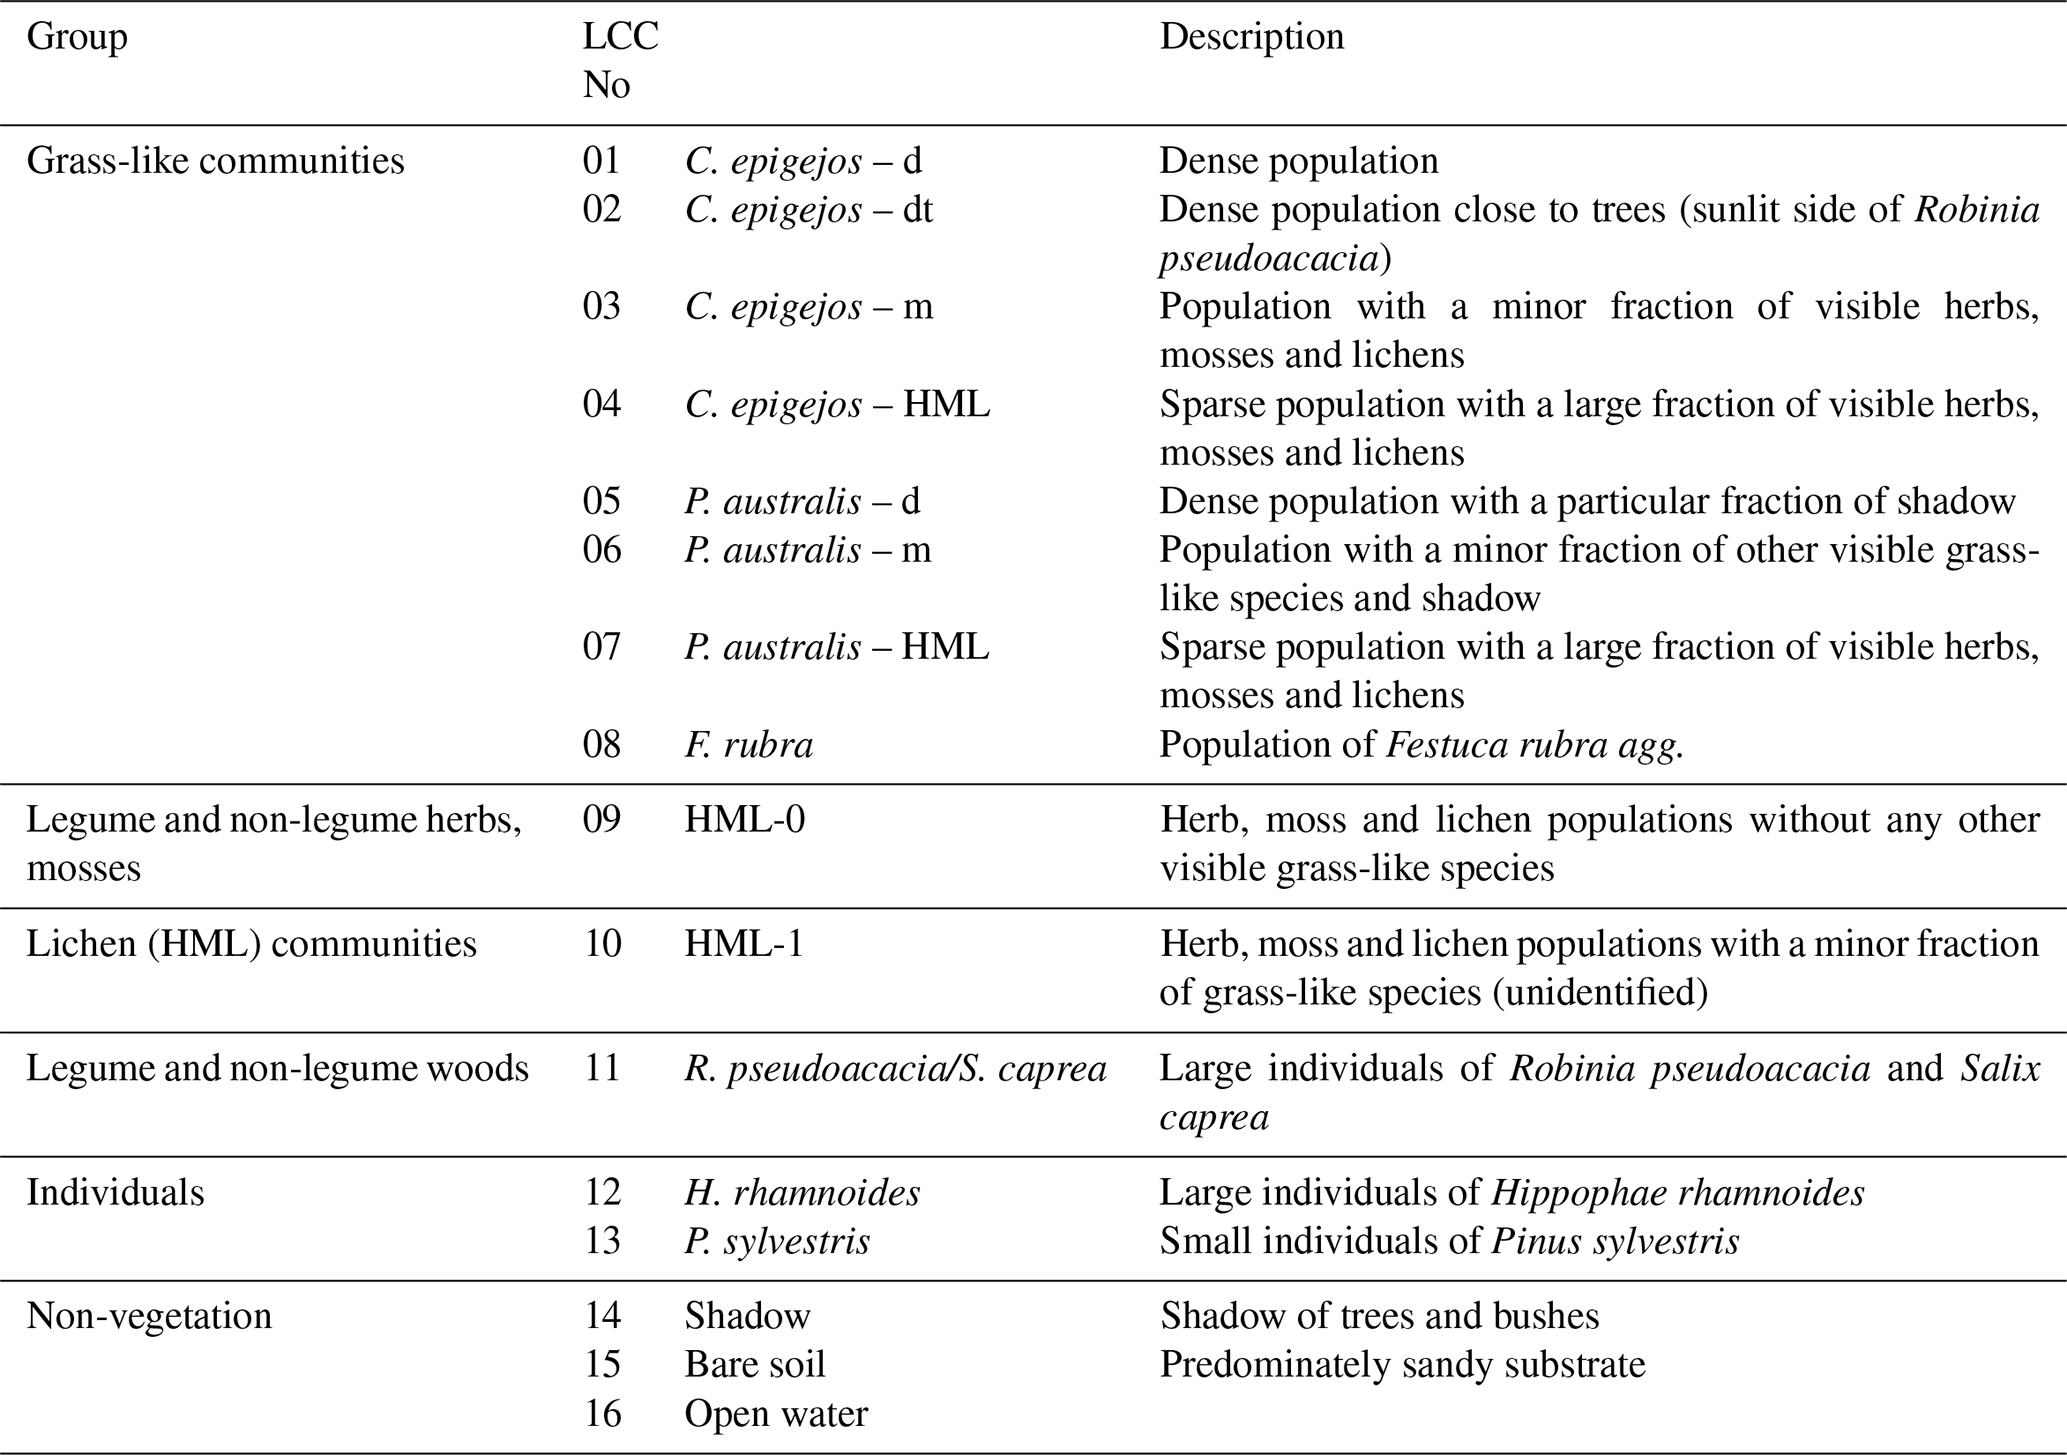
Finally 16 relevant land cover classes (LCCs) were defined including three classes of non-vegetation (shadow, bare soil, open water) and four classes of legume and non-legume woods (Table 1). The statistical separability of the LCC signatures was computed before each classification run. Divergence, an often used separability measure in remote sensing, is computed using the mean and variance–covariance matrices of the pixel values representing the training area. The Jeffries–Matusita (J–M) distance (Kavzoglu and Mather, 2000), the divergence measure used in this study, was computed for all possible LCC pairs. A computed value of zero indicates that classes are inseparable, and a value of 1414 means total separability (Swain and Davis, 1978).
2.5 Calculation of the normalized difference vegetation index (NDVI)
The NDVI is an intrinsic vegetation index that simply accounts for the chlorophyll absorption feature in red (R) and the structural information inherent in high NIR reflectance of a green vegetation canopy. It does not involve any external factor other than the measured spectral information and was calculated by
where NIR and R are the reflectance in the near-infrared and red bands. Since radiometric calibration was renounced in this study, NIR and R refer to DNs instead of at-surface reflectance. In order to investigate the potential of the available bands in the red edge (RE, the steep incline between VIS and NIR reflectance typically for green vegetation) and NIR domain, five variations of the NDVI were calculated. The four NIR bands correspond to b831, b861, b899 and b953. In the case of the RE band b713, NIR has to be substituted by RE in Eq. (1).
Coefficients of determination (R2) were calculated for the relationships between the examined VIs and the ground-measured fresh shoot biomass of C. epigejos and P. australis as individual species and for the pooled dataset consisting of all measures. Since the fresh litter accumulated during the preceding seasons was covered by the tall-growing C. epigejos and P. australis and therefore cannot be estimated directly, R2 values were calculated analogously for the sum of the fresh shoot biomass and litter. The latter was done in order to find out whether correlations between calculated VIs and fresh shoot biomass and between VIs and fresh shoot biomass including the litter can be used for an indirect estimation of fresh litter.
Table 1List of the 16 relevant land cover classes (LCC) as predefined for classification on the basis of field survey and botanical mappings.
2.6 Statistical analysis
Correlations were analysed using Spearman's rank correlation (rs, monotonic relationships) and Pearson's correlation (r, linear relationships). Significance between independent samples was tested with the Kruskal–Wallis analysis of variance (ANOVA) followed by multiple pairwise comparisons (Dunn's post hoc test). Statistical analyses were performed using the software package SPSS Statistics (version 22.0.0.0, IBM Corp.).

Figure 3Mean signatures of classified LCCs other than C. epigejos and P. australis (a) and respective signatures of C. epigejos and P. australis classes (b). Note the different scaling of the y axes.
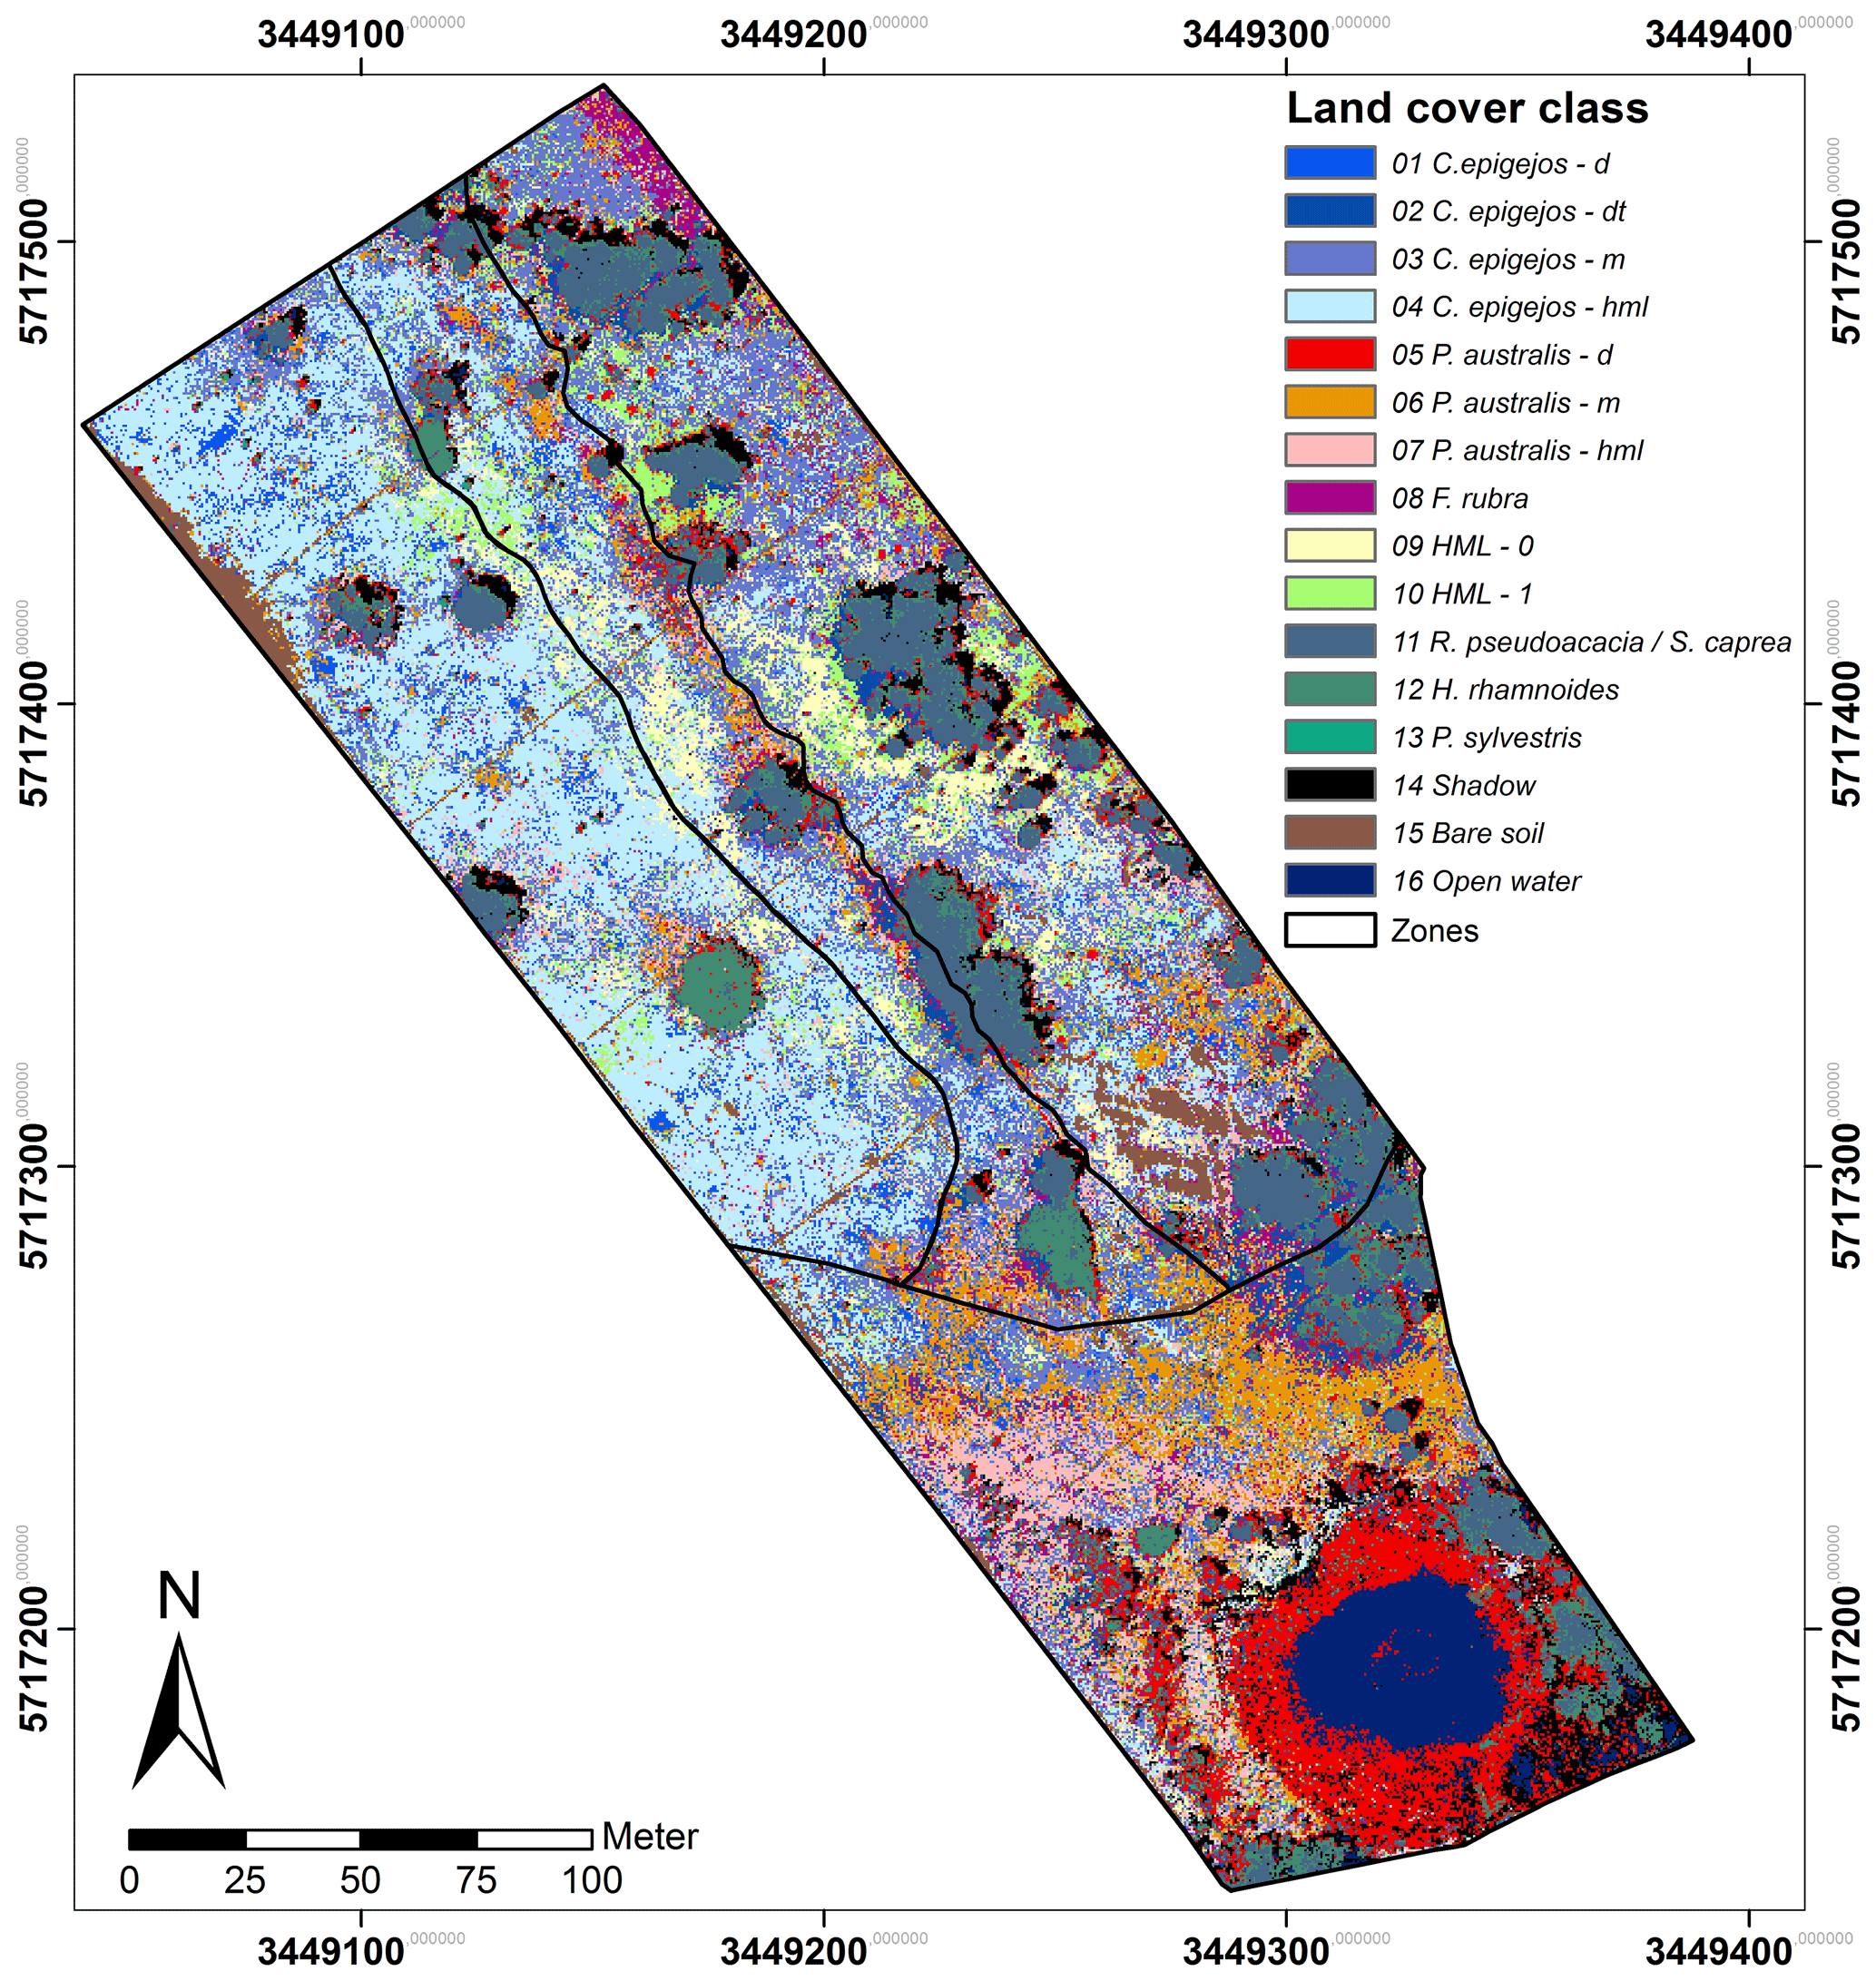
Table 2Mean, standard deviation (SD), min, max and coefficient of variation (CV) calculated for fresh and dry biomass samples of C. epigejos and P. australis. All units in [g m−2].

3.1 Image classification
The computed J–M distance for the 120 LCC pairs showed an average of 1386 and a minimum of 1142. While the signatures of 79 LCCs were almost totally separable (J–M distance ≥1410), a fair separability existed for 32 LCC pairs (J–M distance ≥1248). Values below 1249 were computed for nine LCC pairs, indicating a poor separability.
Figure 3 depicts the mean signatures of the 16 LCCs. In Fig. 3a all LCCs other than those classified as C. epigejos or P. australis (8 to 16) revealed large differences and could thus be clearly distinguished. While open water and shadow showed the lowest DNs over all spectral bands, the highest DNs in the visible range were characteristic for sandy soil (Stoner and Baumgardner, 1981). Regardless of the use of DNs instead of reflectance, the signatures of trees and bushes showed the characteristic features of green vegetation. With decreasing chlorophyll content and population densities of photosynthetically active species (here F. rubra) and a simultaneously increasing fraction of shadow, cryptogam species and dead plant material (LCCs 9 and 10), DNs showed a more or less monotonous increase in DNs from the VIS to the NIR wavelength domain. The signatures of LCCs 1 to 7 are depicted in Fig. 3b. The signature of the dense P. australis population (LCC 5) exhibited a shape similar to the signatures of trees and bushes, but DNs were lower in the NIR domain influenced by a higher fraction of shadow visible to the sensor. All other signatures appeared similar regarding the general shape (monotonous increase), but the separability was fairly high for most of them caused by the lower overall reflectance and the flatter slope of the signature with an increasing fraction of visible non-photosynthetic material and shadow. Amongst the 10 pairs showing poor separability, four pairs comprised LCCs describing transitional states within the same species (e.g. P. australis; LCC 6 and LCC 7) or could not clearly distinguish between C. epigejos and P. australis. The first case was uncritical as the respective LCCs were treated as one LCC in further analysis. The second case could not be avoided due to co-occurrence within the same area of interest. However, resulting misclassifications were negligible with respect to the small differences of Si content observed for both species.
Constraints had to be accepted regarding the poor separability between F. rubra (LCC 8), C. epigejos (LCC 2) and P. australis (LCC 6 and 7). Although mean signatures indicated fair separability at least in the NIR domain, class variances were large and diminished the separability.
3.2 Spatial coverage and zonal distribution of land cover classes
C. epigejos (40 %) and P. australis (22 %) cover most of the area followed by trees, bushes and the respective shadow with a spatial coverage of 19 %. Legume and non-legume herbs, mosses and lichens without or with a minor fraction of grass-like species cover 4.5 % and 4.8 % respectively. The remaining area was classified as F. rubra (LCC 8; 3.5 %), open water (3.1 %) and bare soil (2.6 %). The spatial coverage of each of the 16 LCCs is depicted in Fig. 4.
The Si accumulators C. epigejos and P. australis showed a clear zonal distribution. C. epigejos was widespread in the northern zones of the catchment. Populations with high density (LCC 1 and 2) occurred regularly near the sunlit side of R. pseudoacacia (LCC 2). In reality, the populations were distributed more circularly around the trees, but the shaded side prevented classification during image acquisition. Other high-density populations (LCC 1) were predominately spread as smaller patches in the western zone. A clear zonal distinction could be observed for the two C. epigejos classes dominating the northern zones. The sparse populations (LCC 4) with a spatial coverage of 19 % occurred in the western zone and the central trench. LCC 3 as the second largest class (15 %) was widespread in the eastern zone and the central trench but spatially separated by trees, bushes and larger patches of other LCCs (HML 0 and 1, bare soil). P. australis mainly occurred in the southern zone of the catchment with a dense population concentrated around the artificial pond. A narrow band ran from the northwest to the southeast along the central trench. The less dense and the sparse populations (LCCs 6 and 7) occurred in a band-like pattern running in the west–east direction. The zonal pattern reflected mainly wetter areas, i.e. the pond's fringe or sites where lateral groundwater flow approached the surface (return flow). The narrow NW–SE band marked the edge of an erosion gully along the central trench, and the W–E band matched the belowground clay dams, where groundwater flow was forced towards the land surface.
3.3 Ground-based measurements of above ground biomass of C. epigejos and P. australis
With the exception of the separately sampled litter, the variation in fresh shoot biomass was larger than the respective variation at P. australis sites (Table 2). The lowest amount was sampled at plot I5-2 with 126 g m−2. In contrast, amounts at plot CA-1 were 8 times higher (1018 g m−2). Since the sampled litter was predominately dead material, differences between fresh and dry samples were naturally small. However, the overall variance was similar to that of fresh and dry shoot biomass but it should be noted that no correlation existed between the two quantities. High amounts of litter were sampled at plots with low and high shoot biomass (e.g. I5-2 and CA-2 respectively). The variation between the three plots at one site reflected the small-scale variability of the island-like populations of C. epigejos with decreasing shoot biomass from the centre to the margins. While amounts at L2-3 (centre) were 1.5 times higher than at L2-2 (margin), the factor increased to almost 3 between plots I5-3 and I5-2. The separately sampled litter varied within a range between 14 g m−2 (L2-1) and 126 g m−2 (I5-3).
Since there was no access to the dense P. australis population in the surroundings of the pond, the highest and lowest amounts of fresh and dry shoot biomass were collected at site Q5. The small-scale variability in fresh green shoot biomass (factor of 4.9) was even higher compared with C. epigejos. The fresh and dry samples of litter showed a high variance indicated by a CV of 74 % between plots. Again, the lowest and highest amounts were sampled at site Q5 with fresh weights of 57 g m−2 at Q5-2 and 646 g m−2 at Q5-1.
Table 3R2, RMSE and MRE for relationships between examined NDVIs and aboveground biomass of C. epigejos and P. australis.
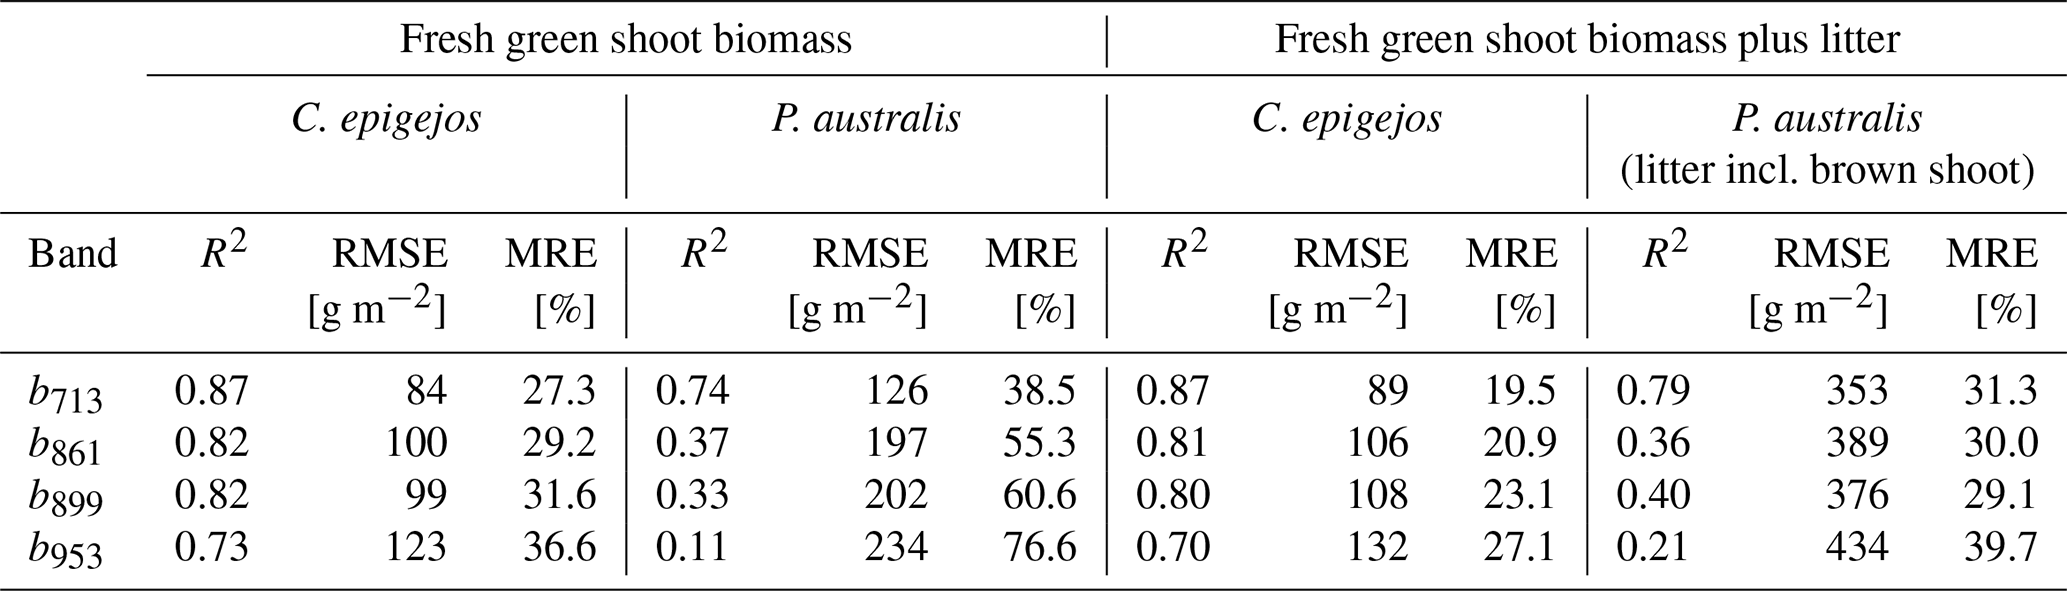
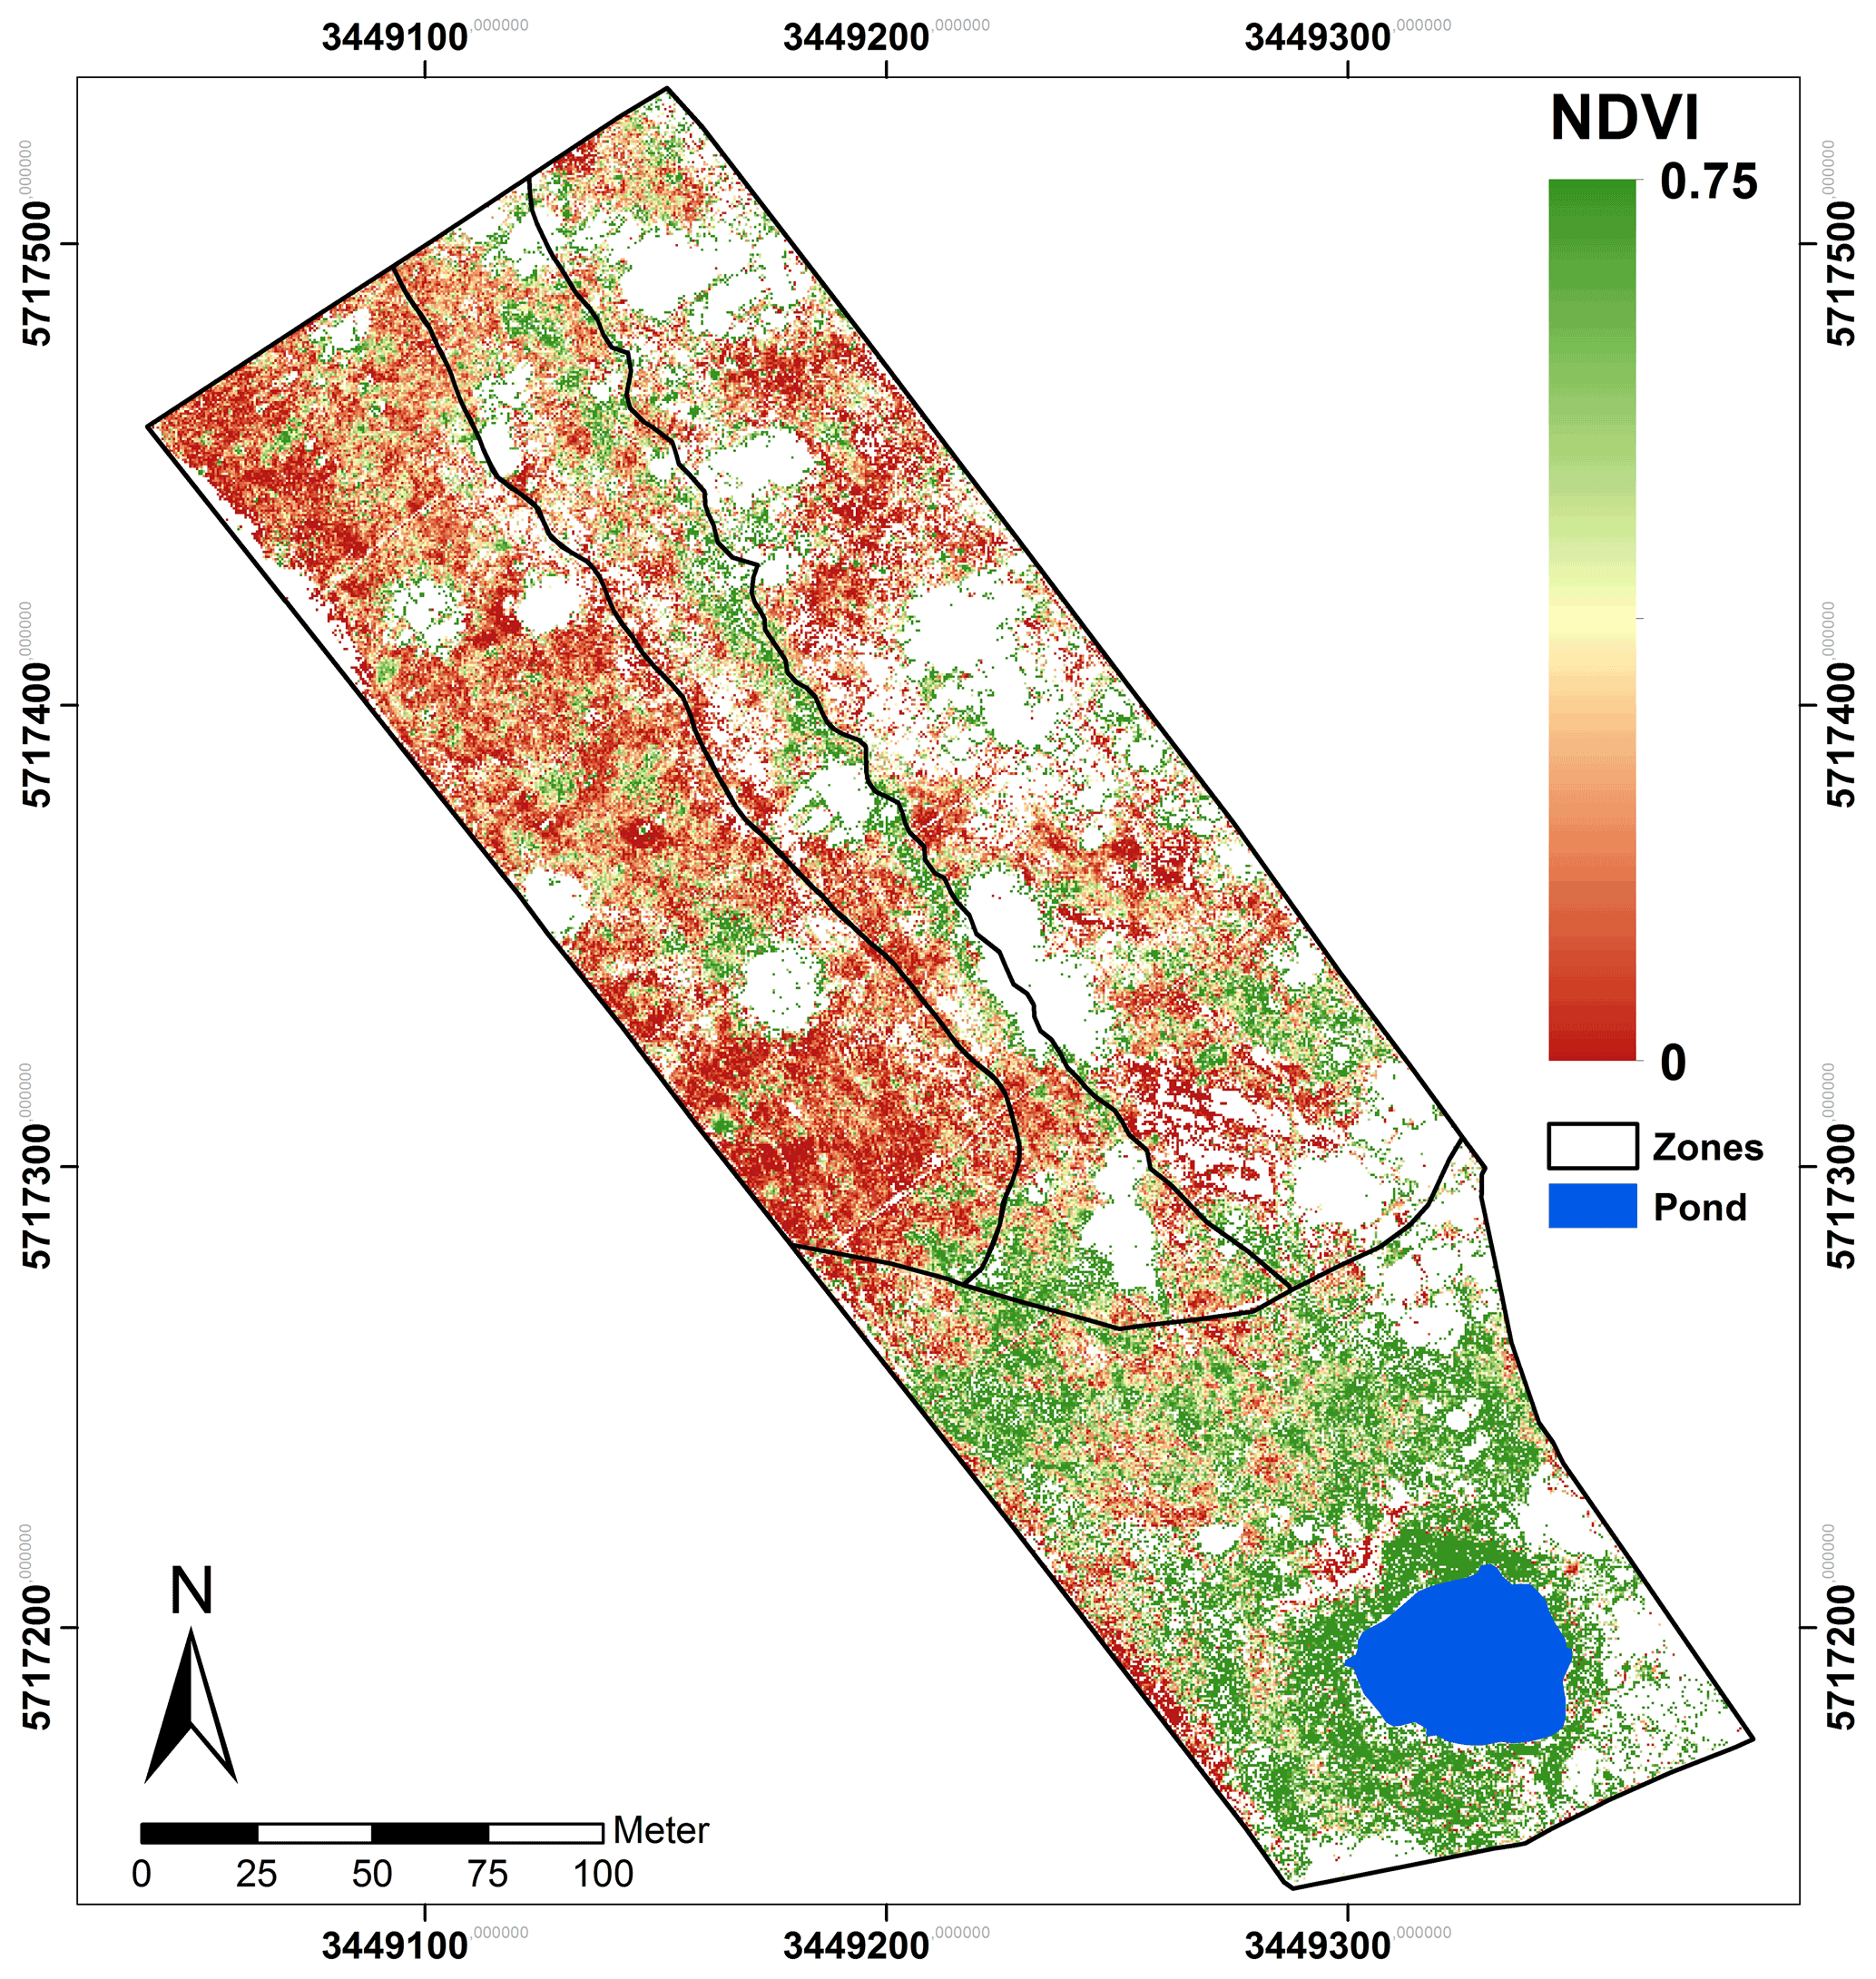
Figure 5NDVIb713 calculated from Eq. (1) using the red edge band. The area corresponds with the classified spread of C. epigejos (LCCs 1–4) and P. australis (LCCs 5–7).
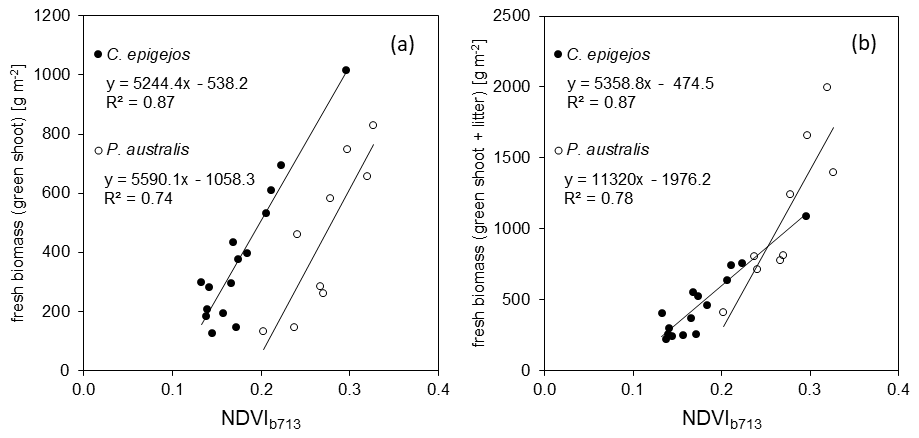
Figure 6Response of NDVIb713 to fresh green shoot biomass (a) and the sum of fresh green shoot biomass and litter (b) of C. epigejos and P. australis.
3.4 VI performance
All relationships calculated for the combinations between NDVIs and ground-measured biomass showed a positive linear trend. The low NDVI values, ranging between 0.08 (C. epigejos; L2-2; NDVIb891) and 0.41 (P. australis; P3-2; NDVIb856) indicated no saturation effects. The respective R2, root-mean-square errors (RMSEs) [g m−2] and mean relative errors (MREs) [%] for the examined relationships are summarized in Table 3.
Regarding the band combinations, the NDVI using the RE b713 (Fig. 5) was found to be the best predictor for both species as well as for fresh green shoot biomass (Fig. 6a) and for the sum of fresh green shoot biomass and fresh litter (Fig. 6b). In both cases high R2 values could be observed for C. epigejos (R2=0.87) and P. australis (R2=0.74 and R2=0.78 respectively). While the other band combinations performed well for C. epigejos, the predictive power decreased significantly for P. australis (R2 range between 0.40 and 0.11). VIs of P. australis showed higher values at the same fresh green biomass amounts and generally a larger scatter of values than C. epigejos. This effect was related to the different plant architecture of the two species. The combination of broader green leaves and larger but less individual plants of P. australis led to higher VIs representing the same biomass. On the other hand, the number of pixels affected by shadow with decreasing population densities increased the scatter of VI values.
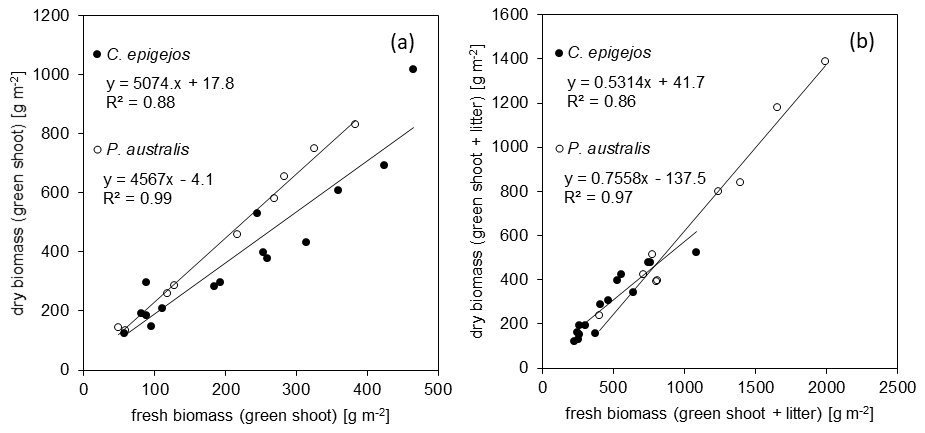
Figure 7Correlation between fresh and dry green shoot biomass (a) and the respective biomass including litter (b) for C. epigejos and P. australis.
Table 4Mean Si content of biomass fractions of C. epigejos and P. australis and respective Si stocks calculated from the areal coverage derived from ML classification.
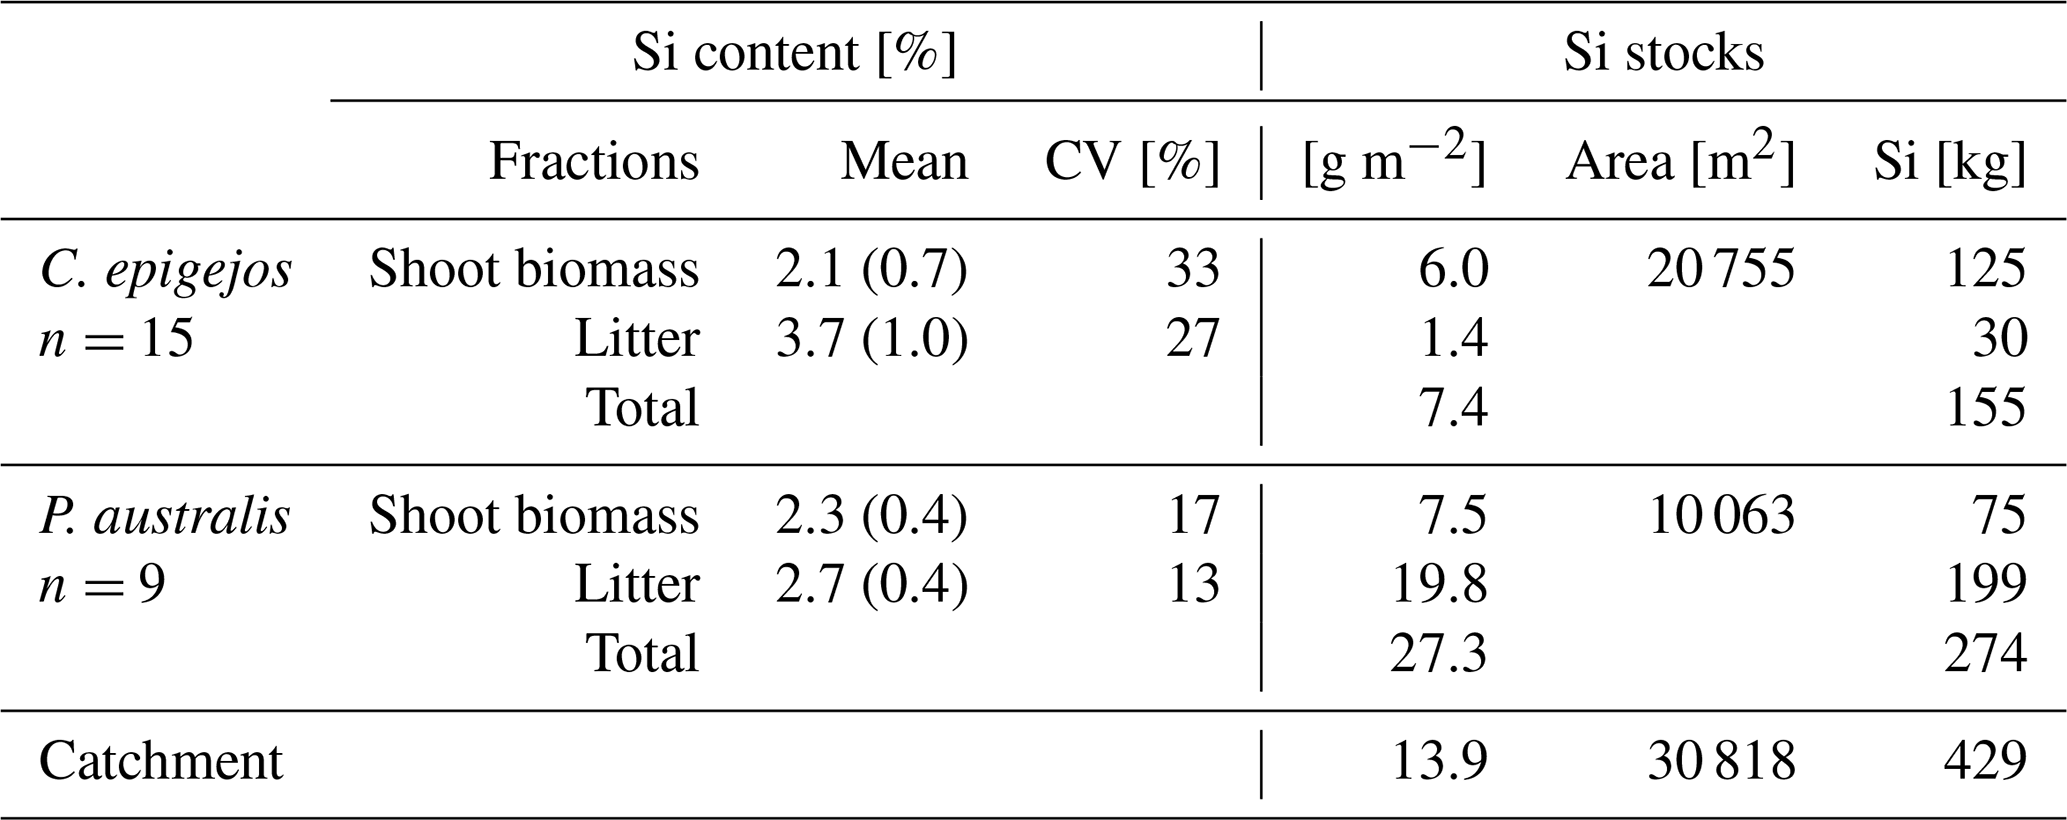
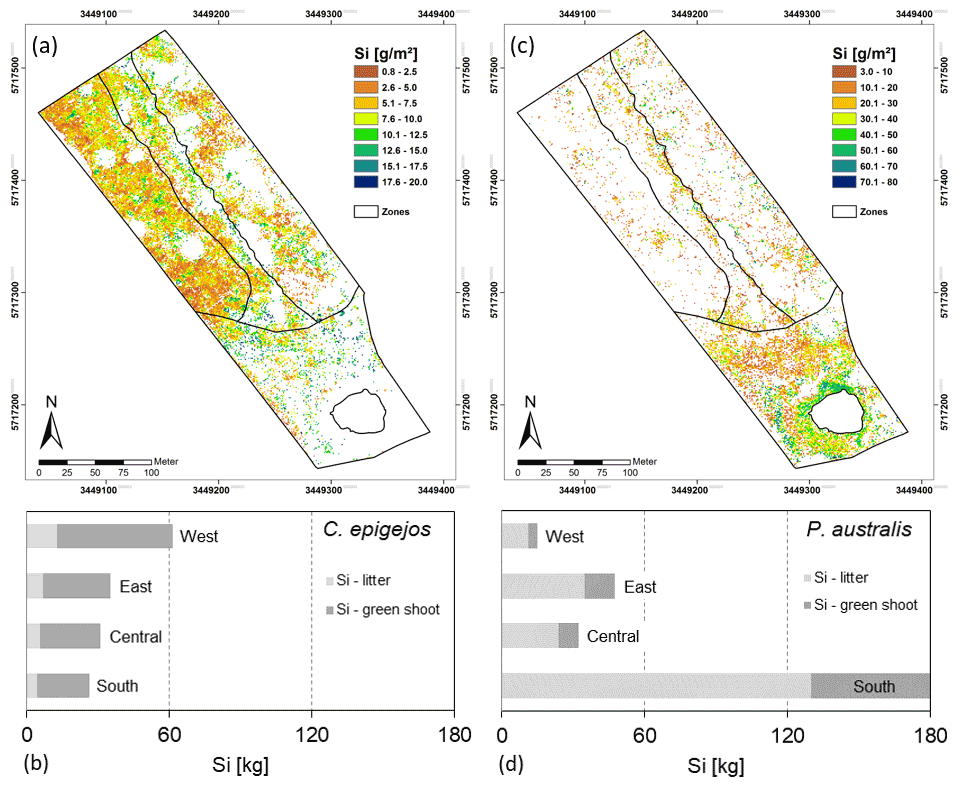
Figure 8Spatial distribution of Si stocks of C. epigejos (a) and P. australis (c) and total amounts of Si accumulated in the four zones by C. epigejos (b) and P. australis (d). Note the different legend scales in (a) and (c).
3.5 Estimation of dry biomass fractions
Taking into account the results of Sect. 3.3, dry green shoots and the sum of dry green shoots and litter were calculated separately for each species. The quantities were highly correlated, with R2 values of 0.88 and 0.86 for C. epigejos and 0.99 and 0.97 for P. australis. The respective linear regressions (Fig. 7a and b) were used to model their spatial distribution in a first step. In a second step, the modelled amounts of dry green shoots were subtracted from the modelled sum of dry green shoots and litter to yield the spatial distribution of dry litter.
3.6 Silicon content and stocks of C. epigejos and P. australis
The mean Si content within dry litter of C. epigejos (3.7 %) was 1.8 times higher than the Si content in the dry shoot biomass of the current year (2.1 %). The effect was less pronounced for the three analysed fractions of P. australis (Table 4). The Si content ranged between 3.0 % (dry litter without dry brown shoot biomass), 2.5 % (dry brown shoot biomass) and 2.3 % (dry green shoot biomass). As we regarded the sum of the first two fractions as litter, the mean of both contents (2.7 %) was used for further calculations. The mean fairly represented real conditions since both fractions, on average, contributed to the sum in equal amounts. Finally, the respective Si content was used to calculate the Si stocks in both fractions of C. epigejos and P. australis. The areas given in Table 4 equal the summed areal coverage of the classified LCCs 1–4 (C. epigejos) and 5–7 (P. australis). The total Si stock (sum of green shoot biomass and litter) accumulated in P. australis contributed to 64 % (275 kg) to the total Si stock calculated for the whole catchment (429 kg) despite the fact that the areal coverage was almost half that of C. epigejos.
This was simply caused by the fact that P. australis formed more dry biomass per unit ground area than C. epigejos (factor of 2.3 on average). The spatial distribution of total Si stocks calculated on the basis of the real areal coverage of both species is depicted in Fig. 8a and c. According the higher biomass production, Si stocks of P. australis reached a maximum (98 g m−2) in the fringe around the pond. The majority between 3 and 60 g Si m−2 occurred in the southern zone and in a narrow band along erosion gullies in the central trench.
With the exception of a few patches in the southern zone, the vast majority of values did not exceed 17 g m−2 in the case of C. epigejos. It is noticeable that the southern zone showed a clear two-parted internal zonation. The northern part was a type of a transition zone showing a co-occurrence of both species with high Si accumulation in C. epigejos, whereas the southern part was dominated by P. australis in the surroundings of the pond. This indicated that the spatial pattern was caused by soil moisture conditions rather than the initial spatial differences in soil properties induced by construction work and explained the relatively low zonal contribution of 17 % (26 kg) to the total Si stock of 154 kg (Fig. 8b).
Regardless of the accumulated Si in the southern zone and the central trench, the clear distinction between the eastern and western zone was striking. While the western zone contributed to 40 % (62 kg), only 23 % (35 kg) was accumulated in the eastern zone. Values corresponded to mean Si stocks of 4.0 and 2.3 g m−2 respectively.
Figure 8d shows the Si stocks accumulated in P. australis calculated for each of the four zones. While the southern zone contributed 66 % (180 kg Si) to the total amount, Si stocks in northern zones played a minor role. Mean Si stocks reached 12.2 g Si m−2 in the southern zone but significantly lower values in the eastern (3.1 g Si m−2) and western (1.0 g Si m−2) zones. Although mean Si stocks in the central trench were similar to those in the eastern zone (3.6 g Si m−2), the occurrence of P. australis tended to be more linear along the main gully. Regarding habitat requirements of P. australis, the occurrence was a result of higher soil moisture conditions in this area and the partially wet and flooded sites around the pond.
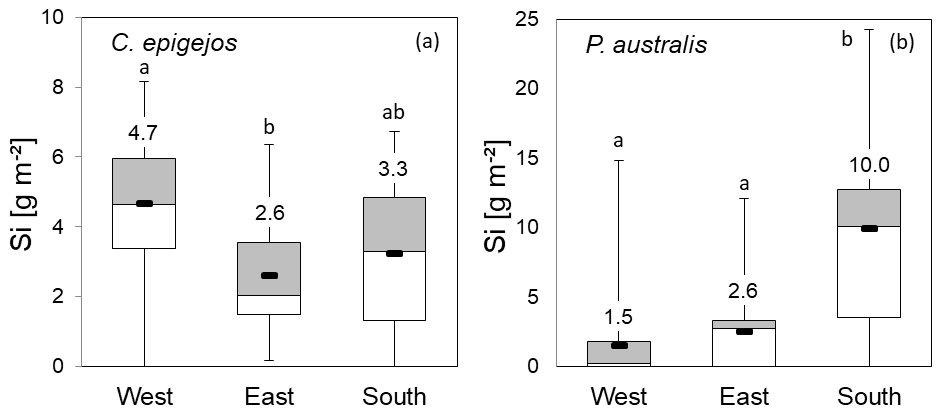
Figure 9Si stocks of C. epigejos (a) and P. australis (b) at grid points in the western, eastern and southern zones. Numbers represent zonal means (box plots: mean, upper and lower quartiles; minimum; and maximum). The letters “a” and “b” indicate statistical significance of differences between zones according to Kruskal–Wallis ANOVA (p<0.05). Note the different scaling of the y axes.
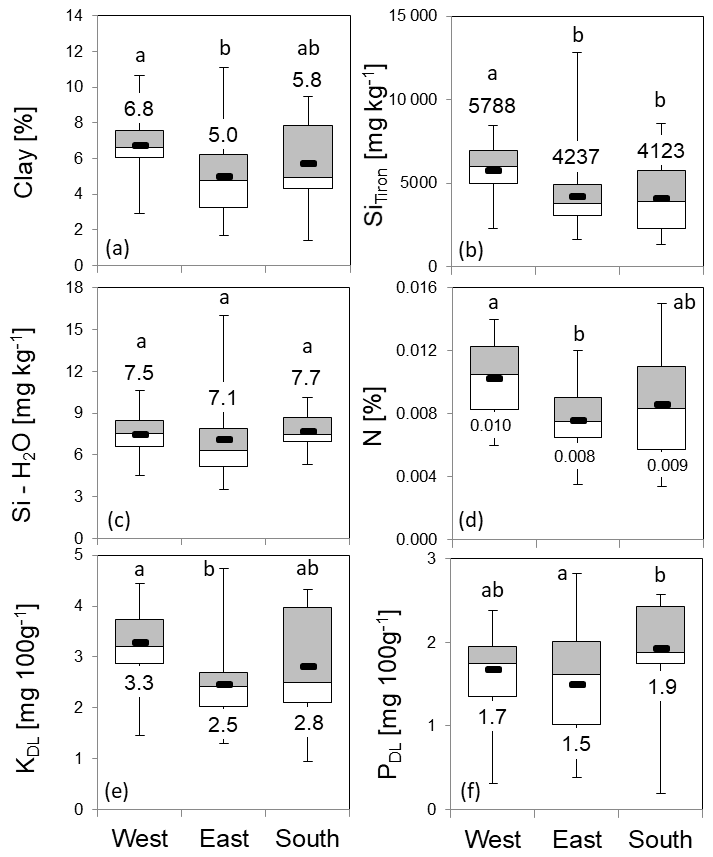
Figure 10Soil properties and nutrients at grid points in the western, eastern and southern zones (box plots: mean, upper and lower quartiles; minimum; and maximum). Figures depict the distribution of clay content (a), Tiron-extractable amorphous Si (SiTiron) (b), water-soluble Si (Si – H2O) (c), nitrogen (d), potassium (e) and phosphorus (f). Numbers represent zonal means. The letters “a” and “b” indicate statistical significance of differences between zones according to Kruskal–Wallis ANOVA (p<0.05).
3.7 Relationship between Si stocks of C. epigejos, P. australis and site properties
From a total of 124 grid points, we excluded all locations in the central trench due to disturbances in soil properties and related nutrient availability caused by water erosion compared to the initial conditions in 2005. Moreover, we excluded several grid points within the remaining zones located below trees and bushes without any classified occurrence of C. epigejos and P. australis. Finally, Si stocks and site properties of 35 grid points located in the western zone, 32 in the eastern zone and 18 in the southern zone were used for statistical analysis. Mean Si stocks were extracted from a squared area of 25 m2 around each grid point.
Compared to the zonal means of 4.0, 2.3 and 1.8 g m−2 for C. epigejos, the Si stocks extracted at grid points increased to 4.7 g m−2 in the western zone, 2.6 g m−2 in the eastern zone and 3.3 g m−2 in the southern zone (Fig. 9a). However, the ratios of 0.9 for the western and eastern zones indicated an adequate representation of the grid points for both zones. The large difference in the southern zone was mainly caused by the two-parted zonation with almost no occurrence of C. epigejos in more than half of the southern zone area. Zonal Si stocks accumulated in P. australis in the western, eastern and southern zones (1.0, 3.1 and 12.2 g m−2) were sufficiently represented by grid points in all zones (1.5, 2.6 and 10.0 g m−2) (Fig. 9b). According to Kruskal–Wallis ANOVA (p<0.05), differences in mean Si stocks were statistically significant between the western and eastern zones for C. epigejos and between the southern zone and the other two zones for P. australis. Among the examined soil properties, means of clay content (Fig. 10a) showed a corresponding trend with respect to Si accumulation in dry biomass of C. epigejos for all three zones including the significant difference between the western and eastern zones (rs=0.385, p=0.001).
Significant differences were found for SiTiron (Fig. 10b) between the western and eastern zones, whereas values in the southern zone did not differ very much from those in the eastern zone (rs=0.416, p<0.001). The water-soluble Si (Fig. 10c) could be ruled out as a driving factor since there was no differentiation between means over all zones (rs=0.004, p=0.971). The zonal distribution of the most important nutrients drew a similar picture. Highly significant differences of means between the western and eastern zones were found for nitrogen (Fig. 10d) and potassium (Fig. 10e). For both nutrients, slightly higher values compared to the eastern zone could be observed for the southern zone, which is in accordance with higher Si stocks (N: rs=0.412, p<0.001; KDL: rs=0.419, p<0.001). It can be concluded that PDL is not a driving factor for the spatial spread of C. epigejos populations at Chicken Creek, since availability was more or less equal in all three zones (Fig. 10f) (, p=0.871).
As stated before, the occurrence of P. australis was governed mainly by soil moisture conditions. Therefore neither examined soil properties nor nutrient availability showed a recognizable impact on the spatial spread along zones. No significant correlations between Si stocks of P. australis and soil properties were detectable with the exception of SiTiron (, p=0.007).
4.1 Aboveground phytogenic Si stocks at Chicken Creek
Mean aboveground Si stocks of P. australis and C. epigejos are surprisingly high and are comparable to or markedly exceed reported values for the Si storage in aboveground vegetation, e.g. in the Great Plains (short grass steppe and tall grass prairie, 2.2 to 6.7 g Si m−2; Blecker et al., 2006), the tropical humid grass savanna (tall grass Loudetia simplex, 3.3 g Si m−2; Alexandre et al., 2011) or forested biogeosystems (beech forest: 8.3 g Si m−2, Sommer et al., 2013; beech–fir forest: 18 g Si m−2, pine forest: 9 g Si m−2, Bartoli, 1983). Maxima of Si stocks at Chicken Creek reach values (up to 98 g Si m−2) that are comparable to the Si storage in wetlands (50 to 100 g Si m−2; Struyf and Conley, 2009). Due to the fact that the Si content of C. epigejos and P. australis is in line with published values for grasses in general (Hodson et al., 2005), we conclude the observed Si stocks to be predominantly driven by the (high) biomasses of both plants. If we assume a more or less steady annual Si accumulation in C. epigejos for 5 years (C. epigejos has become one of the most dominating plant species since 2010; Zaplata et al., 2011b), the mean Si accumulation in the aboveground biomass of C. epigejos amounted to about 6.0 . If we further assume a similar time span for the Si accumulation in P. australis, the mean Si accumulation in the aboveground biomass of P. australis amounted to about 7.5 g Si m−2 per year. Thus, annual Si fixation in C. epigejos and P. australis at Chicken Creek exceeds published data on annual biosilicification rates of temperate forest biogeosystems (beech forest: 3.5 , Sommer et al., 2013; beech–fir forest: 2.6 , pine forest: 0.8 g Si , Bartoli, 1983; Douglas fir forest: 3.1 , Norway spruce forest: 4.4 , black pine forest: 0.2 , European beech forest: 2.3 g Si , oak forest: 1.9 , Cornelis et al., 2010).
In light of potential aboveground biomasses of, e.g., C. epigejos (up to about 700 g m−2; Rebele and Lehmann, 2001), our results emphasize the significance of grasses for Si cycling in general. In this context, eutrophication is one of the most important drivers of the increased abundance of C. epigejos in many regions of central Europe, especially eastern Germany, Poland and the Czech Republic (Rebele and Lehmann, 2001), while on the other hand eutrophication might also be one of the drivers of the decline of P. australis in numerous European wetlands since the 1950s (van der Putten, 1997).
Considering the net primary production of the major biome types worldwide and the average amounts of Si fixed in the corresponding vegetation, the significance of grasses for Si cycling becomes much clearer: tropical woodland and savanna, temperate steppe, tundra, wetland and cultivated land belong to the biome types where Si is actively accumulated and vegetation is widely dominated by grasses (Carey and Fulweiler, 2012). Humans directly affect the distribution and size of these biomes and thus influence corresponding Si cycling through intensified land use and management change in forestry and agriculture (Struyf et al., 2010; Vandevenne et al., 2015a, b). Si exports through harvested crops generally lead to a Si loss in agriculturally used soils (anthropogenic desilication) (Desplanques et al., 2006; Guntzer et al., 2012; Keller et al., 2012; Meunier et al., 2008; Vandevenne et al., 2012). These losses can be compensated for by, e.g., the application of phytogenic Si in the form of biochar or crop straw recycling (Li and Delvaux, 2019; Yang et al., 2020; Puppe et al., 2021). On a global scale, field crops synthesize about 35 % of Si accumulated in vegetation, and this proportion is going to increase with increased agricultural production within the next decades (Carey and Fulweiler 2016). In this context, targeted manipulation of Si cycling might be a promising strategy to enhance carbon sequestration in agricultural biogeosystems to mitigate climate change (Song et al., 2014).
4.2 Initial soil properties as drivers of spatial patterns of C. epigejos and P. australis and corresponding Si stocks
In general, the composition and structure of plant communities and the spatial distribution of plant biomass are mainly controlled by climatic, edaphic (e.g. soil moisture/texture, pH and nutrients) and geographic–historic factors as well as by species interactions (e.g. consumption by herbivores) and anthropogenic perturbations (e.g. Polis 1999). At Chicken Creek consumption of plants by herbivores can be generally excluded, because the total study area is fenced. Studies of Zaplata et al. (2011a, 2013) indicated that differences in vegetation dynamics at Chicken Creek can be directly derived from slight differences in edaphic conditions resulting from construction work with large machines (Gerwin et al., 2010).
In this context, especially differences in soil pH, carbon content, calcium carbonate and conductivity between the sandier eastern and the loamier western parts were identified to influence plant species distribution in general (Zaplata et al., 2013). Our results generally corroborate this differentiation between zones of Chicken Creek with clay, N, KDL and Tiron-extractable Si content as important drivers of the small-scale distribution of C. epigejos. Süß et al. (2004) analysed plant successional trajectories and corresponding drivers in calcareous sand ecosystems in the northern upper Rhine valley in Germany. They found the successional trajectories of C. epigejos to be correlated to total N, extractable P and K as well as soil moisture. In contrast, the most important nutrients for aboveground biomass production of C. epigejos seem to be N and calcium, while P and K seem to have no significant effect on biomass production (Rebele and Lehmann, 2001). This is also in line with our observation that PDL seems to be no driver of the small-scale distribution of C. epigejos at Chicken Creek. Plant-available Si concentrations seem to be no driver for the distribution of C. epigejos and P. australis as well. This might be a hint that Si accumulation in plants is probably more influenced by the phylogenetic position of a plant than by environmental factors like temperature or Si availability (see Prychid et al., 2004; Hodson et al., 2005; Cooke and Leishman 2012).
4.3 Benefits and limitations of UAS-based remote sensing of phytogenic Si stocks
Natural ecosystems are characterized by an abundant flora, arranged in a complex spatial pattern. Despite the use of ultrahigh-resolution UAS imagery, a sufficient classification of all relevant species in an ecosystem is challenging or even impossible and has been addressed in previous studies (e. g. Dunford et al., 2009; Laliberte et al., 2011; Husson et al., 2016).
While larger individuals like trees and bushes are easy to identify, the size of the majority of species at Chicken Creek is far below the 10 cm spatial resolution of the multispectral imagery used in our study, and tall growing plants or broadleaved species prevent the sensor from seeing low-growing species below. Consequently, and in contrast to the classification of monocultures, the produced LCC map of the Chicken Creek catchment merely represents the spatial distribution of species or species compositions visible to the sensor. For this reason, we could hardly use the botanical mapping at grid points provided by Markus Zaplata (personal communication, 2016), to validate our classification, but we could use these data as a rough quality check. Hence, training areas for the classification have been defined giving priority to the two main Si accumulators under study. However, both limitations were of minor importance in the case of P. australis and C. epigejos. Even smaller patches of both species were large enough to be identified with the spatial resolution. With the exception of the transition zone northeast of the pond, where C. epigejos co-exists below P. australis, populations are spatially separated and represent the uppermost layer of the canopy within the respective plant community. This may lead to slight underestimations of the spread of C. epigejos and the subsequently estimated Si stock in this area. The clear spectral distinction between similar signatures prevents many other species from proper classification in general and in particular in the case of only a few available spectral bands. This limitation can be diminished by choosing an appropriate date for image acquisition, when the predominately green leaves of C. epigejos and P. australis enhance the optical contrast against the background reflectance of herbs, mosses and lichens. This cannot avoid the inclusion of other grass-like species such as F. rubra or B. sylvaticum in one of the C. epigejos or P. australis classes and the confusion with litter in the case of sparse vegetation cover.
The majority of studies using the original NDVI, other VIs or combinations of VIs have been derived from satellite imagery at the landscape level (e. g. short grass prairie, Anderson et al., 1993; short grass steppe, Todd et al., 1998; rangeland, Mundava et al., 2014; different types of grassland and temperate steppe, Meng et al., 2018) showing poor up to moderate correlations between VIs and aboveground biomass. R2 values range between 0 and 0.6 for either total biomass or fractions of biomass caused by insufficient spatial and spectral resolution but mainly by background reflectance of soil, shadow or non-photosynthetic plant components such as standing dead plants or litter. The immense quantity of studies which evaluated different sensors with numerous VIs at various scales and environments hamper a clear assessment of our results. While several studies reported no or minor improvements in the relationships between red-edge VIs involving the wavelength region between 680 and 750 nm and vegetation parameters (e. g. Cui and Kerekes, 2018; Easterday et al., 2019), other studies carried out over heterogeneous forest stands have proven the red-edge reflectance to be sensitive to chlorophyll content while largely being unaffected by structural properties and crown shadow (e.g. Zarco-Tejada et al., 2018; Xu et al., 2019). This explains in part the outperformance of our results compared to the aforementioned studies and the results presented here, in particular for P. australis, which show a drastic decrease in R2 values when NIR reflectance bands were used instead of the red-edge band. The most important benefit of UAS remote sensing of phytogenic Si stocks is its potential to cover the heterogeneity in plant biomasses and thus phytogenic Si stocks. This is in contrast to previous studies, which assumed identical biomasses for Si stock quantifications (e.g. Cornelis et al., 2010; Sommer et al., 2013; Turpault et al., 2018). In addition, these studies mainly focused on a single plant species in a given ecosystem. Conversely, UAS remote sensing enables the detection of biomasses of different plant species simultaneously and thus the quantification of Si stocks in a lifelike way. Furthermore, UAS remote sensing enables the detection of plant biomasses in larger areas, i.e. at a landscape scale, which is also in contrast to previous studies, which used results of small study plots for an extrapolation to larger spatial units up to a global scale implicitly assuming similar environmental conditions (e.g. Carey and Fulweiler, 2012). Due to the fact that aboveground biomass of plants seems to be the main factor of corresponding phytogenic Si stock quantities (the variations in Si content in a plant species in a given ecosystem are considerably lower, especially when we assume that the phylogenetic position of a plant – rather than environmental factors – determines potential plant Si content; see, e.g. Hodson et al., 2005), detection of biomass heterogeneities via UAS remote sensing represents a promising tool for the quantification of lifelike phytogenic Si pools at landscape scales.
As both species, C. epigejos and P. australis, analysed at Chicken Creek show a wide range of biomass (0.1–98 g m−2), the use of mean biomasses in Si stock calculations or Si cycling models generally leads to deviations and thus substantial Si stock underestimations or overestimations. For a profound understanding of Si cycling in general and the influence of land use in particular, detailed information on the small-scale spatial distribution of plant-related Si stocks based on an accurate biomass assessment is urgently needed. This information will help us to understand the interaction between edaphic factors, plant distribution, ecosystem productivity (biomass) and anthropogenic desilication on a local (i.e. site-specific) scale. Due to the fact that ultrahigh-resolution imagery captured by UASs is capable of differentiating between Si-accumulating species and respective fresh biomass and litter, this technique is also a promising tool for the detailed assessment of Si fluxes in grasslands. As Si content of litter has been recognized as an important driver of decomposition rates (Schaller et al., 2016, 2017), information on litter Si stocks will further help us to better understand ecosystem biogeochemistry in general.
We found mean aboveground Si stocks of P. australis and C. epigejos to be comparable to or even distinctly higher than reported values for the Si storage in aboveground vegetation of different terrestrial biogeosystems. Biomasses of both plants were quite high and have been found to be the main driver of Si stocks at Chicken Creek as Si concentrations of C. epigejos and P. australis were in line with previously published values.
From our results we can conclude that the distribution of C. epigejos and P. australis and corresponding Si stocks at Chicken Creek are clearly determined by initial soil properties. While we found clay, N, KDL and Tiron-extractable Si contents to be important drivers of the small-scale distribution of C. epigejos, the distribution of P. australis was mainly governed by soil moisture conditions. For the distribution of both grasses and corresponding Si stocks, we found no relation to plant-available Si concentrations in soils. This supports our findings that biomasses are the main drivers of Si stocks at Chicken Creek.
The UAS-based remote sensing of phytogenic Si stocks exhibits several benefits: (i) the heterogeneity in plant biomasses and corresponding Si stocks can be covered, (ii) biomasses of different plant species can be detected simultaneously and (iii) plant biomasses in larger areas, i.e. at a landscape scale, can be captured. However, UAS-based remote sensing of phytogenic Si stocks is aggravated by some technical limitations (e.g. the spatial resolution of the multispectral imagery) that have to be considered during the interpretation of results.
A1 UAS, camera specification and mission settings
The Carolo P360 is a fixed-wing construction, developed by the Institute of Aerospace Systems of the Technical University Braunschweig (Fig. 1). With a wingspan of 3.6 m and a take-off weight of almost 22.5 kg including the complete battery set for the electric drive motor, the MINC autopilot system including servo actuators and the payload (sensors and control unit), the UAS is capable of carrying an additional payload of approximately 2.5 kg. The battery set allows flight durations of approximately 40 min at ground speeds between 20 and 30 m s−1 including the time for climbing and landing.
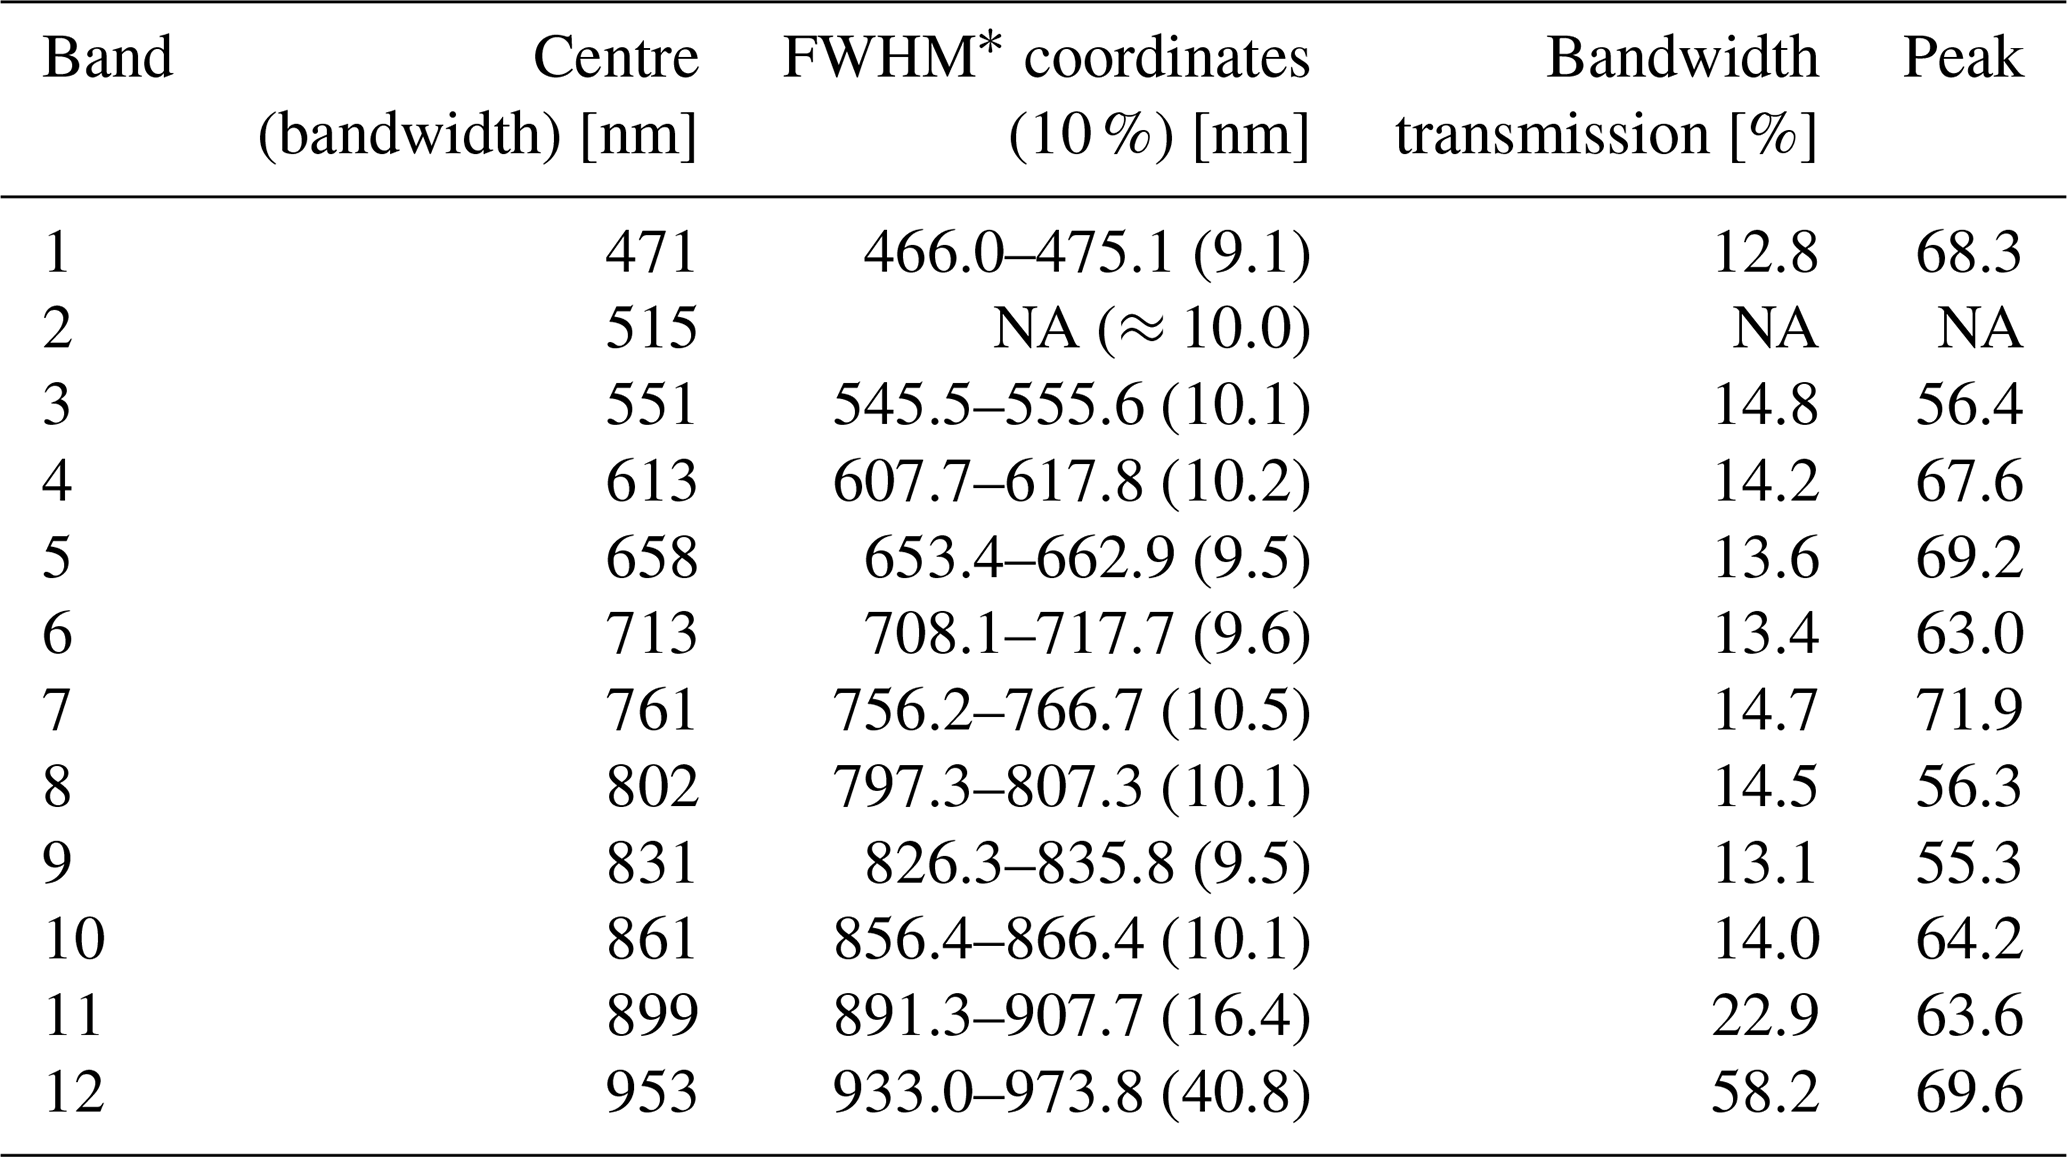
Table A1Filter configuration of the Mini-MCA 12 and optical properties of the mounted filters. For band 2 (b) no fact sheet has been provided.
* Full width at half maximum. NA – not available.
The multispectral camera Mini-MCA 12 is a compact modular construction integrating two basic modules into one rugged chassis. Each module consists of an array of six individual CMOS sensors (1280×1024 pixels; pixel size 5.2 µm), lenses (focal length 8.5 mm) and mountings for user-definable band-pass filters. The filter configuration and specific properties are summarized in Table A1.
Mission settings followed the recommended cruising speed of 25 m s−1, and the camera exposure time of 2 s resulted in an overlap in flight direction of approximately 50 %. A distance of 40 m between the flight paths was required to achieve a sufficient across flight overlap of at least 60 %. Twenty-two waypoints were predefined, each marking a start point and end point of 10 parallel flight paths with a total length of 8.6 km including the loop lines. In order to maintain the GSD of ∼0.1 m, terrain effects were compensated for by setting the flight altitude to 163 m for the northern waypoint and 153 m for the southern waypoints. A total of 2556 individual ( multispectral) images were captured during the mission.
A2 Image post-processing chain
Post-processing of MCA imagery aimed at the conversion of raw digital numbers (DN) into georeferenced at-surface reflectance images. This multistage procedure consisted of three major components: (i) radiometric image correction and (ii) transformation of sensor coordinates into a geographic coordinate system and image alignment and (iii) absolute radiometric calibration. The radiometric image correction included periodic and checkered pattern noise reduction, correction of sensor-based illumination fall-off (vignetting), horizontal band noise removal (caused by the progressive shutter of CMOS sensors), and lens distortion. The transformation of sensor coordinates included the fusion of recorded GPS measurements with collected images, band-wise automated aerial triangulation (AAT), the minimization of remaining geometric distortions and the alignment of single bands to one multispectral image using ground control points (GCPs). Due to homogenous environmental conditions during the 10 min of image acquisition (weather and illumination geometry), we renounced the conversion of measured DNs into at-surface reflectance, which is required for the retrieval of physical parameters of vegetation canopies or bare soil properties because a recorded DN is a function of not only the spectral characteristics of vegetation or soils but also environmental conditions (Moran et al., 1995). A detailed description of the multistage procedure is beyond the scope of this paper. Thus the following paragraphs give a brief overview of the basic methods used in this study to generate one georeferenced multispectral image from the recorded raw images.
Radiometric corrections comprised noise reduction, correction for vignetting and lens distortion effects. The dark offset subtraction technique proposed by Kelcey and Lucieer (2012) reduced the noise component of an image by subtracting the average per-pixel noise calculated from 120 repetitions captured in a completely darkened environment for each of the 12 sensors. The method used for the correction of vignetting effects basically uses a look-up table (LUT) for each sensor, composed of correction factors for each pixel derived from flat field imagery (Mansouri et al., 2005). These were generated by capturing multiple images of an evenly illuminated white cardboard with almost Lambertian properties and constant spectral characteristics over VIS and NIR wavelengths. In a first step the per-pixel average and the corresponding standard deviation were calculated from a total of 10 images for each of the 12 sensors at different exposure levels, followed by a subtraction of the respective dark offset imagery.
To account for the horizontal band noise induced by the progressive shutter of the camera, a shutter correction factor was calculated (Wehrhan et al., 2016).
Finally, a correction technique for lens distortions was applied. The plumb-line approach described in the Brown–Conrady model (Hugemann, 2010) is implemented in the PhotoScan-Pro V.1.7. software (Agisoft LLC, St. Petersburg, Russia). The model required the input of the focal length (8.5 mm) and the pixel size (5.2 µm). Internal and external orientation of each camera (band) was then estimated automatically from the geometry of an image sequence during the image alignment process (Dall'Asta and Roncella, 2014).
Mosaicking and geo-referencing using The PhotoScan-Pro workflow involved common photogrammetric procedures including the search for conjugate points by feature detection algorithms used in the bundle adjustment procedure, approximation of camera positions and orientation, geometric image correction, point cloud and mesh creation, automatic georeferencing, and finally the creation of an orthorectified mosaic (Conçalves and Henriques, 2015). This workflow was applied to each of the 10 bands independently. The ERDAS Imagine software (Hexagon Geospatial, Norcross, GA, US) was then used to improve the spatial accuracy and to transform the single bands to the local coordinate system ETRS 89 UTM 33 by using the precisely measured raster point coordinates. Finally the 10 bands were stacked to a single multispectral image.
For more details regarding description of methods, used materials and technical equipment, the reader is referred to Wehrhan et al. (2016).
A supervised pixel-based classification of a natural ecosystem needs a clear understanding of the nature and the expected results. The result is governed (i) by the spectral and spatial resolution of input imagery, (ii) the biodiversity, (iii) the morphology of the vegetation layer, and (iiii) the selection of adequate training areas. The ultrahigh resolution easy allowed the identification of larger objects such as trees, patches of bare soil and some individuals of P. australis but was still too low to identify individuals of C. epigejos. Due to almost unique spectral properties of green grass-like species, the number and the bandwidths of spectral MCA bands were insufficient for a clear distinction. The morphology of the vegetation layer determined whether a species is visible to the sensor or hidden by another species; e.g. trees or P. australis plants prevent the classification of a C. epigejos population growing underneath. Finally, the selection of training areas determined the classification quality. Selecting small training areas with little statistical variation in the signatures may result in large unclassified areas and vice versa. The separability between classes will be diminished if the signatures of the respective training areas are to some extent similar. As is typical for a supervised maximum-likelihood classification, several trials were necessary to define an appropriate number of representative training areas with sufficient statistical separability of signatures. Taking all aforementioned aspects into account, class definition was driven by the objectives addressed in this particular study. We are aware that these classes in part do not coincide with vegetation or species communities as they are defined in the terminology of ecologists or biologists. However, for simplification purposes the term land cover class (LCC) was used.
All biomass and Si data are available on request to the corresponding author. Underlying soil data were downloaded from https://www.b-tu.de/chicken-creek/apps/datenportal (last access: 15 September 2021, login required).
MS designed and supervised the study. MW conducted the UAS mission, performed image processing, interpreted data, and created maps and graphics. MS, DP and DK contributed expertise in biogenic Si cycling and interpreted Si data. MW, DP and MS wrote the manuscript with contributions of all authors.
The authors declare that they have no conflict of interest.
Publisher's note: Copernicus Publications remains neutral with regard to jurisdictional claims in published maps and institutional affiliations.
Many thanks to Reneé Ende and Christian Buhtz for their excellent laboratory support and to Antje Wehrhan and Ingrid Onasch for carrying out ground truth measurements of biomass. Special thanks to Markus Zaplata, who supported our work with inspiring personal communication and provided botanical expertise.
This study has been financed by the Deutsche Forschungsgemeinschaft (DFG) under grant SO 302/7-1 (Spatiotemporal dynamics of biogenic Si pools in initial soils and their relevance for desilication). Daniel Puppe was funded by the Deutsche Forschungsgemeinschaft (DFG) under grant PU 626/2-1 (Biogenic Silicon in Agricultural Landscapes (BiSiAL) – Quantification, Qualitative Characterization, and Importance for Si Balances of Agricultural Biogeosystems).
This paper was edited by Martin De Kauwe and reviewed by two anonymous referees.
Alexandre, A., Meunier, J. D., Colin, F., and Koud, J. M.: Plant impact on the biogeochemical cycle of silicon and related weathering processes, Geochim. Cosmochim. Ac., 61, 677–682, 1997.
Alexandre, A., Bouvet, M., and Abbadie, L.: The role of savannas in the terrestrial Si cycle: a case-study from Lamto, Ivory Coast, Global Planet. Change 78, 162–169, https://doi.org/10.1016/j.gloplacha.2011.06.007, 2011.
Anderson, G. L., Hanson, J. D., and Haas, R. H.: Evaluating Landsat Thematic Mapper derived vegetation Indices for estimating above-ground biomass on semiarid rangelands, Remote Sens. Environ., 45, 165–175, https://doi.org/10.1016/0034-4257(93)90040-5, 1993.
Bartoli, F.: The biogeochemical cycle of silicon in two temperate forest ecosystems, Environ. Biogeochem. Ecol. Bull., 35, 469–476, https://doi.org/10.1016/j.gca.2007.11.010, 1983.
Berni, J. A. J., Zarco-Tejada, P. J., Suárez, L., and Fereres, E.: Thermal and Narrowband Multispectral Remote Sensing for Vegetation Monitoring From an Unmanned Aerial Vehicle, IEEE T. Geosci. Remote, 47, 722–738, https://doi.org/10.1109/TGRS.2008.2010457, 2009.
Biermans, V. and Baert, L.: Selective extraction of the amorphous Al, Fe and Si oxides using an alkaline Tiron solution, Clay Miner., 12, 127–135, https://doi.org/10.1180/CLAYMIN.1977.012.02.03, 1977.
Blecker, S. W., McCulley, R. L., Chadwick, O. A., and Kelly, E. F.: Biologic cycling of silica across a grassland bioclimosequence, Global Biogeochem. Cy., 20, GB3023, https://doi.org/10.1029/2006GB002690, 2006.
Bouman, B. A. M.: Accuracy of estimation the leaf area index from vegetation indices derived from crop reflectance characteristics, a simulation study, Int. J. Remote Sens., 13, 3069–3084, https://doi.org/10.1080/01431169208904103, 1992.
Carey, J. C. and Fulweiler, R. W.: The terrestrial silica pump, PLoS One 7, https://doi.org/10.1371/journal.pone.0052932, 2012.
Carey, J. C. and Fulweiler R. W.: Human appropriation of biogenic silicon–the increasing role of agriculture, Funct. Ecol., 30, 1331–1339, https://doi.org/10.1111/1365-2435.12544, 2016.
Clarke, J.: The occurrence and significance of biogenic opal in the regolith, Earth-Sci. Rev., 60, 175–194, https://doi.org/10.1016/S0012-8252(02)00092-2, 2003.
Conçalves, J. A., Henriques, R.: UAV photogrammetry for topographic monitoring of coastal areas, ISPRS J. Photogramm., 104, 101–111, https://doi.org/10.1016/j.isprsjprs.2015.02.009, 2015.
Cooke, J. and Leishman, M. R.: Tradeoffs between foliar silicon and carbon-based defences: evidence from vegetation communities of contrasting soil types. Oikos, 121, 2052–2060, https://doi.org/10.1111/j.1600-0706.2012.20057.x, 2012.
Cornelis, J. T. and Delvaux, B.: Soil processes drive the biological silicon feedback loop, Funct. Ecol., 30, 1298–1310, https://doi.org/10.1111/1365-2435.12704, 2016.
Cornelis, J. T., Ranger, J., Iserentant, A., and Delvaux, B.: Tree species impact the terrestrial cycle of silicon through various uptakes, Biogeochemistry, 97, 231–245, https://doi.org/10.1007/s10533-009-9369-x, 2010.
Cui, Z. and Kerekes, J. P.: Potential of red edge spectral bands in future Landsat satellites on agroecosystem canopy green leaf area index retrieval, Remote Sens.-Basel, 10, 1458, https://doi.org/10.3390/rs10091458, 2018.
Cui, X., Gibbes, C., Southworth, J., and Waylen, P.: Using Remote Sensing to Quantify Vegetation Change and Ecological Resilience in a Semi-arid System, Land, 2, 108–130, https://doi.org/10.3390/land2020108, 2013.
Dall'Asta, E., and Roncella, R. A.: Comparison of Semiglobal and Local Dense Matching Algorithms for Surface Reconstruction, The International Archives of the Photogrammetry, Remote Sensing and Spatial Information Sciences, ISPRS Technical Commission V Symposium, XL-5, Riva del Garda, Italy, 23–25 June 2014, https://doi.org/10.5194/isprsarchives-XL-5-187-2014.
Desplanques, V., Cary, L., Mouret, J. C., Trolard, F., Bourrié, G., Grauby, O., and Meunier, J.-D.: Silicon transfers in a rice field in Camargue (France), J. Geochem. Explor, 88, 190–193, https://doi.org/10.1016/j.gexplo.2005.08.036, 2006.
Dunford, R., Michel, K., Gagnage, M., Piégay, H., and Trémelo, M.-L.: Potential and constraints of Unmanned Arial Vehicle technology for the characterization of Mediterranean riparian forest, Int. J. Remote Sens., 30:19, 4915–4935, https://doi.org/10.1080/01431160903023025, 2009.
Dürr, H. H., Meybeck, M., Hartmann, J., Laruelle, G. G., and Roubeix, V.: Global spatial distribution of natural riverine silica inputs to the coastal zone, Biogeosciences, 8, 597–620, https://doi.org/10.5194/bg-8-597-2011, 2011.
Easterday, K., Kislik, C., Dawson, T. E., Hogan, S., and Kelly, M.: Remotely Sensed Water Limitation in Vegetation: Insights from an Experiment with Unmanned Aerial Vehicles (UAVs), Remote Sens., 11, 1853, https://doi.org/10.3390/rs11161853, 2019.
Ehrlich, H., Demadis, K. D., Pokrovsky, O. S., and Koutsoukos, P. G.: Modern views on desilicification: biosilica and abiotic silica dissolution in natural and artificial environments, Chem. Rev., 110, 4656–4689, https://doi.org/10.1021/cr900334y, 2010.
Elmer, M., Schaaf, W., Biemelt, D., Nenov, R., and Gerwin, W.: Introduction, in: The artificial catchment “Chicken Creek” – Initial ecosystem development 2005–2010, edited by: Elmer, M., Schaaf, W., Biemelt, D., Gerwin, W., and Hüttl, R. F., Ecosyst. Dev. 3. Brandenburg Univ. of Technol., Cotbtus, Germany, 1–10, 2011.
Elmer, M., Gerwin, W., Schaaf, W., Zaplata, M. K., Hohberg, K., Nenov, R., Bens, O., and Hüttl, R. F.: Dynamics of initial ecosystem development at the artificial catchment Chicken Creek, Lusatia, Germany, Environ. Earth Sci., 69, 491–505, https://doi.org/10.1007/s12665-013-2330-2, 2013.
Epstein, E.: Silicon: its manifold roles in plants, Annals of Applied Biology, 155, 155–160, https://doi.org/10.1111/j.1744-7348.2009.00343.x, 2009.
Fraysse, F., Pokrovsky, O. S., Schott, J., and Meunier, J. D.: Surface properties, solubility and dissolution kinetics of bamboo phytoliths, Geochim. Cosmochim. Ac., 70, 1939–1951, https://doi.org/10.1016/j.gca.2005.12.025, 2006.
Fraysse, F., Pokrovsky, O. S., Schott, J., and Meunier, J. D.: Surface chemistry and reactivity of plant phytoliths in aqueous solutions, Chem. Geol., 258, 197–206, https://doi.org/10.1016/j.chemgeo.2008.10.003, 2009.
Fuller, R. M., Groom, G. B., Mugisha, S., Ipulet, P., Pomeroy, D., Katende, A., Baily, R., and Ogutu-Ohwayo, R.: The integration of field survey and remote sensing for biodiversity assessment: a case study in the tropical forests and wetlands of Sango Bay, Uganda, Biol. Conserv., 86, 379–391, https://doi.org/10.1016/S0006-3207(98)00005-6, 1998.
Gamon, J. A., Field, C. B., Goulden, M. L., Griffin, K. L., Hartley, A. E., Joel, G., Penuelas, J., and Valentini, R.: Relationships between NDVI, Canopy Structure, and Photosynthesis in three Californian Vegetation Types, Ecol. Appl., 5, 28–41, 1995.
Gao, X., Huete, A. R., Ni, W., and Miura, T.: Optical-biophysical relationships of vegetation spectra without background contamination, Remote Sens. Environ., 74, 609–620, 2000.
Gerke, H. H., Maurer, T., and Schneider, A.: A three-dimensional structure and process model for integrated hydro-geo-pedologic analysis of a constructed hydrological catchment, Vadose Zone J., 12, 4, https://doi.org/10.2136/vzj2013.02.0040, 2013.
Gerwin, W., Schaaf, W., Biemelt, D., Fischer, A., Winter, S., and Hüttl, R. F.: The artificial catchment Chicken Creek (Lusatia, Germany) – a landscape laboratory for interdisciplinary studies of initial ecosystem development, Ecol. Eng., 35, 1786–1796, 2009.
Gerwin, W., Schaaf, W., Biemelt, D., Elmer, M., Maurer, T., and Schneider, A.: The Artificial catchment “Hühnerwasser” (Chicken Creek): construction and initial properties, in: Ecosystem Development 1, edited by: Hüttl, R. F., Schaaf, W., Biemelt, D., and Gerwin, W., pp. 58, 2010.
Gerwin, W., Schaaf, W., Biemelt, D., Winter, S., Fischer, A., Veste, M., and Hüttl, R. F.: Overview and first results of ecological monitoring at the artificial watershed Chicken Creek (Germany), Phys. Chem. Earth, 36, 61–73, https://doi.org/10.1016/j.pce.2010.11.003, 2011.
Gonzáles, M. P., Bonaccorso, E., and Papeş, M.: Applications of geographic information systems and remote sensing techniques to conservation of amphibians in northwestern Ecuador, Global Ecology and Conservation, 3, 562–574, https://doi.org/10.1016/j.gecco.2015.02.006, 2015.
Guntzer, F., Keller, C., Poulton, P. R., McGrath, S. P., and Meunier, J.-D.: Long-term removal of wheat straw decreases soil amorphous silica at Broadbalk, Rothamsted, Plant Soil, 352, 173–184, doi: 0.1007/s11104-011-0987-4, 2012.
Haboudane, D., Miller, J. R., Pattey, E., Zarco-Tejada, P. J., and Strachan, I. B.: Hyperspectral vegetation indices and novel algorithms for predicting green LAI of crop canopies: Modeling and validation in the context of precision agriculture, Remote Sens. Environ., 90, 337–352, https://doi.org/10.1016/j.rse.2003.12.013, 2004.
Hodson, M. J., White, P. J., Mead, A., and Broadley, M. R.: Phylogenetic variation in the silicon composition of plants, Ann. Bot.-London, 96, 1027–1046, https://doi.org/10.1093/aob/mci255, 2005.
Hugemann, W.: Correcting Lens Distortions in Digital Photographs, Ingenieurbüro Morawski + Hugemann, Leverkusen, Germany, 2010.
Husson, E., Hagner, O., and Ecke, F.: Unmanned aircraft systems help to map aquatic vegetation, Appl. Veg. Sci., 17, 567–577, https://doi.org/10.1111/avsc.12072, 2014.
Husson, E., Ecke, F., and Reese, H.: Comparison of manual mapping and automated object-based image analysis of non-submerged aquatic vegetation from very-high-resolution UAS images, Remote Sens.-Basel, 8, 724, https://doi.org/10.3390/rs8090724, 2016.
Kaczorek, D., Puppe, D., Busse, J., and Sommer, M.: Effects of phytolith distribution and characteristics on extractable silicon fractions in soils under different vegetation–An exploratory study on loess. Geoderma, 356, 113917, https://doi.org/10.1016/j.geoderma.2019.113917, 2019.
Kaneko, K. and Nohara, S.: Review of effective vegetation mapping using the UAV (Unmanned Aerial Vehicle) Method, Journal of Geographic Information Systems, 6, 733–742, https://doi.org/10.4236/jgis.2014.66060, 2014.
Katz, O., Puppe, D., Kaczorek, D., Prakash, N. B., and Schaller, J.: Silicon in the soil–plant continuum: Intricate feedback mechanisms within ecosystems, Plants, 10, 4, 652, 2021.
Kavzoglu, T. and Mather, P. M.: The Use of Feature Selection Techniques in the Context of Artificial Neural Networks, Proceedings of the 26th Annual Conference of the Remote Sensing Society, Leicester, UK, 12–14 September, unpaginated CD ROM, 2000.
Kelcey, J. and Lucieer, A.: Sensor Correction of a 6-Band Multispectral Imaging Sensor for UAV Remote Sensing, Remote Sens.-Basel, 4, 1462–1493, https://doi.org/10.3390/rs4051462, 2012.
Keller, C., Guntzer, F., Barboni, D., Labreuche, J., and Meunier, J. D.: Impact of agriculture on the Si biogeochemical cycle: input from phytolith studies, C. R. Geosci., 344, 739–746, https://doi.org/10.1016/j.crte.2012.10.004, 2012.
Kim, J. Y., Rastogi, G., Do, Y., Kim, D.-K., Muduli, P. R., Samal, R. N., Pattnaik, A. K., and Joo, G.-J.: Trends in a satellite-derived vegetation index and environmental variables in a restored brackish lagoon, Global Ecol. Conserv., 4, 614–624, https://doi.org/10.1016/j.gecco.2015.10.010, 2015.
Kodama, H. and Ross, G. J.: Tiron dissolution method used to remove and characterize inorganic components in soils, Soil Sci. Soc. Am. J., 55, 1180–1187, https://doi.org/10.2136/sssaj1991.03615995005500040047x, 1991.
Kross, A., McNairn, H., Lapen, D., Sonohara, M., and Champagne, C.: Assessment of RapidEye vegetation indices for estimation of leaf area index and biomass in corn and soybean crops, Int. J. Appl. Earth Obs., 34, 235–248, https://doi.org/10.1016/j.jag.2014.08.002, 2015.
Laliberte, A. S., Goforth, M. A., Steele, C. M., and Rango, A.: Multispectral Remote Sensing from Unmanned Aircraft: Image Processing Workflows and Applications for Rangeland Environments, Remote Sens.-Basel, 3, 2529–2551, https://doi.org/10.3390/rs3112529, 2011.
Lelong, C. C. D., Burger, P., Jubelin, G., Roux, B., Labbé, S., and Baret, F.: Assessment of Unmanned Aerial Vehicles Imagery for Quantitative Monitoring of Wheat Crop in Small Plots, Sensors, 8, 3557–3585, https://doi.org/10.3390/s8053557, 2008.
Li, Z., Cornelis, J. T., Vander Linden, C., Van Ranst, E., and Delvaux, B.: Neoformed aluminosilicate and phytogenic silica are competitive sinks in the silicon soil–plant cycle, Geoderma, 368, 114308, https://doi.org/10.1016/j.geoderma.2020.114308, 2020.
Li, Z., Unzué-Belmonte, D., Cornelis, J.-T., Vander Linden, C., Struyf, E., Ronsse, F., and Delvaux, B.: Effects of phytolithic rice-straw biochar, soil buffering capacity and pH on silicon bioavailability, Plant Soil, 438, 187–203, https://doi.org/10.1007/s11104-019-04013-0, 2019.
Li, Z. and Delvaux, B.: Phytolith-rich biochar: A potential Si fertilizer in desilicated soils, GCB Bioenergy, 11, 1264–1282, https://doi.org/10.1111/gcbb.12635, 2019.
Ma, J. F. and Yamaji, N.: Silicon uptake and accumulation in higher plants, Trends Plant Sci., 11, 392–397, https://doi.org/10.1016/j.tplants.2006.06.007, 2006.
Mansouri, A., Marzani, F. S., and Gouton, P.: Development of a protocol for CCD calibration: application to a multispectral imaging system, Int. J. Robot. Autom., 3767, 1–12, https://doi.org/10.2316/Journal.206.2005.2.206-2784, 2005.
Meng, B., Gao, J., Liang, T., Cui, X., Ge, J., Yin, J., Feng, Q., and Xie, H.: Modeling of alpine grassland cover based on Unmanned Arial Vehicle technology and multi-factor methods: A case study in the east of Tibetan Plateau, China, Remote Sens.-Basel, 10, 320, https://doi.org/10.3390/rs10020320, 2018.
Meunier, J. D., Guntzer, F., Kirman, S., and Keller, C.: Terrestrial plant-Si and environmental changes, Mineralogical Magazine, 72, 263–267, https://doi.org/10.1180/minmag.2008.072.1.263, 2008.
Meunier, J. D., Keller, C., Guntzer, F., Riotte, J., Braun, J. J., and Anupama, K.: Assessment of the 1 % Na2CO3 technique to quantify the phytolith pool, Geoderma, 216, 30–35, 2014.
Moran, M. S., Jackson, R. D., Clarke, T. R., Qi, J., Cabot, F., Thome, K. J., and Markham, B. L.: Reflectance factor retrieval from Landsat TM and SPOT HRV data for bright and dark targets, Remote Sens. Environ., 52, 218–230, 1995.
Mundava, C., Helmholz, P., Schut, A. G. T., Corner. R., McAtee, B., and Lamb, D. W.: Evaluation of vegetation indices for rangeland biomass estimation in the Kimberly area of Western Australia, ISPRS Annals of the Photogrammetry, Remote Sensing and Spatial Information Sciences, ISPRS Technical Commission VII Symposium, Istanbul, Turkey, 29 September–2 October 2014, Volume II-7.
Otukei, J. R. and Blaschke, T.: Land cover change assessment using decision trees, support vector machines and maximum likelihood classification algorithms, Int. J. Appl. Earth Obs., 12S, 27–31, https://doi.org/10.1016/j.jag.2009.11.002, 2010.
Polis, G. A.: Why are parts of the world green? Multiple factors control productivity and the distribution of biomass, Oikos, 86, 3–15, 1999.
Prychid, C. J., Rudall, P. J., and Gregory, M.: Systematics and biology of silica bodies in monocotyledons, Bot. Rev., 69, 377–440, 2004.
Puppe, D.: Review on protozoic silica and its role in silicon cycling. Geoderma 365, 114224, https://doi.org/10.1016/j.geoderma.2020.114224, 2020.
Puppe, D. and Leue, M.: Physicochemical surface properties of different biogenic silicon structures: results from spectroscopic and microscopic analyses of protistic and phytogenic silica. Geoderma 330, 212–220, https://doi.org/10.1016/j.geoderma.2018.06.001, 2018.
Puppe, D. and Sommer, M.: Experiments, uptake mechanisms, and functioning of silicon foliar fertilization – a review focusing on maize, rice, and wheat. Adv. Agron. 152, 1–49, https://doi.org/10.1016/bs.agron.2018.07.003, 2018.
Puppe, D., Kaczorek, D., Wanner, M., and Sommer, M.: Dynamics and drivers of the protozoic Si pool along a 10-year chronosequence of initial ecosystem states, Ecol. Eng., 70, 477–482, https://doi.org/10.1016/j.ecoleng.2014.06.011, 2014.
Puppe, D., Ehrmann, O., Kaczorek, D., Wanner, M., and Sommer, M.: The protozoic Si pool in temperate forest ecosystems – Quantification, abiotic controls and interactions with earthworms, Geoderma, 243–244, 196–204, https://doi.org/10.1016/j.geoderma.2014.12.018, 2015.
Puppe, D., Höhn, A., Kaczorek, D., Wanner, M., and Sommer, M.: As Time Goes By – Spatiotemporal Changes of Biogenic Si Pools in Initial Soils of an Artificial Catchment in NE Germany, Appl. Soil Ecol., 105, 9–16, https://doi.org/10.1016/j.apsoil.2016.01.020, 2016.
Puppe, D., Höhn, A., Kaczorek, D., Wanner, M., Wehrhan, M., and Sommer, M.: How big is the influence of biogenic silicon pools on short-term changes in water-soluble silicon in soils? Implications from a study of a 10-year-old soil–plant system, Biogeosciences, 14, 5239–5252, https://doi.org/10.5194/bg-14-5239-2017, 2017.
Puppe, D., Wanner, M., and Sommer, M.: Data on euglyphid testate amoeba densities corresponding protozoic silicon pools, and selected soil parameters of initial and forested biogeosystems, Data in Brief, 21, 1697–1703, https://doi.org/10.1016/j.dib.2018.10.164, 2018.
Puppe, D., Kaczorek, D., Schaller, J., Barkusky, D., and Sommer, M.: Crop straw recycling prevents anthropogenic desilication of agricultural soil–plant systems in the temperate zone–Results from a long-term field experiment in NE Germany, Geoderma, 403, 115187, https://doi.org/10.1016/j.geoderma.2021.115187, 2021.
Rebele, F. and Lehmann, C.: Biological flora of central Europe: Calamagrostis epigejos ( L.) Roth, Flora, 196, 325–344, https://doi.org/10.1016/S0367-2530(17)30069-5, 2001.
Rouse, J. W., Haas, R. H., Schell, J. A., and Deering, D. W.: Monitoring vegetation system in the great plains with ERTS, Proceedings of the Third Earth Resources Technology Satellite-1 Symposium, Greenbelt, USA, NASA SP-351, 3010–3017, 1974.
Sauer, D., Saccone, L., Conley, D. J., Herrmann, L., and Sommer, M.: Review of methodologies for extracting plant-available and amorphous Si from soils and aquatic sediments, Biogeochemistry, 80, 89–108, https://doi.org/10.1007/s10533-005-5879-3, 2006.
Schaaf, W., Biemelt, D., Hüttl, R. F.: Initial development of the artificial catchment “Chicken Creek” – monitoring program and survey 2005–2008, Ecosystem Development 2, Forschungszentrum für Landschaftsentwicklung und Bergbaulandschaften der BTU Cottbus, Cottbus, 2010.
Schaller, J., Roscher, C., Hillebrand, H., Weigelt, A., Oelmann, Y., Wilcke, W., Ebeling, A., and Weisser, W. W.: Plant diversity and functional groups affect Si and Ca pools in aboveground biomass of grassland systems, Oecologia, 182, 277–286, 2016.
Schaller, J., Hodson, M. J., and Struyf, E.: Is relative Si/Ca availability crucial to the performance of grassland ecosystems?, Ecosphere, 8, e01726, https://doi.org/10.1002/ecs2.1726, 2017.
Schaller, J., Puppe, D., Kaczorek, D., Ellerbrock, R., and Sommer, M.: Silicon cycling in soils revisited, Plants, 10, 295, https://doi.org/10.3390/plants10020295, 2021.
Schneider, A., Maurer, T., and Gerke, H. H.: Aspects of initial surface development, in: The artificial catchment “Chicken Creek” – Initial ecosystem development 2005–2010, edited by: Elmer, M., Schaaf, W., Biemelt, D., Gerwin, W., and Hüttl, R. F., Ecosyst. Dev. 3. Brandenburg Univ. of Technol., Cottbus, Germany, 11–32, 2011.
Shafri, H. Z. M., Suhaili, A., and Mansor, S.: The Performance of Maximum Likelihood, Spectral Angle Mapper, Neural Network and Decision Tree Classifiers in Hyperspectral Image Analysis, J. Comput. Sci., 3, 419–423, https://doi.org/10.3844/jcssp.2007.419.423, 2007.
Sommer, M., Kaczorek, D., Kuzyakov, Y., and Breuer, J.: Silicon pools and fluxes in soils and landscapes – a review, J. Plant Nutr. Soil Sc., 169, 310–329, https://doi.org/10.1002/jpln.200521981, 2006.
Sommer, M., Jochheim, H., Höhn, A., Breuer, J., Zagorski, Z., Busse, J., Barkusky, D., Meier, K., Puppe, D., Wanner, M., and Kaczorek, D.: Si cycling in a forest biogeosystem the importance of transient state biogenic Si pools, Biogeosciences, 10, 4991–5007, https://doi.org/10.5194/bg-10-4991-2013, 2013.
Song, Z., Müller, K., and Wang, H.: Biogeochemical silicon cycle and carbon sequestration in agricultural ecosystems, Earth-Sci. Rev., 139, 268–278, https://doi.org/10.1016/j.earscirev.2014.09.009, 2014.
Stoner, E. R. and Baumgardner, M. F.: Characteristic variations in reflectance of surface soils, Soil Sci. Soc. Am. J., 45, 1161–1165, 1981.
Strecha, C., Fletcher, A., Lechner, A., Erskine, P., and Fua, P.: Developing species specific vegetation maps using multi-spectral hyperspatial imagery from unmanned aerial vehicles, ISPRS Annals of the Photogrammetry, Remote Sensing and Spatial Information Sciences, XXII ISPRS Congress, Melbourne, Australia, 25 August–1 September 2012, Volume I-3, 311–316, 2012.
Street-Perrott, F. A. and Barker, P. A.: Biogenic silica: a neglected component of the coupled global continental biogeochemical cycles of carbon and silicon, Earth Surf. Proc. Land. 33, 1436–1457, 2008.
Struyf, E. and Conley, D. J.: Silica: an essential nutrient in wetland biogeochemistry, Front. Ecol. Environ., 7, 88–94, https://doi.org/10.1890/070126, 2009.
Struyf, E. and Conley, D. J.: Emerging understanding of the ecosystem silica filter, Biogeochemistry, 107, 9–18, https://doi.org/10.1007/s10533-011-9590-2, 2012.
Struyf, E., Smis, A., Van Damme, S., Garnier, J., Govers, G., Van Wesemael, B., Conley, D.J, Batelaan, O., Frot, E., Clymans, W., Vandevenne, F., Lancelot, C., Goos, P., and Meire, P.: Historical land use change has lowered terrestrial silica mobilization, Nat. Commun., 1, 129, https://doi.org/10.1038/ncomms1128, 2010.
Süß, K., Storm, C., Zehm, A., and Schwabe, A.: Succession in inland sand ecosystems: which factors determine the occurrence of the tall grass species Calamagrostis epigejos ( L.) Roth and Stipa capillata L.?, Plant Biol., 6, 465–476, https://doi.org/10.1055/s-2004-820871, 2004.
Swain, P. H. and Davis, S. M. (Eds.): Remote Sensing: The Quantitative Approach, McGraw Hill, New York, N.Y., Hamburg, Germany, 1978.
Thenkabail, P. S., Smith, R. B., and De Pauw, E.: Evaluation of Narrowband and Broadband Vegetation Indices for Determining Optimal Hyperspectral Wavebands for Agricultural Crop Characterization, Photogramm. Eng. Rem. S., 68, 607–621, 2002.
Todd, S. W., Hoffer, R. M., and Milchunas, D. G.: Biomass estimation on grazed and ungrazed rangelands using spectral indices, Int. J. Remote Sens., 19, 427–438, https://doi.org/10.1080/014311698216071, 1998.
Turner, D., Lucieer, A., Malenovský, Z., King, D. H., and Robinson, S. A.: Spatial Co-Registration of Ultra-High Resolution Visible, Multispectral and Thermal Images Acquired with a Micro-UAV over Antarctic Moss Beds, Remote Sens.-Basel, 6, 4003–4024, https://doi.org/10.3390/rs6054003, 2014.
Turpault, M.-P., Calvaruso, C., Kirchen, G., Redon, P.-O., and Cochet, C.: Contribution of fine tree roots to the silicon cycle in a temperate forest ecosystem developed on three soil types, Biogeosciences, 15, 2231–2249, https://doi.org/10.5194/bg-15-2231-2018, 2018.
van der Putten, W. H.: Die-back of Phragmites australis in European wetlands: an overview of the European research programme on reed die-back and progression (1993–1994), Aquat. Bot., 59, 263–275, 1997.
Vandevenne, F., Struyf, E., Clymans, W., and Meire, P.: Agricultural silica harvest: have humans created a new loop in the global silica cycle?, Front. Ecol. Environ., 10, 243–248, https://doi.org/10.1890/110046, 2012.
Vandevenne, F. I., Barão, L., Ronchi, B., Govers, G., Meire, P., Kelly, E. F., and Struyf, E.: Silicon pools in human impacted soils of temperate zones, Global Biogeochem. Cy., 29, 1439–1450, https://doi.org/10.1002/2014GB005049, 2015a.
Vandevenne, F. I., Delvaux C., Hughes H. J., André L., Ronchi B., Clymans W., Barão L., Govers G., Meire, P., and Struyf, E.: Landscape cultivation alters δ30Si signature in terrestrial ecosystems, Sci. Rep.-UK, 5, 7732, https://doi.org/10.1038/srep07732, 2015b.
VDLUFA: Methodenbuch Band I: Die Untersuchung von Böden, Kap. 6.2.1.2., VDLUFA Verlag, Speyer, 1991.
Wang, J., Rich, P. M., Price, K. P., and Kettle, W. D.: Relationship between NDVI, Grassland Production, and Crop Yield in the Central Great Plains, Geocarto Int., 20, 5–11, https://doi.org/10.1080/10106040508542350, 2005.
Wehrhan, M., Rauneker, P., and Sommer, M.: UAV-based Estimation of Carbon Exports from Heterogeneous Soil Landscapes – A Case Study from the CarboZALF Experimental Area, Sensors, 16, 255, https://doi.org/10.3390/s16020255, 2016.
Xu, N., Tian, J., Tian, Q., Xu, K., and Tang, S.: Analysis of vegetation red edge with different illuminated/shaded canopy proportions and to construct Normalized Difference Canopy Shadow Index, Remote Sens.-Basel, 11, 1192, https://doi.org/10.3390/rs11101192, 2019.
Yang, X., Zhaoliang, S., Zhilian, Q., Wu, L., Yin, L., Van Zwieten, L., Song, A., Ran, X., Yu, C., and Wang, H.: Phytolith-rich straw application and groundwater table management over 36 years affect the soil-plant silicon cycle of a paddy field, Plant Soil, 454, 343–358, https://doi.org/10.1007/s11104-020-04656-4, 2020.
Zaplata, M. K., Winter, S., Biemelt, D., and Fischer, A.: Immediate shift towards source dynamics: the pioneer species Conyza canadensis in an initial ecosystem, Flora, 206, 928–934, https://doi.org/10.1016/j.flora.2011.07.001, 2011a.
Zaplata, M. K., Fischer, A., and Winter, S.: Vegetation patterning. in: The artificial catchment “Chicken Creek” – initial ecosystem development 2005–2010, Ecosystem Development, 3, edited by: Elmer, M., Schaaf, W., Biemelt, D., Gerwin, W., and Hüttl, R. F., BTU, Cottbus, pp. 67–92, 2011b.
Zaplata, M. K., Winter, S., Fischer, A., Kollmann, J., and Ulrich, W.: Species-driven phases and increasing structure in early-successional plant communities, Am. Nat., 181, E17–E27, https://doi.org/10.1086/668571, 2013.
Zarco-Tejada, P. J., Hornero, A., Hernandez-Clemente, R., and Beck, P. S. A.: Understanding the temporal dimension of the red –edge spectral region for forest decline detection using high-resolution hyperspectral and Sentinel-2a imagery, ISPRS J. Photogramm., 137, 134–148, https://doi.org/10.1016/j.isprsjprs.2018.01.017, 2018.
Zarco-Tejada, P. J., González-Dugo, V., and Berni, J. A. J.: Fluorescence, temperature and narrow-band indices acquired from a UAV platform for water stress detection using a micro-hyperspectral imager and a thermal camera, Remote Sens. Environ., 117, 322–337, https://doi.org/10.1016/j.rse.2011.10.007, 2012.
Zweig, C. L., Burgess, M. A., Percival, H. F., and Kitchens, W. M.: Use of unmanned aircraft systems to delineate fine-scale wetland vegetation communities, Wetlands, 35, 303–309, https://doi.org/10.1007/s13157-014-0612-4, 2015.