the Creative Commons Attribution 4.0 License.
the Creative Commons Attribution 4.0 License.
 | 26 Jan 2021
Climatic traits on daily clearness and cloudiness indices
Andrés Ochoa
Solar radiation has a crucial role in photosynthesis, evapotranspiration and other biogeochemical processes. The amount of solar radiation reaching the Earth's surface is a function of astronomical geometry and atmospheric optics. While the first is deterministic, the latter has a random behaviour caused by highly variable atmospheric components such as water and aerosols. In this study, we use daily radiation data (1978–2014) from 37 FLUXNET sites distributed across the globe to inspect for climatic traits in the shape of the probability density function (PDF) of the clear-day (c) and the clearness (k) indices. The analysis was made for shortwave radiation (SW) at all sites and for photosynthetically active radiation (PAR) at 28 sites. We identified three types of PDF, unimodal with low dispersion (ULD), unimodal with high dispersion (UHD) and bimodal (B), with no difference in the PDF type between c and k at each site. Looking for regional patterns in the PDF type, we found that latitude, global climate zone and Köppen climate type have a weak relation and the Holdridge life a stronger relation with c and k PDF types. The existence and relevance of a second mode in the PDF can be explained by the frequency and meteorological mechanisms of rainy days. These results are a frame to develop solar radiation stochastic models for biogeochemical and ecohydrological modelling.
- Article
(5456 KB) - Full-text XML
-
Supplement
(36384 KB) - BibTeX
- EndNote


Solar radiation drives most physical, chemical and biological processes at the Earth's surface. It is the primary energy source for photosynthesis, evapotranspiration and other biochemical processes (Wu et al., 2016; Mercado et al., 2009). The amount of solar irradiance reaching any place on the Earth's surface at a given time results from the Sun's emission spectrum, Sun–Earth distance, the angle of incidence of solar rays and the atmospheric attenuation of light. The geometry of Earth's orbit and rotation is well-known and can be calculated with high precision. However, atmospheric attenuation of light is strongly affected by atmospheric constituents such as molecular gases, aerosols, water vapour and clouds by reflecting, absorbing and scattering processes (Platt et al., 2012; Wallace and Hobbs, 2006). Aerosols, water vapour and clouds are highly variable in space and time. As a consequence, uncertainty is unavoidable when calculating surface solar radiation because of the high space and time variability of aerosols, water vapour and clouds (Li and Trishchenko, 2001; Chen et al., 2000).
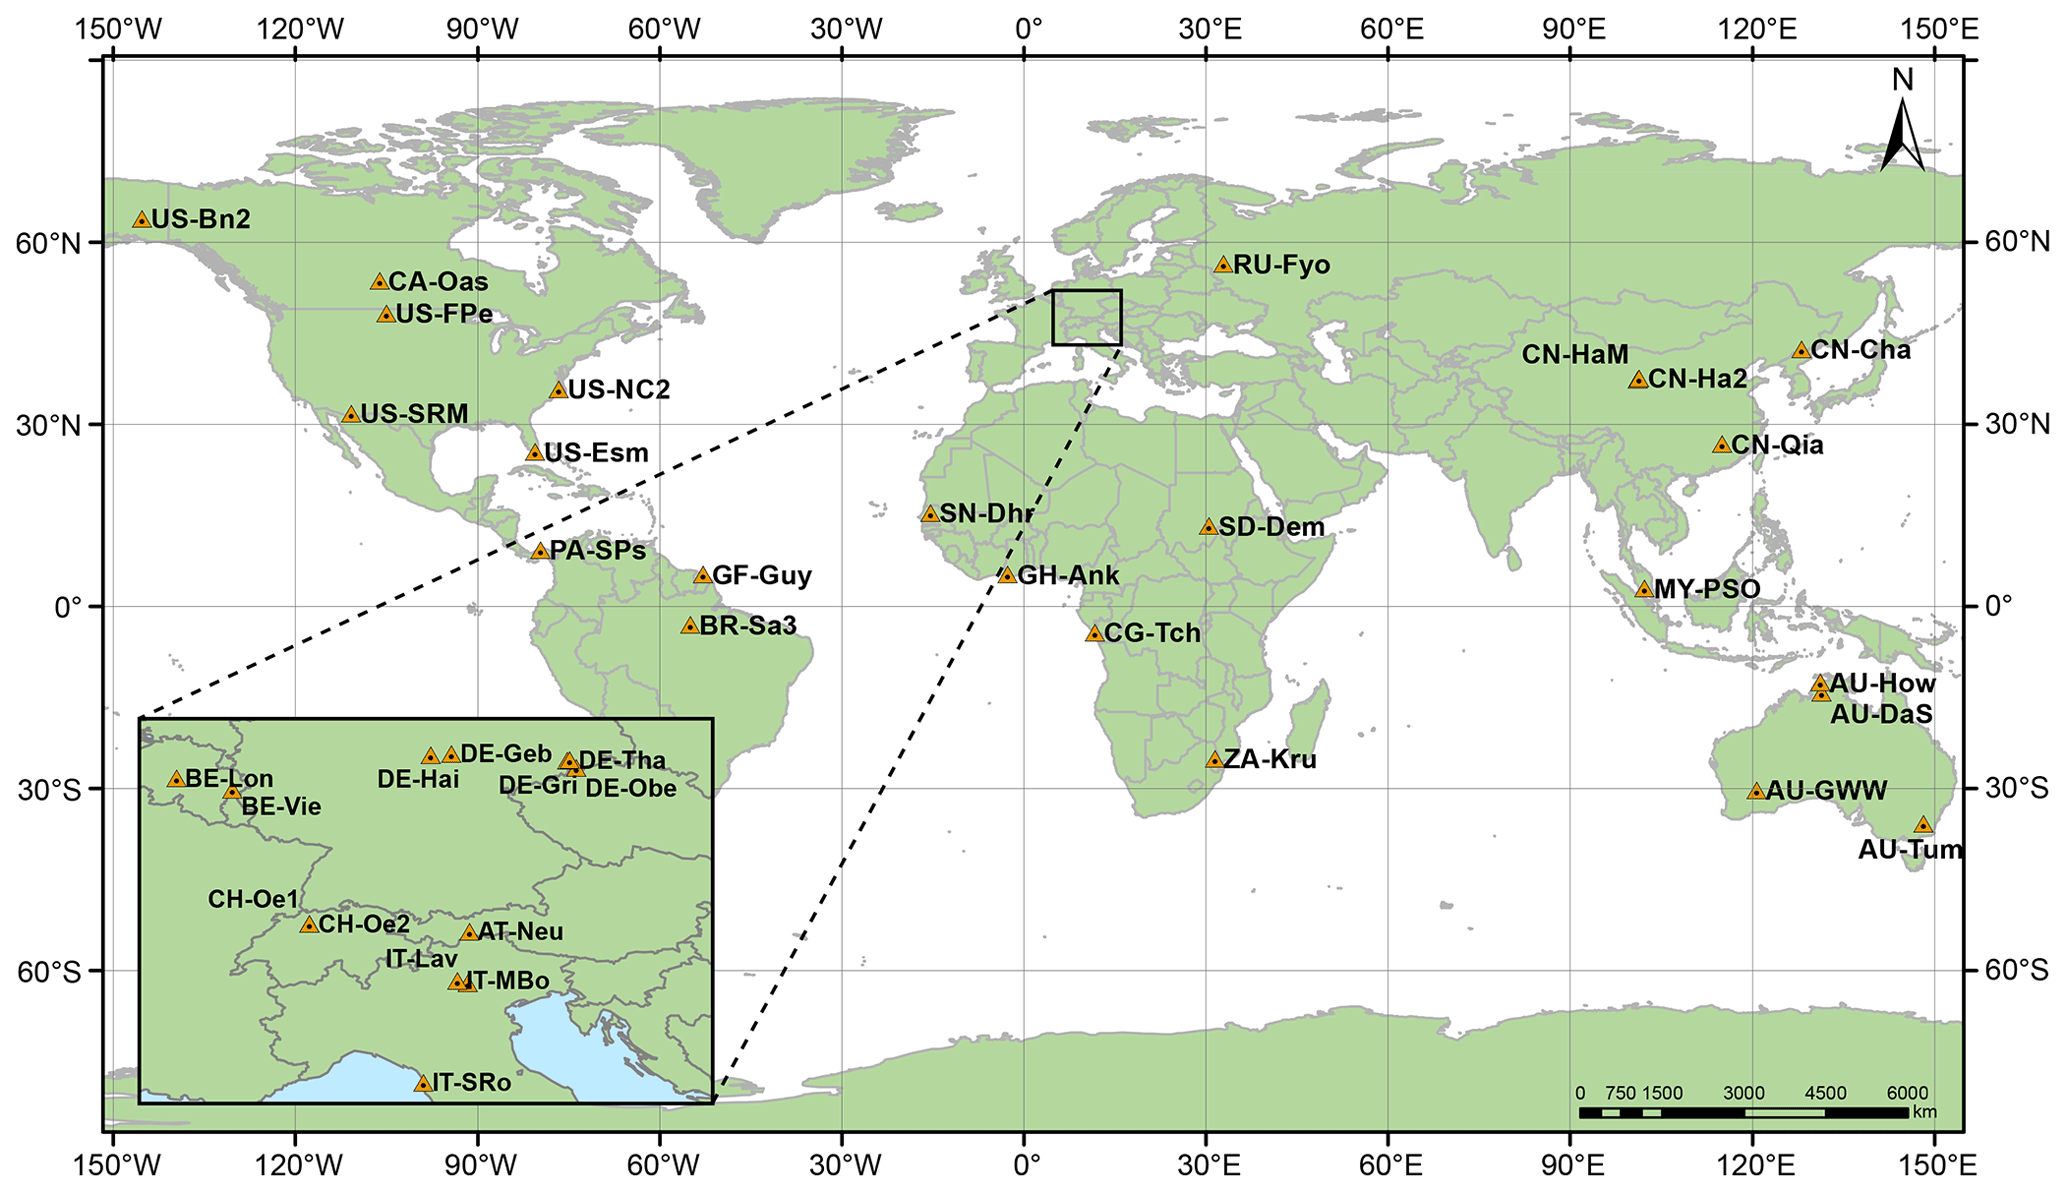
Figure 1The sites selected from the FLUXNET data set are spanned over several continents and climates.
Scientists have tackled the problem of atmospheric light attenuation with mechanistic and statistical approaches. While the former deal with the physical and chemical processes governing light attenuation, the latter use large numbers of observations to infer patterns of variability caused. Two indices are widely used to quantify the random nature of atmospheric light attenuation, the clear-sky index (c) (see Tran, 2013; Harrouni, 2008; Ianetz and Kudish, 2008; Allen et al., 2006; Hansen, 1999; Skartveit and Olseth, 1992; Bendt et al., 1981; Gordon and Hochman, 1984; Liu and Jordan, 1960), defined as the ratio of actual radiation to clean-dry atmosphere radiation, and the clearness index (k) (see Engerer and Mills, 2014; Hollands and Suehrcke, 2013; Ianetz and Kudish, 2008; Polo et al., 2008; Olseth and Skartveit, 1984), which is the ratio of actual radiation to top-of-the-atmosphere radiation (i.e. with no atmospheric attenuation). Although c and k can be calculated for any spectral band and time aggregation scale, they are often studied at the hourly or daily time steps and for the shortwave band (e.g. Utrillas et al., 2018; Cañada et al., 2003; Martinez-Lozano et al., 1999). Notice that because of the different physical mechanisms involved in the magnitude, frequency and duration of clouds, water vapour and aerosols across the globe, c and k must show statistical properties related to regional and local climate.
In this paper, we analyse the statistical properties of c and k at 37 FLUXNET sites distributed worldwide (Sect. 2) looking for climate-related variability patterns. We process historical extraterrestrial spectral irradiance data from the SOLID project (Sect. 2) by using mechanistic models – solar geometry and the Beer–Lambert law (Sect. 3) – to remove the deterministic component of historical daily solar radiation observations. Then, we analyse the probability distribution function of c and k in relation to global climate regions, Köppen climate types and Holdridge life zones (Sects. 4 and 5).
Characterising the stochastic behaviour of surface solar radiation is of great importance in many research fields, e.g. photovoltaic electricity generation, photosynthesis, nutrient dynamics in ecosystems, water dynamics in soils, solar power forecasting and forest fire risks (e.g. Muñoz, 2019; Engerer and Mills, 2014). Of special interest are the ecohydrological and biochemical models of Rodríguez-Iturbe and Porporato (2004) and collaborators (e.g. Schaffer et al., 2015; Tamea et al., 2011; Laio et al., 2009; Ridolfi et al., 2008; Nordbotten et al., 2007; Daly et al., 2004a, b; Manzoni et al., 2004; Porporato et al., 2003; D'Odorico et al., 2000), which have made great progress since the beginnings of the 20th century. All these remarkable works, however, have been oriented to water-limited ecosystems, where uncertainty is introduced by the rainfall process only. To study energy-limited ecosystems, daily solar radiation is required as one more external variable driving evaporation and transpiration processes. Solar radiation is also a random variable, since it highly depends on atmospheric transmittance, especially that of clouds (Muñoz et al., 2020). This paper has the purpose of establishing a framework for daily solar radiation characterisation that serves as a base for developing the ecohydrology of energy-limited ecosystems.
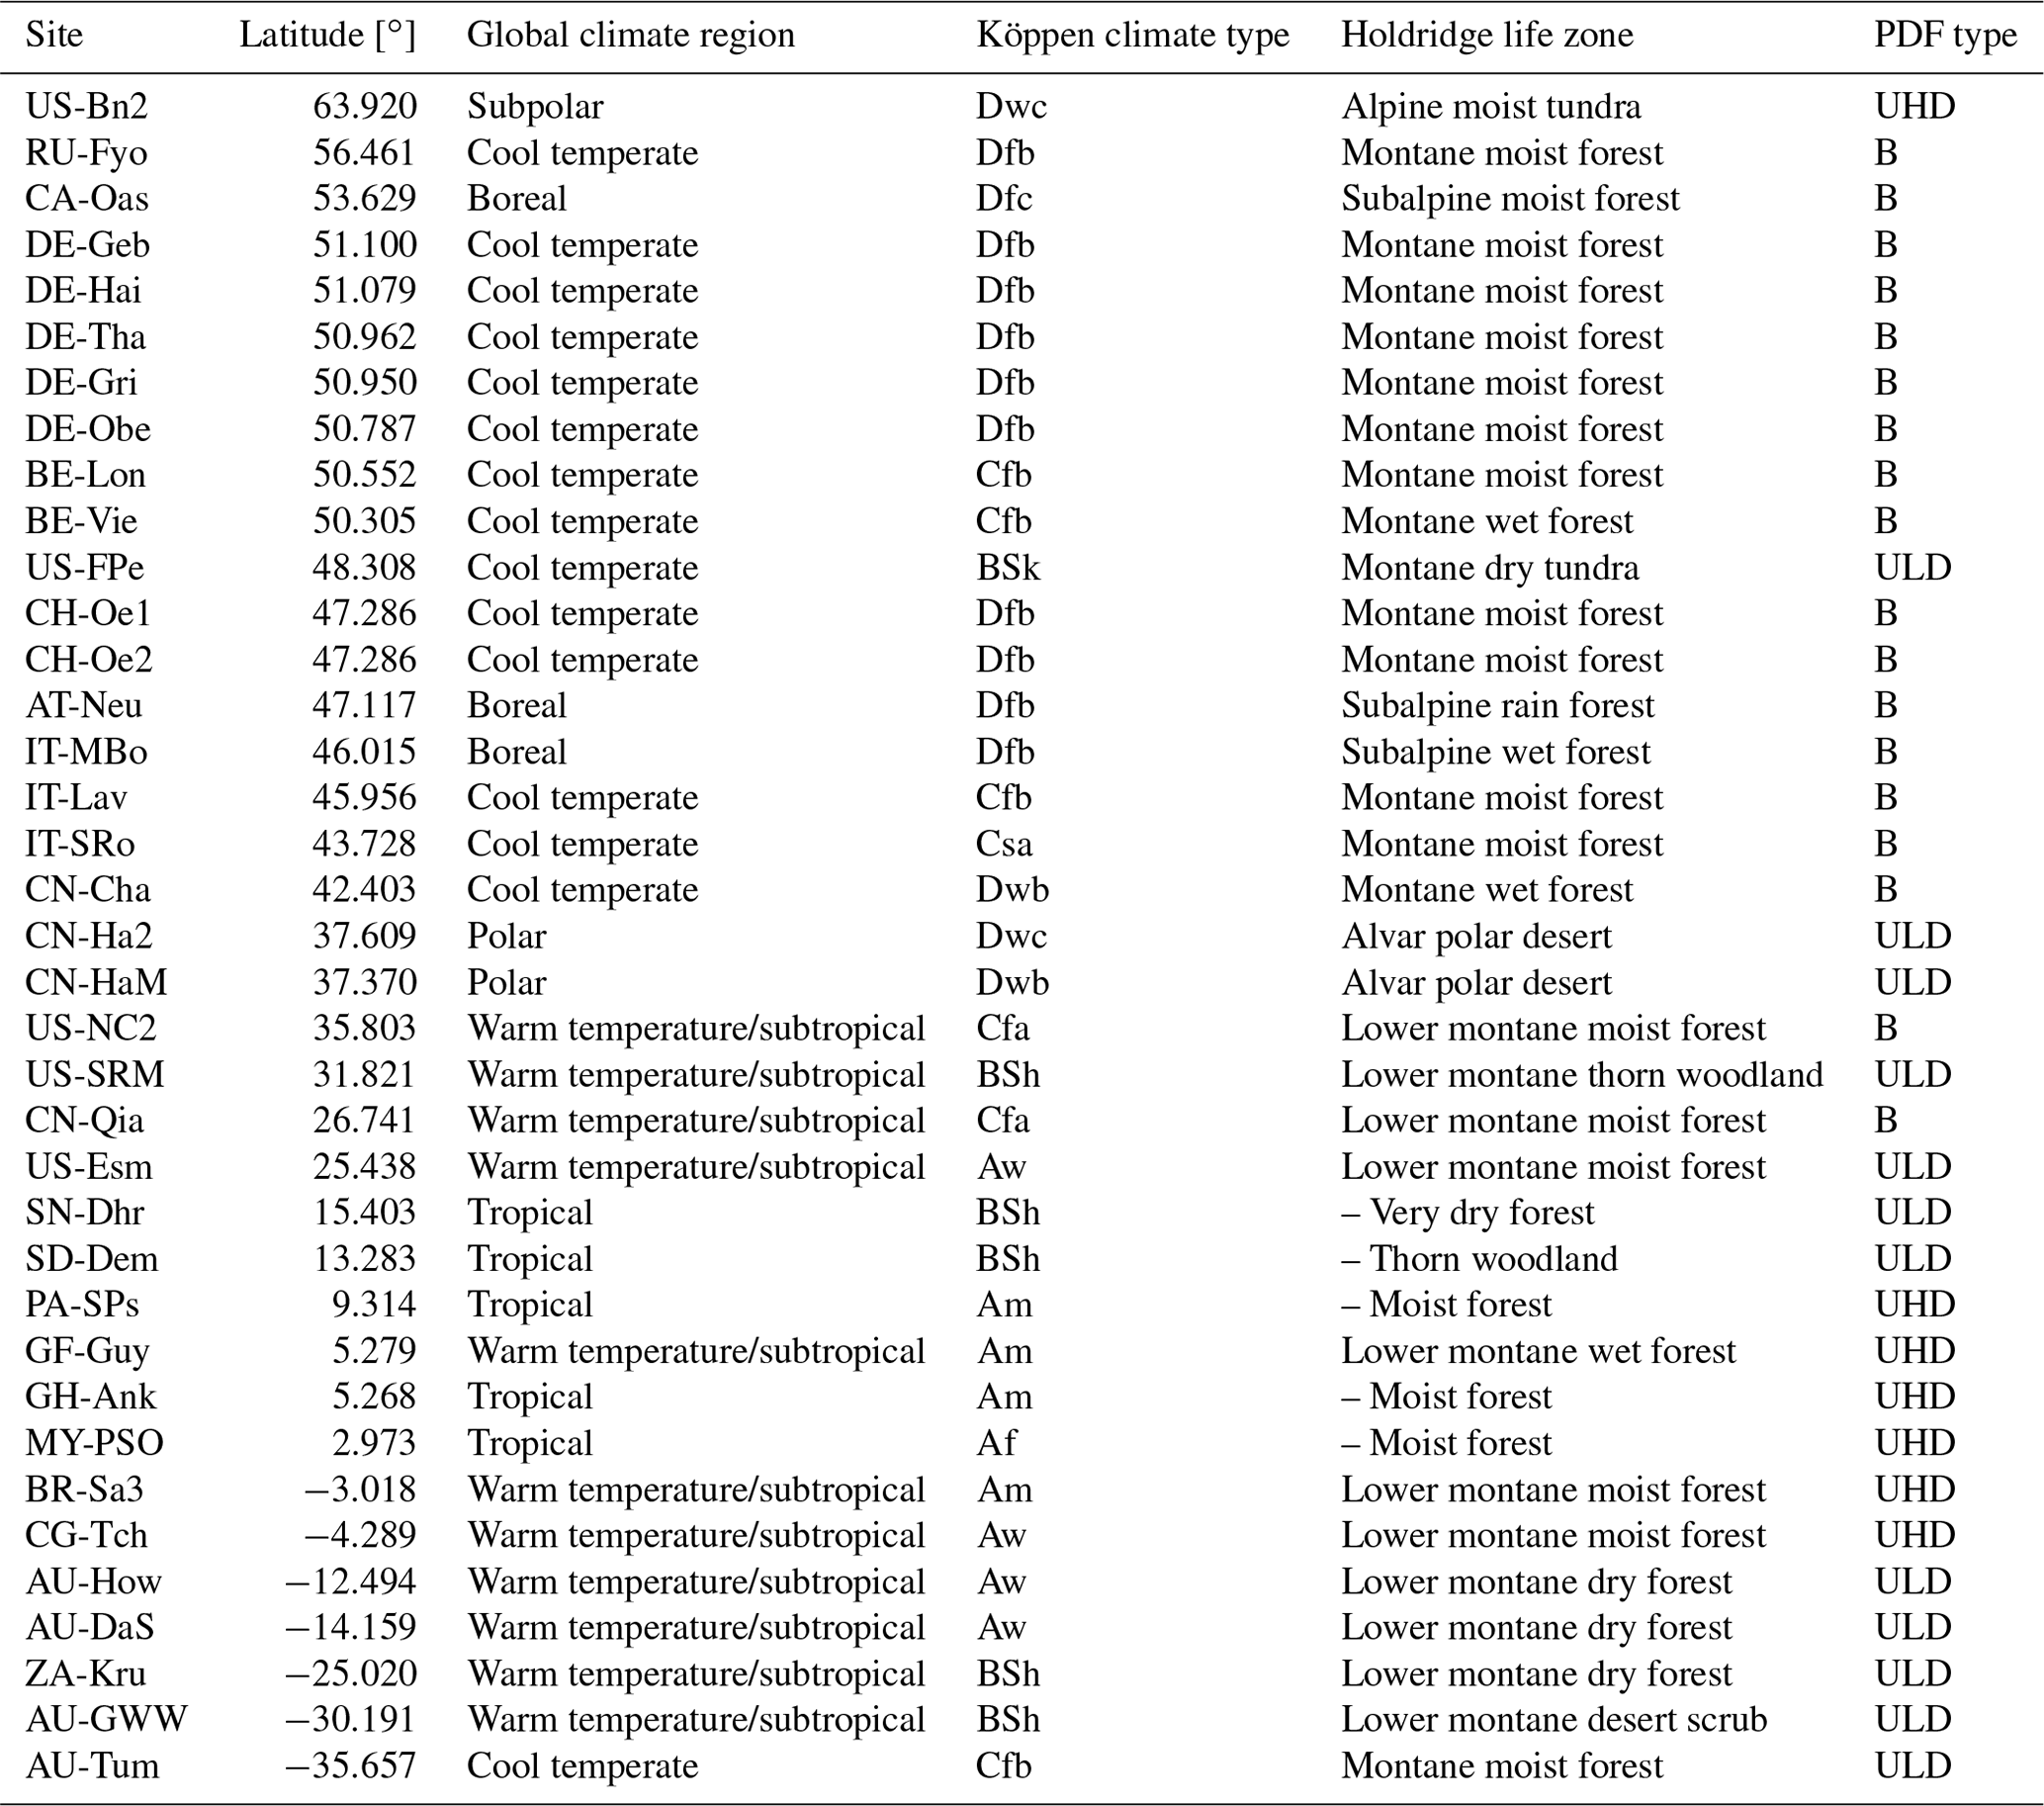
Table 1FLUXNET sites. The record period refers to complete calendar years, i.e. data for all sites start on 1 January of the initial year and end on 31 December of the last year.
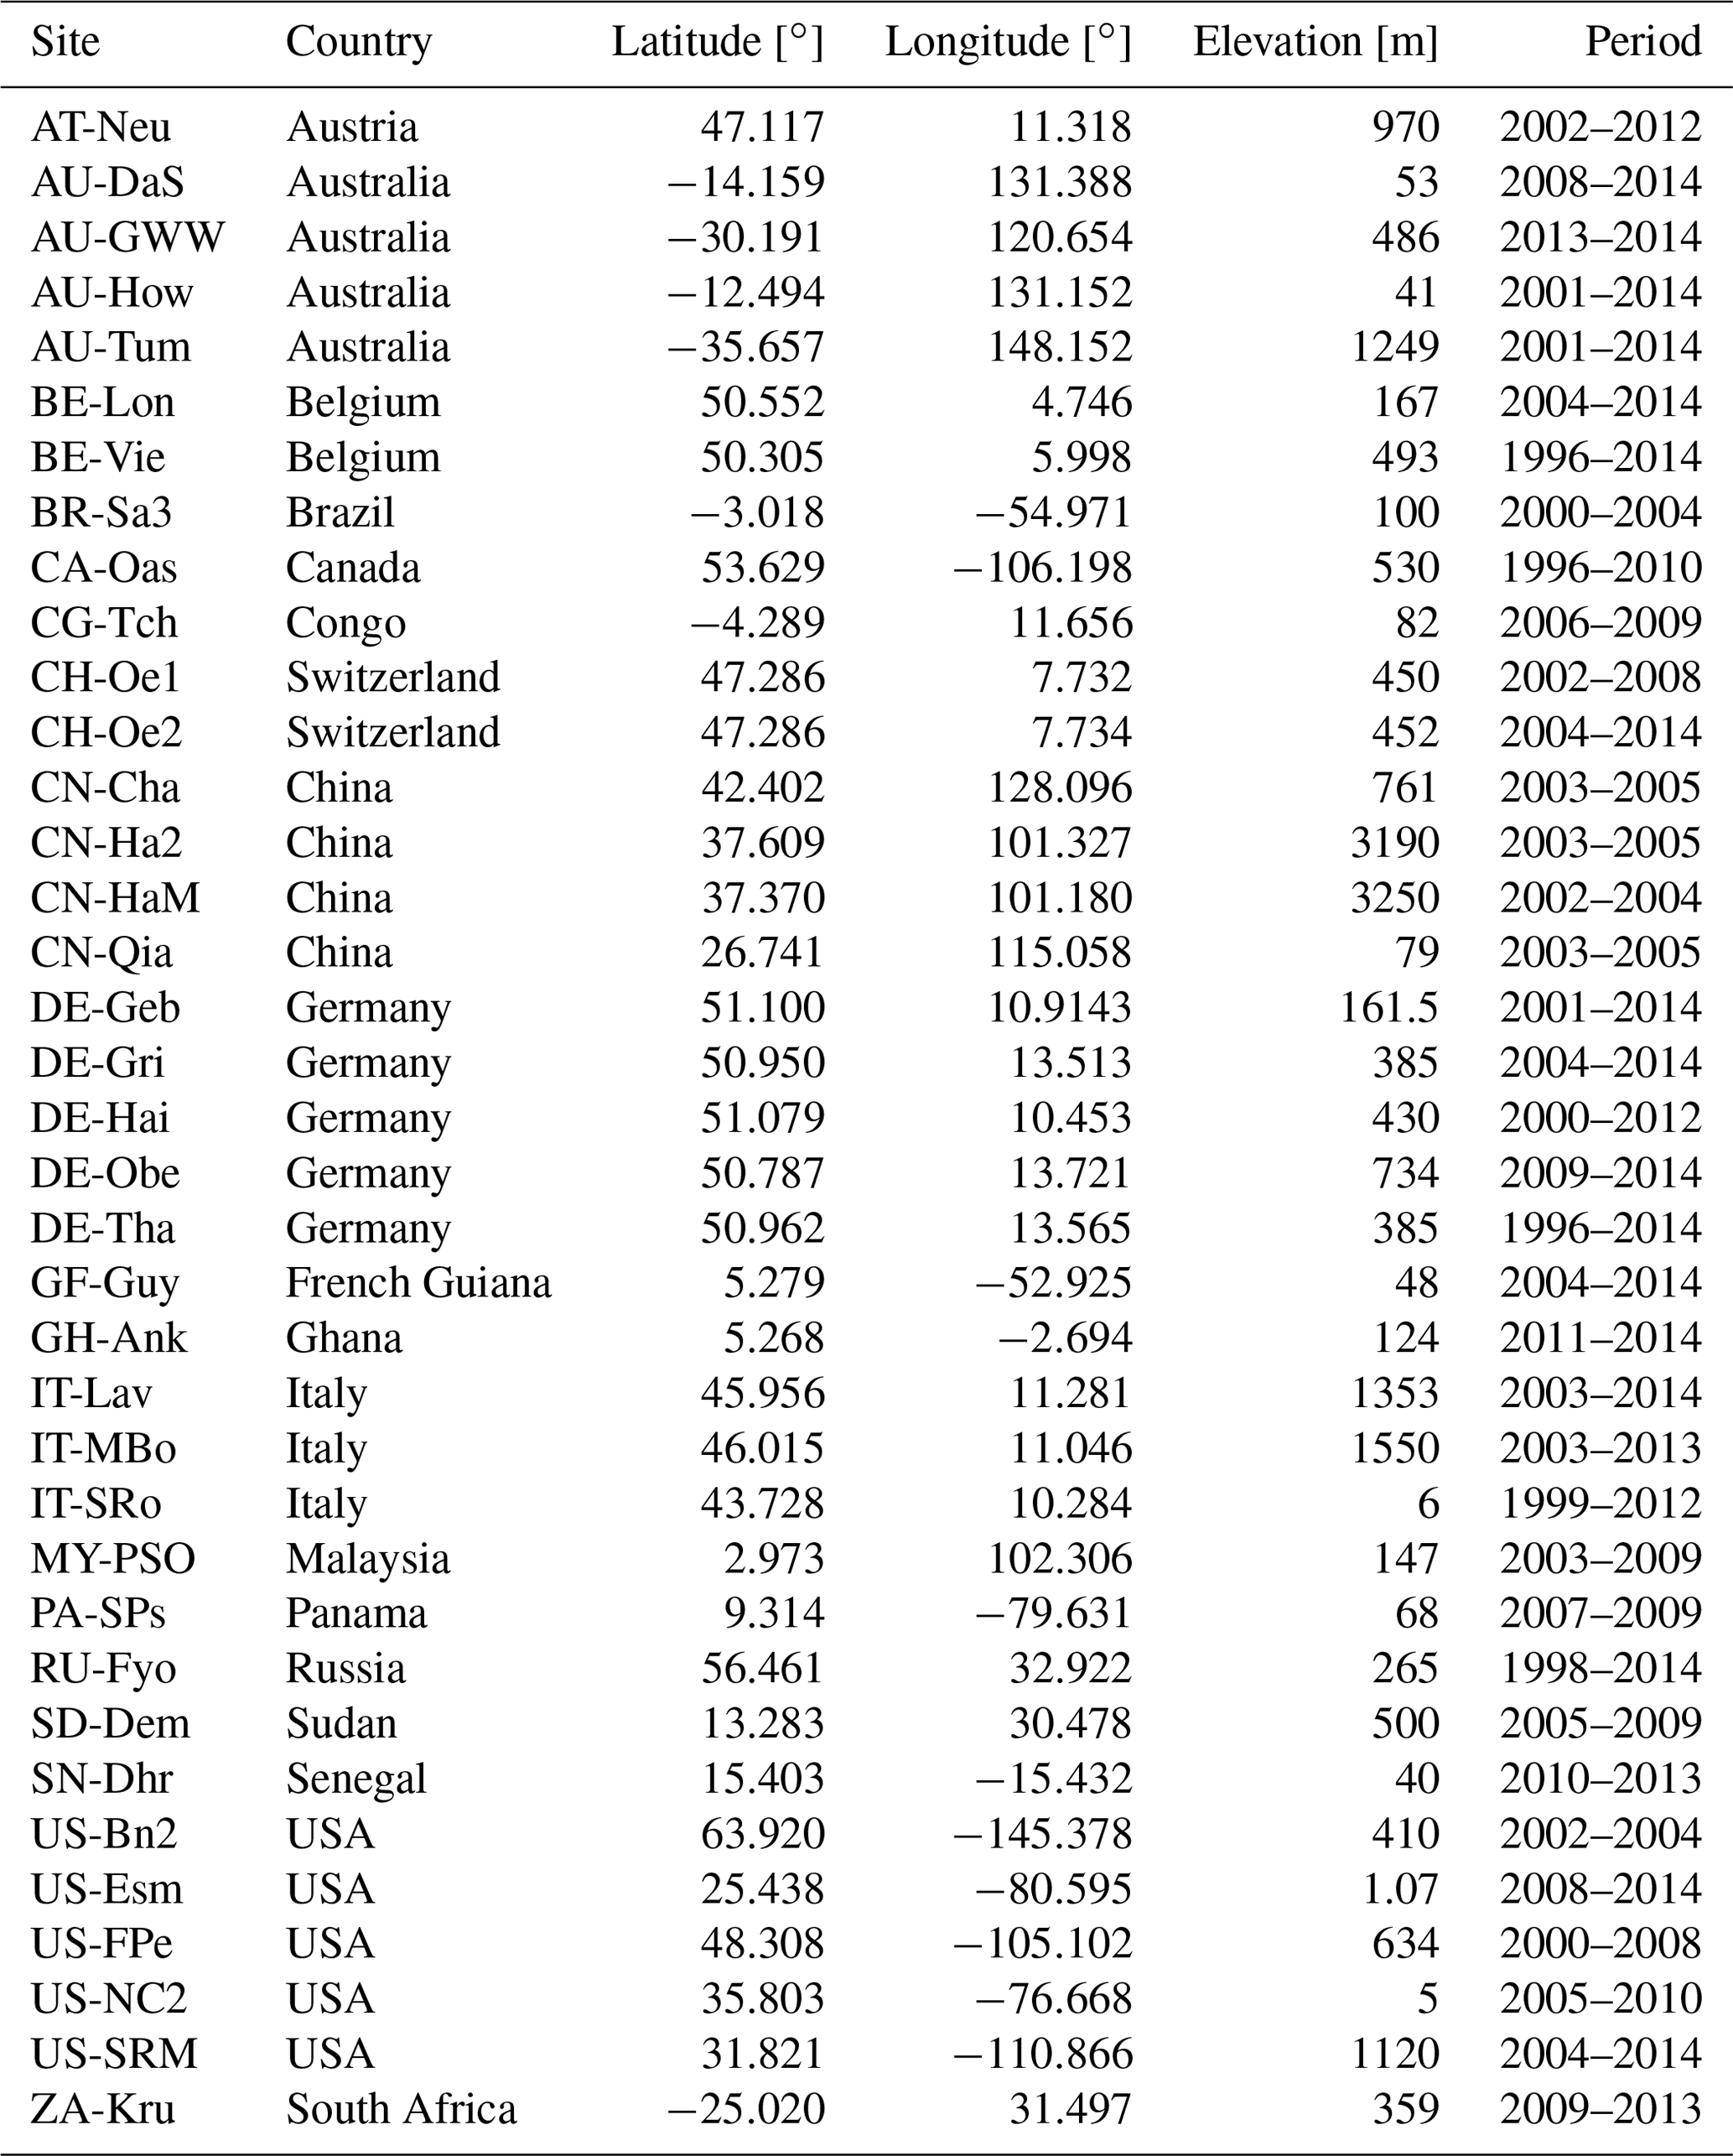
Our data set comprises daily observations of incoming solar radiation and rainfall from 37 sites around the world from the FLUXNET data set (Baldocchi et al., 2001; Olson et al., 2004) (Fig. 1). We analyse two spectral bands, the photosynthetically active radiation (PAR) and the shortwave radiation (SW). While SW observations are available at all sites, PAR observations are available at 28 sites only. Sites have different periods of record spanning from 1996 to 2014 and elevations from sea level to 1550 m (Table 1). These sites were selected from an initial set of more than 200 sites after filtering by several criteria such as record length, data quality and spatial coverage of the whole group. FLUXNET PAR data are given as photosynthetic photon flux density (PPFD). The wavelength domain for PPFD in the FLUXNET data set is 400–700 nm (Olson et al., 2004) and has units of µmol m−2 s−1. We convert PPFD to PAR irradiance in W m−2 through the relationship 4570 nmol m−2 s−1 =1 W m−2 (Sager and McFarlane, 1997).
We use the solar spectral irradiance (SSI) at the top of the atmosphere from the “First European Comprehensive Solar Irradiance Data Exploitation project” (SOLID) (Haberreiter et al., 2017; Schöll et al., 2016) as input data for an atmospheric radiation transfer model (Sect. 3). The SOLID spectral time series has a daily time resolution from 11 July 1978 to 31 December 2014 (13 204 d) and covers the wavelength range between 0.5 and 1991.5 nm. Data from SOLID are available at http://projects.pmodwrc.ch/solid (last access: 14 March 2019).
In order to analyse the spatial climatic patterns of the random component of PAR and SW radiation, we use the Köppen climate classification from Peel et al. (2007), downloaded from the author's web page (https://people.eng.unimelb.edu.au/mpeel/koppen.html, last access: 14 September 2020), and the Holdridge life zones (Holdridge, 1947, 1967) from Leemans (1992), downloaded from UNEP-WCMC (https://www.unep-wcmc.org/resources-and-data/holdridges-life-zones, last access: 14 September 2020).
Daily radiation amount at a site on the Earth’s surface results from integrating instantaneous irradiance over the day length. Surface instantaneous irradiance estimation comprises solar irradiance at the top of the atmosphere (TOA) and the attenuation of light as it passes through the atmosphere for the site and time of interest. The clear-day and the clearness indices are two frequently used measures to assess atmospheric attenuation without dealing with the physics of the atmospheric attenuation process. The clear-day index (c) (also known as clear-sky index, relative clearness index and normalised clearness index) is defined as the ratio of observed radiation to theoretical radiation for a cloudless, clean and dry atmosphere (cda) at ground level (Eq. 1). The clearness index (k) is the ratio of observed radiation to theoretical radiation without atmosphere (which amounts to the same as radiation at TOA) (Eq. 2). While k assesses the whole atmospheric effect on radiation, c evaluates the effect of those atmospheric components that are highly variable in space and time, such as clouds, water vapour and aerosols.
The definitions of c and k in Eqs. (1) and (2) can be used for different time aggregation scales, spectral bands, radiation components (i.e. diffuse, beam, global) or surface orientation. We use them for daily global radiation on a horizontal surface for the SW and PAR spectral bands. While estimating k only involves geometric operations (Sect. 3.1), assessing c also requires calculating the cloudless, clean and dry atmosphere attenuation, for which we use the Beer–Lambert law (Sect. 3.2).
3.1 Daily radiation at the top of the atmosphere
Integration of the daily SSI over the spectral band of interest (400–700 nm for PAR and 285–280 nm for SW) gives the total spectral irradiance for each band (TSIPAR and TSISW) at TOA, as shown in Eq. (3). After some geometric transformations accounting for solar declination (δ) and latitude (ϕ) (Iqbal, 1983), the daily global radiation on a horizontal surface can be calculated as shown in Eq. (4).
Here E0 is the eccentricity correction factor of the Earth's orbit, and ωsr is the sunrise hour angle for the day.
3.2 Daily surface radiation for a cloudless, clean dry atmosphere
Daily horizontal surface radiation for a cloudless, clean and dry atmosphere (Hcda) is the sum of the corresponding direct (Hb) and diffuse (Hd) components, which we calculate separately. To calculate daily Hb and Hd, we first model the direct and diffuse instantaneous spectral irradiances at the ground level and then integrate them along the day length and both PAR and SW spectral domains. Following Iqbal (1983), we assume the cloudless, clean and dry atmosphere to be composed by uniformly mixed gases (m) and ozone (o). Using the Beer–Lambert law and integrating, daily Hb is calculated as in Eq. (5).
where SSI is the extraterrestrial spectral irradiance normal to the rays from the sun (obtained from SOLID), γ is the solar altitude varying from sunrise (sr) to sunset (ss), and τma, λ is the transmittance due to the molecular absorbers of the cda atmosphere.
For the assumed atmosphere composition , where τo and τg are the ozone and the mixed-gas transmittance, respectively (see details in Iqbal, 1983, Sect. 6.14). We arbitrarily assumed forward and backward scatterances of 0.5 and considered only the first pass of radiation through the atmosphere. Although higher reflectances could bring about some subestimation of H, especially during snow-cover periods, we think it is not a critical issue for the sake of this study. Uncertainty caused by these two assumptions will be included in the statistical properties of c. Hd can then be calculated by Eq. (6).
where τr, λ is the transmittance due to Rayleigh molecular scattering (see details in Iqbal, 1983, Sec.6.14).
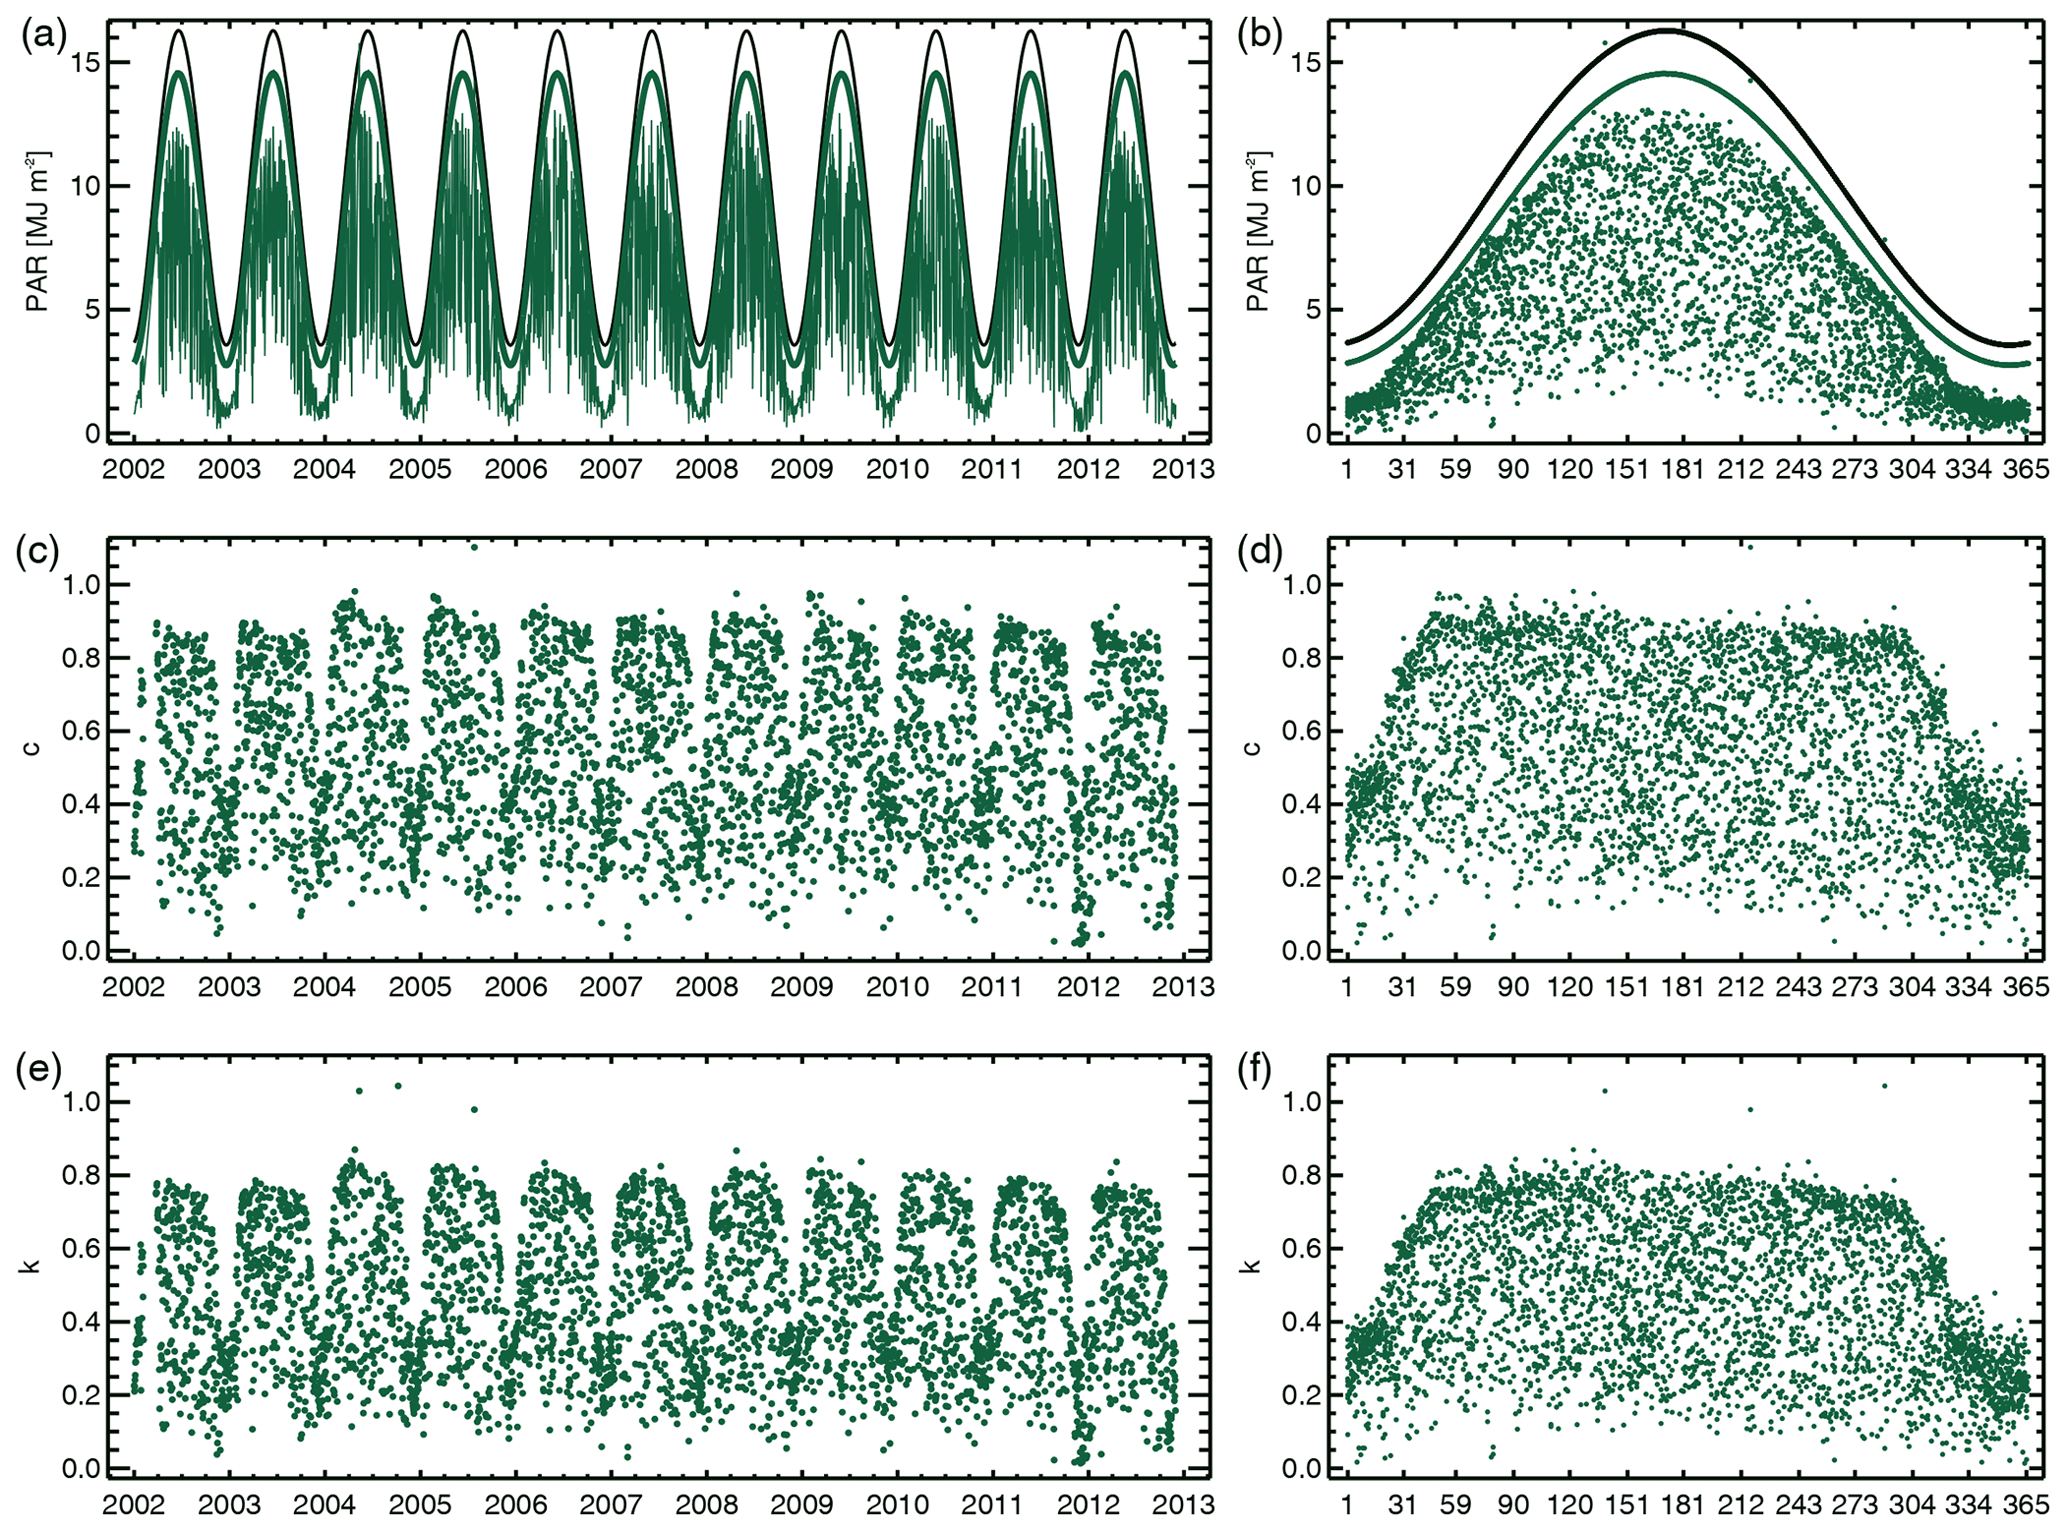
Figure 2Time series and annual cycle of PAR (a, b), c (c, d) and k (e, f) at AT-Neu. Solid black and green lines in panels (a) and (b) indicate PAR0 (no atmosphere) and PARcda (clean and dry atmosphere), respectively. Thin lines in (a) and points in (b) show PARobs.
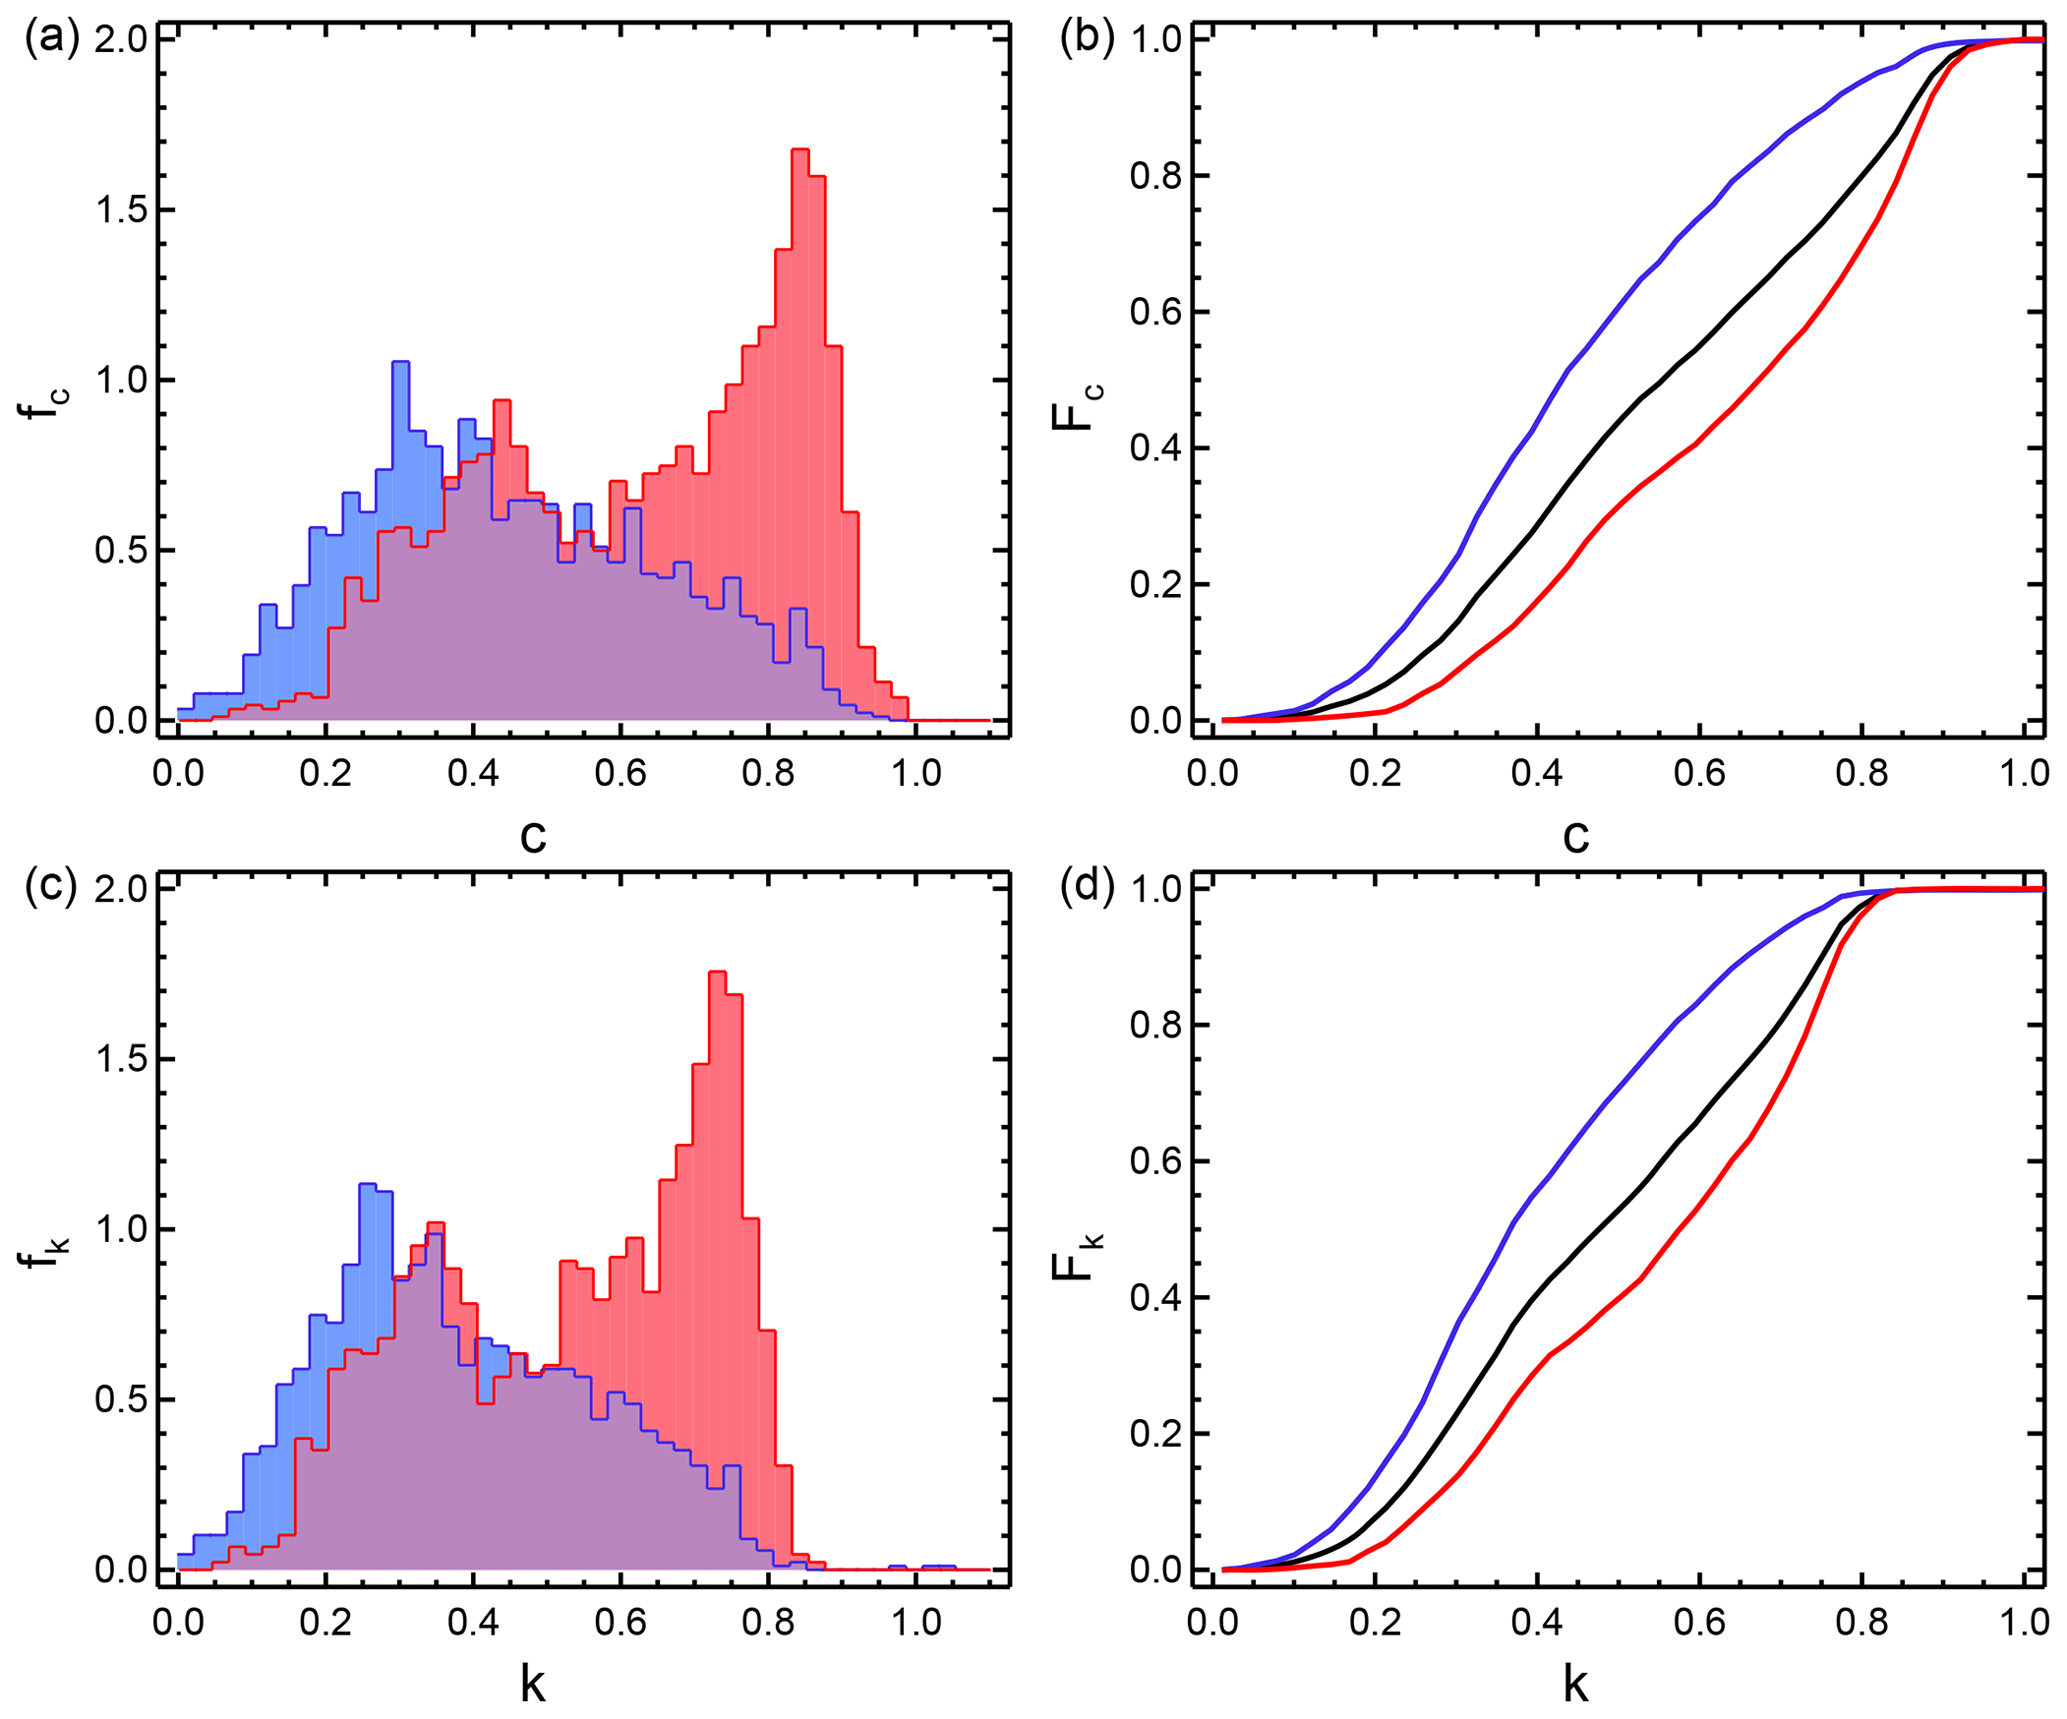
Figure 3PDFs (a) and CDFs (b) for rainy (blue) and dry (red) days of c (a, b) and k (c, d) for PAR at AT-Neu.
Several atmospheric parameters are required by Eqs. (5) and (6). We assume the 1976 US standard atmosphere (NASA, 1976) (sea level pressure of 101.325 kPa, sea level temperature of 288 K and sea level density of 1.225 kg/m3) and the Kasten and Young (1989, Table II) optical air mass function of solar altitude, which has 336 values for solar altitudes between 0∘ and 90∘. Transmittance for ozone and mixed gases is calculated as in Eqs. (7) to (9).
Here mr is the relative air mass at standard pressure, ma is the relative air mass at actual pressure, ko and kg are the absorption attenuation coefficient for oxygen and mixed gases, and lo is the amount of ozone in centimetres (at normal temperature and pressure, NTP). We calculate ko, λ for any λ value using the Leckner (1978) interpolation of the classic Vigroux (1953) data. For calculating lo we interpolate, for each latitude and day of the year (doy) of interest, the Table 5.3.2 from Iqbal (1983), which gives the monthly total amount of ozone in a vertical column of air for several latitudes (Iqbal's table is a reproduction of Table 4.2 from Robinson, 1966, p.114). ko,λ is calculated by interpolating Table 6.13.1, which is a reproduction of Table 4 in Leckner (1978, p.146).
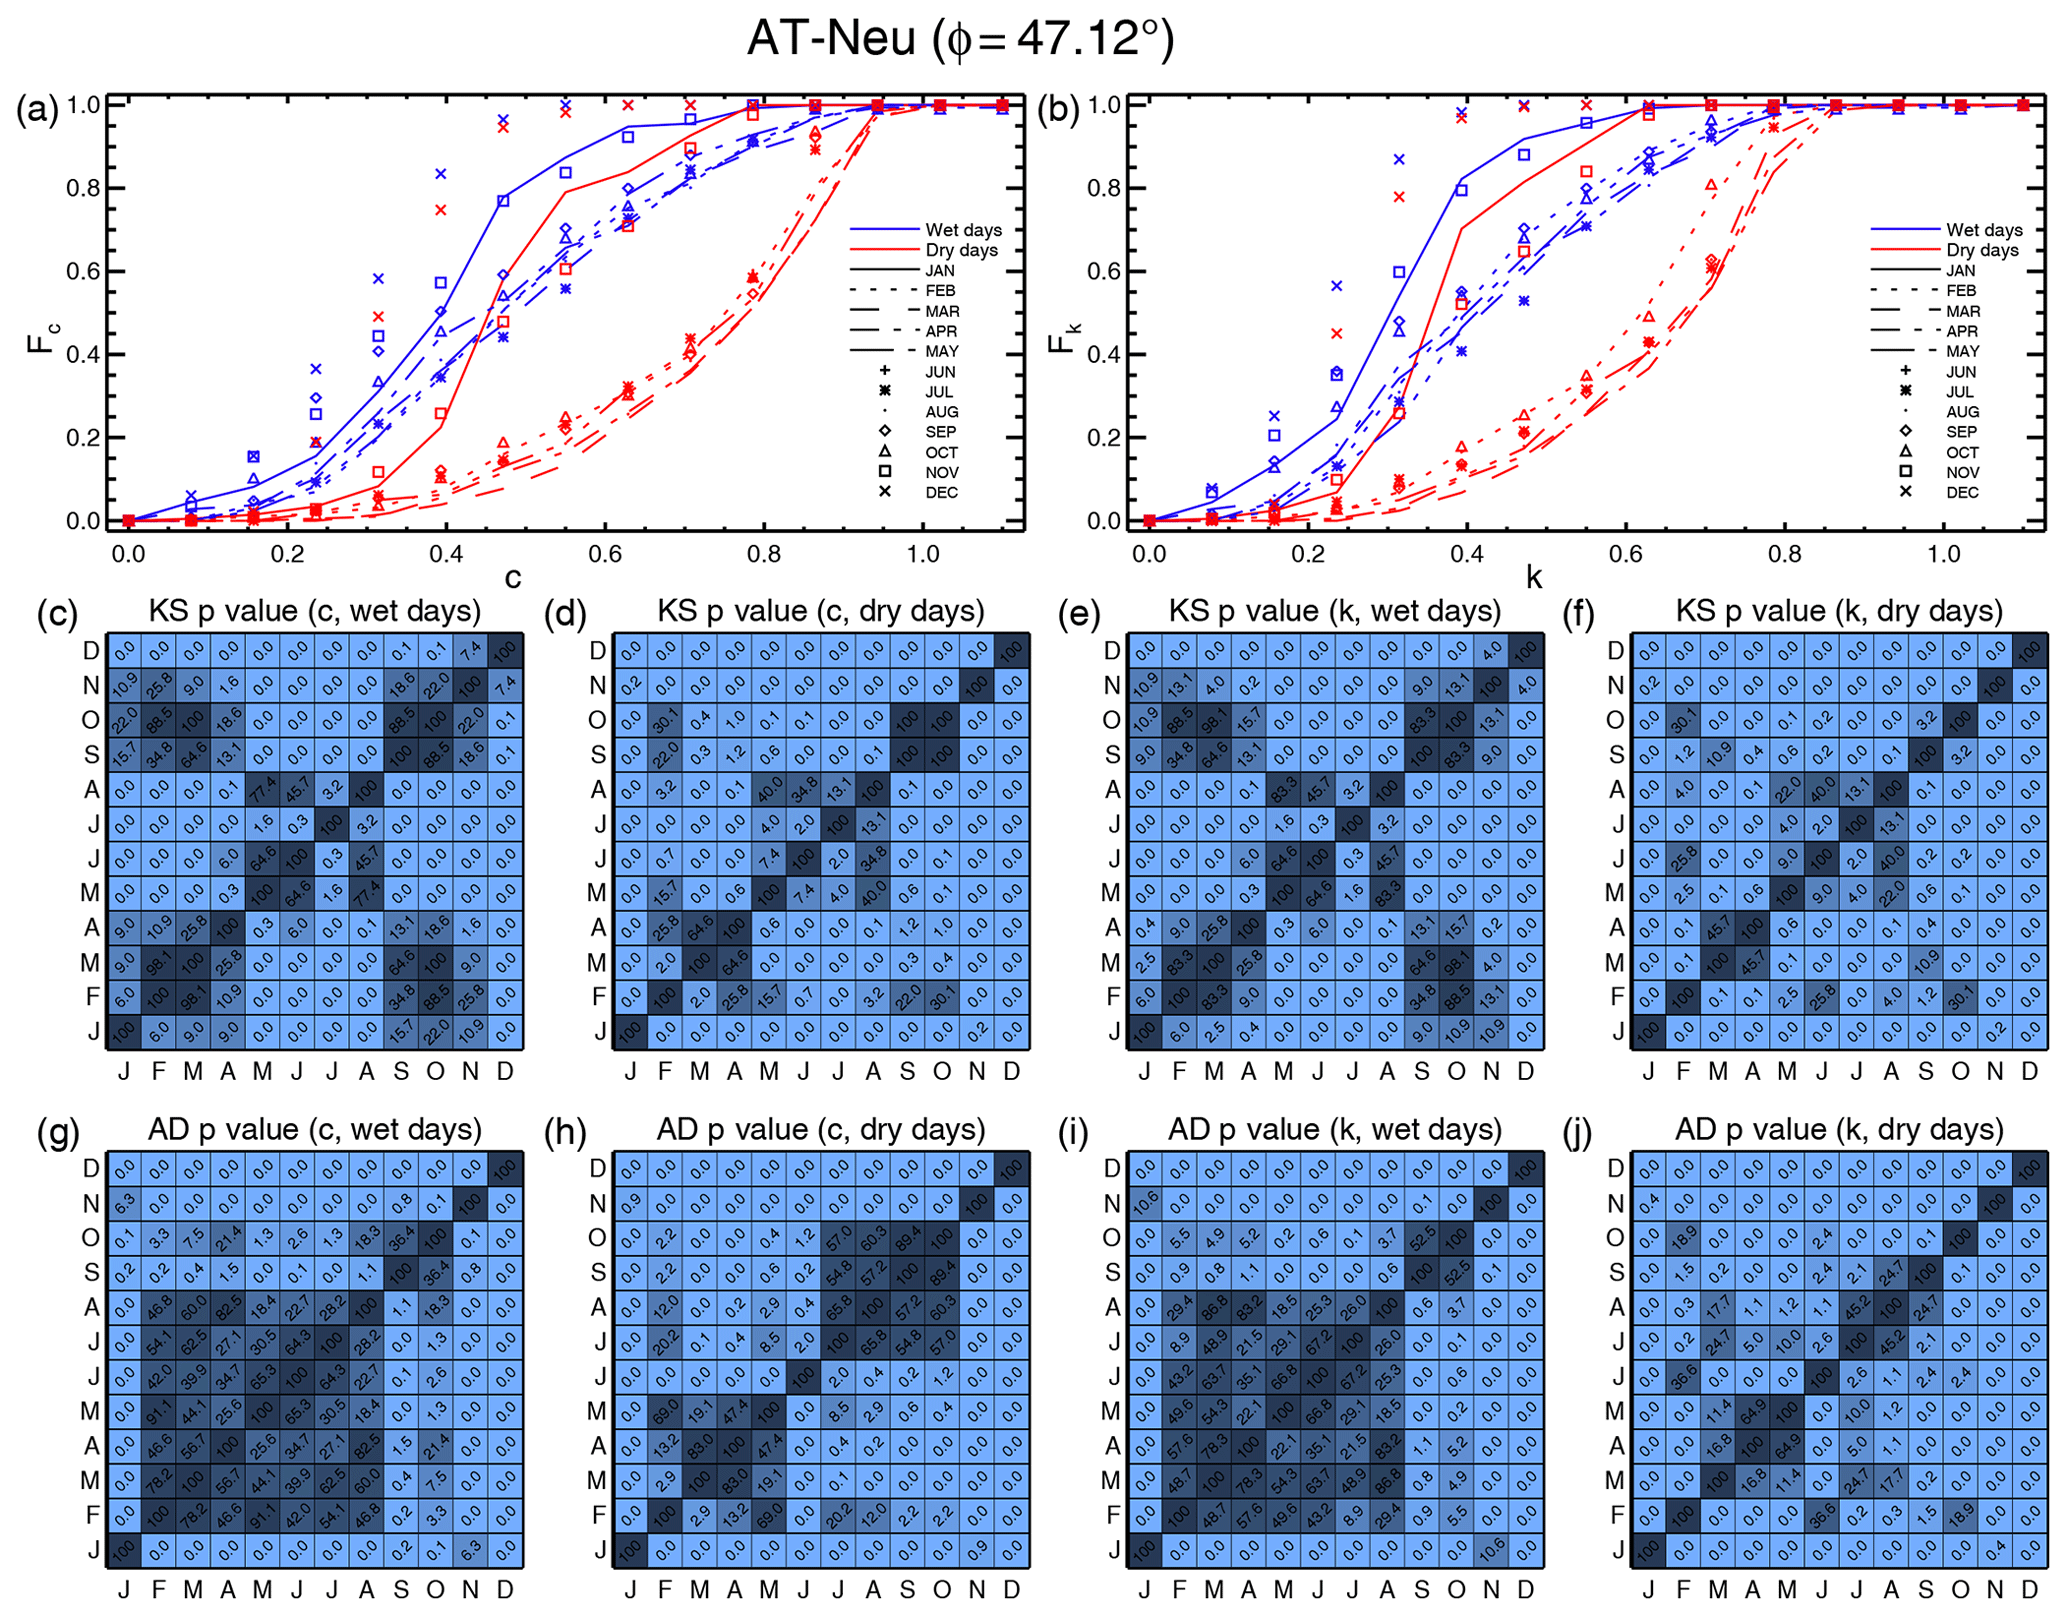
Figure 4Monthly CDFs of c (a) and k (b). The p value of the two-sample KS and AD tests applied to all combinations of monthly CDF of c and k during wet (blue) and dry (red) days at AT-Neu (c–j). The p values are multiplied by 100 to show more decimals using less space.
3.3 Statistical properties of k and c
After the process is described in Sect. 3.1 and 3.2, we calculate daily time series of c and k by using the expressions in Eqs. (1) and (2) for the SW and PAR spectral bands. Then, we estimate the mean annual cycle and empirical probability density functions (PDFs) of H, c and k for both bands. We separate the data samples of c and k by humid and dry days, using precipitation data as a proxy of cloudiness and water vapour in the atmosphere. Finally, we examine the seasonality of c and k by comparing the cumulative distribution function (CDF) of each month with the CDFs of the other months. Comparison is carried out visually and tested by using the Kolmogorov–Smirnov (KS) and the Anderson–Darling (AD) goodness-of-fit tests (Dodge, 2008; Pearson, 1900; Scholz and Stephens, 1987). KS is maybe the more frequently used test for comparing distributions. AD makes a good complement to the KS test because it is more reliable to detect differences at the extremes of the distribution (Engmann and Cousineau, 2011).
Table 2Climate classification and k and c PDF type of all sites. Table is sorted by decreasing latitude.
Plots of the time series and the mean annual cycle of daily PAR, c and k at AT-Neu – a site with long and high-quality records – are shown in Fig. 2. Analogous figures for all studied sites are available in the Supplement. Although both PAR and SW radiation and their corresponding c and k exhibit annual seasonality in the maximum values, they take values spanning over their whole domain nearly all year round. Separating the data into the rainy days and the dry days allows estimation of the corresponding conditional PDFs and CDFs (Fig. 3 for AT-Neu, all other sites in the Supplement). Repeating this process for each month reveals the existence (or not) of seasonality in the PDFs and CDFs (Fig. 4 for AT-Neu, all other sites in the Supplement).
Inspection of the PDFs of all sites (see Supplement) led us to define three types of PDF according to the shape of the functions, namely unimodal with low dispersion (ULD), unimodal with high dispersion (UHD) and bimodal (B). The three types of PDFs are illustrated in Fig. 5a.
Looking for climate-related regionalisation patterns, the c and k PDF type was compared to the global climate region (Fig. 5b), the Köppen climate classification (Fig. 5c) and the Holdridge life zones (Fig. 6). An in-depth inspection of the plots of all sites allowed us to set out the following statements: (a) the same behaviour is observed for c and k at each site, (b) latitude is not enough to explain the shape of the PDFs, (c) Köppen climate types show a more clear pattern than global climate regions and (d) Holdridge life zones show the clear-cut pattern of variability of the PDF types. Table 2 summarises these results and the Köppen and Holdridge classifications of each site.
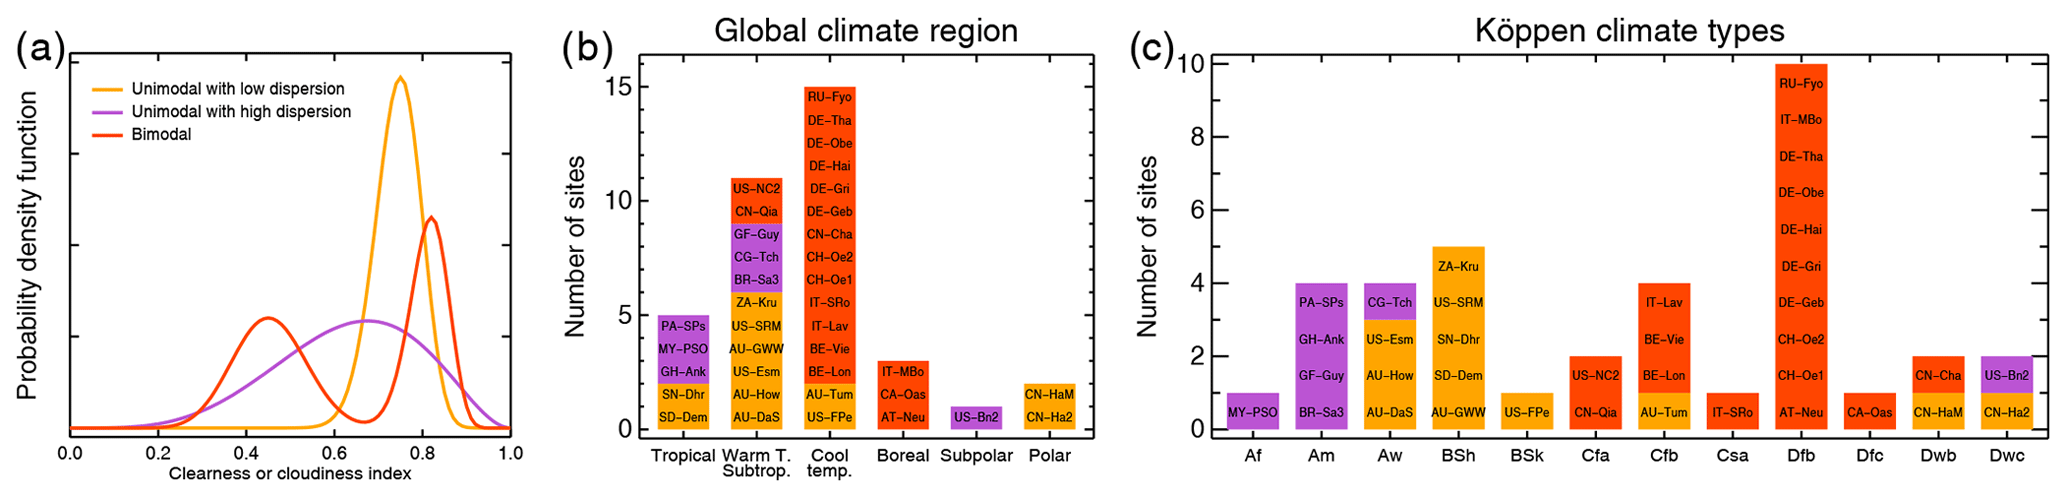
Figure 5Panel (a) shows a scheme of the three PDF types of k and c. Panels (b) and (c) show the climatic distribution of the identified PDF types for the 37 case studies.

Figure 6Plotting all sites in the Holdridge life zone triangle shows three groups of sites with the same c and k PDF shape. Red symbols represent bimodal, purple symbols unimodal with high dispersion and yellow symbols unimodal with low-dispersion PDFs.
We analysed the stochastic behaviour of the daily clearness and clear-sky indices for the PAR and SW spectral domains. Both indices remove the astronomical seasonality, and c also removes the seasonality of the clean- and dry-air optical mass. Therefore, c is arguably more effective at classifying sites based on their solar radiation characteristics than k. A few values of c and k greater than 1 occurred occasionally. This could happen because of multiple reflections of light, as is probably the case during winter at high latitudes. This could introduce important errors if we were performing a forecast work, but it is not so problematic in this study. The analysis of rainy and dry days revealed that c and k have the same PDF shape for both indices at each site. This result is obvious because the whole data sample was separated by rainy and dry days and both indices are designed to consider the effect of water in the atmosphere. This is also a reason explaining that the PDF shows the same shape type for the SW and the PAR bands.
Although radiation itself is a proxy of cloudiness (Nyamsi et al., 2019; Oliphant et al., 2006), we use rainfall to separate the data sample into rainy and dry days keeping in mind the connection of our stochastic description of attenuation with the family of stochastic models of Rodríguez-Iturbe and Porporato (2004) and others. This way, bimodal distributions of c and k vanish in most of the cases when data are divided into rainy and dry days, reinforcing the idea that the modes are strongly related to clear and overcast sky conditions. Exceptions to this pattern occur in DE-Geb and DE-Hai (30 km distant) and AT-Neu (Fig. 4), where the PDFs of dry days still have a bimodal distribution. Despite DE-Geb and DE-Hai being only 30 km distant, local conditions are quite different. While DE-Geb is in a cropland at 162 m a.s.l. with a mean annual rainfall (MAP) of about 500 mm (Anthoni et al., 2004b, a), DE-Hai is in a deciduous broadleaf forest at 430 m a.s.l. with a MAP of 750–800 mm. (Knohl et al., 2003). The high frequency of fog and low stratus occurring in central Germany (Rösner et al., 2020; Egli et al., 2017; Cermak et al., 2009) could be related to the physical mechanisms by which dry days still have bimodal distributions.
Results suggest the occurrence of the three PDF types described in Sect. 4. Our interpretation is that a general bimodal-shaped PDF could explain the three types. Following the nomenclature used in the ecohydrological models of Rodríguez-Iturbe and Porporato (2004) and collaborators (e.g. Tamea et al., 2011; Laio et al., 2009; Nordbotten et al., 2007; Manzoni et al., 2004; Porporato et al., 2003), let λ be the probability of occurrence a rainy day. Let also x represent any of our indices c and k. The PDF of x can then be written as in Eq. (10).
where fR(x) and fD(x) are the conditional PDF of x for rainy and dry days, respectively. The family of this PDF shown in Fig. 7 has members with one and two modes. The UHD-type PDF emerges in the marginal function f(x) when the two modes of fR(x) and fD(x) are close to each other.
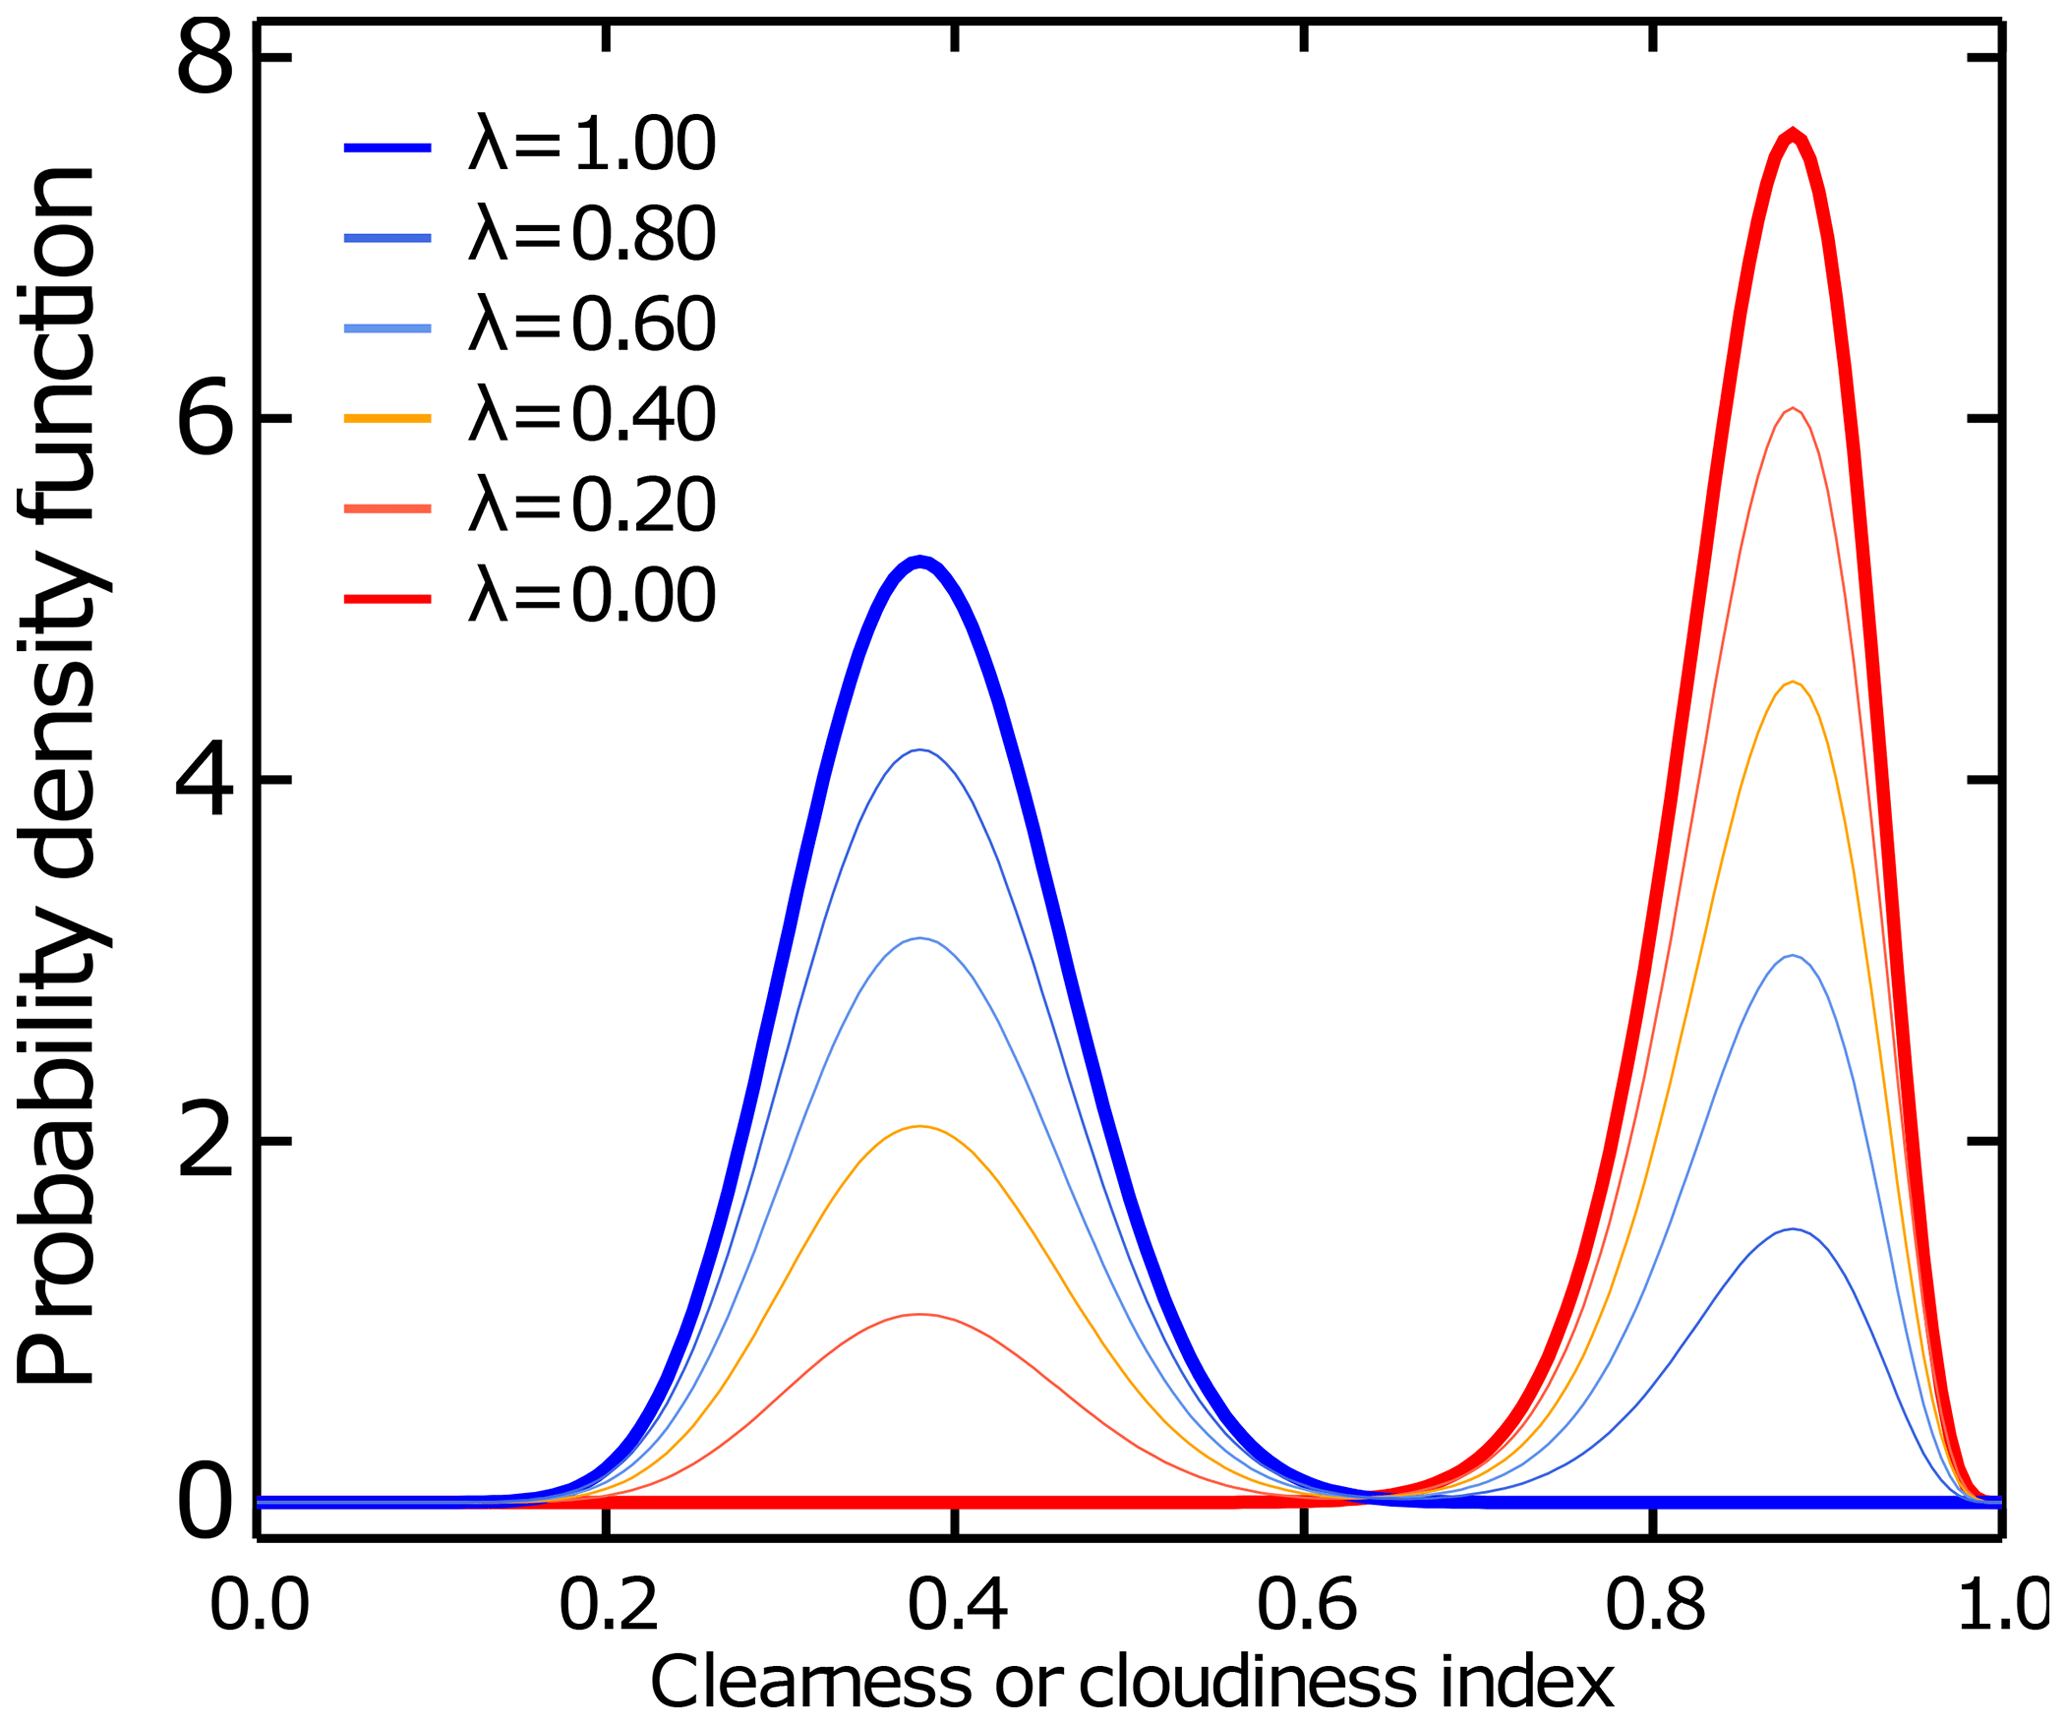
The general model of Eq. (10) is also useful to understand the climate influence on the marginal PDF of c and k. If λ→0 (i.e. in very dry sites), the c and k PDFs are of the ULD type and result from solar geometry and the permanent constituents of the atmosphere. If λ is not so low, the PDF will be of the UHD type where convection is the main driver of cloud formation and of the B type where cloud dynamics is controlled by larger-scale phenomena such as atmospheric jets and meteorological fronts (Boucher et al., 2013). Obviously, as λ→1, the c and k PDFs will approximate those of the humid days, no matter the physical mechanisms.
5.1 Regionalisation
As shown in Table 2 and Fig. 5, latitude and global climate regions have a weak relation with the PDF types, with ULD occurring in the tropical, warm tropical, subtropical and cool temperate regions; UHD in tropical and subtropical regions; and B-type PDFs in warm tropical, subtropical, cool temperate, and boreal regions. There is also one UHD site in the subpolar region and two ULD sites in the polar region. In summary, there is no clear pattern of PDF type variability when grouped by latitude or global climate regions.
The Köppen classification system performs better than global climate regions to capture the PDF type variability (Fig. 5). C climates (Cfa, Cfb, Csa) and Df climates (Dfb and Dfc) have a clear predominance of the B-type PDFs, except for one site in Australia (AU-Tum). B climates (BSh and BSk) and Aw climates (with one exception) are all of the ULD type. Am climate is UHD, and a variety of PDF types occur in the Dwb and Dwc climates.
Plotting the sites on the Holdridge life zone scheme (see Fig. 6) reveals a clear-cut pattern of c and k PDF types. The Holdridge life zone triangle has the advantage of showing several climate variables independently. These variables are humidity, annual precipitation and potential evapotranspiration ratio. Boreal and cool temperate regions in the more humid provinces have PDFs of the B type, tropical regions in the humid provinces show PDFs of the UHD type, and the dry provinces show all ULD-type PDFs. Two isolated sites occur at the top of the triangle, two ULD sites in the polar desert of China and one UHD site in Alaska (see map in Fig. 1).
We inspected 37 sites worldwide for the influence of local climate on statistical properties of clearness and clear-day indices. We identified three types of statistical behaviour according to the PDF shape, namely ULD, UHD and B. The same PDF type was found to occur for c and k at each site for both PAR and SW radiation bands. It was evidenced that latitude is not enough to explain the shape of the PDFs, suggesting that climate could play an important role. Global climate region and the Köppen climate have a stronger relation than latitude with the PDF types. Holdridge life zone classification showed the most clear-cut pattern of variability of the PDF types. We proposed a general mathematical model for the PDF of c or k that has the ULD, UHD and B types as particular cases. This model constitutes an important basis for biogeochemical modelling in energy-limited ecosystems, especially in ecohydrology, but also in meteorology, glaciology, agroclimatology and other research fields.
The data used for the analysis are accessible in Muñoz and Ochoa (2021). Radiation, clearness and clear-day indices at 37 FLUXNET sites, HydroShare, are provided: https://doi.org/10.4211/hs.7962c298ce544953be8d1dd6dab63bb0.
The supplement related to this article is available online at: https://doi.org/10.5194/bg-18-573-2021-supplement.
EM and AO conceived the idea. AO calculated the clear-sky daily radiation. EM did all the statistics. Both EM and AO analysed the results and wrote the manuscript. AO supervised the work.
The authors declare that they have no conflict of interest.
We thank Departamento Administrativo de Ciencia, Tecnología e Investigación de Colombia (Colciencias) for financial support by the programme “Becas de Doctorado Nacionales”. We also thank Universidad Nacional de Colombia for financial support through the programmes “Convocatoria nacional de proyectos para el fortalecimiento de la investigación, creación e innovación de la Universidad Nacional de Colombia 2016–2018” and “Convocatoria para el Apoyo al Desarrollo de Tesis de Posgrado de la Universidad Nacional de Colombia 2018”. Finally, we acknowledge the FLUXNET community and the SOLID project for sharing the data we used in this study.
This research has been supported by Ministerio de Ciencia, Tecnología e Innovación (grant no. 647) and Universidad Nacional de Colombia (grant nos. 44338 and 35813).
This paper was edited by Paul Stoy and reviewed by three anonymous referees.
Allen, R. G., Trezza, R., and Tasumi, M.: Analytical integrated functions for daily solar radiation on slopes, Agr. Forest Meteorol., 139, 55–73, https://doi.org/10.1016/j.agrformet.2006.05.012, 2006. a
Anthoni, P., Knohl, A., Rebmann, C., Freibauer, A., Mund, M., Ziegler, W., Kolle, O., and Schulze, E.: Forest and agricultural land-use-dependent CO2 exchange in Thuringia, Germany, Glob. Change Biol., 10, 2005–2019, https://doi.org/10.1111/j.1365-2486.2004.00863.x, 2004a. a
Anthoni, P. M., Freibauer, A., Kolle, O., and Schulze, E.-D.: Winter wheat carbon exchange in Thuringia, Germany, Agr. Forest Meteorol., 121, 55–67, https://doi.org/10.1016/S0168-1923(03)00162-X, 2004b. a
Baldocchi, D., Falge, E., Gu, L., Olson, R., Hollinger, D., Running, S., Anthoni, P., Bernhofer, C., Davis, K., Evans, R., Fuentes, J., Goldstein, A., Katul, G., Law, B., Lee, X., Malhi, Y., Meyers, T., Munger, W., Oechel, W., Paw, K. T., Pilegaard, K., Schmid, H. P., Valentini, R., Verma, S., Vesala, T., Wilson, K., and Wofsy, S.: FLUXNET: A New Tool to Study the Temporal and Spatial Variability of Ecosystem–Scale Carbon Dioxide, Water Vapor, and Energy Flux Densities, B. Am. Meteorol. Soc., 82, 2415–2434, https://doi.org/10.1175/1520-0477(2001)082<2415:FANTTS>2.3.CO;2, 2001. a
Bendt, P., Collares-Pereira, M., and Rabl, A.: The frequency distribution of daily insolation values, Sol. Energy, 27, 1–5, https://doi.org/10.1016/0038-092X(81)90013-X, 1981. a
Boucher, O., Randall, D., Artaxo, P., Bretherton, C., Feingold, G., Forster, P., Kerminen, V.-M., Kondo, Y., Liao, H., Lohmann, U., Rasch, P., Satheesh, S., Sherwood, S., Stevens, B., and Zhang, X.: Clouds and Aerosols, in: Climate Change 2013: The Physical Science Basis. Contribution of Working Group I to the Fifth Assessment Report of the Intergovernmental Panel on Climate Change, edited by: Stocker, T., Qin, D., Plattner, G.-K., Tignor, M., Allen, S., Boschung, J., Nauels, A., Xia, Y., Bex, V., and Midgley, P., 571–657, Cambridge University Press, Cambridge, United Kingdom and New York, NY, USA, 2013. a
Cañada, J., Pedros, G., and Bosca, J.: Relationships between UV (0.290–0.385 µm) and broad band solar radiation hourly values in Valencia and Córdoba, Spain, Energy, 28, 199–217, 2003. a
Cermak, J., Eastman, R. M., Bendix, J., and Warren, S. G.: European climatology of fog and low stratus based on geostationary satellite observations, Q. J. Roy. Meteor. Soc., 135, 2125–2130, https://doi.org/10.1002/qj.503, 2009. a
Chen, T., Rossow, W. B., and Zhang, Y.: Radiative Effects of Cloud-Type Variations, J. Climate, 13, 264–286, https://doi.org/10.1175/1520-0442(2000)013<0264:REOCTV>2.0.CO;2, 2000. a
Daly, E., Porporato, A., and Rodríguez-Iturbe, I.: Coupled Dynamics of Photosynthesis, Transpiration, and Soil Water Balance. Part I: Upscaling from Hourly to Daily Level, J. Hydrometeorol., 5, 546–558, https://doi.org/10.1175/1525-7541(2004)005<0546:CDOPTA>2.0.CO;2, 2004a. a
Daly, E., Porporato, A., and Rodríguez-Iturbe, I.: Coupled Dynamics of Photosynthesis, Transpiration, and Soil Water Balance. Part II: Stochastic Analysis and Ecohydrological Significance, J. Hydrometeorol., 5, 559–566, https://doi.org/10.1175/1525-7541(2004)005<0559:CDOPTA>2.0.CO;2, 2004b. a
Dodge, Y.: The Concise Encyclopedia of Statistics, Springer New York, New York, NY, https://doi.org/10.1007/978-0-387-32833-1, 2008. a
D'Odorico, P., Ridolfi, L., Porporato, A., and Rodríguez-Iturbe, I.: Preferential states of seasonal soil moisture: The impact of climate fluctuations, Water Resour. Res., 36, 2209–2219, https://doi.org/10.1029/2000WR900103, 2000. a
Egli, S., Thies, B., Drönner, J., Cermak, J., and Bendix, J.: A 10 year fog and low stratus climatology for Europe based on Meteosat Second Generation data, Q. J. Roy. Meteor. Soc., 143, 530–541, https://doi.org/10.1002/qj.2941, 2017. a
Engerer, N. A. and Mills, F. P.: KPV: A clear-sky index for photovoltaics, Sol. Energy, 105, 679–693, 2014. a, b
Engmann, S. and Cousineau, D.: Comparing distributions: the two-sample Anderson–Darling test as an alternative to the Kolmogorov–Smirnov test, Journal of Applied Quantitative Methods, 6, 1–17, 2011. a
Gordon, J. M. and Hochman, M.: On the random nature of solar radiation, Sol. Energy, 32, 337–342, https://doi.org/10.1016/0038-092X(84)90276-7, 1984. a
Haberreiter, M., Schöll, M., Dudok de Wit, T., Kretzschmar, M., Misios, S., Tourpali, K., and Schmutz, W.: A new observational solar irradiance composite, J. Geophys. Res.-Space, 122, 5910–5930, https://doi.org/10.1002/2016JA023492, 2017. a
Hansen, J. W.: Stochastic daily solar irradiance for biological modeling applications, Agr. Forest Meteorol., 94, 53–63, https://doi.org/10.1016/S0168-1923(99)00003-9, 1999. a
Harrouni, S.: Fractal Classification of Typical Meteorological Days from Global Solar Irradiance: Application to Five Sites of Different Climates, in: Modeling Solar Radiation at the Earth's Surface, edited by: Badescu, V., chap. 2, 29–55, Springer-Verlag Berlin Heidelberg, 2008. a
Holdridge, L. R.: Determination of World Plant Formations From Simple Climatic Data, Science, 105, 367–368, https://doi.org/10.1126/science.105.2727.367, 1947. a
Holdridge, L. R.: Life zone ecology, Tropical Science Center, San Jose, Costa Rica, 1967. a
Hollands, K. G. T. and Suehrcke, H.: A three-state model for the probability distribution of instantaneous solar radiation, with applications, Sol. Energy, 96, 103–112, https://doi.org/10.1016/j.solener.2013.07.007, 2013. a
Ianetz, A. and Kudish, A.: A method for determining the solar global and defining the diffuse and beam irradiation on a clear day, in: Modeling Solar Radiation at the Earth's Surface: Recent Advances, edited by: Badescu, V., chap. 4, 93–113, Springer-Verlag Berlin Heidelberg, https://doi.org/10.1007/978-3-540-77455-6_4, 2008. a, b
Iqbal, M.: An Introduction to Solar Radiation, Academic Press, Toronto, 1983. a, b, c, d, e
Kasten, F. and Young, A. T.: Revised optical air mass tables and approximation formula, Appl. Optics, 28, 4735, https://doi.org/10.1364/AO.28.004735, 1989. a
Knohl, A., Schulze, E. D., Kolle, O., and Buchmann, N.: Large carbon uptake by an unmanaged 250-year-old deciduous forest in Central Germany, Agr. Forest Meteorol., 118, 151–167, https://doi.org/10.1016/S0168-1923(03)00115-1, 2003. a
Laio, F., Tamea, S., Ridolfi, L., D'Odorico, P., and Rodríguez-Iturbe, I.: Ecohydrology of groundwater-dependent ecosystems: 1. Stochastic water table dynamics, Water Resour. Res., 45, 1–13, https://doi.org/10.1029/2008WR007292, 2009. a, b
Leckner, B.: The spectral distribution of solar radiation at the earth's surface–elements of a model, Sol. Energy, 20, 143–150, https://doi.org/10.1016/0038-092X(78)90187-1, 1978. a, b
Leemans, R.: Global Holdridge Life Zone Classifications, Digital Raster Data, in: Global Ecosystems Database Version 2.0, NOAA National Geophysical Data Center, Boulder, USA, 1992. a
Li, Z. and Trishchenko, A. P.: Quantifying Uncertainties in Determining SW Cloud Radiative Forcing and Cloud Absorption due to Variability in Atmospheric Conditions, J. Atmos. Sci., 58, 376–389, https://doi.org/10.1175/1520-0469(2001)058<0376:QUIDSC>2.0.CO;2, 2001. a
Liu, B. Y. and Jordan, R. C.: The interrelationship and characteristic distribution of direct, diffuse and total solar radiation, Sol. Energy, 4, 1–19, https://doi.org/10.1016/0038-092X(60)90062-1, 1960. a
Manzoni, S., Porporato, A., D'Odorico, P., Laio, F., and Rodriguez-Iturbe, I.: Soil nutrient cycles as a nonlinear dynamical system, Nonlin. Processes Geophys., 11, 589–598, https://doi.org/10.5194/npg-11-589-2004, 2004. a, b
Martinez-Lozano, J. A., Tena, F., and Utrillas, M. P.: Ratio of UV to global broad band irradiation in Valencia, Spain, Int. J. Climatol., 19, 903–911, 1999. a
Mercado, L. M., Bellouin, N., Sitch, S., Boucher, O., Huntingford, C., Wild, M., and Cox, P. M.: Impact of changes in diffuse radiation on the global land carbon sink, Nature, 458, 1014–1017, https://doi.org/10.1038/nature07949, 2009. a
Muñoz, E.: Soil moisture dynamics in water- and energy-limited ecosystems. Application to slope stability, Phd, Universidad Nacional de Colombia, available at: http://bdigital.unal.edu.co/73824/6/1128281996.2019.pdf (last access: 23 October 2020), 2019. a
Muñoz, E. and Ochoa, A.: Radiation, clearness and clear-day indices at 37 FLUXNET sites, HydroShare, https://doi.org/10.4211/hs.7962c298ce544953be8d1dd6dab63bb0, 2021. a
Muñoz, E., Ochoa, A., Poveda, G., and Rodríguez-Iturbe, I.: Probabilistic soil moisture dynamics of water- and energy-limited ecosystems, EarthArXiv, https://doi.org/10.31223/osf.io/au4tb, 2020. a
NASA: U.S. Standard Atmosphere, 1976, Tech. rep., NOAA, Washington, D.C., 1976. a
Nordbotten, J. M., Rodriguez-Iturbe, I., and Celia, M. A.: Stochastic coupling of rainfall and biomass dynamics, Water Resour. Res., 43, 1–7, https://doi.org/10.1029/2006WR005068, 2007. a, b
Nyamsi, W. W., Blanc, P., Augustine, J. A., Arola, A., and Wald, L.: A new clear-sky method for assessing photosynthetically active radiation at the surface level, Atmosphere, 10, 219, https://doi.org/10.3390/ATMOS10040219, 2019. a
Oliphant, A., Susan, C., Grimmond, B., Schmid, H. P., and Wayson, C. A.: Local-scale heterogeneity of photosynthetically active radiation (PAR), absorbed PAR and net radiation as a function of topography, sky conditions and leaf area index, Remote Sens. Environ., 103, 324–337, https://doi.org/10.1016/j.rse.2005.09.021, 2006. a
Olseth, J. A. and Skartveit, A.: A probability density function for daily insolation within the temperate storm belts, Sol. Energy, 33, 533–542, https://doi.org/10.1016/0038-092X(84)90008-2, 1984. a
Olson, R., Holladay, S., Cook, R., Falge, E., Baldocchi, D., and Gu, L.: FLUXNET. Database of fluxes, site characteristics, and flux-community information, Tech. rep., Oak Ridge National Laboratory (ORNL), Oak Ridge, TN, United States, https://doi.org/10.2172/1184413, 2004. a, b
Pearson, K.: X. On the criterion that a given system of deviations from the probable in the case of a correlated system of variables is such that it can be reasonably supposed to have arisen from random sampling, The London, Edinburgh, and Dublin Philosophical Magazine and Journal of Science, 50, 157–175, https://doi.org/10.1080/14786440009463897, 1900. a
Peel, M. C., Finlayson, B. L., and McMahon, T. A.: Updated world map of the Köppen-Geiger climate classification, Hydrol. Earth Syst. Sci., 11, 1633–1644, https://doi.org/10.5194/hess-11-1633-2007, 2007. a
Platt, U., Pfeilsticker, K., and Vollmer, M.: Radiation and Optics in the Atmosphere, in: Springer Handbook of Lasers and Optics, edited by: Träger, F., 1475–1517, Springer Berlin Heidelberg, Berlin, Heidelberg, https://doi.org/10.1007/978-3-642-19409-2_23, 2012. a
Polo, J., Zarzalejo, L., and Ramírez, L.: Solar Radiation Derived from Satellite Images, in: Modeling Solar Radiation at the Earth's Surface, edited by: Badescu, V., chap. 18, 449–461, Springer-Verlag Berlin Heidelberg, 2008. a
Porporato, A., D'Odorico, P., Laio, F., and Rodriguez-Iturbe, I.: Hydrologic controls on soil carbon and nitrogen cycles. I. Modeling scheme, Adv. Water Resour., 26, 45–58, https://doi.org/10.1016/S0309-1708(02)00094-5, 2003. a, b
Ridolfi, L., D'Odorico, P., Laio, F., Tamea, S., and Rodriguez-Iturbe, I.: Coupled stochastic dynamics of water table and soil moisture in bare soil conditions, Water Resour. Res., 44, 1–11, https://doi.org/10.1029/2007WR006707, 2008. a
Robinson, N.: Solar Radiation, Elsevier, Amsterdam, 1966. a
Rodríguez-Iturbe, I. and Porporato, A.: Ecohydrology of Water-Controlled Ecosystems, Cambridge University Press, New York, USA, 2004. a, b, c
Rösner, B., Egli, S., Thies, B., Beyer, T., Callies, D., Pauscher, L., and Bendix, J.: Fog and Low Stratus Obstruction of Wind Lidar Observations in Germany – A Remote Sensing-Based Data Set for Wind Energy Planning, Energies, 13, 3859, https://doi.org/10.3390/en13153859, 2020. a
Sager, J. C. and McFarlane, J. C.: Radiation, in: Growth Chamber Handbook, edited by: Langhans, R. and Tibbitts, T., 1–30, NC-101 Committee on Controlled Environment Technology and Use, Iowa State University, Ames, IA, USA, 1997. a
Schaffer, B. E., Nordbotten, J. M., and Rodriguez-Iturbe, I.: Plant biomass and soil moisture dynamics: analytical results, P. R. Soc. A, 471, 20150179, https://doi.org/10.1098/rspa.2015.0179, 2015. a
Schöll, M., Dudok de Wit, T., Kretzschmar, M., and Haberreiter, M.: Making of a solar spectral irradiance dataset I: observations, uncertainties, and methods, J. Space Weather Spac., 6, A14, https://doi.org/10.1051/swsc/2016007, 2016. a
Scholz, F. and Stephens, M.: K-Sample Anderson-Darling Tests, J. Am. Stat. Assoc., 82, 918–924, https://doi.org/10.2307/2288805, 1987. a
Skartveit, A. and Olseth, J. A.: The probability density and autocorrelation of short-term global and beam irradiance, Sol. Energy, 49, 477–487, https://doi.org/10.1016/0038-092X(92)90155-4, 1992. a
Tamea, S., Laio, F., Ridolfi, L., and Rodriguez-Iturbe, I.: Crossing properties for geophysical systems forced by Poisson noise, Geophys. Res. Lett., 38, 1–5, https://doi.org/10.1029/2011GL049074, 2011. a, b
Tran, V. L.: Stochastic models of solar radiation processes, Ph.D. thesis, Université d'Orléans, Orléans, France, 2013. a
Utrillas, M. P., Marín, M. J., Esteve, A. R., Salazar, G., Suárez, H., Gandía, S., and Martínez-Lozano, J. A.: Relationship between erythemal UV and broadband solar irradiation at high altitude in Northwestern Argentina, Energy, 162, 136–147, 2018. a
Vigroux, E.: Contribution à l'étude expérimentale de l'absorption de l'ozone, Ann. Phys., 12, 709–762, https://doi.org/10.1051/anphys/195312080709, 1953. a
Wallace, J. M. and Hobbs, P. V.: Atmospheric Science. An Introductory Survey, Academic Press, 2 edn., San Diego, CA, USA, 2006. a
Wu, A., Song, Y., van Oosterom, E. J., and Hammer, G. L.: Connecting Biochemical Photosynthesis Models with Crop Models to Support Crop Improvement, Front. Plant Sci, 7, 1518, https://doi.org/10.3389/fpls.2016.01518, 2016. a