the Creative Commons Attribution 4.0 License.
the Creative Commons Attribution 4.0 License.
 | 01 Dec 2021
Methane gas emissions from savanna fires: what analysis of local burning regimes in a working West African landscape tell us
Paul Laris
Moussa Koné
Fadiala Dembélé
Christine M. Rodrigue
Lilian Yang
Rebecca Jacobs
Quincy Laris
Savanna fires contribute significantly to greenhouse gas emissions. While it is recognized that these fires play a critical role in the global methane cycle, there are too few accurate estimates of emissions from West Africa, the continent's most active fire region. Most estimates of methane emissions contain high levels of uncertainty as they are based on generalizations of diverse landscapes that are burned by complex fire regimes. To improve estimates we used an approach grounded in the burning practices of people who set fires to working landscapes. We collected and analyzed smoke samples for 36 experimental fires using a canister method for the early dry season (EDS) and mid-dry season (MDS). We also collected data for savanna type, grass type, biomass composition and amount consumed, scorch height, speed of fire front, fire type, and ambient air conditions for two sites in Mali. We report values for fire intensity, combustion completeness, patchiness, modified combustion efficiency (MCE), emission factor (EF) and methane emission density.
Our study found that mean methane EFs ranged from 3.83 g kg−1 in the EDS to 3.18 g kg−1 in the MDS, but the small sample did not provide enough power for this effect to be significant. We found head fires had nearly double the CH4 EF of backfires (5.12 g kg−1 to 2.74), a significant difference. Byram's fire intensity was a significant driver of CH4 EF but with weak effect. Methane emission density increased marginally from 0.839 g m−2 in the EDS to 0.875 g m−2 in the MDS, a difference that was not significant. Head fires, however, had much higher emission densities than backfires – 1.203 vs. 0.708 g m−2 – respectively, a significant difference. We suggest the reason for the higher methane emissions from head fires, which have higher intensity, is the longer flame lengths that burn green leaves on trees, releasing methane. We conclude that policies aimed at shifting the burning regime earlier to reduce methane emissions will not have the desired effects, especially if fire type is not considered. Future research should consider the state and amount of leafy biomass combusted in savanna fires.
- Article
(5071 KB) - Full-text XML
- BibTeX
- EndNote


The African savannas are the Earth's most extensively and frequently burned regions (Giglio et al., 2010) and account for some 64 % of the global extent of area burnt annually (Grégoire et al., 2013). Indeed, African savanna fires regularly burn such large areas that they are visible from space, so much so that NASA scientists refer to Africa as the “burn center of the planet” (National Aeronautics and Space Administration, 2005). Savanna fires are a major source of greenhouse gases (GHGs) including carbon dioxide, carbon monoxide, methane and nitrous oxide (Koppmann et al., 2005; Russell-Smith et al., 2021).
Methane, a critical GHG, is responsible for about 20 % of the warming induced by long-lived gases. Although most sources and sinks of methane are known, their relative contributions to atmospheric methane levels remain highly uncertain (Kirschke et al., 2013; Saunois et al., 2016, 2020). Our lack of understanding of the global methane cycle contributed to the recent “methane enigma”, a dramatic observed decline in the rate of increase in atmospheric methane, which triggered a search for “missing methane” (Heimann, 2011). Although the decrease was originally and mistakenly attributed to a decline in fossil fuel burning and a shift in farming practices (Kirschke et al., 2013), it was eventually determined that the missing methane was due to a decline in area burned by savanna fires. As NASA researchers determined, the missing methane from a drop in savanna burned area caused a decrease of 3.7 Tg CH4 per year – a value nearly twice the decrease expected (Worden et al., 2018).
The missing methane event demonstrates two important aspects of emissions from savanna fires. First, these emissions are significant, so much so that they can offset increases from the key sources (fossil fuels and agriculture). Second, our knowledge of the processes and factors that regulate the amount of methane emissions from savannas is limited to the point that a large decrease went virtually undetected. Although eventually scientists discovered the source, there remains a high level of uncertainty for many key variables that determine the amounts of methane emitted from savanna fires (Worden et al., 2018). In addition, there remains concern about the gap between “top-down” (atmospheric measurements) and “bottom-up” (land-based models) estimates of global methane emissions, which differ by 30 %; Saunois et al. (2020) suggest the reason is an overestimation of emissions from bottom-up models. There is thus a need to improve land-based estimates of emissions from savanna fires.
In general, the crucial parameters for determining GHG emissions from fires include burned area (BA), fuel consumption (FC) and the species-specific emission factor (EF), usually defined as the amount of gas or particle mass emitted per kilogram of dry fuel burned, expressed in units of grams per kilogram (g kg−1) dry matter (van Leeuwen and van der Werf, 2011). The precise emissions from savanna fires depend on a variety of factors including those associated with fuel, specifically vegetation type (the mix of grassy, leafy and woody fuels) and fuel moisture (a function of climate, soil and fire season), as well as factors directly related to a fire's properties, most of which change during a long fire season.
By one estimate savanna fires contribute 62 % (4.92 Pg CO2 per year) of gross global mean fire emissions (Lipsett-Moore et al., 2018). Due to their high rates of burning and vast extents, savannas are thought to hold potential as major carbon sinks if the fire regime could be modified to reduce emissions. The most commonly proposed change in the regime to reduce the impacts of fires is to shift burning to an earlier period in the dry season because early fires generally burn less completely and more patchily. Indeed, Lipsett-Moore et al. (2018, p. 1) recently argued that there are “global opportunities for significant emission reductions by simply shifting the fire period in African savannas to early dry season”.
Yet, although scientists and policy makers increasingly recognize the important role these fires play in the global carbon cycle, there are few accurate estimates of their emissions especially in terms of the key factors that determine the type and quantity of GHG emissions. Critically, most studies of emissions are global scale and use average biome level EFs. EFs show large variability, however, between and within biomes due to differences in fuel type and composition, burning conditions, and tree density (Andreae and Merlet, 2001; Korontzi, 2005; van Leeuwen and van der Werf, 2011; Russell-Smith et al., 2021). There are few regionally specific emission estimates because accurate quantification of such emissions is difficult, being dependent upon reliable estimation of the various parameters, many of which require intense fieldwork (Russell-Smith et al., 2009).
Nowhere is this truer than for West Africa, the continent's most active fire region. To date, measurements of emissions from African savannas are limited to a few broad-scale studies, largely based in the continent's southeast and that rarely adequately account for changes in fuel classes, seasonality or a host of other key factors including fire type and intensity (Bonsang et al., 1995; Lacaux et al., 1995; Hoffa et al., 1999; Korontzi, 2005). Indeed, the most recent catalogs of EFs and fuel consumption (FC) for savannas includes a single data point from West Africa (van Leeuwen et al., 2014; Andreae, 2019). Studies from other regions find there is great variation in study results (Russel-Smith, 2009; van Leeuwen and van der Werf, 2011), and, as Murphy et al. (2012) note, the variability between samples collected within fires can be greater than the differences between fires of different seasons. These authors were unable to draw general conclusions about seasonal variation in methane emissions and EFs. Among the key issues cited were the variations in the fraction of tree-leaf litter in the fuels of different savanna environments.
In fact, there are not a lot of data in the literature on fine fuel mixtures (the primary fuel for savanna fires) used to estimate EFs in Africa, although the amount of woody vegetation clearly affects emissions (Korontzi, 2005; van Leeuwen and van der Werf, 2011). In the Brazilian Cerrado, for example, Vernooij et al. (2021) found that the seasonal effect on methane EF was stronger in more woody savanna vegetation, with late dry season (LDS) fires having 20 % lower EF than early dry season (EDS) ones in shrub-dominated areas.
Fuel moisture is also an issue; Russel-Smith et al. (2009) noted there are currently no comprehensive measurements of the seasonality of emission gas composition, yet fuel moisture is a key determinant. This is a critical problem because, although evidence suggests that EDS fires consume less biomass and burn more patchily, they also tend to have a lower combustion efficiency than later fires due to their higher fuel moisture levels. A lower combustion efficiency theoretically causes a higher emission factor for CH4. Indeed, one study in Africa found that the bulk of CH4 emissions come from EDS fires (Hoffa et al., 1999) because the decrease in area burned is more than offset by the increase in the CH4 EF. Elsewhere in southern Africa, Russell-Smith et al. (2021) found that emission factors varied significantly by season for some vegetation types but not others, although notably the latter study involved only “cured” grasses. We would argue that “early” fires burn uncured fuels by definition.
In sum, while savannas undoubtedly harbor great theoretical potential to sequester more carbon and emit less through a change in fire regime, there exists a great deal of uncertainty as to what the actual carbon shifts might be should regimes change. Fire regimes are themselves complex; we define them as the characteristic fire activity prevailing in a region, typically determined by frequency, intensity, seasonality, size distribution, type of fire and fuels consumed (Keeley and Pausas, 2019). Changes in one or more of these factors can alter fire emissions. We suggest the key sources of uncertainty in terms of carbon emissions arise largely from the spatiotemporal complexity of savanna vegetation patterns and fire regimes combined with many unknowns or biases associated with a lack of consideration of human fire setting and land management practices in these complex landscapes (Laris, 2021).
Savannas are patch mosaic landscapes in which vegetation and soil types vary dramatically – on the order of tens of meters – across landscapes (Duvall, 2011). This variation creates a seasonal-mosaic landscape in which the fuel conditions (fuel moisture, fuel load and mix, and fuel stature) vary over space and time (Fig. 1). As the fuel conditions change, people commonly set fire to different patches in accordance with grass species drying rates, as well as other land management concerns (e.g., crop harvests and grazing patterns). In many parts of West Africa, people control the time (time of day and season), location and type of savanna, and type of fires they set. By controlling these variables, human acts determine the conditions of the fuels, as well as the ambient air conditions and the specific fire properties. To take one simple example, a fire in wooded savanna with tall perennial grasses (Fig. 1d) will have very different fuel moisture levels as the fire season progresses (shifting high to low), different percentages of leaf litter and total fine fuel biomass (shifting low to high) (Fig. 1f), and variable wind conditions (peaking in mid-dry season, MDS). Critically, the seasonal timing of a fire not only affects the fuel moisture of grasses but also the leafy biomass because green leaves on small trees burn in EDS, while fallen leaf litter, which creates a bed of compact and less-aerated fuel, burns in LDS. As such, the incomplete combustion of leafy biomass is a function of high fuel moisture in one season and low oxygen conditions in another, with unknown implications for methane gas emissions.
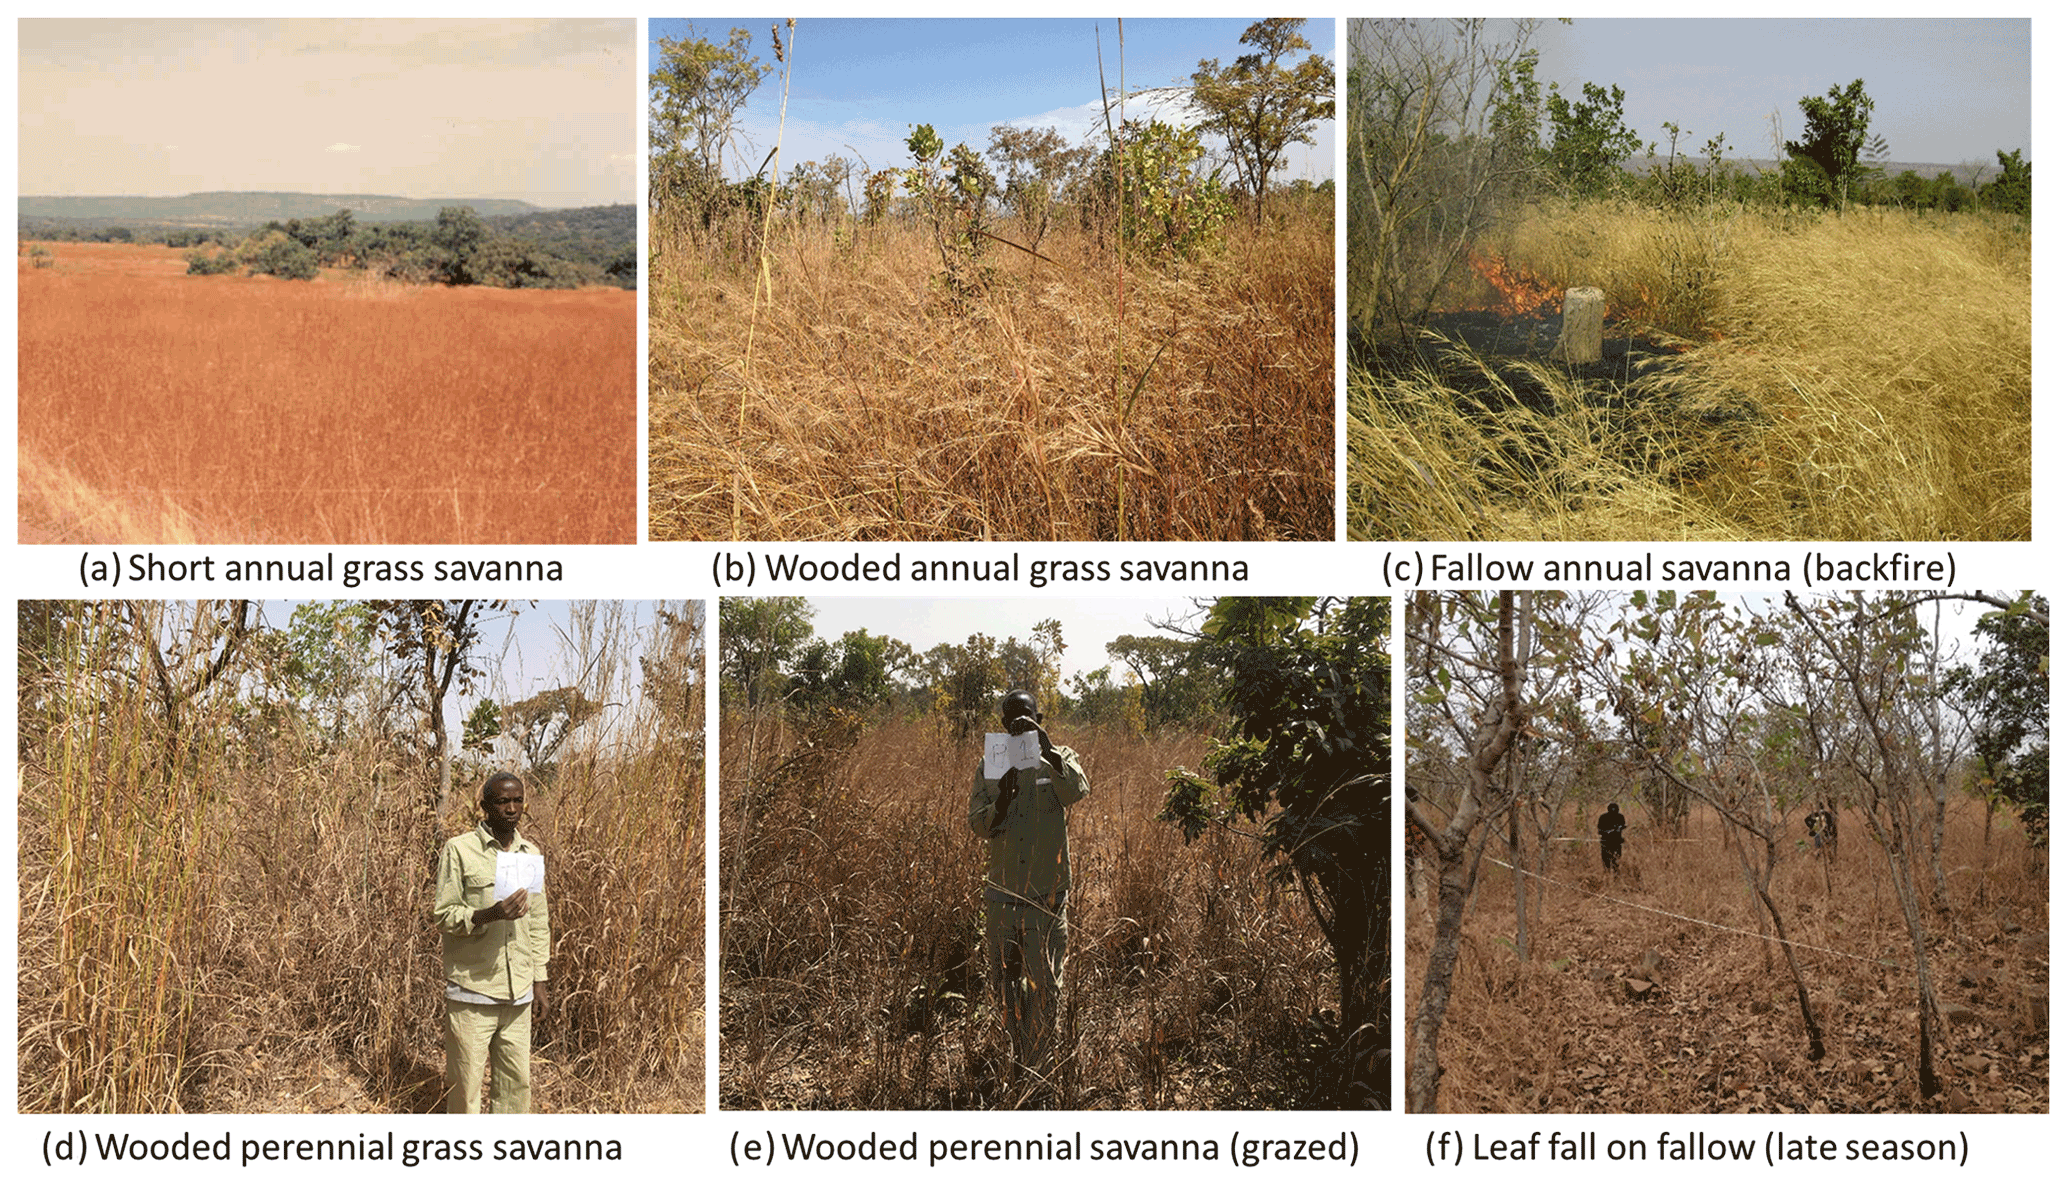
Figure 1Different savanna vegetation types used in fire experiments for the study areas of Tabou and Faradiélé, Mali. Note that grass species, height and density, woody cover, and leaf litter amounts vary dramatically over space and time.
Human fire uses determine the pyrogeography of fire – the specific location, timing, type of fire and vegetation burned – creating complex spatiotemporal patterns of fires and emissions. People tend to set fires to fine annual grasses (Fig. 1a) as soon as they are dry, while they wait to burn perennials (which are too moist to burn in the early dry season) (Fig. 1d) until later, often igniting them in a flurry of fires at the end of the harvest in late December (below). This creates a seasonal-mosaic fire regime in which some patches burn early, others later and some not at all. Purposeful fires are most often set as backfires in the late afternoon as temperatures and wind speeds are falling and as humidity is rising, which limits fire intensity (Laris et al., 2020). Lower-intensity fires tend to self-extinguish at the edge of moister vegetation patches and in the evening; they have lower flame heights reducing the reach of fires into leafy tree canopies (Laris et al., 2021). Later in the fire season, fires are less likely to be purposefully set and are more likely to burn as intense, uncontrolled head fires.
It is clear that any effort to predict future changes in emissions or to implement policy to reduce emissions requires more detailed information on how emissions vary according to the key factors noted above, many of which are a function of human land management practices (see Appendix). Specifically, given the spatiotemporal complexity of savanna environments, whether a shift to an earlier fire regime will result in a decrease in methane emissions for a given savanna must be determined empirically, and proposed policies to apply generalized findings from one continent to another may not achieve desired emission reductions.
This study aims to fill a knowledge gap by incorporating data on human burning practices, the characteristics of the fire regimes they produce, the vegetation conditions on the landscapes they burn and the resulting emissions of key GHGs. Through a novel geographic approach, we designed our experiments to gather data in ways that reflect actual on-the-ground burning practices of people living in working landscapes at two mesic savanna sites in Mali, West Africa. By “working landscapes”, we mean savanna lands that are occupied and worked by people as opposed to areas managed as reserves (e.g., Charnley et al., 2014); the latter are most often used in fire research. The biomass (fuels) in working landscapes is a function of land use practices including rotational agriculture, annual burning and animal grazing and can differ significantly from those found on non-working lands (Fig. 1d and e), which can affect fire intensity, combustion completeness and combustion efficiency with implications for gas emissions. The burning regimes studied, which are determined by such factors as seasonality, time of day, (ambient weather), fire type (with or counter to the wind), grass type and woody vegetation cover, were selected to reflect local practices and are based on over a decade of field and remote sensing research.
To determine the factors that influence fire emissions of methane gas from anthropogenic fires we conducted experimental fires using a field-based method to measure key factors. We collected canister samples of smoke emissions for 36 fires during the early and middle seasons, which we report on here. We also collected data for savanna type, grass type, biomass composition and amount consumed, scorch height, speed of fire front, fire type, and ambient air conditions for two mesic savanna sites in Mali.
We based our research on two working landscapes located in the southern Sudanian savanna of southern Mali (Fig. 2). We chose areas with annual precipitation over 900 mm because they burn frequently and are typical of this broad mesic savanna belt in West Africa. The climate is divided into two seasons: a wet period from approximately June through October and a dry season from November through May. We also recognize a cool dry period from approximately November through February and a hot dry period from March through May. This distinction is important because the Harmattan wind, which is dry and desiccates vegetation while creating unique fire weather, dominates in the cool season. The mean annual rainfall is 991 mm for Tabou and 1177 mm for Faradiélé (based on data from the nearby urban centers of Bamako (latitude 12.64∘, longitude −8.00∘) and Bougouni (latitude 11.42∘, longitude −7.47∘) for each study area, respectively) (Henry, 2011). The fire season follows the rains and typically runs from November through April. The regime follows a regular annual spatiotemporal pattern with the majority of fires occurring in late December and early January (Laris et al., 2016).
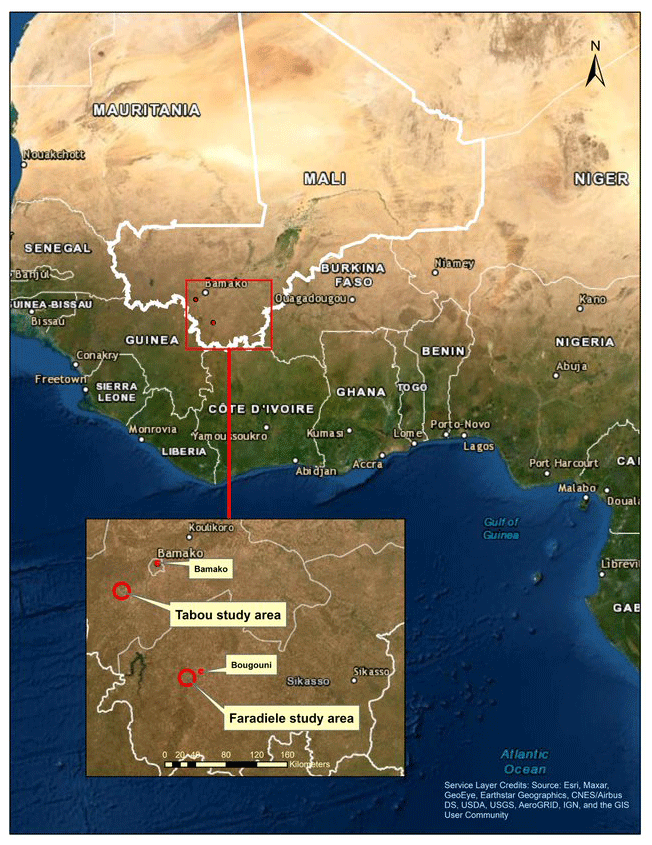
Figure 2Study areas in southern Mali (figure by Scott Winslow).
The vegetation is southern Sudanian savanna and is predominantly composed of a mixture of grasses, trees and shrubs in a complex mosaic. The landscape heterogeneity is a function of topography, underlying soil and hydrology, as well agricultural uses, the combinations of which produces unique patterns of land cover (Duvall, 2011; Laris, 2011). Ferricrete outcrops on hard pan cover considerable areas. Soil in these areas generally has high gravel content and is very shallow, creating xeric conditions. Vegetation is dominated by short, annual grasses (principally Loudetia togoensis but also Andropogon pseudapricus), and there are usually a few widely scattered trees. They form up to 25 % of the savanna in southern Mali. Except for the intensively cultivated areas, a near-continuous layer of tall (over 1 m in height) perennial grasses (principally Andropogon gayanus, Hyparrhenia dissolute, Cymbopogon giganteus and Schizachyrium pulchellum) covers the more fertile soils, although there are pockets where the tree canopy is closed and there is little grass cover. The land cover in settled areas has been significantly modified. Perennial grasses are less common (except on long-fallow plots), and large portions of the landscape are covered by annual grasses, particularly Andropogon pseudapricus and Pennisetum pedicellatum with scattered trees.
2.1 Data collection
We studied 36 experimental fires. Data on the following variables were collected in the field for each fire: average plot biomass, grass proportion of biomass, grass species, biomass consumed, fuel moisture, wind speed, scorch height, ambient humidity, temperature, fire type, time of day, fire duration, burn patchiness and fire season. Vegetation characteristics including grass type (annual or perennial), grass species and leaf height were also recorded for each site. Fuel load (plot biomass) was measured in each of the experimental plots by delineating three representative pre-fire quadrats of 1×1 m. Grasses were cut at the base using a scythe and weighed with an electronic balance to determine the average. When present, we weighed leaf litter separately. A total of 16 of the 36 fires were set in the EDS and 20 in the MDS. As the purpose of the study was to replicate local burning practices, the majority of these fires were set as backfires (25) with head fires (11) set for the purpose of comparison.
Most grasses burned were fully cured; however, for those that were not, we cut a sample and weighed it wet and then dried and reweighed it to determine the cure rate, which was taken as the average for the plot. Fuel moisture content for the cured fuels was calculated using the method developed by Viney (1991) for savanna fuels:
where H is relative humidity, and T is ambient temperature at the time of the burn. We calculated dry biomass weight by subtracting the fuel moisture content from the wet biomass weight, and the amount of fuel consumed was calculated by subtracting the average ash and unburned fuels remaining in three quadrats per plot from the pre-fire dry biomass weight.
We used a Kestrel 5500 Weather Meter station (KestrelMeters.com, Boothwyn, Pennsylvania, USA) to collect wind speed, ambient humidity and temperature during the burning of each plot. We recorded values every 5 s and averaged them for each burn. The weather station was placed upwind and near each experimental plot 2 m off the ground in an open area. We recorded wind speed relative to the direction of each fire.
2.2 Plot design
We selected plots to represent an array of savanna vegetation types dominated by different amounts of woody cover and grass species. To aid in the selection of the burn plots, we used a long-term fire database to select sites with known fire seasonality – fires known to burn during the early, middle or late fire season on an annual basis (Laris, 2011). We divided the sites into plots of 10×10 m and applied fire treatments of head and back burns. Fire timing was set according to the historical pattern of burning, with early fires set in November through December, middle fires in January, and late fires in late February and March (Laris et al., 2016). We conducted multiple burns per site to account for plot-level heterogeneity. Plots at each site were located in close proximity with attention paid to maintaining consistency in grass type and woody cover. Head-fire and backfire plots were located directly adjacent.
We noted ignition time, and each fire was timed until the flaming front reached the end of the 10 m plot. We set the majority of fires in late afternoon, which is in accordance with local practice, although we set some fires earlier for comparative purposes. Post-fire ash and any unburned material were weighed for areas of similar composition to the 1 × 1 m pre-fire quadrats to determine the amount of biomass consumed. Scorch height was averaged for each plot by measuring the height of scorch marks on several small trees. Burn patchiness – the percentage of the plot affected by fire – was estimated by two observers.
There are several key limitations of this study. First, the number of gas samples is relatively small due to the high price of shipping gas samples (we collected only 36 emission samples for a total of 97 experimental burns, and no samples were from the LDS). The majority of the samples were for backfires to replicate local practices, with head-fire samples taken for comparative purposes. We only sampled each fire once and thus caution against assuming a single sample represents the typical emissions for the entire fire (see Murphy et al., 2012, above), but we do think the mean values for the data we collected provide a useful sample of typical West African fire emissions. In addition, we burned different savanna vegetation types (with different grasses and woody vegetation amounts) at different times of the fire season in accordance with local practices; as such, we do not have systematic results for burning all grass types for all fire seasons (e.g., few perennial grasses burn in the EDS).
2.3 Field data analysis
To quantify intensity we used the fire-line intensity of Byram (1959), which is defined as follows:
where I is Byram's fire-line intensity (kW m−1), H is the net low heat of combustion (kJ kg−1), w is the fuel consumed in the active flaming front (kg m−2), and r is the linear rate of fire spread (m s−1). The net low heat of combustion (H) was selected following Williams et al. (1998) with 20 000 kJ kg−1 as an appropriate value for savanna fires.1 The amount of fuel consumed was calculated by subtracting the average ash and unburned material remaining in three quadrats per plot from the pre-fire measurement of dry biomass. Variable r was derived from the time it took for the base of the first flaming front to reach the end of the 10 m plot. We calculated fire-line intensity for all samples possessing all the variables for analysis. Finally, combustion completeness was calculated by dividing the biomass consumed by the pre-fire biomass.
2.4 Gas emission sampling and analysis
We collected samples of smoke from a sample of 36 of our experimental fires for the early and middle seasons along with background air samples for each different site prior to burning. (The high cost of shipping canisters prohibited collecting data for the late season using this method.) Samples were collected in stainless steel vacuum canisters by mounting the canister on a pole and holding the canister with open flow-restricting valve about 40 cm above the flame. We sampled all fires a single time once the flaming front had developed (approximately two-thirds of the way through the burn plot). Once filled, the canisters were shipped directly back to California for analysis at the laboratory of the Department of Chemistry at the University of California at Irvine. Mass spectrometer (MS), thermal conductivity and flame ionization after separation by gas chromatography were used to detect, inventory and measure the quantities of the different species of gas contained in the samples (Katzenstein et al., 2003; Koné et al., 2020).
We calculated EF as follows:
EFx is the emission factor for species x (g kg−1). Fc is the mass fraction of carbon in the fuel for which we use the value of 0.5 (the majority of studies find the carbon fraction to vary between 0.425 and 0.50; the latter is used most often for purposes of comparison (Ward et al., 1996), although Lacaux et al. (1995) found a value of 0.425 for West Africa). MM is the molecular mass of species x (g), and 1000 g kg−1 is a conversion factor. MMcarbon is the molecular mass of carbon (12 g), and Cx CT is the ratio of the number of moles of species x in the emission sample divided by the total number of moles of carbon, calculated as follows:
where ER is the emission ratio of species x to CO2, NCj is the number of carbon atoms in compound j, and the sum is over all carbonaceous species (approximated as CO2, CO and CH4 for this study).
The general equation used to quantify the gas species emitted from vegetation fires is the basic biomass burning emission model of the Intergovernmental Panel on Climate Change (IPCC) (IPCC, 2003: 49; IPCC, 2006: A2.13).
Here, “emission” is the gas or aerosol flux in tons (t), “area” is the total area burnt in hectares (ha), “fuel load” is the amount of burnt biomass in tons per hectare (t ha−1), “combustion completeness” is the fraction of fuel affected by fire that was pyrolyzed in percent (%), and “emission factor” of a gas is the amount of this gas generated when 1 kg of fuel is burnt. We have revised the formula to include seasonally specific values for area, fuel load, combustion completeness and emission factor and add the variable burn patchiness (BP), which is the fraction of the surface area affected by the fire.
We suggest the following revision for determining emissions by fire season in savannas (Es).
Here, BA is burned area, FL is fuel load, CC is combustion completeness, and EFx is emission factor of species x. We propose using seasonal values for these key factors because these variables vary significantly by season as a function of ambient weather, as well as fuel moisture and fuel type (fraction of leaf litter or shrubs) and fuel conditions. We have added BPs because patchiness varies by season (as well as fuel) and because most estimates of burned area are based on satellite image analysis, which is too coarse to determine the actual surface area burned due to burn patchiness (the actual area burned is thus BP × BA) (Russell-Smith et al., 2009). Note that even medium-resolution burned area estimates using Landsat contain errors in the percent of area burned due to the fragmented patterns fires create across a heterogeneous savanna landscape. We did not determine total BA for this work but have done so previously using Landsat data covering the study area (Laris, 2011). As such, we present our results in terms of emissions per square meter according to season of the burn.
Complete combustion of vegetation results in the release of carbon in the form of CO2, while incomplete combustion leads to the emission of CO, CH4 and a large variety of organic compounds (Koppmann et al., 2005). Because many of the factors that control EFs also regulate combustion efficiency, determining the latter is a useful proxy for predicting how individual emission factors will vary under different fire conditions. Modified combustion efficiency (MCE) – the ratio of CO2 to CO + CO2 – is frequently used to estimate combustion completeness as values for MCE are related to different phases in the combustion process. In general, when the MCE exceeds 90 %, a fire is flaming and combustion temperatures are high. When MCE is less than 85 %, combustion is smoldering. A savanna fire is typically characterized by a flaming front moving across the landscape leaving smoldering material. As such, the smoke emitted from savanna fires is typically a product of both flaming and smoldering on different fragments of fuel.
Bivariate statistical analyses were performed to test the significance of the difference of means (t tests) in CH4 EF by season (EDS and MDS) and by fire direction (head fires and backfires) and in MCE by season and fire direction. F tests established the similarity of variances, and all t tests were done with pooled estimates of variance. These were done in the OpenOffice Calc spreadsheet (Apache Software Foundation, version 4.1, available at: https://www.openoffice.org/, last access: 29 November 2021) and PAleontological STatistics (Hammer et al., 2001), with effect sizes (Cohen's d) and post hoc power calculated in G*Power (Faul et al., 2009). We used bivariate regression analysis to look for correlations between the two dependent variables – methane EF and density – and independent variables – Byram's fire intensity, proportion of grass biomass (to woody biomass), total fuel moisture and Viney fuel moisture (a function of ambient temperature and humidity). These were done in Calc, and power was estimated in G*Power.
3.1 Plot characteristics
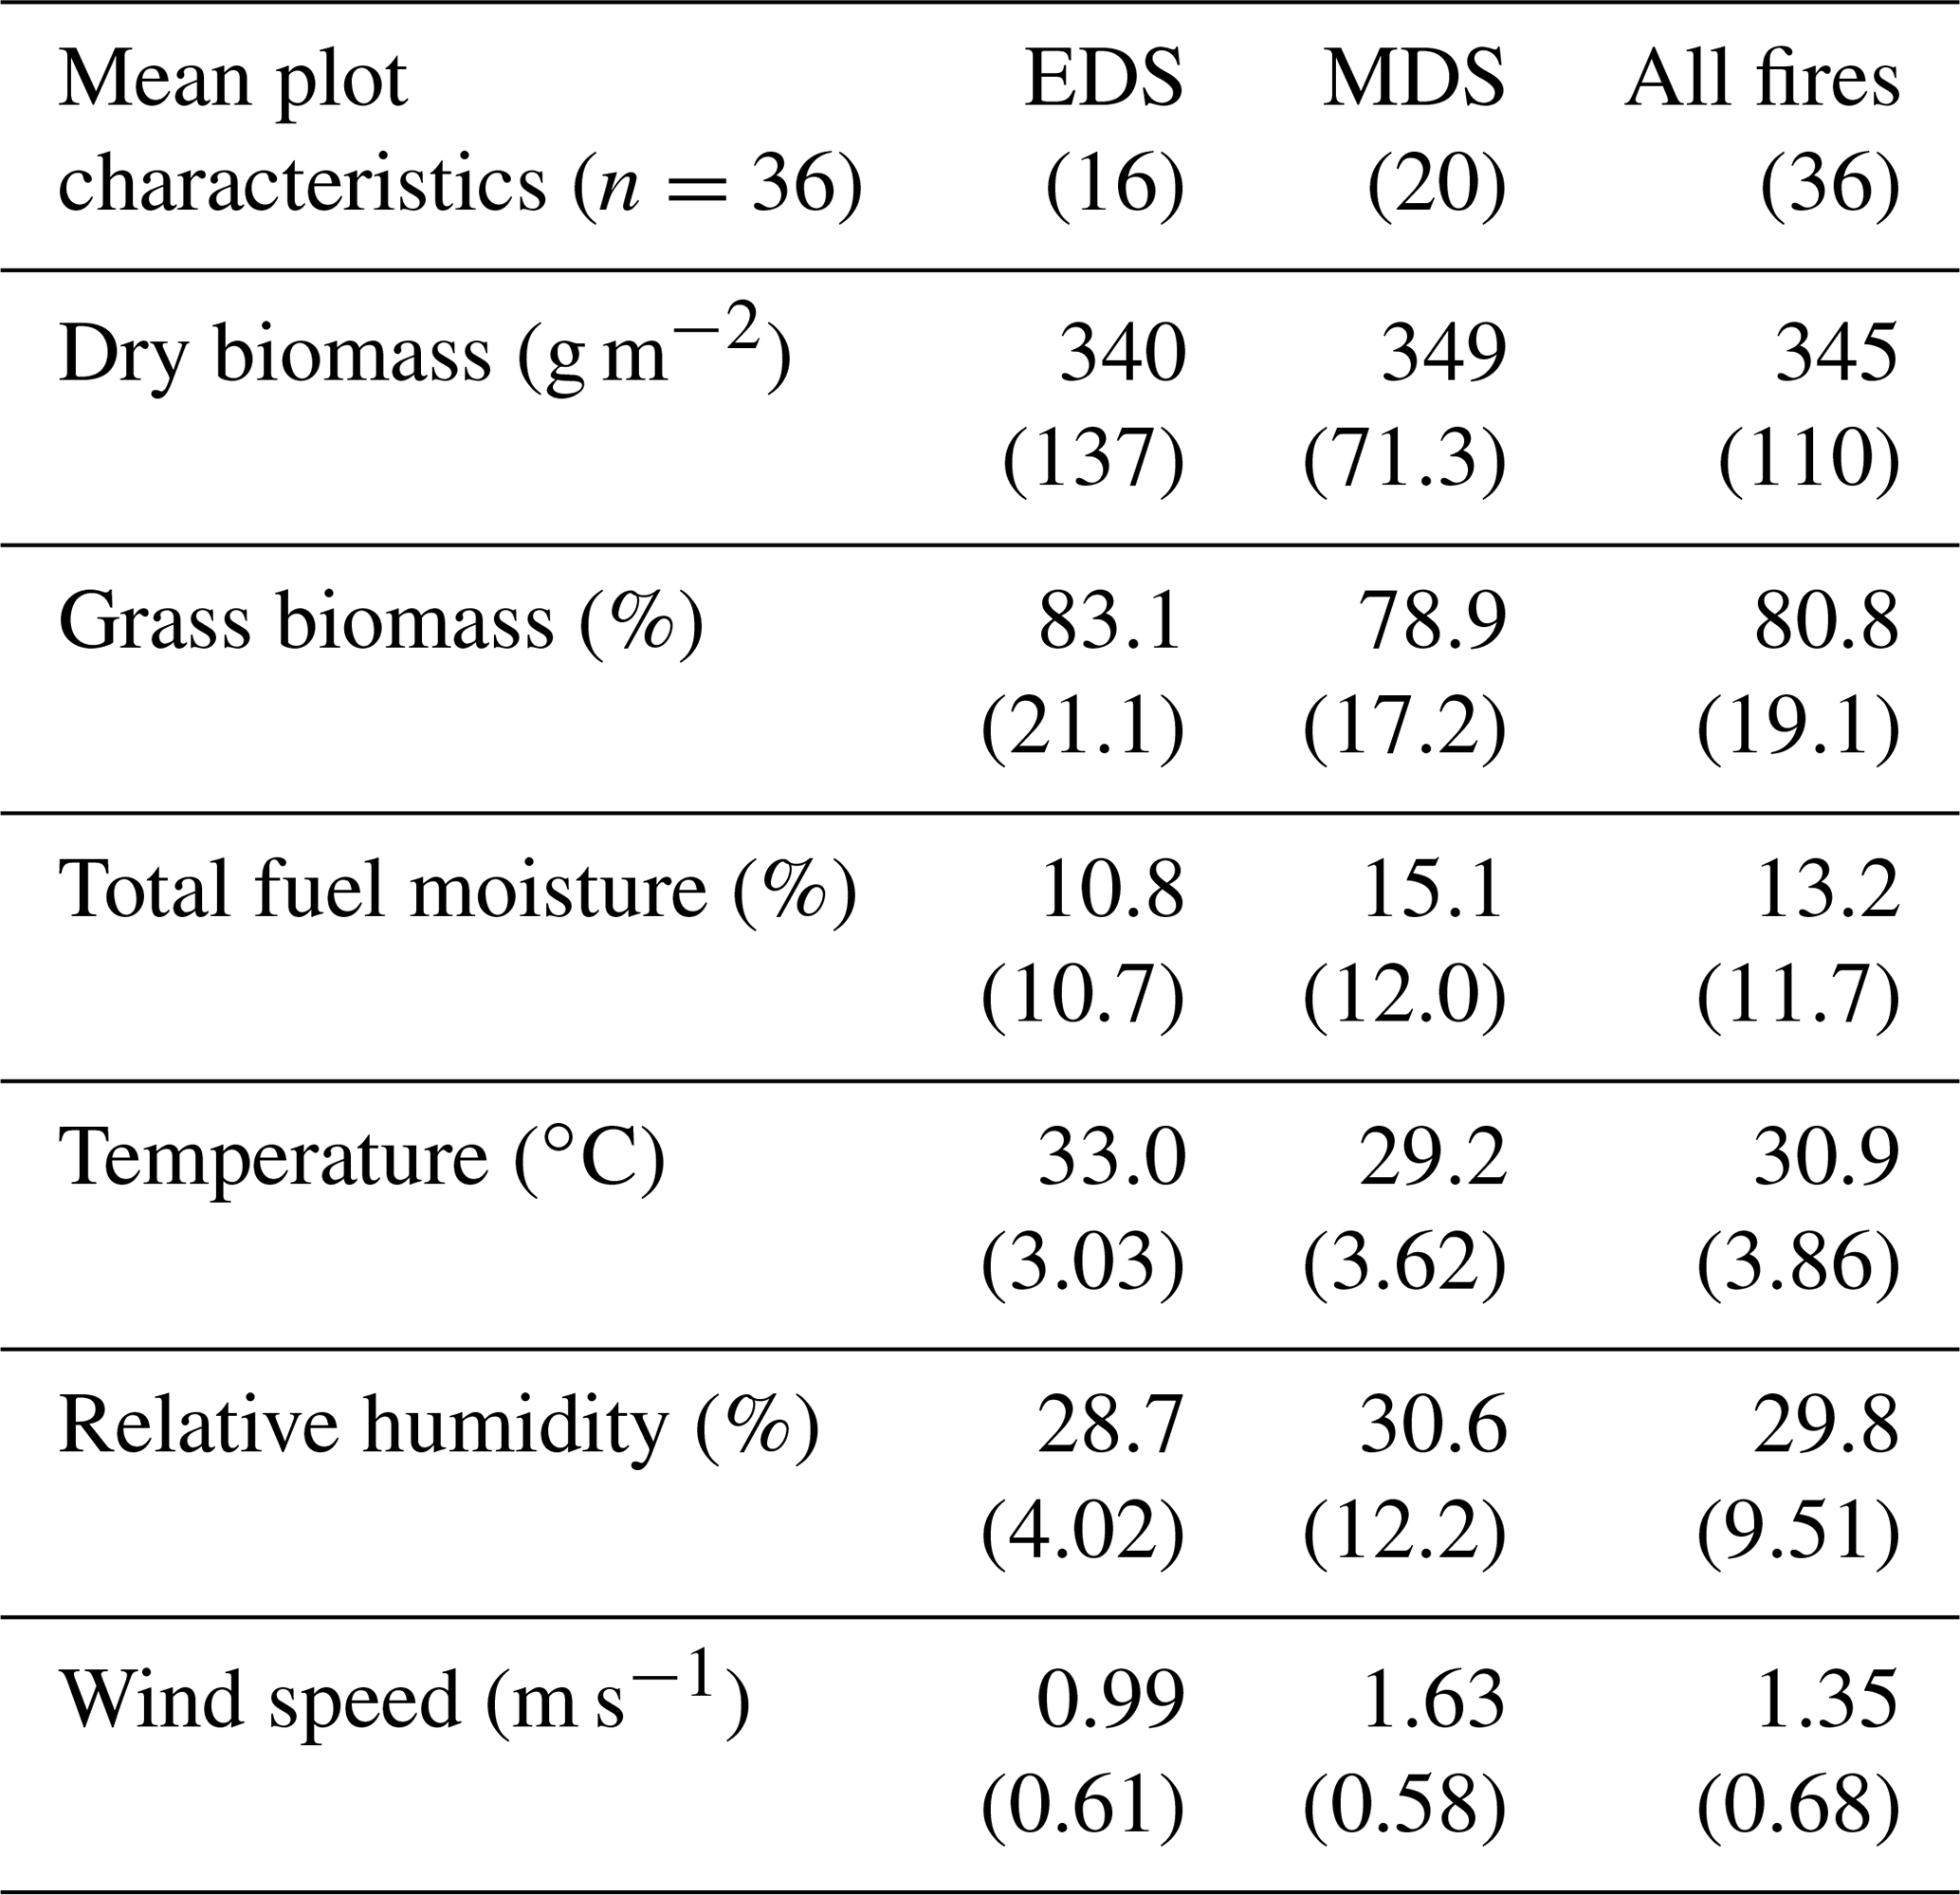
The mean plot characteristics for biomass and weather conditions demonstrate the importance of the inclusion of the mid-season in this study (Table 1) (see Laris et al., 2021, for late dry season values). Average temperature generally increases over the course of the dry season but dips by 0.4 ∘C in mid-season, which is an established phenomenon in West African climates. Average humidity decreases as the dry season progresses, but the mid-season humidity is considerably more variable than in the early season. Calculated fuel moisture content based on Viney declines over the course of the dry season, but when combined with the measured mean cure rates for moist grasses, the total fuel moisture means rose from 10.8 % in the EDS to 15.1 % in the MDS with high variability. Mean wind speed peaks mid-season during the Harmattan, although the wind speeds are relatively low – classified as a light breeze on the Beaufort scale. The percent of grass of the total plot biomass is greatest in the early season, while the total biomass (total fine fuels – grasses and leaves) is higher in mid-season, reflecting an increase in leaf litter as the dry season progresses. The increase in dry biomass also reflects the changes in species types burned – the taller perennials often burn later in the dry season. Some perennials are too moist to burn during the early months of the dry season and burn less completely in the mid-season due to higher moisture content.
Table 1Mean plot characteristics by study period (n and standard deviations in parentheses) (2014–2016, Mali).
3.2 Fire characteristics
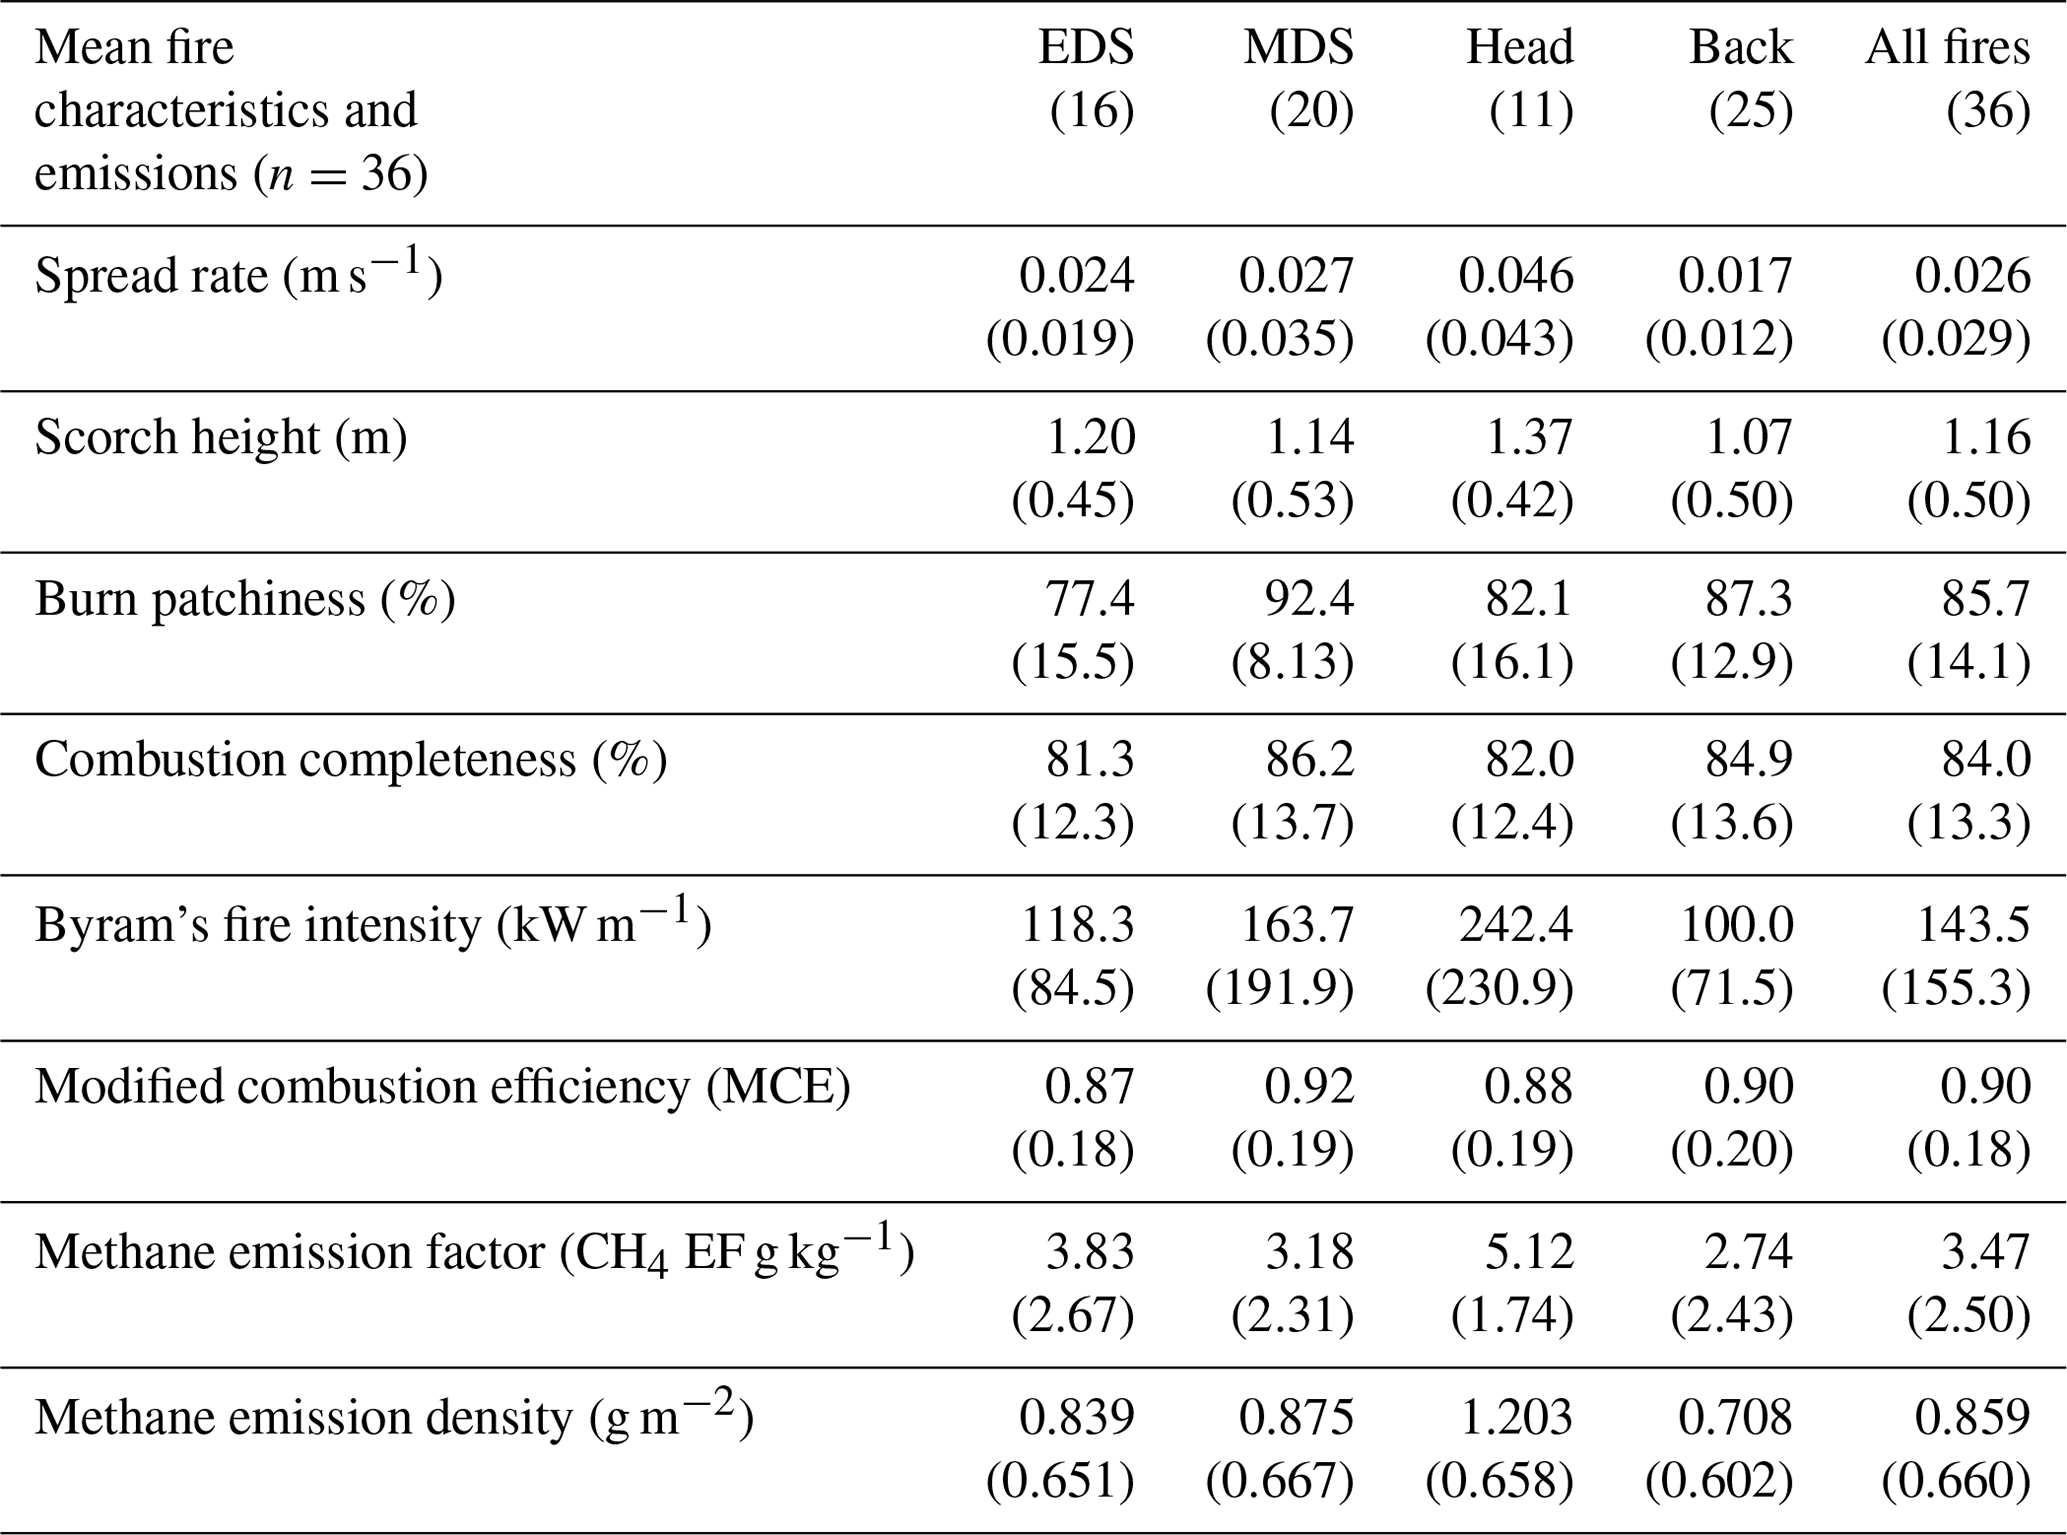
The characteristics of the fires also vary by season (Table 2). The mean BP increased as the dry season progressed from 77.4 % in the EDS to 92.3 % in the MDS, as expected due to the gradual desiccation of the biomass and slight rise in wind speed. CC also increased from the early to middle season (81.3 % to 86.2 %). These variables showed great variability in both seasons. Spread rate and intensity increased from the early to the middle season, with the high variation in intensity values reflecting the wide variety of fuel, weather and fire conditions. The data also show that fire type has a large influence on fire intensity, as expected; head-fire mean intensity was much greater than that for backfires (242.4 W m−1 to 100.0 W m−1). In addition, we found a large variation in the fire-line intensity values especially for head fires.
Table 2Mean fire characteristics and emissions by study period and fire type (2014–2016, Mali).
3.3 Methane emissions and MCE
The mean EF for methane was 3.47 g kg−1, and the mean MCE was 0.90, which is considered to be on the cusp of flaming and smoldering (Table 2). Our study found that methane EFs ranged from 3.83 g kg−1 in the EDS to 3.18 g kg−1 in the MDS. These differences yield a weak effect size of 0.25 (Cohen's d), but the small sample did not provide enough power () for this effect to be significant (p=0.45). The results indicate that fire type has a larger impact on methane EF than fire season. Head fires had nearly double the CH4 EF of backfires (5.12 to 2.74 g kg−1), and this held regardless of fire season. This difference is both significant (p=0.02) and dramatic in effect (Cohen's d=0.92) despite the relatively small sample (). MCE was also slightly lower for head fires than for backfires and lower for the EDS (0.87 compared to 0.92 for MDS).
Despite the small sample (), fire intensity (Byram's) was a significant driver of CH4 EF (p=0.03), but the correlation was modest (R=0.38), and the effect size was weak () (Fig. 3). There was a similar relationship for fire intensity and methane density (P=0.006; ) (Fig. 4). Methane emission density increased marginally from 0.839 g m−2 in the EDS to 0.875 g m−2 in the MDS. This was not significant (p=0.88), the effect size was trivial (Cohen's d=0.05), and the sample size was underpowered (). Head fires, however, had much higher emission densities than backfires (1.203 vs. 0.708 g m−2, respectively). This difference yields a strong effect (Cohen's d=0.81), which is significant (p=0.04) even though the study was underpowered ().
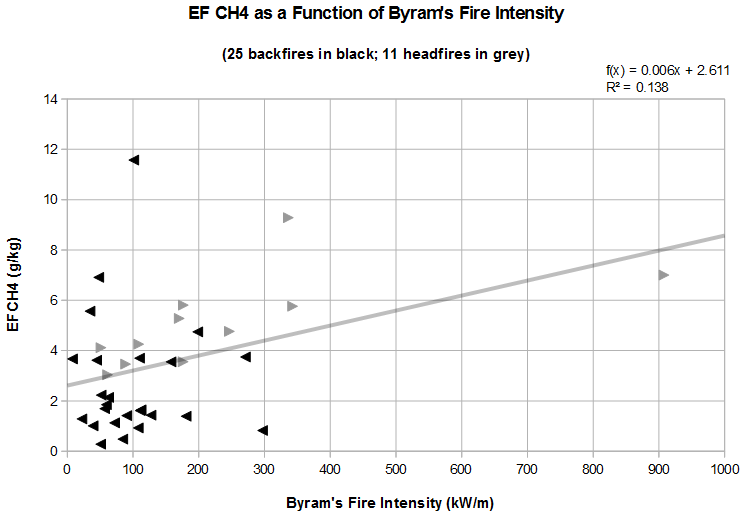
Figure 3Methane EF as a function of Byram's fire intensity for all fires. Arrows indicate fire type (2014–2016, Mali).

Figure 4Methane density as a function of Byram's fire intensity for all fires. Arrows indicate fire type (2014–2016, Mali).
We found no significant relationship between Byram's intensity and CO EF (Fig. 5) and no significant relationship between CH4 EF and either total moisture, calculated Viney moisture, or percent of grass in the biomass. We did find a negative and significant relationship between MCE and CH4 EF, as expected (P=0.000001; 6); however, the effects of fire type can be seen here as well. When head fires and backfires are examined separately, the relationship between CH4 EF and MCE for backfires is much stronger than head fires (Fig. 6). Similarly, for MCE and methane density we found a stronger relationship for backfires than head fires.
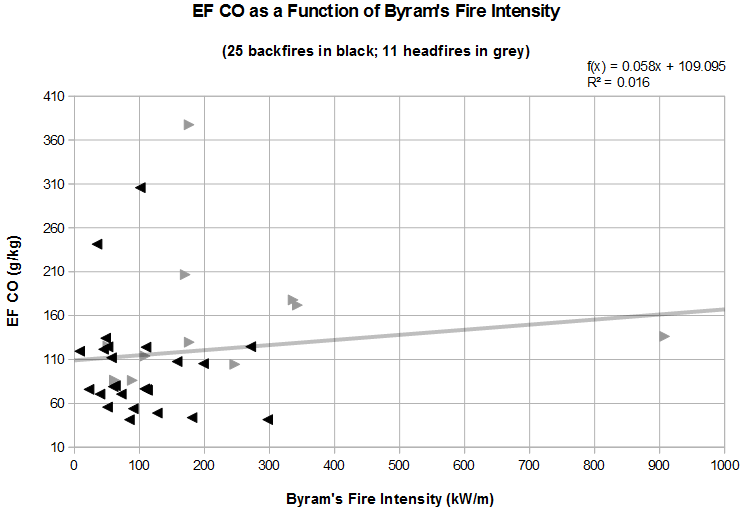
Figure 5Carbon monoxide EF as a function of Byram's fire intensity for all fires. Arrows indicate fire type (2014–2016, Mali).
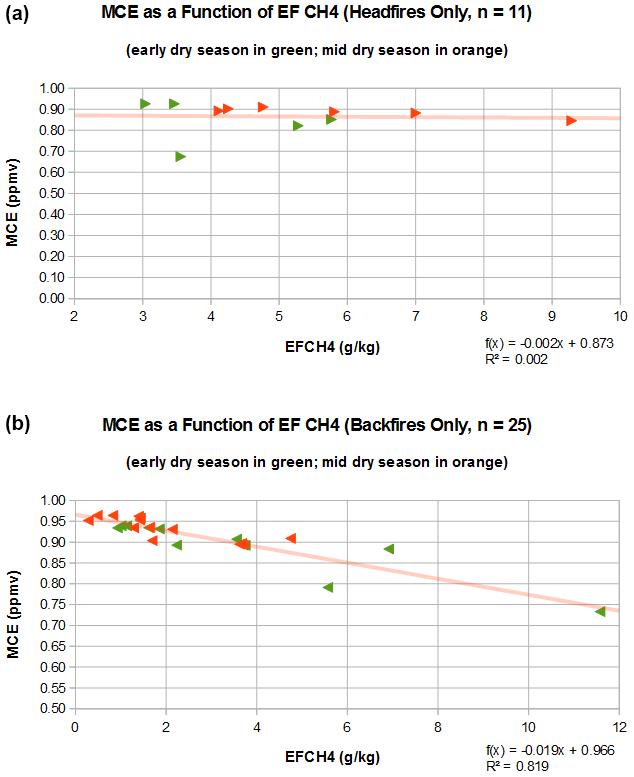
Figure 6MCE as a function of CH4 EF for head fires (a) and backfires (b). Green fires are EDS, and orange are MDS. Arrows indicate fire type (2014–2016, Mali).
Our study finds that methane EF means were highest for EDS, as expected, and dropped by about 20 % by the MDS. We found, however, that fire type had a greater (and more significant) impact on methane EF than season; head-fire methane EFs were nearly double those for backfires (5.12 to 2.74 g kg−1). In general, methane EFs increased as fire intensity increased, and head fires, which have higher fire intensity, had higher methane EFs regardless of season. Increased fire intensity results in taller flame heights, which reach into the tree canopies of the numerous small trees and burn greater amounts of fresh green leaves (Fig. 7). Indeed, our field observations recorded the highest methane emissions (over 5000 ppm) during the combustion of green leaves on small trees. We were not able to determine the amount of leaves on trees that were combusted in this study, although it is reasonable to estimate that more green leaves would burn on trees in the EDS than other seasons. Interestingly, we did not find a correlation between Byram's fire intensity and CO EF, although CH4 and CO EFs did correlate with each other, as expected. We suggest the latter finding supports our argument that higher flame heights result in increased CH4 emissions, and this suggests that CH4 and CO EFs may not be as coupled as some research suggests.
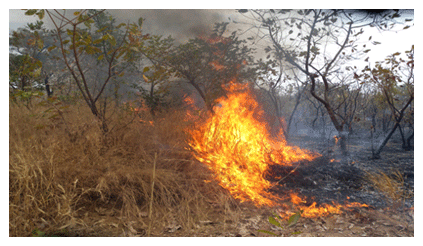
Figure 7A head fire extending from a bed of dry grasses into the green leaves in the tree canopy, Tabou Village, Mali (Photo by Paul Laris).
Our results compare favorably with the biome averages from Andreae (2019). Andreae's savanna biome mean MCE was 0.94 (± 0.02), and mean CH4 EF was 2.7 (± 2.2) g kg−1, which can be compared with our values for our MCE (f) of 0.90 and methane EF (f) of 3.47 g kg−1 (Table 3). If we use the lower-percent carbon value for West African savannas (42.5 % based on Lacaux et al. (1995) as opposed to 50 % used for comparative purposes), then our methane EF (adjusted) values (2.95 g kg−1) are quite close to the biome means. It is not surprising that our values had a lower MCE and higher CH4 EF than the biome means because we based our values on emissions from “wooded mesic savannas” as opposed to the “grassland” values used in most savanna biome estimates. Wooded savannas contain small trees, shrubs and leaf litter, which tend to reduce MCE and increase methane EF values (e.g., Vernooij et al., 2021) due to the fraction of ligneous fuel in the mix.
Table 3A comparison of methane EF values for seasonal savanna and woodland fire studies.

* Although Russell-Smith et al. (2021) refer to their fires as EDS for comparative purposes, they are more in line with MDS burning for reasons noted below. NA – not available.
Our results compare favorably for seasonal changes in methane EFs found by Korontzi (2005) for East African woodland savanna. Importantly, our data are more in line with Korontzi's values for “woodlands” (Miombo) than for “grassland” (Dambo) savannas (Table 3). We attribute this to the fact that both areas have mesic rainfall regimes and high tree and shrub cover. As noted, we found the percent of grass of the total plot biomass is greatest in the EDS, while the total biomass is higher in the MDS, reflecting a tripling of leaf litter biomass.
Korontzi (2005) argued that because EDS fires have a much lower CC – near 0 % in the early EDS to 80 % by LDS – total emissions from EDS fires would be less than those from LDS ones. This is in spite of the fact that they found EDS fires have higher methane EFs by a factor of 1.47 for woodlands and 3.93 for grasslands (compared with our ratio of 1.20). They also found that fuel load increased by about 20 % from EDS to LDS with a big increase in MDS (we found a smaller increase). Finally, they found that methane EFs were at their peak in MDS as opposed to LDS. As a result, Korontzi concludes that for southeastern Africa, early fires produce lower methane emissions than either mid- or late-season fires in contrast to our results. Korontzi found the regional average CH4 emission densities more than doubled from 0.24 g m−2 in the EDS to 0.55 g m−2 in the LDS. By comparison, we found smaller increases by season – less than 5 %, which was insignificant. The larger range in emission density values estimated by Korontzi is derived largely from the higher range of CC used in their model. Korontzi (2005) also notes that the lower emission densities for CH4 in the EDS were mainly a result of the larger effect of the increased fuel moisture content on lowering CC compared with its effect on MCE. They note this was the opposite of what they found for their grassland fires, indicating that the amount of woody vegetation is a critical determinant of CH4 EF.
It is important to note that Korontzi's values for early season CC were derived using a model and based on fuel moisture levels alone, not experimental data. We argue that, practically speaking, people do not set fires when grasses are too moist to carry fire in West Africa. As such, we argue that using CC values less than 50 %, while theoretically useful, are not at all practical because people are unlikely to set such fires as they would not achieve the desired goals of burning (Laris, 2005, 2011). Indeed, it is probable that a fire which burns less than 50 % of biomass will burn a second time late in the season because a fire consuming such a small fraction will not break fuel connectivity. It is also important to note that breaking fuel connectivity is a key reason for setting early fires and a critical reason why a mosaic fire regime burns less total area (Laris et al., 2018). As such, although theoretically possible, we do not agree that using such low CC values is reasonable for determining emissions from fires in actual African landscapes. Indeed, we have rarely seen burned landscapes with more than 50 % of the biomass standing post fire.
By comparison, Russell-Smith et al. (2021) found that emission factors varied by season for Dambo grasslands but not for savanna woodlands (Table 3). They found that Dambo grasses burned in the EDS had a methane EF of over 4 times that of those burned in LDS (nearly identical with results from Korontzi). Contrastingly, they found little difference by season in methane EF for dry wooded savannas and a surprisingly higher EF in late season for more wooded savannas, which contrasts with our findings and those of Korontzi (2005) for wooded savannas. We must note, however, that the date chosen for the EDS of Russell-Smith et al. (2021) is more comparable with the MDS date used in our study – both dates represent the “middle” of the dry season. Indeed, as Russell-Smith et al. (2021) note, trees in wooded savanna had already begun dropping leaves, and grasses were fully cured at the time of their “EDS” fires – characteristics we would not associate with early burning in West Africa. As such, we would argue that Russell-Smith et al. (2021) provide good evidence that MDS (not EDS) fires produce lower methane emissions than LDS fires in Africa.
Unfortunately, there is no recognized standard for what distinguishes the early from the middle or late dry season in the savanna literature – a problem hampering fire science. Elsewhere we have argued that the dichotomous (EDS/LDS) view of savanna burning is problematic because the point at which the fire season shifts from early to late has not been adequately defined and varies by context (Laris et al., 2017; Laris, 2021). We note that although adding a third, middle season is potentially useful for research on gas emissions, the fundamental problem of typology remains. While the EDS clearly begins when the rains end, there are no recognized standards for determining when the MDS or LDS begins. While fuel moisture level holds some promise for developing a typology, the patchy heterogeneous nature of savannas means that some patches could burn “early” (higher fuel moisture) and some “late” (lower fuel moisture) in the same fire. Other factors must be considered as well, the clearest of which is leaf fall. We suggest the onset of leaf fall is a reasonable marker for a division between EDS and MDS. Weather conditions also play a critical role, and these differ by region. For example, in West Africa winds peak in MDS, but they are stronger in the LDS in southern Africa (Russell-Smith et al., 2021).
In our previous research involving a large sample of 97 experimental fires, we found that fires set in the MDS (the peak moment in local burning) differed from those set in the EDS or LDS (the seasons used in most fire studies) in key ways (Laris et al., 2020). In our larger study we found that when fires are set in accordance with local practices, MDS fires had the lowest fire intensity and scorch heights, while CC increased only slightly from the early to the middle season with a larger jump in the late season. Mean values for BP gradually increased from the early to the middle to late season due to the drying of the biomass. Fuel moisture was also slightly higher in the MDS than EDS (due to the burning of more perennials) before dropping dramatically in the LDS. Fuel loads increased in the MDS largely due to a rise in the percentage of leaf litter in the total biomass. It should be noted that an increase in leaf litter means a decrease in the amount of green leaves burned on trees. In sum, we conclude that seasonal distinctions can be useful if clearly defined, but they should be limited to specific savannas and not used for comparative purposes between regions for the purposes of determining the effects of fire on emissions.
When comparing our results for EDS and MDS fires, we find evidence for an emission trade-off. That is, while EDS fires have a lower BP than MDS fires, as well as lower CC, the lower amount of biomass burned by EDS fires is offset by the higher methane EF resulting in statistically insignificant differences in methane emission densities by season2. We must reiterate, however, that an unknown quantity of standing leaves are combusted during fires (especially the EDS when leaves remain on trees), meaning the fuel loads we measured for the EDS are an underestimation of the leafy fuels consumed. Small trees often dominate mesic savanna woodlands, such as those in West Africa. These so-called “Gulliver” trees are often less than 2 m tall because they are repeatedly burned back to the rootstock by annual fires (Laris and Dembele, 2012). We argue that the burning of small trees contributes significantly to methane release. As such, we cannot support the policy suggestion put forth by Lipsett-Moore (2018) who promote increased early burning in African savannas to reduce methane emissions. While it is theoretically possible that very early fires would burn a lower fraction of the landscape than we have observed, we argue that such a policy is just as likely to cause an increase in methane emissions due to higher methane EF of earlier burning, which may be a function of green leaf combustion (see Korontzi, 2005). It is also important to note that higher-intensity head fires would be required to increase the burned area of moist perennial grasses in the EDS3, and because head fires have a methane EF nearly double that of backfires, burning with head fires would likely counter any advantage of burning early to reduce emissions. In addition, local inhabitants would be very reluctant to set such fires due to the increased risk that setting head fires could damage field crops, which remain unharvested in the EDS.
Surprisingly, there are but a few studies of African savanna emission factors for which head-fire and backfire data are available. Wooster et al. (2011) found mean EF methane for head fires to be higher than the backfire mean by 3.35 to 1.88 g kg−1 (a similar ratio to what we found). Several laboratory results also support our finding that MCE and EF methane are functions of fire type. Keene et al. (2006) used laboratory fires of fuels from southeastern Africa and found that the type of fire (backing, heading or mixed), as well as fuel moisture, influenced MCE. The lowest MCE values they recorded were all for heading fires with relatively low moisture content, while MCE fell and EF methane rose as fuel moisture increased. Similarly, Surawski et al. (2015) found that heading fires exhibited the lowest MCE and higher methane EF.
While the primary purpose of this study was to determine realistic values for methane emissions for a representative working savanna in West Africa, the findings can inform broader-scale modeling efforts for savanna fire burning (Hanston et al., 2016) in three ways. First, we do not recommend making crude assumptions about the effects of fire season on methane emissions as these will vary by savanna. Second, there is a need to map fires according to type because head fires cause higher methane emissions for the two reasons noted above. Third, modelers need to make distinctions between savanna types because there are large differences between emissions from grass-dominated and wooded savanna landscapes as both theory and empirical results suggest. In sum, modelers should focus on developing methods to determine the direction (type) of fire remotely in addition to other key factors such as fire intensity, fuel moisture, savanna woody cover (especially small trees) and burn severity.
This study finds that when fires are set in working landscapes in accordance with well-documented burning practices of West African people, methane EFs decreased from the early dry season to the mid-dry season (although the results were not significant). We also found that methane emission density increased only marginally from EDS to the MDS, a difference that was not significant. We found that fire type had a much greater effect on methane emissions than fire season, with head fires having significantly higher methane EF compared to backfires and significantly higher methane densities due to higher fire intensity. We note that we are unaware of any estimates for area burned according to fire type for any of the world's savannas.
It is important to reiterate that several key findings of this study arise from documented burning practices of people living in working landscapes. People set fires in West Africa later in the day resulting in fires with lower intensity due to lower wind and air temperature and higher humidity, and people predominantly set backfires, all of which contribute to lower-intensity burning, which results in lower methane emissions. In addition, we note that the fuel loads we recorded are nearly 50 % lower on working savanna lands compared to reserve lands used in some other studies (Laris et al., 2020). Finally, the number of fires peaks in the West African region in the MDS, and although the methane emission density values for the EDS were slightly lower than for the MDS, a significant reason for this was the increased fuel load from leaf litter in the MDS. We should note that EDS fires tend to burn more green leaves on trees, which are not accounted for in this study.
In conclusion, our study finds that several factors influence the emissions from savanna fires including the fire season, fuel load and type, and, most importantly, fire type. Each of these factors are a function of human land and fire management practices. We also conclude there is an emission trade-off in setting fires earlier, and, as such, a policy to increase the amount of early burning in West African would be very difficult to implement because much burning is already “early” and because earlier burning of uncured grasses and green leaves would likely result in higher methane EFs. Moreover, any policy aimed at increasing the amount of early burning would likely require setting head fires, which would decrease burn patchiness and increase combustion completeness, further negating the effects of any reduction in burned area while also causing an undesired increase in uncontrolled fires.
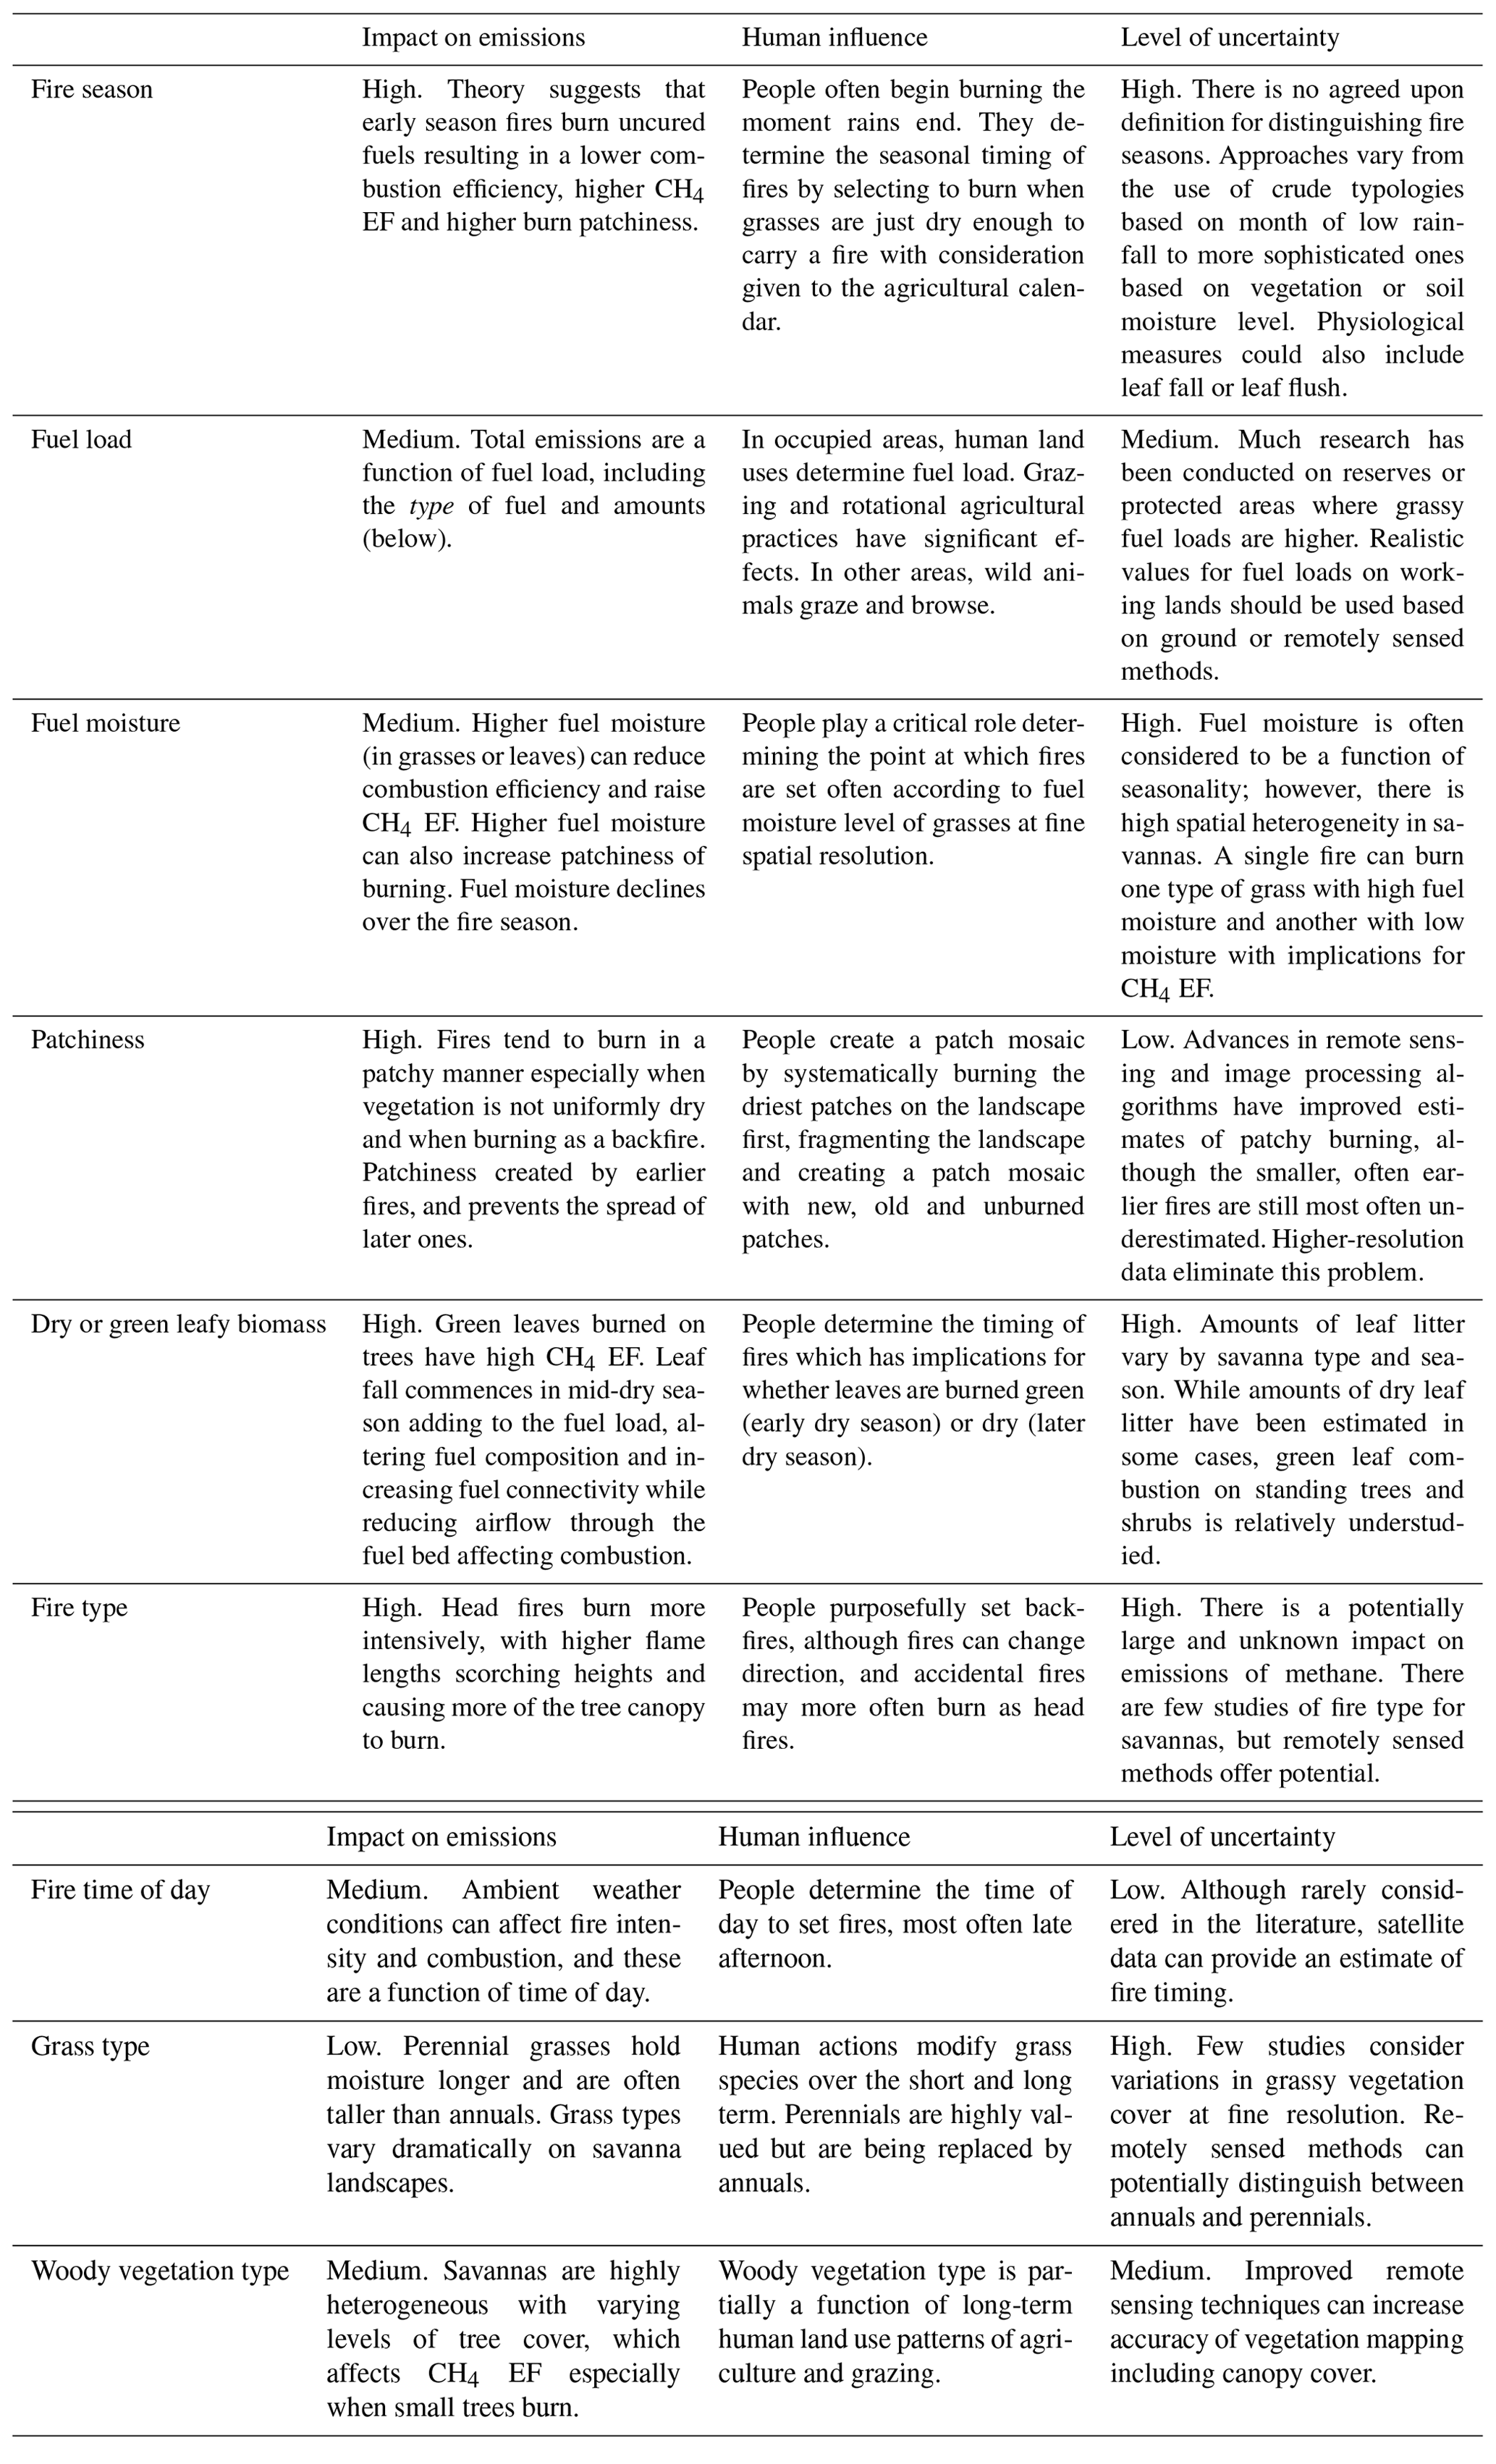
Table A1Factors affecting methane emissions from West African savanna fires, human influence and uncertainty.
Notes are available at https://cla.csulb.edu/departments/geography/savannalabo/wp-content/uploads/2021/01/Notes-for-Mali-fire-data-2016-2018.docx (Laris, 2016–2018a).
Data are available at https://cla.csulb.edu/departments/geography/savannalabo/wp-content/uploads/2021/01/Cannister_data-with-EF-and-MCE-good.xlsx (Laris, 2016–2018b) and https://cla.csulb.edu/departments/geography/savannalabo/wp-content/uploads/2021/01/Mali-2015-2018-final-merge-all-gases-by-plot.xlsx (Laris, 2016–2018c).
PL was principal investigator on the project, supervised all aspects of the research and wrote the manuscript. MK was involved in the fieldwork and the gathering, cleaning and organizing of all data, as well as commenting on the manuscript. FD was head of the field research team and advisor in the field. RJ and LY were involved in data organization and analysis, as well as discussing and commenting on the manuscript. CMR was responsible for the statistical analysis with assistance from QL.
The contact author has declared that neither they nor their co-authors have any competing interests.
Publisher’s note: Copernicus Publications remains neutral with regard to jurisdictional claims in published maps and institutional affiliations.
This article is part of the special issue “The role of fire in the Earth system: understanding interactions with the land, atmosphere, and society (ESD/ACP/BG/GMD/NHESS inter-journal SI)”. It is a result of the EGU General Assembly 2020, 3–8 May 2020.
The authors wish to thank Fakuru Camara for his never-ending help in the field, Umu Kante for keeping us all happy and fed, and the people of Tabou and Faradiélé for supporting this research.
This research has been supported by the National Science Foundation (grant nos. 1313820 and G181115100).
This paper was edited by Fang Li and reviewed by Sally Archibald and three anonymous referees.
Andreae, M. O.: Emission of trace gases and aerosols from biomass burning – an updated assessment, Atmos. Chem. Phys., 19, 8523–8546, https://doi.org/10.5194/acp-19-8523-2019, 2019.
Andreae, M. O. and Merlet, P.: Emission of trace gases and aerosols from biomass burning, Global Biogeochem. Cy., 15, 955–966, 2001.
Bonsang, B., Boissard, C., Le Cloarec, M. F., Rudolph, J., and Lacaux, J. P.: Methane, carbon monoxide and light non-methane hydrocarbon emissions from African savanna burnings during the FOS/DECAFE experiment, J. Atmos. Chem., 22, 149–162, 1995.
Byram, G. M.: Combustion of forest fuels, edited by: Davis, K. P., Forest fire: Control and use, McGraw-Hill, New York, 61–89, 1959.
Charnley, S., Sheridan, T. E., and Nabhan, G. P. (Eds.): Stitching the West Back Together: Conservation of Working Landscapes, The University of Chicago Press, Chicago, 2014.
Duvall, C. S.: Biocomplexity from the ground up: Vegetation patterns in a west African savanna landscape, Ann. Assoc. Am. Geogr., 101, 497–522, 2011.
Faul, F., Erdfelder, E., Buchner, A., and Lang, A.-G.: Statistical power analyses using G*Power 3.1: Tests for correlation and regression analyses, Behav. Res. Methods, 41, 1149–1160, 2009.
Giglio, L., Randerson, J. T., van der Werf, G. R., Kasibhatla, P. S., Collatz, G. J., Morton, D. C., and DeFries, R. S.: Assessing variability and long-term trends in burned area by merging multiple satellite fire products, Biogeosciences, 7, 1171–1186, https://doi.org/10.5194/bg-7-1171-2010, 2010.
Grégoire, J.-M., Eva, H. D., Belward, A. S., Palumbo, I., Simonetti, D., and Brink, A.: Effect of land-cover change on Africa's burnt area, Int. J. Wildland Fire, 22, 107–120, 2013.
Hammer, O., Harper, D. A. T., and Ryan, P. D.: PAST: Paleontological Statistics Software Package for Education and Data Analysis, Palaeontol. Electron., 4, 1–9, 2001.
Hantson, S., Arneth, A., Harrison, S. P., Kelley, D. I., Prentice, I. C., Rabin, S. S., Archibald, S., Mouillot, F., Arnold, S. R., Artaxo, P., Bachelet, D., Ciais, P., Forrest, M., Friedlingstein, P., Hickler, T., Kaplan, J. O., Kloster, S., Knorr, W., Lasslop, G., Li, F., Mangeon, S., Melton, J. R., Meyn, A., Sitch, S., Spessa, A., van der Werf, G. R., Voulgarakis, A., and Yue, C.: The status and challenge of global fire modelling, Biogeosciences, 13, 3359–3375, https://doi.org/10.5194/bg-13-3359-2016, 2016.
Heimann, M.: Enigma of the recent methane budget, Nature, 476, 157–158, 2011.
Henry, C.: An integrated approach to estimating groundwater storage, variability and recharge in Southern Mali, Africa, M.Sc Thesis, Department of Earth Sciences, Simon Fraser University, Canada, 2011.
Hoffa, E. A., Wakimoto, R. H., Ward, D. E., Hao, W. M., and Susott, R. A.: Seasonality of carbon emissions from biomass burning in a Zambian savanna, J. Geophys. Res., 104, 13841–13853, 1999.
IPCC: Good Practice Guidance for Land Use, Land-Use Change and Forestry, available at: http://www.ipcc-nggip.iges.or.jp/public/gpglulucf/gpglulucf_contents.html (last access: 25 November 2021), 2003.
IPCC: Guidelines for National Greenhouse Gas Inventories, Agriculture, Forestry and other Land Use (AFOLU), Vol. 4, available at: http://www.ipcc-nggip.iges.or.jp/public/2006gl/vol4.html (last access: 25 November 2021), 2006.
Katzenstein, A. S., Doezema, L. A., Simpson, I. J., Blake, D. R., and Rowland, F. S.: Extensive regional atmospheric hydrocarbon pollution in the southwestern United States, P. Natl. Acad. Sci. USA, 100, 11975–11979, 2003.
Keeley, J. E. and Pausas, J. G.: Distinguishing disturbance from perturbations in fire-prone ecosystems, Int. J. Wildland Fire, 28, 282–287, 2019.
Keene, W. C., Lobert, J. M., Crutzen, P. J., Maben, J. R., Scharffe, D. H., Landmann, T., Hély, C., and Brain, C.: Emissions of major gaseous and particulate species during experimental burns of southern African biomass, J. Geophys. Res., 111, D04301, https://doi.org/10.1029/2005JD006319, 2006.
Kirschke, S., Bousquet, P., Ciais, P., Saunois, M., Canadell, J. G., Dlugokencky, E. J., Bergamaschi, P., Bergmann, D., Blake, D. R., Bruhwiler, L., Cameron-Smith, P., Castaldi, S., Chevallier, F., Feng, L., Fraser, A., Heimann, A., Hodson, E. L., Houweling, S., Josse, B., Fraser, P. J., Krummel, P. B., Lamarque, J.-F., Langenfelds, R. L., Le Quéré, C., Naik, V., O'Doherty, S., Palmer, P. I., Pison, I., Plummer, D., Poulter, B., Prinn, R. G., Rigby, M., Ringeval, B., Santini, M., Schmidt, M., Shindell, D. T., Simpson, I. J., Spahni, R., Steele, L. P., Strode, S. A., Sudo, K., Szopa, S., van der Werf, G. R., Voulgarakis, A., van Weele, M., Weiss, R. F., Williams, J. E., and Zeng, G.: Three decades of global methane sources and sinks, Nat. Geosci., 6, 813–823, 2013.
Koné, M., Dembele, F., and Laris, P.: Inventaire, typologie et estimation quantitative des gaz émis par les feux de brousse en savane soudanaise dans le sud Mali, Revue de Géographie Tropicale et d'Environnement, 2, 26–39, 2020.
Koppmann, R., von Czapiewski, K., and Reid, J. S.: A review of biomass burning emissions, part I: gaseous emissions of carbon monoxide, methane, volatile organic compounds, and nitrogen containing compounds, Atmos. Chem. Phys. Discuss., 5, 10455–10516, https://doi.org/10.5194/acpd-5-10455-2005, 2005.
Korontzi, S.: Seasonal patterns in biomass burning emissions from southern African vegetation fires for the year 2000, Glob. Change Biol., 11, 1680–1700, 2005.
Lacaux, J. P., Brustet, M., and Delmas, R.: Biomass burning in the tropical savannas of Ivory Coast: An overview of the field experiment Fire of Savannas (FOS/DECAFE 91), J. Atmos. Chem., 22, 195–216, 1995.
Laris, P.: Spatiotemporal problems with detecting and mapping mosaic fire regimes with coarse-resolution satellite data in savanna environments, Rem. Sens. Environ., 99, 412–424, 2005.
Laris, P.: Humanizing savanna biogeography: Linking human practices with ecological patterns in a frequently burned savanna of southern Mali, Ann. Assoc. Am. Geogr., 101, 1067–1088, 2011.
Laris, P.: Notes for Mali Fire Data (2016–2018), Mali Fire Data [data set], available at: https://cla.csulb.edu/departments/geography/savannalabo/wp-content/uploads/2021/01/Notes-for-Mali-fire-data-2016-2018.docx (last access: 26 November 2021), 2016–2018a.
Laris, P.: Canister Data with EF, Mali Fire Data [data set], available at: https://cla.csulb.edu/departments/geography/savannalabo/wp-content/uploads/2021/01/Cannister_data-with-EF-and-MCE-good.xlsx (last access: 26 November 2021), 2016–2018b.
Laris, P.: Final Merge – All Gases by Plot, Mali Fire Data [data set], available at: https://cla.csulb.edu/departments/geography/savannalabo/wp-content/uploads/2021/01/Mali-2015-2018-final-merge-all-gases-by-plot.xlsx (last access: 26 November 2021), 2016–2018c.
Laris, P.: On the problems and promises of savanna fire regime change, Nat. Commun., 12, 4891, https://doi.org/10.1038/s41467-021-25141-1, 2021.
Laris, P. and Dembele, F.: Humanizing savanna models: integrating natural factors and anthropogenic disturbance regimes to determine tree-grass dynamics in savannas, J. Land Use Sci., 7, 459–482, 2012.
Laris, P., Dadashi, S., Jo, A., and Wechsler S.: Buffering the savanna: Fire regimes and disequilibrium ecology in West Africa, Plant Ecol., 217, 583–596, 2016.
Laris, P., Koné, M., Dadashi, S., and Dembele, F.: The early/late fire dichotomy: Time for a reassessment of Aubreville's savanna fire experiments, Prog. Phys. Geogr., 41, 68–94, 2017.
Laris, P., Jo, A., Wechsler, S., and Dadashi, S.: The Effects of Landscape Pattern and Vegetation Type on the Fire Regime of a Mesic Savanna in Mali, J. Environ. Manag., 227, 134–145, 2018.
Laris, P., Jacobs, R., Koné, M., Dembele, F., and Rodrigue, C. M.: Determinants of fire intensity in working landscapes of an African savanna, Fire Ecol., 16, 27, https://doi.org/10.1186/s42408-020-00085-x, 2020.
Laris, P., Yang, L., Dembele, F., and Rodrigue, C. M.: Fire and water: the role of grass competition on juvenile tree growth and survival rates in a mesic savanna, Plant Ecol., 222, 861–875, https://doi.org/10.1007/s11258-021-01149-x, 2021.
Lipsett-Moore, G. J., Wolff, N. H., and Game, E. T.: Emissions mitigation opportunities for savanna countries from early dry season fire management, Nat. Commun., 9, 2247, https://doi.org/10.1038/s41467-021-25042-3, 2018.
Murphy, B., Russell-Smith, J., Edwards, A., Meyer, M., and Meyer, C. P. (Eds.): Carbon Accounting and Savanna Fire Management, CSIRO Press, Australia, 2012.
National Aeronautics and Space Administration (NASA), Biomass burning, https://earthobservatory.nasa.gov/features/BiomassBurning/biomass_burning3.php (last access: 20 November 2021), 2005.
Russell-Smith, J., Murphy, B. P., Meyer, C. P., Cook, G. D., Maier, S., Edwards, A. C., Schatz, J., and Brocklehurst, P.: Improving estimates of savanna burning emissions for greenhouse accounting in northern Australia: Limitations, challenges, applications, Int. J. Wildland Fire, 18, 1–18, 2009.
Russell-Smith, J., Yates, C., Vernooij, R., Eames, T., van der Werf, G., Ribeiro, N., Edwards, A., Beatty, R., Lekoko, O., Mafoko, J., Monagle, C., and Johnston, S.: Opportunities and challenges for savanna burning emissions abatement in southern Africa, J. Environ. Manage., 288, 112414, https://doi.org/10.1016/j.jenvman.2021.112414, 2021.
Saunois, M., Jackson, R. B., Bousquet, P., Poulter, B., and Canadell, J. G.: The growing role of methane in anthropogenic climate change, Environ. Res. Lett., 11, 120207, https://doi.org/10.1088/1748-9326/11/12/120207, 2016.
Saunois, M., Stavert, A. R., Poulter, B., Bousquet, P., Canadell, J. G., Jackson, R. B., Raymond, P. A., Dlugokencky, E. J., Houweling, S., Patra, P. K., Ciais, P., Arora, V. K., Bastviken, D., Bergamaschi, P., Blake, D. R., Brailsford, G., Bruhwiler, L., Carlson, K. M., Carrol, M., Castaldi, S., Chandra, N., Crevoisier, C., Crill, P. M., Covey, K., Curry, C. L., Etiope, G., Frankenberg, C., Gedney, N., Hegglin, M. I., Höglund-Isaksson, L., Hugelius, G., Ishizawa, M., Ito, A., Janssens-Maenhout, G., Jensen, K. M., Joos, F., Kleinen, T., Krummel, P. B., Langenfelds, R. L., Laruelle, G. G., Liu, L., Machida, T., Maksyutov, S., McDonald, K. C., McNorton, J., Miller, P. A., Melton, J. R., Morino, I., Müller, J., Murguia-Flores, F., Naik, V., Niwa, Y., Noce, S., O'Doherty, S., Parker, R. J., Peng, C., Peng, S., Peters, G. P., Prigent, C., Prinn, R., Ramonet, M., Regnier, P., Riley, W. J., Rosentreter, J. A., Segers, A., Simpson, I. J., Shi, H., Smith, S. J., Steele, L. P., Thornton, B. F., Tian, H., Tohjima, Y., Tubiello, F. N., Tsuruta, A., Viovy, N., Voulgarakis, A., Weber, T. S., van Weele, M., van der Werf, G. R., Weiss, R. F., Worthy, D., Wunch, D., Yin, Y., Yoshida, Y., Zhang, W., Zhang, Z., Zhao, Y., Zheng, B., Zhu, Q., Zhu, Q., and Zhuang, Q.: The Global Methane Budget 2000–2017, Earth Syst. Sci. Data, 12, 1561–1623, https://doi.org/10.5194/essd-12-1561-2020, 2020.
Surawski, N. C., Sullivan, A. L., Meyer, C. P., Roxburgh, S. H., and Polglase, P. J.: Greenhouse gas emissions from laboratory-scale fires in wildland fuels depend on fire spread mode and phase of combustion, Atmos. Chem. Phys., 15, 5259–5273, https://doi.org/10.5194/acp-15-5259-2015, 2015.
van Leeuwen, T. T. and van der Werf, G. R.: Spatial and temporal variability in the ratio of trace gases emitted from biomass burning, Atmos. Chem. Phys., 11, 3611–3629, https://doi.org/10.5194/acp-11-3611-2011, 2011.
van Leeuwen, T. T., van der Werf, G. R., Hoffmann, A. A., Detmers, R. G., Rücker, G., French, N. H. F., Archibald, S., Carvalho Jr., J. A., Cook, G. D., de Groot, W. J., Hély, C., Kasischke, E. S., Kloster, S., McCarty, J. L., Pettinari, M. L., Savadogo, P., Alvarado, E. C., Boschetti, L., Manuri, S., Meyer, C. P., Siegert, F., Trollope, L. A., and Trollope, W. S. W.: Biomass burning fuel consumption rates: a field measurement database, Biogeosciences, 11, 7305–7329, https://doi.org/10.5194/bg-11-7305-2014, 2014.
Vernooij, R., Giongo, M., Borges, M. A., Costa, M. M., Barradas, A. C. S., and van der Werf, G. R.: Intraseasonal variability of greenhouse gas emission factors from biomass burning in the Brazilian Cerrado, Biogeosciences, 18, 1375–1393, https://doi.org/10.5194/bg-18-1375-2021, 2021.
Viney, N. R.: A review of fine fuel moisture modelling, Int. J. Wildland Fire, 1, 215–234, https://doi.org/10.1071/WF9910215, 1991.
Williams, R. J., Gill, A. M., and Moore, P. H.: Seasonal changes in fire behavior in a tropical savanna in northern Australia, Int. J. Wildland Fire, 8, 227–239, 1998.
Wooster, M. J., Freeborn, P. H., Archibald, S., Oppenheimer, C., Roberts, G. J., Smith, T. E. L., Govender, N., Burton, M., and Palumbo, I.: Field determination of biomass burning emission ratios and factors via open-path FTIR spectroscopy and fire radiative power assessment: headfire, backfire and residual smouldering combustion in African savannahs, Atmos. Chem. Phys., 11, 11591–11615, https://doi.org/10.5194/acp-11-11591-2011, 2011.
Worden, J. R., Bloom, A. A., Pandey, S., Jiang, Z., Worden, H. M., Walker, T. W., Houweling, S., and Röckmann, T.: Reduced biomass burning emissions reconcile conflicting estimates of the post-2006 atmospheric methane budget, Nat. Commun., 8, 2227, https://doi.org/10.1038/s41467-017-02246-0, 2017.
Ward, D. E., Hao, W. M., Susott, R. A., Babbitt, R. E., Shea, R. W., Kauffman, J. B., and Justice, C. O.: Effect of fuel composition on combustion efficiency and emission factors for African savanna ecosystems, J. Geophys. Res., 101, 23569–23576, 1996.
We used the value of 20 000 kJ kg−1 following Williams et al. (1998, p. 230) who note: “Given the range and lack of consistency between studies in the value of H, and, in the view of the authors, the misleading precision implied by values rounded to the nearest 100 kJ kg−1, 20 000 kJ kg−1 is within the range of reported vales and is easy and convenient to apply.”.
We note that results from our larger study of 97 fires found a less dramatic rise in BP and CC from EDS to MDS to LDS than for the sample of 36 fires used here. In the larger study, BP increased marginally as the dry season progressed to a near-complete burn by the late season (85.3 % to 92.3 % to 99.2 %). CC increased very slightly from the early to middle season before increasing substantially in the late season (85.1 % to 86.4 % to 92.8 %) (Laris et al., 2020). These findings suggest a stronger emission trade-off than reported here.
We made several attempts to burn perennial grasses in December and could not get them to ignite. Only under windy, head-fire conditions will perennial grasses burn in the EDS.