the Creative Commons Attribution 4.0 License.
the Creative Commons Attribution 4.0 License.
 | 06 Dec 2021
Quantifying the role of moss in terrestrial ecosystem carbon dynamics in northern high latitudes
Junrong Zha
Mosses are ubiquitous in northern terrestrial ecosystems, and play an important role in regional carbon, water and energy cycling. Current global land surface models that do not consider mosses may bias the quantification of regional carbon dynamics. Here we incorporate mosses as a new plant functional type into the process-based Terrestrial Ecosystem Model (TEM 5.0), to develop a new model (TEM_Moss). The new model explicitly quantifies the interactions between vascular plants and mosses and their competition for energy, water, and nutrients. Compared to the estimates using TEM 5.0, the new model estimates that the regional terrestrial soils currently store 132.7 Pg more C and will store 157.5 and 179.1 Pg more C under the RCP8.5 and RCP2.6 scenarios, respectively, by the end of the 21st century. Ensemble regional simulations forced with different parameters for the 21st century with TEM_Moss predict that the region will accumulate 161.1±142.1 Pg C under the RCP2.6 scenario and 186.7±166.1 Pg C under the RCP8.5 scenario over the century. Our study highlights the necessity of coupling moss into Earth system models to adequately quantify terrestrial carbon–climate feedbacks in the Arctic.


Northern high-latitude ecosystems, which refer to the land ecosystems (>45∘ N) in northern temperate, boreal, grassland, and tundra regions, hold about 30 % of global terrestrial carbon (C) in soils and plants (Allison and Treseder, 2008; Jobbágy and Jackson, 2000; Kasischke, 2000; Tarnocai et al., 2009; Hugelius et al., 2014) and contain as much as 1024 Pg soil organic carbon from 0 to 3 m depth (Treseder et al., 2016; Schuur et al., 2008). This large amount of carbon is potentially responsive to ongoing global warming (Burke et al., 2017; Koven et al., 2015; Comyn-Platt et al., 2018), which is especially pronounced at high latitudes (Treseder et al., 2016). Thus, explicit investigation of carbon–climate feedback is important (Wieder et al., 2013; Bond-Lamberty and Thomson, 2010).
Ecosystem models are important tools for understanding the role of boreal ecosystems in carbon–climate feedbacks (Bond-Lamberty et al., 2005; Chadburn et al., 2017; Zhuang et al., 2002; Treseder et al., 2016). Process-based biogeochemical models such as TEM (Hayes et al., 2014; Raich et al., 1991; Melillo et al., 1993; McGuire et al., 1992; Zhuang et al., 2001, 2002, 2010, 2013), Biome-BGC (Running and Coughlan, 1988; Bond-Lamberty et al., 2007), and Biosphere Energy Transfer Hydrology scheme (BETHY) (Knorr, 2000) are increasingly employed to simulate current and future carbon dynamics. Those models estimate carbon dynamics by simulating processes such as photosynthesis, respiration, nitrogen competition, evapotranspiration, and soil decomposition (Bond-Lamberty et al., 2005; Zhuang et al., 2015). The results from these models are influenced by components and processes that are built into the model (Turetsky et al., 2012; Oreskes et al., 1994). However, the role of boreal forests in carbon sink or source activities has not yet reached a consensus due to a number of model limitations (Cahoon et al., 2012; Hayes et al., 2011; Todd-Brown et al., 2013).
One limitation is that ecosystem models often ignore some important components such as understory processes that play crucial roles in biogeochemical cycles (Zhuang et al., 2002; Treseder et al., 2011; Bond-Lamberty et al., 2005). For instance, mosses are ubiquitous in northern ecosystems, and show a pattern of increasing abundance with increasing latitude (Turetsky et al., 2012; Jägerbrand et al., 2006). Their functional traits, including tolerance to drought and a broad response of net assimilation rates to temperature, allow them to persist in high-latitude regions (Harley et al., 1989). The activities of moss that are related to water, nutrients, and energy may influence several ecosystem processes such as permafrost formation and thaw, peat accumulation, soil decomposition, and net primary productivity (NPP) (Turetsky et al., 2012; Nilsson and Wardle, 2005). Mosses can have positive or negative interactions with vascular plants (Skre and Oechel, 1979; Turetsky et al., 2010). On the one hand, mosses compete with vascular plants for available nutrients, negatively affecting vascular plant productivity (Skre and Oechel, 1979; Gornall et al., 2011; Turetsky et al., 2012). Besides, a thick moss cover can form an environment with water logging or low oxygen supply, which is common in high-latitude regions (Skre and Oechel, 1979; Cornelissen et al., 2007). The moss cover prevents absorbed solar heat from being conducted down into the soil and tends to decrease soil temperature in summer. Therefore, soil decomposition rates can be affected since they are mediated by soil temperature, which will further influence growth of vascular plants (Gornall et al., 2007). On the other hand, some species of mosses can serve as an important source of nitrogen because of their associations with microbial nitrogen fixers (Basilier, 1979; DeLuca et al., 2007; Markham, 2009; Kip et al., 2011). Thus, mosses can also exert positive effects on plant growth due to their regulation of nitrogen availability for vascular plants (Hobbie et al., 2000; Gornall et al., 2007). It is gradually being recognized that mosses can have comparable influences on high-latitude ecosystems to vascular plants, due to their large density and essential function in plant competition, soil climate, and carbon and nutrient cycling (Longton, 1988; Lindo and Gonzalez, 2010; Okland, 1995; Pharo and Zartman, 2007). They can on average contribute 20 % of aboveground NPP in boreal forests (Turetsky et al., 2010), and their annual NPP may reach as high as 350 g C m−2 in some regions in the Arctic (Pakarinen and Vitt 1973), even exceeding that of vascular plants (Oechel and Collins, 1976; Clarke et al., 1971). Thus, ignoring mosses, the keystone species of boreal ecosystems, can pose large biases in model predictions and limit the utility of models. To date, a number of ecosystem models have already included moss activities to explore the response of moss to disturbance (Bond-Lamberty et al., 2007; Euskirchen et al., 2009; Frolking et al., 2010) or improve model prediction of carbon dynamics (Bond-Lamberty et al., 2005). However, the potential role of moss in the regional carbon dynamics in northern high latitudes has been slowly evaluated by considering the interactions between moss and vascular plants, especially with respect to their competition for water, nutrients, and energy.
This study developed a new version of the Terrestrial Ecosystem Model (Raich et al., 1991; McGuire et al., 1992; Zhuang et al., 2001, 2002, 2010, 2013, 2015), hereafter referred to as TEM_Moss, by explicitly considering moss impacts on terrestrial ecosystem carbon dynamics. The competition for water, energy, and nutrients between vascular plants and mosses is explicitly modeled. The verified TEM_Moss and previous TEM were compared against the observed data of ecosystem carbon, soil temperature, and moisture dynamics. Both models were then used to analyze the regional carbon dynamics in northern high latitudes (north of 45∘ N) during the 20th and 21st centuries.
2.1 Overview
First, we briefly describe how we developed the TEM_Moss by modifying the previous TEM 5.0 to consider their interactions between vascular plants and mosses. Second, parameterization and validation of TEM_Moss using measured gap-filled carbon flux data and meteorological data at representative sites are presented. Third, we present how we have applied both models (TEM_Moss and TEM 5.0) to the northern high latitudes (above 45∘ N) to quantify regional carbon dynamics during the 20th and 21st centuries.
2.2 Model description
TEM is a process-based, large-scale biogeochemical model that uses monthly climatic data and spatially explicit vegetation and soil information to simulate the dynamics of carbon and nitrogen fluxes and pool sizes of plants and soils (Raich et al., 1991; McGuire et al., 1992; Zhuang et al., 2010, 2015). However, in previous versions of TEM, the interactions between mosses and vascular plants on carbon and nitrogen cycling have not been included. Here we developed a TEM_Moss model by modifying model structure and incorporating activities of moss into extant TEM 5.0 (Zhuang et al., 2003). Based on the structure of TEM 5.0, we added carbon and nitrogen pools and fluxes to simulate activities of moss including photosynthesis, respiration, litterfall, and nutrient and water cycling (Fig. 1). Thus, the structure of TEM_Moss includes the processes of both vascular plants and mosses (Fig. 1).
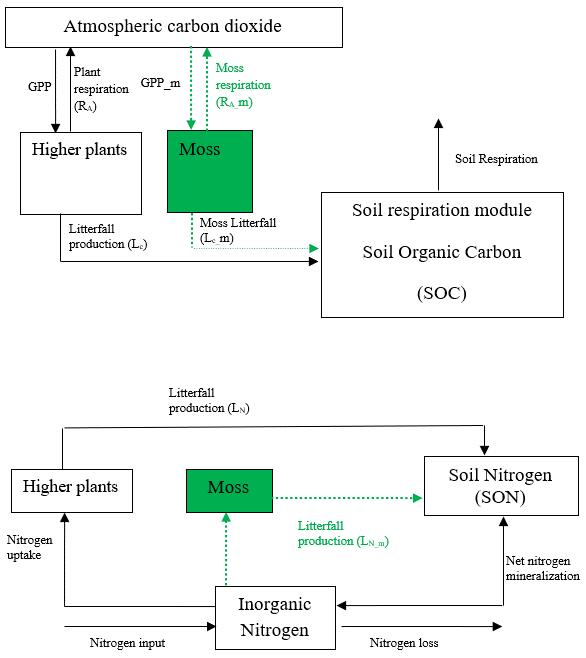
Figure 1Schematic diagram of TEM_Moss: green dashed arrows are new carbon and nitrogen fluxes, representing moss production, moss respiration, and litterfall of moss. Black arrows were in TEM 5.0 (Zhuang et al., 2013).
In TEM_Moss, moss photosynthesis (GPPm) is described as a maximum rate, reduced by influence of photosynthetically active radiation, mean air temperature, mean atmospheric carbon dioxide concentrations, moss moisture, and indirectly nitrogen availability (Frolking et al., 1996; Launiainen et al., 2015; Zhuang et al., 2002). For each time step, GPPm is calculated as
where Cmax denotes the maximum rate of carbon assimilation by moss (units: ). f(PAR) is a scalar function that depends on monthly photosynthetically active radiation (PAR), which is calculated as (Frolking et al., 1996; Launiainen et al., 2015; Kulmala et al., 2011)
where b (units: ) is the half saturation constant for PAR use by moss as indicated by the Michaelis–Menten kinetic.
The temperature effect on moss photosynthesis is modeled as a multiplier (Frolking et al., 1996; Raich et al., 1991):
where T is the monthly mean air temperature (units: ∘C), and Tmin, Tmax, and Topt are parameters (units: ∘C) that limit f(T) to a range of zero to 1.
The moisture effect is also modeled as a multiplier (Frolking et al., 1996; Raich et al., 1991):
where wm is moss moisture (units: mm), and wmin, wmax, and wopt are related parameters (units: mm) that limit f(wm) to a range of zero to 1.
f([CO2]) is also a scalar function that depends on monthly mean atmospheric carbon dioxide concentration (Zhuang et al., 2002; Raich et al., 1991):
where [CO2] (units: µL L−1) represents monthly mean atmospheric carbon dioxide concentration, and km (units: µL L−1) is the internal CO2 concentration at which moss C assimilation proceeds at one-half its maximum rate.
The function f(NA) models the limiting effects of plant nitrogen status on GPP (McGuire et al., 1992; Zhuang et al., 2002), which is a scalar function that depends on monthly N available for incorporation into plant production of new tissue.
Meanwhile, in TEM_Moss, we defined the moss respiration rate (Rm) as a function of moss respiration rate at 10 ∘C, moss respiration temperature sensitivity which was expressed as a Q10 function, and moss moisture (Launiainen et al., 2015; Frolking et al., 1996):
where R10,m (units: ) represents the moss respiration rate at 10 ∘C, the parameter Q10,m is moss respiration temperature sensitivity, Tm is moss temperature (∘C) and wm is moss moisture (mm).
The function f∗(wm) denotes the moisture effect on moss respiration. Here we used f∗(wm) to distinguish from the function f(wm), which is moisture effect on moss photosynthesis as mentioned earlier. f∗(wm) is defined as (Frolking et al., 1996; Zhuang et al., 2002)
where wopt,r (units: mm) denotes the optimal water content for moss respiration.
Besides, the carbon in litter production from mosses to soil (LC,m) is modeled as proportional to moss carbon biomass with a constant ratio (Zhuang et al., 2002):
where MOSSC denotes the moss carbon biomass, and cfallm is the corresponding constant proportion.
Thus, the change of moss carbon pool (MOSSC) can be modeled as
On the other hand, research has shown that mosses can uptake substantial inorganic nitrogen from the bulk soil (Ayres et al., 2006; Fritz et al., 2014). In our model, nitrogen uptake by moss (Nuptakem) is modeled as a function of available soil nitrogen, moss moisture, and mean air temperature, and the relative amount of energy allocated to N versus C uptake (Zhuang et al., 2002; Raich et al., 1991):
where Nmax is the maximum rate of nitrogen uptake by mosses (units: ), and Nav (units: g m−2) represents available soil nitrogen, which is treated as a state variable in our model. kn (units: g m−2) is the concentration of available soil nitrogen at which nitrogen uptake proceeds at one-half its maximum rate. T is the monthly mean air temperature (∘C), and Am is a unitless parameter ranging from 0 to 1, which represents relative allocation of effort to carbon vs. nitrogen uptake. Ks is a parameter accounting for relative differences in the conductance of the soil to N diffusion, which can be calculated through moss moisture (Zhuang et al., 2002; Raich et al., 1991):
where wf (units: mm) denotes the moss field capacity.
The nitrogen in litter production from mosses to soil (LN,m) is modeled as proportional to moss nitrogen biomass with a constant ratio (Zhuang et al., 2002):
where nfallm is the constant proportion to moss nitrogen biomass (MOSSN).
Thus, the changes in moss nitrogen pool (MOSSN) can be modeled as
At the same time, total carbon and nitrogen in litterfall and total nitrogen uptake from soil available nitrogen are changed due to incorporation of mosses:
where LC,v and LN,v are carbon and nitrogen in litter production from vascular plants to soil, and Nuptakev is nitrogen uptake by vascular plants (Raich et al., 1991; Melillo et al., 1993; Zhuang et al., 2003).
Except for the above equations, other governing equations in TEM 5.0 have not been changed. More equations of TEM 5.0 have been documented in previous studies (Raich et al., 1991; McGuire et al., 1992; Zhuang et al., 2003; Zha and Zhuang, 2018).
In TEM 5.0, a soil thermal module (STM) simulates soil thermal dynamics considering the effects of moss thickness, soil moisture, and snowpack (Zhuang et al., 2001, 2002). In STM, the soil profile was treated as a three-soil-layer system: (1) a moss plus fibric soil organic layer, (2) a humic organic soil layer, and (3) a mineral soil layer, and temperature for each layer can be derived from STM (Zhuang et al., 2001, 2002, 2003). Temperature in the moss layer is estimated with STM.
A water balance module (WBM) was also incorporated into TEM 5.0 to simulate soil hydrologic dynamics (Vörösmarty et al., 1989; Zhuang et al., 2001). The WBM receives information on precipitation, air temperature, potential evapotranspiration, vegetation, soils, and elevation to predict soil moisture evapotranspiration and runoff (Vörösmarty et al., 1989). The soil was treated as a single profile in WBM (Vörösmarty et al., 1989; Zhuang et al., 2001). To simulate moss moisture, we added a moss layer on the soil profile by modifying the WBM (Fig. 2). Similar to soil moisture, moss moisture is also treated as a state variable in the revised WBM, which is modeled as
where the term “percolation” denotes the percolation from moss, which is the sum of rainfall percolation and snowmelt percolation from moss. We assume that there is no runoff from the moss layer.

Figure 2The revised water balance model: the green dashed circle represents the hydrology dynamics for moss (Vörösmarty et al., 1989).
Accompanied by the above equation, changes in soil water (SM) are modified as
Calculations for these water fluxes regarding vascular plants were not changed. More details about an earlier version of WBM were described in Vörösmarty et al. (1989) and Zhuang et al. (2001).
2.3 Model parameterization and validation
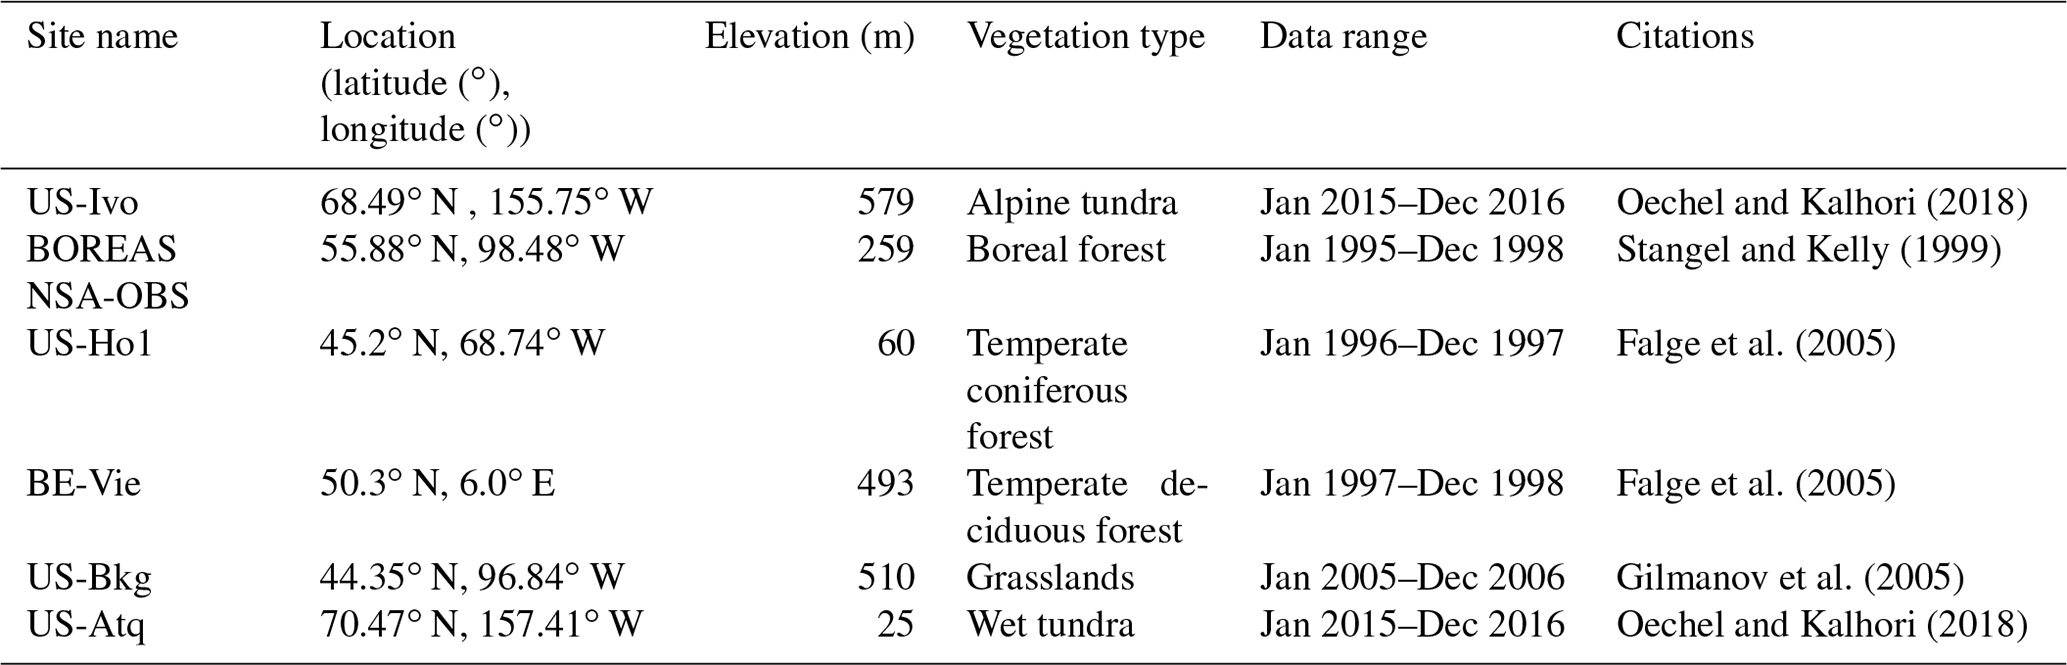
The newly introduced parameters that are associated with moss activities are documented in Table 1. We parameterized the TEM_Moss for six representative ecosystem types in northern high latitudes with gap-filled monthly net ecosystem productivity (NEP, ) data from the AmeriFlux network (Davidson et al., 2000). We assumed that the moss types are associated with the representative ecosystem types, which means we tuned the moss-related parameters for the six representative ecosystem types. Except for the moss-related parameters, other parameters related to vascular plants are default based on Zha and Zhuang (2018). The information of the six sites that we chose to calibrate the TEM_Moss is compiled in Table 2. The parameterization was conducted using a global optimization algorithm known as the SCE-UA (Shuffled complex evolution) method, which aims to minimize the difference between model simulations and measurements (Duan et al., 1994). In our calibration, the cost function of the minimization is
where NEPobs,i and NEPsim,i are the measured and simulated NEP, respectively. k is the number of data pairs for comparison. Fifty independent sets of parameters were converged to minimize the objective function, and finally the optimized parameters were derived as the mean of these 50 sets of inversed parameters. We presented the boxplot of parameter posterior distributions at sites chosen for calibration (Fig. 5). At the same time, the results of model parameterization were shown in Fig. 3. Besides these parameters related to moss, all other parameters use their default values in TEM 5.0 (Zhuang et al., 2003). Note, in TEM 5.0 and its application, the parameters were also calibrated for each representative ecosystem in northern high latitudes. Specifically, TEM 5.0 was parameterized for mixed grassland–sub-shrublands, moist non-acidic tundra, mixed hardwood and conifer forests, tallgrass prairie, savanna tropical forests, tussock tundra, and conifer forest in the region. TEM 5.0 was then extrapolated to the region to quantify carbon dynamics without considering the role of moss in boreal ecosystems (Zhuang et al., 2003). Here our revised model TEM_Moss was parameterized for representative ecosystems in the region by explicitly considering the role of moss in soil physics and carbon and nitrogen dynamics. The TEM_Moss optimized parameters were then used for model validation and extrapolation as well as comparison with TEM 5.0 simulations.
Table 1Parameters associated with moss activities in TEM_Moss.
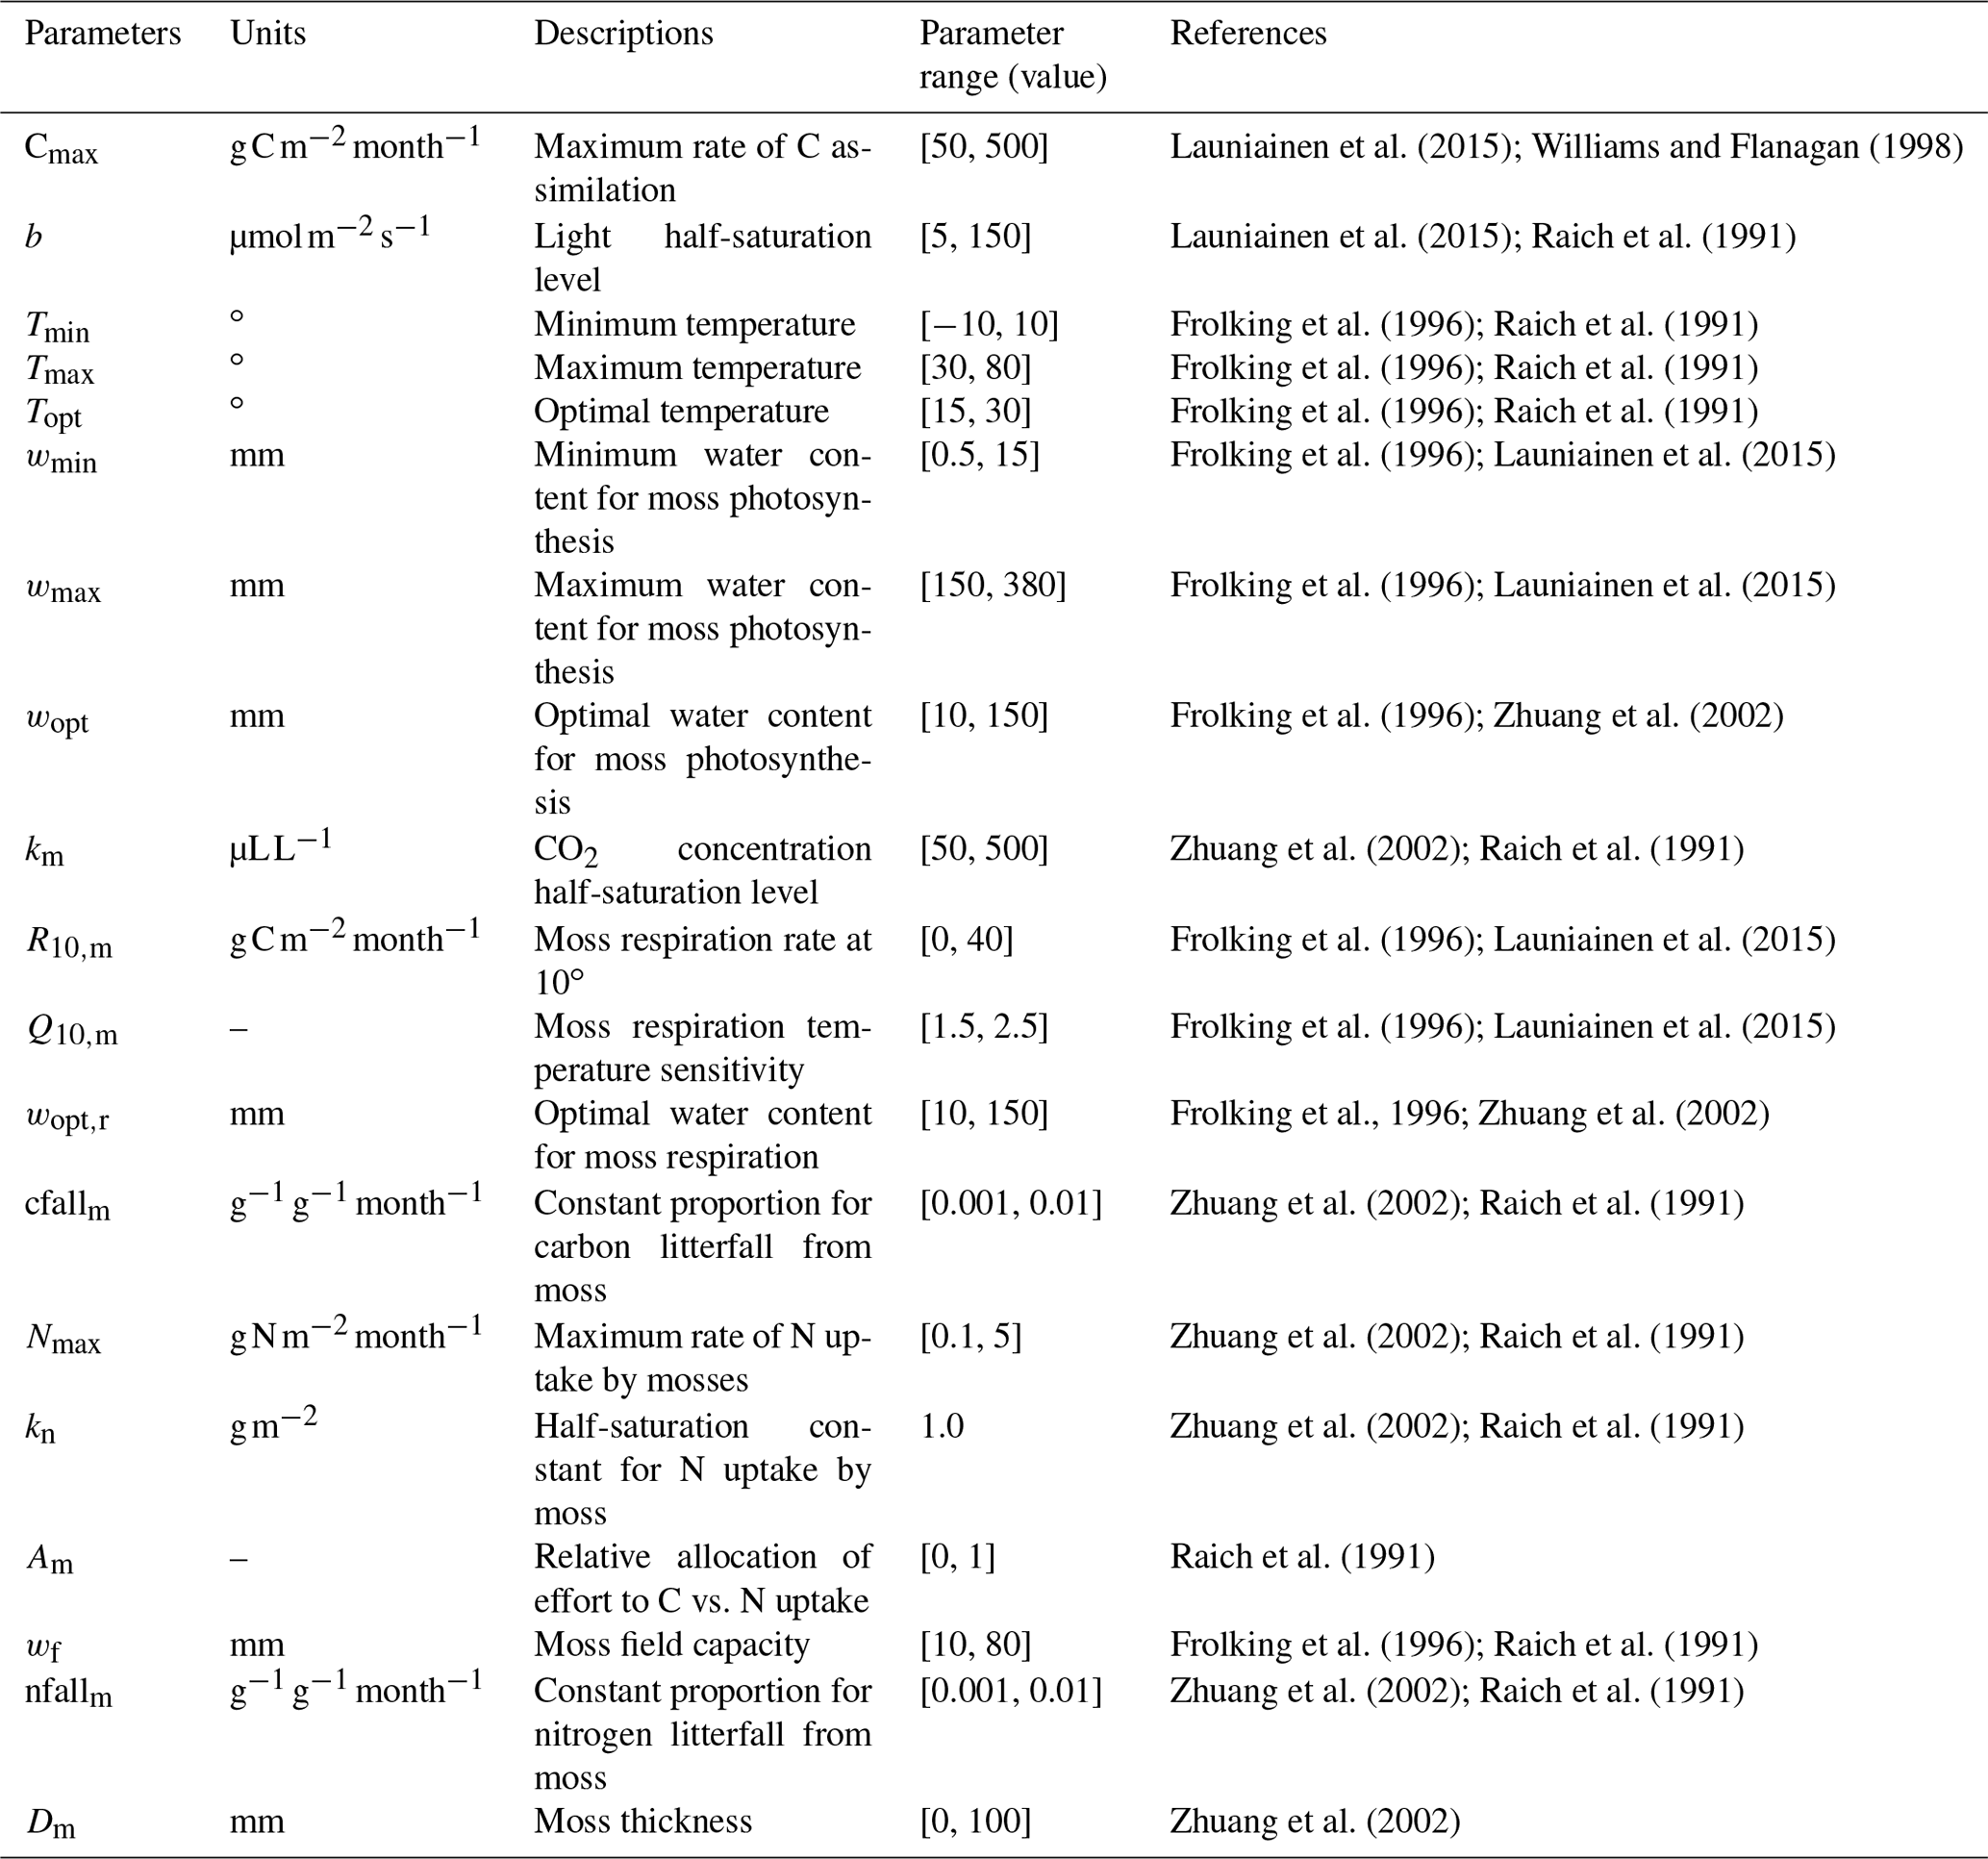
Table 2Site description and measured NEP data used to calibrate TEM_Moss.
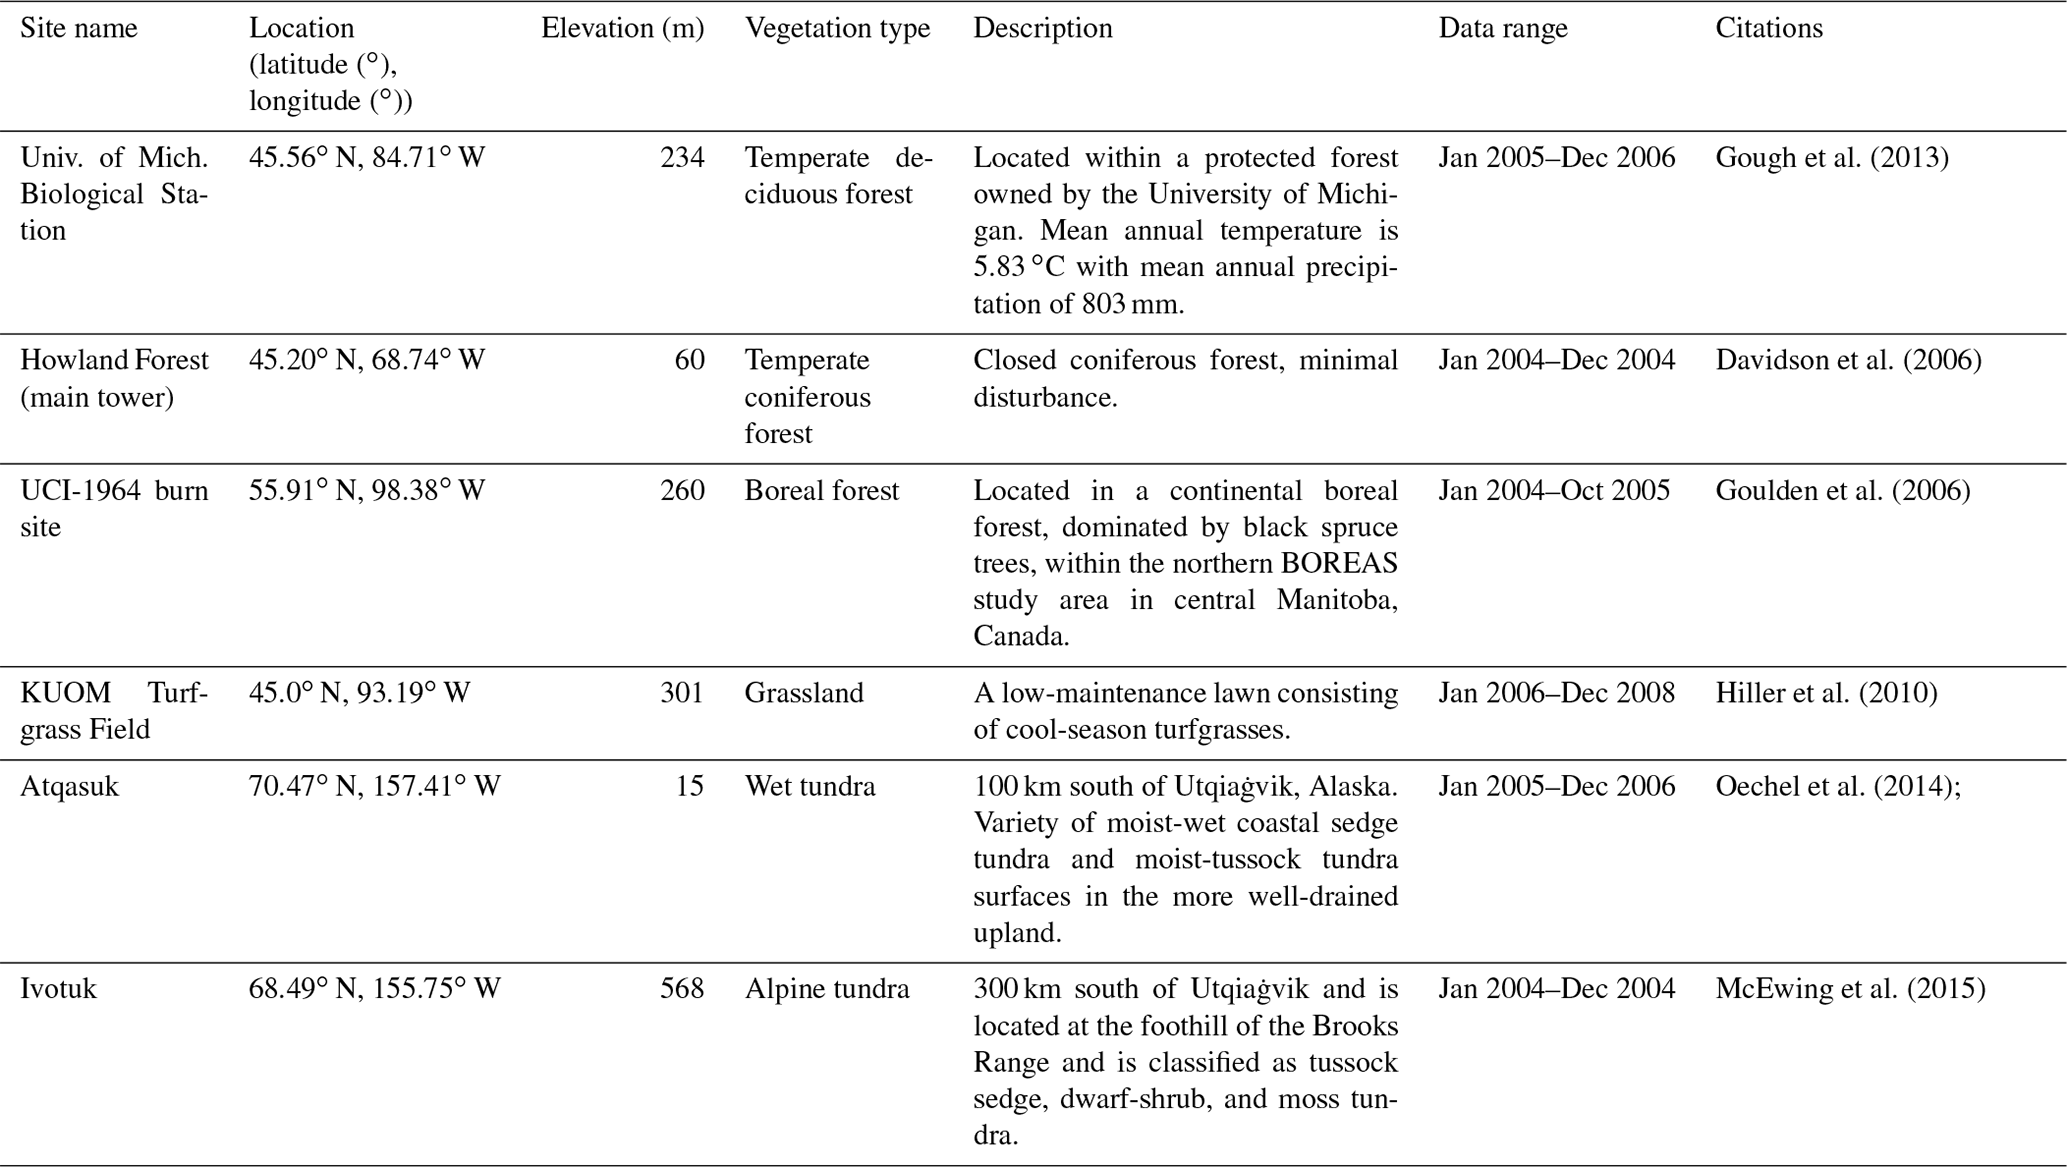

Figure 3Comparison between observed and simulated NEP () at (a) Ivotuk (alpine tundra), (b) UCI-1964 burn site (boreal forest), (c) Howland Forest (temperate coniferous forest), (d) Univ. of Mich. Biological Station (temperate deciduous forest), (e) KUOM Turfgrass Field (grassland), and (f) Atqasuk (wet tundra). Error bars represent standard errors among daily data in 1 month.
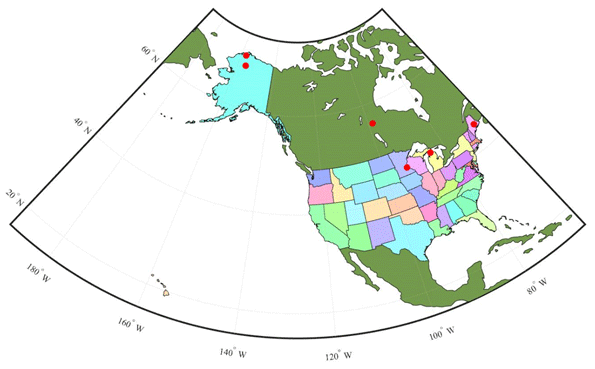
Figure 4Map showing six sites used for TEM_Moss calibration. The red points represent the six sites: five are in the US and one is in Canada. US-Ivo: Ivotuk (alpine tundra); CA-NS3: UCI-1964 burn site (boreal forest); US-Ho1: Howland Forest (temperate coniferous forest); US-UMB: Univ. of Mich. Biological Station (temperate deciduous forest); US-KUT: KUOM Turfgrass Field (grassland); US-Atq: Atqasuk (wet tundra).
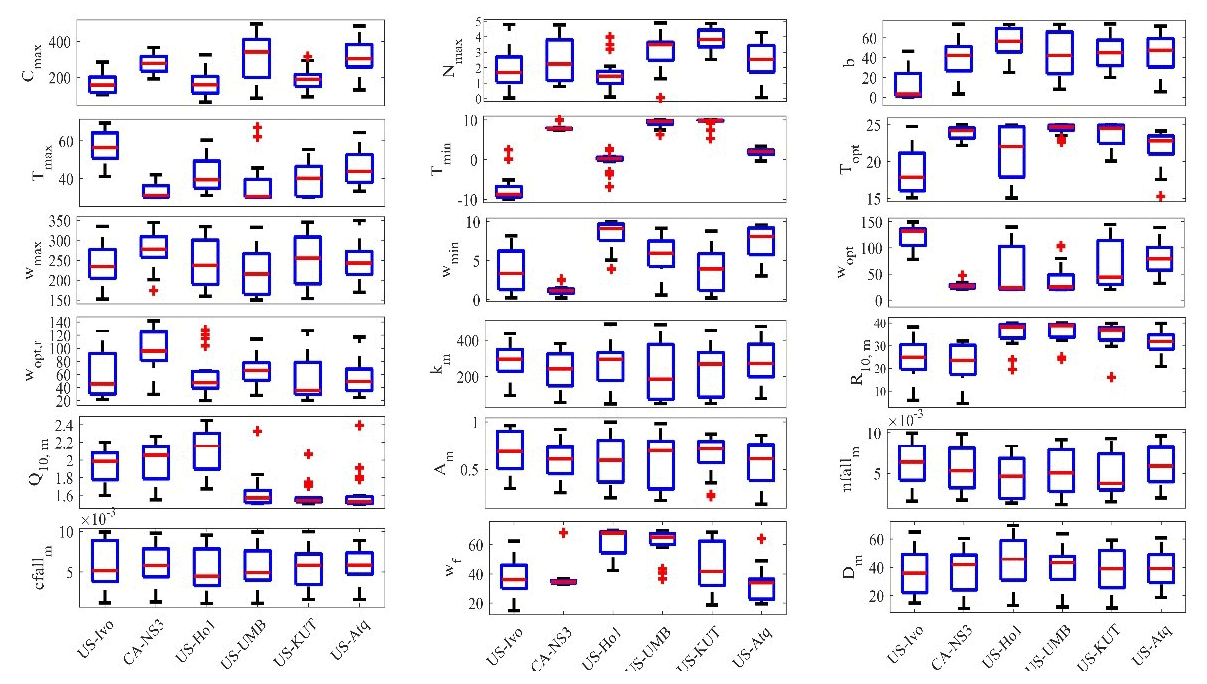
Figure 5Boxplot of parameter posterior distributions that are obtained after ensemble inverse modeling for TEM_Moss at all six sites. US-Ivo: Ivotuk (alpine tundra); CA-NS3: UCI-1964 burn site (boreal forest); US-Ho1: Howland Forest (temperate coniferous forest); US-UMB: Univ. of Mich. Biological Station (temperate deciduous forest); US-KUT: KUOM Turfgrass Field (grassland), US-Atq: Atqasuk (wet tundra). Boxes represent the range between the first quartile and the third quartile of the parameter values; the red line within the box represents the second quartile or the mean of the values. The bottom and top whiskers represent minimum and maximum parameter values, respectively.
Table 3Site description and measured NEP data used to validate TEM_Moss.

We verified the TEM_Moss-simulated NEP, soil moisture, and soil temperature. First, we conducted site-level simulations at six sites that contain level-4 gap-filled monthly NEP data from the AmeriFlux network (Table 3). Site-level monthly gap-filled soil moisture and soil temperature data were organized from the ORNL DAAC dataset (https://daac.ornl.gov/, last access: 8 August 2021) to make a comparison with model simulations (Tables 4 and 5). Local climate data including monthly air temperature (∘C), precipitation (mm), and cloudiness (%) were obtained to drive these model simulations.
Table 4Site description and measured volumetric soil moisture data used to validate TEM_Moss.
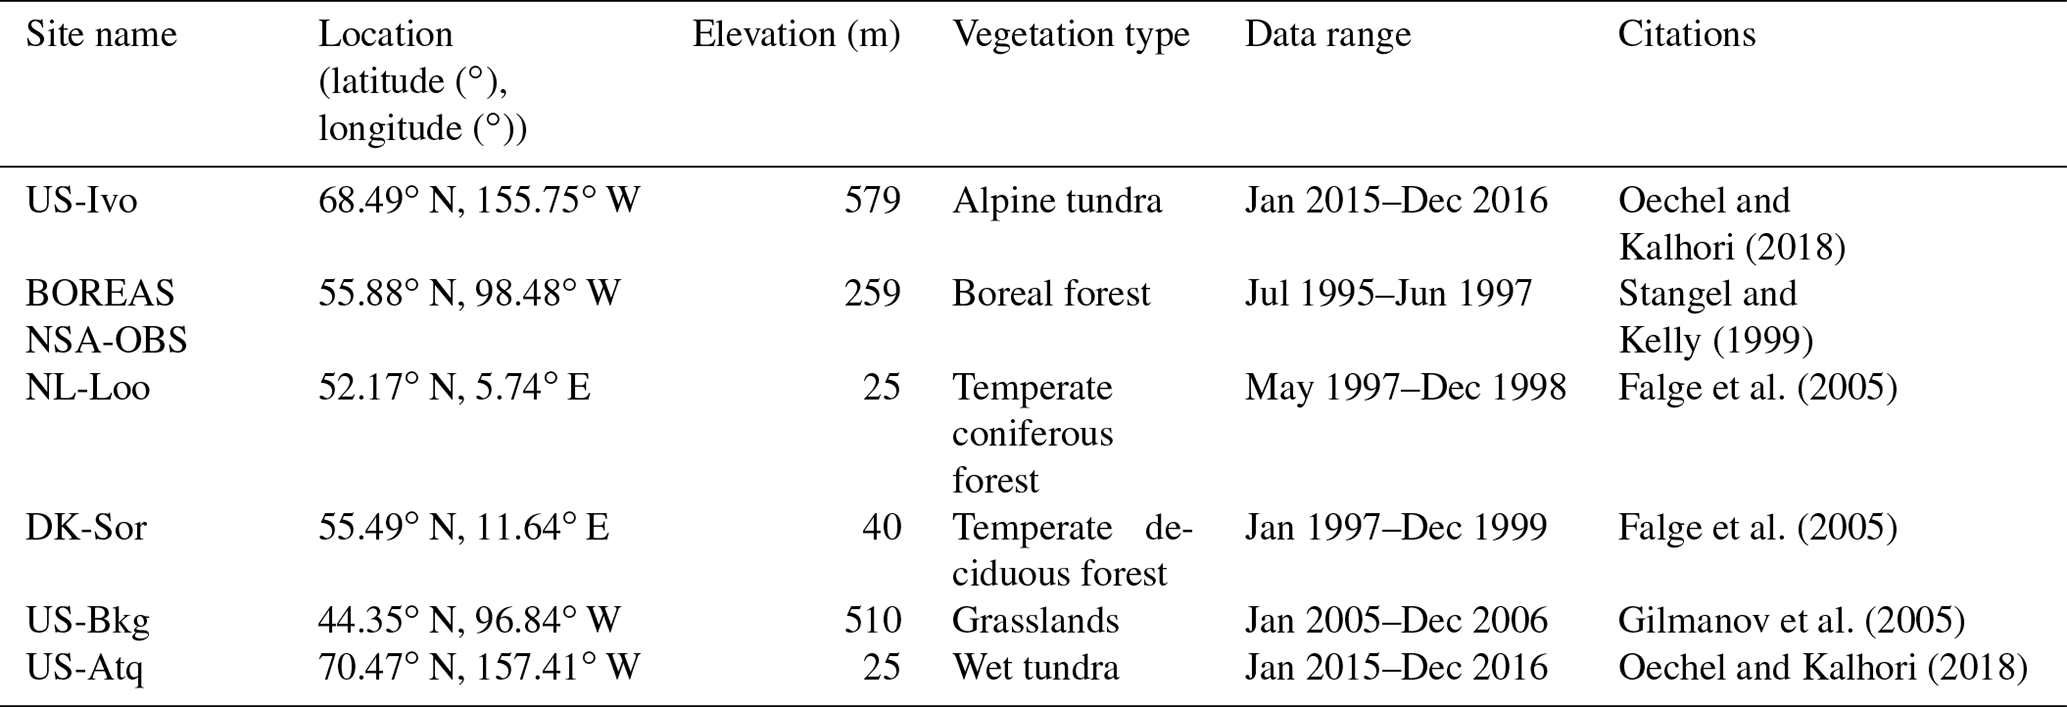
Table 5Site description and measured soil temperature at 5 cm depth data used to validate TEM_Moss.
2.4 Regional extrapolation
With six site-level calibrated parameters, TEM-Moss is applied to the region pixel by pixel based on vegetation distribution data. Both TEM_Moss and TEM 5.0 were applied to northern high latitudes (above 45∘ N) for historical (the 20th century) and future (the 21st century) quantifications of carbon dynamics. For historical simulations, climatic forcing data including monthly air temperature, precipitation, and cloudiness and atmospheric CO2 concentrations during the 20th century were collected from the Climatic Research Unit (CRU TS3.1) from the University of East Anglia (Harris et al., 2014). Other ancillary inputs including gridded soil texture (Zhuang et al., 2015), elevation (Zhuang et al., 2015), and potential natural vegetation (Melillo et al., 1993) were also organized. For future simulations, two contrasting Intergovernmental Panel on Climate Change (IPCC) climate scenarios (RCP2.6 and RCP8.5) were used to drive the models. The future climate forcing data and atmospheric CO2 concentrations during the 21st century under these two climate change scenarios were derived from the HadGEM2-ESmodel, which is a member of CMIP5project213 (https://esgf-node.llnl.gov/search/cmip5/, last access: 8 August 2021).
Simulations were conducted at a spatial resolution of (Zhuang et al., 2001, 2002). A spin-up was run to reach an equilibrium for each pixel, and the values of state variables at equilibrium were treated as initial values for transient simulations (McGuire et al., 1992). Specifically, we chose the first 30 years in the whole 100-year climatic forcing data to spin up the models when conducting historical and future simulations. For each of the simulations, net primary production (NPP), heterotrophic respiration (RH), and net ecosystem production (NEP) were analyzed. We denoted that a positive NEP represents a CO2 sink from the atmosphere to terrestrial ecosystems, while a negative value represents a source of CO2 from terrestrial ecosystems to the atmosphere.
In these simulations, for each pixel, we assumed its moss distribution area is the same as the vascular plant distribution. The total carbon uptake and emission of mosses in a pixel are calculated as the multiplication of pixel area with the carbon fluxes such as NEP (units: ). Moss-related parameters for representative ecosystems are calibrated (Fig. 4 and Table 1) or obtained from previous model parameterization, and the rest of the model parameters are default from Zha and Zhuang (2018).
3.1 Model validation
TEM_Moss was able to reproduce the monthly NEP and performed better than TEM 5.0 at chosen sites, with larger R-square values and smaller RMSE (Fig. 6, Table 6). R square for TEM_Moss reached 0.94 at Bartlett Experimental Forest site and 0.72 at Ivotuk site (Table 6). R-square values for TEM 5.0 showed a similar pattern, reaching 0.91 and a minimum value of 0.43 at the Bartlett Experimental Forest and Ivotuk sites, respectively (Table 6). Except for the Ivotuk site, R squares for TEM_Moss are all higher than 0.8 at the chosen sites, while most R squares for TEM 5.0 are from 0.62 to 0.75 (Table 6). On the other hand, RMSE for TEM_Moss is lower than that for TEM 5.0 at each site (Table 6).
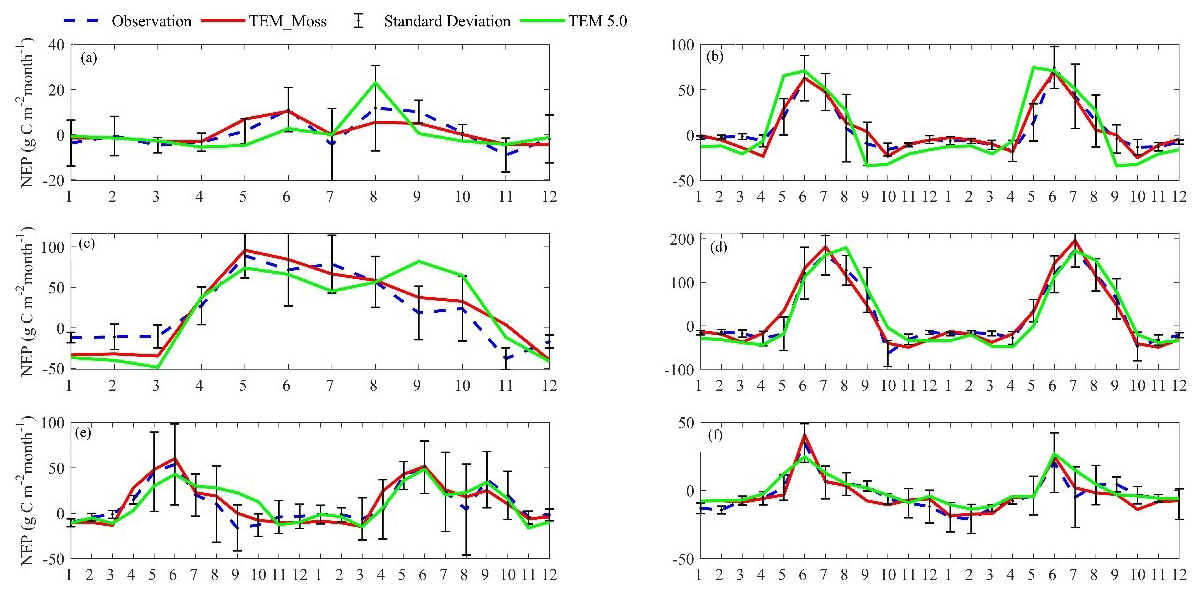
Figure 6Comparison between observed and simulated NEP () at (a) Ivotuk (alpine tundra), (b) UCI-1964 burn site (boreal forest), (c) Howland Forest (temperate coniferous forest), (d) Bartlett Experimental Forest (temperate deciduous forest), (e) Brookings (grassland), and (f) Atqasuk (wet tundra).
Table 6Model validation statistics for TEM_Moss and TEM 5.0 at six sites with NEP data.
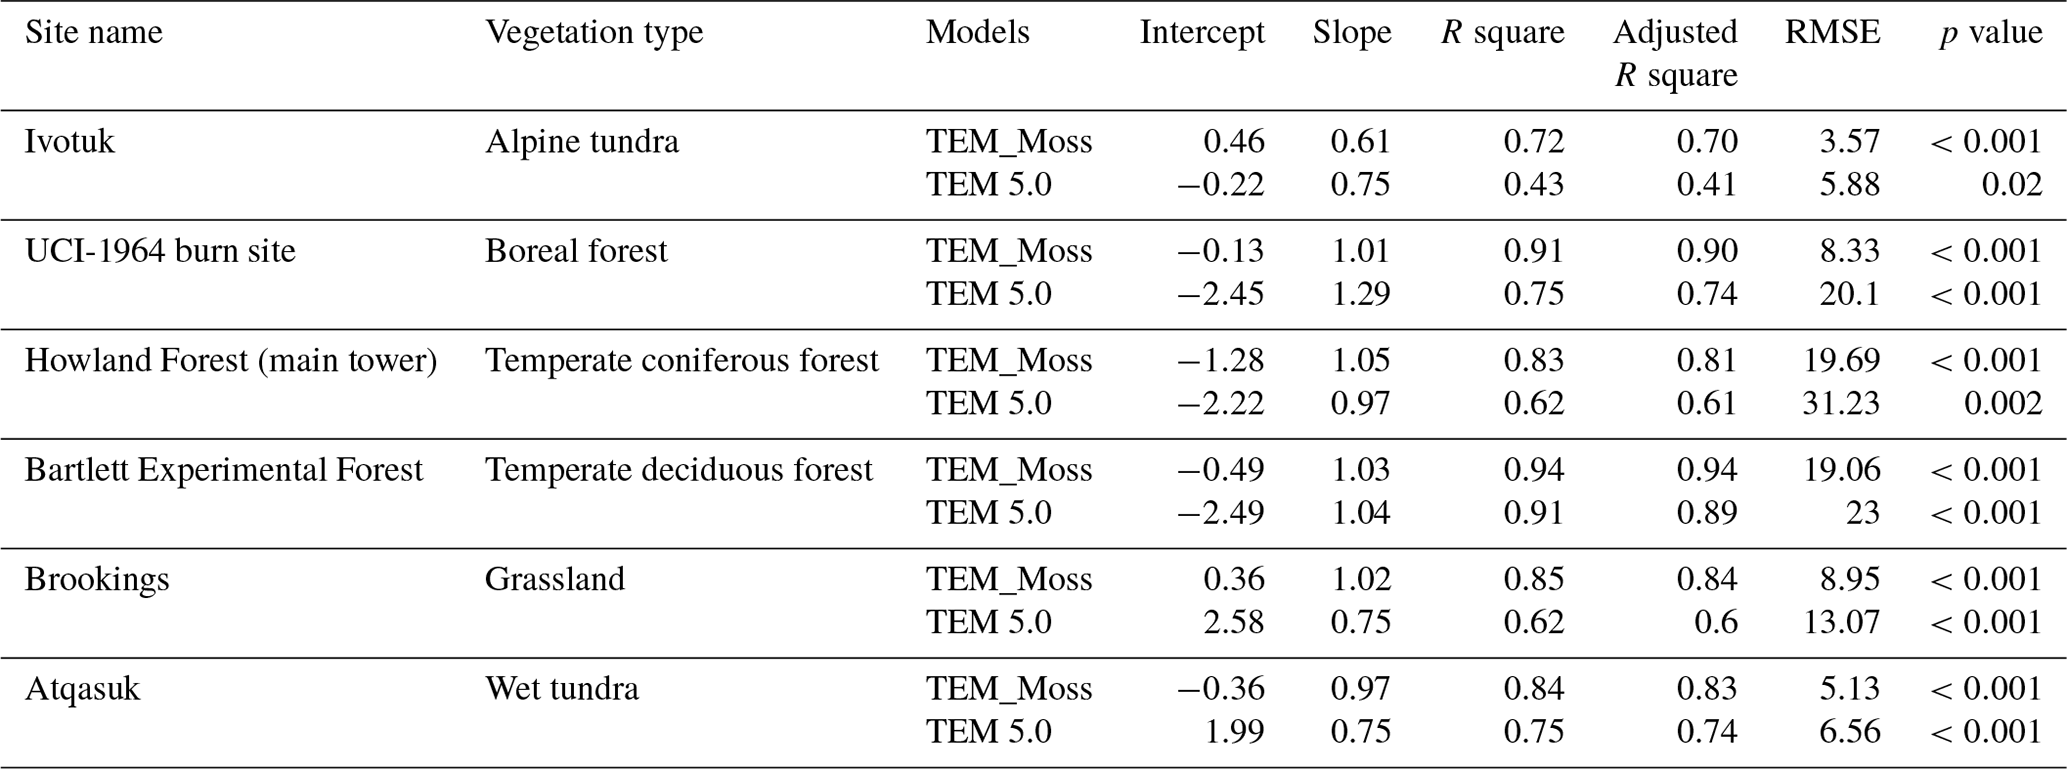
Table 7Model validation statistics for TEM_Moss and TEM 5.0 at six sites with volumetric soil moisture data.

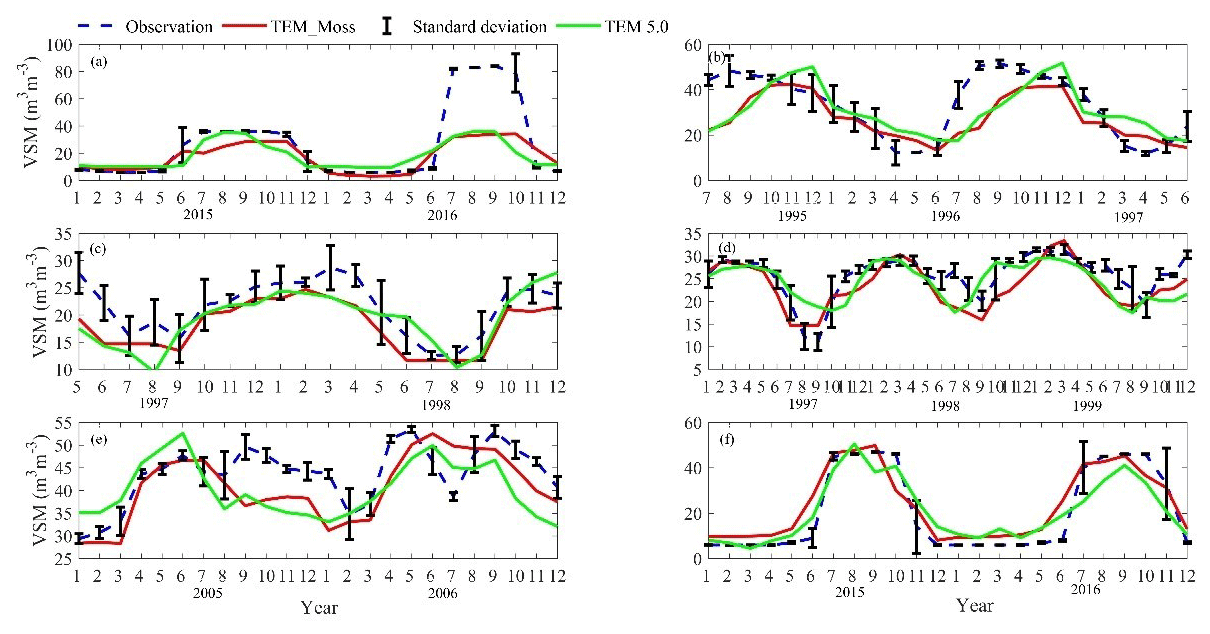
Figure 7Comparison between observed and simulated volumetric soil moisture (VSM, m3 m−3) at (a) US-Ivo (alpine tundra), (b) BOREAS NSA-OBS (boreal forest), (c) NL-Loo (temperate coniferous forest), (d) DK-Sor (temperate deciduous forest), (e) US-Bkg (grassland), and (f) US-Atq (wet tundra).
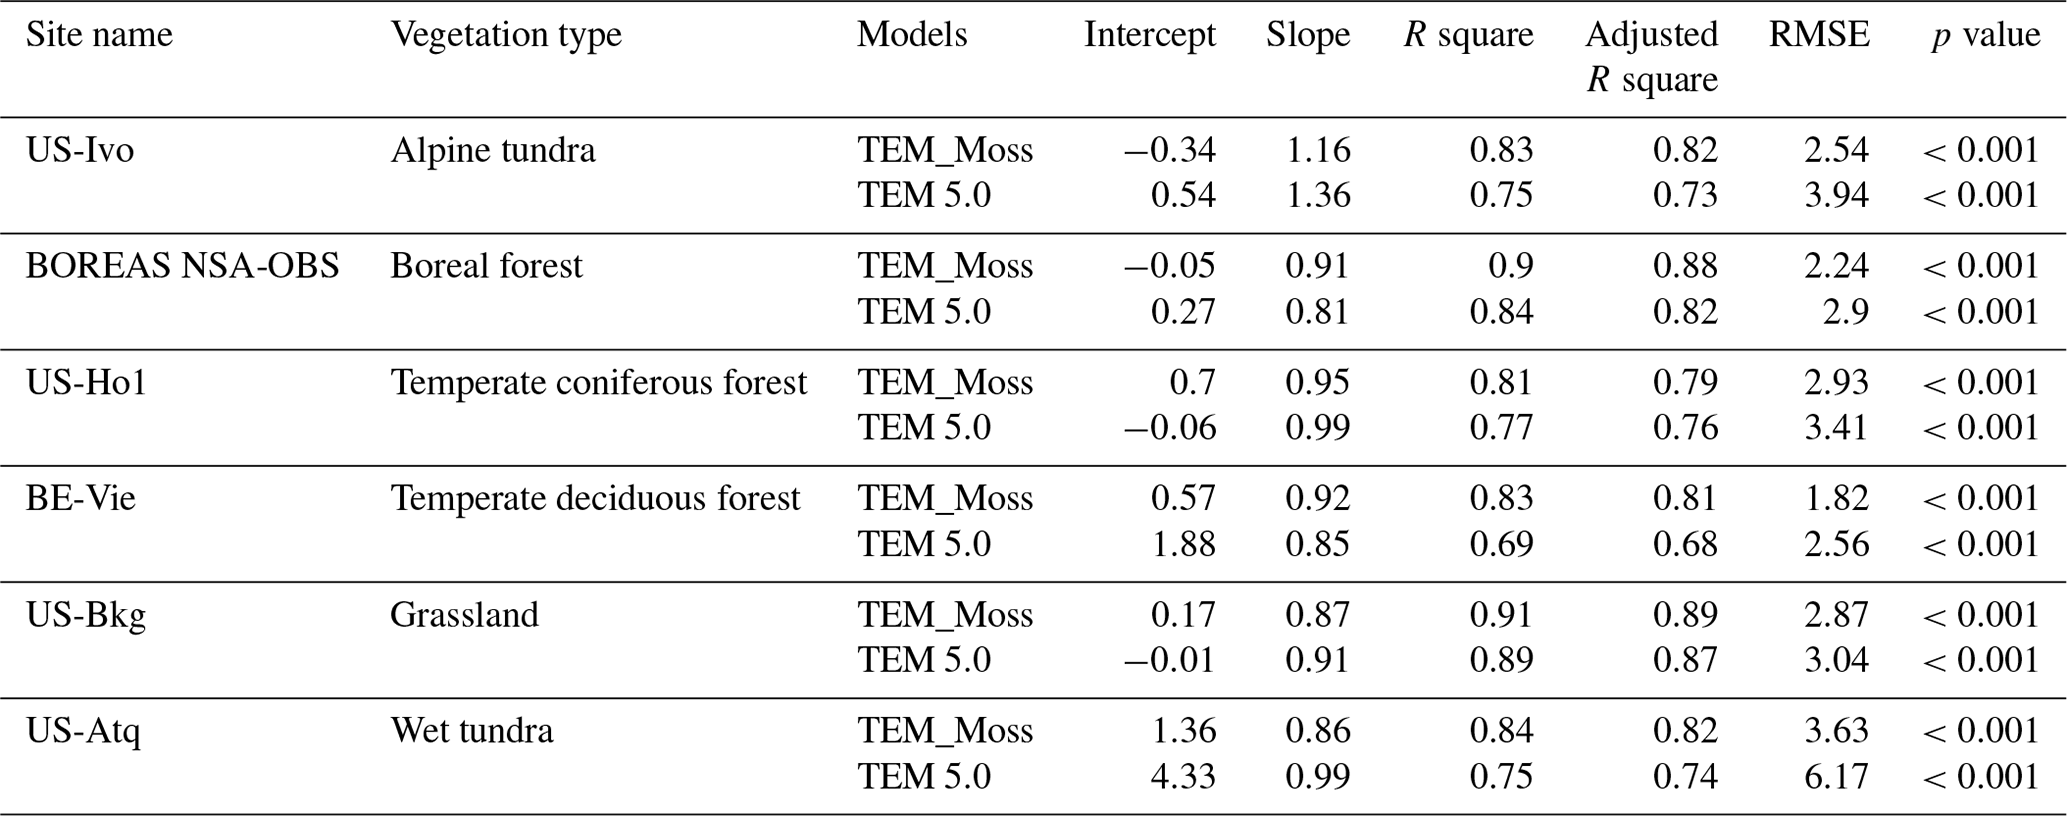
We presented the comparisons between measured and simulated volumetric soil moisture (VSM) from TEM_Moss and TEM 5.0 (Fig. 7). Statistical analysis shows that TEM_Moss reproduces the soil moisture well, with R squares ranging from 0.51 at US-Bkg to 0.87 at US-Atq (Table 7). R squares for TEM_Moss are substantially higher than that for TEM 5.0 at most chosen sites, except for US-Atq (Table 7). RMSE for TEM_Moss is lower than that for TEM 5.0 at each site (Table 7). Similarly, comparisons between measured and simulated soil temperature at 5 cm depth (ST_5) from TEM_Moss and TEM 5.0 indicated that TEM_Moss can reproduce the soil temperature with R squares ranging from 0.81 at US-Ho1 to 0.91 at US-Bkg, while TEM 5.0 reproduces the soil temperature with R squares ranging from 0.69 at BE-Vie to 0.89 at US-Bkg (Fig. 8; Table 8). Although R squares for both models are relatively high and RMSE for them is relatively low, TEM_Moss still shows higher R squares and lower RMSE than TEM 5.0 (Table 8).
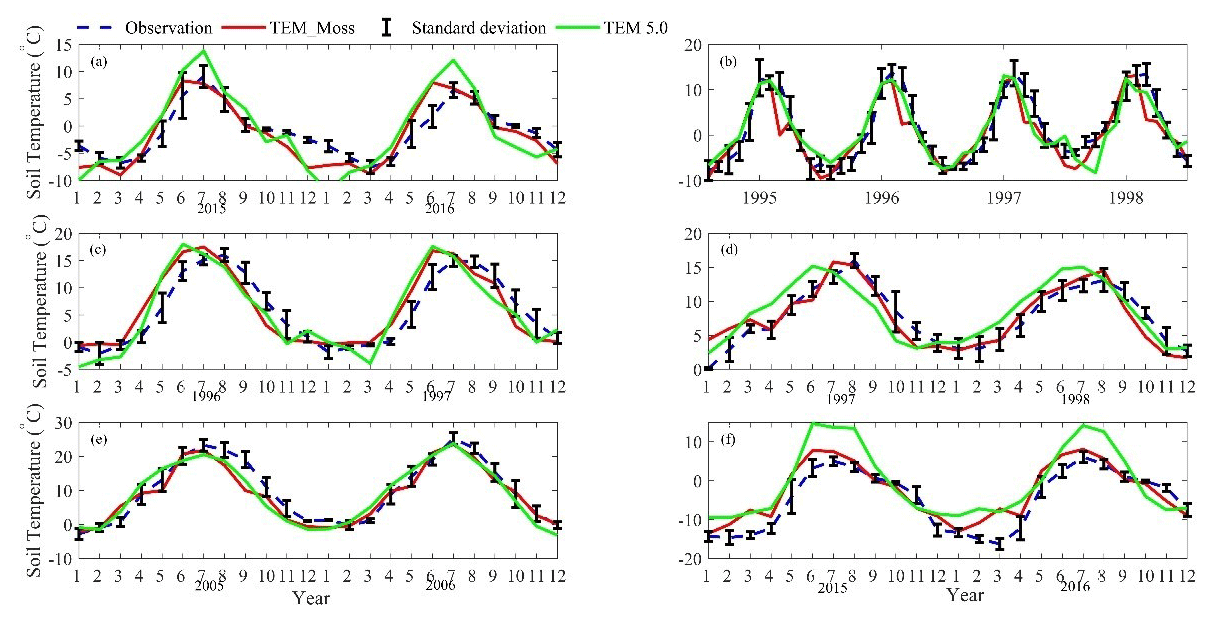
Figure 8Comparison between observed and simulated soil temperature at 5 cm depth (∘) at (a) US-Ivo (alpine tundra), (b) BOREAS NSA-OBS (boreal forest), (c) US-Ho1 (temperate coniferous forest), (d) BE-Vie (temperate deciduous forest), (e) US-Bkg (grassland), and (f) US-Atq (wet tundra).
Table 8Model validation statistics for TEM_Moss and TEM 5.0 at six sites with soil temperature at 5 cm depth data.
3.2 Regional carbon dynamics during the 20th century
Both TEM_Moss and TEM 5.0 were used to simulate northern high-latitude regional carbon balance during the 20th century (Fig. 9). Higher NEP was correlated with the combination of relatively higher NPP and lower heterotrophic respiration (RH). TEM_Moss indicated that the northern high latitudes acted as a carbon sink of 221.9 Pg with an inter-annual standard deviation of 0.31 Pg C yr−1 during the 20th century, which is 132.7 Pg larger than 89.2 Pg simulated by TEM 5.0 (Fig. 10). The simulated NEP by TEM_Moss ranges from 1.38 to 3.05 Pg C yr−1, while the range by TEM 5.0 was from 0.11 to 1.75 Pg C yr−1 (Fig. 9). The patterns of the simulated NEP from two models were similar, with both showing a general increasing trend throughout the 20th century (Fig. 9). By 2000, the TEM_Moss simulation indicated that the northern high-latitude region stored 3.05 Pg C yr−1, which is more than twice the storage estimated by TEM 5.0 (1.33 Pg C yr−1, Fig. 9). Both models indicated that carbon uptake by the northern ecosystems during the second half of the 20th century was higher than the first half for most of the region, and only a small portion of the region lost carbon in last century (Fig. 10).
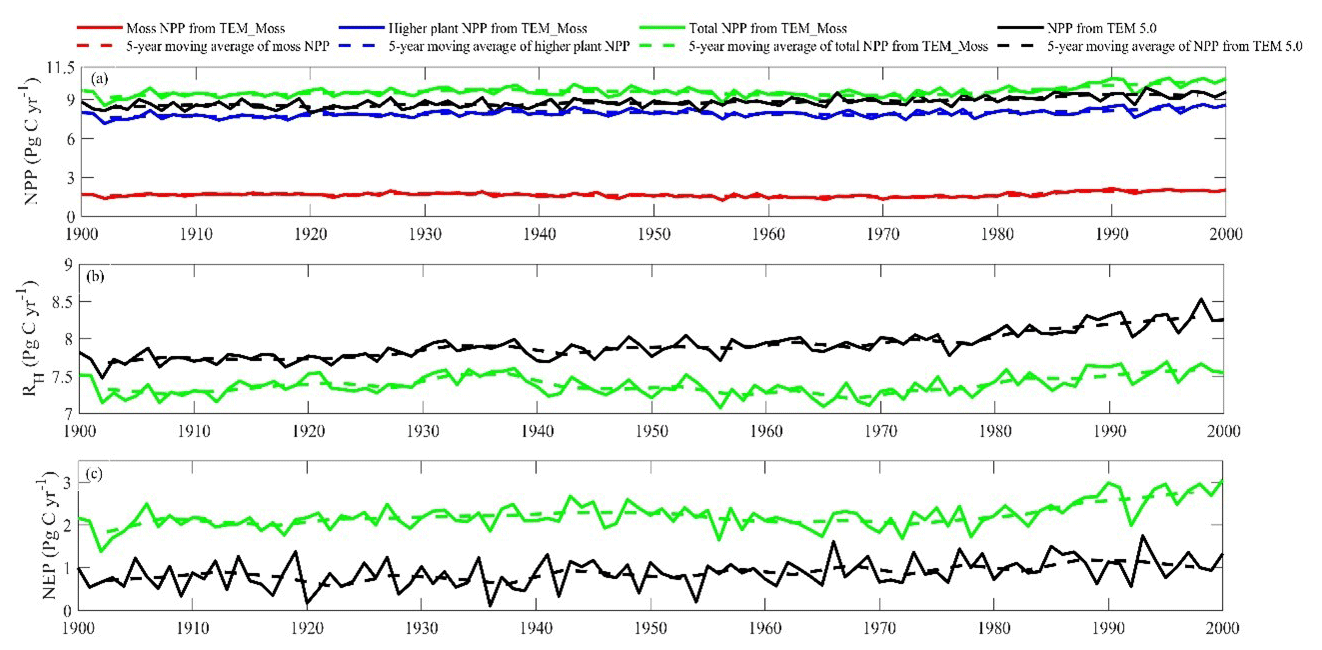
Figure 9Simulated annual net primary production (NPP, a), heterotrophic respiration (RH, b), and net ecosystem production (NEP, c) during the 20th century by TEM_Moss and TEM 5.0.
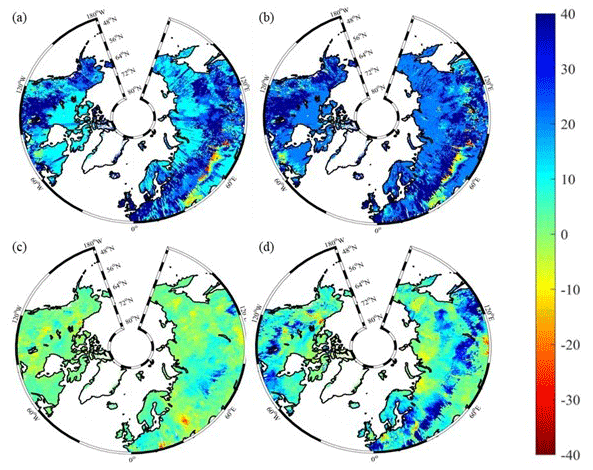
Figure 10Spatial distribution of NEP simulated by TEM_Moss for the periods (a) 1900–1950 and (b) 1951–2000 and by TEM 5.0 for the periods (c) 1900–1950 and (d) 1951–2000. Positive values of NEP represent sinks of CO2 into terrestrial ecosystems, while negative values represent sources of CO2 to the atmosphere.
Simulated total NPP by TEM_Moss was 9.6 Pg C yr−1, ranging from 8.52 to 10.65 Pg C yr−1 in the 20th century, with 1.69 Pg C yr−1 of moss NPP and 7.93 Pg C yr−1 of vascular plant NPP (Fig. 9, Table 9). Moss NPP ranges from 1.23 to 2.14 Pg C yr−1, and the ratio of moss NPP to vascular plant NPP is 0.21 (Fig. 9). TEM 5.0 estimated 0.8 Pg C yr−1 lower total NPP than TEM_Moss but 0.87 Pg C yr−1 higher NPP for vascular plants (Fig. 9). On the other hand, average heterotrophic respiration in the 20th century was 7.38 Pg C yr−1, and all years were within about 5 % of this value (Fig. 9). TEM 5.0 projected 0.53 Pg C yr−1 higher RH than TEM_Moss (7.91 Pg C yr−1, Fig. 9). Overall, TEM_Moss predicted higher total NPP but lower RH, which jointly caused a pronounced difference in NEP between the two models.
Table 9Average annual NPP, RH, and NEP (as Pg C per year) during the 20th century estimated by two models.
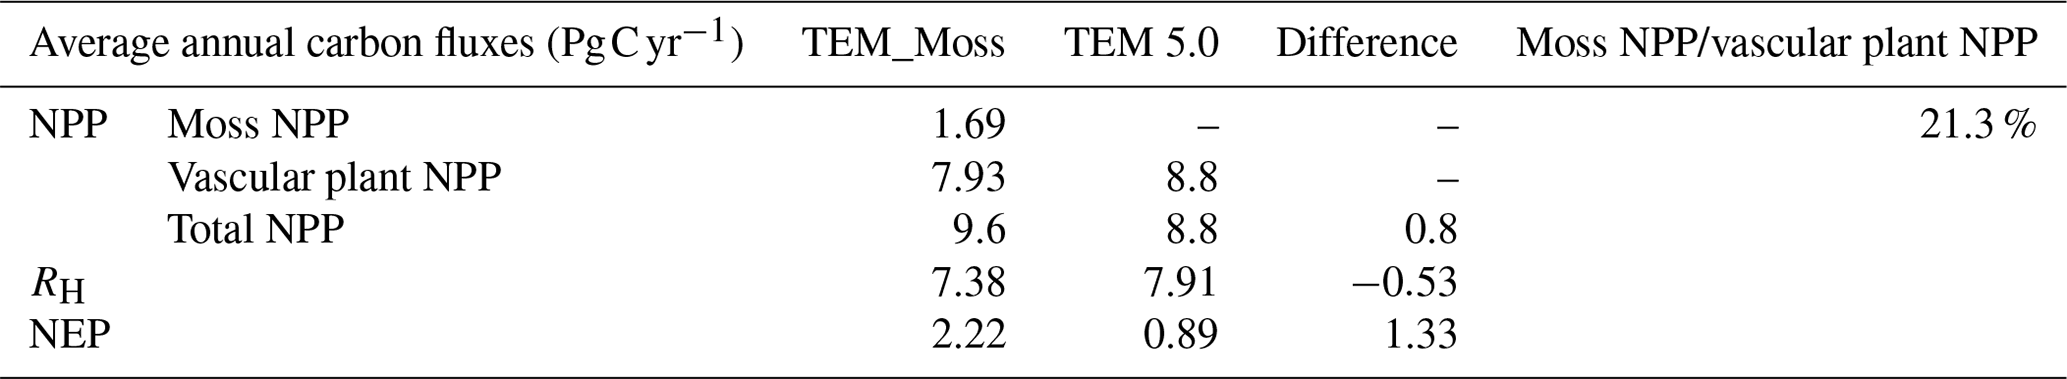
Table 10Increase in SOC, vegetation carbon (VGC), and moss carbon (MOSSC) from 1900 to 2000 and total carbon storage during the 20th century predicted by two models.
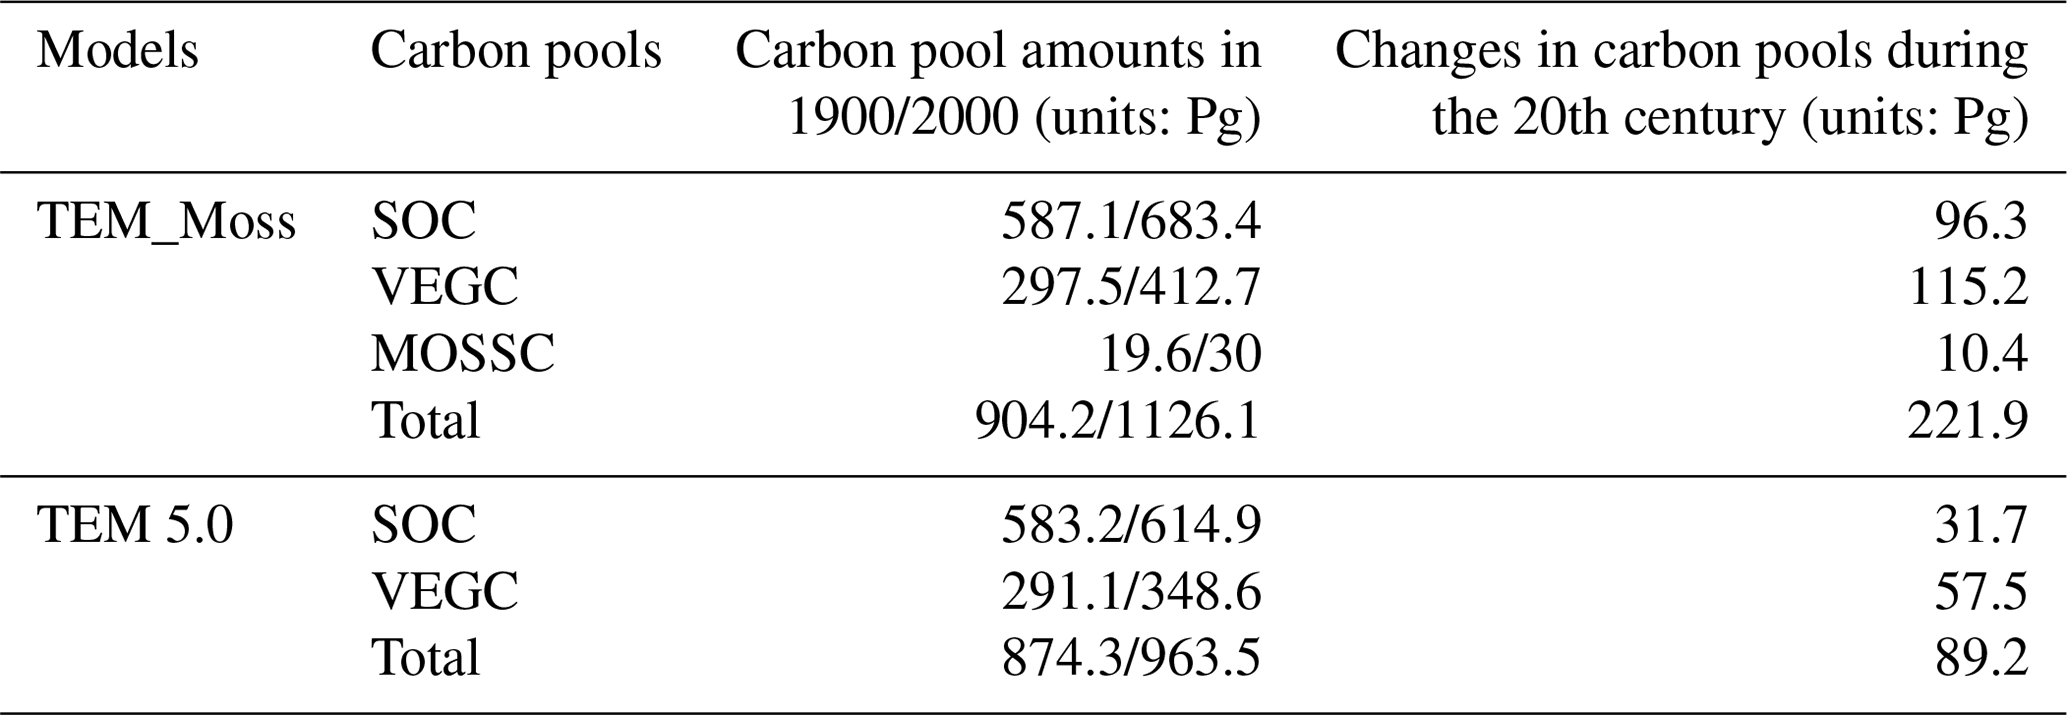
Table 11Average annual NPP, RH, and NEP (as Pg C yr−1) during the 21st century estimated by two models under the (a) RCP8.5 scenario and (b) RCP2.6 scenario.
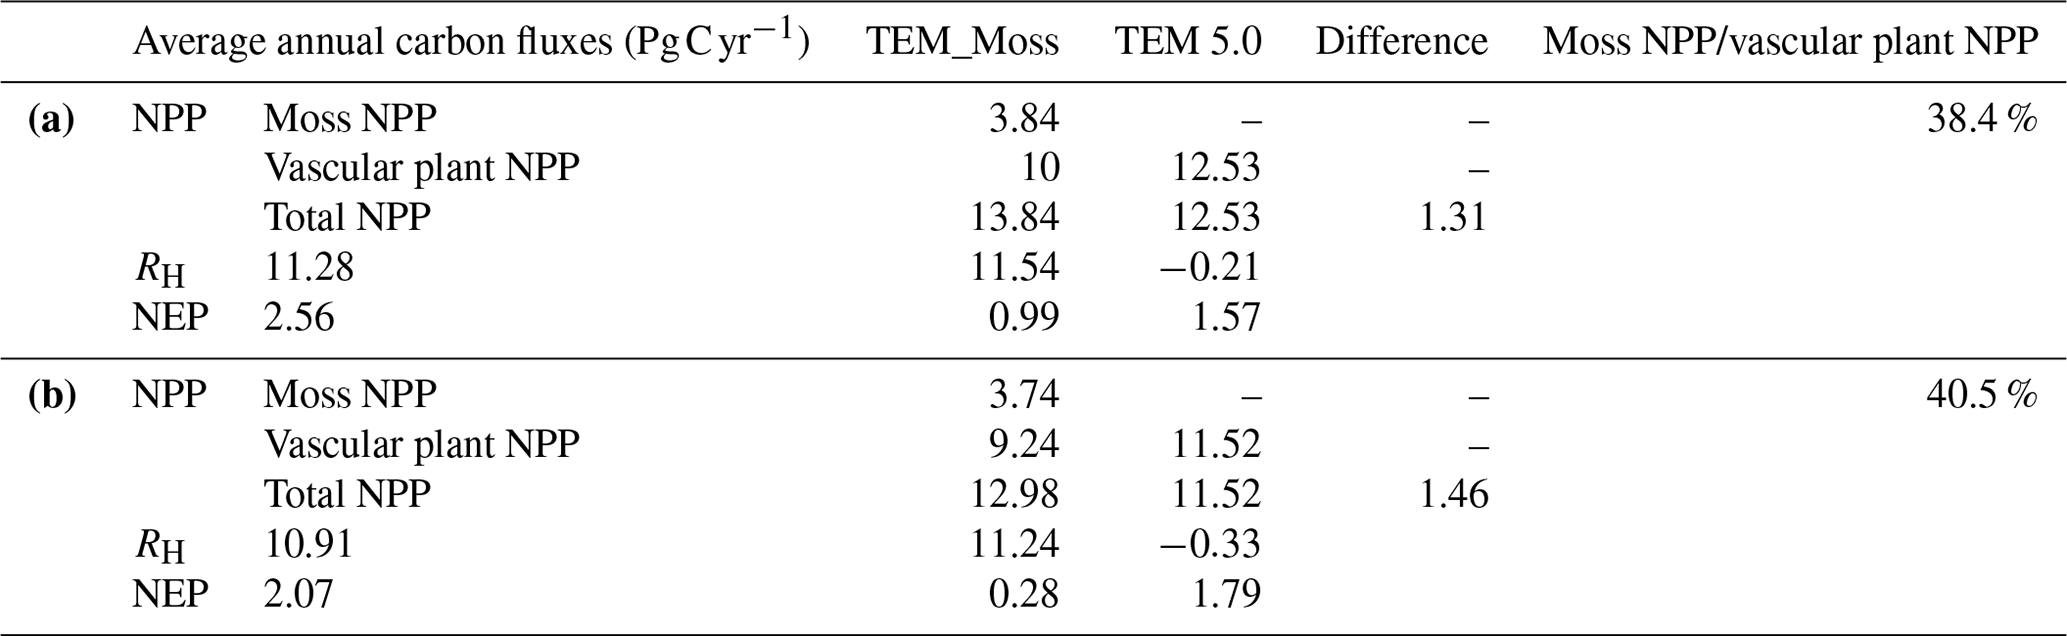
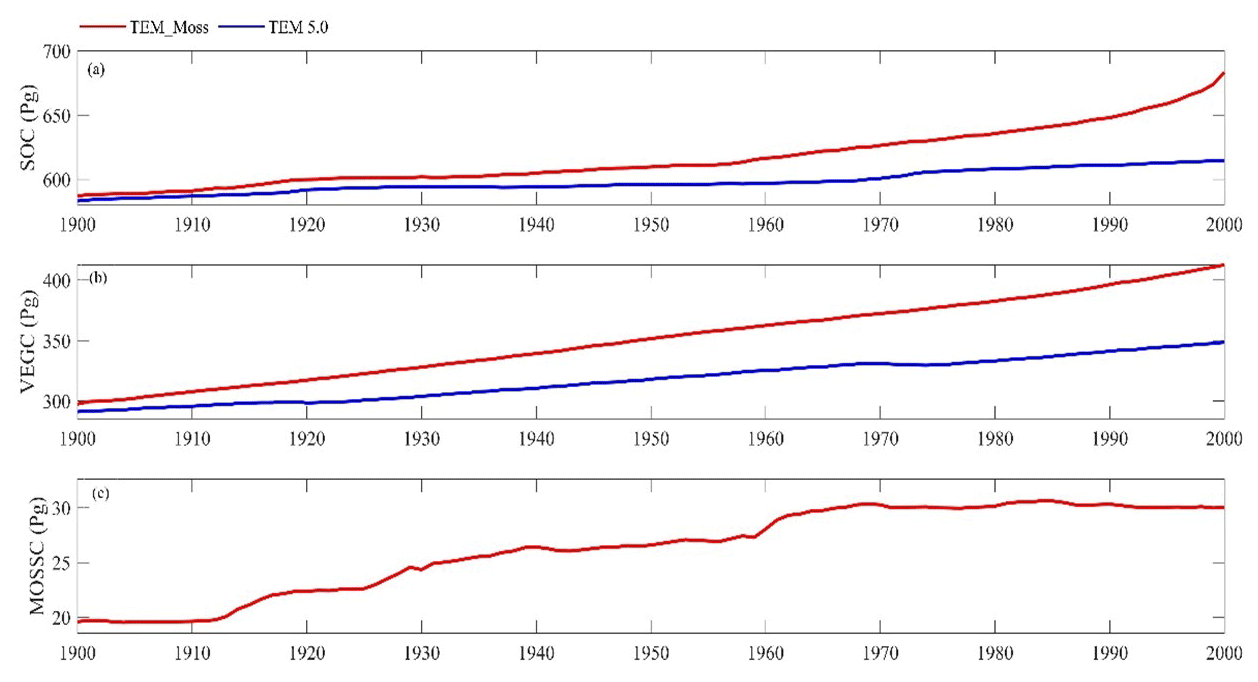
Figure 11Simulated annual soil organic carbon (SOC, a), vegetation carbon (VEGC, b), and moss carbon (MOSSC, c) during the 20th century by TEM_Moss and TEM 5.0.
Both models estimated that soil organic carbon and vegetation carbon were accumulating continuously in the 20th century (Fig. 11). TEM_Moss indicated that regional soil organic carbon (SOC) and VEGC accumulated 96.3 and 115.2 Pg C, respectively, and the carbon uptake by moss was 10.4 Pg in the period (Fig. 11, Table 10). As simulated by TEM_Moss, 43.4 %, 51.9 %, and 4.7 % of total carbon uptake in the region was assimilated to soils, vascular plants, and mosses, respectively (Table 10). TEM 5.0 simulated that SOC increased by 31.7 Pg at the end of the 20th century, which is 64.6 Pg C less than the value estimated by TEM_Moss (Table 10). TEM 5.0 estimated 57.7 Pg C in plants less than the value estimated by TEM_Moss (57.5 Pg C, Table 10). Of total carbon, 35.5 % and 64.5 % were as SOC and VEGC, respectively.
3.3 Regional carbon dynamics during the 21st century
Under the RCP2.6 scenario, TEM_Moss simulated NEP of 2.07 Pg C yr−1 with the range from 0.41 to 3.2 Pg C yr−1 and an inter-annual standard deviation of 0.59 Pg C yr−1 during the 21st century (Fig. 12a). The regional sink shows a decreasing pattern in the 2000s and then generally increases over the remaining years of the 21st century (Fig. 12a). For comparison, TEM 5.0 predicted an average NEP of 0.28 Pg C yr−1 with the range from −1.48 to 1.69 Pg C yr−1 during the 21st century (Fig. 12a). Thus, TEM 5.0 projected 179.1 Pg C stored in northern ecosystems is less than the estimation from TEM_Moss in the 21st century. Besides, TEM 5.0 simulated that the regional NEP showed a decreasing trend, and the region fluctuates between sinks and sources during the century (Fig. 12a). The spatial patterns from the two models also showed differences. TEM_Moss indicated that the region accumulates carbon over this century, while TEM 5.0 simulated that some regions changed from a carbon sink to a source in the second half of the century (Fig. 13a). Simulated regional NPP by TEM_Moss ranges from 11.2 to 13.7 Pg C yr−1 with a mean of 12.98 Pg C yr−1 in this century, while average NPP predicted by TEM 5.0 is 1.46 Pg C yr−1 lower than that value (11.52 Pg C yr−1, Fig. 12a). TEM_Moss-simulated NPP has 3.74 Pg C yr−1 from moss and 9.24 Pg C yr−1 from vascular plants, which account for 28.8 % and 71.2 % of total NPP, respectively (Fig. 12a). Meanwhile, TEM_Moss estimated that RH is 10.91 Pg C yr−1, while TEM 5.0 predicted it as 11.24 Pg C yr−1, which is higher (Fig. 12b). Both models projected that soil organic carbon and vegetation carbon accumulate in this century but with different magnitudes (Fig. 14a). TEM_Moss predicted that regional SOC and VEGC accumulated 84.7 Pg C and 112.6 Pg C, respectively, during the 21st century, while TEM 5.0 predicted a smaller increase with 12.1 and 15.5 Pg C in SOC and VEGC, respectively (Fig. 14a, Table 12a). Besides, TEM_Moss also predicted an increase of 9.4 Pg C in MOSSC, accounting for 4.5 % of the total carbon uptake in this region (Table 12a).
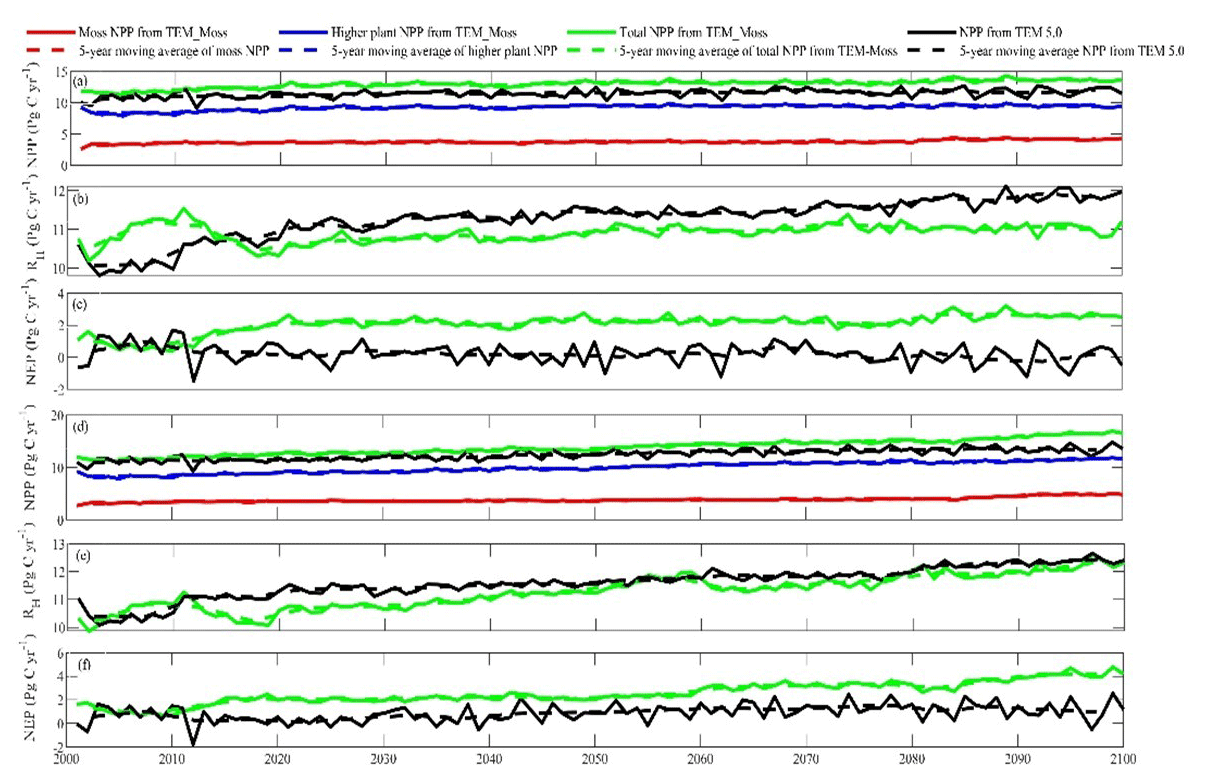
Figure 12Predicted changes in carbon fluxes: annual net primary production (NPP, a, d), heterotrophic respiration (RH, b, e), and net ecosystem production (NEP, c, f) during the 21st century under the RCP2.6 scenario (a–c) and RCP8.5 scenario (d–f) by TEM_Moss and TEM 5.0.
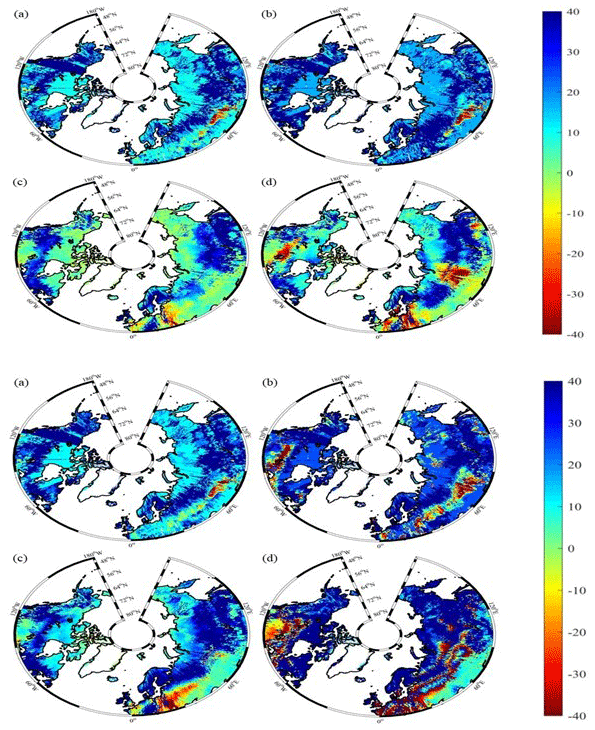
Figure 13Spatial distribution of NEP simulated for the periods (a) 2000–2050 and (b) 2051–2099 by TEM_Moss and by TEM 5.0 (c, d) during the 21st century under the RCP2.6 scenario (upper panel) and RCP8.5 scenario (bottom panel). Positive values of NEP represent sinks of CO2 into terrestrial ecosystems, while negative values represent sources of CO2 to the atmosphere.
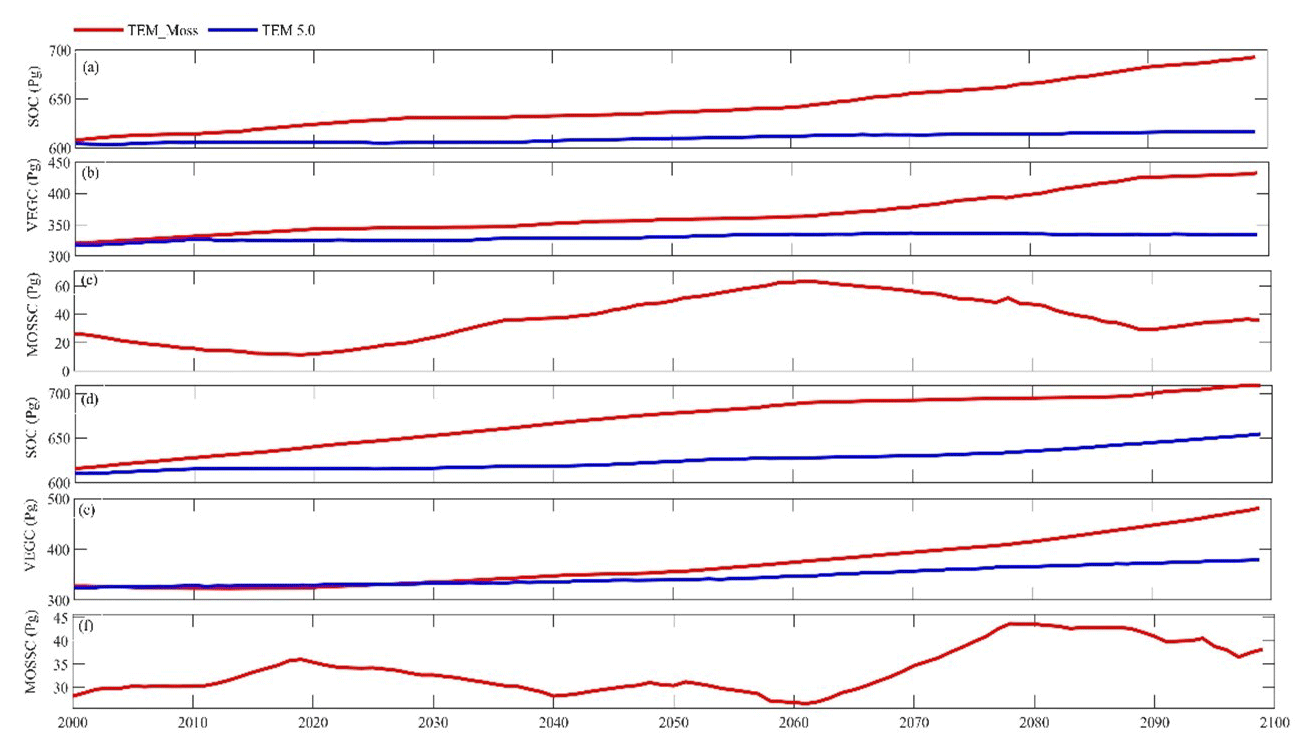
Figure 14Simulated annual soil organic carbon (SOC, a, d), vegetation carbon (VEGC, b, e), and moss carbon (MOSSC, c, f) during the 21st century by TEM_Moss and TEM 5.0 under the RCP2.6 scenario (a–c) and RCP8.5 scenario (d–f).
Table 12Increase in SOC, vegetation carbon (VGC), and moss carbon (MOSSC) from 1900 to 2000 and total carbon storage during the 21st century predicted by two models under the (a) RCP2.6 scenario and (b) RCP8.5 scenario.
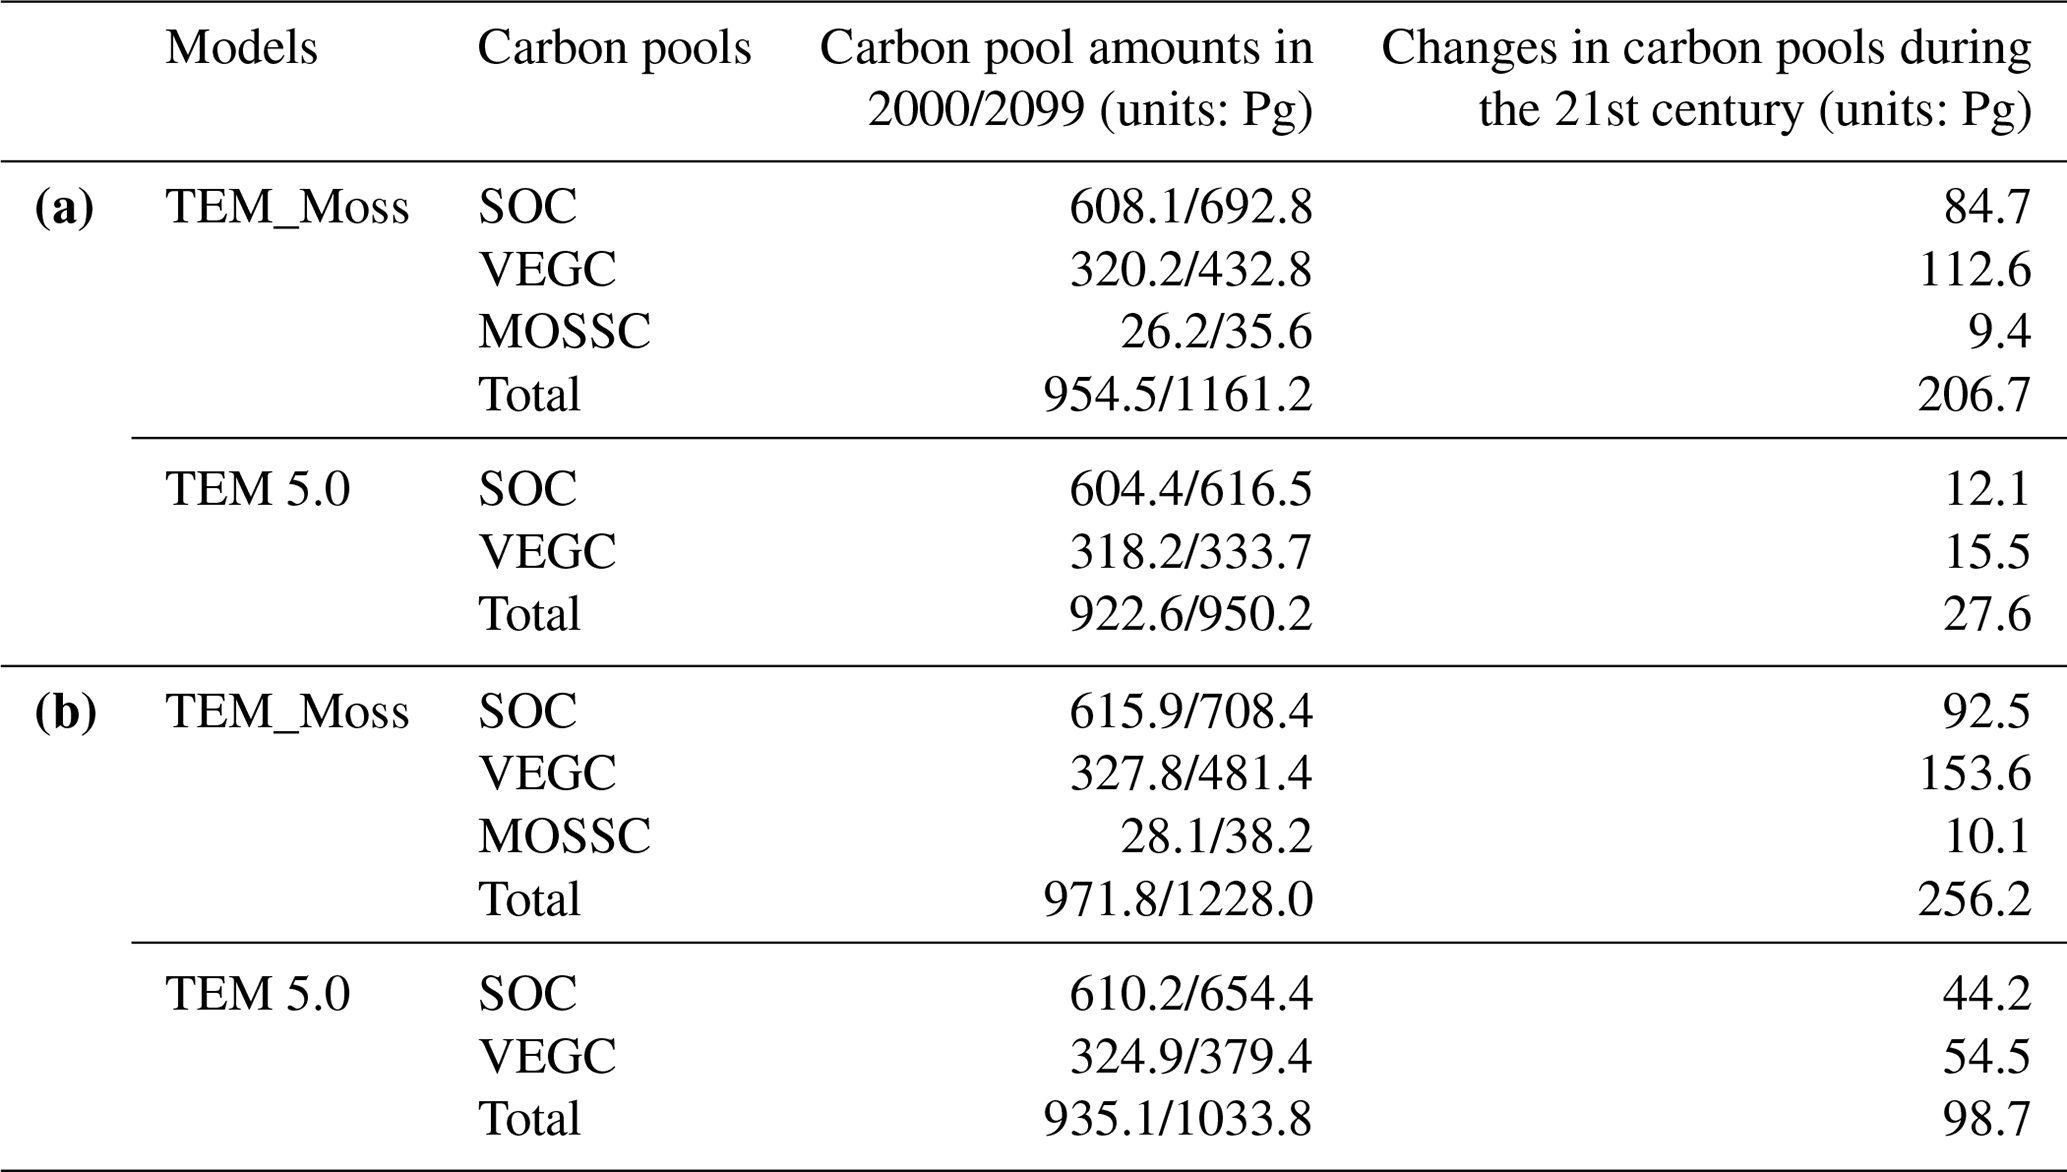
Under the RCP8.5 scenario, TEM_Moss simulated annual NPP of 13.84 Pg C yr−1 with a range from 11.09 to 16.94 Pg C yr−1, which is 1.31 Pg C yr−1 higher than the projection from TEM 5.0 (Fig. 12b). Total NPP estimated by TEM_Moss has 3.84 Pg C yr−1 from moss and 10 Pg C yr−1 from vascular plants (Fig. 12b). Annual RH was 11.28 Pg C yr−1 estimated by TEM_Moss and 11.54 Pg C yr−1 by TEM 5.0, respectively (Fig. 12b). Consequently, TEM_Moss-projected NEP was 2.56 Pg C yr−1 with the inter-annual standard deviation of 0.93 Pg C yr−1 in this century (Fig. 12b). NEP ranges from 0.67 to 4.78 Pg C yr−1 estimated with TEM_Moss, while a range from −1.69 to 2.65 Pg C yr−1 with a mean of 0.99 Pg C yr−1 was estimated by TEM 5.0 (Fig. 12b). TEM_Moss predicted more carbon uptake of 157.5 Pg than TEM 5.0 during the 21st century. Both models predicted that NEP showed an increasing trend during the 21st century (Fig. 12b). Moreover, similar spatial patterns of carbon sinks and sources appeared in the projections from two models (Fig. 13b). Soil organic carbon and vegetation carbon show an increasing trend in both models (Fig. 14b). Regional SOC and VEGC increased by 92.5 and 153.6 Pg C, respectively, by the end of the 21st century predicted by TEM_Moss. In contrast, the increase of 44.2 and 54.5 Pg C in SOC and VEGC, respectively, was predicted by TEM 5.0 (Fig. 14b, Table 12b). TEM_Moss predicted an increase of 10.1 Pg C in MOSSC (Table 12b).
4.1 The role of moss in the regional carbon dynamics
Global warming has been pronounced in recent decades, particularly at high latitudes (IPCC, 2014; Tape et al., 2006; Stow et al., 2004). An enormous amount of soil organic carbon stored in northern high-latitude regions (Tarnocai et al., 2009; Schuur et al., 2008) is expected to affect a broad spectrum of ecological and human systems and cause rapid changes in the Earth system when undergoing substantial climate change (Serreze and Francis 2006; Davidson and Janssens, 2006; McGuire et al., 2009). Improving projections for carbon budget of high-latitude terrestrial ecosystems is essential for understanding global carbon–climate feedbacks (Melillo et al., 2011; Todd-Brown et al., 2013).
Our simulations suggest that mosses play an important role in the regional carbon dynamics, which is consistent with previous studies (McGuire et al., 2009; Turetsky et al., 2012). First of all, mosses are productive with carbon assimilation even during low temperature, water content, and irradiance (Kallio and Heinonen, 1975; Harley et al., 1989). For example, mosses can tolerate drought through physiological responses, such as by suspending metabolism and by withstanding cell desiccation (Turetsky et al., 2012; Oechel and Van Cleve, 1986). The key functional traits related to water, nutrient, and thermal tolerances of mosses enable them to fit in harsh northern conditions (Shetler et al., 2008; Turetsky et al., 2012). Thus, with incorporation of moss into our models, the total NPP estimation in our model is affected. Mosses also act as powerful competitors with vascular plants for nutrient uptake. Their rapid nutrient acquisition and slow nutrient loss through slow decomposition may constrain concentrations of plant-available nitrogen (Hobbie et al., 2000; Turetsky et al., 2010; Oechel and Van Cleve, 1986; Gornall et al., 2007), which will further decrease NPP of vascular plants. Our model results suggested that the NPP of vascular plants considering moss is indeed lower than previous NPP estimates without considering moss, but the total NPP is larger than before. We estimated that mosses contribute 17.6 % of NPP in the 20th century and 28.8 % and 27.6 % in the 21st century under the RCP2.6 and RCP8.5 scenarios, respectively. This is comparable with the results reported by a synthesis study, indicating an average contribution 20 % of aboveground NPP from moss in upland boreal forests, and the contribution is 48 % in wetland ecosystems. Frolking et al. (1996) even reported a contribution of 38.4 % to total NPP by moss at a boreal forest site. Moreover, mosses can also influence heterotrophic respiration (RH) through their effects on soil thermal and hydrologic dynamics (Zhuang et al., 2001). With the layer of moss, soil temperature tends to decrease, but soil moisture tends to increase (Oechel and Van Cleve, 1986), which will further decrease soil respiration in summer. This supports our results that TEM_Moss-simulated RH is lower than that of TEM 5.0. With a combination of higher NPP and lower RH, NEP predicted by TEM_Moss is larger than that of TEM 5.0. The two contrasting regional simulations by TEM_Moss and TEM 5.0 indicated the region is currently a carbon sink, which is consistent with previous studies (White et al., 2000; McGuire et al., 2009; Schimel et al., 2001). Our study estimates that regional NEP during the 20th century is 2.2 Pg C yr−1 with TEM_Moss and 0.89 Pg C yr−1 with TEM 5.0, respectively. In the 1990s, the regional sink is projected to be 2.7 and 1.1 Pg C yr−1 by TEM_Moss and TEM 5.0, respectively. Compared with other existing studies, our regional estimates of NEP are within the reasonable range. McGuire et al. (2009) estimated a land sink of 0.3–0.6 Pg C yr−1 for the pan-arctic region for the 1990s, which is closer to our estimation by TEM 5.0 but less than the projection by TEM_Moss. Besides, Schimel et al. (2001) reported an estimation of the northern extratropical NEP from 0.6 to 2.3 Pg C yr−1 in the late 20th century, which is comparable to our estimates. Our simulations also confirmed that mosses and vascular plants respond to climate change similarly in terms of their productivity (Turetsky et al., 2010).
4.2 Model uncertainty and limitations
There are a number of uncertainty sources in our model simulations. First, due to the limited understanding of moss photosynthesis (He et al., 2015) and various moss N uptake pathways (e.g., Bay et al., 2013; Berg et al., 2013), a few important assumptions have been made in our modeling. For instance, we assume that mosses behave similarly to vascular plants regarding photosynthesis, and soil N uptake is the only pathway for mosses without considering N uptake through N fixers and atmospheric wet N deposition (Ayres et al., 2006). Second, the errors in the observed data will influence our parameterization results, which will bias our regional estimates of carbon dynamics. Second, climatic driving data are also a source of uncertainty for historical and future simulations. Third, model assumptions will also induce additional uncertainties. For instance, we assumed that vegetation distribution will remain unchanged during the transient simulation. However, vegetation will change in response to warming climate and disturbances such as fire and insect outbreaks in the region (Hansen et al., 2006), which will affect carbon budget. Missing potential responses to disturbances in our model shall introduce additional uncertainties (Soja et al., 2007; Kasischke and Turetsky, 2006). Future moss dynamics will also impact carbon dynamics in this region. For instance, long-term warming experiments along natural climatic gradients, ranging from Swedish subarctic birch forest and subarctic/subalpine tundra to Alaskan arctic tussock tundra, concluded that both diversity and abundance of mosses are likely to decrease under arctic climate warming (Lang et al., 2012). Similarly, total moss cover declined in both heath and mesic meadow under experimental long-term warming (by 1.5–3 ∘C), driven by general declines in many species (Alatalo et al., 2020). Due to global warming, significant losses in moss diversity are expected in boreal forests and alpine biomes, leading to changes in ecosystem structure and function, nutrient cycling, and carbon balance (He et al., 2015).
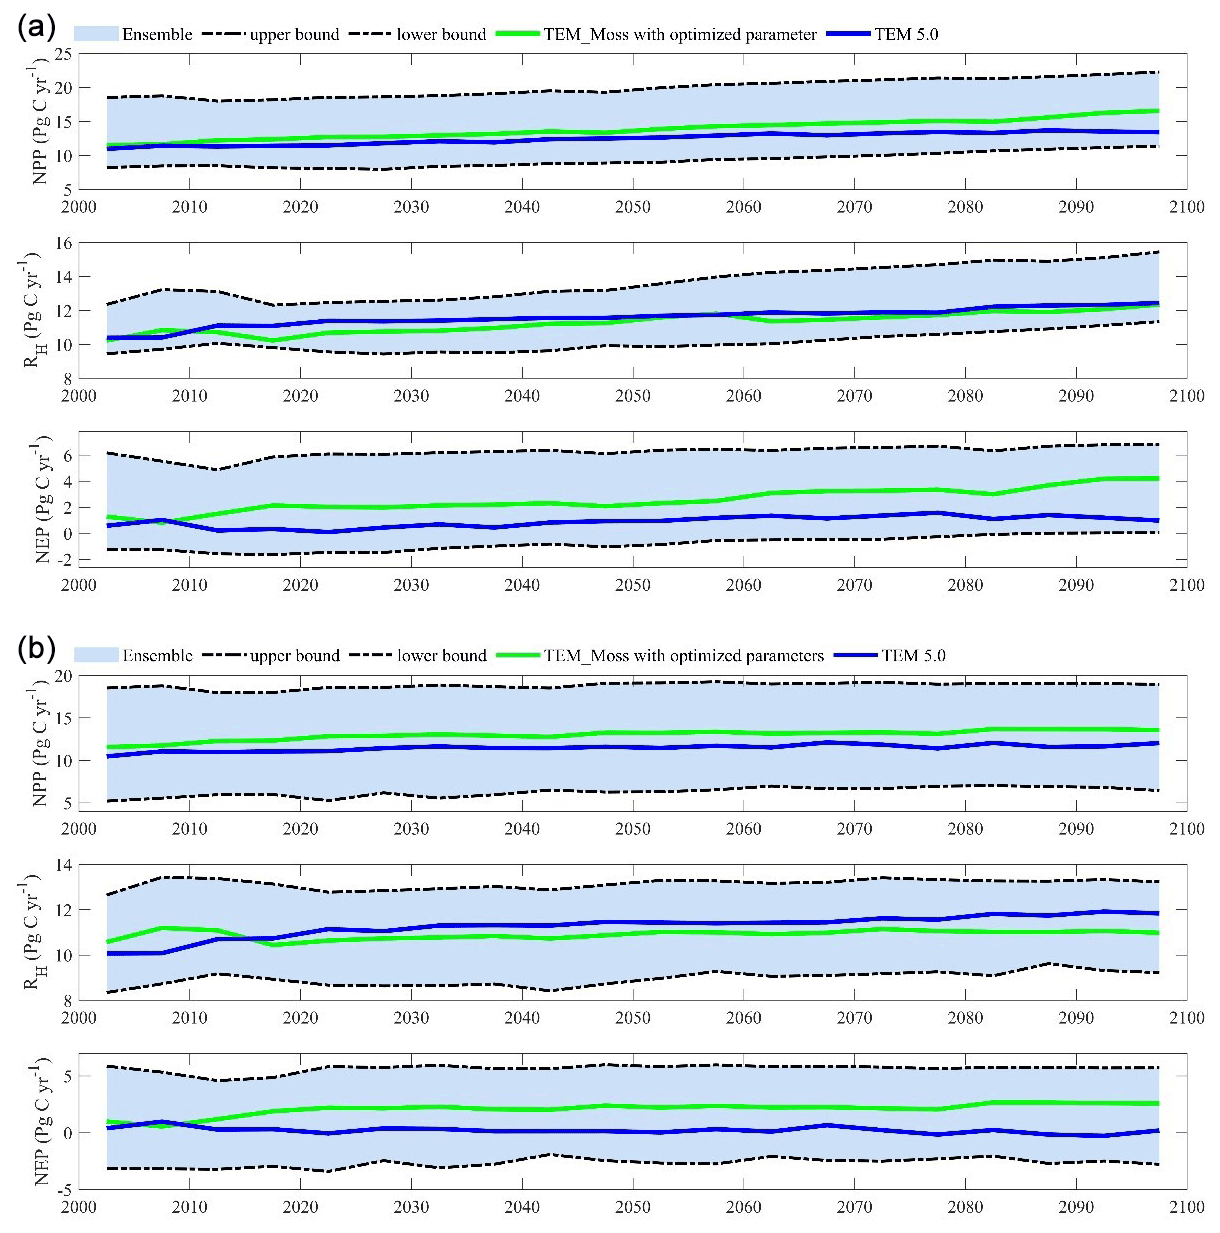
Figure 15The 5-year moving average plots for carbon fluxes under the (a) RCP2.6 scenario and (b) RCP8.5 scenario. The blue area represents the upper and lower bounds of simulations.
We conducted ensemble regional simulations with 50 sets of parameters to quantify model uncertainty due to uncertain parameters. The 50 sets of parameters were obtained using the method in Tang and Zhuang (2008). The ensemble means and the inter-simulation standard deviations are used to measure the model uncertainty (Fig. 15). TEM_Moss predicted the regional cumulative carbon ranges from a carbon loss of 266 Pg C to a carbon sink of 567.3 Pg C by different ensemble members, with a mean of 161.1±142.1 Pg during the 21st century under the RCP2.6 scenario. Under the RCP8.5 scenario, TEM_Moss predicted that the region acts from a carbon source of 79.1 Pg C to a carbon sink of 625.9 Pg C, with a mean of 186.7±166.1 Pg during the 21st century (Fig. 15).
This study took an important step to incorporate moss into an extant ecosystem model that has not explicitly considered the role of moss and its interactions with vascular plants. Our model simulations showed that mosses have strong influences on regional ecosystem carbon cycling, by affecting the soil thermal, nitrogen availability, and water conditions of terrestrial ecosystems. However, there are still limitations in our model. First, we did not differentiate various kinds of mosses because they have their own functional traits. Different kinds of mosses may provide different levels of insulation for soil, resulting in different soil thermal conditions that affect microbial activities. The structural and physiological traits of mosses will differ largely in different moss groups, such as feather moss versus Sphagnum (Turetsky et al., 2010). In addition, we lack spatially explicit information of moss distribution in the region, which will lead to a large regional uncertainty of carbon quantification. We assumed that moss area distribution is the same as its associated vegetation distribution. Another limitation is that some important physiological traits of moss have not been modeled. For example, moss abundance may change following shifts in vascular species composition due to shading or burial by vascular litter (Turetsky et al., 2010; Cornelissen et al., 2007). Furthermore, disturbance such as wildfires can also influence moss activities.
This study explicitly incorporated moss into an extant process-based terrestrial ecosystem model to investigate the carbon dynamics in the Arctic for present day and future. Historical regional simulations with TEM_Moss indicated that the region is a carbon sink of 221.9 Pg C over the 20th century, and this sink may decrease to 206.7 Pg C under the RCP2.6 scenario or increase to 256.2 Pg C under the RCP8.5 scenario during the 21st century. Compared with an earlier version of TEM that has not explicitly modeled moss, TEM_Moss projected that the region stored 132.7 Pg more C over the last century and 179.1 and 157.5 Pg more C under the RCP2.6 and RCP8.5 scenarios, respectively. This study demonstrated that moss activities have large effects on ecosystem soil thermal, water, and carbon dynamics through their interactions with vascular plants. This study highlights the importance of considering the moss dynamics in Earth system models to adequately quantify the carbon–climate feedbacks in the Arctic.
Correspondence and material requests should be addressed to qzhuang@purdue.edu.
QZ designed the study. JZ conducted model development, simulation, and analysis. JZ and QZ wrote the paper.
The authors declare that they have no conflict of interest.
Publisher's note: Copernicus Publications remains neutral with regard to jurisdictional claims in published maps and institutional affiliations.
This research was supported by an NSF project (IIS-1027955), a DOE project (DE-SC0008092), and a NASA LCLUC project (NNX09AI26G). We acknowledge the Rosen High Performance Computing Center at Purdue for computing support. We also acknowledge the World Climate Research Programme's Working Group on Coupled Modeling Intercomparison Project CMIP5, and we thank the climate modeling groups for producing and making available their model output. The data of this study can be accessed from the Purdue Research Repository.
This research has been supported by the DOE (grant no. DESC0008092), NASA LCLUC (grant no. NNX09AI26G), and NASA (grant no. NNX17AK20G).
This paper was edited by Jens-Arne Subke and reviewed by two anonymous referees.
Alatalo, J. M., Jägerbrand, A. K., Erfanian, M. B., Chen, S., Sun, S.-Q., and Molau, U.: Bryophyte cover and richness decline after 18 years of experimental warming in alpine Sweden, AoB PLANTS, 12, 6, plaa061, https://doi.org/10.1093/aobpla/plaa061, 2020.
Allison, S. D. and Treseder, K. K.: Warming and drying suppress microbial activity and carbon cycling in boreal forest soils, Glob. Change Biol., 14, 2898–2909, https://doi.org/10.1111/j.1365-2486.2008.01716.x, 2008.
Ayres, E., R. v. d. Wal, Sommerkorn, M., and Bardgett, R. D.: Direct uptake of soil nitrogen by mosses, Biol. Lett.-UK, 2, 286–288, https://doi.org/10.1098/rsbl.2006.0455, 2006.
Basilier, K.: Moss-associated nitrogen fixation in some mire and coniferous forest environments around Uppsala, Sweden, Lindbergia, 5, 84–88, 1979.
Bay, G., Nahar, N., Oubre, M., Whitehouse, M. J., Wardle, D. A., Zackrisson, O., Nilsson, M.-C., and Rasmussen, U.: Boreal feather mosses secrete chemical signals to gain nitrogen, New Phytol., 200, 54–60, https://doi.org/10.1111/nph.12403, 2013.
Berg, A., Danielsson, Å., and Svensson, B. H.: Transfer of Fixed-N from N2-Fixing Cyanobacteria Associated with the Moss Sphagnum Riparium Results in Enhanced Growth of the Moss, JSTOR, Plant Soil, 362, 271–278, https://www.jstor.org/stable/42951898 (last access: 28 May 2021), 2013.
Bond-Lamberty, B. and Thomson, A.: Temperature-associated increases in the global soil respiration record, Nature, 464, 579–582, https://doi.org/10.1038/nature08930, 2010.
Bond-Lamberty, B., Gower, S. T., Ahl, D. E., and Thornton, P. E.: Reimplementation of the Biome-BGC model to simulate successional change, Tree Physiol., 25, 413–424, 2005.
Bond-Lamberty, B., Peckham, S. D., Ahl, D. E., and Gower, S. T.: Fire as the dominant driver of central Canadian boreal forest carbon balance, Nature, 450, 89–92, https://doi.org/10.1038/nature06272, 2007.
Burke, E. J., Ekici, A., Huang, Y., Chadburn, S. E., Huntingford, C., Ciais, P., Friedlingstein, P., Peng, S., and Krinner, G.: Quantifying uncertainties of permafrost carbon–climate feedbacks, Biogeosciences, 14, 3051–3066, https://doi.org/10.5194/bg-14-3051-2017, 2017.
Cahoon, S. M., Sullivan, P. F., Shaver, G. R., Welker, J. M., Post, E., and Holyoak, M.: Interactions among shrub cover and the soil microclimate may determine future Arctic carbon budgets, Ecol. Lett., 15, 1415–1422, https://doi.org/10.1111/j.1461-0248.2012.01865.x, 2012.
Chadburn, S. E., Burke, E. J., Cox, P. M., Friedlingstein, P., Hugelius, G., and Westermann, S.: An observation-based constraint on permafrost loss as a function of global warming, Nat. Clim. Change, 7, 340–344, https://doi.org/10.1038/nclimate3262, 2017.
Clarke, G. C. S.: Productivity of Bryophytes in Polar Regions, Ann. Bot.-London, 35, 99–108, 1971.
Comyn-Platt, E., Hayman, G., Huntingford, C., Chadburn, S. E., Burke, E. J., Harper, A. B., Collins, W. J., Webber, C. P., Powell, T., Cox, P. M., Gedney, N., and Sitch, S.: Carbon budgets for 1.5 and 2 ∘C targets lowered by natural wetland and permafrost feedbacks, Nat. Geosci., 11, 568–573, 2018.
Cornelissen, J. H., Lang, S. I., Soudzilovskaia, N. A., and During, H. J.: Comparative cryptogam ecology: a review of bryophyte and lichen traits that drive biogeochemistry, Ann. Bot.-London, 99, 987–1001, https://doi.org/10.1093/aob/mcm030, 2007.
Davidson, E. A. and Janssens, I. A.: Temperature sensitivity of soil carbon decomposition and feedbacks to climate change, Nature, 440, 165–173, https://doi.org/10.1038/nature04514, 2006.
Davidson, E. A., Trumbore, S. E., and Amundson, R.: Soil warming and organic carbon content, Nature, 408, 789, https://doi.org/10.1038/35048672, 2000.
Davidson, E. A., Janssens, I. A., and Luo, Y.: On the variability of respiration in terrestrial ecosystems: moving beyond Q10, Glob. Change Biol., 12, 154–164, https://doi.org/10.1111/j.1365-2486.2005.01065.x, 2006.
DeLuca, T. H., Zackrisson, O., Gentili, F., Sellstedt, A., and Nilsson, M. C.: Ecosystem controls on nitrogen fixation in boreal feather moss communities, Oecologia, 152, 121–130, https://doi.org/10.1007/s00442-006-0626-6, 2007.
Duan, Q., Sorooshian, S., and Gupta, V. K.: Optimal use of the SCE-UA global optimization method for calibrating watershed models, J. Hydrol., 158, 265–284, 1994.
Euskirchen, E. S., McGuire, A. D., Chapin III, F. S., Yi, S., and Thompson, C. C.: Changes in vegetation in northern Alaska under scenarios of climate change, 2003–2100: implications for climate feedbacks, Ecol. Appl., 19, 1022–1043, 2009.
Falge, E., Aubinet, M., Bakwin, P. S., Baldocchi, D., Berbigier, P., Bernhofer, C., Black, T. A., Ceulemans, R., Davis, K. J., Dolman, A. J., Goldstein, A., Goulden, M. L., Granier, A., Hollinger, D. Y., Jarvis, P. G., Jensen, N., Pilegaard, K., Katul, G., Kyaw Tha Paw, P., Law, B. E., Lindroth, A., Loustau, D., Mahli, Y., Monson, R., Moncrieff, P., Moors, E., Munger, J. W., Meyers, T., Oechel, W., Schulze, E.-D., Thorgeirsson, H., Tenhunen, J., Valentini, R., Verma, S. B., Vesala, T., and Wofsy, S. C.: FLUXNET Marconi Conference Gap-Filled Flux and Meteorology Data, 1992–2000, ORNL DAAC, Oak Ridge, Tennessee, USA, https://doi.org/10.3334/ORNLDAAC/811, 2005.
Fritz, C., Lamers, L. P. M., Riaz, M., van den Berg, L. J. L., and Elzenga, T. J. T. M.: Sphagnum Mosses – Masters of Efficient N-Uptake while Avoiding Intoxication, PLoS ONE, 9, e79991, https://doi.org/10.1371/journal.pone.0079991, 2014.
Frolking, S., Goulden, M. L., Wofsy, S. C., Fan, S-M., Sutton, D. J., Munger, J. W., Bazzaz, A. M., Daube, B. C., Crill, P. M., Aber, J. D., Band, L. E., Wang, X., Savage, K., Moore, T., and Harriss, R. C.: Modelling temporal variability in the carbon balance of a spruce/moss boreal forest, Glob. Change Biol., 2, 343–366, 1996.
Frolking, S., Roulet, N. T., Tuittila, E., Bubier, J. L., Quillet, A., Talbot, J., and Richard, P. J. H.: A new model of Holocene peatland net primary production, decomposition, water balance, and peat accumulation, Earth Syst. Dynam., 1, 1–21, https://doi.org/10.5194/esd-1-1-2010, 2010.
Gilmanov, T. G., Tieszen, L. L., Wylie, B. K., Flanagan, L. B., Frank, A. B., Haferkamp, M. R., Meyers, T. P., and Morgan, J. A.: Integration of CO2flux and remotely-sensed data for primary production and ecosystem respiration analyses in the Northern Great Plains: potential for quantitative spatial extrapolation, Global Ecol. Biogeogr., 14, 271–292, https://doi.org/10.1111/j.1466-822X.2005.00151.x, 2005.
Gornall, J. L., Jonsdottir, I. S., Woodin, S. J., and van der Wal, R.: Arctic mosses govern below-ground environment and ecosystem processes, Oecologia, 153, 931–941, https://doi.org/10.1007/s00442-007-0785-0, 2007.
Gornall, J. L., Woodin, S. J., Jonsdottir, I. S., and van der Wal, R.: Balancing positive and negative plant interactions: how mosses structure vascular plant communities, Oecologia, 166, 769–782, https://doi.org/10.1007/s00442-011-1911-6, 2011.
Gough, C. M., Hardiman, B. S., Nave, L. E., Bohrer, G., Maurer, K. D., Vogel, C. S., Nadelhoffer, K. J., and Curtis, P. S.: Sustained carbon uptake and storage following moderate disturbancein a Great Lakes forest, Ecol. Appl., 23, 1202–1215, 2013.
Goulden, M. L., Winston, G. C., McMillan, A. M. S., Litvak, M. E., Read, E. L., Rocha, A. V., and Rob Elliot, J.: An eddy covariance mesonet to measure the effect of forest age on land atmosphere exchange, Glob. Change Biol., 12, 2146–2162, https://doi.org/10.1111/j.1365-2486.2006.01251.x, 2006.
Hansen, J., Sato, M., Ruedy, R., Lo, K., Lea, D. W., and Medina-Elizade, M.: Global temperature change, P. Natl. Acad. Sci. USA, 103, 14288–14293, https://doi.org/10.1073/pnas.0606291103, 2006.
Harley, P. C., Tenhunen, J. D., Murray, K. J., and Beyers, J.: Irradiance and temperature effects on photosynthesis of tussock tundra Sphagnum mosses from the foothills of the Philip Smith Mountains, Alaska, Oecologia, 79, 251–259, 1989.
Harris, I., Jones, P. D., Osborn, T. J., and Lister, D. H.: Updated high-resolution grids of monthly climatic observations – the CRU TS3.10 Dataset, Int. J. Climatol., 34, 623–642, https://doi.org/10.1002/joc.3711, 2014.
Hayes, D. J., McGuire, A. D., Kicklighter, D. W., Gurney, K. R., Burnside, T. J., and Melillo, J. M.: Is the northern high-latitude land-based CO2 sink weakening?, Global Biogeochem. Cy., 25, GB3018, https://doi.org/10.1029/2010gb003813, 2011.
Hayes, D. J., Kicklighter, D. W., McGuire, A. D., Chen, M., Zhuang, Q., Yuan, F., Melillo, J. M., and Wullschleger, S. D.: The impacts of recent permafrost thaw on land–atmosphere greenhouse gas exchange, Environ. Res. Lett., 9, 045005, https://doi.org/10.1088/1748-9326/9/4/045005, 2014.
He, Y., Yang, J., Zhuang, Q., Harden, J. W., McGuire, A.D., Liu, Y., Wang, G., and Gu, L.: Incorporating microbial dormancy dynamics into soil decomposition models to improve quantification of soil carbon dynamics of northern temperate forests, J. Geophys. Res.-Biogeo., 120, 2596–2611, https://doi.org/10.1002/2015jg003130, 2015.
Hiller, R. V., McFadden, J. P., and Kljun, N.: Interpreting CO2 Fluxes Over a Suburban Lawn: The Influence of Traffic Emissions, Bound.-Lay. Meteorol., 138, 215–230, https://doi.org/10.1007/s10546-010-9558-0, 2010.
Hobbie, S. E., Schimel, J. P., Trumbore, S. E., and Randerson, J. R.: Controls over carbon storage and turnover in high-latitude soils, Glob. Change Biol., 6, 196–210, 2000.
Hugelius, G., Strauss, J., Zubrzycki, S., Harden, J. W., Schuur, E. A. G., Ping, C.-L., Schirrmeister, L., Grosse, G., Michaelson, G. J., Koven, C. D., O'Donnell, J. A., Elberling, B., Mishra, U., Camill, P., Yu, Z., Palmtag, J., and Kuhry, P.: Estimated stocks of circumpolar permafrost carbon with quantified uncertainty ranges and identified data gaps, Biogeosciences, 11, 6573–6593, https://doi.org/10.5194/bg-11-6573-2014, 2014.
Jägerbrand, A. K., Lindblad, K. E. M., Björk, R. G., Alatalo, J. M., and Molau, U.: Bryophyte and Lichen Diversity Under Simulated Environmental Change Compared with Observed Variation in Unmanipulated Alpine Tundra, Biodivers. Conserv., 15, 4453–4475, https://doi.org/10.1007/s10531-005-5098-1, 2006.
Jenkins, J. P., Richardson, A. D., Braswell, B. H., Ollinger, S. V., Hollinger, D. Y., and Smith, M. L.: Refining light-use efficiency calculations for a deciduous forest canopy using simultaneous tower-based carbon flux and radiometric measurements, Agr. Forest Meteorol., 143, 64–79, https://doi.org/10.1016/j.agrformet.2006.11.008, 2007.
Jobbágy, E. G. and Jackson, R. B.: The vertical distribution of soil organic carbon and its relation to climate and vegetation, Ecol. Appl., 10, 423–436, 2000.
Kasischke, E. S.: Boreal ecosystems in the global carbon cycle, in: Fire, climate change, and carbon cycling in the boreal forest, Ecological Studies (Analysis and Synthesis), 138, 19–30, https://doi.org/10.1007/978-0-387-21629-4_2, 2000.
Kasischke, E. S. and Turetsky, M. R.: Recent changes in the fire regime across the North American boreal region – Spatial and temporal patterns of burning across Canada and Alaska, Geophys. Res. Lett., 33, L09703, https://doi.org/10.1029/2006gl025677, 2006.
Kip, N., Ouyang, W., van Winden, J., Raghoebarsing, A., van Niftrik, L., Pol, A., Pan, Y., Bodrossy, L., van Donselaar, E. G., Reichart, G. J., Jetten, M. S., Damste, J. S., and Op den Camp, H. J.: Detection, isolation, and characterization of acidophilic methanotrophs from Sphagnum mosses, Appl. Environ. Microb., 77, 5643–5654, https://doi.org/10.1128/AEM.05017-11, 2011.
Knorr, W.: Annual and interannual CO2 exchanges of the terrestrial biosphere: process-based simulations and uncertainties, Global Ecol. Biogeogr., 9, 225–252, 2000.
Koven, C. D., Schuur, E. A. G., Schädel, C., Bohn, T. J., Burke, E. J., Chen, G., Chen, X., Ciais, P., Grosse, G., Harden, J. W., Hayes, D. J., Hugelius, G., Jafarov, E. E., Krinner, G., Kuhry, P., Lawrence, D. M., Macdougall, A. H., Marchenko, S. S., Mcguire, A. D., Natali, S. M., Nicolsky, D. J., Olefeldt, D., Peng, S., Romanovsky, V. E., Schaefer, K. M., Strauss, J., Treat, C. C., and Turetsky, M.: A simplified, data-constrained approach to estimate the permafrost carbon-climate feedback, Philos. T. R. Soc. A, 373, 20140423, https://doi.org/10.1098/rsta.2014.0423, 2015.
Kulmala, L., Pumpanen, J., Hari, P., and Vesala, T.: Photosynthesis of ground vegetation in different aged pine forests: Effect of environmental factors predicted with a process-based model, J. Veg. Sci., 22, 96–110, 2011.
Lang, S. I., Cornelissen, J. H. C., Shaver, G. R., Matthias, A., Callaghan, T. V., Molau, U., Ter Braak, C. J. F., Holzer, A., and Aerts, R.: 2011. Arctic warming on two continents has consistent negative effects on lichen diversity and mixed effects on bryophyte diversity, Glob. Change Biol., 18, 1096–1107, https://doi.org/10.1111/j.1365-2486.2011.02570.x, 2011.
Launiainen, S., Katul, G. G., Lauren, A., and Kolari, P.: Coupling boreal forest CO2, H2O and energy flows by a vertically structured forest canopy – Soil model with separate bryophyte layer, Ecol. Model., 312, 385–405, https://doi.org/10.1016/j.ecolmodel.2015.06.007, 2015.
Lindo, Z. and Gonzalez, A.: The Bryosphere: An Integral and Influential Component of the Earth's Biosphere, Ecosystems, 13, 612–627, https://doi.org/10.1007/s10021-010-9336-3, 2010.
Longton, R. E.: Adaptations and strategies of polar bryophytes, Bot. J. Linn. Soc., 98, 253–268, 1988.
Markham, J. H.: Variation in moss-associated nitrogen fixation in boreal forest stands, Oecologia, 161, 353–359, https://doi.org/10.1007/s00442-009-1391-0, 2009.
McEwing, K. R., Fisher, J. P., and Zona, D.: Environmental and vegetation controls on the spatial variability of CH4 emission from wet-sedge and tussock tundra ecosystems in the Arctic, Plant Soil, 388, 37–52, https://doi.org/10.1007/s11104-014-2377-1, 2015.
McGuire, A. D., Melillo, J. M., Joyce, L. A., Kicklighter, D. W., Grace, A. L., Moore III, B., and Vorosmarty, C. J.: Interactions between carbon and nitrogen dynamics in estimating net primary productivity for potential vegetation in North America, Global Biogeochem. Cy., 6, 101–124, 1992.
McGuire, A. D., Anderson, L. G., Christensen, T. R., Dallimore, S., Guo, L., Hayes, D. J., Heimann, M., Lorenson, T. D., Macdonald, R. W., and Roulet, N.: Sensitivity of the carbon cycle in the Arctic to climate change, Ecol. Monogr., 79, 523–555, 2009.
Melillo, J. M., McGuire, A. D., Kicklighter, D. W., Moore, B., Vorosmarty, C. J., and Schloss, A. L.: Global climate change and terrestrial net primary production, Nature, 363, 234, https://doi.org/10.1038/363234a0, 1993.
Melillo, J. M., Butler, S., Johnson, J., Mohan, J., Steudler, P., Lux, H., Burrows, E., Bowles, F., Smith, R., Scott, L., Vario, C., Hill, T., Burton, A., Zhou, Y.-M., and Tang, J.: Soil warming, carbon–nitrogen interactions, and forest carbon budgets, PNAS, 108, 9508–9512, 2011.
Oechel, W. C. and Van Cleve, K.: The role of bryophytes in nutrient cycling in the taiga, in: Forest ecosystems in the Alaskan taiga. A synthesis of structure and function, edited by: Van Cleve, K., Chapin III, F. S., Dryness, C. T., Viereck, L. A., Flanagan, P. W., Springer, Berlin Heidelberg New York, 1986.
Oechel, W. C. and Collins, N. J.: Comparative COz exchange patterns in mosses from two tundra habitats at Barrow, Alaska, Can. J. Botany, 54, 1355–1369, 1976.
Oechel, W. and Kalhori, A.: ABoVE: CO2 and CH4 Fluxes and Meteorology at Flux Tower Sites, Alaska, 2015–2017, ORNL DAAC, Oak Ridge, Tennessee, USA, https://doi.org/10.3334/ORNLDAAC/1562, 2018.
Oechel, W. C., Laskowski, C. A., Burba, G., Gioli, B., and Kalhori, A. A. M.: Annual patterns and budget of CO2 flux in an Arctic tussock tundra ecosystem, J. Geophys. Res.-Biogeo., 119, 323–339, https://doi.org/10.1002/2013jg002431, 2014.
Okland, R. H.: Population Biology of the Clonal Moss Hylocomium Splendens in Norwegian Boreal Spruce Forests, I. Demography, J. Ecol., 83, 697–712, 1995.
Oreskes, N., Shrader-Frechette, K., and Belitz, K.: Verification, validation, and confirmation of numerical models in the earth sciences, Science, 263, 641–646, 1994.
Pakarinen, P. and Vitt, D. H.: Primary production of plant communities of the Truelove Lowland, Devon Island, Canada–Moss communities, Primary production and production processes, tundra biome, International Biological Programme, Tundra Biome Steering Committee, Edmonton Oslo, 37–46, 1973.
Pharo, E. J. and Zartman, C. E.: Bryophytes in a changing landscape: The hierarchical effects of habitat fragmentation on ecological and evolutionary processes, Biol. Conserv., 135, 315–325, https://doi.org/10.1016/j.biocon.2006.10.016, 2007.
Raich, J. W., Rastetter, E. B., Melillo, J. M., Kicklighter, D. W., Steudler, P. A., Peterson, B. J., Grace, A. L., Moore III, B., and Vorosmarty, C. J.: Potential net primary productivity in South America: application of a global model, Ecol. Appl., 1, 399–429, 1991.
Richardson, A. D., Jenkins, J. P., Braswell, B. H., Hollinger, D. Y., Ollinger, S. V., and Smith, M. L.: Use of digital webcam images to track spring green-up in a deciduous broadleaf forest, Oecologia, 152, 323–334, https://doi.org/10.1007/s00442-006-0657-z, 2007.
Running, S. W. and Coughlan, J. C.: A general model of forest ecosystem processes for regional applications I. Hydrologic balance, canopy gas exchange and primary production processes, Ecol. Model., 42, 125–154, 1988.
Schimel, D. S., House, J. I., Hibbard, K. A., Bousquet, P., Ciais, P., Peylin, P., Braswell, B. H., Apps, M. J., Baker, D., Bondeau, A., Canadell, J., Churkina, G., Cramer, W., Denning, A. S., Field, C. B., Friedlingstein, P., Goodale, C., Heimann, M., Houghton, R. A., Melillo, J. M., Moore III, B., Murdiyarso, D., Noble, I., Pacala, S. W., Prentice, I. C., Raupach, M. R., Rayner, P. J., Scholes, R. J., Steffen, W. L., and Wirth, C.: Recent patterns and mechanisms of carbon exchange by terrestrial ecosystems, Nature, 414, 169–172, 2001.
Schuur, E. A. G., Bockheim, J., Canadell, J. G., Euskirchen, E., Christopher, Field, S. V. G., Hagemann, S., Kuhry, P., Lafleur, P. M., Lee, H., Mazhitova, G., Nelson, F. E., Rinke, A., Romanovsky, V. E., Shiklomanov, N., Tarnocai, C., Venevsky, S., Vogel, J. G., and Zimov, S. A.: Vulnerability of Permafrost Carbon to Climate Change: Implications for the Global Carbon Cycle, Bioscience, 58, 701–714, 2008.
Serreze, M. C. and Francis, J. A.: The Arctic on the fast track of change, Weather, 61, 65–69, 2006.
Shetler, G., Turetsky, M. R., Kane, E., and Kasischke, E.: Sphagnum mosses limit total carbon consumption during fire in Alaskan black spruce forests, Can. J. Forest Res., 38, 2328–2336, https://doi.org/10.1139/x08-057, 2008.
Skre, O. and Oechel, W. C.: Moss production in a black spruce Picea mariana forest with permafrost near Fairbanks, Alaska, as compared with two permafrost-free stands, Ecography, 2, 249–254, 1979.
Soja, A. J., Tchebakova, N. M., French, N. H. F., Flannigan, M. D., Shugart, H. H., Stocks, B. J., Sukhinin, A. I., Parfenova, E. I., Chapin, F. S., and Stackhouse, P. W.: Climate-induced boreal forest change: Predictions versus current observations, Global Planet. Change, 56, 274–296, https://doi.org/10.1016/j.gloplacha.2006.07.028, 2007.
Stangel, D. and Kelly, S. F.: BOREAS HYD-01 Volumetric Soil Moisture Data, ORNL Distributed Active Archive Center, https://doi.org/10.3334/ORNLDAAC/255, 1999.
Stow, D. A., Hope, A., McGuire, D., Verbyla, D., Gamon, J., Huemmrich, F., Houston, S., Racine, C., Sturm, M., Tape, K., Hinzman, L., Yoshikawa, K., Tweedie, C., Noyle, B., Silapaswan, C., Douglas, D., Griffith, B., Jia, G., Epstein, H., Walker, D., Daeschner, S., Petersen, A., Zhou, L., and Myneni, R.: Remote sensing of vegetation and land-cover change in Arctic Tundra Ecosystems, Remote Sens. Environ., 89, 281–308, https://doi.org/10.1016/j.rse.2003.10.018, 2004.
Tang, J. and Zhuang, Q.: Equifinality in parameterization of process-based biogeochemistry models: A significant uncertainty source to the estimation of regional carbon dynamics, J. Geophys. Res.-Biogeo., 113, G04010, https://doi.org/10.1029/2008jg000757, 2008.
Tape, K. E. N., Sturm, M., and Racine, C.: The evidence for shrub expansion in Northern Alaska and the Pan-Arctic, Glob. Change Biol., 12, 686–702, https://doi.org/10.1111/j.1365-2486.2006.01128.x, 2006.
Tarnocai, C., Canadell, J. G., Schuur, E. A. G., Kuhry, P., Mazhitova, G., and Zimov, S.: Soil organic carbon pools in the northern circumpolar permafrost region, Global Biogeochem. Cy., 23, GB2023, https://doi.org/10.1029/2008gb003327, 2009.
Todd-Brown, K. E. O., Randerson, J. T., Post, W. M., Hoffman, F. M., Tarnocai, C., Schuur, E. A. G., and Allison, S. D.: Causes of variation in soil carbon simulations from CMIP5 Earth system models and comparison with observations, Biogeosciences, 10, 1717–1736, https://doi.org/10.5194/bg-10-1717-2013, 2013.
Treseder, K. K., Balser, T. C., Bradford, M. A., Brodie, E. L., Dubinsky, E. A., Eviner, V. T., Hofmockel, K. S., Lennon, J. T., Levine, U. Y., MacGregor, B. J., Pett-Ridge, J., and Waldrop, M. P.: Integrating microbial ecology into ecosystem models: challenges and priorities, Biogeochemistry, 109, 7–18, https://doi.org/10.1007/s10533-011-9636-5, 2011.
Treseder, K. K., Marusenko, Y., Romero-Olivares, A. L., and Maltz, M. R.: Experimental warming alters potential function of the fungal community in boreal forest, Glob. Change Biol., 22, 3395–3404, https://doi.org/10.1111/gcb.13238, 2016.
Turetsky, M. R., Mack, M. C., Hollingsworth, T. N., and Harden, J. W.: The role of mosses in ecosystem succession and function in Alaska's boreal forest, Can. J. Forest Res., 40, 1237–1264, https://doi.org/10.1139/x10-072, 2010.
Turetsky, M. R., Bond-Lamberty, B., Euskirchen, E., Talbot, J., Frolking, S., McGuire, A. D., and Tuittila, E. S.: The resilience and functional role of moss in boreal and arctic ecosystems, New Phytol., 196, 49–67, https://doi.org/10.1111/j.1469-8137.2012.04254.x, 2012.
Vörösmarty, C. J., Moore III, B., Grace, A. L., and Gildea, M. P.: Continental scale models of water balance and fluvial transport: an application to South America, Global Biogeochem. Cy., 3, 241–265, 1989.
Wardle, D. A.: Understory vegetation as a forest ecosystem driver: evidence from the northern Swedish boreal forest, The Ecological Society of America, 3, 421–428, 2005.
White, A., Cannell, M. G. R., and Friend, A. D.: The high-latitude terrestrial carbon sink: a model analysis, Glob. Change Biol., 6, 227–245, 2000.
Wieder, W. R., Bonan, G. B., and Allison, S. D.: Global soil carbon projections are improved by modelling microbial processes, Nat. Clim. Change, 3, 909–912, https://doi.org/10.1038/nclimate1951, 2013.
Williams, T. G. and Flanagen, L. B.: Measuring and modelling environmental influences on photosynthetic gas exchange in Sphagnum and Pleurozium, Plant Cell Environ., 21, 555–564, 1998.
Zha, J. and Zhuang, Q.: Microbial decomposition processes and vulnerable arctic soil organic carbon in the 21st century, Biogeosciences, 15, 5621–5634, https://doi.org/10.5194/bg-15-5621-2018, 2018.
Zhuang, Q., Romanovsky, V. E., and McGuire, A. D.: Incorporation of a permafrost model into a large-scale ecosystem model: Evaluation of temporal and spatial scaling issues in simulating soil thermal dynamics, J. Geophys. Res.-Atmos., 106, 33649–33670, https://doi.org/10.1029/2001jd900151, 2001.
Zhuang, Q., McGuire, A. D., O'Neill, K. P., Harden, J. W., Romanovsky, V. E., and Yarie, J.: Modeling soil thermal and carbon dynamics of a fire chronosequence in interior Alaska, J. Geophys. Res., 108, FFR 3-1–FFR-3-26, https://doi.org/10.1029/2001jd001244, 2002.
Zhuang, Q., McGuire, A. D., Melillo, J. M., Clein, J. S., Dargaville, R. J., Kicklighter, D. W., Myneni, R. B., Dong, J., Romanovsky, V. E., Harden, J., and Hobbie, J. E.: Carbon cycling in extratropical terrestrial ecosystems of the Northern Hemisphere during the 20th Century: A modeling analysis of the influences of soil thermal dynamics, Tellus, 55B, 751–776, 2003.
Zhuang, Q., He, J., Lu, Y., Ji, L., Xiao, J., and Luo, T.: Carbon dynamics of terrestrial ecosystems on the Tibetan Plateau during the 20th century: an analysis with a process-based biogeochemical model, Global Ecol. Biogeogr., 19, 649–662, https://doi.org/10.1111/j.1466-8238.2010.00559.x, 2010.
Zhuang, Q., Chen, M., Xu, K., Tang, J., Saikawa, E., Lu, Y., Melillo, J. M., Prinn, R. G., and McGuire, A. D.: Response of global soil consumption of atmospheric methane to changes in atmospheric climate and nitrogen deposition, Global Biogeochem. Cy., 27, 650–663, https://doi.org/10.1002/gbc.20057, 2013.
Zhuang, Q., Zhu, X., He, Y., Prigent, C., Melillo, J. M., David McGuire, A., Prinn, R. G., and Kicklighter, D. W.: Influence of changes in wetland inundation extent on net fluxes of carbon dioxide and methane in northern high latitudes from 1993 to 2004, Environ. Res. Lett., 10, 095009, https://doi.org/10.1088/1748-9326/10/9/095009, 2015.