the Creative Commons Attribution 4.0 License.
the Creative Commons Attribution 4.0 License.
 | 07 Dec 2021
A modelling study of temporal and spatial pCO2 variability on the biologically active and temperature-dominated Scotian Shelf
Krysten Rutherford
Katja Fennel
Dariia Atamanchuk
Douglas Wallace
Helmuth Thomas
Continental shelves are thought to be affected disproportionately by climate change and are a large contributor to global air–sea carbon dioxide (CO2) fluxes. It is often reported that low-latitude shelves tend to act as net sources of CO2, whereas mid- and high-latitude shelves act as net sinks. Here, we combine a high-resolution regional model with surface water time series and repeat transect observations from the Scotian Shelf, a mid-latitude region in the northwest North Atlantic, to determine what processes are driving the temporal and spatial variability of partial pressure of CO2 (pCO2) on a seasonal scale. In contrast to the global trend, the Scotian Shelf acts as a net source. Surface pCO2 undergoes a strong seasonal cycle with an amplitude of ∼ 200–250 µatm. These changes are associated with both a strong biological drawdown of dissolved inorganic carbon (DIC) in spring (corresponding to a decrease in pCO2 of 100–200 µatm) and pronounced effects of temperature, which ranges from 0 ∘C in the winter to near 20 ∘C in the summer, resulting in an increase in pCO2 of ∼ 200–250 µatm. Throughout the summer, events with low surface water pCO2 occur associated with coastal upwelling. This effect of upwelling on pCO2 is also in contrast to the general assumption that upwelling increases surface pCO2 by delivering DIC-enriched water to the surface. Aside from these localized events, pCO2 is relatively uniform across the shelf. Our model agrees with regional observations, reproduces seasonal patterns of pCO2, and simulates annual outgassing of CO2 from the ocean of mol C m−2 yr−1 for the Scotian Shelf, net uptake of CO2 by the ocean of mol C m−2 yr−1 for the Gulf of Maine, and uptake by the ocean of mol C m−2 yr−1 for the Grand Banks.
- Article
(8279 KB) - Full-text XML
-
Supplement
(20121 KB) - BibTeX
- EndNote


The global ocean acts as a major sink of CO2 from the atmosphere (e.g. Le Quéré et al., 2018; Gruber et al., 2019; Landschützer et al., 2014; Rödenbeck et al., 2015), but it has been suggested that flux density (or flux per unit area) on continental shelves is larger than in the open ocean (Chen et al., 2013; Laruelle et al., 2014). Therefore, compared to their size, continental shelves are thought to disproportionately contribute to global air–sea CO2 fluxes (Laruelle et al., 2010). Additionally, they are susceptible to climate change on much shorter timescales than the open ocean (Cai et al., 2010) and are experiencing increasing impacts of human activity (Cai, 2011; Doney, 2010; Gruber, 2015). Given their high susceptibility to negative impacts from climate change, and their potentially significant contribution to global air–sea CO2 fluxes, it is important to understand the drivers underlying inorganic carbon dynamics on continental shelves.
It is generally thought that continental shelves at middle to high latitudes act as net sinks of atmospheric CO2 while those at low latitudes act as net sources (e.g. Chen and Borges, 2009; Cai et al., 2006; Laruelle et al., 2014; Roobaert et al., 2019). There are, however, notable deviations from this global-scale pattern. The Scotian Shelf, a mid-latitude shelf off the coast of eastern Canada, is one example with large discrepancies between independent estimates of air–sea CO2 flux (Fennel et al., 2019). Direct measurements made using a moored CARIOCA buoy on the Scotian Shelf indicate that the shelf acts as a net source of CO2 to the atmosphere (Shadwick et al., 2010, 2011; Shadwick and Thomas, 2014). These findings are in contrast to other studies using observations from the Surface Ocean CO2 Atlas (SOCAT) database, indicating that the Scotian Shelf follows the global trend and acts as a net sink of CO2 (Laruelle et al., 2014, 2015; Signorini et al., 2013). These contrasting results for the Scotian Shelf emphasize the large uncertainty inherent in shelf-wide CO2 flux estimates.
Continental shelves are highly complex and dynamic regions where many biological and physical processes modulate CO2 flux (Laruelle et al., 2014, 2017; Roobaert et al., 2019). The partial pressure of CO2 (pCO2) in the ocean is one of the key factors which determines the air–sea CO2 flux. Recent global studies found that thermal controls dominate the seasonality of pCO2 but that these alone cannot describe observed pCO2 variations, particularly in temperate and high latitudes (Roobaert et al., 2019). High rates of primary production on continental shelves (Chen and Borges, 2009) are another important driver of seasonal changes in pCO2.
Continental margins are also subject to intense horizontal transport processes, which act as additional drivers of CO2 fluxes. For example, the continental shelf pump, a term first coined by Tsunogai et al. (1999) in relation to the East China Sea, describes the movement of shelf water high in dissolved inorganic carbon (DIC) across the shelf break to the subsurface open ocean, leading to an influx of atmospheric CO2. This mechanism is thought to mainly occur at mid- to high-latitude shelves since it relies on winter cooling to create dense shelf water that is transported to the open ocean's subsurface layers. Upwelling is another well-studied transport mechanism driving shelf-wide CO2 dynamics. The California Current System is a typical example of an upwelling system (Chavez et al., 2017; Hickey, 1998; Fennel et al., 2019; Feely et al., 2008). Here, winds drive coastal upwelling, which brings DIC-rich water to the surface along the continental shelf and creates favourable conditions for CO2 outgassing to the atmosphere.
Altogether, these complex shelf dynamics lead to large spatial and temporal variability of pCO2 (Previdi et al., 2009). Such large variability combined with limited data availability for many continental shelves makes it difficult to accurately constrain CO2 fluxes. Limited data availability in space and time, often with seasonal biases, is a prime source of uncertainty in flux estimates that can only be overcome with more uniformly distributed sampling. To fully capture how ocean margins are reacting to perturbations caused by the steady input of anthropogenic CO2 to the atmosphere, it is important to understand the processes underlying both spatial and temporal evolution of shelf-wide pCO2.
Numerical models can be useful when investigating such complex interactions and constraining CO2 flux since they can interpret sparse measurements through the mechanistic representations of relevant processes. In the present study, we employ a high-resolution biogeochemical model of the northwest North Atlantic to examine the magnitude, variability, and sign of the air–sea CO2 flux on the Scotian Shelf. Previous studies have evaluated our model's ability to represent the physical (Brennan et al., 2016; Rutherford and Fennel, 2018) and biological (Laurent et al., 2021) dynamics of the region. Here, we focus solely on the model representation of inorganic carbon dynamics, especially the spatial and temporal variability of pCO2 on a seasonal scale on the Scotian Shelf in light of new, high-resolution, shelf-wide observations.
Our overall goal is to show how both biological and transport processes work together seasonally on the Scotian Shelf to set shelf-wide surface pCO2. We additionally discuss event-based variability of the air–sea CO2 flux and, especially, how short-term, upwelling-favourable wind events throughout the summer create spatial variability of CO2 on the Scotian Shelf. To accomplish these goals, our paper (1) discusses the seasonal cycle of pCO2 across the shelf; (2) investigates the spatial variability of pCO2, particularly during the summer months; and (3) reports shelf-wide air–sea CO2 flux estimates in comparison to previously reported estimates. We discuss the importance of our findings in terms of global patterns of air–sea CO2 flux and carbon cycling.
The Scotian Shelf (Fig. 1) is uniquely located at the junction of the subpolar and subtropical gyres (Loder et al., 1997; Hannah et al., 2001). Regional circulation is dominated by southward transport of the Labrador Current (Loder et al., 1998; Fratantoni and Pickart, 2007). As a result, cool Arctic-derived water accumulates along the northwestern North Atlantic continental shelf separating fresh shelf waters from warmer and salty slope waters (Beardsley and Boicourt, 1981; Loder et al., 1998; Fratantoni and Pickart, 2007).
The Scotian Shelf in particular is controlled by inshore and shelf-break branches of the southwestward moving current. The shelf-break branch inhibits the movement of water across the shelf break of the Scotian Shelf (Rutherford and Fennel, 2018). As a result, water moves predominantly along-shelf so that residence times in the region are relatively long, with water being retained on the Scotian Shelf for an average of 3 months before moving further southwest on the shelf (Rutherford and Fennel, 2018). In terms of vertical structure, the Scotian Shelf shifts between a two-layer system in the winter, when a cold, fresh layer sits over a warm, salty deep layer, and a three-layer system in the spring and summer, when a warm surface layer forms in the top 20 m above the cold intermediate layer between 20–100 m and the warm and salty deep layer (Dever et al., 2016).
The Scotian Shelf is additionally characterized by a large, shelf-wide spring bloom initiated in late March (Ross et al., 2017; Fournier et al., 1977; Mills and Fournier, 1979), when the mixed layer is still relatively deep and temperature is at its coldest (Craig et al., 2015). The initiation of the spring bloom in late March has rapid and large impacts on the observed pCO2 seasonality (Shadwick et al., 2010, 2011).
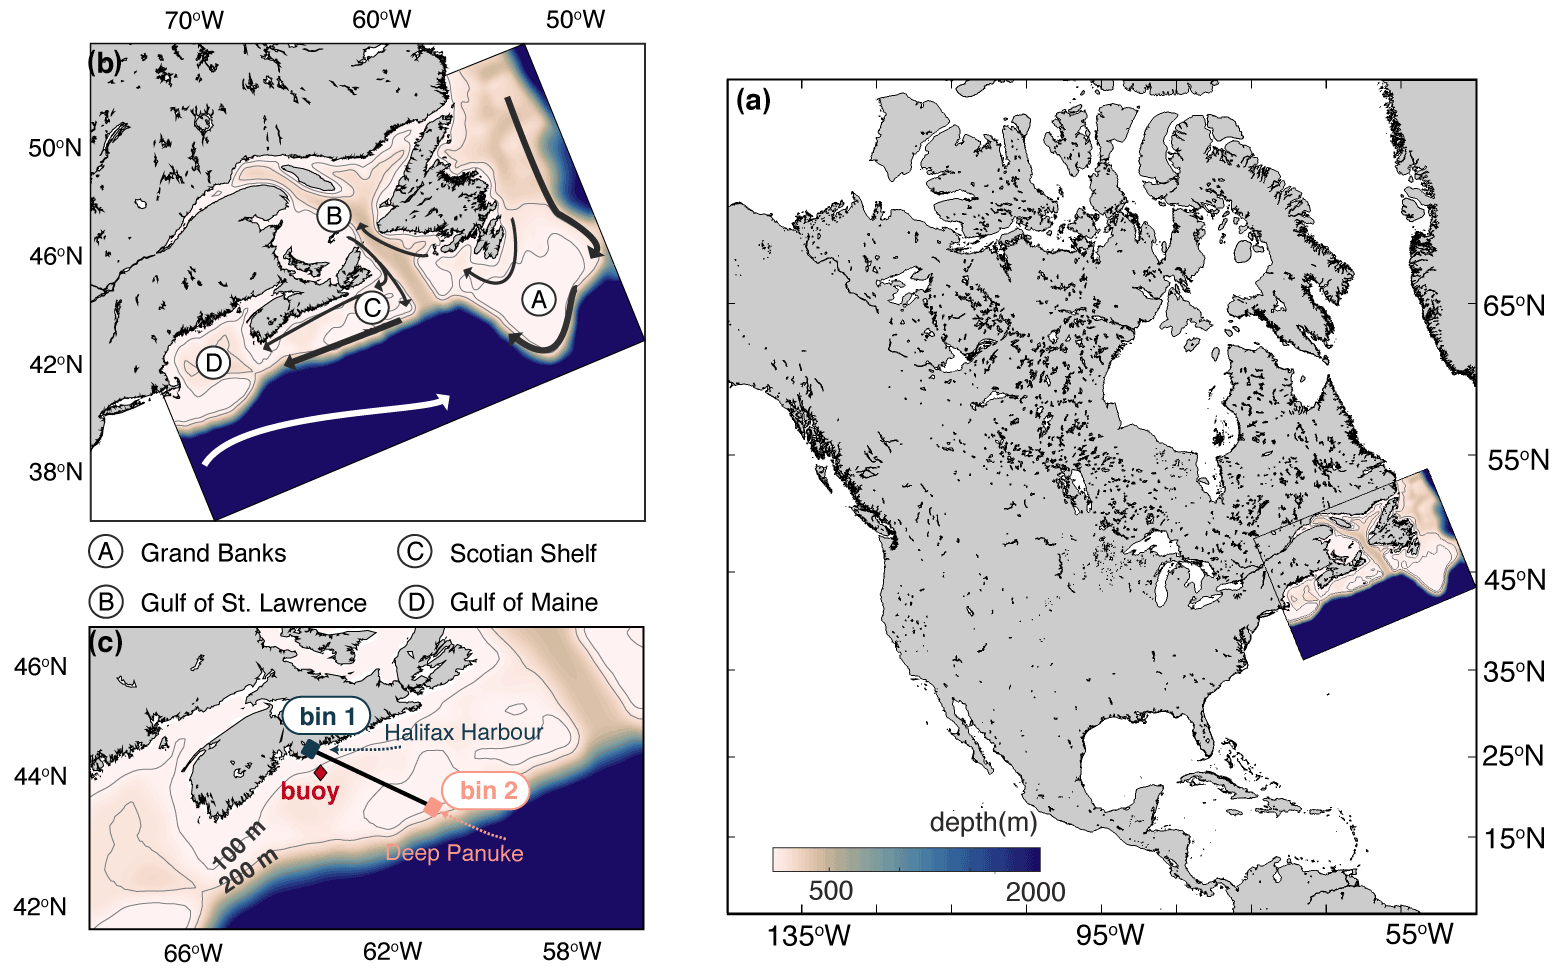
Figure 1Bathymetric maps of the model domain. (a) Map of North America, including the location of the model domain. (b) A zoomed-in map of the model domain with mean current locations. (c) Zoomed-in map of the Scotian Shelf, which indicates the location of the CARIOCA buoy (red diamond) and the Atlantic Condor transect (black line). Bin 1 (Halifax Harbour) and bin 2 (Deep Panuke) are used for analyses of spatial variability. All maps show the 100 and 200 m isobaths.
3.1 Model setup and initialization
3.1.1 Physical model setup
We employ a biogeochemical model, based on Fennel et al. (2006), Fennel and Wilkin (2009), and Laurent et al. (2021), that is part of the Regional Ocean Modelling System (ROMS, v.3.5; Haidvogel et al., 2008). The physical model implementation, described in more detail in Brennan et al. (2016), has 30 vertical levels and approximately 10 km horizontal resolution (240×120 horizontal grid cells) and uses the GLS vertical mixing scheme (Umlauf and Burchard, 2003; Warner et al., 2005), atmospheric surface forcing from the European Centre for Medium-Range Weather Forecasts (ECMWF) global atmospheric reanalysis (Dee et al., 2011), and the “high-order spatial interpolation at the middle temporal level” (HSIMT) advection scheme for tracers (Wu and Zhu, 2010). Physical initial and boundary conditions are defined using the regional physical ocean model of the northwest North Atlantic of Urrego-Blanco and Sheng (2012). Temperature and salinity are nudged towards the climatology of Geshelin et al. (1999) in a 10-grid-cell-wide buffer zone along open boundaries. Nudging strength decays linearly away from the boundaries to a value of zero in the 11th grid cell from the boundary. Tides are imposed from Egbert and Erofeeva (2002). Climatological river discharge is imposed for 12 major rivers and uses observed long-term monthly means from the Water Survey of Canada. Full details on the physical model setup and its validation can be found in Brennan et al. (2016) and Rutherford and Fennel (2018). These studies have shown that our model simulates the vertical structure and seasonal cycling of temperature and salinity on the shelf well. The model captures mesoscale features and the coastal upwelling events and simulates the volume transport throughout the region in agreement with observation-based estimates.
3.1.2 Biogeochemical module
The biogeochemical model is based on the nitrogen-cycle model with the inorganic carbon component of Fennel et al. (2006) and Fennel and Wilkin (2009) but was recently expanded to include two phytoplankton and two zooplankton functional groups (Laurent et al., 2021). For a detailed description and validation of the biological model, we refer to Laurent et al. (2021), who compared the model output with glider transects of temperature, salinity, and chlorophyll and in situ measurements of chlorophyll and nitrate. The model was evaluated on a seasonal scale for the entire model domain, mainly in the surface (top 100 m). Laurent et al. (2021) showed that the model outperforms global models for the region for all variables and that the timing of the spring bloom is well represented, but the model slightly underestimates the magnitude of the bloom and tends to overestimate nitrate throughout the year.
For calculating the air–sea CO2 flux, according to the carbonate chemistry model of Zeebe and Wolf-Gladrow (2001), we use dissociation constants (K1 and K2) from Millero (1995) using Mehrbach et al. (1973) data on the seawater scale which are deemed appropriate for the typical salinity ranges from 27 to 36.6 in the model domain (lower salinities are highly localized in the Gulf of St. Lawrence estuary). Atmospheric pCO2 is set to the seasonal cycle and secular trend derived from Sable Island monitoring data contributed by Environment Canada's Greenhouse Gas Measurement Program (Environment and Climate Change Canada, 2016). The long-term linear trend in the atmospheric pCO2 is ∼ +2 µatm yr−1 (see Supplement for the full trend equation and figure). CO2 solubility is calculated with the Weiss (1974) formulation. The gas transfer coefficient of Ho et al. (2006) is used and depends on wind speed at 10 m above the sea surface and the Schmidt number. Further details of the biogeochemical model, including the carbonate chemistry equations, can be found in Laurent et al. (2017, their Supplement). Carbon initialization, boundary conditions, and climatological nudging are calculated from relationships with temperature and salinity determined from bottle data for the region. DIC is nudged in an 80-grid-cell-wide buffer zone along the eastern boundary, with nudging linearly decaying away from a nudging timescale of 60 d at the boundary to a value of 0 in the 81st grid cell. At all other boundaries, a 10-grid buffer zone is used, as with temperature and salinity. Use of a wider boundary nudging zone along the eastern boundary was found to be beneficial in imposing low-frequency variability from the Labrador Sea at the northeastern boundary. The nudging zones are not used in the analysis.
Nitrate concentrations in rivers are prescribed from Global NEWS model output Seitzinger et al. (2005). DIC and total alkalinity (TA) in rivers were calculated by fitting a linear relationship with salinity from Gulf of St. Lawrence bottle data and extrapolating to river water salinity. The model is initialized on 1 January 1999, from solution of Urrego-Blanco and Sheng (2012) for temperature and salinity. Nitrate (NO) concentrations are initialized from the regional climatologies as in Laurent et al. (2021). DIC and TA initial and boundary conditions were created from observationally based relationships with temperature (T) and salinity (S) using bottle data from regional cruises from 1997–2011 encompassing as far south as the Gulf of Maine and as far north as the Labrador Sea (observations from DFO's AZMP program; see https://dfo-mpo.gc.ca/science/data-donnees/azmp-pmza/index-eng.html#publications, last access: September 2014). Initialization relationships used only observations from December, January, and February (TA = 43S+800, r2=0.96; DIC = , r2=0.90). Boundary conditions used observations that encompassed the entire year (TA = 41S+875, r2=0.92; DIC = , r2=0.80). The model is run for 16 years (1999–2014) with daily output. The present study analyses the model output from 2006–2014, with focus on year 2006. See the Supplement for a comparison of surface pCO2 throughout the simulation and a brief validation of TA and DIC.
3.1.3 Taylor decomposition of upwelling events
To better understand the effects of coastal upwelling on surface pCO2, we perform a Taylor decomposition on the model output during one of the upwelling events focused on in this study, following a similar methodology to Rheuban et al. (2019) and Hauri et al. (2020). Here, we investigate the influence of T, S, DIC, and TA on pCO2 following the equation
where f indicates the CO2SYS set of equations. We calculated anomalies, ΔpCO2, from a reference value, pCO2,0:
The reference values for each variable were calculated as the average of that variable along the Atlantic Condor transect (see Fig. 1) in the upper 40 m (i.e. the part of the water column affected by the upwelling event). We decomposed ΔpCO2 relatively simply into perturbations related to T, S, DIC, and TA calculated as follows:
We refer the reader to Rheuban et al. (2019) for a more detailed description of the Taylor decomposition methodology.
3.2 Observational datasets
The moored CARIOCA buoy was located at Station 2 on the Halifax Line. Station 2 (HL2; 44.3∘ N, 63.3∘ W) is located about 30 km offshore from Halifax, Nova Scotia, and occupied monthly by the Bedford Institute of Oceanography. The buoy measured surface water (at approximately 1 m depth) temperature, conductivity, pCO2, salinity, and Chl-a fluorescence every hour and was deployed from 2007 to 2014 with several gaps in data due to calibration and maintenance (see Table S1 in Supplement). pCO2 was estimated using an automated spectrophotometric technique (Lemay et al., 2018). The raw pCO2 data contained high-amplitude spikes, with increases from 400 to over 1000 µatm within a few hours, which were measuring artifacts and did not represent pCO2 of surrounding water. These spikes were removed by binning all years of the pCO2 observations into a 365 d of year (DOY) seasonal cycle. Any points that were outside 1.5 standard deviations of the 1-month moving average pCO2 were discarded. This method removed only the extreme values and maintained much of the observed variability (see Fig. 2).
The sensor-based underway system, Dal-SOOP (Arruda et al., 2020), was installed on the multipurpose platform supply vessel Atlantic Condor (operated by Atlantic Towing Ltd.) and has been measuring a suite of biogeochemical parameters, including pCO2, in the surface water since May 2017. The ship transits weekly to biweekly between the Halifax Harbour (Bin 1) and the Deep Panuke gas platform off Sable Island (Bin 2) on the Scotian Shelf (Fig. 1). The Atlantic Condor pCO2 data underwent standard QA/QC procedures, which included pre- and post-deployment and regular zero calibration of the pCO2 sensor (Pro-Oceanus Systems Inc, Canada) and associated data corrections. The QC'd data have been deposited into the Surface Ocean CO2 Atlas (SOCAT v.2020), where they were attributed an accuracy of ±10 µatm. Performance of the novel Dal-SOOP system was assessed during a 2-month transatlantic cruise in comparison with a conventional pCO2 equilibrator and showed good agreement with the latter (i.e. −5.7 ± 4.0 µatm; Arruda et al., 2020).
During the QC/QA procedure, some data collected in close proximity to Halifax, and corresponding to the outbound transects, were removed. Some of these data were biased high and attributed to prolonged ship layover in port allowing for a build-up of high pCO2 within the Dal-SOOP system due to respiration. The active pumping that delivers fresh seawater to the measurement system is triggered by a GPS signal when the ship leaves the harbour; as a result, there can be a delayed response from the pCO2 sensor to the much lower pCO2 signals observed immediately outside the harbour. To account for the bias, values that were 2 standard deviations from the mean pCO2 value for the latitudinal bin closest to the Halifax Harbour were removed for some transects. Only three transects were removed.
The CARIOCA and Atlantic Condor transect observations were mapped onto year 2006 for comparison directly with this year in the model using the linear trend in atmospheric pCO2 (+2 µatm yr−1). Where numbers are reported comparing the model mean to observations, the observations were mapped to year 2010 (the median year of our model simulation). For comparison of the modelled flux to the flux estimates from the CARIOCA buoy, years 2006–2014 in the model were used and no mapping of the observations was performed.
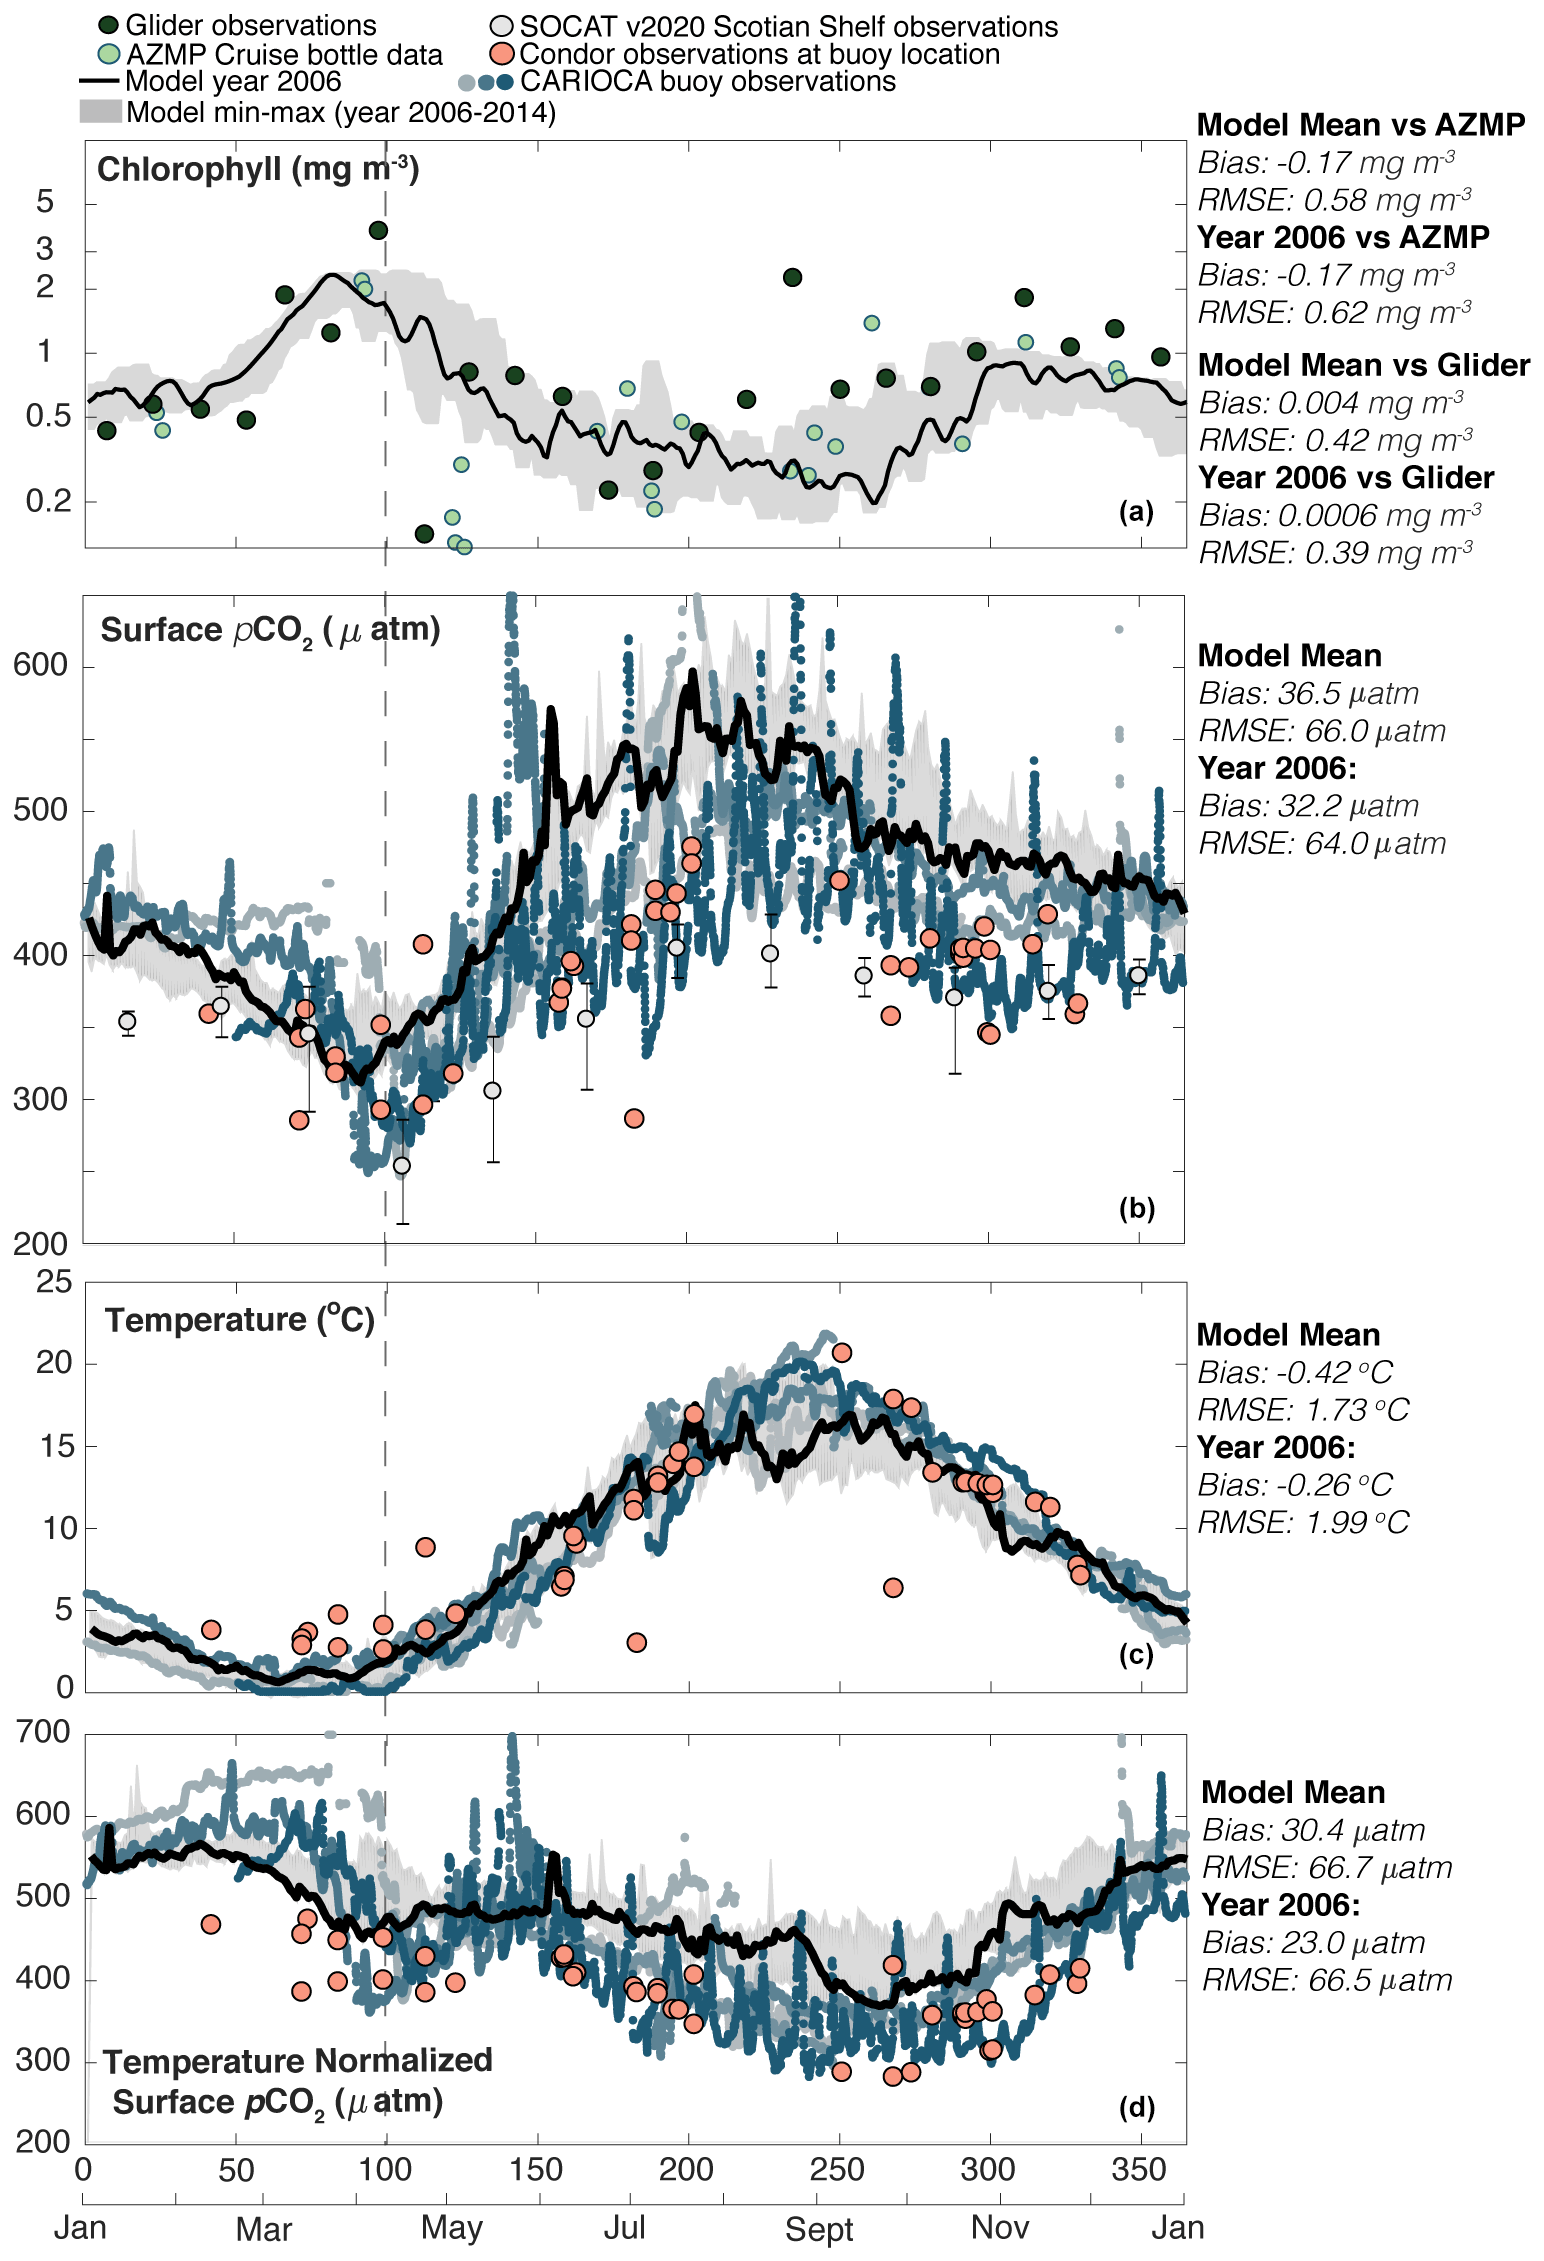
Figure 2Seasonal (from panel a to d, with RMSE and bias in reference to year 2006) (a) chlorophyll (glider RMSE: 0.39 mg m−3, glider bias: 0.0006 mg m−3; AZMP RMSE: 0.62 mg m−3, AZMP bias: −0.17 mg m−3); (b) pCO2 (RMSE: 64.0 µatm, bias: 32.2 µatm); (c) temperature (RMSE: 1.99 ∘C, bias: −0.26 ∘C); (d) temperature-normalized pCO2 following Takahashi et al. (2002) (RMSE: 66.5 µatm, bias: 23.0 µatm) at Station 2 on the Scotian Shelf. The model year 2006 is shown with the thick black line and min–max in the model from years 2006–2014 with the grey shaded area in all panels. In panel (a) the dark green points are AZMP bottle data and light green points are glider data. In panels (b)–(d) observations from the moored CARIOCA buoy are shown as small blue points, with lighter shades of blue indicating earlier observations and darker shades indicating more recent observations, and observations from the Atlantic Condor transects at approximately the same location as the buoy are shown in large pink points. Both the Atlantic Condor and CARIOCA buoy observations are mapped to year 2006 using the atmospheric trend in pCO2. Light grey points are monthly mean SOCAT observations for the entire Scotian Shelf, and the error bars are the 10th and 90th percentiles.
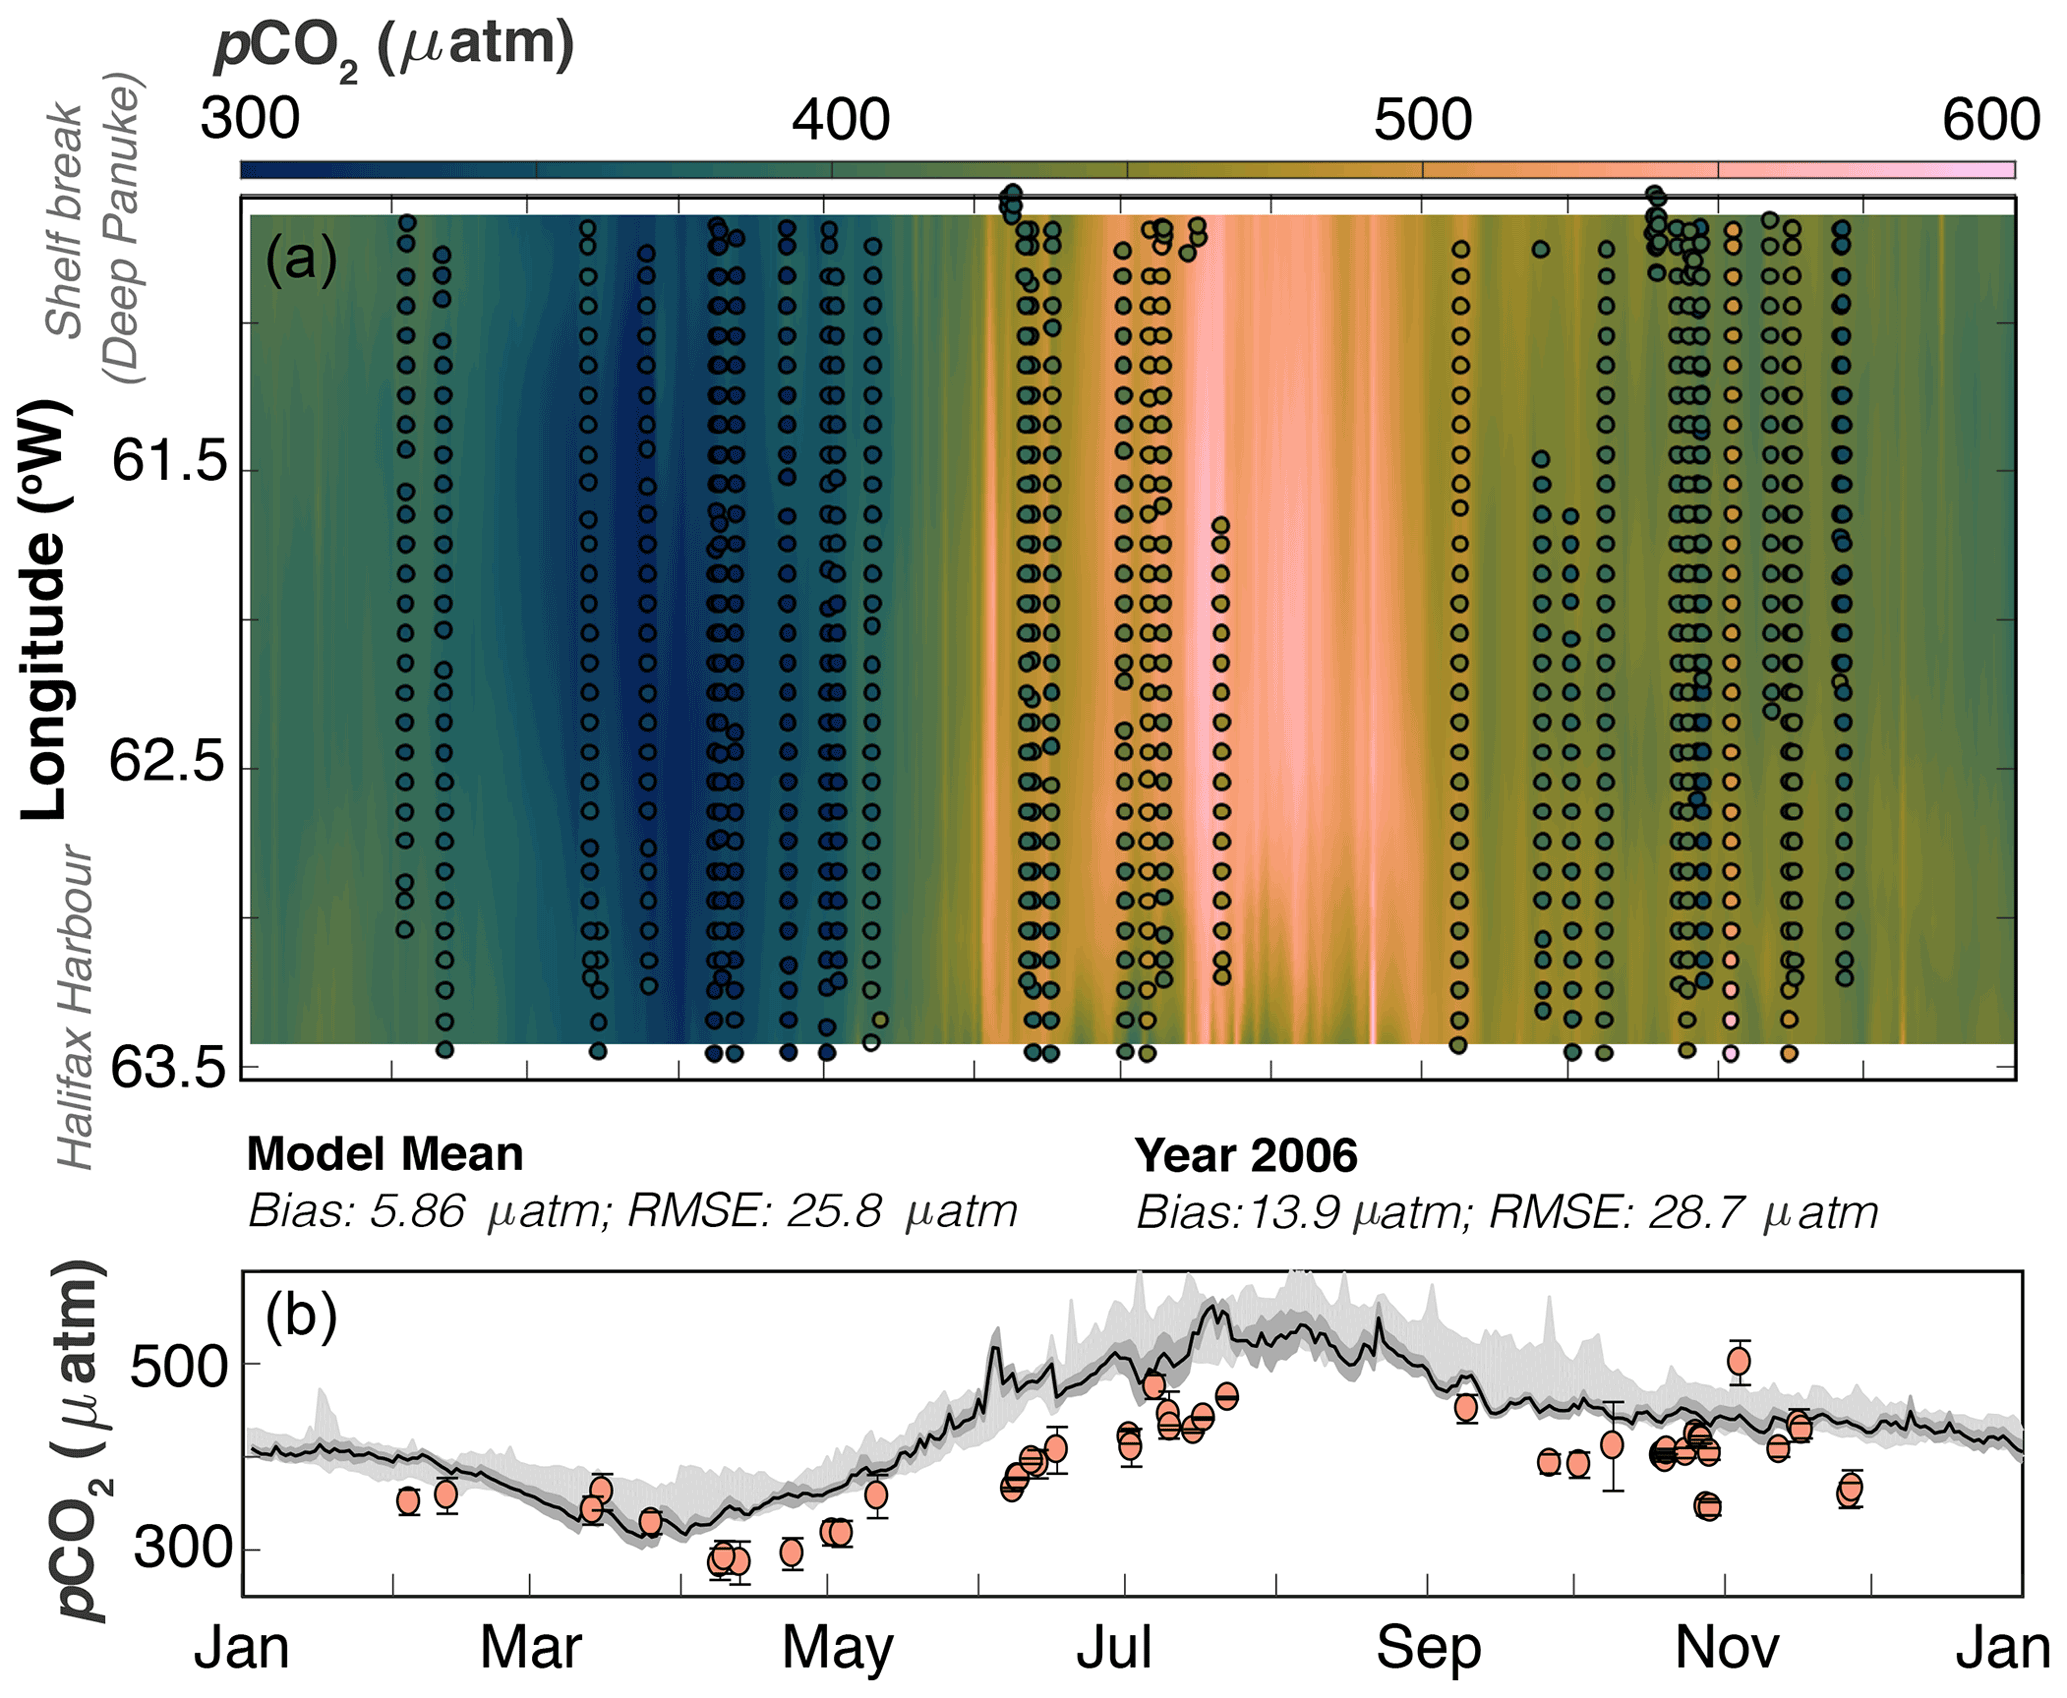
Figure 3Model–data comparison along the Atlantic Condor transect. Panel (a) shows pCO2 (in colour) evolving over time (x axis) along the transect (longitude on the y axis; Halifax Harbour to shelf break). The background is the model average pCO2 along the transect, and the points are the Atlantic Condor data binned into 0.1∘ longitudinal bins. Panel (b) shows the average pCO2 along the transect (y axis) as it evolves over the seasonal cycle (x axis). The line is year 2006 from the model averaged across the transect, the dark grey shaded area is the standard deviation, and the light grey shaded area is the min–max pCO2 along the transect from 2006–2014. The points are the average, and the error bars are standard deviation of observational pCO2 across each transect. The Atlantic Condor observations are mapped to year 2006 in both panels using the atmospheric trend in pCO2. RMSE: 28.7 µatm; bias: 13.9 µatm.
4.1 CO2 time series and transect
Both the model and observations at the CARIOCA buoy location (see Fig. 1) are shown as a seasonal cycle in Fig. 2 (chlorophyll, pCO2, temperature, and temperature-normalized pCO2). The buoy observations show a distinct and recurring seasonal cycle in pCO2. Specifically, pCO2 slightly decreases (from ∼ 450 to 425 µatm) from day 0 to 75. In late March, at approximately day 75, there is a large (100–200 µatm) and rapid (over ∼ 25 d) drop of pCO2 associated with DIC drawdown due to the spring bloom (the dashed line indicates the peak in chlorophyll and its alignment with the lowest pCO2 value). This drawdown of DIC occurs while the surface temperature is relatively constant and at its annual minimum.
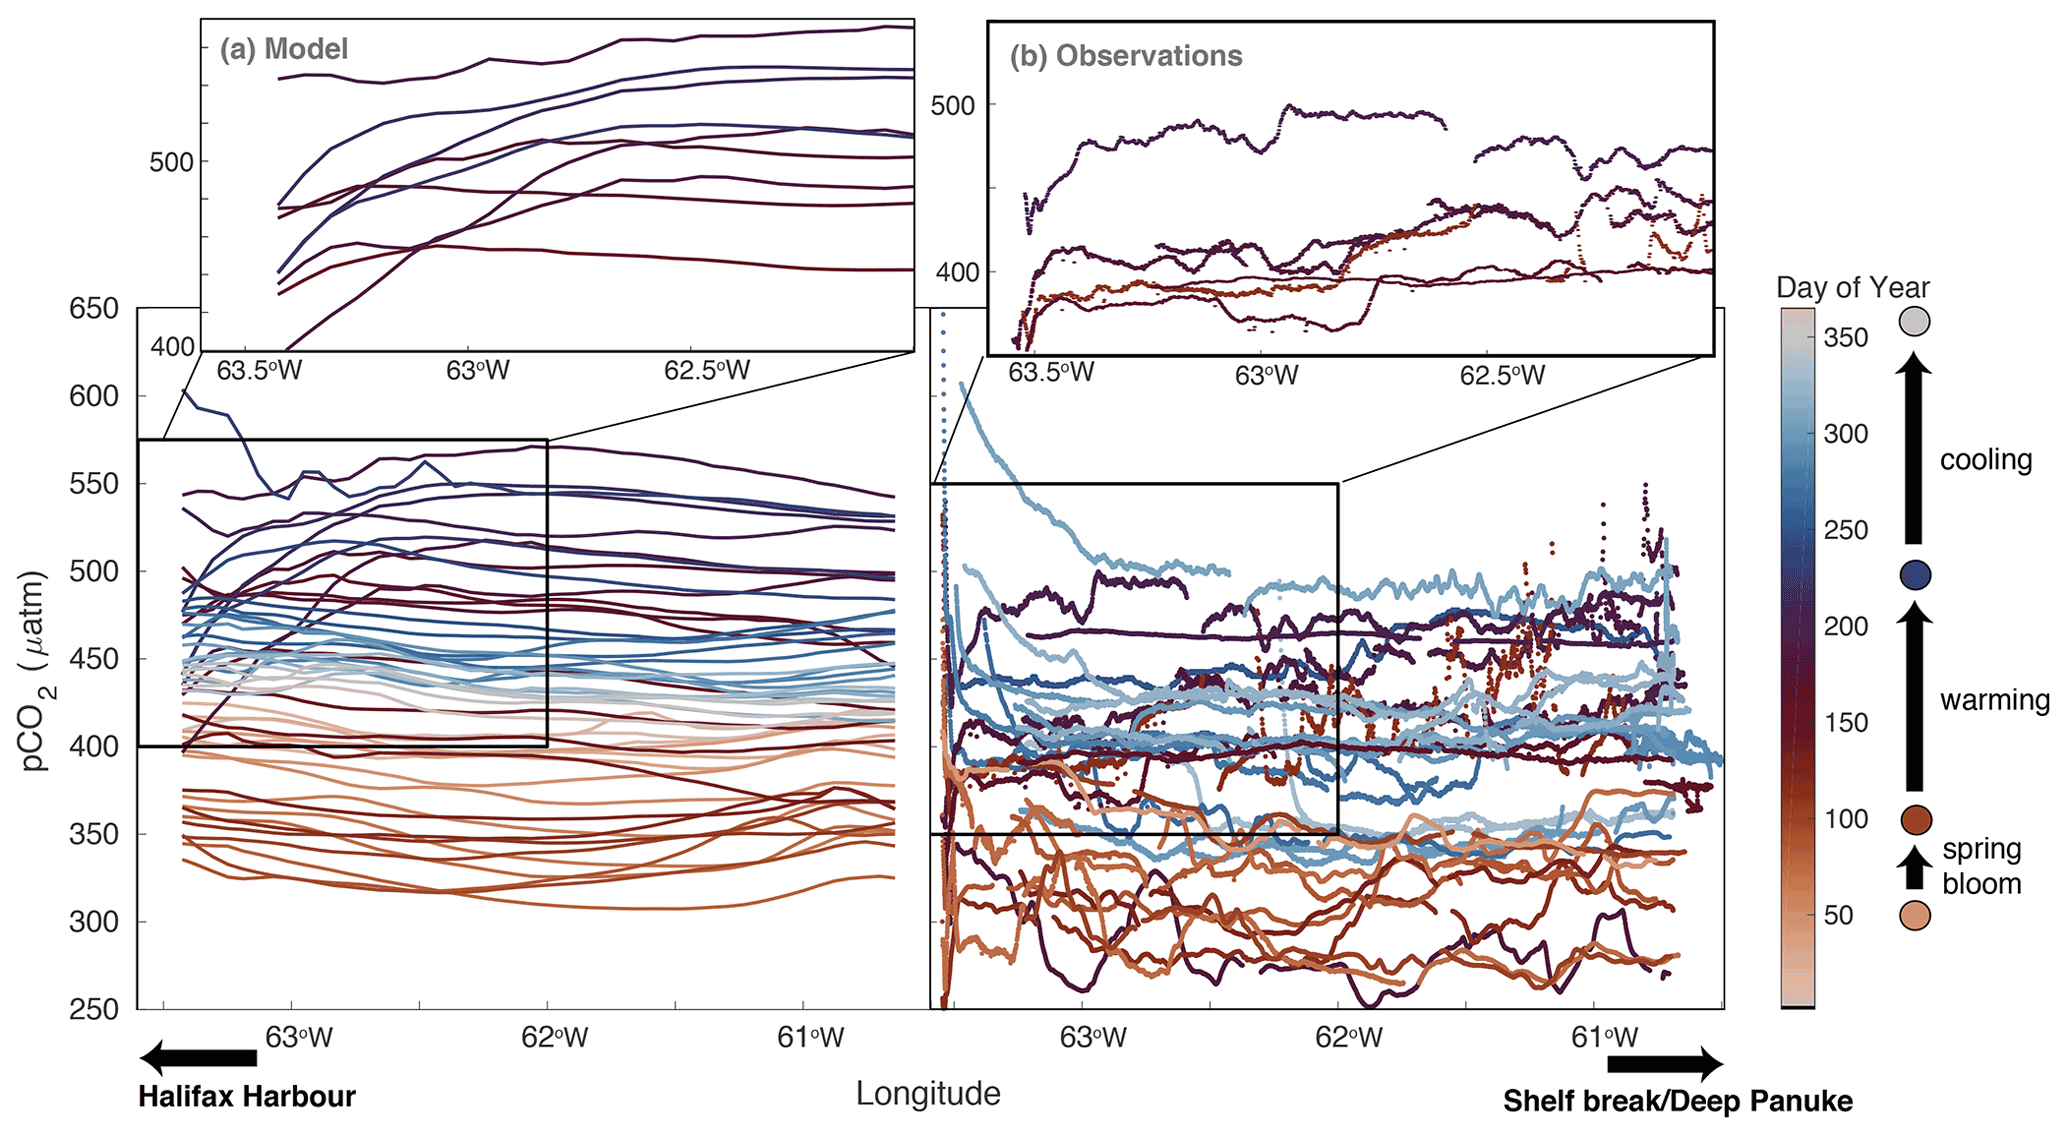
Figure 4Temporal evolution of pCO2 across the Atlantic Condor transect. The x axis is longitude, with the Halifax Harbour indicated on the left-hand side and the shelf break indicated on the right-hand side of each panel; the y axis is pCO2; and the colour indicates the day of the year. The left panel is year 2006 of the model along the transect every 7 d. The right panel shows all of the observations along the transect. The upper insets zoom in on the indicated boxes showing only the events with lower pCO2 near shore in the summer months (dark red/purple coloured lines).
Following the drop in pCO2 associated with the spring bloom, around day 100, surface water starts to warm, and this warming dominates the pCO2 seasonal cycle with a maximum value of approximately 450–500 µatm reached around day 200–250 (mid- to late summer). Around day 250, temperatures and pCO2 start to decrease. Also shown is the temperature-normalized pCO2 using the Takahashi et al. (2002) method for removing the thermal component of pCO2 variations. The biological drawdown of DIC is visible in the temperature-normalized pCO2 during the spring bloom starting around day 75 and a further decline throughout summer from day 150 to 250. This indicates that the overall increase in the non-normalized pCO2 in summer is driven by increasing temperatures and that biological processes tend to draw down DIC during this period.
Most of the Atlantic Condor observations at this location fall within the envelope of the buoy observations' pCO2 seasonal cycle. The monthly mean SOCAT v2020 pCO2 for the entire Scotian Shelf also falls within the spread of buoy observations for most months. Exceptions include February and August, when the SOCAT observations are lower than the buoy observations, and September and October, when the SOCAT observations are at the low end of the buoy observations.
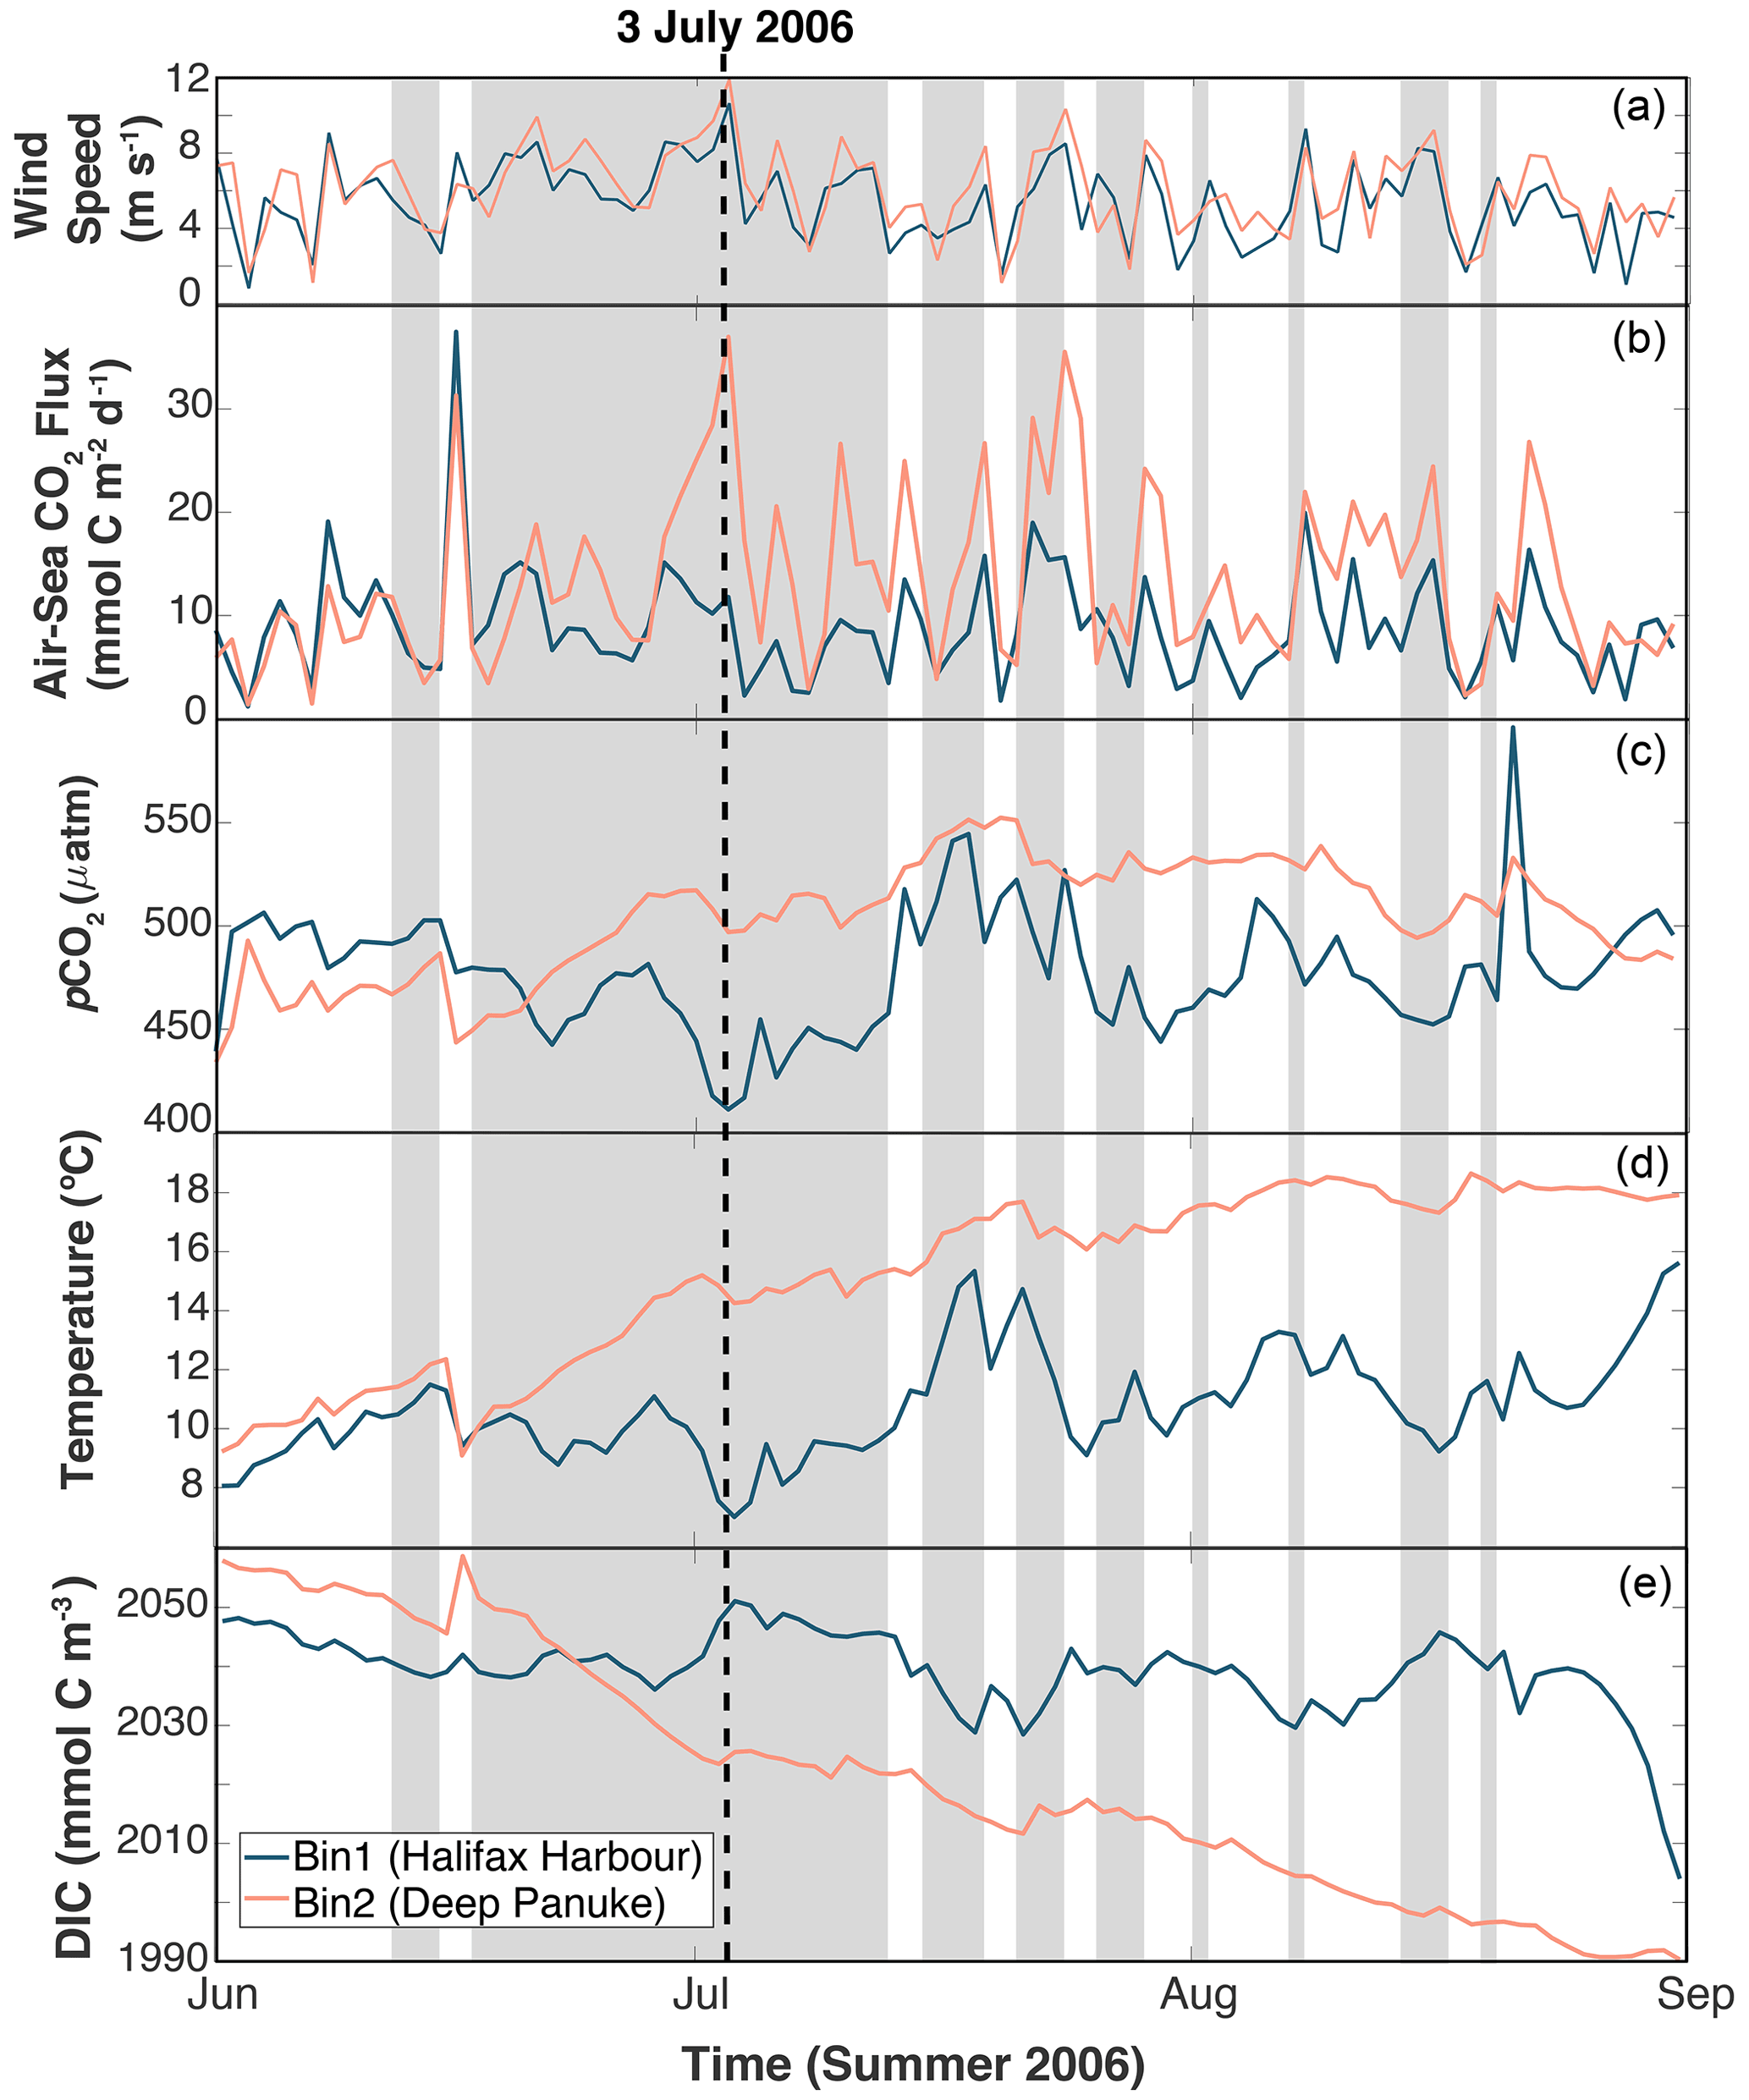
Figure 5Time series of variables in two bins along the Atlantic Condor transect (see Fig. 1) during summer 2006. From panel (a) to (d): (a) wind speed, (b) air–sea CO2 flux, (c) pCO2, (d) temperature, and (e) dissolved inorganic carbon (DIC). Shaded area indicates when there was upwelling-favourable winds near shore (Bin 1). The blue lines indicate the values from the nearshore bin closest to the Halifax Harbour, and the pink lines indicate values from the offshore bin near the Deep Panuke oil platform.
In terms of quantitative metrics, the model (year 2006) at the buoy location has an overall bias of 32.2 µatm and RMSE of 64.0 µatm compared to the buoy data. The model underestimates pCO2 throughout January and February (day 0–80) partly because its spring bloom starts earlier than in the observations. The bloom-related minimum in pCO2 in the model is approximately 50–75 µatm higher than the buoy observations and approximately 25–50 µatm higher than the Atlantic Condor observations. Temperature then dominates the pCO2 seasonality in the model over a similar period as in the observations. During the summer (day 150–300), the model overestimates pCO2 but follows a similar cycle as the observations throughout the remainder of the year. The temperature-normalized pCO2 has similar biases (underestimation from day 0–80; overestimation from day 150–300), an RMSE of 66.5 µatm, and an overall bias of 23.0 µatm for year 2006.
A comparison of simulated pCO2 with the Atlantic Condor transect observations along the average ship track (Fig. 1) is shown in Fig. 3. Compared to the Atlantic Condor observations, the model (year 2006) has a bias of 13.9 µatm and an RMSE of 28.7 µatm. The model tends towards slightly higher pCO2 across the shelf compared to the ship data, but the bias along the ship track is about half the magnitude of that at the buoy. The seasonal cycle along the ship track (Fig. 3) is similar to that at the buoy (Fig. 2). The top panel of Fig. 3 shows qualitatively good agreement between the model and observations across the whole transect, which is reflected in the averaged pCO2 in the bottom panel. The model does a very good job at representing pCO2 throughout the winter (November through March) but does not reproduce the full spring bloom drop in pCO2 across the whole shelf throughout April as observed. The model also overestimates pCO2 throughout most of June and July. The seasonal cycle across the transect is relatively uniform throughout most of the year, but there are some exceptions; for example, throughout July pCO2 is relatively low near the shelf break in both the model and observations.

Figure 6Surface map of pCO2 (a), and transects along the average Atlantic Condor ship track of (b–d) pCO2, temperature, and dissolved inorganic carbon (DIC) from the model taken during an upwelling event (3 July 2006; see Fig. 5). Contours in the transects are density. Panel (a) indicates the Atlantic Condor transect with the black line and the location of the CARIOCA buoy with the red diamond.
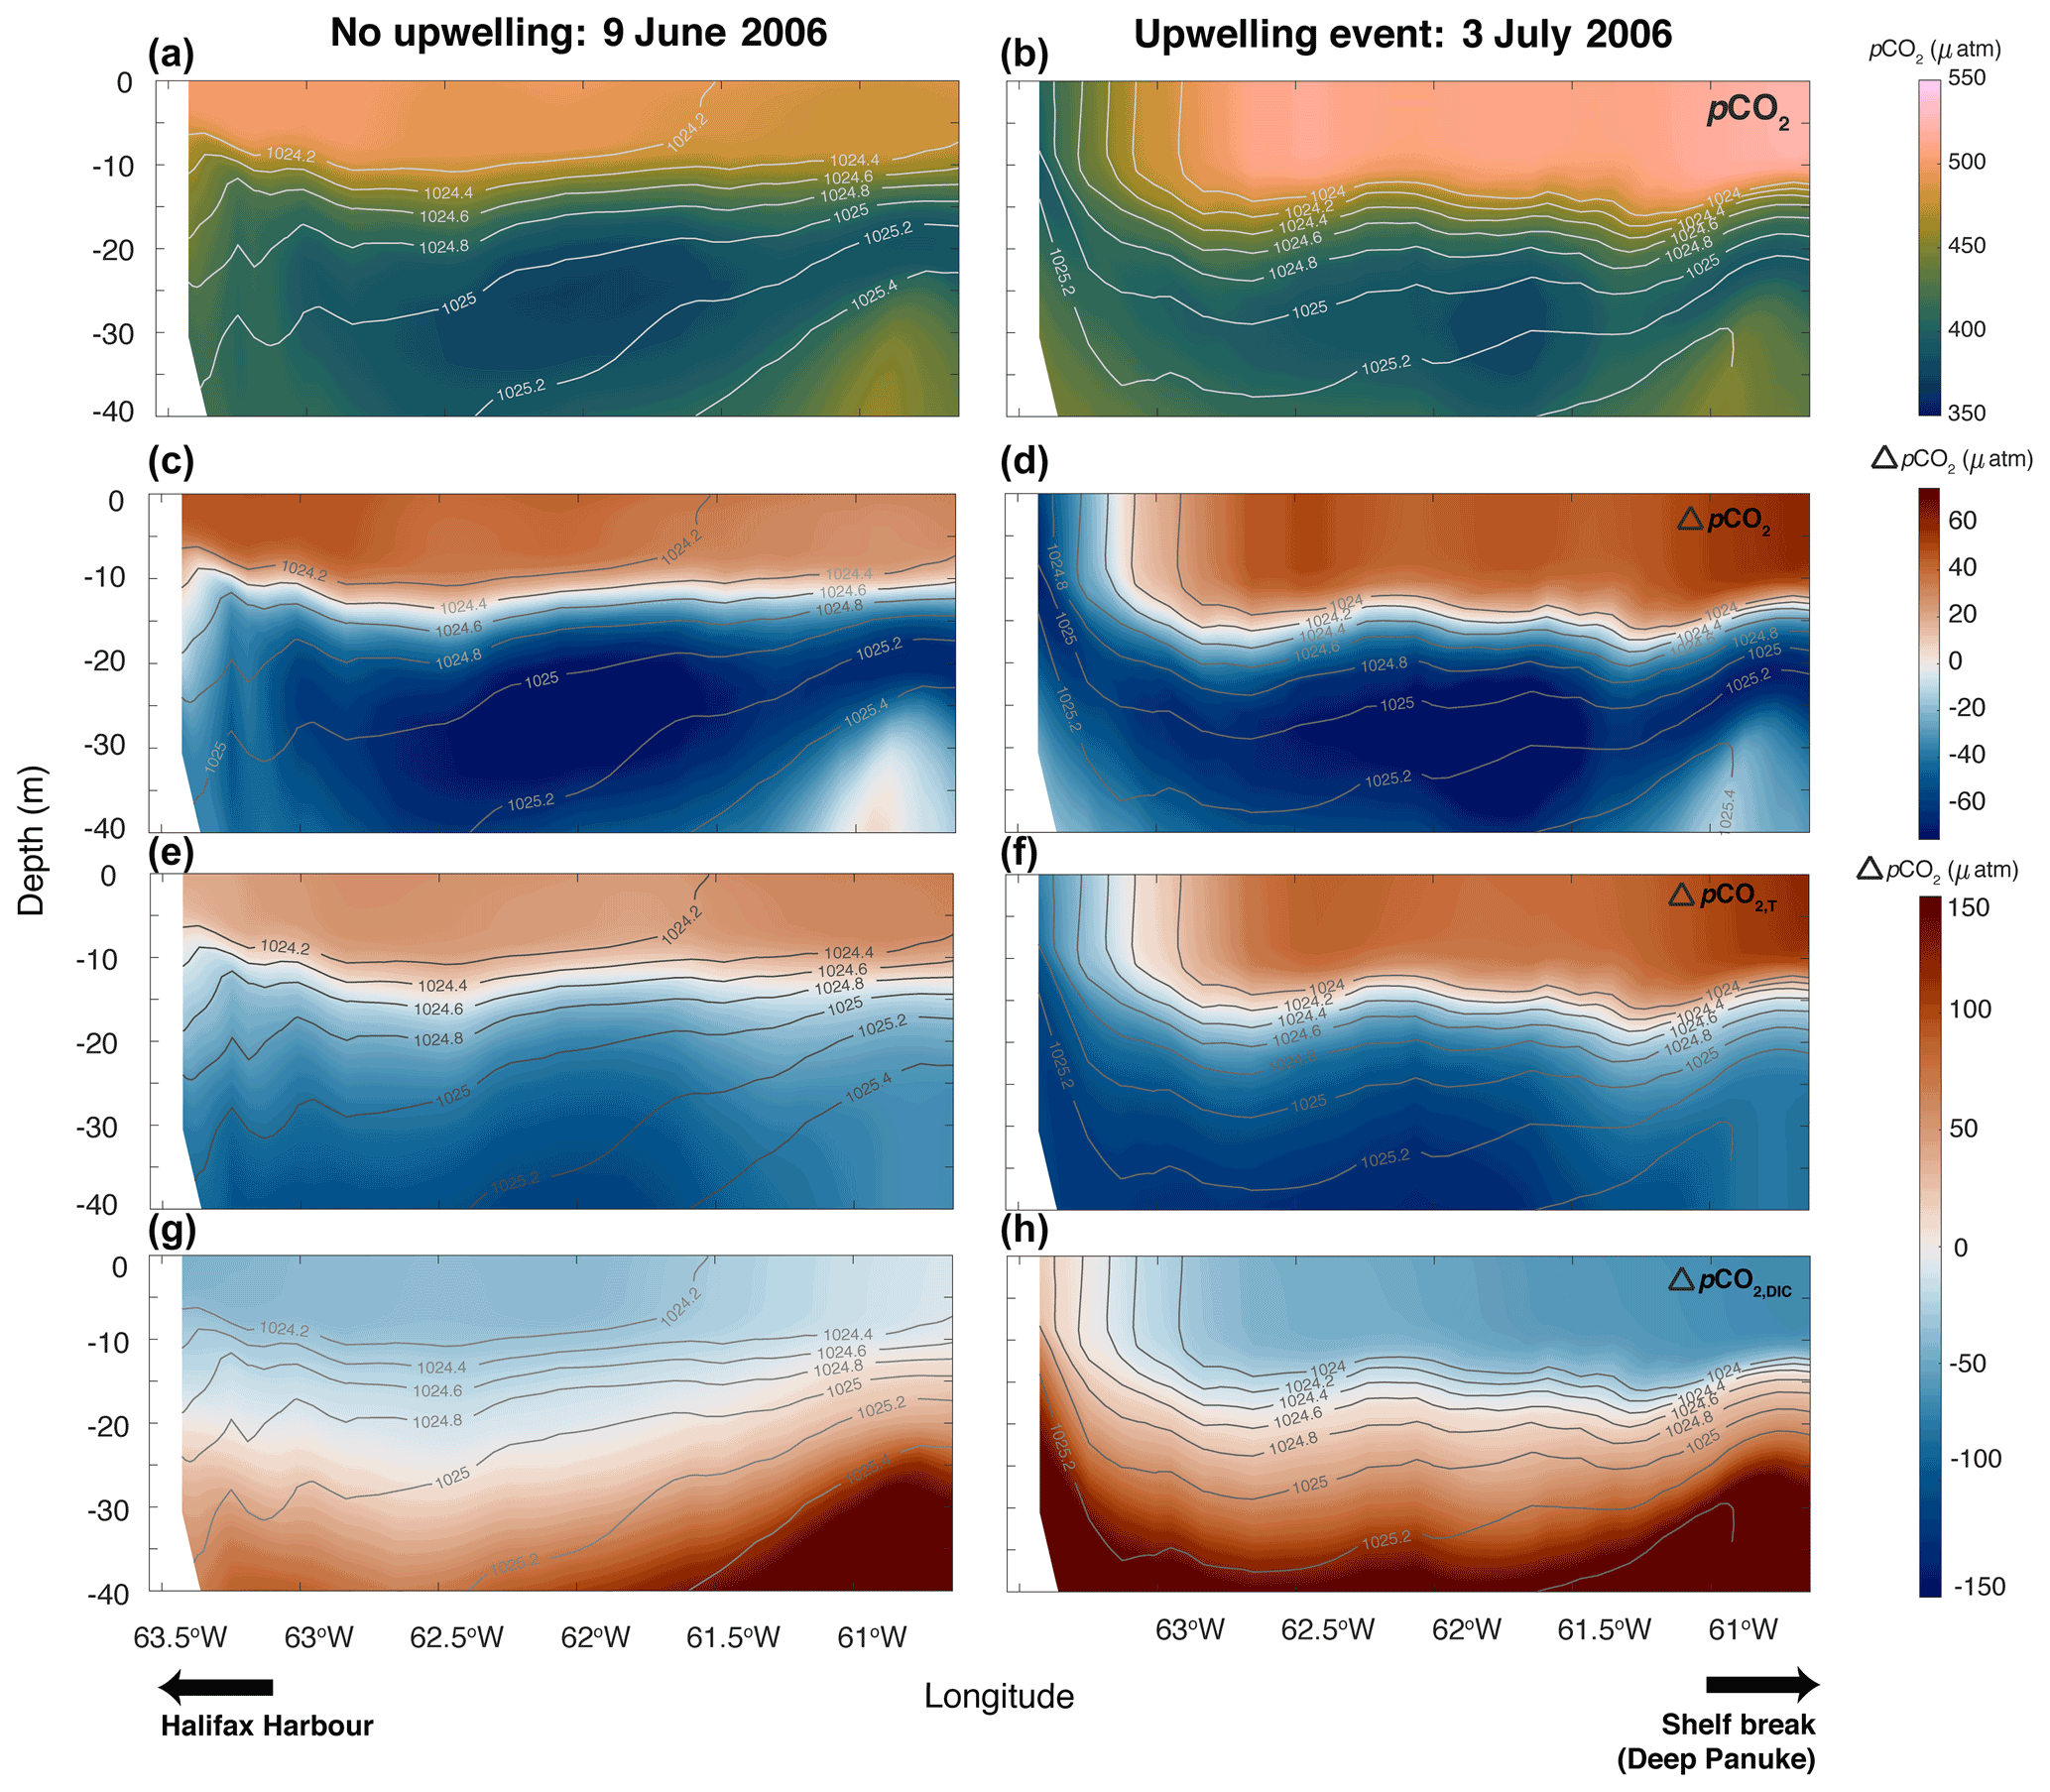
Figure 7Taylor decomposition of the upwelling event (right side; 3 July 2006) in Fig. 6 compared to a non-upwelling event (left side; 9 June 2006). From top to bottom: (a, b) pCO2, (c, d) overall anomaly in pCO2 (ΔpCO2) from the mean pCO2 in the upper 40 m, (e, f) anomaly in pCO2 due to temperature changes (ΔpCO2,T), and (g, h) anomaly in pCO2 due to DIC changes (ΔpCO2,DIC).
4.2 Effects of upwelling events
To better understand the effect of physical events on shelf-wide pCO2, this section focuses on the cross-shelf variations in year 2006. Figure 4 shows the evolution of pCO2 along the Atlantic Condor transect throughout the year in both model (Fig. 4a) and observations (Fig. 4b). As in Figs. 2 and 3, the seasonal cycle of pCO2 extends across the entire shelf. Starting in January (light beige), pCO2 is around 400 µatm. In March (∼ day 50; golden orange colour), pCO2 starts to decrease, reaching a minimum of approximately 325 µatm in the model and around 275–300 µatm in the observations (day 100; dark brown colour). pCO2 subsequently increases again due to warming in the late spring/early summer and reaches a maximum of about 550 µatm in the model and 525 µatm in the observations (day 200; purple values). Following this peak in pCO2, both the model and observations start to decline, associated with cooling (days 225 to 325; purple to light blue). Small-scale spatial variability in the observations is not captured by the model but may, at least in part, be due to measurement artifacts of the underway system.
The insets in Fig. 4 highlight events in summer (purple) in the northwestern half of the transect closest to Halifax, when pCO2 decreases by 50–100 µatm within ∼ 40 km off the coast in the model and approximately 25 km off the coast in the observations. With more obvious examples in the model than in the observations, we use the model to investigate into a possible explanation for this decreased pCO2. Figure 5 highlights the differences in pCO2, air–sea CO2 flux, temperature, and DIC between two longitudinal bins along the Atlantic Condor transect throughout summer 2006 in the model. The bin locations are shown in Fig. 1 and contrast data closest to the coastline (Halifax Harbour bin, 63.5 to 63∘ W; blue) with data closest to the shelf break (Deep Panuke bin, 61 to 60.5∘ W; pink). In the model throughout June to August 2006, there are low-pCO2 events near shore corresponding to low temperature which occurs during upwelling-favourable winds. During some of these events, temperature near shore is about 7 ∘C lower than near the shelf break. These upwelling events and the subsequent low-pCO2 signal result in a short-term lowering of air–sea CO2 fluxes near shore (blue) compared to farther offshore (pink) throughout the summer (at approximately half the flux value near shore versus offshore throughout July).
The top panel in Fig. 6 shows a snapshot of surface pCO2 from the model during one of the upwelling events (3 July 2006; vertical dashed line in Fig. 5). pCO2 is relatively uniform across most of the shelf. However, in a narrow band along the coastline, pCO2 values are nearly 100 µatm lower than the rest of the shelf. The bottom panels in Fig. 6 show transects of pCO2, temperature and DIC with density contours along the Atlantic Condor transect for the same time slice (3 July 2006). In these panels, the density gradients move upwards towards the coastline, consistent with upwelling events. This upwelling brings cooler temperatures and higher DIC concentrations to the surface along the coastline of Nova Scotia. The low-pCO2 bin ranges from 63.5 to 63∘ W longitude in the model (approximately 63.5 to 63.3∘ W longitude in the observations; Fig. 4), and aligns with the surface area affected by the upwelling events (Fig. 6) in the model. See the Supplement for more variables along the Atlantic Condor transect during the 3 July 2006, upwelling event.
Figure 7 illustrates the results of the Taylor decomposition during the 3 July 2006, upwelling event with lower pCO2 near shore compared to a snapshot without upwelling (9 June 2006) where surface pCO2 is relatively uniform. The pCO2 anomalies (ΔpCO2) show the deviations in each time slice from the mean pCO2 in the upper 40 m. In both time slices, the surface pCO2 is ∼ 50 µatm higher than the mean pCO2 value in the upper 40 m. However, in the upwelling case, the upwelled water is 40–50 µatm lower than the mean pCO2. In both time slices, across most of the transect, temperature is acting to increase pCO2 (ΔpCO2,T; by ∼ 50–60 µatm on 9 June 2006 and by ∼ 75–100 µatm on 3 July 2006) in the top 10–15 m from the mean value, whereas DIC is acting to decrease pCO2 (ΔpCO2,DIC; by ∼ 10–20 µatm on 9 June 2006 and by ∼ 40–50 on 3 July 2006). However, in the upwelling region on 3 July, temperature has the opposite effect and is acting to decrease pCO2 by ∼ 50–60 µatm and DIC is acting to increase pCO2 by only ∼ 5–10 µatm from the mean pCO2 in the top 40 m. The effects of alkalinity (ΔpCO2,TA) and salinity (ΔpCO2,S) are much smaller across the shelf and in both time slices (see Fig. S11). Comparisons of ΔpCO2,T and ΔpCO2,DIC illustrate that, in the upwelled region, anomalies in pCO2 from temperature are larger than those from DIC. However, if water from below 30 m was upwelled, DIC would likely start to outweigh the effect of temperature on pCO2.
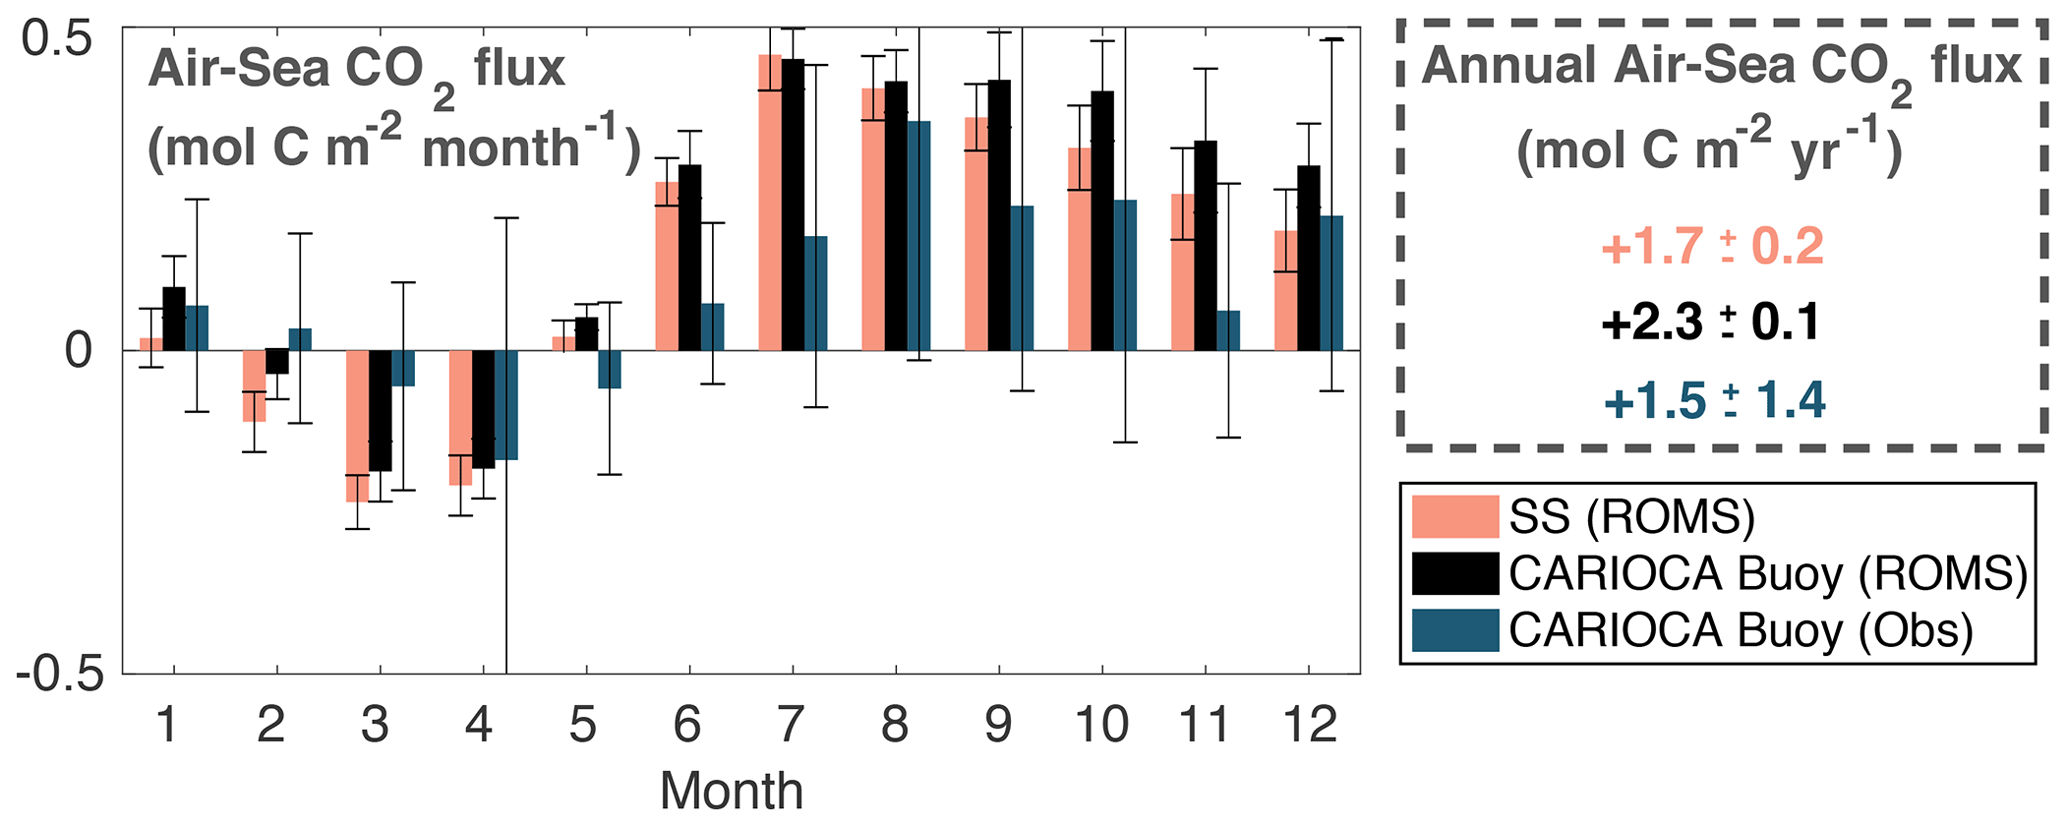
Figure 8Monthly and annual air–sea CO2 flux calculated from the model on the entire Scotian Shelf (pink), extracted at the CARIOCA buoy location (black), and from the buoy observations (blue). Flux is averaged over simulation years 2006–2014 for the model and years 2007–2014 for the CARIOCA observations. Error bars are ±1 standard deviations between years.
4.3 Regional flux estimates
The model-simulated air–sea CO2 fluxes, integrated by month and year, and averaged over the simulation from 2006–2014, for the Scotian Shelf and at the buoy location are shown in Fig. 8 in comparison to the flux calculated from the CARIOCA buoy observations. The uncertainty in the model estimates is calculated as the standard deviation between years. Annually, the averaged flux between the model and observations is comparable, and the flux estimates at the buoy location are significantly larger than the shelf-wide flux estimates. The model-estimated, annually integrated flux for the Scotian Shelf shows outgassing of CO2 at mol C m−2 yr−1. At the buoy location, just outside the upwelling region, the model estimates net outgassing of mol C m−2 yr−1. From the buoy observations, the annually integrated CO2 flux is estimated as net outgassing at mol C m−2 yr−1. Although our model-derived estimate is within the upper error bound of the observation-based estimate, it is higher, which may be due to the model's overestimation of pCO2, particularly throughout the summer months. There are also some differences in the seasonal cycle. In the model, the Scotian Shelf flux is lower in magnitude than the flux at the buoy location during most of the year, and particularly from June to January. Bin 1 along the Atlantic Condor transect (Halifax Harbour/upwelling bin, Fig. 1) has an annually integrated flux of mol C m−2 yr−1, which is comparable to the annual flux of bin 2 (Deep Panuke/shelf-break bin, Fig. 1) at mol C m−2 yr−1 and the simulated flux at the buoy location. These results indicate that cross-shelf variability in air–sea CO2 fluxes is small.
Figure 9 compares the model-derived, annual flux estimates from the present study for the Scotian Shelf ( mol C m−2 yr−1), Grand Banks ( mol C m−2 yr−1), and Gulf of Maine ( mol C m−2 yr−1) to previously reported estimates. The model estimate for the Scotian Shelf agrees well with the estimates from Shadwick et al. (2011) but disagrees with those from Signorini et al. (2013), Laruelle et al. (2014), and Laruelle et al. (2015). Laruelle et al. (2014) define the shelf region as a larger area that encompasses both the Scotian Shelf and Gulf of Maine. Laruelle et al. (2015) calculate one flux estimate for both the Scotian Shelf and Gulf of Maine. Signorini et al. (2013) calculate separate estimates for Gulf of Maine and Scotian Shelf. The model estimate for the Gulf of Maine agrees best with the estimates from Laruelle et al. (2014) and Laruelle et al. (2015) and disagrees with the estimates from Signorini et al. (2013) and Vandemark et al. (2011).
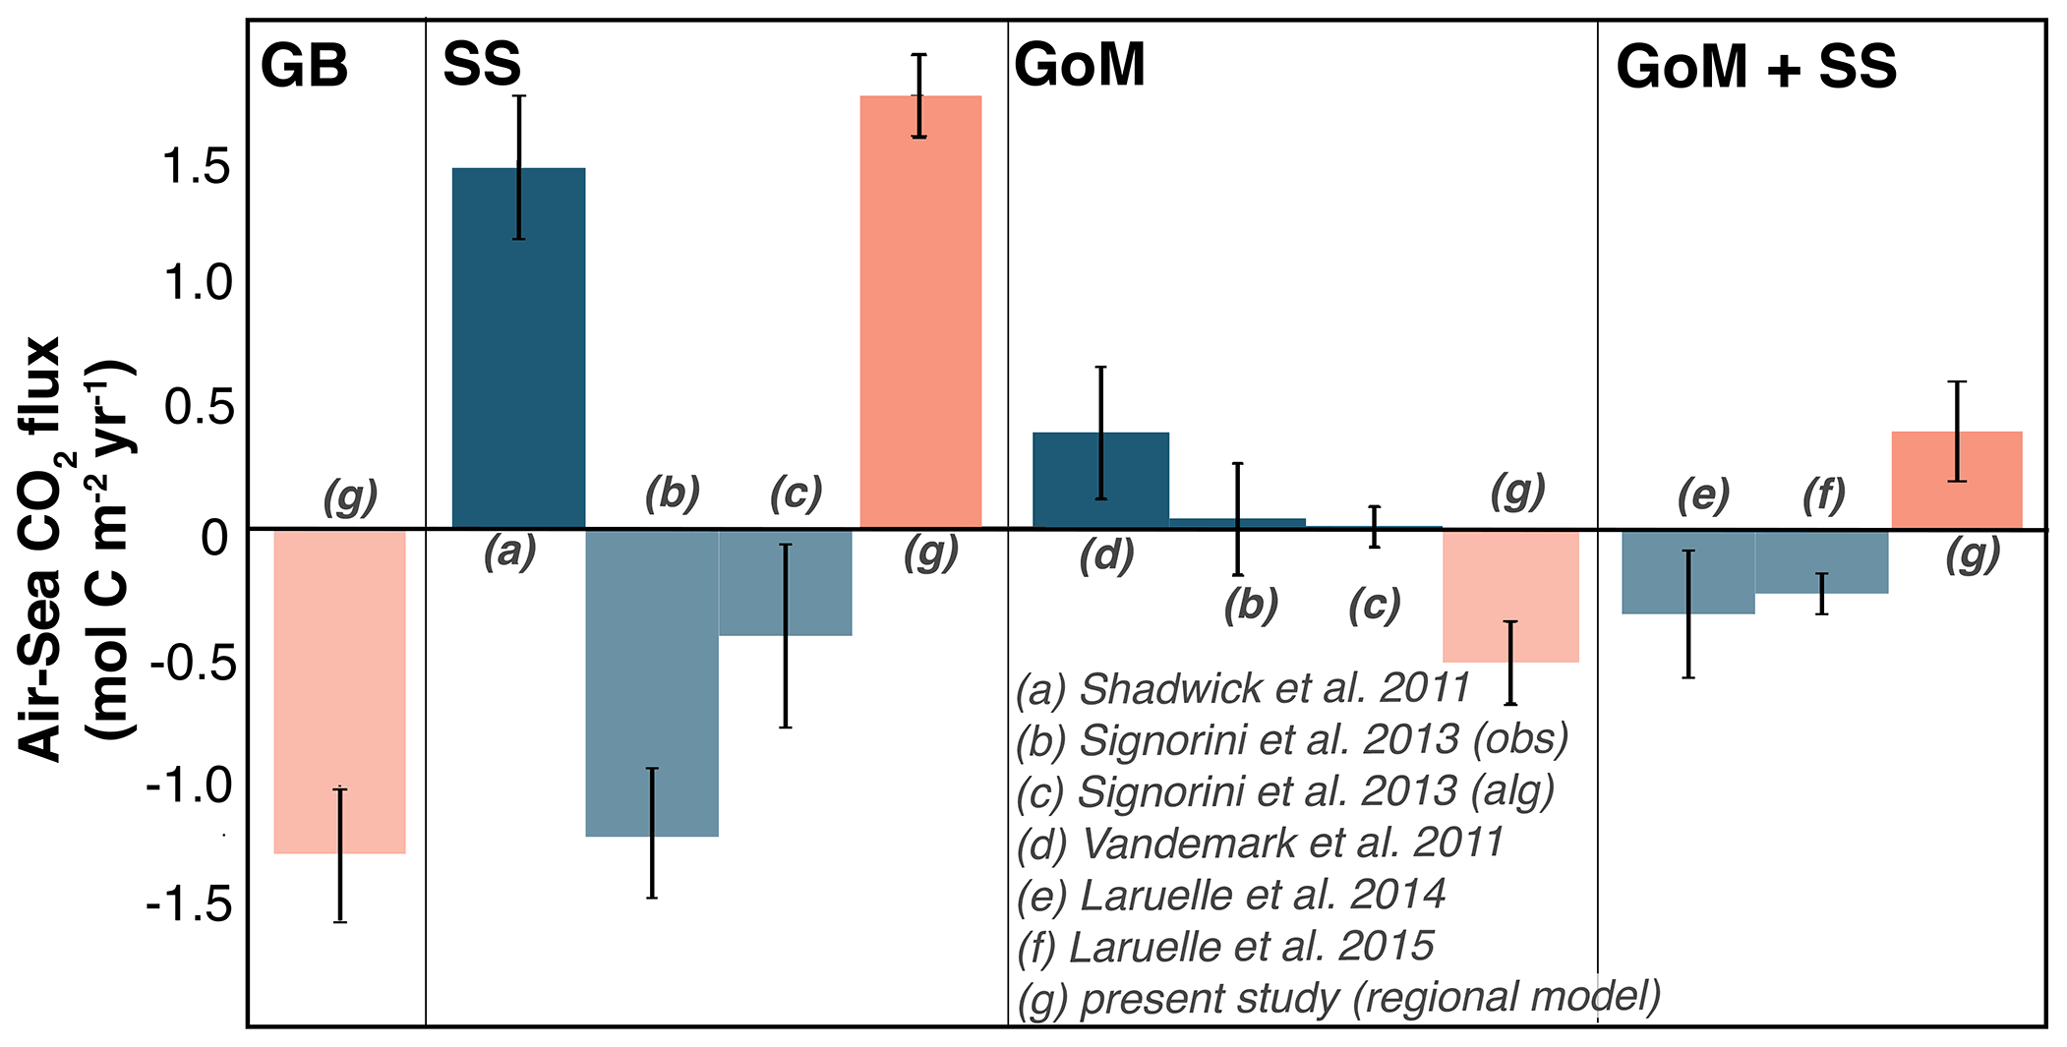
Figure 9Annually integrated air–sea CO2 flux for the Grand Banks (GB), Scotian Shelf (SS), and Gulf of Maine (GoM) in the model (pink) compared to literature values (blue). Positive values are net outgassing, indicated by solid bars, and negative values are net ingassing, indicated by faded bars.
We have compared the inorganic carbon dynamics in our medium-complexity biogeochemical model of the northwest North Atlantic against two different observational datasets of pCO2, one of them highly resolved in time from a CARIOCA buoy and the other with high spatial resolution along a cross-shelf transect that is occupied approximately biweekly. The largest limitation of the model is that it is unable to capture the speed and magnitude of the DIC drawdown associated with the spring bloom throughout March and April (Figs. 2 and 3). The simulated pCO2 starts to decline earlier and over a longer period than in both the buoy and transect observations, and the transect shows that this timing is consistent across the whole shelf. Additionally, the model does not reach the observed pCO2 minimum during the bloom across the whole shelf. This discrepancy appears to be a result of the bloom initiation occurring slightly too early and the bloom spanning a longer period of time in the model, as well as also chlorophyll levels in the model not reaching the peak values that are observed (Fig. 2a). This limitation aside, the overall seasonal cycle and switch between biological- and temperature-dominated signals in pCO2 are well captured, and the model simulates both the seasonal spatial and temporal variability of pCO2 across the Scotian Shelf reasonably well.
Notable occurrences of spatial variability of pCO2 on the Scotian Shelf occur throughout the summer months in both the model and observations. With only 1–2 clear examples of lower pCO2 within ∼ 25 km of shore in the observations, we used our model to hypothesize about a possible mechanism driving this variability. In the model, we found that coastal upwelling events are driving the summertime spatial variability of pCO2 on the Scotian Shelf and could explain the variability in the observations as well. The physical dynamics of coastal upwelling is well documented on the Scotian Shelf (Petrie et al., 1987; Shan et al., 2016). This upwelling only affects the nearshore region (within ∼ 20–40 km of shore in the model, depending on the event) where water from the cold intermediate layer is transported to the surface. In the model, this creates a coastal band of cold water at the surface that is high in DIC and low in pCO2 (Fig. 6). The difference between inshore and offshore temperatures (7 and 15 ∘C, respectively) during these events has a larger influence on the pCO2 spatial variability than the DIC variations (2050 mmol C m−3 inshore and 2020 mmol C m−3 offshore; Fig. 6) because the thermodynamic influence of temperature outweighs the effect of a slight increase in DIC, thus lowering pCO2 (see the Taylor decomposition in Fig. 7). In the example explored in the present study, the upwelled water comes from ∼ 20–25 m depth that has a pCO2 approximately 100 µatm lower than the rest of the shelf. Temperature in the upwelled water is acting to lower pCO2 by ∼ 150 µatm, whereas DIC is acting to increase pCO2 by ∼ 50 µatm compared to the rest of the shelf. If deeper water was being upwelled to the surface, DIC would likely start to be the dominant factor in setting pCO2 during these events (Fig. 7). For the given range of DIC values (2060 to 2020 mmol C m−3) and a mean temperature of 11 ∘C, the thermodynamic effect outweighs the effect of DIC differences for temperature changes larger than 4 ∘C. Typically, it is thought that upwelling of subsurface waters rich in DIC leads to increased surface pCO2 as is the case for the California Current System (CCS), encompassing the continental shelves off of Washington, Oregon, and California, where nearshore outgassing of CO2 during upwelling events is well documented (Fennel et al., 2019; Chavez et al., 2017; Evans et al., 2015; Fiechter et al., 2014; Turi et al., 2014). There are, however, large differences between the Scotian Shelf and the typical upwelling scenario of the CCS. For instance, the size and geometry of these shelves are quite different, which affects the type of water being upwelled to the surface. The California Shelf is an active margin approximately 10 km wide (Fennel et al., 2019) compared to the passive-margin Scotian Shelf with approximately 120–240 km width (Shadwick et al., 2010). As a result, the upwelling in the CCS brings DIC-rich water (∼ 2200–2250 µmol kg−1) from deep in the water column (below 150–200 m) of the open ocean across the shelf break to the surface of the shelf (Feely et al., 2008). On the Scotian Shelf, it is only subsurface shelf water from between ∼ 20–25 m depth that is being upwelled, which is at a similar temperature to the upwelled water in the CCS (7–8 ∘C) but at a much lower DIC concentration (2050 mmol C m−3).
Our regional model shows that upwelling events could be a large contributor to setting the CO2 signal in the summer on the inner portion of the Scotian Shelf, acting to lower pCO2 here and slightly reducing outgassing compared to the outer shelf. Throughout the remainder of the year, the pCO2 distribution across the Scotian Shelf is relatively uniform (Fig. 3). Comparison of the inner and outer shelf pCO2 (Fig. 4) shows the similar seasonality that is seen across the shelf, both in the model results and Atlantic Condor observations. Additionally, the simulated annual air–sea CO2 flux in bin 1 (upwelling bin, Fig. 1) is mol C m−2 yr−1 and is similar to bin 2 (shelf-break bin, Fig. 1), where the annual flux is mol C m−2 yr−1. For comparison, the annual flux for the entire shelf flux is mol C m−2 yr−1, and the flux at the CARIOCA buoy is mol C m−2 yr−1. Our results indicate that the short-term upwelling events in the summer do not significantly affect the shelf-wide fluxes on an annual scale. The location of the CARIOCA buoy slightly overestimates shelf-wide fluxes but is fairly representative of the shelf-wide pCO2 dynamics overall.
According to the model, the Scotian Shelf acts as a net source of CO2 to the atmosphere ( mol C m−2 yr−1), the Gulf of Maine is a net sink of CO2 ( mol C m−2 yr−1), and the Grand Banks act as a net sink of CO2 ( mol C m−2 yr−1). These results are in agreement with Shadwick et al. (2011) for the Scotian Shelf and Laruelle et al. (2014) and Laruelle et al. (2015) for the Gulf of Maine. Our results disagree, however, with results from other global (Laruelle et al., 2014) and regional studies (Laruelle et al., 2015; Signorini et al., 2013; Vandemark et al., 2011). The discrepancy in reported air–sea CO2 flux between these studies is partly a result of how each study defines the area of the Scotian Shelf and Gulf of Maine. For example, Laruelle et al. (2015) calculates one estimate for both the Scotian Shelf and Gulf of Maine. The shelves of eastern North America are diverse, particularly in width and circulation features, and defining them as a single region is not representative. Additionally, the Scotian Shelf waters are strongly influenced by cold, carbon-rich Labrador Sea water, which is not the dominant endmember south of the Gulf of Maine (Loder et al., 1998; Rutherford and Fennel, 2018; Fennel et al., 2019). Calculating a single flux estimate for the entirety of this dynamically diverse region is problematic and will yield a different estimate than when considering smaller and more specific regions. However, this only partially explains the difference in flux estimates.
Another reason is that the global SOCAT database was missing important regional data until recently. Signorini et al. (2013) used data from version 1.5 of the SOCAT database, and Laruelle et al. (2014) and Laruelle et al. (2015) used data from version 2.0 of the SOCAT database. Neither of the observational datasets used in the present study were included in SOCAT versions 1.5 and 2.0. Figure 10 illustrates the difference between different SOCAT versions for seasonal pCO2 on the Scotian Shelf. SOCAT v2020 has consistently higher average pCO2 values than v1.5 and v2, with at least double the number of years and a much larger number of observations going into each monthly average (on the order of 1000 to 10 000 measurements in v2020 versus 100 to 1000 in v1.5 and v2). We believe that flux estimates using the updated SOCAT v2020 will agree better with our estimates, and those of Shadwick et al. (2011) since SOCAT v2020 include more observations with higher spatial and temporal resolution to better capture the distinct seasonal cycle here. Our study, however, only focuses on the recent seasonality of pCO2, making it difficult to distinguish if earlier SOCAT versions miss the regional dynamics solely due to low resolution of observations or if the estimates from the different SOCAT versions are reflective of a shift in the behaviour of the shelf system. More work should therefore be done to better understand how variability on longer timescales could be affecting regional pCO2 and if that variability could also be a reason for the disagreement between the different SOCAT version.
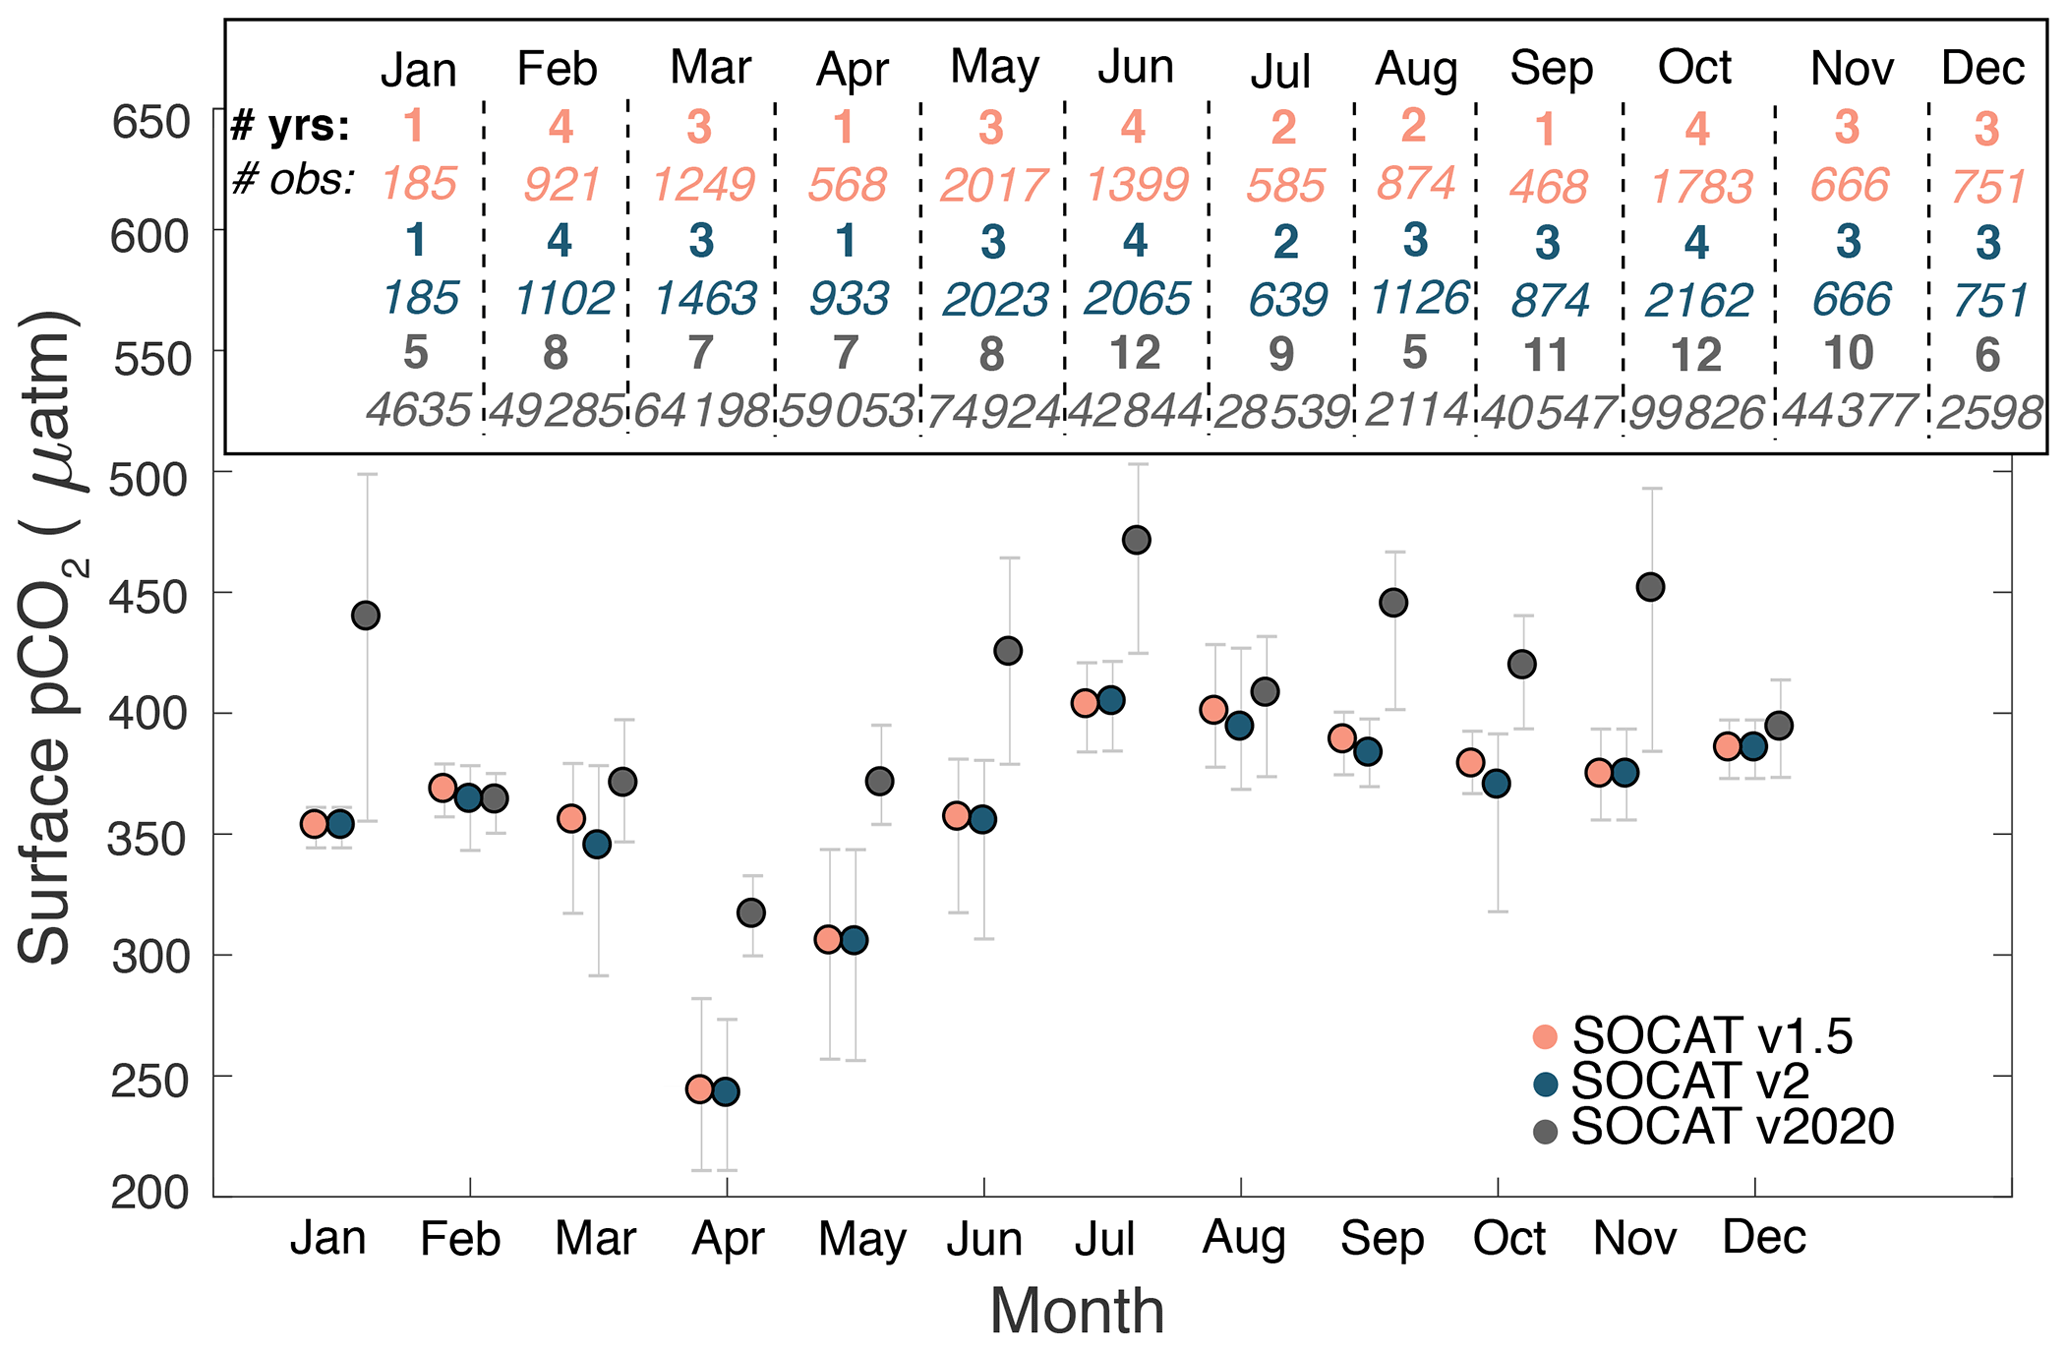
Figure 10Comparison of the seasonal cycle of pCO2 for the different versions of SOCAT for the Scotian Shelf, mapped to year 2006. The points indicate the mean for each month, and the bars indicate the 5th and 95th percentile. Inset shows the number of years and number of observations used in each month for each version.
In the present study, we have synthesized and compared our model simulations with high-resolution observations to highlight the dependence of Scotian Shelf pCO2 seasonality on (1) biological drawdown of DIC during the spring bloom, (2) temperature effects throughout the summer months, and (3) wind-driven coastal upwelling events. In Fig. 2d, the temperature-normalized pCO2 shows the non-thermal pCO2 signal, which distinguishes the influence of biological and transport processes on pCO2 (Takahashi et al., 2002). There is a clear decrease in pCO2 associated with the spring bloom. The simulated decrease in pCO2 is smaller than in the observations, likely due to the bloom occurring too early and over a more extended period in the model than the observations. In summer, temperature-normalized pCO2 continues to decrease rather than follow the increasing temperature signal of non-normalized pCO2. Previous studies have noted that, in summer, the thermodynamic signal in pCO2 outweighs the influence of biological activity (Shadwick et al., 2011; Shadwick and Thomas, 2014), which could explain the differences in seasonality between pCO2 and temperature-normalized pCO2 in the present study. We believe this thermodynamic influence is an important factor driving the net outgassing observed on the Scotian Shelf, particularly when combined with the delivery of DIC-rich water from the Labrador Sea.
Understanding what processes presently control CO2 dynamics is important for projecting how the region will be affected by changes in climate. Previous studies have suggested that the frequency and intensity of coastal upwelling could increase (e.g. Xiu et al., 2018). In the case of the Scotian Shelf, increased upwelling would lead to less outgassing or even net ingassing during summer along the coast of Nova Scotia. Climate change could therefore disproportionately affect the nearshore region here and lead to an intensification of spatial gradients. Such an upwelling signal would be in addition to the effect of increasing atmospheric CO2, which may be driving the entire Scotian Shelf towards a more neutral system with less outgassing. The effect of the thermal control on Scotian Shelf pCO2 is also an important aspect to consider. As temperatures continue to rise, summer pCO2 values will also likely increase, potentially offsetting some of the effect of increased atmospheric CO2 but also affecting production and respiration rates. Of course, none of these factors act independently and will instead combine to alter both the seasonal and spatial patterns of pCO2 in the region, making the overall outcome of climate-related perturbations on the Scotian Shelf difficult to predict. However, the implementation of a regional model that resolves current conditions well, as in the present study, is an important step towards projecting future climate-related changes in the region.
In this study, we have validated surface pCO2 fields on a seasonal scale from a medium-complexity regional biogeochemical model for the northwest North Atlantic shelf region against pCO2 observations from a CARIOCA buoy and repeated cross-shelf transects from a ship of opportunity that crosses the Scotian Shelf. Except for the strength and speed of the pCO2 drawdown associated with the spring bloom, the model simulations represent the observed spatial and temporal variability of pCO2 on the Scotian Shelf well. Contrary to most coastal upwelling systems, upwelling events in summer are acting to lower pCO2 within ∼ 25 km of the coastline, as cold, carbon-enriched intermediate-layer water is brought to the surface. The lowering of surface pCO2 during these events occurs because the temperature effect leading to a lowering of pCO2 overwhelms the increase in pCO2 associated with DIC enrichment. We found pCO2 to be relatively uniform across the shelf, with the exception of a narrow band impacted by summer upwelling events. Overall, the Scotian Shelf acts as a net source of CO2 ( mol C m−2 yr−1), the Gulf of Maine is a net sink of CO2 ( mol C m−2 yr−1), and the Grand Banks act as a net sink of CO2 ( mol C m−2 yr−1) in our simulation. Combination of the model simulation and the highly resolved observational datasets emphasizes that the seasonal cycle of pCO2 is driven by strong biological drawdown of DIC in early spring and a dominant thermal control throughout the summer months. Except for the short spring bloom period, surface pCO2 is oversaturated with respect to atmospheric values, which results in net outgassing. Ongoing changes in climate and carbon cycling will likely alter both the seasonal and spatial patterns of pCO2 on the Scotian Shelf.
The ROMS model code can be accessed at https://www.myroms.org (Haidvogel et al., 2008). Here version 3.5 was used. The Atlantic Condor observations can be found on the Surface Ocean CO2 Atlas (SOCAT) database (Bakker et al., 2016) at https://www.socat.info/.
The supplement related to this article is available online at: https://doi.org/10.5194/bg-18-6271-2021-supplement.
KR and KF conceived the research questions of this study. KR carried out the model simulations and analyses. DA, DW, and HT implemented observational platforms and contributed the subsequent datasets. KR and KF discussed the results and wrote the manuscript, with inputs from DA, DW, and HT.
The contact author has declared that neither they nor their co-author has any competing interests.
Publisher’s note: Copernicus Publications remains neutral with regard to jurisdictional claims in published maps and institutional affiliations.
We would like to thank the captain and crew of Atlantic Condor for their continuing support in operating the Dal-SOOP underway system. Mike Vining, Jeremy Lai, Dan Kehoe, Kitty Kam, and Jordan Sawler contributed to the design, installation, and maintenance of the underway system. We also are grateful for the use of observational datasets to initialize our model from Kumiko Azetsu-Scott (Department of Fisheries and Oceans Canada) and Alfonso Mucci (McGill University). We would also like to acknowledge the use of the scientific colour maps lapaz, vikO, and batlow (Crameri, 2018) used in this study. We are additionally grateful for the three reviewers of our paper and their constructive feedback.
This research has been supported by NSERC (Katja Fennel's NSERC Discovery Grant and the COD-REMAP grant); by the Marine Environmental Observation, Prediction and Response Network (MEOPAR); by the Canada Excellence Research Chair (CERC) in Ocean Science and Technology at Dalhousie University; and by the Canada Foundation for Innovation (CFI) project number 29011.
This paper was edited by Jack Middelburg and reviewed by Claudine Hauri, Wiley Evans, and one anonymous referee.
Arruda, R., Atamanchuk, D., Cronin, M., Steinhoff, T., and Wallace, D. W.: At-sea intercomparison of three underway pCO2 systems, Limnol. Oceanogr. Meth., 18, 63–76, https://doi.org/10.1002/lom3.10346, 2020. a, b
Bakker, D. C. E., Pfeil, B., Landa, C. S., Metzl, N., O'Brien, K. M., Olsen, A., Smith, K., Cosca, C., Harasawa, S., Jones, S. D., Nakaoka, S., Nojiri, Y., Schuster, U., Steinhoff, T., Sweeney, C., Takahashi, T., Tilbrook, B., Wada, C., Wanninkhof, R., Alin, S. R., Balestrini, C. F., Barbero, L., Bates, N. R., Bianchi, A. A., Bonou, F., Boutin, J., Bozec, Y., Burger, E. F., Cai, W.-J., Castle, R. D., Chen, L., Chierici, M., Currie, K., Evans, W., Featherstone, C., Feely, R. A., Fransson, A., Goyet, C., Greenwood, N., Gregor, L., Hankin, S., Hardman-Mountford, N. J., Harlay, J., Hauck, J., Hoppema, M., Humphreys, M. P., Hunt, C. W., Huss, B., Ibánhez, J. S. P., Johannessen, T., Keeling, R., Kitidis, V., Körtzinger, A., Kozyr, A., Krasakopoulou, E., Kuwata, A., Landschützer, P., Lauvset, S. K., Lefèvre, N., Lo Monaco, C., Manke, A., Mathis, J. T., Merlivat, L., Millero, F. J., Monteiro, P. M. S., Munro, D. R., Murata, A., Newberger, T., Omar, A. M., Ono, T., Paterson, K., Pearce, D., Pierrot, D., Robbins, L. L., Saito, S., Salisbury, J., Schlitzer, R., Schneider, B., Schweitzer, R., Sieger, R., Skjelvan, I., Sullivan, K. F., Sutherland, S. C., Sutton, A. J., Tadokoro, K., Telszewski, M., Tuma, M., van Heuven, S. M. A. C., Vandemark, D., Ward, B., Watson, A. J., and Xu, S.: A multi-decade record of high-quality fCO2 data in version 3 of the Surface Ocean CO2 Atlas (SOCAT), Earth Syst. Sci. Data, 8, 383–413, https://doi.org/10.5194/essd-8-383-2016, 2016 (data available at: https://www.socat.info/, last access: October 2020). a
Beardsley, R. C. and Boicourt, W. C.: On Estuarine and Continental-Shelf Circulation in the Middle Atlantic Bight, in: Evolution of Physical Oceanography, MIT Press, Cambridge, 198–233, 1981. a
Brennan, C. E., Bianucci, L., and Fennel, K.: Sensitivity of northwest North Atlantic shelf circulation to surface and boundary forcing: A regional model assessment, Atmosphere-Ocean, 54, 230–247, https://doi.org/10.1080/07055900.2016.1147416, 2016. a, b, c
Cai, W.-J.: Estuarine and Coastal Ocean Carbon Paradox: CO2 Sinks or Sites of Terrestrial Carbon Incineration?, Annu. Rev. Mar. Sci., 3, 123–145, https://doi.org/10.1146/annurev-marine-120709-142723, 2011. a
Cai, W.-J., Dai, M., and Wang, Y.: Air-sea exchange of carbon dioxide in ocean margins: A province-based synthesis, Geophys. Res. Lett., 33, L12603, https://doi.org/10.1029/2006GL026219, 2006. a
Cai, W.-J., Chen, L., Chen, B., Gao, Z., Lee, S. H., Chen, J., Pierrot, D., Sullivan, K., Wang, Y., Hu, X., Huang, W.-J., Zhang, Y., Xu, S., Murata, A., Grebmeier, J. M., Jones, E. P., and Zhang, H.: Decrease in the CO2 Uptake Capacity in an Ice-Free Arctic Ocean Basin, Science, 329, 556–559, https://doi.org/10.1126/science.1189338, 2010. a
Chavez, F. P., Pennington, J. T., Michisaki, R. P., Blum, M., Chavez, G. M., Friederich, J., Jones, B., Herlien, R., Kieft, B., Hobson, B., Ren, A. S., Ryan, J., Sevadjian, J. C., Wahl, C., Walz, K. R., Yamahara, K., Friederich, G. E., and Messié, M.: Climate variability and change: response of a coastal ocean ecosystem, Oceanography, 30, 128–145, 2017. a, b
Chen, C.-T. A. and Borges, A. V.: Reconciling opposing views on carbon cycling in the coastal ocean: Continental shelves as sinks and near-shore ecosystems as sources of atmospheric CO2, Deep-Sea Res. Pt. II, 56, 578–590, https://doi.org/10.1016/j.dsr2.2009.01.001, 2009. a, b
Chen, C.-T. A., Huang, T.-H., Chen, Y.-C., Bai, Y., He, X., and Kang, Y.: Air–sea exchanges of CO2 in the world's coastal seas, Biogeosciences, 10, 6509–6544, https://doi.org/10.5194/bg-10-6509-2013, 2013. a
Craig, S. E., Thomas, H., Jones, C. T., Li, W. K. W., Greenan, B. J. W., Shadwick, E. H., and Burt, W. J.: The effect of seasonality in phytoplankton community composition on CO2 uptake on the Scotian Shelf, J. Marine Syst., 147, 52–60, https://doi.org/10.1016/j.jmarsys.2014.07.006, 2015. a
Crameri, F.: Scientific Colour-maps, Zenodo [data set], https://doi.org/10.5281/zenodo.1243862, 2018. a
Dee, D. P., Uppala, S. M., Simmons, A. J., Berrisford, P., Poli, P., Kobayashi, S., Andrae, U., Balmaseda, M. A., Balsamo, G., Bauer, P., Bechtold, P., Beljaars, A. C. M., van de Berg, L., Bidlot, J., Bormann, N., Delsol, C., Dragani, R., Fuentes,M., Geer, A. J., Haimberger, L., Healy, S. B., Hersbach, H., Hólm, E. V., Isaksen, L., Kållberg, P., Köhler, M., Matricardi, M., McNally, A. P., Monge-Sanz, B. M., Morcrette, J.-J., Park, B.-K., Peubey, C., de Rosnay, P., Tavolato, C., Thépaut, J.-N., and Vitart, F.: The ERA-Interim reanalysis: Configuration and performance of the data assimilation system, Q. J. Roy. Meteor. Soc., 137, 553–597, 2011. a
Dever, M., Hebert, D., Greenan, B., Sheng, J., and Smith, P.: Hydrography and coastal circulation along the Halifax Line and the connections with the Gulf of St. Lawrence, Atmosphere-Ocean, 54, 199–217, https://doi.org/10.1080/07055900.2016.1189397, 2016. a
Doney, S. C.: The Growing Human Footprint on Coastal and Open Ocean Biogeochemistry, Science, 328, 1512–1516, https://doi.org/10.1126/science.1185198, 2010. a
Egbert, G. D. and Erofeeva, S. Y.: Efficient inverse modeling of barotropic ocean tides, J. Atmos. Ocean. Tech., 19, 183–204, https://doi.org/10.1175/1520-0426(2002)019<0183:EIMOBO>2.0.CO;2, 2002. a
Environment and Climate Change Canada: Canadian Greenhouse Gas Measurement Program, available at: https://www.canada.ca/en/environment-climate-change/services/climate-change/science-research-data/greenhouse-gases-aerosols-monitoring/canadian-greenhouse-gas-measurement-program.html, last access: March 2016. a
Evans, W., Hales, B., Strutton, P. G., Shearman, R. K., and Barth, J. A.: Failure to bloom: Intense upwelling results in negligible phytoplankton response and prolonged CO2 outgassing over the Oregon shelf, J. Geophys. Res.-Oceans, 120, 1446–1461, https://doi.org/10.1002/2014JC010580, 2015. a
Feely, R. A., Sabine, C. L., Hernandez-Ayon, J. M., Ianson, D., and Hales, B.: Evidence for upwelling of corrosive “acidified” water onto the continental shelf, Science, 320, 1490–1492, https://doi.org/10.1126/science.1155676, 2008. a, b
Fennel, K. and Wilkin, J.: Quantifying biological carbon export for the northwest North Atlantic continental shelves, Geophys. Res. Lett., 36, L18605, https://doi.org/10.1029/2009GL039818, 2009. a, b
Fennel, K., Wilkin, J., Levin, J., Moisan, J., O'Reilly, J., and Haidvogel, D.: Nitrogen cycling in the Middle Atlantic Bight: Results from a three-dimensional model and implications for the North Atlantic nitrogen budget, Global Biogeochem. Cy., 20, GB3007, https://doi.org/10.1029/2005GB002456, 2006. a, b
Fennel, K., Alin, S., Barbero, L., Evans, W., Bourgeois, T., Cooley, S., Dunne, J., Feely, R. A., Hernandez-Ayon, J. M., Hu, X., Lohrenz, S., Muller-Karger, F., Najjar, R., Robbins, L., Shadwick, E., Siedlecki, S., Steiner, N., Sutton, A., Turk, D., Vlahos, P., and Wang, Z. A.: Carbon cycling in the North American coastal ocean: a synthesis, Biogeosciences, 16, 1281–1304, https://doi.org/10.5194/bg-16-1281-2019, 2019. a, b, c, d, e
Fiechter, J., Curchitser, E. N., Edwards, C. A., Chai, F., Goebel, N. L., and Chavez, F. P.: Air-sea CO2 fluxes in the California Current: Impacts of model resolution and coastal topography, Global Biogeochem. Cy., 28, 371–385, https://doi.org/10.1002/2013GB004683, 2014. a
Fournier, R. O., Marra, J., Bohrer, R., and Det, M. V.: Plankton Dynamics and Nutrient Enrichment of the Scotian Shelf, Journal of the Fisheries Board of Canada, 34, 1004–1018, https://doi.org/10.1139/f77-153, 1977. a
Fratantoni, P. S. and Pickart, R. S.: The western North Atlantic shelfbreak current system in summer, J. Phys. Oceanogr., 37, 2509–2533, https://doi.org/10.1175/JPO3123.1, 2007. a, b
Geshelin, Y., Sheng, J., and Greatbatch, R. J.: Monthly mean climatologies of temperature and salinity in the western North Atlantic, Tech. rep., Canadian Data Report of Hydrography and Ocean Sciences, Fisheries and Oceans Canada, 1999. a
Gruber, N.: Carbon at the coastal interface, Nature, 517, 148–149, https://doi.org/10.1038/nature14082, 2015. a
Gruber, N., Clement, D., Carter, B. R., Feely, R. A., Van Heuven, S., Hoppema, M., Ishii, M., Key, R. M., Kozyr, A., Lauvset, S. K., Monaco, C. L., Mathis, J. T., Murata, A., Olsen, A., Perez, F. F., Sabine, C. L., Tanhua, T., and Wanninkhof, R.: The oceanic sink for anthropogenic CO2 from 1994 to 2007, Science, 363, 1193–1199, https://doi.org/10.1126/science.aau5153, 2019. a
Haidvogel, D., Arango, H., Budgell, W., Cornuelle, B., Curchitser, E., Di Lorenzo, E., Fennel, K., Geyer, W., Hermann, A., Lanerolle, L., Levin, J., McWilliams, J., Miller, A., Moore, A., Powell, T., Shchepetkin, A., Sherwood, C., Signell, R., Warner, J., and Wilkin, J.: Ocean forecasting in terrain-following coordinates: Formulation and skill assessment of the Regional Ocean Modeling System, J. Comput. Phys., 227, 3595–3624, https://doi.org/10.1016/j.jcp.2007.06.016, 2008 (code available at: https://www.myroms.org, last access: 1 May 2011). a, b
Hannah, C. G., Shore, J. A., Loder, J. W., and Naimie, C. E.: Seasonal circulation on the western and central Scotian Shelf, J. Phys. Oceanogr., 31, 591–615, https://doi.org/10.1175/1520-0485(2001)031<0591:SCOTWA>2.0.CO;2, 2001. a
Hauri, C., Schultz, C., Hedstrom, K., Danielson, S., Irving, B., Doney, S. C., Dussin, R., Curchitser, E. N., Hill, D. F., and Stock, C. A.: A regional hindcast model simulating ecosystem dynamics, inorganic carbon chemistry, and ocean acidification in the Gulf of Alaska, Biogeosciences, 17, 3837–3857, https://doi.org/10.5194/bg-17-3837-2020, 2020. a
Hickey, B. M.: Coastal oceanography of western North America from the tip of Baja California to Vancouver Island, in: The Global Coastal Ocean: Regional Studies and Syntheses, Vol. 11, 345–393, Wiley & Sons, New York, 1998. a
Ho, D. T., Law, C. S., Smith, M. J., Schlosser, P., Harvey, M., and Hill, P.: Measurements of air-sea gas exchange at high wind speeds in the Southern Ocean: Implications for global parameterizations, Geophys. Res. Lett., 33, L16611, https://doi.org/10.1029/2006GL026817, 2006. a
Landschützer, P., Gruber, N., Bakker, D. C., and Schuster, U.: Recent variability of the global ocean carbon sink, Global Biogeochem. Cy., 28, 927–949, https://doi.org/10.1002/2014GB004853, 2014. a
Laruelle, G. G., Dürr, H. H., Slomp, C. P., and Borges, A. V.: Evaluation of sinks and sources of CO2 in the global coastal ocean using a spatially-explicit typology of estuaries and continental shelves, Geophys. Res. Lett., 37, L15607, https://doi.org/10.1029/2010GL043691, 2010. a
Laruelle, G. G., Lauerwald, R., Pfeil, B., and Regnier, P.: Regionalized global budget of the CO2 exchange at the air-water interface in continental shelf seas, Global Biogeochem. Cy., 28, 1199–1214, https://doi.org/10.1002/2014GB004832, 2014. a, b, c, d, e, f, g, h, i, j
Laruelle, G. G., Lauerwald, R., Rotschi, J., Raymond, P. A., Hartmann, J., and Regnier, P.: Seasonal response of air–water CO2 exchange along the land–ocean aquatic continuum of the northeast North American coast., Biogeosciences, 12, 1447–1458, https://doi.org/10.5194/bg-12-1447-2015, 2015. a, b, c, d, e, f, g, h
Laruelle, G. G., Landschützer, P., Gruber, N., Tison, J.-L., Delille, B., and Regnier, P.: Global high-resolution monthly pCO2 climatology for the coastal ocean derived from neural network interpolation, Biogeosciences, 14, 4545–4561, https://doi.org/10.5194/bg-14-4545-2017, 2017. a
Laurent, A., Fennel, K., Cai, W.-J., Huang, W.-J., Barbero, L., and Wanninkhof, R.: Eutrophication-induced acidification of coastal waters in the northern Gulf of Mexico: Insights into origin and processes from a coupled physical-biogeochemical model, Geophys. Res. Lett., 44, 946–956, https://doi.org/10.1002/2016GL071881, 2017. a
Laurent, A., Fennel, K., and Kuhn, A.: An observation-based evaluation and ranking of historical Earth system model simulations in the northwest North Atlantic Ocean, Biogeosciences, 18, 1803–1822, https://doi.org/10.5194/bg-18-1803-2021, 2021. a, b, c, d, e, f
Le Quéré, C., Andrew, R. M., Friedlingstein, P., Sitch, S., Pongratz, J., Manning, A. C., Korsbakken, J. I., Peters, G. P., Canadell, J. G., Jackson, R. B., Boden, T. A., Tans, P. P., Andrews, O. D., Arora, V. K., Bakker, D. C. E., Barbero, L., Becker, M., Betts, R. A., Bopp, L., Chevallier, F., Chini, L. P., Ciais, P., Cosca, C. E., Cross, J., Currie, K., Gasser, T., Harris, I., Hauck, J., Haverd, V., Houghton, R. A., Hunt, C. W., Hurtt, G., Ilyina, T., Jain, A. K., Kato, E., Kautz, M., Keeling, R. F., Klein Goldewijk, K., Körtzinger, A., Landschützer, P., Lefèvre, N., Lenton, A., Lienert, S., Lima, I., Lombardozzi, D., Metzl, N., Millero, F., Monteiro, P. M. S., Munro, D. R., Nabel, J. E. M. S., Nakaoka, S., Nojiri, Y., Padin, X. A., Peregon, A., Pfeil, B., Pierrot, D., Poulter, B., Rehder, G., Reimer, J., Rödenbeck, C., Schwinger, J., Séférian, R., Skjelvan, I., Stocker, B. D., Tian, H., Tilbrook, B., Tubiello, F. N., van der Laan-Luijkx, I. T., van der Werf, G. R., van Heuven, S., Viovy, N., Vuichard, N., Walker, A. P., Watson, A. J., Wiltshire, A. J., Zaehle, S., and Zhu, D.: Global Carbon Budget 2017, Earth Syst. Sci. Data, 10, 405–448, https://doi.org/10.5194/essd-10-405-2018, 2018. a
Lemay, J., Thomas, H., Craig, S. E., Burt, W. J., Fennel, K., and Greenan, B. J. W.: Hurricane Arthur and its effect on the short-term variability of pCO2 on the Scotian Shelf, NW Atlantic, Biogeosciences, 15, 2111–2123, https://doi.org/10.5194/bg-15-2111-2018, 2018. a
Loder, J. W., Han, G., Hannah, C. G., Greenberg, D. A., and Smith, P. C.: Hydrography and baroclinic circulation in the Scotian Shelf region: winter versus summer, Can. J. Fish. Aquat. Sci., 54, 40–56, https://doi.org/10.1139/f96-153, 1997. a
Loder, J. W., Petrie, B., and Gawarkiewicz, G.: The coastal ocean off northeastern North America: A large-scale view, in: The Sea, Volume 11: The Global Coastal Ocean – Regional Studies and Syntheses, edited by: Robinson, A. R. and Brink, K. H., Chap. 5, 105–133, John Wiley & Sons, 1998. a, b, c
Mehrbach, C., Culberson, C. H., Hawley, J. E., and Pytkowicx, R. M.: Measurement of the Apparent Dissociation Constants of Carbonic Acid in Seawater at Atmospheric Pressure, Limnol. Oceanogr., 18, 897–907, https://doi.org/10.4319/lo.1973.18.6.0897, 1973. a
Millero, F. J.: Thermodynamics of the carbon dioxide system in the oceans, Geochim. Cosmochim. Ac., 59, 661–677, https://doi.org/10.1016/0016-7037(94)00354-O, 1995. a
Mills, E. L. and Fournier, R. O.: Fish production and the marine ecosystems of the Scotian Shelf, eastern Canada, Mar. Biol., 54, 101–108, https://doi.org/10.1007/BF00386589, 1979. a
Petrie, B., Topliss, B. J., and Wright, D. G.: Coastal upwelling and eddy development off Nova Scotia, J. Geophys. Res.-Oceans, 92, 12979–12991, https://doi.org/10.1029/JC092iC12p12979, 1987. a
Previdi, M., Fennel, K., Wilkin, J., and Haidvogel, D.: Interannual variability in atmospheric CO2 uptake on the northeast U.S. continental shelf, J. Geophys. Res., 114, G04003, https://doi.org/10.1029/2008JG000881, 2009. a
Rheuban, J. E., Doney, S. C., McCorkle, D. C., and Jakuba, R. W.: Quantifying the effects of nutrient enrichment and freshwater mixing on coastal ocean acidification, J. Geophys. Res.-Oceans, 124, 9085–9100, https://doi.org/10.1029/2019JC015556, 2019. a, b
Rödenbeck, C., Bakker, D. C. E., Gruber, N., Iida, Y., Jacobson, A. R., Jones, S., Landschützer, P., Metzl, N., Nakaoka, S., Olsen, A., Park, G.-H., Peylin, P., Rodgers, K. B., Sasse, T. P., Schuster, U., Shutler, J. D., Valsala, V., Wanninkhof, R., and Zeng, J.: Data-based estimates of the ocean carbon sink variability – first results of the Surface Ocean pCO2 Mapping intercomparison (SOCOM), Biogeosciences, 12, 7251–7278, https://doi.org/10.5194/bg-12-7251-2015, 2015. a
Roobaert, A., Laruelle, G. G., Landschützer, P., Gruber, N., Chou, L., and Regnier, P.: The spatiotemporal dynamics of the sources and sinks of CO2 in the global coastal ocean, Global Biogeochem. Cy., 33, 1693–1714, https://doi.org/10.1029/2019GB006239, 2019. a, b, c
Ross, T., Craig, S. E., Comeau, A., Davis, R., Dever, M., and Beck, M.: Blooms and subsurface phytoplankton layers on the Scotian Shelf: Insights from profiling gliders, J. Marine Syst., 172, 118–127, https://doi.org/10.1016/j.jmarsys.2017.03.007, 2017. a
Rutherford, K. and Fennel, K.: Diagnosing transit times on the northwestern North Atlantic continental shelf, Ocean Sci., 14, 1207–1221, https://doi.org/10.5194/os-14-1207-2018, 2018. a, b, c, d, e
Seitzinger, S. P., Harrison, J. A., Dumont, E., Beusen, A. H. W., and Bouwman, A. F.: Sources and delivery of carbon, nitrogen, and phosphorus to the coastal zone: An overview of Global Nutrient Export from Watersheds (NEWS) models and their application, Global Biogeochem. Cy., 19, GB4S01, https://doi.org/10.1029/2005GB002606, 2005. a
Shadwick, E. and Thomas, H.: Seasonal and spatial variability in the CO2 system on the Scotian Shelf (Northwest Atlantic), Mar. Chem., 160, 42–55, https://doi.org/10.1016/j.marchem.2014.01.009, 2014. a, b
Shadwick, E. H., Thomas, H., Comeau, A., Craig, S. E., Hunt, C. W., and Salisbury, J. E.: Air-Sea CO2 fluxes on the Scotian Shelf: seasonal to multi-annual variability, Biogeosciences, 7, 3851–3867, https://doi.org/10.5194/bg-7-3851-2010, 2010. a, b, c
Shadwick, E., Thomas, H., Azetsu-Scott, K., Greenan, B., Head, E., and Horne, E.: Seasonal variability of dissolved inorganic carbon and surface water pCO2 in the Scotian Shelf region of the Northwestern Atlantic, Mar. Chem., 124, 23–37, https://doi.org/10.1016/j.marchem.2010.11.004, 2011. a, b, c, d, e, f
Shan, S., Sheng, J., Ohashi, K., and Dever, M.: Assessing the performance of a multi-nested ocean circulation model using satellite remote sensing and in situ observations, Satellite Oceanography and Meteorology, 1, 39–59, https://doi.org/10.18063/SOM.2016.01.004, 2016. a
Signorini, S. R., Mannino, A., Najjar, R. G., Friedrichs, M. A., Cai, W. J., Salisbury, J., Wang, Z. A., Thomas, H., and Shadwick, E.: Surface ocean pCO2 seasonality and sea-air CO2 flux estimates for the North American east coast, J. Geophys. Res.-Oceans, 118, 5439–5460, https://doi.org/10.1002/jgrc.20369, 2013. a, b, c, d, e, f
Takahashi, T., Sutherland, S. C., Sweeney, C., Poisson, A., Metzl, N., Tilbrook, B., Bates, N., Wanninkhof, R., Feely, R. A., Sabine, C., Olafsson, J., and Nojiri, Y.: Global sea air CO2 flux based on climatological surface ocean pCO2, and seasonal biological and temperature effects, Deep-Sea Res. Pt. II, 49, 1601–1622, https://doi.org/10.1016/S0967-0645(02)00003-6, 2002. a, b
Tsunogai, S., Watanabe, S., and Sato, T.: Is there a “continental shelf pump” for the absorption of atmospheric CO2?, Tellus B, 51, 701–712, https://doi.org/10.1034/j.1600-0889.1999.t01-2-00010.x, 1999. a
Turi, G., Lachkar, Z., and Gruber, N.: Spatiotemporal variability and drivers of pCO2 and air–sea CO2 fluxes in the California Current System: an eddy-resolving modeling study, Biogeosciences, 11, 671–690, https://doi.org/10.5194/bg-11-671-2014, 2014. a
Umlauf, L. and Burchard, H.: A generic length-scale equation for geophysical turbulence models, J. Marine Res., 61, 235–265, https://doi.org/10.1357/002224003322005087, 2003. a
Urrego-Blanco, J. and Sheng, J.: Interannual variability of the circulation over the Eastern Canadian shelf, Atmosphere-Ocean, 50, 277–300, https://doi.org/10.1080/07055900.2012.680430, 2012. a, b
Vandemark, D., Salisbury, J. E., Hunt, C. W., Shellito, S. M., Irish, J., McGillis, W., Sabine, C., and Maenner, S.: Temporal and spatial dynamics of CO2 air-sea flux in the Gulf of Maine, J. Geophys. Res.-Oceans, 116, C01012, https://doi.org/10.1029/2010JC006408, 2011. a, b
Warner, J. C., Sherwood, C. R., Arango, H. G., and Signell, R. P.: Performance of four turbulence closure models implemented using a generic length scale method, Ocean Model., 8, 81–113, https://doi.org/10.1016/j.ocemod.2003.12.003, 2005. a
Weiss, R. F.: Carbon dioxide in water and seawater: The solubility of a non-ideal gas, Mar. Chem., 2, 203–215, 1974. a
Wu, H. and Zhu, J.: Advection scheme with 3rd high-order spatial interpolation at the middle temporal level and its application to saltwater intrusion in the Changjiang Estuary, Ocean Model., 33, 33–51, https://doi.org/10.1016/j.ocemod.2009.12.001, 2010. a
Xiu, P., Chai, F., Curchitser, E. N., and Castruccio, F. S.: Future changes in coastal upwelling ecosystems with global warming: The case of the California Current System, Sci. Rep. UK, 8, 2866, https://doi.org/10.1038/s41598-018-21247-7, 2018. a
Zeebe, R. E. and Wolf-Gladrow, D. A.: CO2 in Seawater – Equilibrium, Kinetics, Isotopes, 65, 1st Edn., Elsevier Science B.V., Amsterdam, 2001. a