the Creative Commons Attribution 4.0 License.
the Creative Commons Attribution 4.0 License.
 | 15 Dec 2021
Biophysical controls on seasonal changes in the structure, growth, and grazing of the size-fractionated phytoplankton community in the northern South China Sea
Yuan Dong
Zhengchao Wu
Yiping Shuai
Zijia Liu
Zaiming Ge
Weiwen Zhou
Yinchao Chen
The size-fractionated phytoplankton growth and microzooplankton grazing are crucial for the temporal change of community size structure, regulating not only trophic transfer but also the carbon cycle of the ocean. However, the size-dependent growth and grazing dynamics on a monthly or an annual basis are less addressed in the coastal ocean. In this paper, the seasonal responses of the size-fractionated phytoplankton growth and grazing to environmental change were examined over 1 year at a coastal site of the northern South China Sea. We found a nanophytoplankton-dominated community with strong seasonal variations in all size classes. Phytoplankton community growth rate was positively correlated to nutrients, with community grazing rate correlating to the total chlorophyll a at the station, reflecting a combined bottom-up and top-down effect on phytoplankton population dynamics. Further analyses suggested that the specific growth rate of microphytoplankton was significantly influenced by phosphate, and that of nanophytoplankton was influenced by light, although picophytoplankton growth was controlled by both nitrate and temperature. In addition, the specific grazing rate of nanophytoplankton was well correlated to phytoplankton standing stock, while that of micro- and pico-compartments was negatively influenced by ciliate abundance and salinity. Finally, a lower grazing impact for micro-cells (38 %) than nano- and pico-cells (72 % and 60 %, respectively) may support size-selective grazing of microzooplankton on small cells at this eutrophic system.
- Article
(8284 KB) - Full-text XML
-
Supplement
(331 KB) - BibTeX
- EndNote


Plankton are the basic components of the aquatic food web. Phytoplankton growth can be influenced by nutrient availability (such as nitrogen, phosphorus, silica, or iron) via the bottom-up effect and/or zooplankton grazing via the top-down effect (Strom et al., 2007). Grazing of bacterioplankton by microzooplankton (such as nanoflagellates and ciliates) has been well-known in aquatic environments (Ichinotsuka et al., 2006; Unrein et al., 2007; Schmoker et al., 2013). Microzooplankton are generally the dominant herbivores in the marine ecosystem (Calbet and Landry, 2004), regulating not only primary productivity but also carbon transfer within the pelagic food webs (Steinberg and Landry, 2017). Spatial changes of phytoplankton growth and microzooplankton grazing have been well appreciated in the coastal ecosystems due to rapidly varying environmental conditions such as temperature, nutrients, and light (e.g., Landry et al., 2009; Li et al., 2012; Dong et al., 2018). In contrast, temporal variabilities in rate processes over an annual cycle or monthly cycle are often less addressed, not to mention the relevant controlling mechanisms (Chen et al., 2009; Anderson and Harvey, 2019). This aspect of temporal dynamics, however, may be essential for understanding the long-term change of biological productivity, community structure, and ecosystem functions in the coastal oceans.
The coastal regions of the northern South China Sea (NSCS) are subject to strong influences by complex physical processes, such as wind-induced mixing, coastal upwelling, river discharge, and atmospheric deposition. Seasonal variation in primary productivity over the NSCS shelf could be related to hydrographic dynamics driven by varying monsoon winds with a stronger turbulent mixing during the winter (e.g., Shuai et al., 2021). Furthermore, nutrient concentration and stoichiometry of the surface waters could be influenced by the interplay between river discharge (a high ratio) and coastal upwelling (a low ratio) over the inner shelf of the NSCS (Gan et al., 2010), leading to intense phytoplankton blooms during the summer. In addition, the river plume would affect the size structure of the phytoplankton community, with large-sized phytoplankton such as diatoms well promoted at the frontal zone (Li et al., 2018). Finally, atmospheric depositions of nutrients and toxic metals could also largely affect coastal phytoplankton growth and the community compositions of the nearshore waters in the NSCS (Zhou et al., 2021).
The Pearl River estuary (PRE), with an area of about 4.5 km × 105 km, is one of the largest river systems in the northern South China Sea (NSCS). Wanshan archipelago, located at the mouth of the PRE, is the primary channel for the Pearl River waters entering the shelf sea. Therefore, the surrounding waters near Wanshan often showed a rapid change of salinity and nutrients due to the interplay between the estuarine freshwater and the adjacent coastal seawater. Similar to many other estuarine–coastal ecosystems around the world (Cloern et al., 2014), there is high production at the estuary mouth near the Wanshan region but low production in the turbidity maximum zone within the estuary. Phytoplankton in the coastal waters near Wanshan is dominated by fast-growing diatoms in response to strong eutrophication (e.g., Li et al., 2013). The dominant diatom species here are Skeletonema costatum in the summer and Eucampia zoodiacus in the winter, which are intensively grazed by ciliates and dinoflagellates, as well as copepods (Chen et al., 2015). Further studies suggest that phytoplankton growth here is influenced by nutrient limitation (Li et al., 2018), size-selective microzooplankton grazing (Dong et al., 2018), and the deterrent effect of phytoplankton-derived oxylipins on zooplankton grazers (Wu and Li, 2016). Meanwhile, the seasonal patterns of phytoplankton productivity and the grazing activity of microzooplankton in the coastal waters outside the highly euphotic estuary remain less studied.
In this study, we focus on a coastal time series station near the Wanshan archipelago to explore the monthly change of the plankton ecosystem from June 2018 to June 2019. We have performed comprehensive measurements of the plankton community, including the chlorophyll a (chl a) size fractionation, the picophytoplankton composition by flow cytometry, the nano- and microplankton abundances by FlowCAM, and the size-fractionated growth and grazing rates by dilution experiments. Based on these data, we investigate the seasonal variabilities of phytoplankton size structure and size-fractionated growth rates. We explore the relationships of these variabilities with changing environmental conditions such as temperature, light, and nutrients. We also examine the monthly variability of microzooplankton and their size-dependent feeding. Seasonal changes in growth and grazing rates, as well as size-selective prey preference at a coastal site such as Wanshan, could be crucial for understanding the temporal dynamics of food-web structure, carbon export, and nutrient recycling in the coastal ocean (e.g., Steinberg and Landry, 2017). Moreover, our results here may be of great value for modeling the size-structured planktonic ecosystem and associated element cycles as temporal variabilities of these processes are often not well represented in current biogeochemical models (e.g., Li et al., 2011; Sailley et al., 2015).
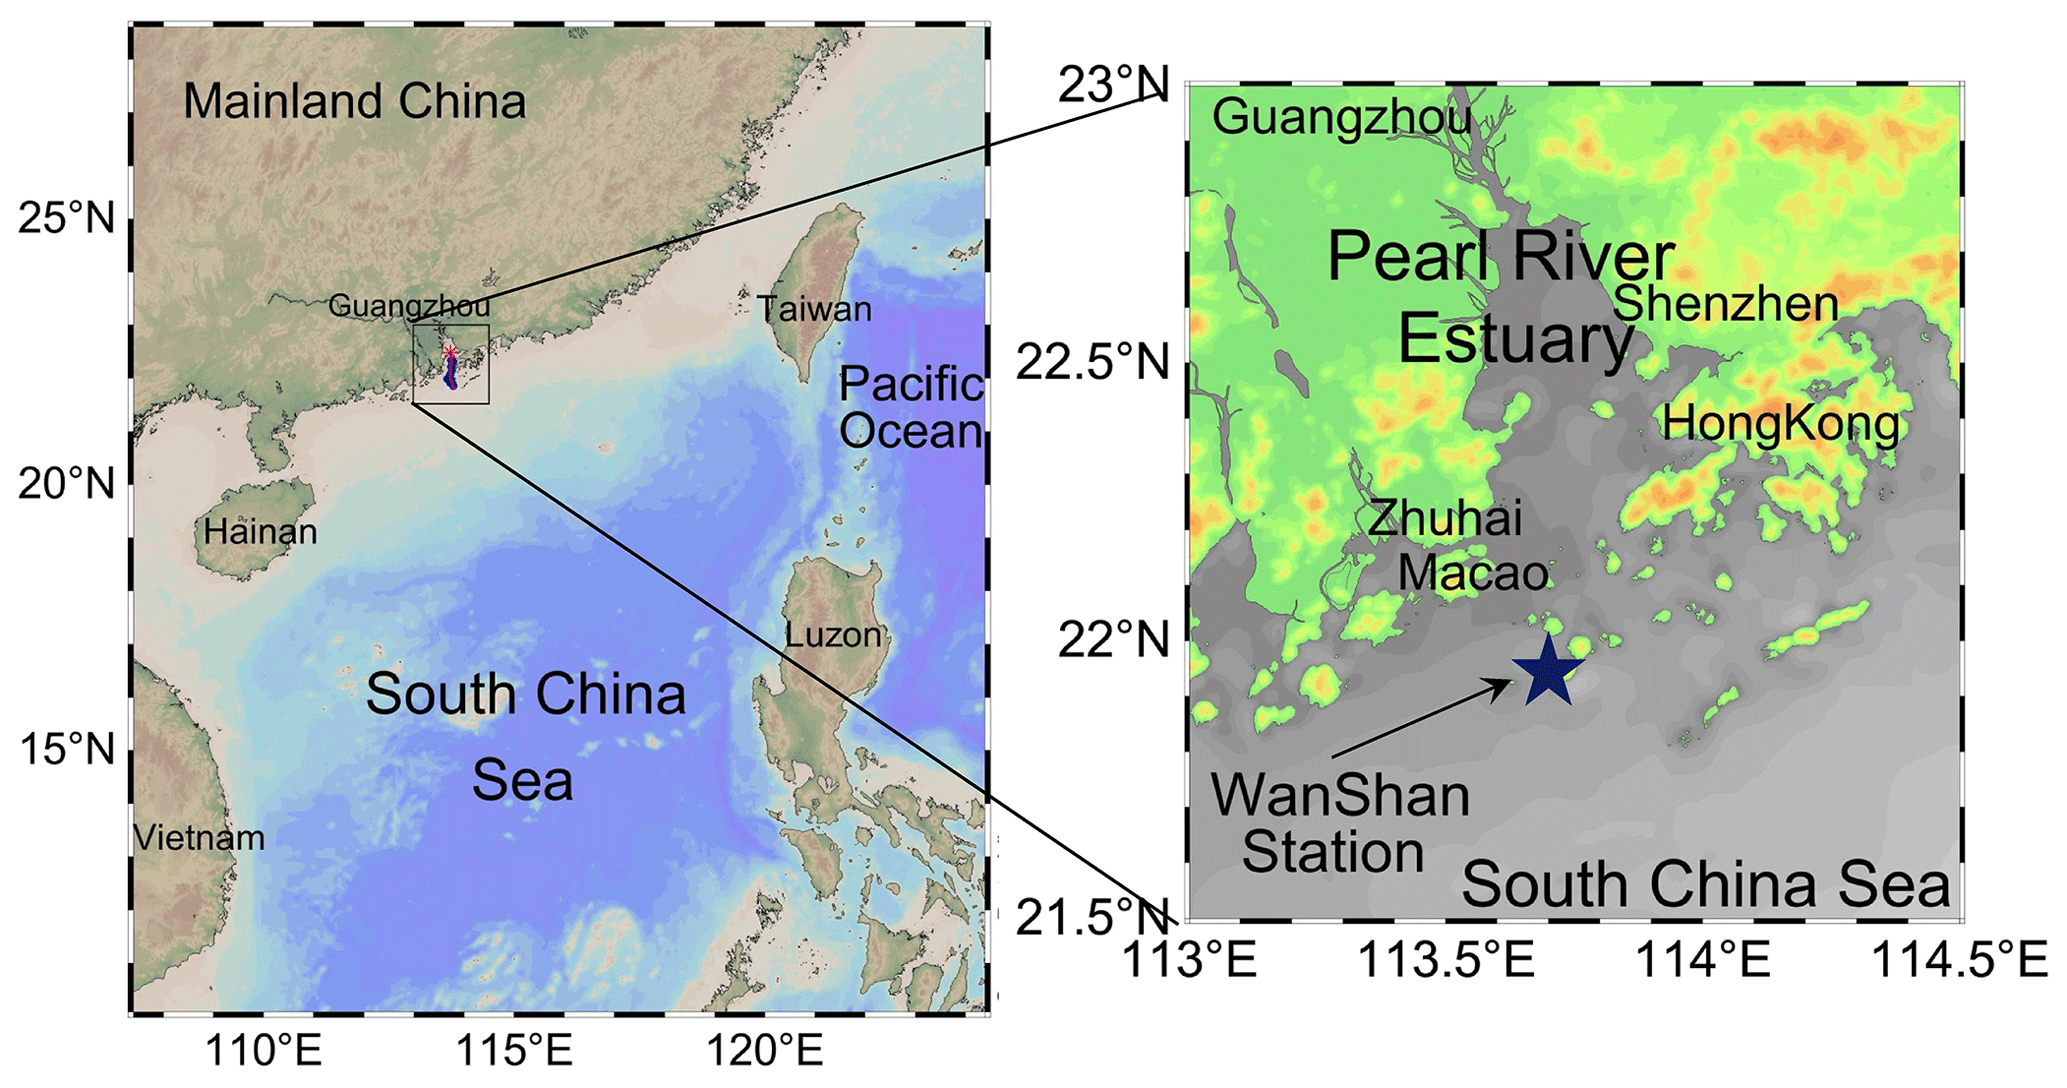
Figure 1Geographic map of the Pearl River estuary and the adjacent northern South China Sea. The filled star in the enlarged panel is the monthly time series station (21.9∘ N, 113.8∘ E) near Wanshan Island from June 2018 to June 2019.
2.1 Description of the field study and measurement of environmental parameters
We also conducted monthly hydrographic and biogeochemical monitoring, as well as phytoplankton chl a size-fractionation and size-specific dilution experiments at the Wanshan station (Fig. 1) from June 2018 to June 2019. This station (21.9∘ N, 113.8∘ E) is located near Wanshan islands of the NSCS with a water depth of ∼ 28 m (see Fig. 1). Water temperature and salinity were measured using a pre-calibrated YSI multi-probe sensor. Surface waters at ∼ 2 m (about 100 L) were directly collected with an acid-cleaned polycarbonate bucket. After removing the larger grazers (> 200 µm) using a 200 µm mesh, water samples were gently transferred to polycarbonate bags in a temperature-controlled cooler in the dark.
The sample for inorganic nutrients, including nitrate (), phosphate (), and silicate (), was pre-filtered through a Whatman GF/F filter and frozen immediately at −20 ∘C in a freezer. Samples were thawed at room temperature and measured by a Seal AA3 auto-analyzer (Bran-Luebbe, GmbH) using the classic colorimetric methods (Hansen and Koroleff, 1999). The monthly solar radiation data were acquired from a nearby weather station in Hong Kong (https://www.hko.gov.hk/en/index.html, last access: 14 December 2021).
There were three major subbranches of the Pearl River system (west, north, and east rivers), flowing into the shelf sea through eight different outlets. The total flow rate to the Wanshan station was estimated by the sum of three major entrances at Humen, Modaomen, and Jiaomen (Guangdong Hydrographic Bureau, http://wsjkw.gd.gov.cn/en/index.html, last access: 14 December 2021).
To show the typical difference in the hydrographic characters of the coastal NSCS between winter and summer, sectional data of two cruises crossing the Wanshan station during December 2006 and June 2019 were used (Fig. S1 in the Supplement). The vertical transects covered the major river-influenced area from the estuary to the inner shelf of the NSCS. The profiles of seawater temperature, salinity, and pressure were continuously measured using a Sea-Bird model SBE9/11 conductivity–temperature–depth (CTD) sensor.
2.2 Phytoplankton and zooplankton measurements
After returning to the laboratory (< 1 h), the chl a size fractionation for micro- (20–200 µm), nano-(2–20 µm), and pico-phytoplankton (< 2 µm) (Dong et al., 2018) was performed immediately. Duplicated seawater samples (1–2 L) were processed through a sequence of filtration steps under a low vacuum (< 50 kPa), including a 20 µm pore size Nylon membrane filter, a 2 µm pore size polycarbonate filter, and a GF/F filter. Total chl a was calculated as the sum of the chl a concentrations of the three different size classes. The filters were extracted in 90 % acetone for at least 18 h in the dark at −20 ∘C. After centrifuging at 4000 rpm for 10 min, the chl a concentration was determined by a Turner Designs model 10 fluorometer (Parsons et al., 1984).
For picoplankton, a volume of 2 mL of seawater was pre-filtered by a 38 µm filter and fixed by paraformaldehyde (0.5 % final concentration). After 10 min of reaction, the samples were frozen and stored at −80 ∘C. Abundances of Synechococcus, picoeukaryotes, and Prochlorococcus-like cells were enumerated using Beckman Coulter's CytoFLEX S flow cytometer (Zhou et al., 2021). Carbon biomasses of Synechococcus, picoeukaryotes, and Prochlorococcus-like cells were estimated using the converting factors of 101, 530, and 32 fg C cell L−1, respectively (Garrison et al., 2000; Worden et al., 2004). Samples were prepared in triplicate.
We measured the abundances of ciliates and chain-forming diatoms via an automated FlowCAM system (Portable Series FlowCAM). Dinoflagellates are also important at the Wanshan station but are difficult to be accurately quantified by FlowCAM. The samples were screened by a 200 µm mesh to remove large particles. A volume of 300 mL of sample was analyzed in auto-image mode using a 300 µm flow cell and a flow rate of 2 mL min−1 (Anderson and Harvey, 2019; Haraguchi et al., 2018). Duplicate runs were pooled for each experiment. The results of FlowCAM were further validated by the inverted microscopic method. Briefly, seawater of 1000 mL was fixed with acidic Lugol's solution (1 % final concentration) and stored in amber plastic bottles at room temperature. After pre-concentrated using the Utermöhl method (Utermöhl, 1958), a 20 mL subsample was counted with an inverted microscope at 200× magnification. The biomass of aloricate ciliate was estimated from biovolume using the conversion factor of 0.19 pg C µm−3 (Putt and Stoecker, 1989) with tintinnid biomass using the equation pg C = 444.5 + 0.053 ⋅ lorica volume (µm3) (Verity and Langdon, 1984).
2.3 Setup of size-specific multi-treatment dilution experiments
The size-specific dilution experiment was carried out directly at a coastal pier 500 m away from the sampling site. The protocol of dilution experiments has been described in detail by Dong et al. (2018). Briefly, all the bottles, tubing, and carboys for the dilution experiment were soaked in 10 % HCl for at least 24 h and rinsed with deionized water and in situ surface seawater successively before each experiment. Particle-free water was prepared by gravity filtering the prescreened seawater through a 0.2 µm filter. The whole seawater was gently poured into 2.4 L polycarbonate bottles containing specific volumes of particle-free water to obtain a dilution series of 10 %, 20 %, 40 %, 70 %, and 100 % whole seawater. Each dilution treatment was duplicated during the experiment. A total of 10 incubation bottles were enriched with dissolved inorganic nutrients of 5 µmol L−1 NaNO3, 0.5 µmol L−1 KH2PO4, and 5 µmol L−1 Na2SiO3 to ensure the constant growth of phytoplankton (particularly to avoid nutrient limitation during winter). The amounts of nutrients are slightly lower than those used by Chen et al. (2009), given that our Wanshan station is relatively closer to the northern South China Sea than their site. There were two additional bottles filled with the whole seawater that served as controls without nutrient addition. All these bottles were tightly capped and incubated for 24 h in an incubator filled with the running surface seawater near the pier (with similar water temperature as the sampling site) and covered with a neutral density screen to mimic the in situ temperature and light at the station. Initial chl a concentrations of the diluted bottles were estimated from the whole seawater multiplied by the dilution factor, which has been verified by the direct measurements. Aliquots of 500 mL samples at the end of the 24 h culture were taken from each bottle for chl a measurement.
2.4 Estimates of growth rate and grazing rate
Estimates of nutrient-enriched phytoplankton growth rate (μn, d−1) and microzooplankton grazing rate (m, d−1) for the total phytoplankton community (Landry and Hassett, 1982) were calculated with least-square regression between the apparent growth rates (εd, d−1) and the dilution factors (d) as
where Chld(0) and Chld(t) are the initial and final concentrations of chl a for each dilution treatment (d), with t the incubation time (1 d in our experiment). The natural growth rate (μ0) is calculated as the sum of the apparent growth rate without nutrient enrichment (εraw) and the grazing rate (Landry et al., 1993).
For each phytoplankton size class i (micro, nano, and pico, respectively), we have equations similar to
where μi and are the natural and nutrient-enriched growth rates of size class i with mi the size-specific grazing rate. and are the raw and nutrient-enriched apparent growth rates of size class i.
2.5 Statistics analysis
Statistical analyses were performed using the software SPSS 14.0. Comparisons between environmental variables were conducted using reduced major axis model II regression with r representing the Pearson coefficient of correlation. A permutation test was carried out to determine the significance of the slopes and calculate the p value. The level of p < 0.05 was considered significant, with p < 0.01 as strong significance. Following the one-way independent measure ANOVA (one-way ANOVA), the significance of the difference between growth–grazing rates and zero was checked using Tukey's HSD test. Responses of the size-fractionated growth and grazing rates to varying environmental parameters were investigated by multivariate statistical analyses using CANOCO version 5.0. Redundancy analysis (RDA) was used to summarize relations between size-fractionated rates and environmental parameters once the length of the first gradient was satisfied by a linear justification.
3.1 Temporal change of hydrodynamics in the study area
At the Wanshan station, there was a strong stratification induced by river discharge and seawater intrusion during the summer in contrast to the well-mixed water column during the winter (Fig. S1). Despite a much higher seawater temperature, surface salinity was much lower in the summer (15.3 ± 8.1) than in the winter (33.3 ± 0.2), reflecting a stronger river discharge. The structure of the summer river plume was manifested by a layer of low-salinity (7.2–24.4) surface water extending from the estuary to the inner shelf.
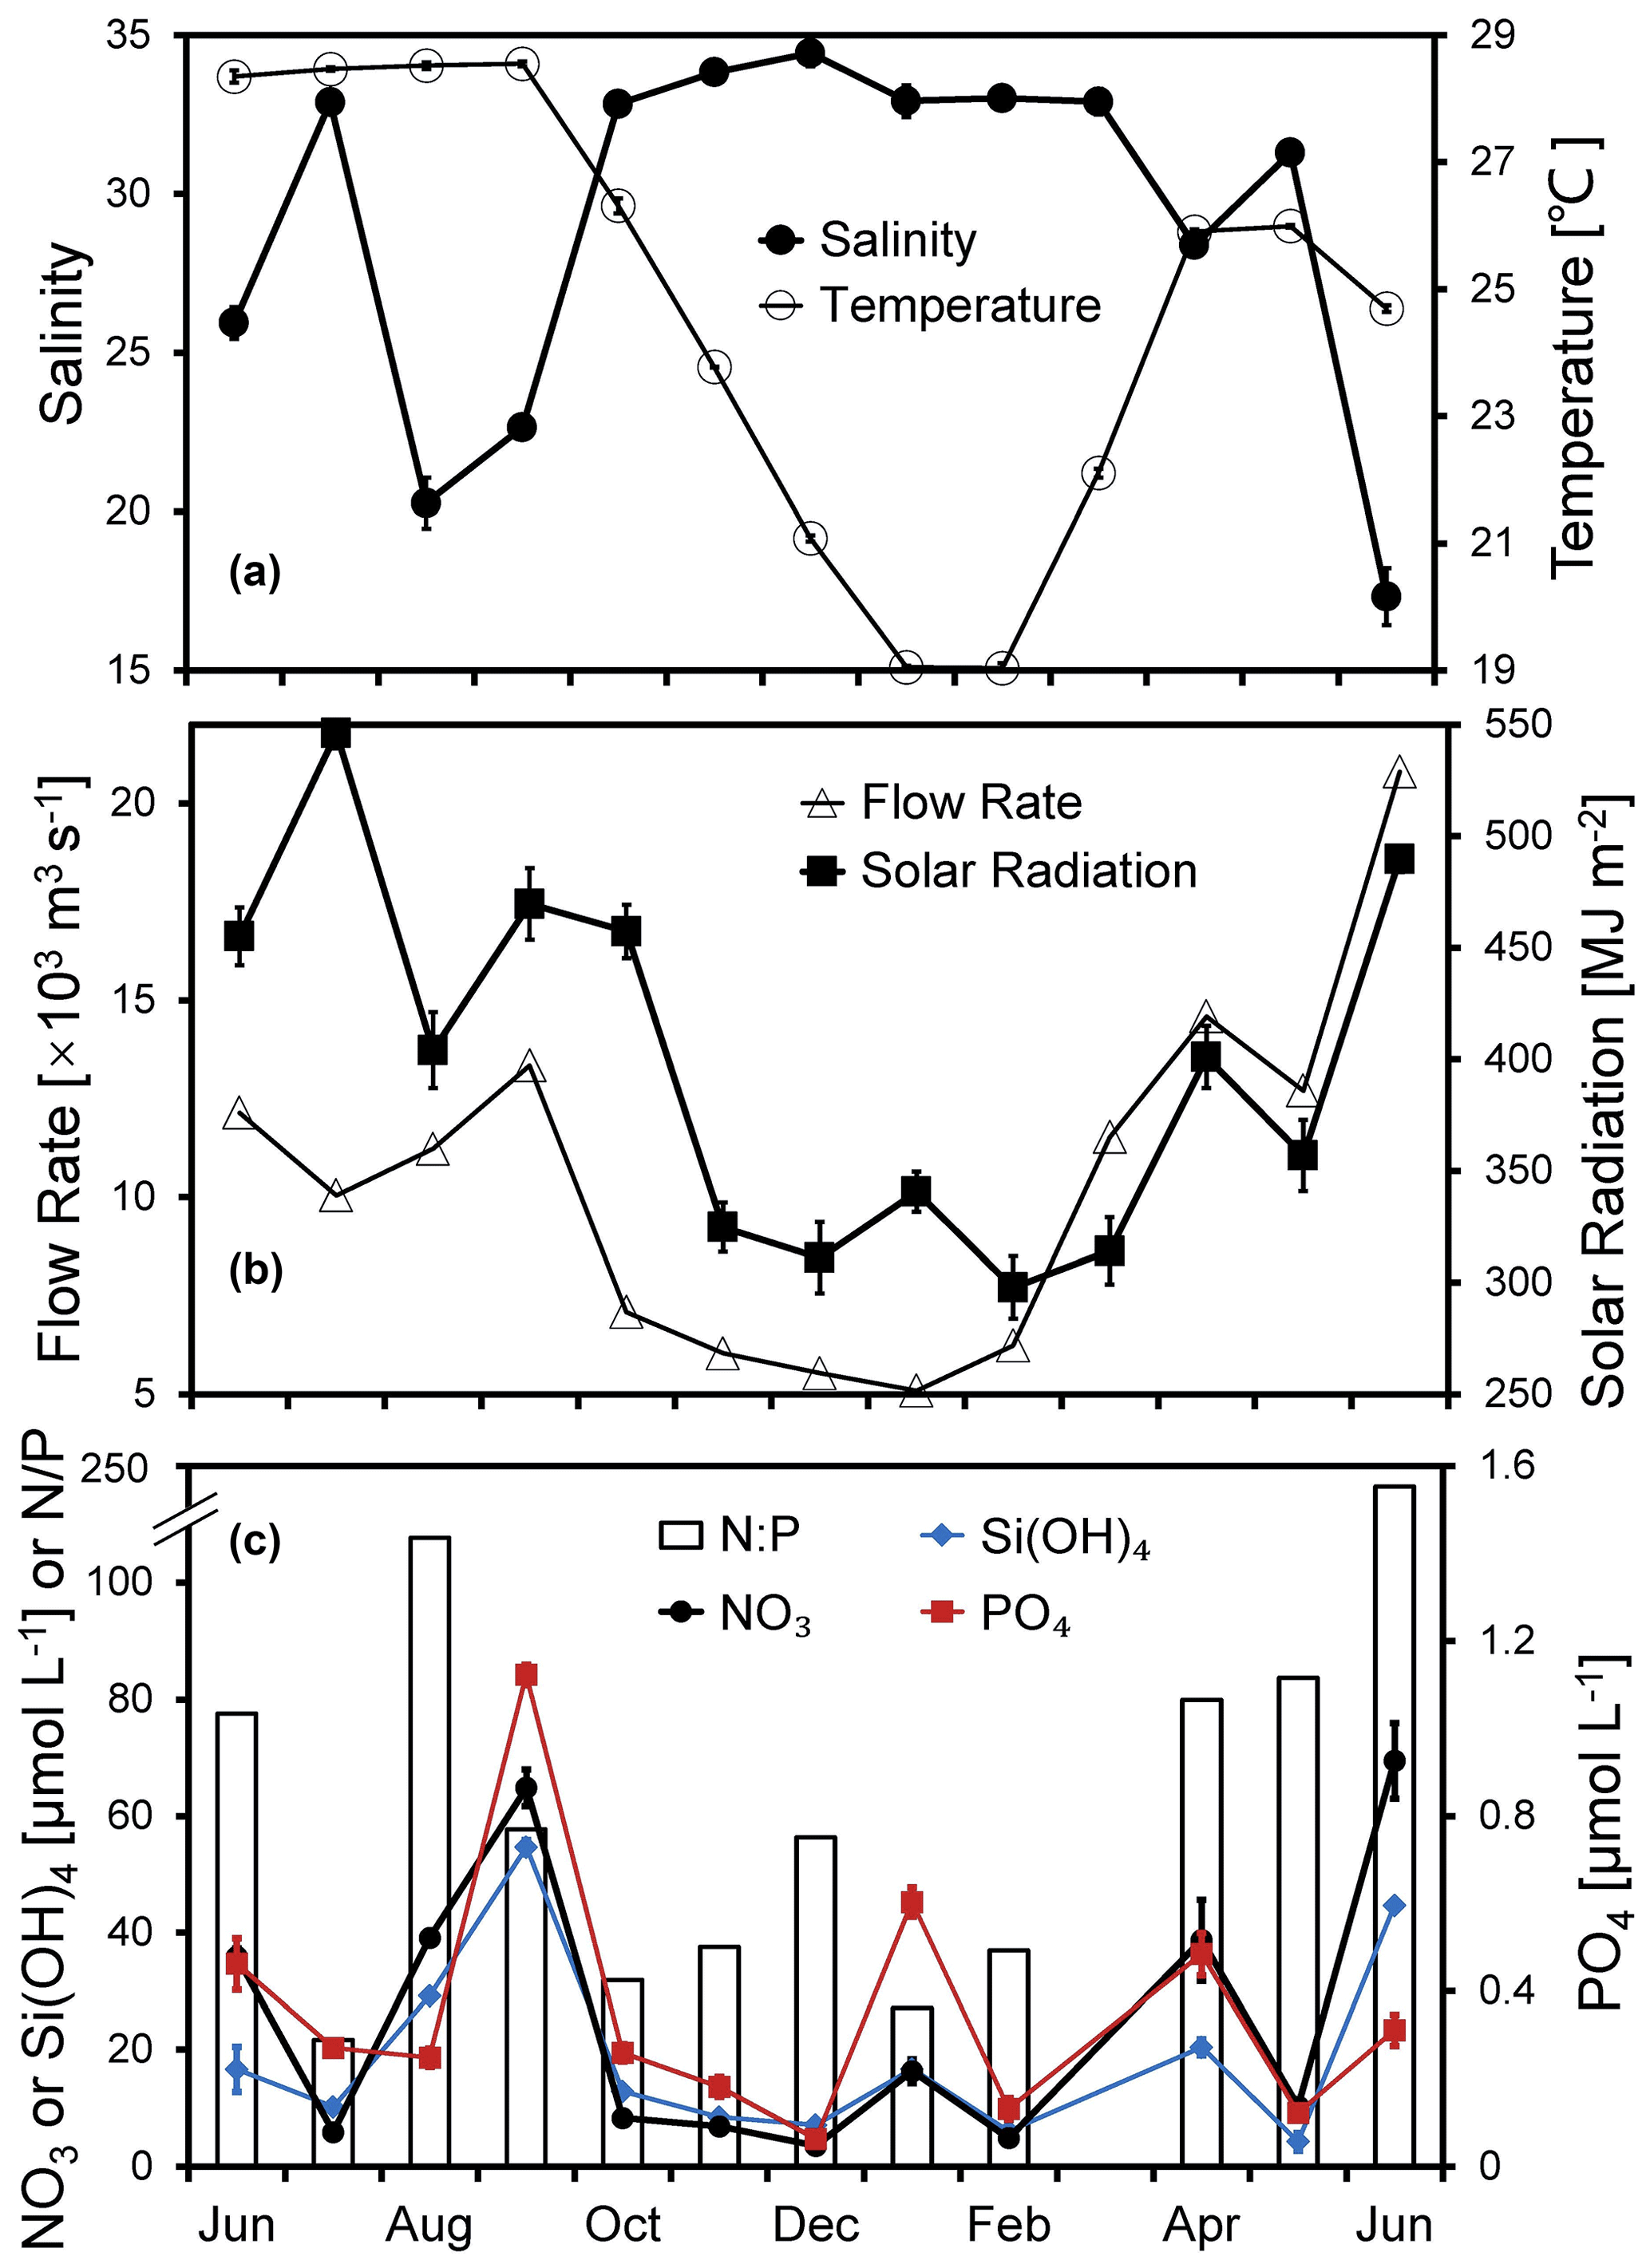
Figure 2Temporal variations in (a) temperature, salinity, (b) flow rate, solar radiation, (c) nitrate, silicate, phosphate, and ratio of the surface water at the Wanshan station from June 2018 to June 2019. Error bars are standard deviations.
Pronounced seasonal variations in temperature, salinity, river flow, and solar radiation were observed during the 1-year time series study at the Wanshan station (Fig. 2a and b). The annually averaged temperature is about 24.8 ± 3.5 ∘C, varying from 19.0 to 28.5 ∘C (Fig. 2a). Salinity fluctuation at Wanshan was evidenced in response to the seasonal flood of freshwater runoff from the Pearl River. While a substantially low salinity (< 26) showed up in June, August, and September 2018, there was a relatively higher salinity of ∼ 33 found during the other months of the year. There was about 66 % of the river discharge occurring in the wet season of April–September with a total flow rate of 82.7 × 10³m3 s−1, which is about twice that in the dry season of October–March (total of 41.5 × 10³m3 s−1) (Fig. 2b).
A strong negative correlation between the monthly flow rate of the Pearl River and the salinity at Wanshan (r = −0.82, n=12, p < 0.01) was observed, which should indicate an essential role of river input in the temporal change of local hydrodynamics at the Wanshan station. Also, the flow rate was positively correlated with nitrate and silicate concentrations (Table S1 in the Supplement), which may reflect a major source of nutrients to the Wanshan station from river discharge. There was an apparent seasonal change of solar radiation (Fig. 2b), with the lowest value in the winter (297.7 MJ m−2) but the highest value in the summer (546.2 MJ m−2). We also found periods of slightly reduced light intensity during August and May due to the cloud coverage. Solar radiation was positively correlated to temperature throughout the year (r=0.76, n=12, p < 0.01) but not with any other environmental parameters at our station (Table S1).
3.2 Temporal change of plankton ecosystem and biogeochemistry
Surface concentrations of nitrate ranged from 3.6 to 69.4 µmol L−1 (with an average of 25.3 ± 23.7 µmol L−1) (Fig. 2c). There were peaks of nitrate in June, September, January, and April during the 1-year cycle, with the highest concentration of 64.8 µmol L−1 found in September. Nitrate concentration decreased dramatically in late autumn, with the lowest 3.6 µmol L−1 found in December. Temporal variations in phosphate and silicate were generally in agreement with that of nitrate (Fig. 2c), which was confirmed by significant correlations between nitrate and phosphate (r=0.64, n=12, p < 0.05) and between phosphate and silicate (r=0.73, n=12, p < 0.01). The surface ratios were very high at the Wanshan station (21.6–116.4), indicating a potential phosphorus deficiency compared to the Redfield ratio. Salinity showed strong negative correlations with both nitrate and silicate, which should reflect the impact of river discharge with an intense mixing between the eutrophic river water and the low-nutrient seawater at the Wanshan station. Meanwhile, we found no correlation between phosphate and salinity (Table S1).
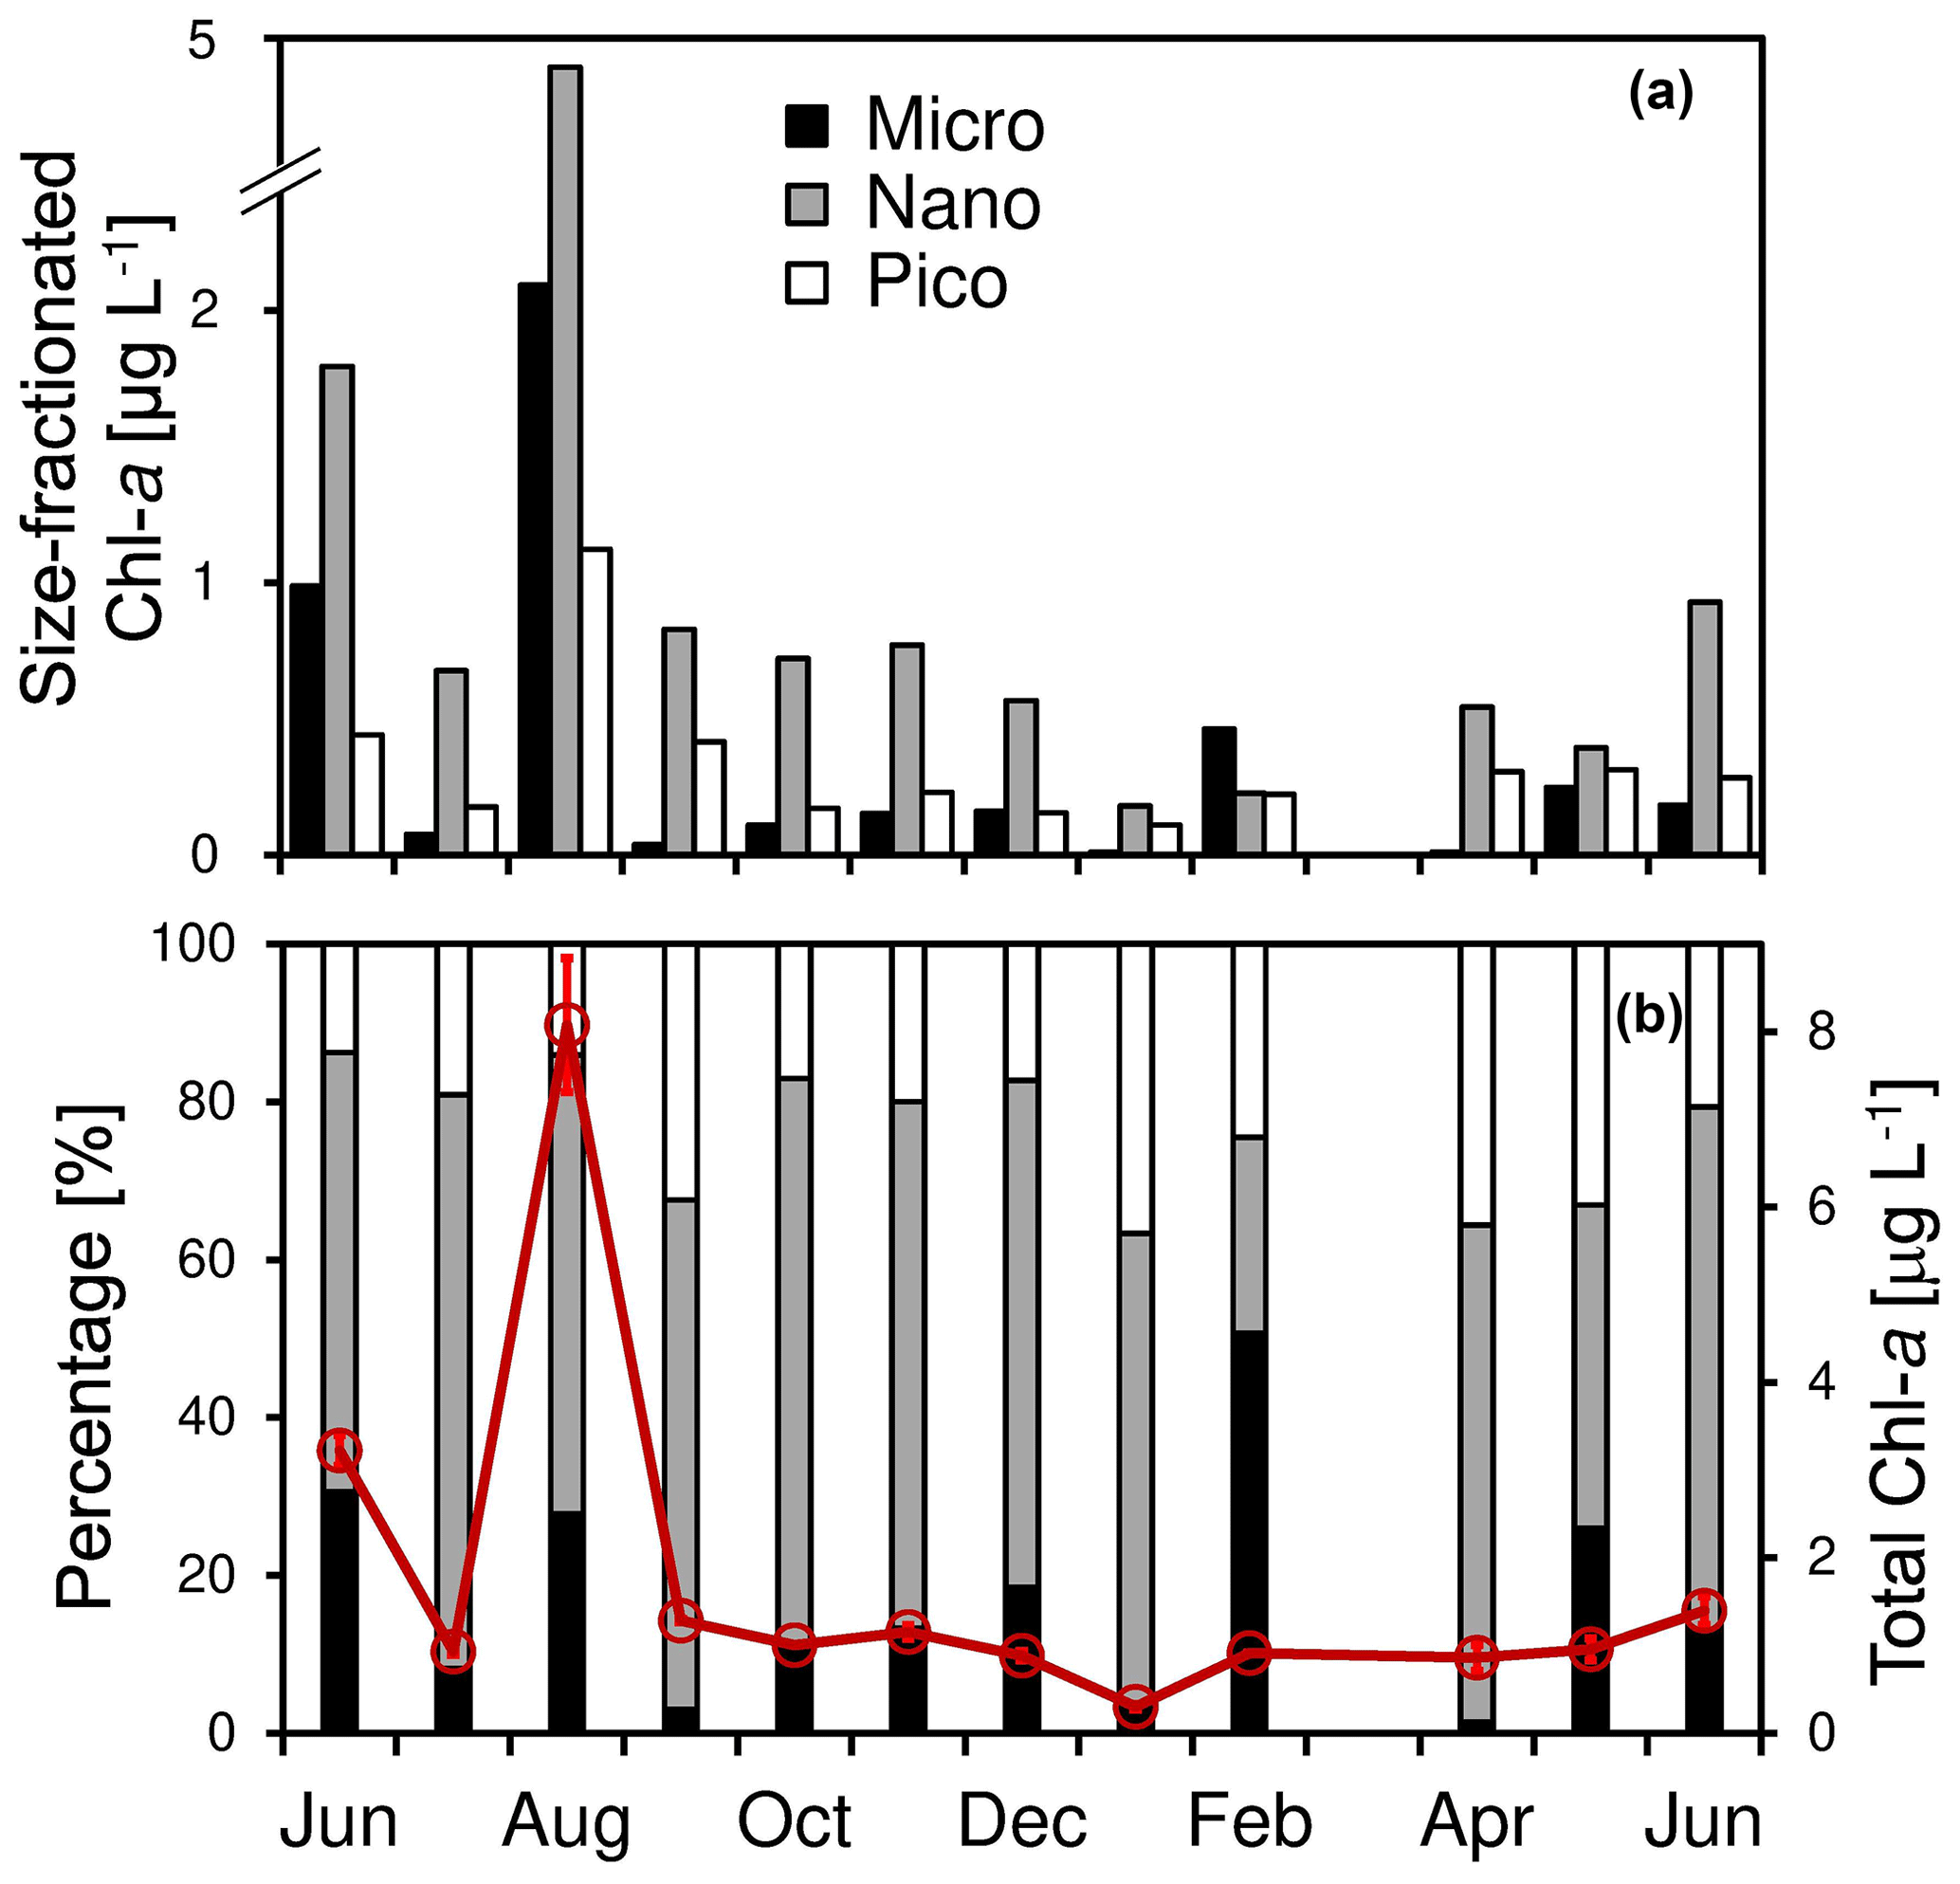
Figure 3Temporal change of (a) size-fractionated chlorophyll a concentrations of micro-, nano-, and pico-phytoplankton as well as (b) the total chlorophyll a concentration (red circles and lines) and the size-fractionated percentages (columns) at the Wanshan station from June 2018 to June 2019. Error bars are standard deviations.
There was a large seasonal change of total chl a varying from 0.33 to 8.1 µg L−1 during the study period (with an average of 1.9 ± 2.2 µg L−1). Consistent with those of nutrients, a generally higher total chl a was found during the summer, with a maximum of 8.1 µg L−1 in August. In contrast, a low chl a concentration of 1.0 ± 0.3 µg L−1 was found among the other months of the year. For the size-fractioned chl a, the phytoplankton community was predominated by nano-cells (on average 60.4 ± 14.5 %) throughout the year, followed by pico- (22.4 ± 7.5 %) and micro-cells (17.2 ± 14.5 %). Also, there was a high chl a concentration and a high percentage of microphytoplankton showing up in June and August 2018 (Fig. 3a) when the total chl a concentration was high (Fig. 3b). A high percentage of micro-cells was also found in February and May 2019, although the total chl a was relatively low (Fig. 3b).
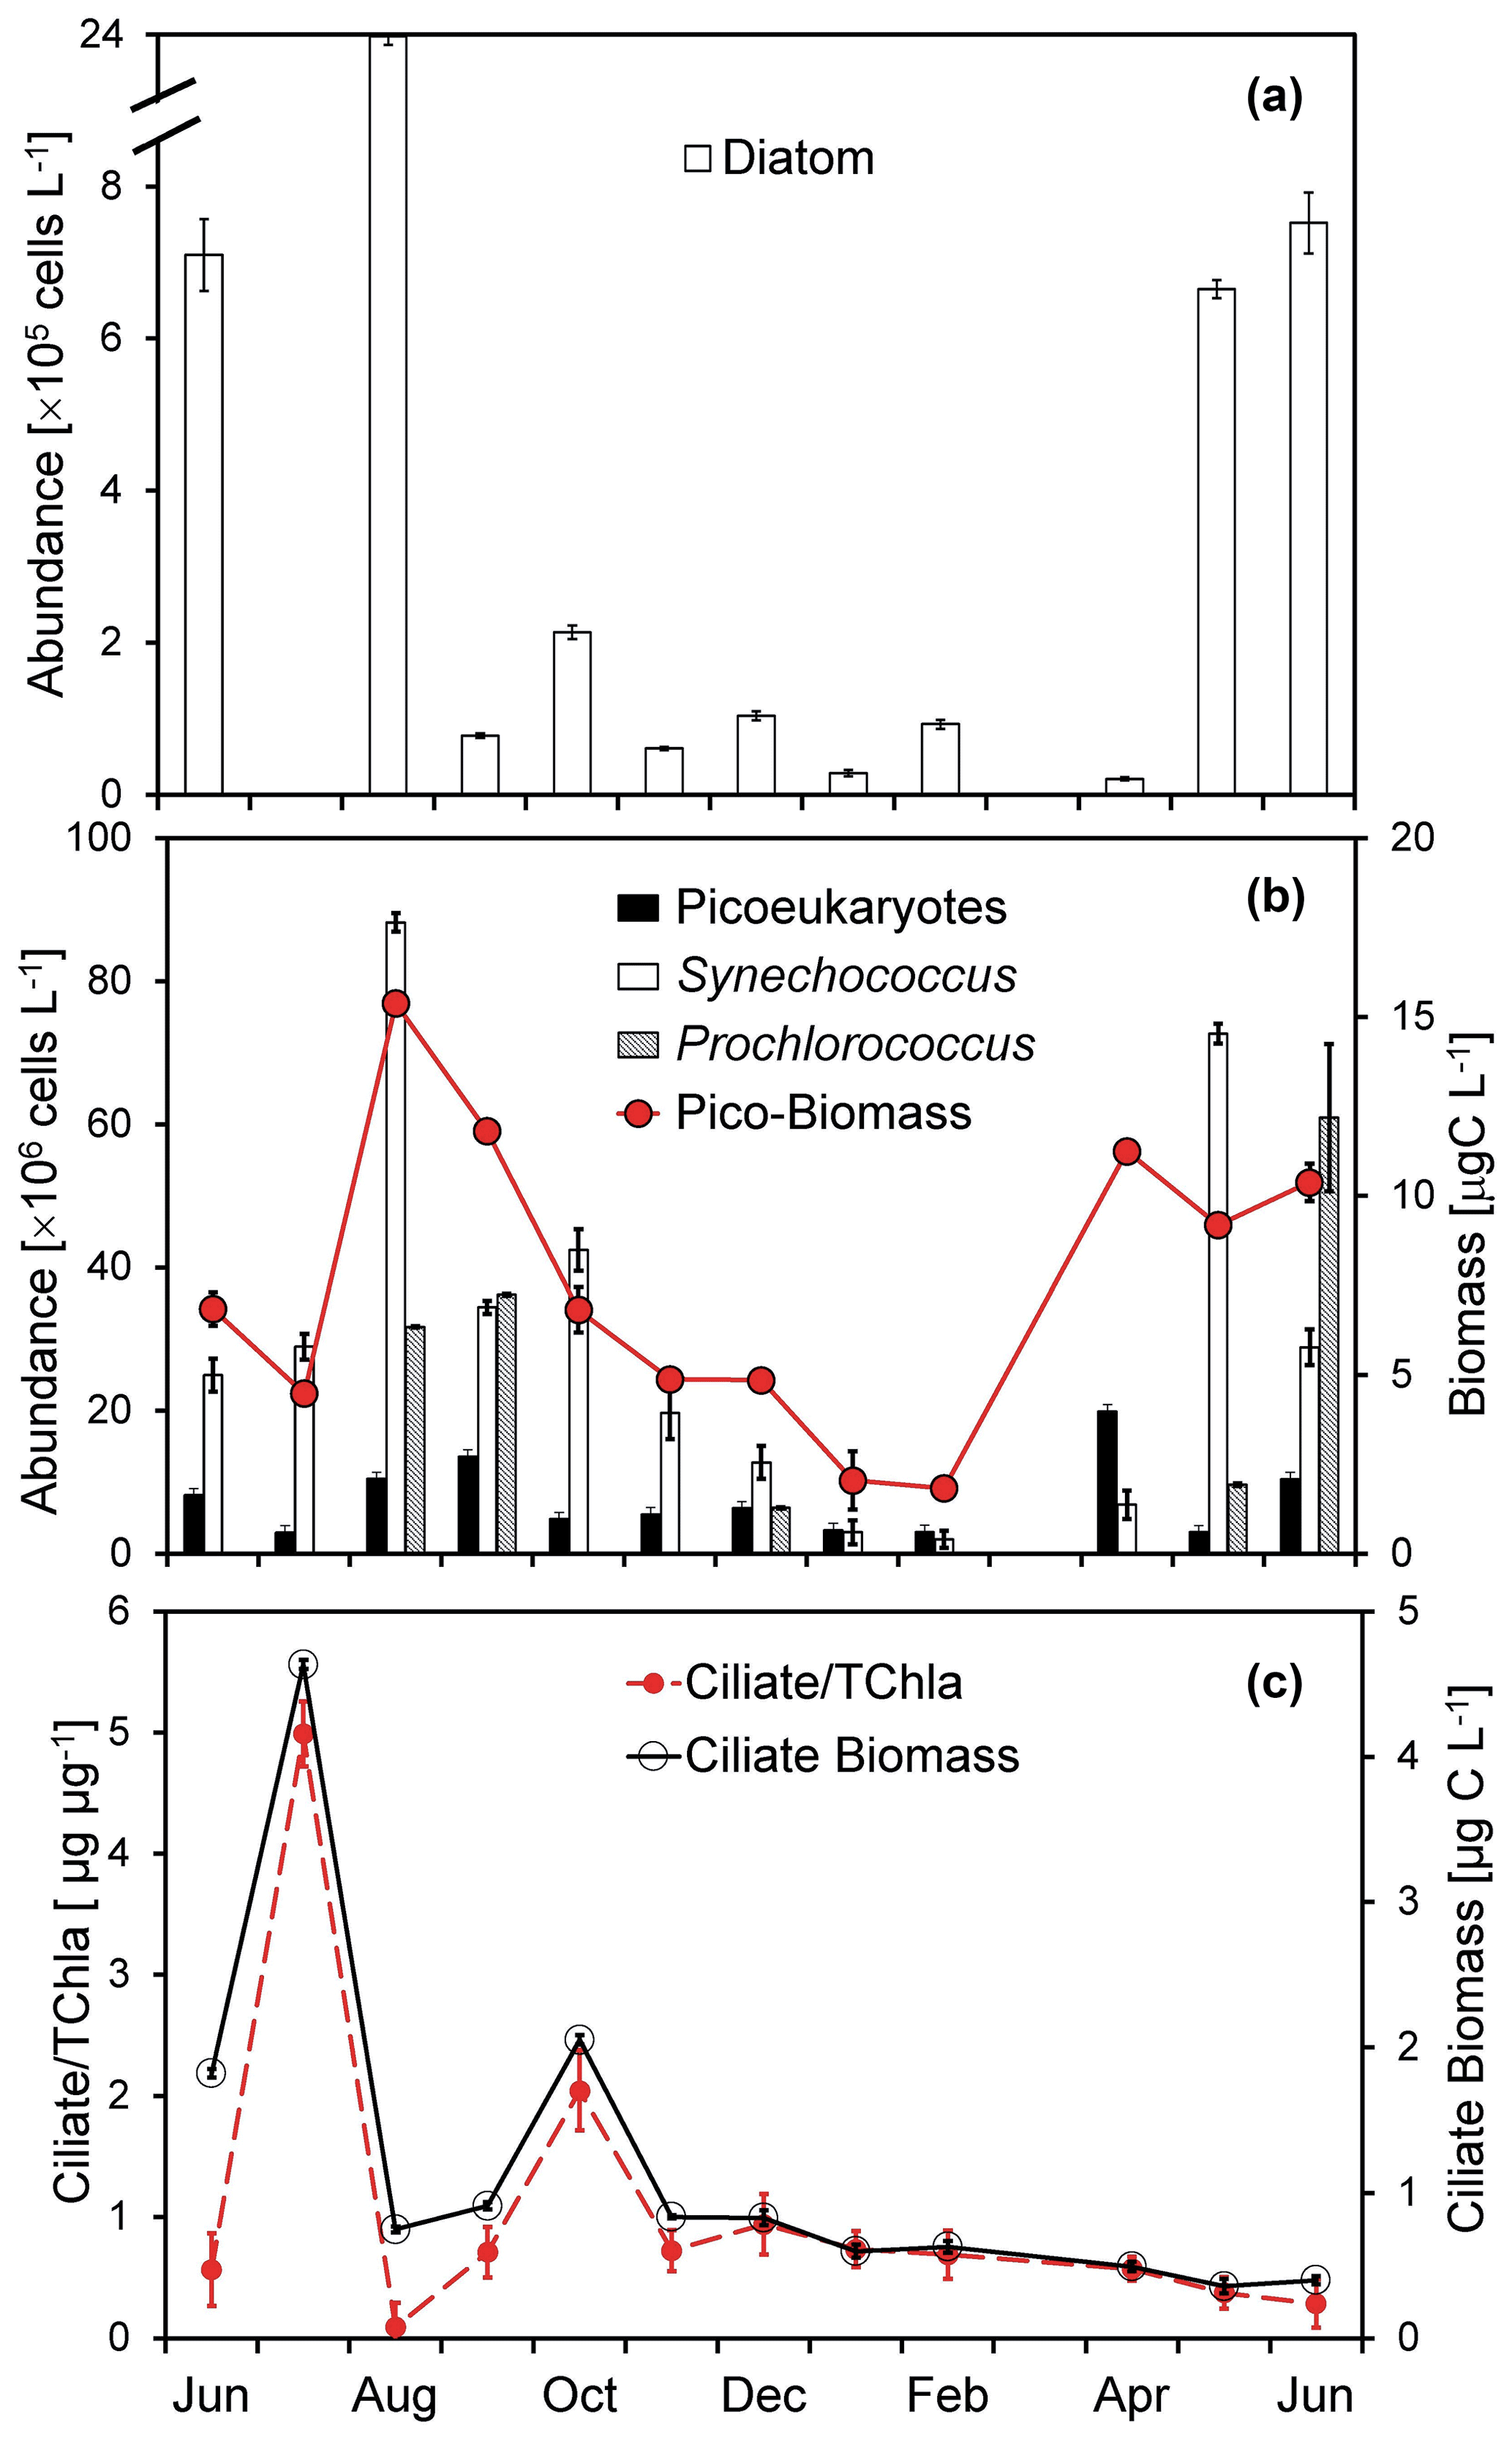
Figure 4Temporal changes of (a) diatom abundance, (b) Synechococcus and pico-eukaryote abundances, total picophytoplankton biomass, and (c) ciliate biomass and the ciliate-to-chlorophyll ratio of the surface water at the Wanshan station from June 2018 to June 2019. Error bars are standard deviations.
The abundance of diatoms, dominated by chain-forming taxa (mainly Skeletonema costatum and Staphylococcus spiralis) varies substantially from undetectable to 23.8 × 10⁵ cells L−1 during our study period (Fig. 4a). A seasonal change of diatom abundance was documented with a lower concentration in the winter but a high concentration in the summer. Consistent with that of the pico-sized chl a (Fig. 3a), there was a much higher picophytoplankton carbon biomass found in the summer than in the winter (Fig. 4b). Generally, Synechococcus dominated the picophytoplankton community most of the year, with an average abundance of 30.4 ± 26.7 × 10⁶ cells L−1. Prochlorococcus-like cells were mostly negligible through the 1-year study (Fig. 4b) except for some months during the summer with high nutrients but low salinity (Fig. 2b and c). Microzooplankton at the Wanshan station were dominated by ciliates (mostly aloricate ciliates and tintinnids; similar to Chen et al., 2009). There was a seasonal change of ciliates (Fig. 4c) with higher biomass found in July (4.6 µg C L−1) and October (2.1 µg C L−1).
3.3 Temporal change of phytoplankton growth and microzooplankton grazing rates
Figure S2 in the Supplement shows the typical results of the size-specific dilution experiments (only two representative months are shown due to the space limitation). Generally, a significant linear relationship between apparent growth rate and the dilution factors was acquired during our monthly dilution experiments. However, the dilution method could not apply to the experimental results of July and October 2018 when a positive slope of the dilution curve was found together with a very high ratio of ciliates over the total chl a (Fig. 4c). The natural growth rates during these two months could be estimated from the undiluted treatment assuming a zero grazing rate as suggested by Calbet and Saiz (2013) when a trophic cascade occurs in the dilution experiment due to omnivorous ciliates feeding on smaller carnivores.
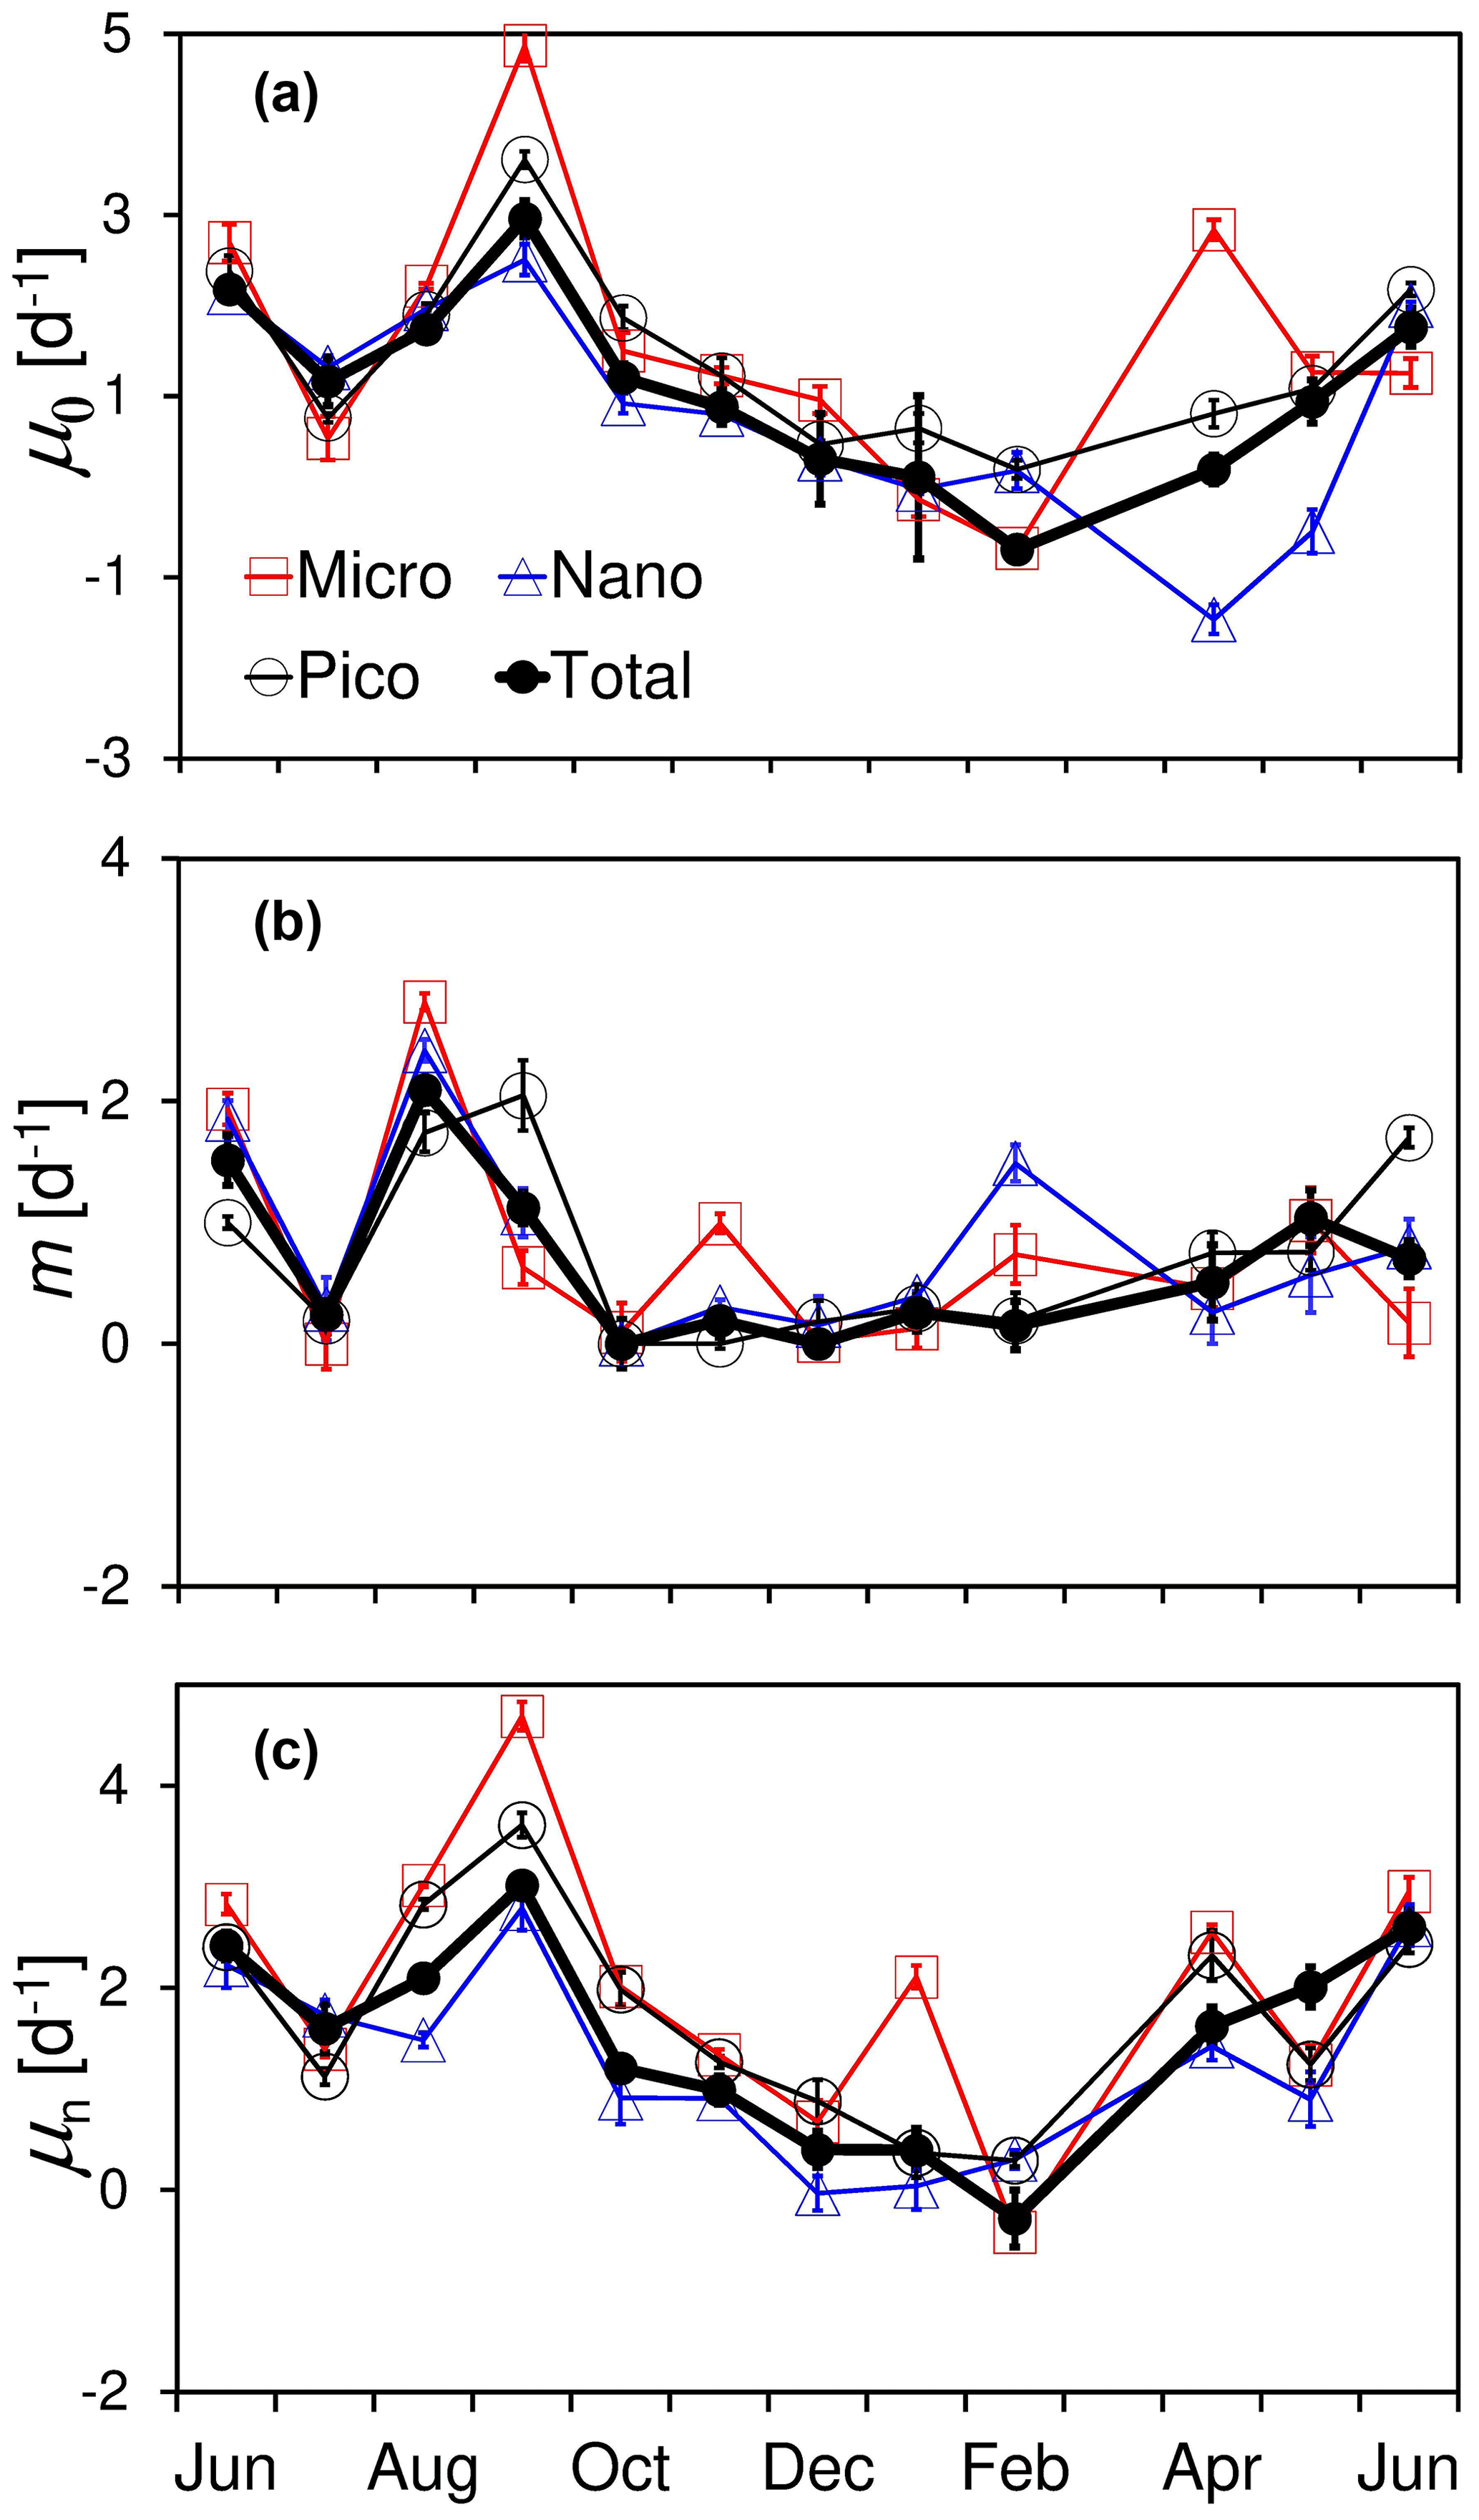
Figure 5Temporal variations in (a) natural phytoplankton growth rate (μ0), (b) microzooplankton grazing rate (m), and (c) nutrient-enriched phytoplankton growth rate (μn), as well as their size-fractionated components for micro-, nano-, and pico-cells at the Wanshan station from June 2018 to June 2019. Error bars are standard errors from dilution fits.
Results of all the monthly dilution experiments at the Wanshan station are shown in Fig. 5 and Table S2 in the Supplement. There were apparent seasonal differences in both growth and grazing rates during our observation period. Generally, we found higher rates in summer than spring and winter for both phytoplankton growth and microzooplankton grazing. Phytoplankton natural growth rate varied from −0.34 to 2.96 d−1 with an average of 1.09 ± 0.95 d−1 during the 1-year cycle (Fig. 5a). The negative rate of −0.34 d−1 was found in February with the lowest temperature and solar radiation, which however was barely different from zero (one-way ANOVA, p=0.24). Temporal change of grazing rate (m) was much different from that of natural growth rate, with the highest rate of ∼ 2.1 d−1 showing up in August (Fig. 5b). These were apparent decouplings between phytoplankton growth and microzooplankton grazing in August and September 2018.
Temporal variations in the size-fractioned growth and grazing rates generally followed the trends of total community, with higher rates in the summer but lower rates in the winter–spring. There was no general difference found among the natural growth rates of three phytoplankton size classes (p > 0.05) except April and May 2019. An elevated growth of micro-cells but a reduced growth of nano-cells was found in April 2019 compared to that of pico-cells (Fig. 5a). Also, there were large negative natural growth rates of nanophytoplankton during April and May 2019 (significantly different from zero, one-way ANOVA, p < 0.01), further discussed in the next section. There was an increase in microzooplankton grazing on pico-cells in September 2018 and June 2019 but on large cells in November and February 2018 (Fig. 5b). There were substantial increases in nutrient-enriched growth rate (μn) found in June, September, January, and April (Fig. 5c), which was consistent with the elevated nutrient concentrations in these months shown previously (Fig. 2c). Generally, the annual average of the nutrient-enriched growth rate (1.68 d−1) was higher than that of the natural growth rate (1.22 d−1), indicating a nutrient deficiency of phytoplankton even in this highly eutrophic system.
4.1 What controls the seasonal change of phytoplankton production?
Phytoplankton growth in the ocean can be influenced by several factors, such as temperature, light, nutrients, and community structure (e.g., Li et al., 2010). Temperature has been known as an important driver for phytoplankton growth (e.g., Eppley, 1972). The temperature effect on phytoplankton growth at the Wanshan station was evidenced by a strong correlation of the community growth rate (μ0) with the temperature (r=0.96, n=6, p < 0.01) during the period of October to April when salinity (and nutrients) fluctuated relatively less. The effect of light on phytoplankton growth at the Wanshan station was similar to that of temperature given the strong correlation between solar radiation and temperature.
Besides temperature and light, dissolved nutrients can also affect phytoplankton growth at the Wanshan station. During June–September 2018 when the water temperature was relatively constant, the community growth rate showed strong correlations with nutrients (r=0.95, n=4, p < 0.01 for nitrate) but not with other parameters, such as light and grazing. Nutrient limitation index () can be used to assess the degree of nutrient shortage for phytoplankton growth, with a lower value of less than 1 indicating a stronger nutrient limitation. The mean nutrient limitation index of for the whole community was about 0.9 ± 0.2 at the Wanshan station, suggesting that phytoplankton here were generally not limited by nutrients. This could very well explain the very similar patterns found between the nutrient-enriched growth rates (μn) and the natural growth rate (μ0) for the total phytoplankton community. A negative correlation of the natural growth rate with salinity during the 1-year cycle could be attributed to nutrients given the tight relationship between salinity and nutrients at the Wanshan station. We can simply divide the environmental variables into two independent groups based on their correlations with each other (Table S1), including temperature (light) and nutrients (salinity). The slow growth of the phytoplankton community (together with a low chl a level of < 1 µg L−1) in the winter was consistent with the low-temperature and the low-nutrient conditions. Thus, the interplay between the two groups of independent factors may be responsible for the seasonal change of phytoplankton growth during the 1 year.
It is surprising to find negative natural growth rates of nanophytoplankton during April and May 2019. The natural growth of nanophytoplankton was likely limited by nutrients since its growth was well promoted during the nutrient-enriched treatments (Fig. 5c). Moreover, a substantially high ratio during these two months suggested that phosphate was largely deficient relative to nitrate in these waters. Phosphorus limitation of nanophytoplankton may infer a disadvantage of nano-cells in competing for phosphorus resources with micro- and pico-cells. Recent studies suggested that picophytoplankton could store and liberate poly-phosphate to support high productivity in a low-phosphate environment (Li et al., 2019). Also, it has been well-known that microphytoplankton could use dissolved organic phosphorus to sustain growth and maintain a sufficient amount of biomass under P-depleted conditions (Girault et al., 2013). However, nanophytoplankton by itself tends to be limited by phosphorus compared to other size phytoplankton when a high ratio was observed. Therefore, a substantial difference in natural growth rate among the three size classes during April 2019 should reflect their different tolerance capacity to P deficiency.
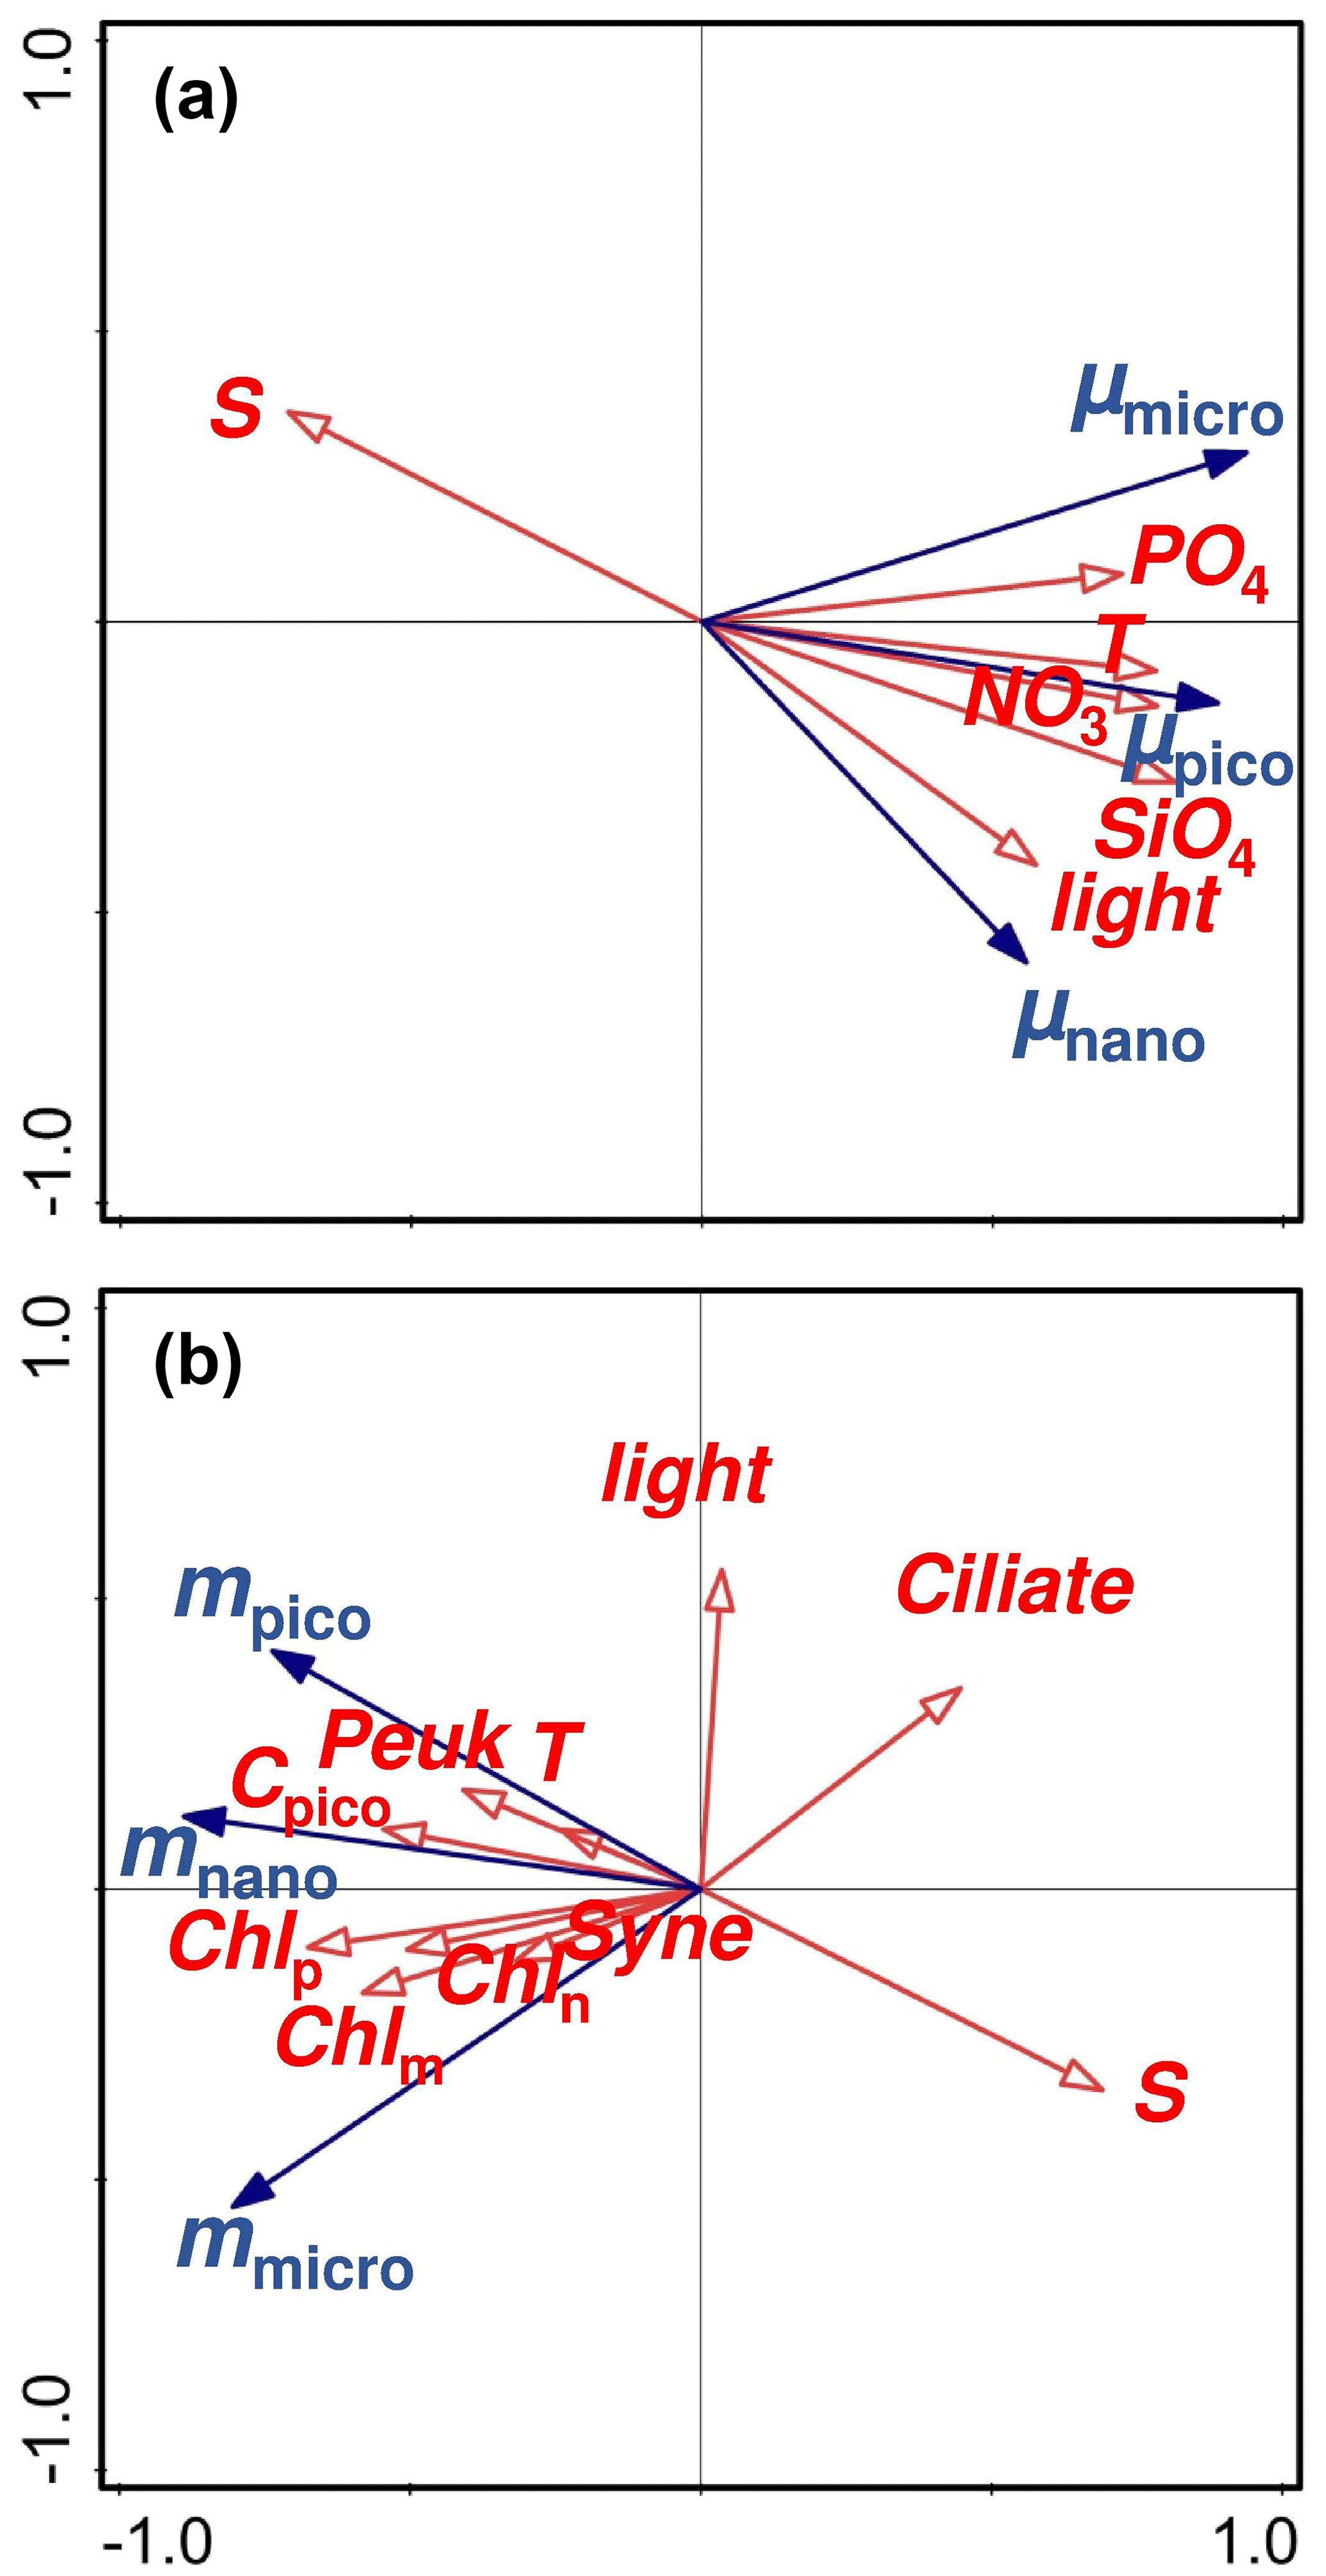
Figure 6Redundancy analyses (RDA) representing (a) the relationships of the size-fractionated phytoplankton growth rates (μmicro, μnano, and μpico) with various environmental variables and (b) the relationships of the size-fractionated microzooplankton grazing rates (mmicro, mnano, and mpico) with various environmental variables. Red arrows are environmental variables with blue arrows for rates; Chlm, Chln, and Chlp are the chlorophyll a concentrations of micro-, nano-, and pico-phytoplankton; Cpico is the picophytoplankton carbon biomass with Peuk for picoeukaryote and Syne for Synechococcus.
We use redundancy analyses (RDAs) to explore the factors controlling the size-fractionated growths of phytoplankton over the annual cycle (Fig. 6a). The first axis explains ∼ 69.63 % of the variance in natural growth rate with the second axis for ∼ 13.1 %, which should guarantee the validation of the RDA method in our study area. The statistical approach highlighted several important factors in driving the observed seasonal change in the size-fractionated phytoplankton growth rates, including temperature, light, and nutrients (Fig. 6a). Microphytoplankton growth seemed more influenced by phosphate than by other factors. This is consistent with the phosphorus control of large phytoplankton growth commonly found in the frontal zones near Wanshan (Li et al., 2018). A higher maximal growth rate together with a larger half-saturation constant will be an advantage for microphytoplankton growth (Dong et al., 2018) in response to an increase in P loading from river inputs in a P-deficient system with extremely high ratios. In contrast, picophytoplankton growth was primarily controlled by nitrate and temperature. This finding is also in good agreement with the previous reports that the growth rates of Synechococcus and picoeukaryotes would generally increase with temperature and nitrate concentrations in the coastal NSCS (Chen et al., 2014). Interestingly, we found nanophytoplankton was more controlled by light than the other factors. It has been suggested that phytoplankton growth on the west coast of Spitsbergen can be driven by solar irradiance on seasonal and inter-annual scales, as the cycles of warming and freshwater discharge in the coastal regions are primarily controlled by solar radiation (van de Poll et al., 2021). The dominant species of nanophytoplankton in the PRE region are small chain-forming diatoms, such as S. costatum and Thalassiosira spp., with chain lengths (or diameters of cell colonies) of less than 20 µm (Li et al., 2013). These small-sized chain-forming diatoms (nanophytoplankton) can grow first when light becomes not limiting in the eutrophic environment and are followed by larger species as nutrients are consumed (e.g., Guillard and Kilham, 1977).
4.2 Drivers for seasonal variability in microzooplankton grazing
We address the temporal change in the feeding strategy of microzooplankton by focusing on their grazing rates in the total phytoplankton community (m) as well as on various phytoplankton size classes (mmicro, mnano, and mpico). We present evidence for the size-selective prey preference of microzooplankton on small autotrophs, which may have a great impact on the temporal dynamics of the plankton community in the coastal ocean.
Generally, microzooplankton grazing (m) at the Wanshan station varied substantially on an annual cycle in response to change in phytoplankton concentration and composition. Surprisingly, we find a zero grazing rate in July when the temperature is high, despite a positive correlation between community grazing rate and temperature (r=0.62, n=12, p < 0.05). In addition, extensive modulation of grazing rate was observed during June–September 2018, when the water temperature was mostly constant. The temperature effect on microzooplankton grazing may not be straightforward (Rose and Caron, 2007). It should be pointed out that the temperature sensitivity of microzooplankton grazing could have been masked in our monthly data given the large fluctuation of grazing rate over a wide range of chl a levels. Though other environmental factors such as light and nutrients may likely be relevant to grazing rates in the coastal ocean (Chen et al., 2009), these relationships were not supported by our direct linear regression analyses at the Wanshan station (Table S1).
Our results support the density-dependent prey ingestion kinetics found in laboratory culture experiments (e.g., Holling, 1959), as evidenced by a significant correlation of the community grazing rate with the total phytoplankton chl a concentration (r=0.82, n=12, p < 0.01). Based on the classic Holling II grazing model, a positive correlation between microzooplankton grazing rate and phytoplankton standing stock may occur during non-saturated feeding (Dong et al., 2018). However, size-dependent selectivity of microzooplankton grazers on phytoplankton prey can affect the community grazing activity, resulting in decoupling between resident grazers and prey (Poulin and Franks, 2010). In this case, grazer biomass alone may not accurately reflect community grazing rates (Menden-Deuer et al., 2018). This was likely the case at the Wanshan station when the community grazing rate was poorly explained by the ciliate biomass.
Redundancy analyses were also employed to address the linkages between the size-fractionated grazing rates and the environmental variables (Fig. 6b), with the first axis accounting for ∼ 69.4 % and the second axis for ∼ 12.8 % of the variance. The grazing mortality rate of nano-cells was more correlated to picoplankton biomass as well as all the size-fractionated chl a concentrations than the other factors. This result is consistent with the significant correlation between community grazing rate and total chl a mentioned in the previous paragraph since nano-phytoplankton was the dominant size class at the Wanshan station. Interestingly, the grazing rate on micro-cells was negatively influenced by the ciliate abundance. A reverse correlation of ciliate with the grazing rate (mmicro) could be explained by selective grazing of microzooplankton on nano- and pico-phytoplankton community (this will be further discussed in the next few paragraphs). Finally, we found a negative correlation of salinity with the grazing rate on picophytoplankton. It has been suggested that small herbivores, such as heterotrophic nano-flagellates, would preferentially graze on picoplankton (Christaki et al., 2001), although they are more sensitive to salinity change in mesotrophic coastal waters (Jolliff et al., 2012). A negative correlation of salinity with the abundance of smaller zooplankton in the Jiaozhou Bay of the South Yellow Sea has been attributed to the discharge of eutrophic freshwater (Wang et al., 2020). This may likely also be true at the Wanshan station given the negative correlation between salinity and nutrients. Therefore, the input of low-salinity and high-nutrient water stimulates phytoplankton growth and thus the growth of zooplankton grazing on them.
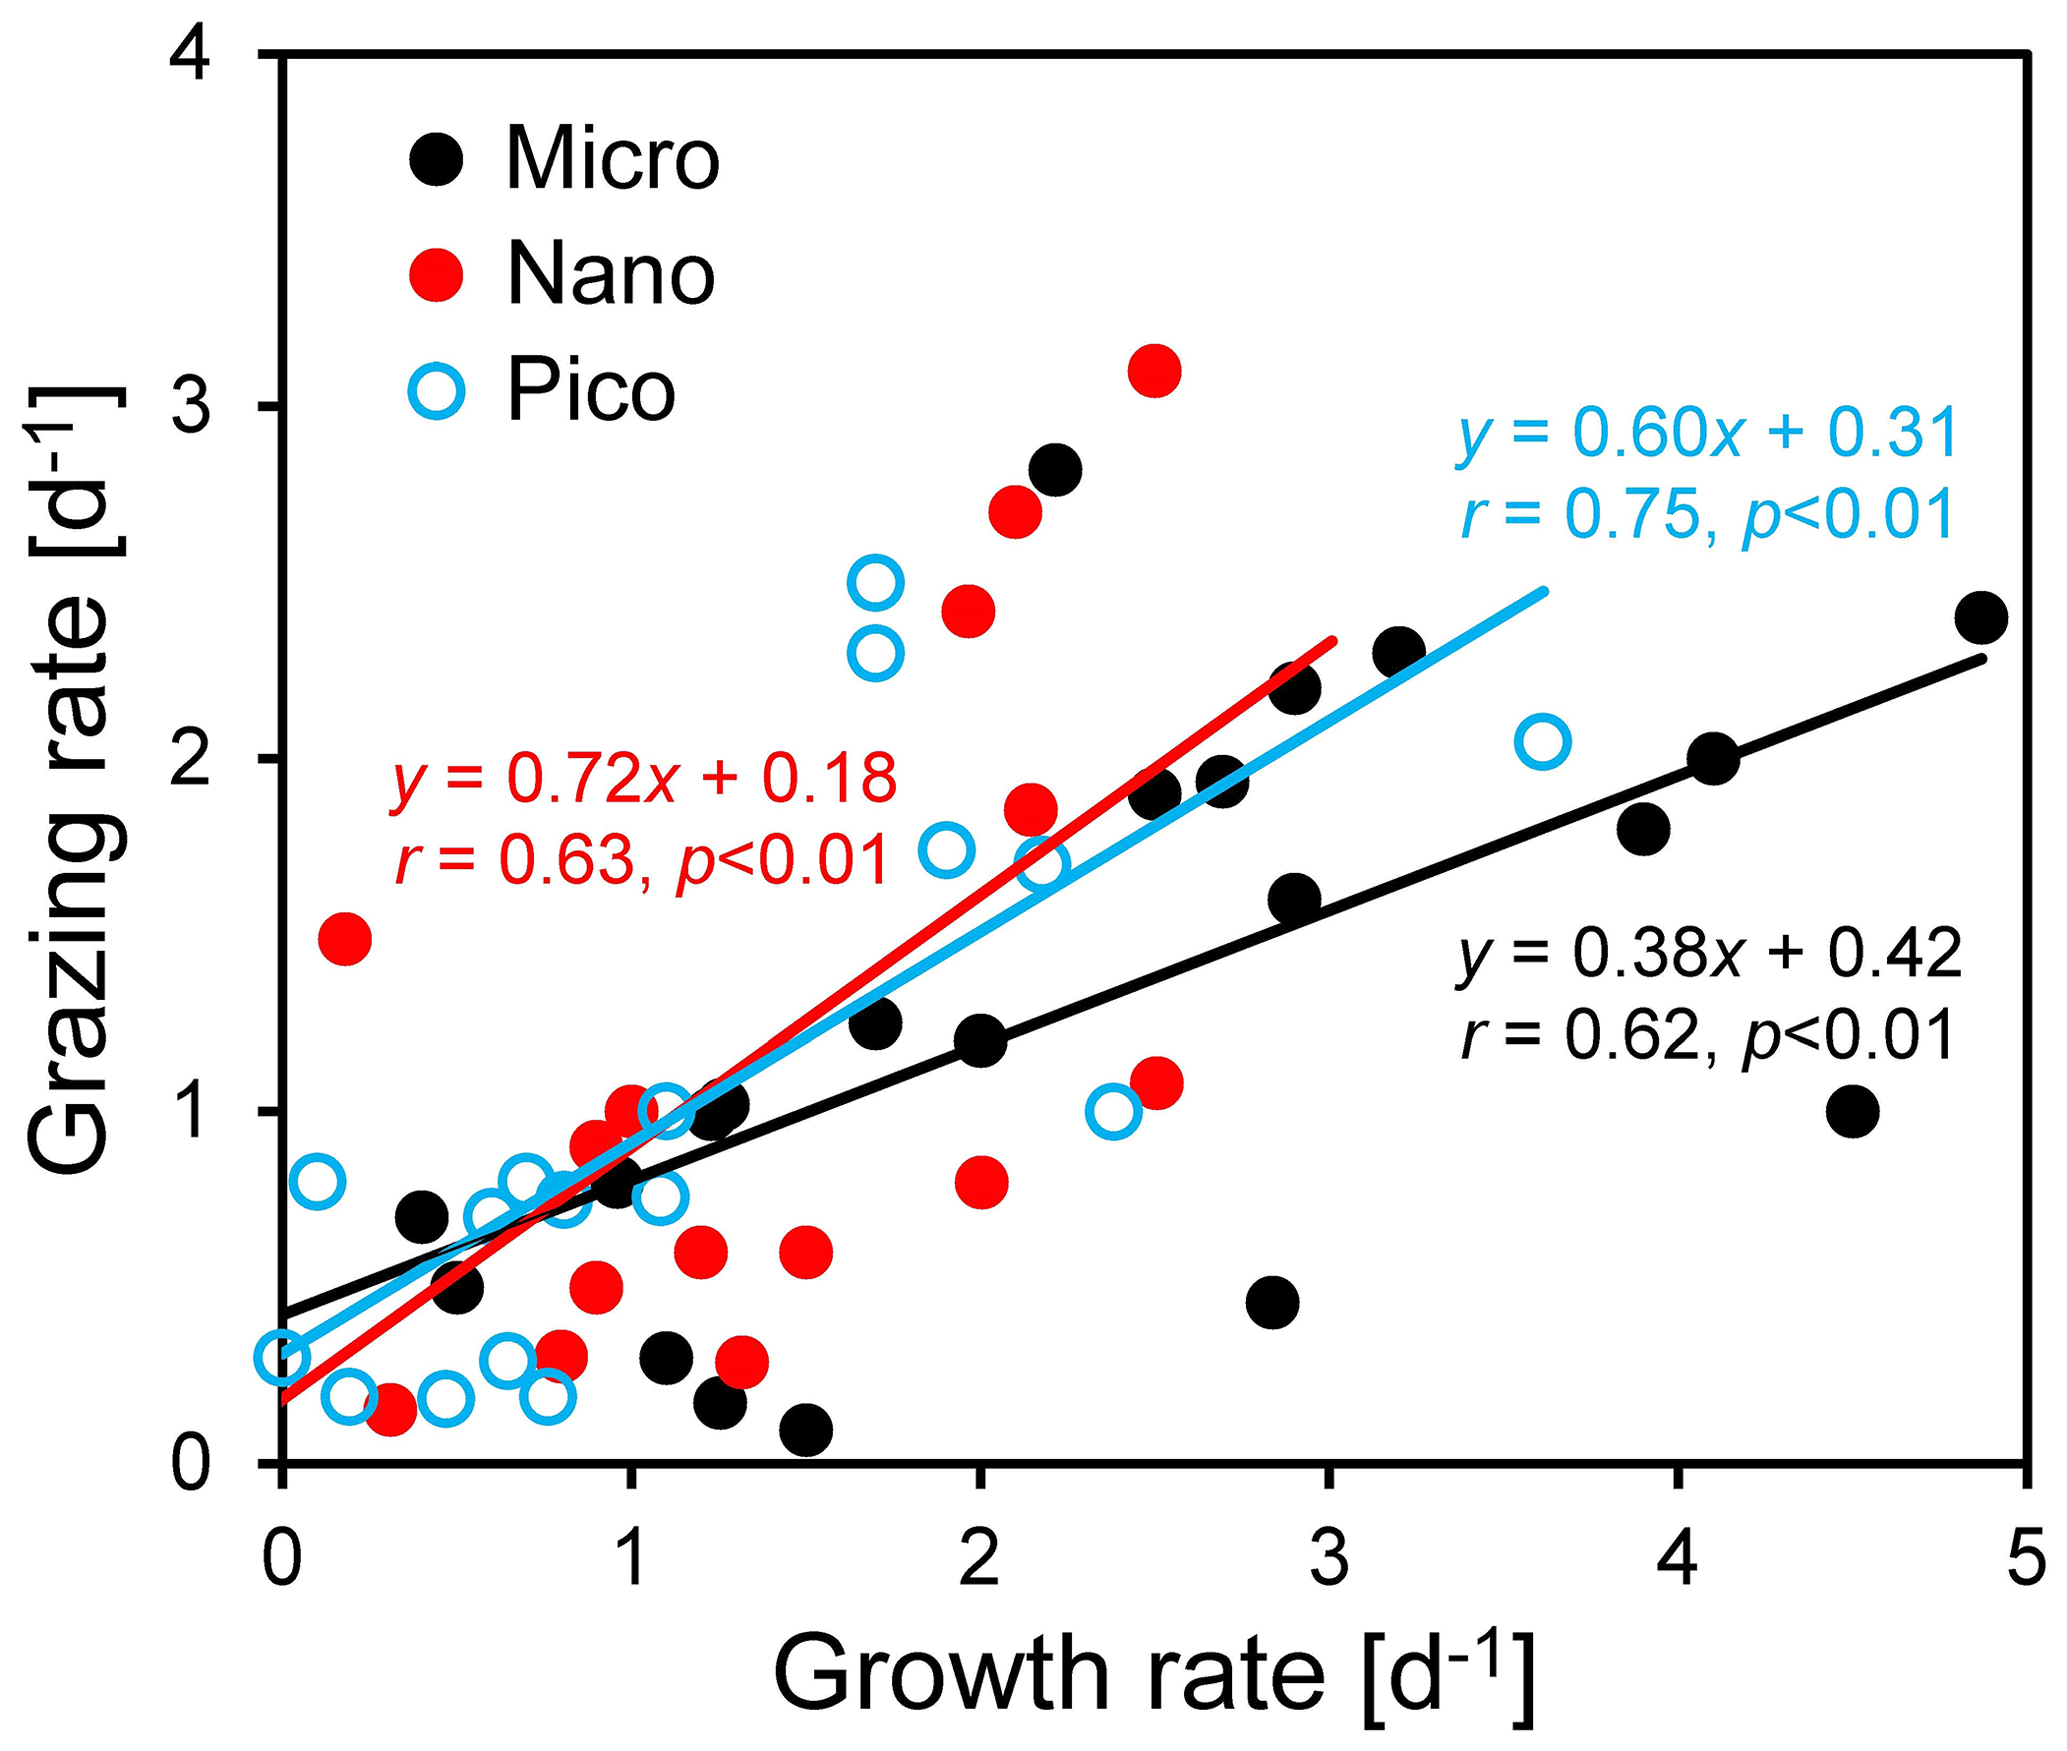
Figure 7Regressions between natural phytoplankton growth rate and microzooplankton grazing rate for micro-, nano-, and pico-cells in the coastal northern South China Sea outside the Pearl River estuary. Note that negative rates have been excluded from the regression.
We found that microzooplankton grazing was an important pathway for phytoplankton loss, although there was a large difference among the three size classes (Fig. 7). On average, microzooplankton consumed ∼ 38 % of microphytoplankton production (r=0.62, n=21, p < 0.01), much lower than that of ∼ 72 % for nanophytoplankton (r=0.63, n=15, p < 0.01) and ∼ 60 % for picophytoplankton (r=0.75, n=17, p < 0.01) (Fig. 7). Our results for nano- and picophytoplankton are consistent with those of 60 %–75 % reported in the global ocean (Calbet and Landry, 2004). A low value for microphytoplankton suggests that additional processes not captured by the dilution technique, such as mesozooplankton grazing, may be important for phytoplankton loss. Mesozooplankton (> 200 µm) prefer large phytoplankton (such as dinoflagellates and diatoms) for prey, although their contribution to grazing is typically less than microzooplankton (Steinberg and Landry, 2017; Calbet and Landry 1999; Karu et al., 2020). Mesozooplankton generally consume ∼ 12 % of the primary production (Calbet 2001; Liu et al., 2010), with a large variability of 0.7 %–31 % in the coastal waters near the PRE (Chen et al., 2015). Higher grazing on nano- and pico-cells compared to micro-cells may indicate size-selective feeding of microzooplankton on small cells. This result is contradictory to the previous finding of no size-selective grazing in the coastal waters west of Hong Kong (Lie and Wong, 2010). Meanwhile, it is consistent with our finding of a high abundance of large-chain-forming diatoms at the Wanshan station, which can effectively avoid grazing by microzooplankton and copepods due to their chain length plasticity (Bergkvist et al., 2012).
Monthly grazing impact () at the Wanshan station reveals a seasonal change of size-selective prey preference of microzooplankton, with increased grazing on nanophytoplankton during the winter–spring period (Fig. S3 in the Supplement). Large aloricate ciliates (30–50 µm), the dominant micrograzers in our system, are the major consumers of nanoplankton (Bernard and Rassoulzadegan, 1990). Increased ingestion of aloricate ciliates on phototrophic nanoflagellates during the winter with lower nanoplankton biomass and productivity has been reported in the coastal waters off Chile (Vargas and Martinez, 2009). Our results are also consistent with the previous finding in the Southern Ocean that microzooplankton preferentially graze on the nano- and pico-phytoplankton during the winter when the community was dominated by small cells (Froneman and Perissinotto, 1996). Alternatively, it has also been suggested that an increase in grazing on small autotrophs may be caused by microzooplankton growth due to the artifact of removing mesozooplankton from the incubations (Schmoker et al., 2013; Calbet and Saiz, 2013). Meanwhile, this effect should be negligible here since mesozooplankton were barely present in our 200 µm screen during the 1-year field study.
A seasonal change in size-selective feeding of microzooplankton may be crucial for understanding food web dynamics and the carbon cycle of the coastal ocean. It has been well recognized that temporal change of phytoplankton community structure can be regulated by size-selective herbivory of microzooplankton (Strom et al., 2007; Haraguchi et al., 2018). In addition, an enhanced export production may occur when large phytoplankton such as diatoms can escape from grazing by micrograzers due to size-selective prey preference on small cells (e.g., Froneman and Perissinotto 1996). Furthermore, nutrient recycling within the microbial food web can be influenced by selective grazing of microplankton on heterotrophic bacterioplankton (Christaki et al., 2001; Unrein et al., 2007). On the other hand, our results may also be important for ecosystem and biogeochemical modeling. Previous results suggest that inaccurate representation of microzooplankton grazing and their prey selection can cause deficiencies of these models and cast doubts on the results of their predictions (e.g., Li et al., 2011; Sailley et al., 2015). In this sense, our finding of seasonal variability of size-selective grazing and its controlling factors should be crucial for not only the parameterization of grazing models but also the prediction of the shifts in the plankton community structure in response to future climate change.
By statistically analyzing the relationships between plankton rates and environmental variables through 1 year at a coastal station outside a eutrophic estuary, we explore the underlying mechanisms controlling the monthly change of phytoplankton growth and microzooplankton grazing. We find that the temporal change in environmental parameters including light, temperature, nitrate, and phosphate could have distinct impacts on the growth of different phytoplankton size classes. Also, the grazing mortalities of various phytoplankton size classes could be related to different factors, including salinity, phytoplankton standing stock, and ciliate abundance. Moreover, selective grazing of microzooplankton on small cells may be important for maintaining a high abundance of large-chain-forming diatoms in this eutrophic system. In summary, our results suggested that both the bottom-up and the top-down factors can interact together to control the growth and grazing mortality of phytoplankton of various sizes.
Our 1-year time series study should offer valuable insights into the seasonal change and the interplay of various environmental factors in controlling plankton population dynamics in the studied area. In addition, our findings of seasonal variabilities in plankton rates and their regulating mechanisms may be important for ocean biogeochemical modeling to accurately account for the carbon flows within the microbial food web and to better predict biological responses to future climate change.
Some of the data used in the present study are available in the Supplement. Other data analyzed in this article are available at the National Earth System Science Data Center, China (http://data.scsio.ac.cn/metaData-detail/1405396650095489024, Li, 2021).
The supplement related to this article is available online at: https://doi.org/10.5194/bg-18-6423-2021-supplement.
YD conducted the investigation and methodology, used the software, and wrote the original draft. QPL provided supervision, visualization, investigation, conceptualization, methodology, data curation, writing, reviewing and editing, and funding acquisition. ZW, YS, ZL, ZG, WZ, and YC helped in the investigation. All authors have given approval to the final version of the paper.
The contact author has declared that neither they nor their co-authors have any competing interests.
Publisher's note: Copernicus Publications remains neutral with regard to jurisdictional claims in published maps and institutional affiliations.
We would like to thank Guanghui Li for field assistance as well as the editor and reviewers for constructive comments.
This research has been supported by the National Natural Science Foundation of China (grant nos. 41906132, 41676108, 41706181), the Guangdong Province Special Supporting Plan for Leading Talent (grant no. 2019TX05H216), the Key Special Project for Introduced Talents Team of Southern Marine Science and Engineering Guangdong Laboratory (Guangzhou) (grant no. GML2019ZD0305).
This paper was edited by Koji Suzuki and reviewed by three anonymous referees.
Anderson, S. R. and Harvey, E. L.: Seasonal variability and drivers of microzooplankton grazing and phytoplankton growth in a subtropical estuary, Front. Mar. Sci., 6, 174, https://doi.org/10.3389/fmars.2019.00174, 2019.
Bergkvist, J., Thor, P., Jakobsen, H. H., Wängberg, S., and Selander, E.: Grazer-induced chain length plasticity reduces grazing risk in a marine diatom, Limnol. Oceanogr., 57, 318–324, https://doi.org/10.4319/lo.2012.57.1.0318, 2012.
Bernard, C. and Rassoulzadegan, F.: Bacteria or microflagellates as a major food source for marine ciliates: possible implications for the microzooplankton, Mar. Ecol. Prog. Ser., 64, 147–155, https://doi.org/10.3354/meps064147, 1990.
Calbet, A.: Mesozooplankton grazing effect on primary production: A global comparative analysis in marine ecosystems, Limnol. Oceanogr., 7, https://doi.org/10.4319/lo.2001.46.7.1824, 2001.
Calbet, A. and Landry, M. R.: Mesozooplankton influences on the microbial food web: Direct and indirect trophic interactions in the oligotrophic open ocean, Limnol. Oceanogr., 6, https://doi.org/10.4319/lo.1999.44.6.1370, 1999.
Calbet, A. and Landry, M. R.: Phytoplankton growth, microzooplankton grazing, and carbon cycling in marine systems, Limnol. Oceanogr., 49, 51–57, https://doi.org/10.4319/lo.2004.49.1.0051, 2004.
Calbet, A. and Saiz, E.: Effects of trophic cascades in dilution grazing experiments: from artificial saturated feeding responses to positive slopes, J. Plankton Res., 35, 1183–1191, https://doi.org/10.1093/plankt/fbt067, 2013.
Chen, B. Z., Liu, H. B., Landry, M. R., Chen, M. R., Sun, J., Shek, L., Chen, X., and Harrison. P. J.: Estuarine nutrient loading affects phytoplankton growth and microzooplankton grazing at two contrasting sites in Hong Kong coastal waters, Mar. Ecol. Prog. Ser., 379, 77–90, https://doi.org/10.3354/meps07888, 2009.
Chen, B. Z, Laws, E. A., Liu, H. B., and Huang, B. Q.: Estimating microzooplankton grazing half-saturation constants from dilution experiments with nonlinear feeding kinetics, Limnol. Oceanogr., 59, 639–644, https://doi.org/10.4319/lo.2014.59.3.0639, 2014.
Chen, M. R., Liu, H. B, Song, S. Q., and Sun, J.: Size-fractionated mesozooplankton biomass and grazing impact on phytoplankton in northern South China Sea during four seasons, Deep-Sea Res. Pt. II, 117, 108–118, https://doi.org/10.1016/j.dsr2.2015.02.026, 2015.
Christaki, U., Giannakourou, A., Wambeke, F. V., and Grégori, G.: Nanoflagellate predation on auto-and heterotrophic picoplankton in the oligotrophic Mediterranean Sea, J. Plankton Res., 23, 1297–1310, https://doi.org/10.1093/plankt/23.11.1297, 2001.
Cloern, J. E., Foster, S. Q., and Kleckner, A. E.: Phytoplankton primary production in the world's estuarine-coastal ecosystems, Biogeosciences, 11, 2477–2501, https://doi.org/10.5194/bg-11-2477-2014, 2014.
Dong, Y., Li, Q. P., Liu, Z. J., Wu, Z. C., and Zhou, W. W.: Size-dependent phytoplankton growth and grazing in the northern South China Sea, Mar. Ecol. Prog. Ser., 599, 35–47, https://doi.org/10.3354/meps12614, 2018.
Eppley, R. W.: Temperature and phytoplankton growth in the sea, Fish. B.-NOAA, 70, 1063–1086, 1972.
Froneman, P. and Perissinotto, R.: Microzooplankton grazing in the Southern Ocean: implications for the carbon cycle, Mar. Ecol., 17, 99–115, https://doi.org/10.1111/j.1439-0485.1996.tb00493.x, 1996.
Gan, J. P., Lu, Z. M., Dai, M. H., Cheung, A. Y. Y., Liu, H. B., and Harrison, P.: Biological response to intensified upwelling and to a river plume in the northeastern South China Sea: A modeling study, J. Geophys. Res., 115, C09001, https://doi.org/10.1029/2009JC005569, 2010.
Garrison, D. L., Gowing, M. M., Hughes, M. P., Campbell L., Caron D. A., Dennett, M. R., Shalapyonok, A., Olson, R. J., Landry, M. R., Brown, S. L., Liu, H. B., Azam, F., Steward, G. F., Ducklow, H. W., and Smith, D. C.: Microbial food web structure in the Arabian Sea: a US JGOFS study, Deep-Sea Res. Pt. II, 47, 1387–1422, https://doi.org/10.1016/S0967-0645(99)00148-4, 2000.
Girault, M., Arakawa, H., and Hashihama, F.: Phosphorus stress of microphytoplankton community in the western subtropical North Pacific, J. Plankton Res., 35, 146–157, https://doi.org/10.1093/plankt/fbs076, 2013.
Guillard, R. R. L. and Kilham, P.: The ecology of marine plankton diatoms, in: The Biology of Diatoms, editd by: Werner, D., University California Press, Berkeley, 372–469, 1977.
Hansen, H. P. and Koroleff, F.: Determination of dissolved inorganic phosphate, in: Methods of seawater analysis, edited by: Grasshoff, K., Kremling, K., and Ehrhardt, M., John Wiley and Sons, 159–228, https://doi.org/10.1002/9783527613984.ch10, 1999.
Haraguchi, L., Jakobse, H. H., Lundholm, N., and Carstensen, J.: Phytoplankton community dynamic: a driver for ciliate trophic strategies, Front. Mar. Sci., 5, 272, https://doi.org/10.3389/fmars.2018.00272, 2018.
Holling, C. S.: Some characteristics of simple types of predation and parasitism, Can. Entomol., 91, 385–398, 1959.
Ichinotsuka, D., Ueno, H., and Nakano, S.: Relative importance of nanoflagellates and ciliates as consumers of bacteria in a coastal sea area dominated by oligotrichous Strombidium and Strobilidium, Aquat. Microb. Ecol., 42, 139–147, https://doi.org/10.3354/ame042139, 2006.
Jolliff, J. K., Smith, T. A., Barron, C. N., deRada, S., Anderson, S. C., Gould, R. W., and Arnone, R.: The impact of coastal phytoplankton blooms on ocean-atmosphere thermal energy exchange: Evidence from a two-way coupled numerical modeling system, Geophys. Res. Lett., 39, L24607, https://doi.org/10.1029/2012GL053634, 2012.
Karu, F., Kobari, T., Honma, T., Kanayama, T., Suzuki, K., Yoshie, N., and Kume, G.: Trophic sources and linkages to support mesozooplankton community in the Kuroshio of the East China Sea, Fish. Oceanogr., 29, 442–456, https://doi.org/10.1111/fog.12488, 2020.
Landry, M. R. and Hassett, R. P.: Estimating the grazing impact of marine micro-zooplankton, Mar. Biol., 67, 283–288, https://doi.org/10.1007/bf00397668, 1982.
Landry, M. R., Monger, B. C., and Selph, K. E.: Time-dependency of microzooplankton grazing and phytoplankton growth in the subarctic Pacific, Prog. Oceanogr., 32, 205–222, https://doi.org/10.1016/0079-6611(93)90014-5, 1993.
Landry, M. R., Ohman, M. D., Goericke, R., Stukel, M. R., and Tsyrklevich, K.: Lagrangian studies of phytoplankton growth and grazing relationships in a coastal upwelling ecosystem off Southern California, Prog. Oceanogr., 83, 208–216, https://doi.org/10.1016/j.pocean.2009.07.026, 2009.
Li, J., Plouchart, D., Zastepa, A., and Dittrich, M.: Picoplankton accumulate and recycle polyphosphate to support high primary productivity in coastal Lake Ontario, Sci. Rep., 9, 19563, https://doi.org/10.1038/s41598-019-56042-5, 2019.
Li, L., Lv, S. H., Jiang, T., and Li. X.: Seasonal variation of size-fractionated phytoplankton in the Pearl River estuary, Chinese Sci. Bull., 58, 2303–2314, https://doi.org/10.1007/s11434-013-5823-1, 2013.
Li, Q. P.: Monthly grazing rates of microzooplankton outside Pearl River estuary, available at: http://data.scsio.ac.cn/metaData-detail/1405396650095489024 [data set], last access: 14 December 2021.
Li, Q. P., Franks, P. J. S. Landry M. R., Goericke R., and Taylor, A. G.: Modeling phytoplankton growth rates and chlorophyll to carbon ratios in California coastal and pelagic ecosystems, J. Geophys. Res., 115, G04003, https://doi.org/10.1029/2009JG001111, 2010.
Li, Q. P., Franks, P. J. S., and Landry, M. R.: Microzooplankton grazing dynamics: parameterizing grazing models with dilution experiment data in the Southern California Ecosystem, Mar. Ecol. Prog. Ser., 438, 59–69, https://doi.org/10.3354/meps09320, 2011.
Li, Q. P., Franks, P. J. S., Ohman, M. D., and Landry, M. R.: Enhanced nitrate fluxes and biological processes at a frontal zone in the southern California current system, J. Plankton Res., 34, 790–801, https://doi.org/10.1093/plankt/fbs006, 2012.
Li, Q. P., Zhou, W., Chen, Y., and Wu, Z.: Phytoplankton response to a plume front in the northern South China Sea, Biogeosciences, 15, 2551–2563, https://doi.org/10.5194/bg-15-2551-2018, 2018.
Lie, A. A. Y. and Wong, C. K.: Selectivity and grazing impact of microzooplankton on phytoplankton in two subtropical semi-enclosed bays with different chlorophyll concentrations, J. Exp. Mar. Biol. Ecol., 390, 149–159, https://doi.org/10.1016/j.jembe.2010.05.001, 2010.
Liu, H., Chen, M., Suzuki, K., Wong, C. K., and Chen, B.: Mesozooplankton selective feeding in subtropical coastal waters as revealed by HPLC pigment analysis, Mar. Ecol. Prog. Ser., 407, 111–123, https://doi.org/10.3354/meps08550, 2010.
Menden-Deuer, S., Lawrence, C., and Franzè, G.: Herbivorous protist growth and grazing rates at in situ and artificially elevated temperatures during an Arctic phytoplankton spring bloom, PeerJ, 6, e5264, https://doi.org/10.7717/peerj.5264, 2018.
Parsons, T. R, Maita, Y., and Lalli, C. M.: A Manual of Chemical and Biological Methods for Seawater Analysis, Elsevier, New York, 1984.
Poulin, F. J. and Franks, P. J. S.: Size-structured planktonic ecosystems: constraints, controls and assembly instructions, J. Plankton Res., 32, 1121–1130, https://doi.org/10.1093/plankt/fbp145, 2010.
Putt, M. and Stoecker, D. K.: An experimentally determined carbon:volume ration for marine “oligotrichous” ciliates from estuarine and coastal waters, Limnol. Oceanogr., 34, 1097–1103, 1989.
Rose, J. M. and Caron, D. A.: Does low temperature constrain the growth rates of heterotrophic protists? Evidence and implications for algal blooms in cold waters, Limnol. Oceanogr., 52, 886–895. https://doi.org/10.4319/lo.2007.52.2.0886, 2007.
Sailley, S. F., Polimene, L., Mitra, A., Atkinson, A., and Allen, J. I.: Impact of zooplankton food selectivity on plankton dynamics and nutrient cycling, J. Plankton Res., 37, 519–529, https://doi.org/10.1093/plankt/fbv020, 2915.
Schmoker, C., Hernandez-Leon, S., and Calbet, A.: Microzooplankton grazing in the oceans: impacts, data variability, knowledge gaps and future directions, J. Plankton Res., 35, 691–706, https://doi.org/10.1093/plankt/fbt023, 2013.
Shuai, Y., Li, Q. P., and Wu, Z.: Biogeochemical responses to nutrient fluxes in the open South China Sea: a 3-D modeling study, J. Geophys. Res., 126, e2020JC016895, https://doi.org/10.1029/2020JC016895, 2021.
Steinberg, D. K. and Landry, M. R.: Zooplankton and the ocean carbon cycle, Annu. Rev. Mar. Sci., 9, 413–444, https://doi.org/10.1146/annurev-marine-010814-015924, 2017.
Strom, S. L., Macri, E. L., and Olson, M. B.: Microzooplankton grazing in the coastal Gulf of Alaska: Variations in top-down control of phytoplankton, Limnol. Oceanogr., 52, 1480–94, https://doi.org/10.4319/lo.2007.52.4.1480, 2007.
Unrein, F., Massana, R., Alonso-Sáez, L., and Gasol, J. M.: Significant year-round effect of small mixotrophic flagellates on bacterioplankton in an oligotrophic coastal system, Limnol. Oceanogr., 52, 456–469, https://doi.org/10.4319/lo.2007.52.1.0456, 2007.
Utermöhl, H.: Zur vervolkomnung der quantitative Phytoplankton-Methodik, Int. Ver. The., 9, 1–38, https://doi.org/10.1080/05384680.1958.11904091, 1958.
van de Poll, W. H., Maat, D. S., Fischer, P., Visser, R. J. W., Brussaard, C. P. D., and Buma, A. G. J.: Solar radiation and solar radiation driven cycles in warming and freshwater discharge control seasonal and inter-annual phytoplankton chlorophyll a and taxonomic composition in a high Arctic fjord (Kongsfjorden, Spitsbergen), Limnol. Oceanogr., 66, 1221–1236, https://doi.org/10.1002/lno.11677, 2021.
Vargas, C. A. and Martínez, R. A.: Grazing impact of natural populations of ciliates and dinoflagellates in a river-influenced continental shelf, Aquat. Microb. Ecol., 56, 93-108, https://doi.org/10.3354/ame01319, 2009.
Verity, P. G. and Langdon, C.: Relationships between lorica volume, carbon, nitrogen and ATP content of tintinnids in Narragansett Bay, J. Plankton Res., 6, 859–868, 1984.
Wang, W. C., Sun, S., Sun, X., Zhang, G. T., and Zhang, F.: Spatial patterns of zooplankton size structure in relation to environmental factors in Jiaozhou Bay, South Yellow Sea, Mar. Pollut. Bull., 150, 110698, https://doi.org/10.1016/j.marpolbul.2019.110698, 2020.
Worden, A. Z., Nolan, J. K., and Palenik B.: Assessing the dynamics and ecology of marine picophytoplankton : The importance of the eukaryotic component, Limnol. Oceanogr., 49, 168–179, https://doi.org/10.4319/lo.2004.49.1.0168, 2004.
Wu, Z. C. and Li, Q. P.: Spatial distributions of polyunsaturated aldehydes and their biogeochemical implications in the Pearl River Estuary and the adjacent northern South China Sea, Prog. Oceanogr., 147, 1–9, https://doi.org/10.1016/j.pocean.2016.07.010, 2016.
Zhou, W. W., Li, Q. P., and Wu, Z. C.: Coastal phytoplankton responses to atmospheric deposition during summer, Limnol. Oceanogr., 66, 1298–1315, https://doi.org/10.1002/lno.11683, 2021.