the Creative Commons Attribution 4.0 License.
the Creative Commons Attribution 4.0 License.
 | 17 Mar 2022
Climate, land cover and topography: essential ingredients in predicting wetland permanence
Jody Daniel
Derek T. Robinson
Wetlands in the Prairie Pothole Region (PPR) are forecast to retract in their ranges due to climate change, and potholes that typically contain ponded water year-round, which support a larger proportion of biological communities, are most sensitive to climate change. In addition to climate, land use activities and topography also influence ponded water amounts in PPR wetlands. However, topography is not typically included in models forecasting the impacts of climate change on PPR wetlands. Using a combination of variables representing climate, land cover/land use and topography, we predicted wetland permanence class in the southern Boreal Forest, Parkland and Grassland natural regions of the Alberta PPR (N = 40 000 wetlands). We show that while climate and land cover/land use were strong predictors of wetland permanence class, topography was as important, especially in the southern Boreal Forest and Parkland natural regions. Our misclassification error rates for the gradient boosting models for each natural region were relatively high (43–60) though our learning rates were low (< 0.1) and our maximum tree depths shallow (5–7) to balance bias and overfitting. Clearly, factors in addition to climate, topography and land cover/land use influence wetland permanence class (i.e., basin size, depth, ground water connectivity, etc.). Despite classification errors, our results indicate that climate was the strongest predictor of wetland permanence class in the Parkland and Grassland natural regions, whereas topography was most important in the southern Boreal Forest Natural Region among the three domains we considered.
- Article
(2317 KB) - Full-text XML
- BibTeX
- EndNote


Wetlands provide a habitat for diverse communities of flora and fauna (Gibbs, 1993; Loesch et al., 2012; Sundberg et al., 2016) and deliver ecosystem services of disproportionate importance relative to the area they occupy (Mitsch and Gosselink, 2015). The diversity and abundance of flora and fauna in these wetland ecosystems (Daniel et al., 2019; Gleason and Rooney, 2018) are a function of the consistency with which ponded water is available (i.e., pond permanence), which is forecast to decline in amount and duration of presence (i.e., hydroperiod) across the Prairie Pothole Region of North America due to climate change (Euliss et al., 2004; Fay et al., 2016; Steen et al., 2014, 2016). In this region, most wetlands are ponded non-permanently, and they support resident biological communities (Daniel et al., 2019; Stewart and Kantrud, 1971) that are sensitive to climate change (Fay et al., 2016; Johnson et al., 2010). Therefore, understanding the relative influence of climate on wetland water levels is critical to improving our understanding of how biological communities in the Prairie Pothole Region (PPR) will respond to climate change.
Alberta lies at the western edge of the Prairie Pothole Region, which encompasses the province's Grassland and Parkland natural regions, as well as the southern edge of the Boreal Forest Natural Region (Schneider, 2013). Given the PPR's semi-arid climate, a decline in wetland hydroperiod is expected because of increases in wetland water deficits (Schneider, 2013; Werner et al., 2013). Simulations for the PPR suggest that the magnitude of change in climatic conditions between 1946 and 2005 was vast enough to drive declines in pond permanence (Werner et al., 2013). Modelling suggests that these wetlands may experience up to a 20 % decline in precipitation due to climate change, which could reduce hydroperiods (Fay et al., 2016). Furthermore, forecasts suggest that many of the wetlands in the southern and western PPR may lose their ponded water completely, driven by drier climate conditions in these areas (Johnson et al., 2005, 2010; Reese and Skagen, 2017). Wetlands that contain ponded water year-round will be most sensitive to climate change because they contain water in late summer when they will be subjected to greater evapotranspiration-driven losses (Fay et al., 2016). They are also relatively rare (Ridge et al., 2021). In addition to climate, topography can also affect hydroperiods in PPR wetlands (Johnson et al., 2010; McCauley et al., 2015; Tsai et al., 2012). The potholes, in which these wetlands are located, form a relic of the land's glaciated history, and larger catchments contribute more water, resulting in larger water budgets and longer hydroperiods for some pothole wetlands than others (Hayashi et al., 2016; Shaw et al., 2013). Contemporary land use practices (e.g., filling and ditching) can alter natural topography, affecting flows of surface and groundwater and subsequently the wetland hydroperiod. This phenomenon, referred to as consolidation drainage, fully or partially drains upper-watershed wetlands and directs their water to areas lower in the watershed (McCauley et al., 2015). Consolidation drainage is typically done to lower the probability that neighbouring croplands will flood (Schindler and Donahue, 2006; Verhoeven and Setter, 2010), which increases farming efficiency (Wiltermuth and Anteau, 2016).
Changes in land use can influence wetland hydroperiods by more than associated terrain modification. For example, landscapes with a higher proportion of agricultural activities can have longer hydroperiods due to the combination of increased surface runoff and decreased soil infiltration (van der Kamp et al., 2003; Voldseth et al., 2007). Many studies assessing the impacts of climate change on PPR wetlands incorporate land use (Anteau et al., 2016; Vodseth et al., 2009), and there is resounding evidence that wetlands exposed to the same climate regime, but situated among different land use activities, differ in their sensitivity to climate change (McCauley et al., 2015; Wiltermuth and Anteau, 2016).
While topography is an important predictor of pond permanence (Hayashi et al., 2016; Neff and Rosenberry, 2017; Shaw et al., 2013; Wiltermuth and Anteau, 2016), it is rarely included in studies assessing the impacts of climate change on PPR wetlands and/or biota (Wolfe et al., 2019). Even well-established models (e.g., WETSIM, Poiani and Johnson, 1993, WETLANDSCAPE, Johnson et al., 2010), applied to the PPR, predict pond permanence in response to climate but omit topography. However, differences in topography may cause wetlands belonging to the same permanence class to differ in their sensitivity to climate change. Consequently, our failure to incorporate topography when predicting pond permanence leaves us with an incomplete understanding of how wetland biota are affected by climate change.
Incorporating the influence of topography individually and in combination with climate and land cover/land use effects on wetland permanence is a gap we must fill to improve wetland and waterfowl population management across the PPR (Fay et al., 2016). We analyse data collected across multiple field projects and use spatial data, comprising thousands of wetlands across the PPR in Alberta, Canada. Only four permanence classes (of seven) are represented in this study (Table 1), and which permanence class a wetland belongs to is determined by the vegetation zone in the deepest part of the wetland – and this is dictated by its typical hydroperiod/pond permanence over several years (Stewart and Kantrud, 1971). Using these data, we quantify the relative contribution of climate, land cover/land use and topography in predicting different wetland permanence classes of marshes in Alberta's PPR.
Table 1Descriptions of the four permanence classes included in our study. We describe the typical length of time that these prairie pothole wetlands will contain ponded water, their associated vegetation zones, as described by Stewart and Kantrud (Stewart and Kantrud, 1971), and the number of wetlands belonging to each class in the Alberta Merged Wetland Inventory (Government of Alberta, 2014) that were within the extent of our 25 m digital elevation model.

2.1 Study area
The wetlands in our study are in the Albertan extent of the Prairie Pothole Region (PPR) (Fig. 1). Wetlands in this region are mainly depressions filled with ponded water, each formed in the last glacial period (Wright, 1972). Spring snow melt is the largest contributor to ponded water amounts, either from direct precipitation into the wetland or as runoff over frozen ground from upland areas (Hayashi et al., 1998). Potholes can differ in the length of time they contain ponded water, which can range from a few weeks after snowmelt to the entire year (Stewart and Kantrud, 1971).
The provincial merged wetland inventory (Alberta Merged Wetland Inventory, published by Alberta Environment and Parks) and the Canadian national wetland inventory (Canadian Wetlands Inventory, published by Environment and Climate Change Canada) do not assign permanence classes or provide measurements (e.g., water volume, depth) that could be used to classify the wetlands in our study region by permanence class. We acquired permanence class data from two smaller wetland inventories (Government of Alberta, 2014) that delineate the location, boundary and permanence class of PPR wetlands based on Stewart and Kantrud's classification (Stewart and Kantrud, 1971) (Table 1). The two wetland inventories differ in their accuracy (Evans et al., 2017) and include wetlands from the Grassland, Parkland and the southern edge of the Boreal Forest natural regions of Alberta. The Grassland Natural Region comprises mixed-grass prairie, and the Parkland Natural Region comprises deciduous trees and grasses. Both are semi-arid regions with potential evapotranspiration rates that are greater than annual precipitation (Downing and Pettapiece, 2006). The Parkland Natural Region, however, experiences more precipitation than the Grassland Natural Region (Downing and Pettapiece, 2006). While most of the Boreal Forest Natural Region is dominated by coniferous trees and annual precipitation amounts typically exceed evapotranspiration rates (Downing and Pettapiece, 2006), the southern margin of the Boreal Forest Natural Region in Alberta contains pothole wetlands and more semi-arid to subhumid climate conditions (Brown et al., 2010; Devito et al., 2005). Our study of the Boreal Forest Natural Region considers only on this southern margin sometimes called the boreal transition zone.
2.2 Wetland locations and extents
For our analysis, we selected a subset of wetlands from the Alberta Merged Wetland Inventory within each natural region (Fig. 1). To ensure wetland conditions were indicative of the natural regions within which they resided, we excluded those within 500 m of a natural region boundary. Then, we randomly selected 12 000 wetlands in the southern Boreal Forest and Parkland natural regions (3000 per permanence class) and 16 000 in the Grassland Natural Region (4000 per permanence class). To ensure spatial independence among sampled wetlands and their relationship to land cover as well as coincide with previous analysis of open-water wetlands (Ridge et al., 2017), topography (Branton et al., 2020) and land cover (Evans et al., 2017), we did not select wetlands that were within 1000 m of another selected wetland.
The distribution of wetland sizes was strongly right-skewed across the three natural regions of interest (Appendix A). Wetlands were typically small, with Boreal Forest Natural Region wetlands possessing the largest median size (2.26 ha), followed by Parkland Natural Region wetlands (1.54 ha) and Grassland Natural Region wetlands (0.58 ha), though size varies with permanence class (Appendix A). In the Grassland Natural Region, the largest wetlands tended to be permanently ponded, whereas the largest wetlands in the Boreal Forest and Parkland natural regions tended to be seasonally ponded (Appendix A). The combination of wetland size and our digital elevation model (DEM) resolution of 25 m suggests that our median wetland sizes would occupy 36, 25 and 9 cells for the Boreal Forest, Parkland and Grassland natural regions, respectively, defining our ability to capture variability among wetland sizes and shape.
2.3 Selecting variables
To select variables representative of climate, land cover/land use and topography that would be useful in testing the relative contribution of these three factors in predicting prairie pothole wetland permanence class, we conducted a literature review using the Web of Science. We limited the search to papers published between 1950 and 2018 with the following key words: (1) Prairie Pothole Region – PPR, Northern Great Plains, Alberta, Saskatchewan, Manitoba and Dakota; (2) weather – climate, temperature and precipitation; (3) disturbance – land use, agriculture, disturbance, oil and gas, grazing, and roads; and (4) pond permanence – watershed, hydroperiod, permanence class, catchment and wetland. We used “OR” operators between key words under the same class and “AND” operators between each key word class. To characterize topography, we selected variables that are commonly used to describe topographic variations, based on a previous review (Branton and Robinson, 2019). Details and results from this review are reported in Table 2.
Table 2List of annual data on climate, land cover and land use, and terrain metrics used to predict wetland permanence class. In this table, we include a description of the significance of each metric for the wetland hydroperiod and the proxy metrics we selected. For our analysis, winter months range from November to February, spring from April to May, and summer from June to August. We used Web of Science to conduct this review, limiting the search to papers published between 1950 and 2018, as well as key words for (1) the PPR – Prairie Pothole Region, Northern Great Plains, Alberta, Saskatchewan, Manitoba and Dakota; (2) weather – climate, temperature and precipitation; (3) disturbance – land use, agriculture, disturbance, oil and gas, grazing, and roads; and (4) pond permanence – watershed, hydroperiod, permanence class, catchment and wetland. We used “OR” operators between key words under the same class and “AND” operators between each key word class. For the terrain metrics, we used selected metrics that are commonly used to describe topographic variations, based on a previous review (Branton and Robinson, 2019). Notably, Branton and Robinson (2019) employed controls on collinearity, including principal component analysis (PCA).
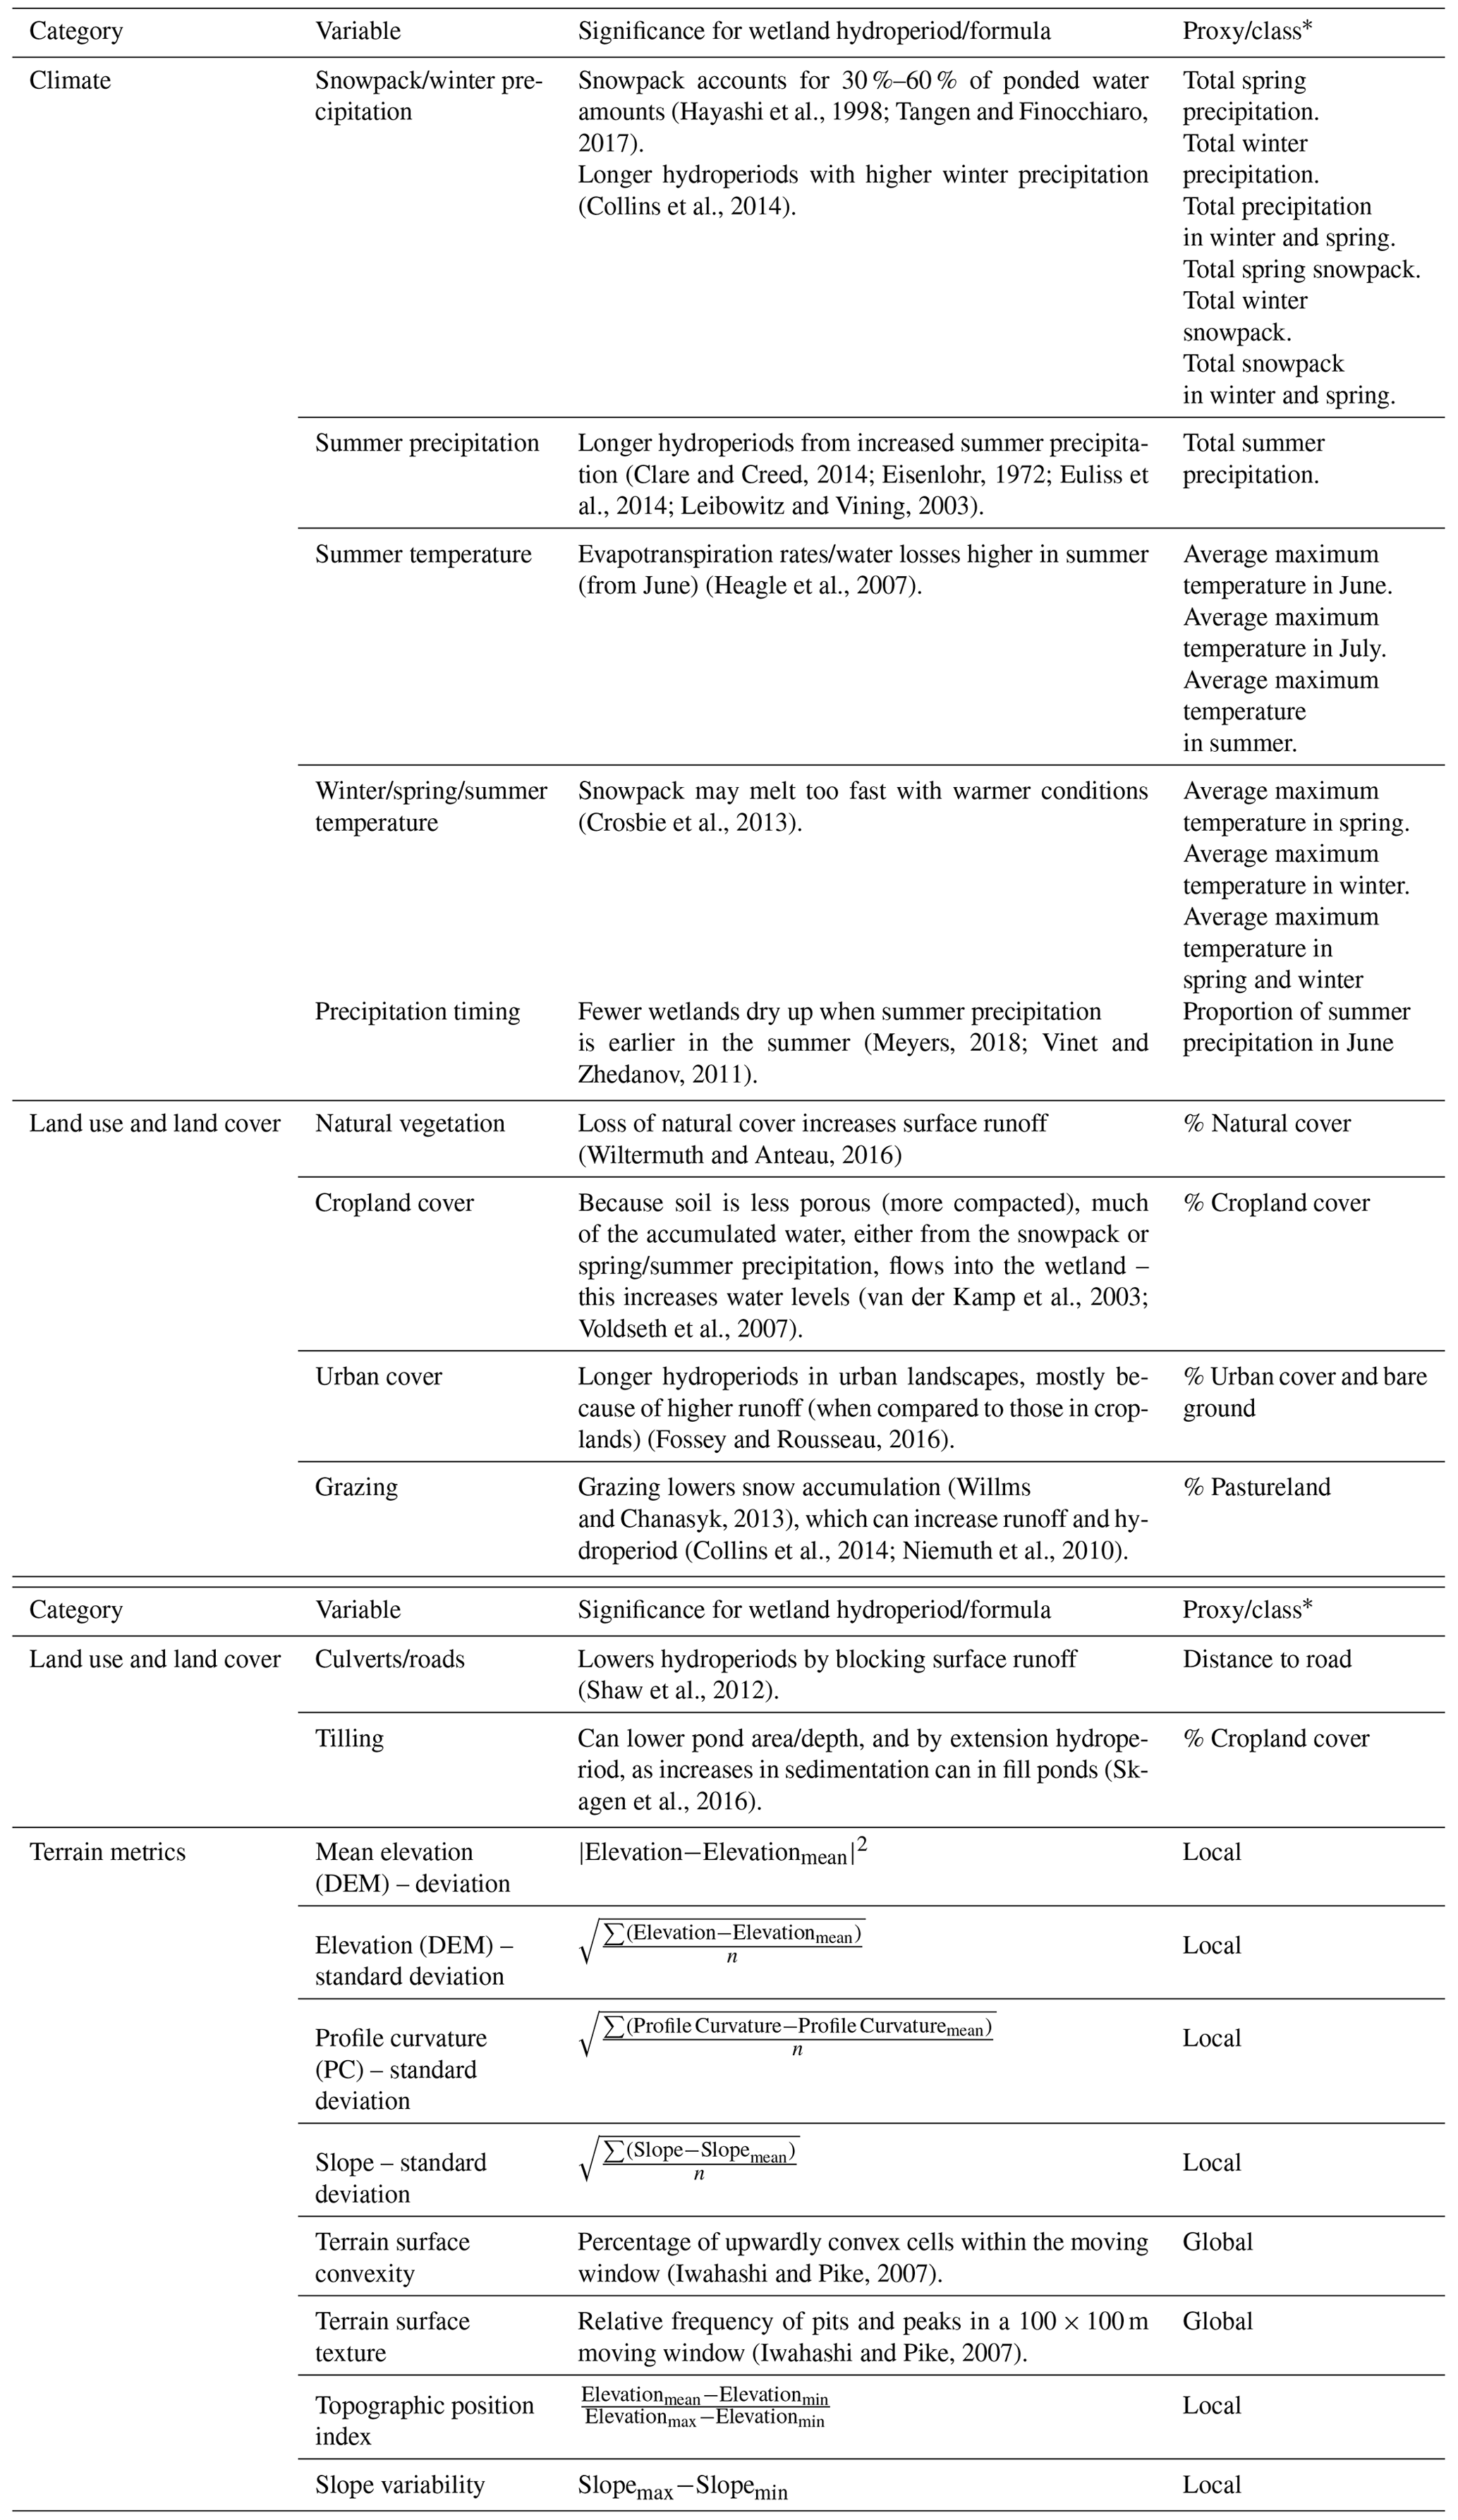
This differentiates terrain metrics by global (estimated using a 100×100 m moving window and mean value within 500 m buffer recorded) and local (estimated within a 500 m buffer of the wetland).
2.3.1 Climate
We acquired 2013–2014 daily weather data from the AgroClimatic Information Service of Alberta to calculate climate variables. These data include precipitation and temperature measurements from 7914 weather stations across the province, observed from October 2013 to August 2014. We calculated seasonal precipitation totals and temperature averages from a compilation of proxy variables (Table 2) at each station. Then, using a simple inverse distance weighting (Tarroso et al., 2019), we interpolated climate variables at the center of each wetland in R (R Core Team, 2019).
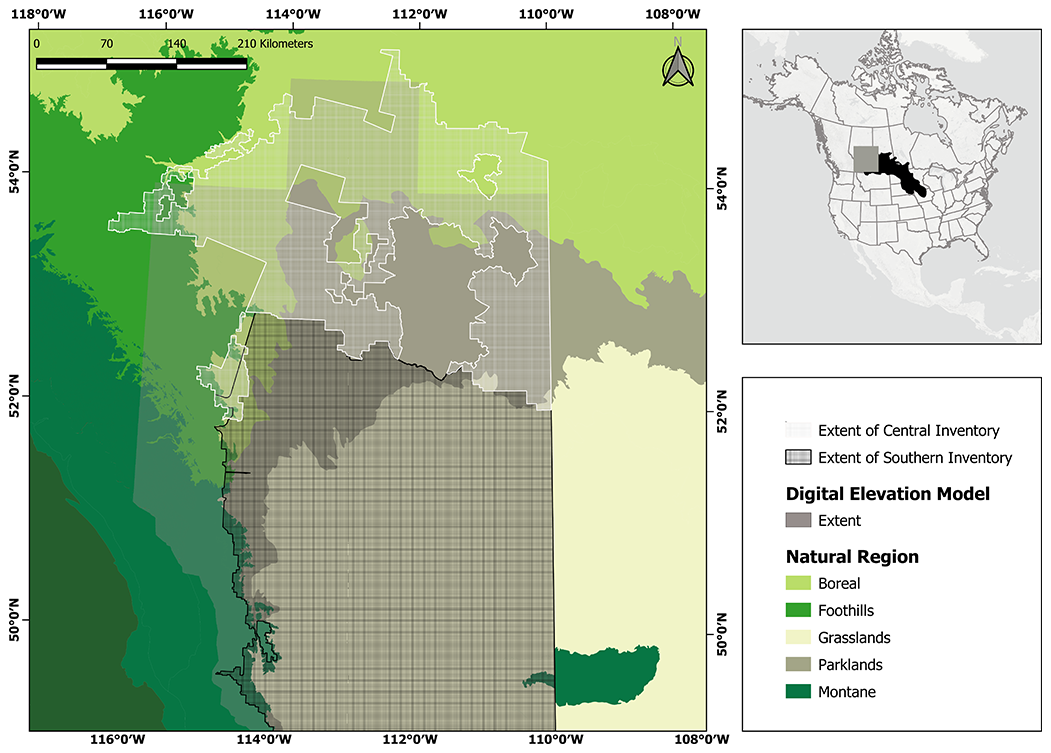
Figure 1Extents of the Central and Southern wetland inventories (Government of Alberta, 2014) used to delineate wetlands in our study. We selected wetlands from three natural regions – Boreal Forest (12 0000), Parkland (12 0000) and Grassland (16 0000); natural region boundaries are sourced from the Government of Alberta (Government Alberta, 2016). These wetlands are within the southern Alberta Prairie Pothole Region. There are 356 246 wetlands delineated in the Southern Inventory and 253 873 in the Central Inventory. DEM data provided by AltaLIS (2015).
We used annual data on climate variables in this analysis because it was available at a fine spatial resolution and corresponded with the 2014 land cover and topography data we used. Additionally, 2014 was a typical year in terms of climate variables. For example, we found no significant difference in mean annual precipitation between the 1981–2010 climate normal and the annual data from 2013–2014 (paired t tests for the Grassland Natural Region: t9 = 1.833, p value = 0.652; and for the Parkland Natural Region: t9=1.833, p value = 0.344) or from 2014–2015 (paired t tests for the Grassland Natural Region: t9=1.833, p value = 0.878; and for the Parkland Natural Region: t9=1.833, p value = 0.315) in either the Grassland or Parkland Natural Region (cumulative precipitation plots in Appendix B). Importantly, the influence of climate variables on wetland permanence classes will exhibit time lags dependent on site-specific factors, such as soil storage, ground water movement and vegetation succession within catchments. Consequently, the temporal window of relevant weather would also be site-specific, and we lack a defensible justification on which to base a threshold for including or excluding annual data on climate variables. Coupled with the typical nature of 2014's annual data on climate variables, we elected to use the single year as representative of average conditions in our study area and maximize comparability to our 2014 topography and land use data. We suggest future research could seek to elucidate how legacy effects of climate and land use may influence wetland permanence classes.
2.3.2 Land cover and land use
Prior research in the PPR identified a strong concordance between land cover within 500 m of wetlands and wetland physicochemical conditions (Kraft et al., 2019). Using land cover data from Agriculture and Agri-Food Canada's (AAFC) Annual Crop Inventory for 2014 (Agriculture and Agri-Food Canada, 2014), we calculated the proportion of each land cover class within a 500 m buffer of each wetland (Table 2). In addition to land cover characteristics, we also measured the distance of each wetland centroid to the nearest road using the National Road Network from the Government of Canada (Statistics Canada, 2010). The landscape fragmentation created by road networks has been shown to alter hydrological flow and divert surface runoff (Shaw et al., 2012) such that wetlands in proximity to roads typically have shorter hydroperiods. We estimated these land cover and land use variables in ArcMap 10.4.1 (ESRI, 2012).
2.3.3 Topography
We quantified topographic characteristics of the landscape surrounding each wetland using a 25 m digital elevation model (DEM) for southern and central Alberta (AltaLIS, 2015) (Fig. 1). We estimated eight terrain variables (Table 2) using ArcMap 10.4.1 (ESRI, 2012) and SAGA 2.3.2 (Conrad et al., 2015). These variables may be grouped as those with local (e.g., standard deviation of slope) versus global (e.g., terrain surface convexity) application (Branton and Robinson, 2019). For local variables, we applied the formula to areas only within 500 m of the wetland boundary. With global variables, we applied a 100×100 m moving window and computed the mean value within the 500 m buffers (Table 2).
2.4 Data analysis
We aimed to quantify the relative contribution of annual data on climate variables, land cover/land use, and topography for different wetland permanence classes and determine the ability of these drivers to predict wetland permanence class. Achieving these two outcomes involved four steps: reducing the number of variables to an orthogonal and parsimonious set for application, visualizing if wetlands could be partitioned based on their permanence class, parametrizing and calibrating a predictive model, and then predicting permanence class and assessing model fit. These analyses were performed in R (R Core Team, 2019), and while they quantify a relationship among our independent variables with wetland permanence, they do not infer causation.
2.4.1 Predicting wetland permanence class
We used an extreme gradient boosting model to predict wetland permanence class for each natural region based on a combination of annual data on climate variables, land cover/land use and topography variables (Appendix C). Extreme gradient boosting is considered a more robust predictive tool than random forest (Sheridan et al., 2016). Like random forest, extreme gradient boosting creates an ensemble of decision trees that partition data based on a specified grouping (Hastie et al., 2009; McCune et al., 2002), which in our case is wetland permanence class. In the first decision tree, all observations are equally weighted (Cutler et al., 2007). The second decision tree attempts to correct for misclassifications derived from the first tree, assigning a higher weight to observations that were difficult to classify. Each subsequent tree attempts to minimize model error by classifying these error-prone observations (Cutler et al., 2007). The use of the minimum error to build a model ensemble makes extreme gradient boosting models prone to overfitting (Cutler et al., 2007). To correct for overfitting, extreme gradient boosting models include a regularized object that penalizes more complex trees (Chen and Guestrin, 2016). We used relatively low learning rates (< 0.1) and restricted tree depths (5–7) to balance overfitting and bias in our model ensembles (Appendix D).
After parametrizing the model, we predicted wetland permanence class in the (1) southern Boreal Forest, (2) Parkland and (3) Grassland natural regions. For each model, we also assessed its performance using test data (70:30 training to test ratio) to determine the misclassification error rate, comparing results between training and test data. Importantly, misclassification error rates reflect the proportion of sites classified as a permanence class by the models that differs from the permanence class assigned it in the wetland inventory and thus assumes that the inventory accurately classifies each wetland. It also does not differentiate between the misclassification of a temporary wetland as seasonal (perhaps a minor error) and the misclassification of a temporary wetland as permanent (a major error). Consequently, we also broke misclassification rates down by inventory class for each model. We also evaluated the relative importance of each variable in predicting permanence class by comparing gain values and assessed under which ranges of each variable a permanence class was more likely to occur with waterfall plots.
3.1 Selecting variables
Before predicting wetland permanence class based on land use and land cover, topography, and annual data on climate variables, we first determined which metrics were collinear within their metric class. Based on a maximum allowable correlation Pearson correlation of 0.9, we reduced our 30 metrics to 19 that reflected climate (7), land cover/land use (4) and topography (8) (Table 2). Next, we incorporated these 19 variables into a PCA to explore partitioning of permanence classes in accordance with the annual data on climate, land cover, and topography variables and to facilitate comparison among the three natural regions. Wetlands in the Grassland Natural Region appeared to be better aligned with all three domains than the wetlands in the southern Boreal Forest and Parkland natural regions (Fig. 2).

Figure 2Principal components analysis for wetlands delineated in the (1) Boreal Forest (totalling 12 000 wetlands), (2) Parkland (totalling 12 000 wetlands) and (3) Grassland (totalling 16 000 wetlands) natural regions. PCAs apply an orthogonal transformation to summarize the data into axes that explain the variance between two correlation matrices. Our data were scaled before implementing the PCA. Vectors on climate (a–c), land use and land cover (d–f), and terrain roughness (g–i) show correlations with both axes. Axis 2, for all datasets, represents a hydroperiod gradient, and terrain roughness is represented on axis 1.
3.2 Model performance
We built an extreme gradient boosting model for each natural region (southern Boreal Forest, Parkland and Grassland) in our study area. Our models had moderate to high error rates for both the training (43 %–50 %) and test datasets (48 %–61 %; Appendix D), which indicates a balance between bias and overfitting. Clearly, annual data on climate, land use/cover and topography alone are not sufficient to perfectly predict wetland permanence class. We conclude that while our models are useful in ranking the relative importance of climate, land cover/land use and topography variables in predicting wetland permanence class, they are not a comprehensive overview of the factors determining permanence class of a given wetland (see Sect. 4.5). Notably, we focus on the context of each wetland (surrounding topography, land cover/land use and climate) rather than wetland-specific properties that would influence permanence class (e.g., basin morphology).
3.3 Relative importance of variables in predicting wetland permanence class among natural regions
In the Parkland and Grassland natural regions, annual data on climate explained the greatest amount of variance in wetland permanence class, based on relative gain values (Fig. 3a–c). As anticipated, our results suggest that climate conditions vary systematically among the natural regions (Fig. 4a–d). Among the climate variables included in our analyses, spring temperature (Boreal Forest Natural Region: 6.87 ∘C [0.425 SD]; Parkland Natural Region: 6.85 ∘C [0.206 SD]; Grassland Natural Region: 8.14 ∘C [0.892 SD]) explained the highest magnitude of variance in predicting permanence class in the Grassland Natural Region (Figs. 3a, 2c) but was less important in the southern Boreal Forest and Parkland natural regions where values are less extreme (Fig. 4a). Winter snowpack (Boreal Forest Natural Region: 92.15 cm [20 SD]; Parkland Natural Region: 67.65 cm [14.99 SD]; Grassland Natural Region: 42.14 cm [15.06 SD]) explained the highest magnitude of variance in predicting permanence class in the southern Boreal Forest and Parkland natural regions, and these amounts were distinctly lower in the warmer Grassland Natural Region (Fig. 4c).
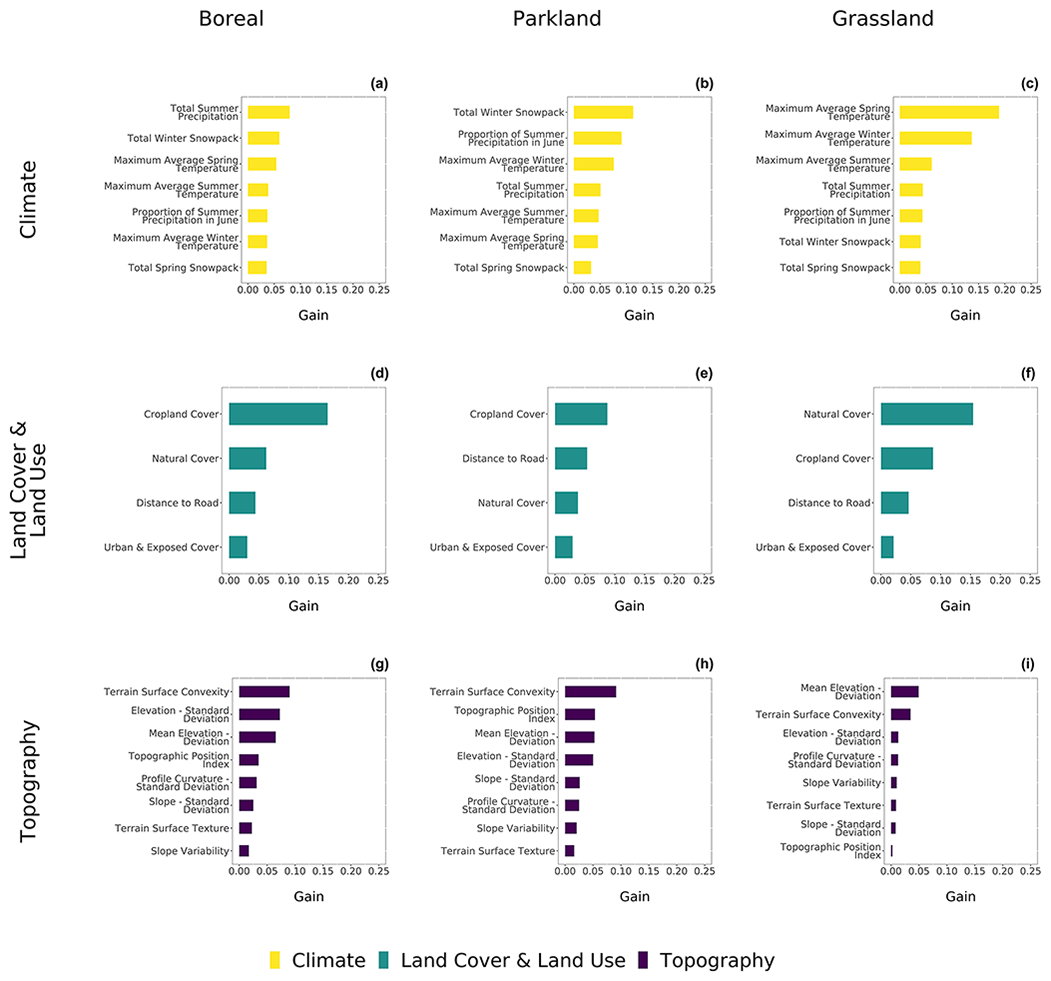
Figure 3Variables ranked by their importance in the extreme gradient boosting models for wetlands delineated in the (1) Boreal Forest (totalling 12 000 wetlands), (2) Parkland (totalling 12 000 wetlands) and (3) Grassland (totalling 16 000 wetlands) natural regions. These variables were proxies for climate (a–c), land cover and land use (d–f), and topography (g–i). The gains illustrate the relative contribution of each variable in the model – the higher the value, the greater the importance.
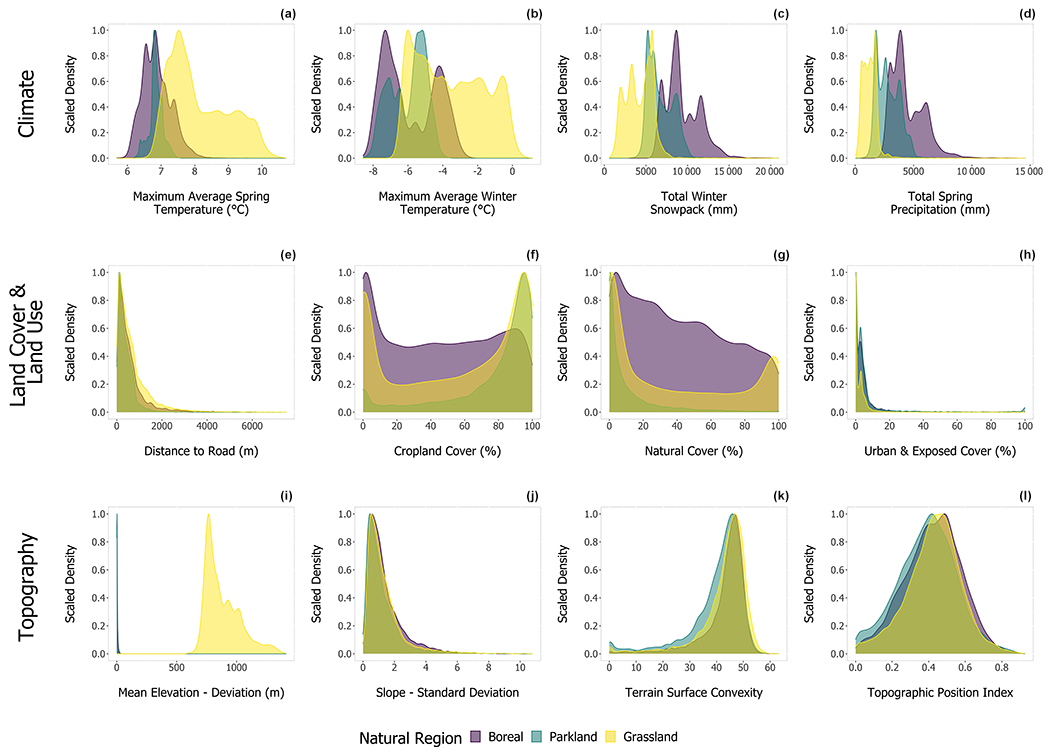
Figure 4Frequency distribution of the top four climate, land cover and land use, and topography variables by natural region.
Land cover/land use was the second most important category of drivers of wetland permanence class, following annual data on climate in the Grassland Natural Region (Fig. 3f), but not in the southern Boreal Forest or Parkland Natural Region (Fig. 3). Yet, unlike climate, land cover/land use did not vary systematically among the three natural regions (Fig. 4e–h). Wetlands surrounded by cropland had shorter hydroperiods in the southern Boreal Forest and Parkland natural regions (Fig. 5d–e), but wetlands surrounded by natural vegetation had shorter hydroperiods in the Grassland Natural Region (Fig. 5f).
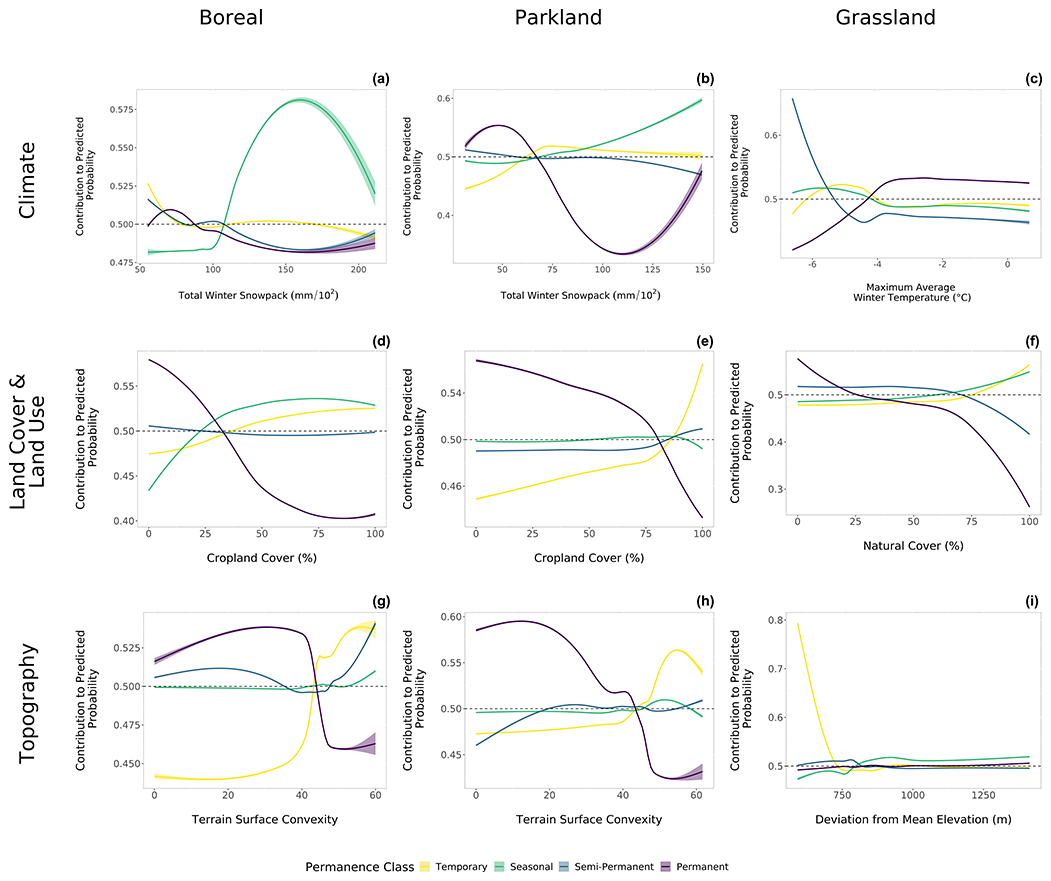
Figure 5Partial dependence plots for the four wetland classes – temporary, seasonal, semi-permanent and permanent based on top metrics. Predicted probabilities below 0.5 suggest that at this measured value of the metric observing that permanence class is unlikely. We show 95 % confidence intervals and used a generalized additive model-based trend line. Probabilities were derived from extreme gradient boosting models for wetlands delineated in the (1) Boreal Forest (totalling 12 000 wetlands), (2) Parkland (totalling 12 000 wetlands) and (3) Grassland (totalling 16 000 wetlands) natural regions.
Topography was the most important category of drivers of wetland permanence class in the southern Boreal Forest and second most important in the Parkland Natural Region, and the order of importance for the terrain metrics was nearly the same in both natural regions (Fig. 3g–i). Though topography metrics were the least important category in the Grassland Natural Region (Fig. 3i), apart from deviation from mean elevation (Fig. 4i), variables associated with topography did not systematically vary among natural regions (Fig. 4j–l).
3.4 Wetland permanence class in the Boreal Forest, Parkland and Grassland natural regions
Our findings suggest that wetland permanence class in the Prairie Pothole Region of Alberta correlates with climate, topography and, to a lesser extent, to surrounding land cover/land use. Generally, across the three natural regions, wetlands with shorter hydroperiods (e.g., temporary and seasonal) were typically situated in landscapes with higher spring snowpack amounts (Fig. 3a–c) and spring temperatures (e.g., Fig. 5a). Longer hydroperiod wetlands were typically situated in landscapes with more summer precipitation and lower spring temperatures (e.g., Fig. 5c), occupying relatively low topographic positions with low terrain convexity (e.g., Fig. 5g, h), and, in the Grassland Natural Region, were sometimes surrounded by less natural cover (Fig. 5f), though in the southern Boreal Forest Natural Region they were more common where cropland was less than 25 % cover (Fig. 5d) and less than 75 % in the Parkland Natural Region (Fig. 5e). Interestingly, the relative importance of variables in predicting the occurrence of both shorter- and longer-hydroperiod wetlands was shared, and this agreement was strongest between the southern Boreal Forest and Grassland natural regions (Appendices F and H).
Our findings support the assertion of other published studies (e.,g., Fay et al., 2016; Johnson et al., 2010, 2005; Johnson and Poiani, 2016; Reese and Skagen, 2017; Werner et al., 2013; McKenna et al., 2019), which conclude that climate change will affect wetland hydroperiod or permanence class. We anticipate that reduced winter snowpack will dry out temporarily and seasonally ponded wetlands, while warmer spring temperatures will reduce the hydroperiod of more permanently ponded wetlands. Yet, annual data on climate is not the only element correlated with wetland permanence class in Alberta's PPR – our analysis used a relatively coarse DEM (25 m), and we nonetheless found that topography was important in predicting permanence class. Consequently, failure to consider topography limits our understanding about the extent to which hydroperiod, and therefore wetland permanence class, may change in response to climate change. We speculate that the use of finer-scale elevation models derived from high-resolution lidar (e.g., 1 m) or remotely piloted aircraft (e.g., 2–5 cm) will reveal even greater importance of topography in surface runoff and wetland hydroperiod, particularly in the Grassland Natural Region, where wetlands were typically smaller and topographic variation relatively subtle.
4.1 Importance of climate
The sensitivity of wetland hydroperiods to annual climate data is corroborated in existing literature, which emphasizes that the semi-arid climate drives the region's sensitivity to climate change (Fay et al., 2016; Johnson et al., 2004; Schneider, 2013). In the southern Boreal Forest and Grassland natural regions, regions with warmer spring temperatures are likely to experience an earlier onset of spring snowmelt, higher water deficits (Schneider, 2013; Zhang et al., 2011) and lower pond permanence classes for wetlands, whereas cooler peak spring temperatures favour greater pond permanence in these natural regions. In the southern Boreal Forest and Parkland natural regions, winter snowpack depth was the most important climate variable, and this we attribute to temporarily and seasonally ponded wetlands requiring a minimum threshold of winter snowpack amount to persist, whereas permanently ponded wetlands also benefit from precipitation in other seasons and so can exist at lower winter snowpack amounts (Fig. 5b). Because climate forecasts suggest that warmer springs and changes in precipitation timing are likely (Zhang et al., 2011), our finding that climate was the most important domain of variables in predicting permanence class supports previous studies that suggest PPR wetlands are sensitive climate change (Johnson et al., 2010; Paimazumder et al., 2013; Schneider, 2013; Viglizzo et al., 2015; Zhang et al., 2011).
4.2 Importance of topography
Despite recognition that topography is a useful proxy in wetland mapping (Branton and Robinson, 2019; Los Huertos and Smith, 2013) and that topography must influence surface-runoff-generating processes that are essential to wetland function (Hayashi et al., 2016; Mushet et al., 2018), the relative importance of topography in hydrological processes is somewhat debated (Devito et al., 2005). Simulations predicting the influence of climate change on the size and isolation of prairie pothole wetlands have focused on climate and land cover/land use (Anteau et al., 2016; Chasmer et al., 2012; Conly et al., 2001; Johnson and Poiani, 2016; McCauley et al., 2015; Steen et al., 2016; Voldseth et al., 2007). Consequently, (1) there is a lack of research quantifying topographic characteristics of wetlands and the landscapes within which they occur; (2) links between topography, vegetation and wetland condition have not been rigorously studied; and (3) policy and guidelines on wetland mitigation and compensation prescribe width-to-length ratios and slopes that are characteristic of permanently ponded wetlands (Environmental Partnerships and Education Branch Alberta, 2007), which are less abundant in all three natural regions (Table 1). Despite remaining numerically more abundant, small and more temporarily ponded wetlands are being preferentially lost in Alberta's Prairie Pothole Region (Serran et al., 2017). If we had a better understanding of how topographic structure determines wetland hydrology/function, we could revise policy and regulations governing wetland management to ensure we better match natural landscapes in their frequency and distribution of wetland permanence classes.
4.3 Importance of land cover/land use
Existing literature identified land cover/land use as the second greatest driver of wetland conditions following climate (Anteau et al., 2016). In the Grassland Natural Region, the terrain is relatively flat compared to the southern Boreal Forest and Parkland natural regions (Alberta Tourism Parks and Recreation, 2015). Consequently, after the important role of annual data on climate in the more arid Grassland Natural Region (Government et al., 2014), land cover/land use might be a stronger driver of permanence class than topography. Importantly, the percent cover of natural vegetation is typically low in the Grassland Natural Region, where most land has been converted to cropland or pastureland (Alberta Tourism Parks and Recreation, 2015). Combined with the process of consolidation drainage, which shunts water from scattered low hydroperiod wetlands, concentrating it in larger more permanently ponded wetlands downstream (McCauley et al., 2015), this leads to Grassland Natural Region landscapes with more natural cover being more likely to contain temporary and seasonal wetlands. Thus, wetlands surrounded by natural vegetation may have shorter hydroperiods because cropland resists infiltration and natural vegetation intercepts snow-sourced surface runoff (Anteau, 2012; van der Kamp et al., 2003; Voldseth et al., 2007), which can account for up 27 % of ponded water amounts (van der Kamp et al., 2003).
Because some landscapes in the PPR are flatter than others (Schneider, 2013), and land use activities can modify the terrain (Anteau, 2012; Wiltermuth and Anteau, 2016; Anteau et al., 2016), our findings do highlight the importance of considering land use in forecasting the impacts of climate change on PPR wetlands. The Boreal Forest and Parkland Natural Region wetlands have stronger overlaps in topography metrics and annual data on climate, and, as a result, differences in land use within these regions may be integral in determining future shifts in the frequency distribution of permanence classes. Forecasts for the province of Alberta suggest there will be expansions in the agricultural industry within the next decade (Government of Alberta, 2015), and this suggests that climate impacts on Albertan PPR wetlands will be compounded by land use activities.
4.4 Topographic position of wetlands by permanence class
Semi-permanent and permanently ponded wetlands typically occur in regional or spatial neighbourhood topographic lows (as opposed to simply local depressions, e.g., perched wetlands), likely because they (1) can hold larger volumes of ponded water (i.e., larger pond size/volume, Novikmec et al., 2016) and (2) receive higher volumes of water inputs from the surrounding landscape (e.g., surface runoff, groundwater, Euliss et al., 2004, 2014; LaBaugh et al., 1998; Toth, 1963). We are unable to partition the natural hydrogeological effects of topographic position on wetland permanence class from the effects of human alteration of the surrounding landscape, yet the importance of topographic position to wetland permanence class is likely reinforced by consolidation drainage when wetlands situated higher in the landscape are drained and the water is redirected to wetlands positioned lower in the landscape (McCauley et al., 2015; Wiltermuth and Anteau, 2016). Because of consolidation drainage, we may observe increases in the hydroperiod of wetlands in topographic lows of the wetlandscape (e.g., sites with low topographic position index values). In the arid but heavily farmed Grassland Natural Region, consolidation drainage can eliminate temporary and seasonally ponded wetlands from areas with limited remaining natural cover (Serran et al., 2017). This aligns with our model results: although the probability of observing a permanent or semi-permanent class wetland was greatest at the lower end of the range of crop cover in our landscapes, the threshold of crop cover above which wetlands were most probably seasonal or temporary in class was higher in the Grassland Natural Region, lower in the Parkland Natural Region and lowest in the Boreal Forest Natural Region. Thus, we recommend that future research investigate the role of topographic position on permanence class, in the absence of human disturbance to control for the influence of consolidation drainage.
4.5 Model error
Our model misclassification error rates were relatively high (Appendix D), indicating imperfect matching between model-predicted permanence class and inventory-reported permanence class for our study wetlands. One key source of uncertainty in our analysis is that the accuracy of the inventory in assigning wetlands a given permanence class is not validated, and in interpreting our model error we must assume that the permanence classes we derived from the inventories are correct, though we know the two inventories differ in their mapping accuracy (Evans et al., 2017). Yet, we hypothesize that our inability to account for soil characteristics (Schneider, 2013) and bathymetry (Huertos and Smith, 2013) likely contributes to misclassification by our models (Appendix D). Schneider (2013) stated that within natural regions, both elevation (which we did account for) and soil characteristics can vary across the landscape. As such, wetlands situated similarly in the landscape may not have the same soil characteristics, and soil characteristics are understood to influence wetland hydrology by dictating the proportion of incident precipitation that is converted to surface run of Hayashi et al. (2016). Though Schneider (2013) also mentioned an influence of disturbance history on ecosystems, prior work in our study region reported no temporal lag in wetland environmental conditions and surrounding land cover (Kraft et al., 2019).
The lack of extensive data on basin morphology identifies a gap that would enrich the presented research by enabling direct classification of wetland permanence from raw bathymetric data. Such data would likely reduce the misclassification error rates of our ensemble models, which rely only on annual data on climate, land use and topography in predicting wetland permanence. Furthermore, these data would provide added value to those conducting research on above- and below-ground hydrologic connectivity and contributing areas (e.g., Chen et al., 2020), as well as those evaluating the impacts of climate change on wetland permanence and subsequently flora and fauna health and resilience (e.g., LaBaugh et al., 2018). As new technologies for mapping wetland bathymetry become more widely available (e.g., bathymetric lidar; Paine et al., 2015; Wang and Philpot, 2007), an opportunity will exist to better understand the link between wetland pattern and process.
Potentially some proportion of model error can be attributed to the use of a single year of climate and land use data as well as our relatively coarse (25 m) digital elevation model. However, it is likely that the contributions of these factors are minimal given that (1) the climate data used (year 2014) is representative of average conditions, coincides with fieldwork, and yielded the strongest among the variables interrogated, and therefore improving the quality of its contribution will not change the qualitative outcome of the presented analysis; (2) previous research found that physiochemical conditions in a wetland are quite congruent with surrounding land cover of the same year with only minor differences when catchments were defined with 10 m versus 25 m resolution DEMs (Kraft et al., 2019); and (3) there was no detectible difference in wetland catchment size when they were derived from DEMs of low (10 m) versus high (3 m) resolution (McCauley and Anteau, 2014).
Lastly, wetland permanence classes are ordinal, and consequently not all misclassifications are equal. From an ecohydrological perspective, a discrepancy between model-predicted and inventory-reported permanence class can be minor (e.g., temporary vs. seasonal) or major (e.g., temporary vs. permanent), and this is not accounted for in the overall misclassification error rate. When we investigate the class-based misclassification error rates, it is apparent that all models were most successful in classifying wetlands at the extreme ends of the permanence class spectrum, and misclassification error rates were higher for seasonal and semi-permanent wetlands (Appendix D). Interestingly, the Grassland Natural Region model tended to misclassify seasonal wetlands as temporary and semi-permanent wetlands as permanent (i.e., misclassified into adjoining classes), whereas the Parkland Natural Region model tended to misclassify seasonal and semi-permanent wetlands more evenly across the three other permanence classes. Overall, these extreme gradient boosting models are valuable for comparing the relative importance of the climate, topographic and landscape domains of predictor variables, despite misclassification error rates.
Because some landscapes in the PPR are flatter than others (Schneider, 2013) and land use activities can modify topography (Anteau, 2012; Anteau et al., 2016; Wiltermuth and Anteau, 2016), our findings also highlight the importance of considering land use in forecasting the impacts of climate change on PPR wetlands. The southern Boreal Forest and Parkland Natural Region wetlands are most congruent in the relative importance of climate and topography variables, and, as a result, differences in land use within these regions may be integral in determining future shifts in the frequency distribution of permanence classes. Forecasts for the province of Alberta suggest expansion in the agricultural industry over the next decade (Government of Alberta, 2015), which suggests that climate impacts on Alberta's PPR wetlands will be compounded by changes in land use activities.
Table A1Frequency distribution of wetland sizes in the Boreal Forest, Grassland and Parkland natural regions. Data on wetland sizes were acquired from the Alberta Merged Wetland Inventory (Government of Alberta, 2014).
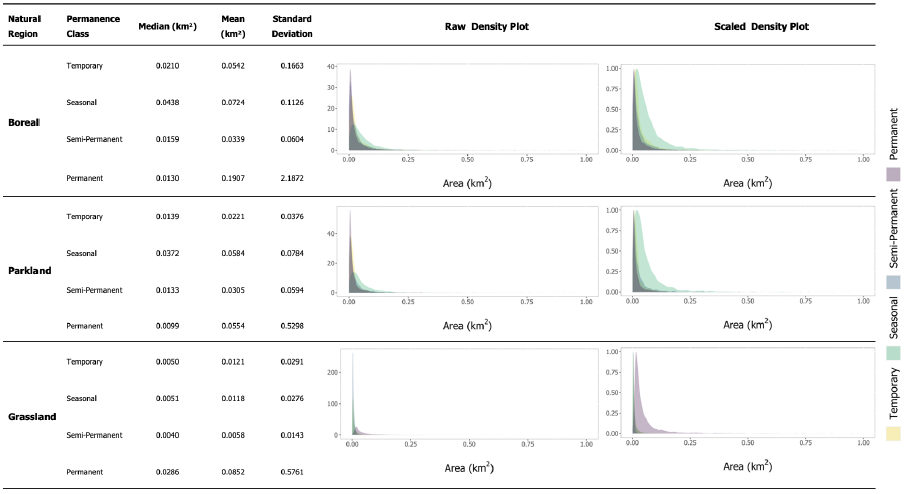
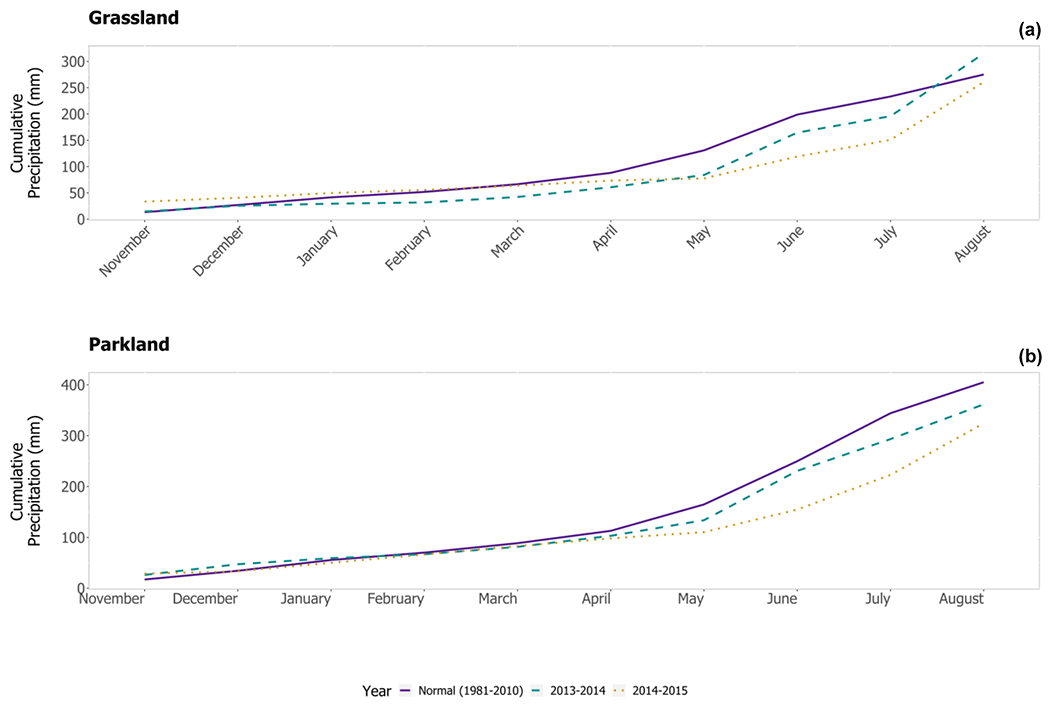
Figure B1Comparison of cumulative precipitation in the (a) Grassland and (b) Parkland natural regions between 2013–2015 to the climate normal. Note that data were not available for the southern portion of the Boreal Forest Natural Region of interest in our study.
Table C1List of parameters tuned for the extreme gradient boosting model, a description of these parameters, their ranges and the ranges evaluated in our cross validation.
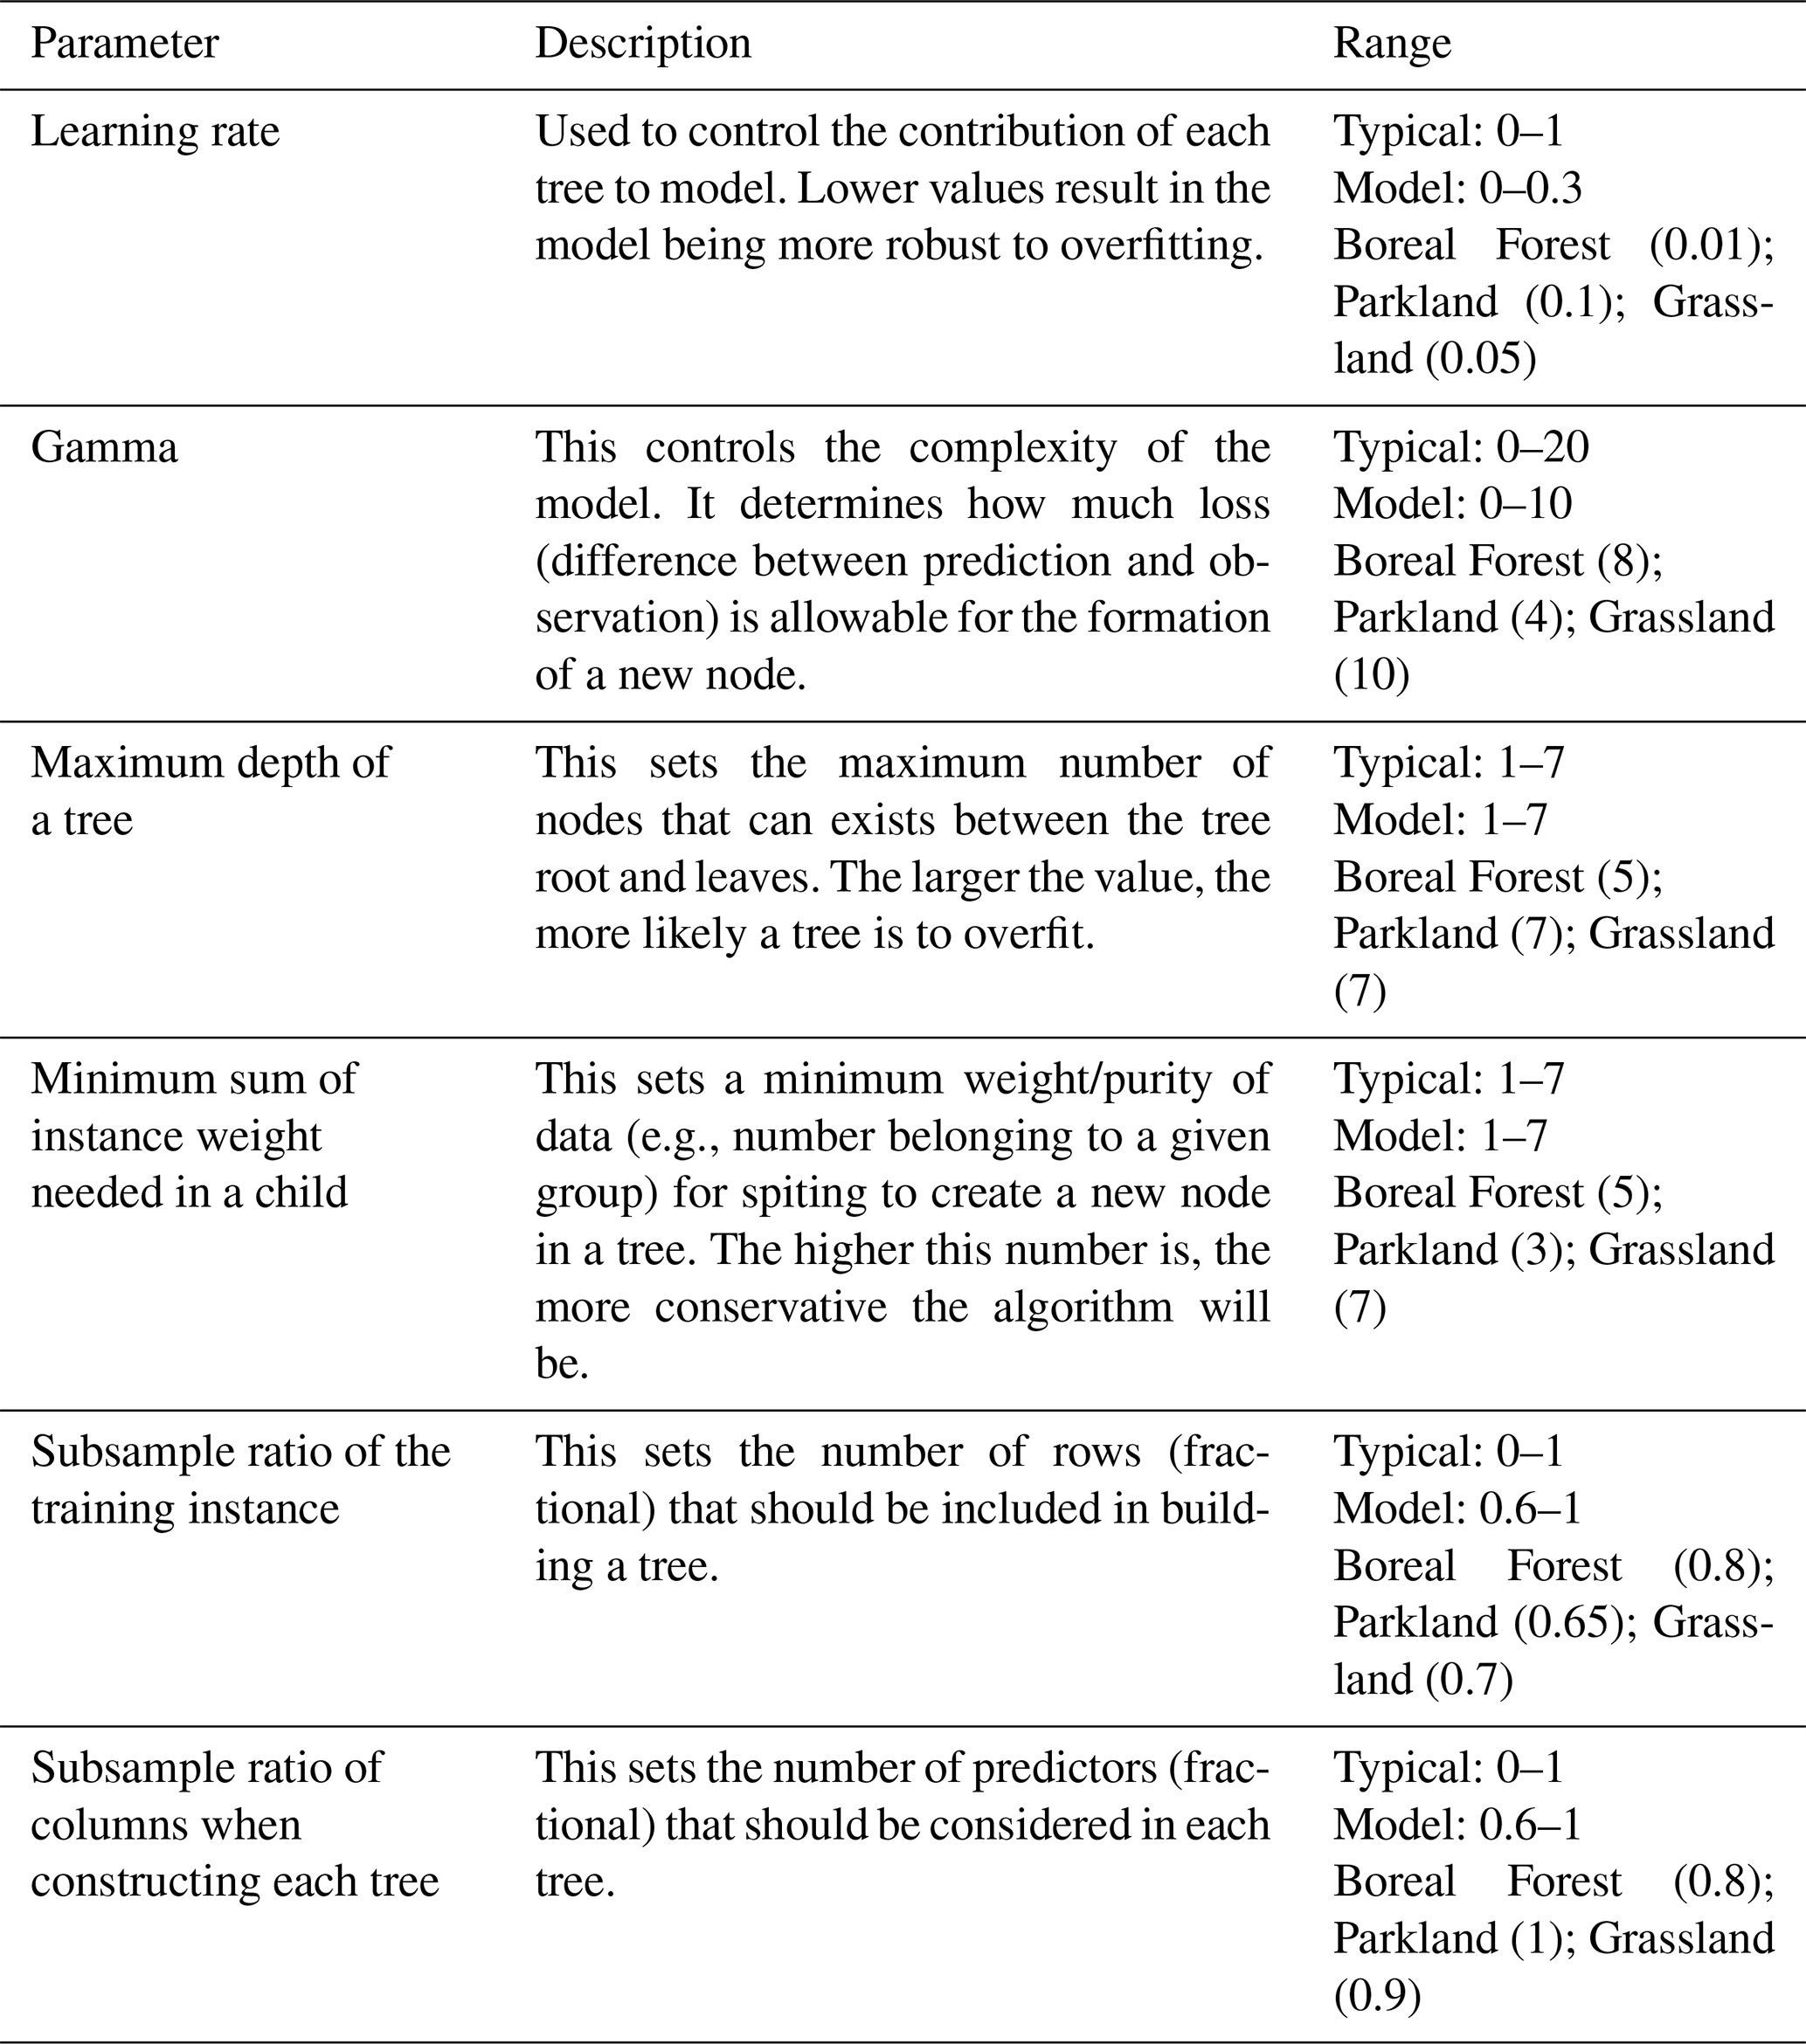
Table D1Value of parameters used in extreme gradient boosting models for our three datasets, the misclassification error rates and number of trees for our models.

Table D2Breakdown of misclassification error by permanence class. Data reflect the percent of wetlands classified as a given permanence class by the inventory (row) that the model classified as each permanence class (column). In general, models fared better at classifying temporary and permanent wetlands and exhibited more misclassification errors in classifying wetlands that the inventory categorized as seasonal or semi-permanent. Semi-permanent wetlands, in particular, tended to be under-predicted by the models.
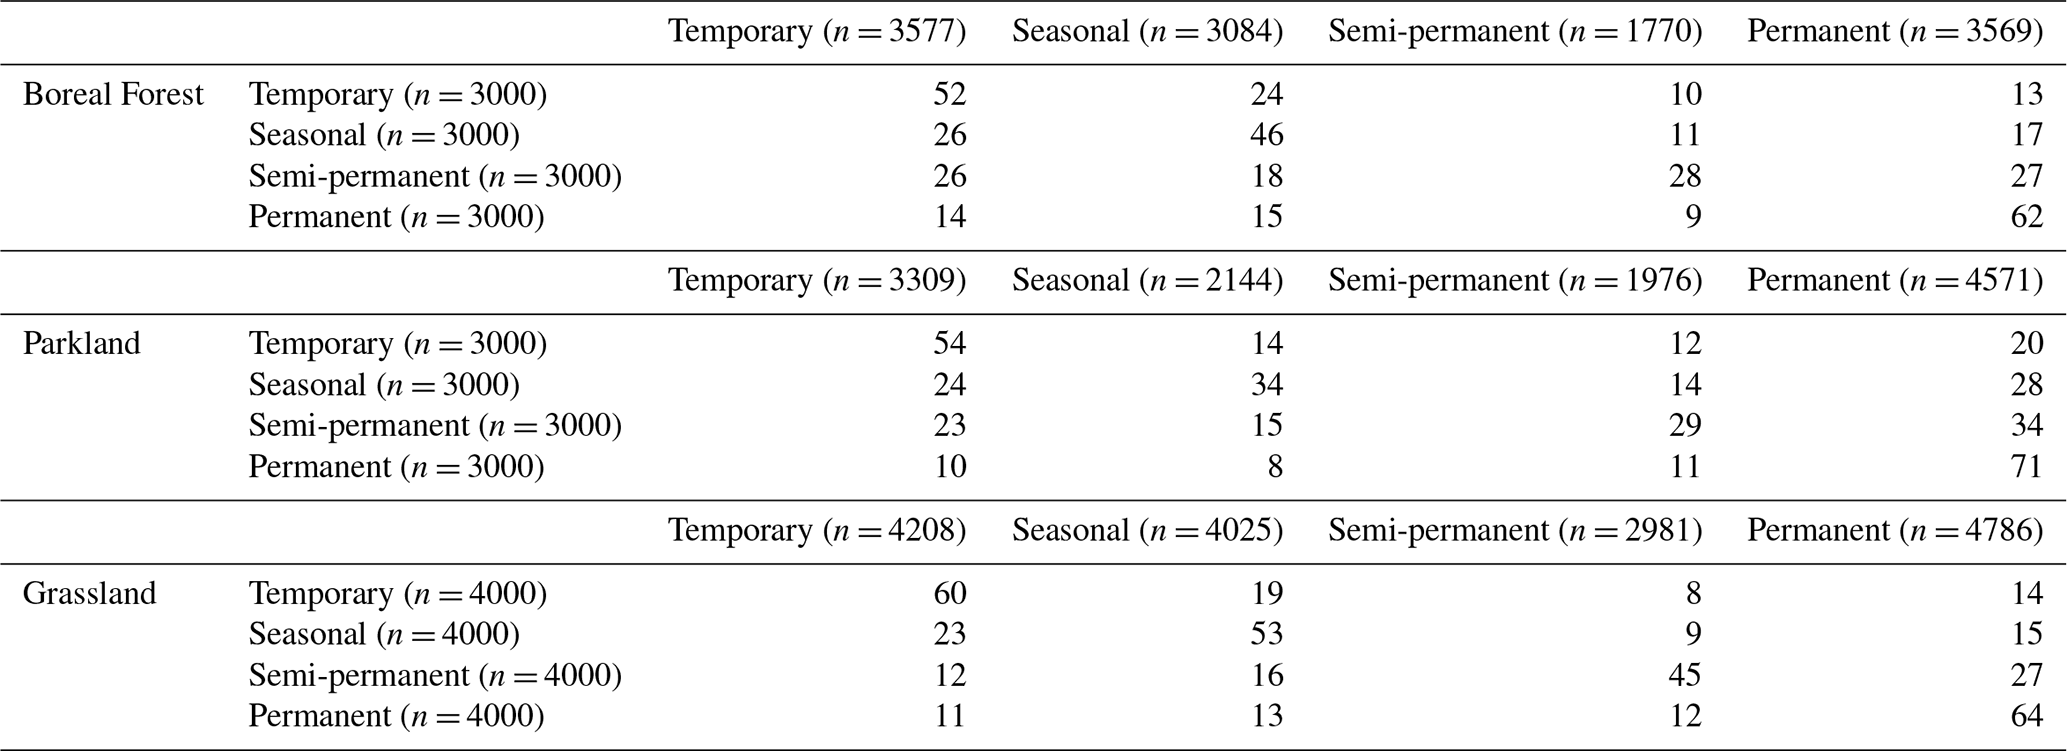

Figure E1Variables ranked by their importance in the extreme gradient boosting models for wetlands delineated in the Boreal Forest (totalling 12 000 wetlands) by permanence class. These variables were proxies for climate (a–d), land cover and land use (e–h), and topography roughness (i–l). The gains illustrate the relative contribution of each variable in the model – the higher the value, the greater the importance.
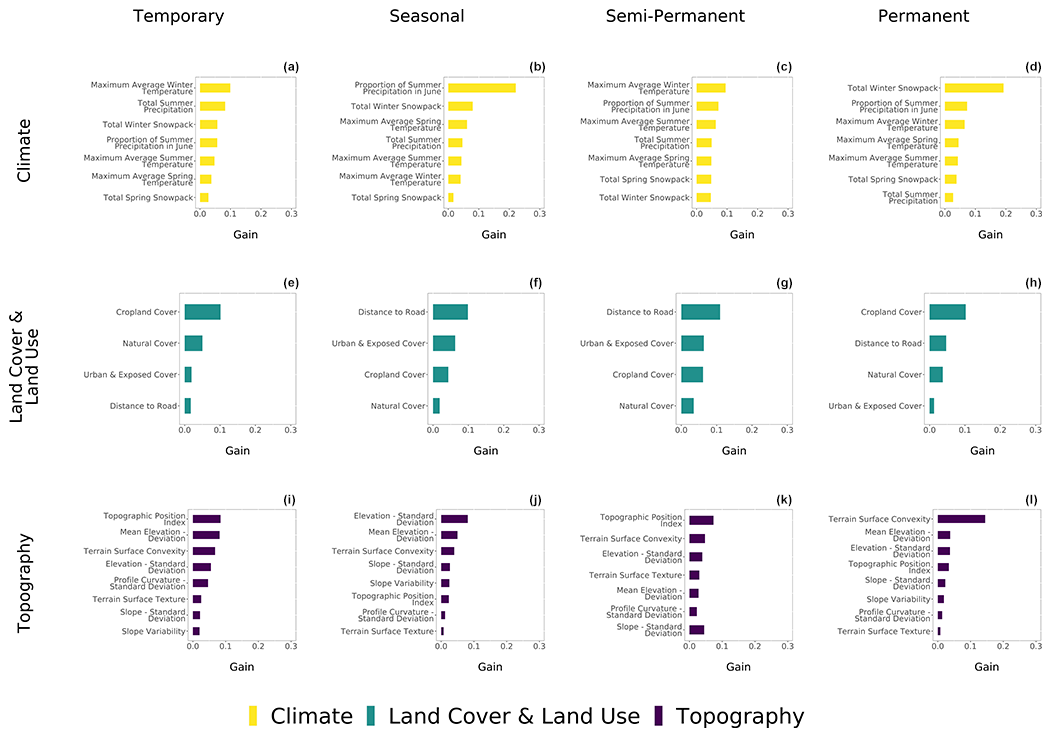
Figure F1Variables ranked by their importance in the extreme gradient boosting models for wetlands delineated in the Parkland Natural Region (totalling 12 000 wetlands) by permanence class. These variables were proxies for climate (a–d), land cover and land use (e–h), and topography roughness (i–l). The gains illustrate the relative contribution of each variable in the model – the higher the value, the greater the importance.

Figure G1Variables ranked by their importance in the extreme gradient boosting models for wetlands delineated in the Grassland Natural Region (totalling 12 000 wetlands) by permanence class. These variables were proxies for climate (a–d), land cover and land use (e–h), and topography roughness (i–l). The gains illustrate the relative contribution of each variable in the model – the higher the value, the greater the importance.
The data and code for this paper are published online with Figshare: https://doi.org/10.6084/m9.figshare.18945248.v1 (Daniel et al., 2022).
RCR conceptualized the study, acquired funding and resources, supervised, and curated the data; DTR and JD gathered the data; JD analysed and visualized the data and wrote the original draft; all authors contributed to the investigation and review and editing.
The contact author has declared that neither they nor their co-authors have any competing interests.
Publisher's note: Copernicus Publications remains neutral with regard to jurisdictional claims in published maps and institutional affiliations.
We thank Michael Anteau, Marcel Pinheiro and Roland Hall for their comments on an earlier draft of this paper and two anonymous reviewers for extremely helpful feedback. We are also grateful to Collin Branton for assistance in short-listing topography variables, based on a prior review of the literature.
This research has been supported by Alberta Innovates (grant no. AI 2335) and the Ontario Trillium Foundation.
This paper was edited by Ben Bond-Lamberty and reviewed by two anonymous referees.
Agriculture and Agri-food Canada: Annual Crop Inventory 2014, Open Data Canada [data set], https://open.canada.ca/data/en/dataset/ae61f47e-8bcb-47c1-b438-8081601fa8fe (last access: 4 March 2022), 2014.
Alberta Tourism Parks and Recreation: Natural Regions & Subregions of Alberta: A framework of Alberta's Parks, Government of Alberta, Edmonton, AB, ISBN 978-1-4601-1362-2, 2015.
AltaLIS: Digital Elevation Model, https://open.alberta.ca/opendata/terrain-20k-digital-elevation-models#summary (last access: 3 March 2022), 2015.
Anteau, M. J.: Do interactions of land use and climate affect productivity of waterbirds and prairie-pothole wetlands?, Wetlands, 32, 1–9, https://doi.org/10.1007/s13157-011-0206-3, 2012.
Anteau, M. J., Wiltermuth, M. T., van der Burg, M. P., and Pearse, A. T.: Prerequisites for understanding climate-change impacts on Northern Prairie Wetlands, Wetlands, 36, 1–9, https://doi.org/10.1007/s13157-016-0811-2, 2016.
Branton, C. and Robinson, D. T.: Quantifying topographic characteristics of wetlandscapes, Wetlands, 40, 433–449, https://doi.org/10.1007/s13157-019-01187-2, 2019.
Brown, S. M., Petrone, R. M., Mendoza, C., and Devito, K. J.: Surface vegetation controls on evapotranspiration from a sub-humid Western Boreal Plain wetland, Hydrol. Process., 24, 1072–1085, https://doi.org/10.1002/hyp.7569, 2010.
Chasmer, L., Petrone, R., Brown, S., Hopkinson, C., Mendoza, C., Diiwu, J., Quinton, W., and Devito, K.: Sensitivity of modelled evapotranspiration to canopy characteristics within the Western Boreal Plain, Alberta, IAHS-AISH Publ., 352, 337–340, 2012.
Chen, S., Johnson, F., Drummond, C., and Glamore, W.: A new method to improve the accuracy of remotely sensed data for wetland water balance estimates, J. Hydrol. Reg. Stud., 29, 100689, https://doi.org/10.1016/j.ejrh.2020.100689, 2020.
Chen, T. and Guestrin, C.: XGBoost: a scalable tree boosting system, in Proceedings of the 22nd ACM SIGKDD International Conference on Knowledge Discovery and Data Mining – KDD '16, Vol. 19, ACM Press, New York, New York, USA, 785–794, https://doi.org/10.1145/2939672.2939785, 2016.
Clare, S. and Creed, I. F.: Tracking wetland loss to improve evidence-based wetland policy learning and decision making, Wetl. Ecol. Manag., 22, 235–245, https://doi.org/10.1007/s11273-013-9326-2, 2014.
Collins, S. D., Heintzman, L. J., Starr, S. M., Wright, C. K., Henebry, G. M., and McIntyre, N. E.: Hydrological dynamics of temporary wetlands in the southern Great Plains as a function of surrounding land use, J. Arid Environ., 109, 6–14, https://doi.org/10.1016/j.jaridenv.2014.05.006, 2014.
Conly, F. M. F. M. M., van der Kamp, G., and van der Kamp, G.: Monitoring the Hydrology of Canadian Prairie Wetlands to Detect the Effects of Climate Change and Land Use Changes, Environ. Monit. Assess., 67, 195–215, https://doi.org/10.1023/A:1006486607040, 2001.
Conrad, O., Bechtel, B., Bock, M., Dietrich, H., Fischer, E., Gerlitz, L., Wehberg, J., Wichmann, V., and Böhner, J.: System for Automated Geoscientific Analyses (SAGA) v. 2.1.4, Geosci. Model Dev., 8, 1991–2007, https://doi.org/10.5194/gmd-8-1991-2015, 2015.
Crosbie, R. S., Scanlon, B. R., Mpelasoka, F. S., Reedy, R. C., Gates, J. B., and Zhang, L.: Potential climate change effects on groundwater recharge in the High Plains Aquifer, USA, Water Resour. Res., 49, 3936–3951, https://doi.org/10.1002/wrcr.20292, 2013.
Cutler, D. R., Edwards, T. C., Beard, K. H., Cutler, A., Hess, K. T., Gibson, J., and Lawler, J. J.: Random forests for classification in ecology, Ecology, 88, 2783–2792, https://doi.org/10.1890/07-0539.1, 2007.
Daniel, J., Gleason, J. E., Cottenie, K., and Rooney, R. C.: Stochastic and deterministic processes drive wetland community assembly across a gradient of environmental filtering, Oikos, 128, 1158–1169, https://doi.org/10.1111/oik.05987, 2019.
Daniel, J., Rooney, R. C., and Robinson, D. T.: Climate, land cover and topography: essential ingredients in predicting wetland permanence, FigShare.com. [data set and code], https://doi.org/10.6084/m9.figshare.18945248.v1, 2022.
Devito, K., Creed, I., Gan, T., Mendoza, C., Petrone, R., Silins, U., and Smerdon, B.: A framework for broad-scale classification of hydrologic response units on the Boreal Plain: Is topography the last thing to consider?, Hydrol. Process., 19, 1705–1714, https://doi.org/10.1002/hyp.5881, 2005.
Downing, D. J. and Pettapiece, W. W.: Natural Regions and Subregions of Alberta, Government of Alberta, Edmonton, Alberta, https://www.albertaparks.ca/media/2942026/nrsrcomplete_may_06.pdf (last access: 25 September 2017), 2006.
Eisenlohr, W. S. J.: Hydrologic investigations of prairie potholes in North Dakota, 1959–1968, U.S. Government Printing Office, Washington, D.C., https://pubs.usgs.gov/pp/0585a/report.pdf (last access: 19 April 2017), 1972.
Environmental Partnerships and Education Branch Alberta: Provincial wetland restoration/compensation guide, Alberta Environment and Parks, Government of Alberta, Edmonton, AB, ISBN 978-0-7785-5479-0, http://www.gov.ab.ca/env/%0A, 2007.
ESRI: ArcGIS Desktop: Release 10.1, https://www.esri.com/news/arcnews/spring12articles/introducing-arcgis-101.html (last access: 3 March 2022), 2012.
Euliss, N. H., Labaugh, J. W., Fredrickson, L. H., Mushet, D. M., Laubhan, M. K., Swanson, G. A., Winter, T. C., Rosenberry, D. O., and Nelson, R. D.: The wetland continuum: a conceptual framework for interpreting biological studies, Wetlands, 24, 448–458, https://doi.org/10.1672/0277-5212(2004)024[0448:TWCACF]2.0.CO;2, 2004.
Euliss, N. H., Mushet, D. M., Newton, W. E., Otto, C. R. V., Nelson, R. D., LaBaugh, J. W., Scherff, E. J., and Rosenberry, D. O.: Placing prairie pothole wetlands along spatial and temporal continua to improve integration of wetland function in ecological investigations, J. Hydrol., 513, 490–503, https://doi.org/10.1016/j.jhydrol.2014.04.006, 2014.
Evans, I. S., Robinson, D. T., and Rooney, R. C.: A methodology for relating wetland configuration to human disturbance in Alberta, Landsc. Ecol., 32, 2059–2076, https://doi.org/10.1007/s10980-017-0566-z, 2017.
Fay, P. A., Guntenspergen, G. R., Olker, J. H., and Carter Johnson, W.: Climate change impacts on freshwater wetland hydrology and vegetation cover cycling along a regional aridity gradient, Ecosphere, 7, e01504, https://doi.org/10.1002/ecs2.1504, 2016.
Fossey, M. and Rousseau, A. N.: Can isolated and riparian wetlands mitigate the impact of climate change on watershed hydrology? A case study approach, J. Environ. Manage., 184, 327–339, https://doi.org/10.1016/j.jenvman.2016.09.043, 2016.
Gibbs, J. P.: Importance of small wetlands for the persistence of local populations of wetland-associated animals, Wetlands, 13, 25–31, 1993.
Gleason, J. E. and Rooney, R. C.: Pond permanence is a key determinant of aquatic macroinvertebrate community structure in wetlands, Freshw. Biol., 63, 264–277, https://doi.org/10.1111/fwb.13057, 2018.
Alberta and Government of Alberta: Alberta Merged Wetland Inventory, https://geodiscover.alberta.ca/ (last access: 25 September 2017), 2014.
Government Alberta: 2005 Natural Regions and Subregions of Alberta, https://geodiscover.alberta.ca/ (last access: 25 September 2017), 2016.
Government of Alberta: Alberta Merged Wetland Inventory, https://geodiscover.alberta.ca/ (last access: 25 September 2017), 2014.
Government of Alberta: Industry profiles: Agricultural industry, Edmonton, AB, http://work.alberta.ca/labour/labour-force-statistics-and-annual-reviews.html (last access: 25 September 2017), 2015.
Hastie, T., Tibshirani, R., and Friedman, J.: The elements of statistical learning: data mining, inference, and prediction, Springer, 2nd Edn., 767 pp., ISBN 13 978-0387848570, 2009.
Hayashi, M., van der Kamp, G., and Rudolph, D. L.: Water and solute transfer between a prairie wetland and adjacent uplands, 1. Water balance, J. Hydrol., 207, 42–55, doi:1016/S0022-1694(98)00098-5, 1998.
Hayashi, M., van der Kamp, G., and Rosenberry, D. O.: Hydrology of prairie wetlands: understanding the integrated surface-water and groundwater processes, Wetlands, 36, 237–254, https://doi.org/10.1007/s13157-016-0797-9, 2016.
Heagle, D. J., Hayashi, M., and van der Kamp, G.: Use of solute mass balance to quantify geochemical processes in a prairie recharge wetland, Wetlands, 27, 806–818, https://doi.org/10.1672/0277-5212(2007)27[806:UOSMBT]2.0.CO;2, 2007.
Huertos, M. L. and Smith, D.: (2013) Wetland Bathymetry and Mapping, in: Wetland Techniques, edited by: Anderson, J. and Davis, C., Springer, Dordrecht, https://doi.org/10.1007/978-94-007-6860-4_2, 2013.
Iwahashi, J. and Pike, R. J.: Automated classifications of topography from DEMs by an unsupervised nested-means algorithm and a three-part geometric signature, Geomorphology, 86, 409–440, https://doi.org/10.1016/j.geomorph.2006.09.012, 2007.
Johnson, W. C. and Poiani, K. A.: Climate change effects on Prairie Pothole wetlands: findings from a twenty-five year numerical modeling project, Wetlands, 36, 1–13, https://doi.org/10.1007/s13157-016-0790-3, 2016.
Johnson, W. C., Boettcher, S. E., Poiani, K. A., and Guntenspergen, G.: Influence of weather extremes on the water levels of glaciated prairie wetlands, Wetlands, 24, 385–398, https://doi.org/10.1672/0277-5212(2004)024[0385:IOWEOT]2.0.CO;2, 2004.
Johnson, W. C., Millett, B. V, Gilmanov, T., Voldseth, R. A., Guntenspergen, G. R., and Naugle, D. E.: Vulnerability of Northern Prairie Wetlands to climate change, Bioscience, 55, 863, https://doi.org/10.1641/0006-3568(2005)055[0863:vonpwt]2.0.co;2, 2005.
Johnson, W. C., Werner, B., Guntenspergen, G. R., Voldseth, R. A., Millett, B., Naugle, D. E., Tulbure, M., Carroll, R. W. H., Tracy, J., and Olawsky, C.: Prairie wetland complexes as landscape functional units in a changing climate, Bioscience, 60, 128–140, https://doi.org/10.1525/bio.2010.60.2.7, 2010.
Kraft, A. J., Robinson, D. T., Evans, I. S., and Rooney, R. C.: Concordance in wetland physicochemical conditions, vegetation, and surrounding land cover is robust to data extraction approach, edited by: Jenkins, D. G., PLoS One, 14, e0216343, https://doi.org/10.1371/journal.pone.0216343, 2019.
LaBaugh, J. W., Winter, T. C., and Rosenberry, D. O.: Hydrologic functions of prairie wetlands, Gt. Plains Res., 8, 17–37, 1998.
Leibowitz, S. G. and Vining, K. C.: Temporal connectivity in a prairie pothole complex, Wetlands, 23, 13–25, https://doi.org/10.1672/0277-5212(2003)023[0013:TCIAPP]2.0.CO;2, 2003.
Loesch, C. R., Reynolds, R. E., and Hansen, L. T.: An assessment of re-directing breeding waterfowl conservation relative to predictions of climate change, J. Fish Wildl. Manag., 3, 1–22, https://doi.org/10.3996/032011-JFWM-020, 2012.
Los Huertos, M. and Smith, D.: Wetland bathymetry and mapping, in: Wetland Techniques, edited by: Anderson, J. and Davis, C. A., 181–227, 2013.
McCauley, L. A. and Anteau, M. J.: Generating nested wetland catchments with readily-available digital elevation data may improve evaluations of land-use change on wetlands, Wetlands, 34, 1123–1132, https://doi.org/10.1007/s13157-014-0571-9, 2014.
McCauley, L. A., Anteau, M. J., van der Burg, M. P., and Wiltermuth, M. T.: Land use and wetland drainage affect water levels and dynamics of remaining wetlands, Ecosphere, 6, art92, https://doi.org/10.1890/ES14-00494.1, 2015.
McCune, B., Grace, J. B., and Urban, D. L.: Analysis of ecological communities, MjM Software Design, Glenden Beach, Oregon, 2002.
McKenna, O. P., Kucia, S. R., Mushet, D. M., Anteau, M. J., and Wiltermuth, M. T.: Synergistic interaction of climate and land-use drivers alter the function of North American, prairie-pothole wetlands, Sustainability, 11, 6581, https://doi.org/10.3390/su11236581, 2019.
Meyers, N.: Use of water isotope tracers to characterize the hydrology of prairie wetlands in Alberta, University of Waterloo, https://uwspace.uwaterloo.ca/bitstream/handle/10012/12924/Meyers_Nicole.pdf?sequence=3&isAllowed=y, last access: 1 March 2018.
Mitsch, W. J. and Gosselink, J. G.: Wetlands, 5th Edn., Wiley, New York, NY, ISBN 978-1-118-67682-0, 2015.
Mushet, D. M., McKenna, O. P., LaBaugh, J. W., Euliss, N. H., and Rosenberry, D. O.: Accommodating state shifts within the conceptual framework of the wetland continuum, Wetlands, 38, 647–651, https://doi.org/10.1007/s13157-018-1004-y, 2018.
Neff, B. P. and Rosenberry, D. O.: Groundwater connectivity of upland-embedded wetlands in the Prairie Pothole Region, Wetlands, 38, 1–13, https://doi.org/10.1007/s13157-017-0956-7, 2017.
Niemuth, N. D., Wangler, B., and Reynolds, R. E.: Spatial and temporal variation in wet area of wetlands in the Prairie Pothole Region of North Dakota and South Dakota, Wetlands, 30, 1053–1064, https://doi.org/10.1007/s13157-010-0111-1, 2010.
Novikmec, M., Hamerlík, L., Kočický, D., Hrivnák, R., Kochjarová, J., Oťaheová, H., Paove-Balang, P., and Svitok, M.: Ponds and their catchments: size relationships and influence of land use across multiple spatial scales, Hydrobiologia, 774, 155–166, https://doi.org/10.1007/s10750-015-2514-8, 2016.
Paimazumder, D., Sushama, L., Laprise, R., Khaliq, M. N., and Sauchyn, D.: Canadian RCM projected changes to short- and long-term drought characteristics over the Canadian Prairies, Int. J. Climatol., 33, 1409–1423, https://doi.org/10.1002/joc.3521, 2013.
Paine, J., Andrews, O., Kutalmis, S., and Thomas, T.: Airborne LiDAR-Based Wetland and Permafrost-Feature Mapping on an Arctic Coastal Plain, North Slope, Alaska, in Remote Sensing of Wetlands, CRC Press, 418–431, https://doi.org/10.1201/b18210, 2015.
Poiani, K. A. and Johnson, W. C.: A spatial simulation model of hydrology and vegetation dynamics in semi-permanent prairie wetlands, Ecol. Appl., 3, 279–293, 1993.
R Core Team: R: A language and environment for statistical computing, R 3.6.1, http://www.r-project.org/, 2019.
Reese, G. C. and Skagen, S. K.: Modeling nonbreeding distributions of shorebirds and waterfowl in response to climate change, Ecol. Evol., 7, 1497–1513, https://doi.org/10.1002/ece3.2755, 2017.
Ridge, J. D., Robinson, D. T., and Rooney, R.: Assessing the potential of integrating distribution and structure of permanent open-water wetlandscapes in reclamation design: a case study of Alberta, Canada, Wetl. Ecol. Manag., 29, 331–350, https://doi.org/10.1007/s11273-020-09769-2, 2021.
Schindler, D. W. and Donahue, W. F.: An impending water crisis in Canada's western prairie provinces, P. Natl. Acad. Sci. USA, 103, 7210–7216, https://doi.org/10.1073/pnas.0601568103, 2006.
Schneider, R. R.: Alberta's natural subregions under a changing climate: past, present, and future, Biodiversity Management & Climate Change Adaptation Project, Alberta Biodiversity Monitoring Institute, https://doi.org/10.7939/R3WS8HM1N, 97 pp., 2013.
Serran, J. N., Creed, I. F., Ameli, A. A., and Aldred, D. A.: Estimating rates of wetland loss using power-law functions, Wetlands, 38, 1–12, https://doi.org/10.1007/s13157-017-0960-y, 2017.
Shaw, D. A., Vanderkamp, G., Conly, F. M., Pietroniro, A., and Martz, L.: The fill-spill hydrology of prairie wetland complexes during drought and deluge, Hydrol. Process., 26, 3147–3156, https://doi.org/10.1002/hyp.8390, 2012.
Shaw, D. A., Pietroniro, A., and Martz, L. W.: Topographic analysis for the prairie pothole region of Western Canada, Hydrol. Process., 27, 3105–3114, https://doi.org/10.1002/hyp.9409, 2013.
Sheridan, R. P., Wang, W. M., Liaw, A., Ma, J., and Gifford, E. M.: Extreme gradient boosting as a method for quantitative structure-activity relationships, J. Chem. Inf. Model., 56, 2353–2360, https://doi.org/10.1021/acs.jcim.6b00591, 2016.
Skagen, S. K., Burris, L. E., and Granfors, D. A.: Sediment accumulation in prairie wetlands under a changing climate: the relative roles of landscape and precipitatio, Wetlands, 36, 383–395, https://doi.org/10.1007/s13157-016-0748-5, 2016.
Statistics Canada: Road Network File – 2010 – Alberta, https://open.canada.ca/data/en/dataset/0de78037-27c3-4844-b8f1-f9b70ea16b48 (last access: 18 August 2019), 2010.
Steen, V., Skagen, S. K., and Noon, B. R.: Vulnerability of breeding waterbirds to climate change in the Prairie Pothole Region, U.S.A, edited by: Brigham, R. M., PLoS One, 9, e96747, https://doi.org/10.1371/journal.pone.0096747, 2014.
Steen, V. A., Skagen, S. K., and Melcher, C. P.: Implications of Climate Change for Wetland-Dependent Birds in the Prairie Pothole Region, Wetlands, 36, 445–459, https://doi.org/10.1007/s13157-016-0791-2, 2016.
Stewart, R. E. and Kantrud, H. A.: Classification of natural ponds and lakes in the glaciated prairie region, Washington, DC, https://pubs.usgs.gov/rp/092/report.pdf (last access: 17 April 2017), 1971.
Sundberg, M. D., Baldwin, R. C., Stewart, T. W., and Weber, M. J.: Linkages between land use, invasive fishes, and Prairie Pothole wetland condition, Wetlands, 36, 1097–1107, https://doi.org/10.1007/s13157-016-0827-7, 2016.
Tangen, B. A. and Finocchiaro, R. G.: A case study examining the efficacy of drainage setbacks for limiting effects to wetlands in the Prairie Pothole Region, USA, J. Fish Wildl. Manag., 8, 513–529, https://doi.org/10.3996/022017-JFWM-012, 2017.
Tarroso, P., Carvalho, S. B., and Velo-Antón, G.: Phylin 2.0: Extending the phylogeographical interpolation method to include uncertainty and user-defined distance metrics, Mol. Ecol. Resour., 19, 1081–1094, https://doi.org/10.1111/1755-0998.13010, 2019.
Toth, J.: A theoretical analysis of groundwater flow in small drainage basins, J. Geophys. Res., 68, 4795–4812, https://doi.org/10.1029/JZ068i016p04795, 1963.
Tsai, J.-S., Venne, L. S., McMurry, S. T., and Smith, L. M.: Local and landscape influences on plant communities in playa wetlands, J. Appl. Ecol., 49, 174–181, https://doi.org/10.1111/j.1365-2664.2011.02063.x, 2012.
van der Kamp, G., Hayashi, M., and Gallén, D.: Comparing the hydrology of grassed and cultivated catchments in the semi-arid Canadian prairies, Hydrol. Process., 17, 559–575, https://doi.org/10.1002/hyp.1157, 2003.
Verhoeven, J. T. A. and Setter, T. L.: Agricultural use of wetlands: opportunities and limitations, Ann. Bot., 105, 155–163, https://doi.org/10.1093/aob/mcp172, 2010.
Viglizzo, E. F., Nosetto, M. D., Jobbágy, E. G., Ricard, M. F., and Frank, F. C.: The ecohydrology of ecosystem transitions: A meta-analysis, Ecohydrology, 8, 911–921, https://doi.org/10.1002/eco.1540, 2015.
Vinet, L. and Zhedanov, A.: A “missing” family of classical orthogonal polynomials, J. Phys. A Math. Theor., 44, 085201, https://doi.org/10.1088/1751-8113/44/8/085201, 2011.
Vodseth, R. A., Johnson, C. W., Guntenspergen, G. R., Gilmanov, T., and Millett, B. V: Adaptation of farming practices could buffer effects of climate change on Northern Prairie Wetlands, Wetlands, 29, 635–647, https://doi.org/10.1672/07-241.1, 2009.
Voldseth, R. A., Johnson, W. C., Gilmanov, T., Guntenspergen, G. R., and Millett, B. V.: Model estimation of land-use effects on water levels of northern Prairie wetlands, Ecol. Appl., 17, 527–540, https://doi.org/10.1890/05-1195, 2007.
Wang, C.-K. and Philpot, W. D.: Using airborne bathymetric lidar to detect bottom type variation in shallow waters, Remote Sens. Environ., 106, 123–135, https://doi.org/10.1016/j.rse.2006.08.003, 2007.
Werner, B. A., Johnson, W. C., and Guntenspergen, G. R.: Evidence for 20th century climate warming and wetland drying in the North American Prairie Pothole Region, Ecol. Evol., 3, 3471–3482, https://doi.org/10.1002/ece3.731, 2013.
Willms, W. D. and Chanasyk, D. S.: Grazing effects on snow accumulation on rough fescue grasslands, Rangel. Ecol. Manag., 59, 400–405, https://doi.org/10.2111/05-107R1.1, 2013.
Wiltermuth, M. T. and Anteau, M. J.: Is consolidation drainage an indirect mechanism for increased abundance of cattail in northern prairie wetlands?, Wetl. Ecol. Manag., 24, 533–544, https://doi.org/10.1007/s11273-016-9485-z, 2016.
Wolfe, J. D., Shook, K. R., Spence, C., and Whitfield, C. J.: A watershed classification approach that looks beyond hydrology: Application to a semi-arid, agricultural region in Canada, Hydrol. Earth Syst. Sci., 23, 3945–3967, https://doi.org/10.5194/hess-23-3945-2019, 2019.
Wright, H. E. J.: Quaternary history of Minnesota, in: Geology of Minnesota – A Centennial Volume, edited by: Sims, P. K. and Morey, G., Minnesota Geological Survey, University of Minnesota, Saint Paul, Minnesota, 515–546, ISBN B000GR7ZLE, 1972.
Zhang, H., Huang, G. H., Wang, D., and Zhang, X.: Uncertainty assessment of climate change impacts on the hydrology of small prairie wetlands, J. Hydrol., 396, 94–103, https://doi.org/10.1016/j.jhydrol.2010.10.037, 2011.