the Creative Commons Attribution 4.0 License.
the Creative Commons Attribution 4.0 License.
 | 04 Apr 2022
Low biodegradability of particulate organic carbon mobilized from thaw slumps on the Peel Plateau, NT, and possible chemosynthesis and sorption effects
Suzanne E. Tank
Jorien E. Vonk
Scott Zolkos
Warming and wetting in the western Canadian Arctic are accelerating thaw-driven mass wasting by permafrost thaw slumps, increasing total organic carbon (TOC) delivery to headwater streams by orders of magnitude primarily due to increases in particulate organic carbon (POC). Upon thaw, permafrost carbon entering and transported within streams may be mineralized to CO2 or re-sequestered into sediments. The balance between these processes is an important uncertainty in the permafrost–carbon–climate feedback. Using aerobic incubations of TOC from streams affected by thaw slumps we find that slump-derived organic carbon undergoes minimal (∼ 4 %) oxidation over a 1-month period, indicating that this material may be predominantly destined for sediment deposition. Simultaneous measurements of POC and dissolved organic carbon (DOC) suggest that mineralization of DOC accounted for most of the TOC loss. Our results indicate that mobilization of mineral-rich tills in this region may protect carbon from mineralization via adsorption to minerals and promote inorganic carbon sequestration via chemolithoautotrophic processes. With intensification of hillslope mass wasting across the northern permafrost zone, region-specific assessments of permafrost carbon fates and inquiries beyond organic carbon decomposition are needed to constrain drivers of carbon cycling and climate feedbacks within stream networks affected by permafrost thaw.
- Article
(5118 KB) - Full-text XML
-
Supplement
(2355 KB) - BibTeX
- EndNote


Permafrost soils comprise the single largest pool of terrestrial organic carbon (OC) (Schuur et al., 2015; Hugelius et al., 2014), half of which may be vulnerable to rapid mobilization into modern biogeochemical cycles via abrupt thaw processes (Turetsky et al., 2020; Olefeldt et al., 2016). Permafrost dissolved organic carbon (DOC), typically defined as compounds < 0.7 µm, is often highly susceptible to biotic mineralization into CO2 within aquatic systems (Vonk et al., 2015a; Littlefair and Tank, 2018; Abbott et al., 2014; Mann et al., 2015). Abrupt thaw can mobilize orders of magnitude more particulate organic carbon (POC; typically > 0.7 µm) than DOC, yet the biodegradability of permafrost POC is not well understood (Shakil et al., 2020; Tank et al., 2020; Vonk et al., 2015b).
Suspended particles can be important sites for mineralization (Attermeyer et al., 2018) or mineral protection (Hemingway et al., 2019; Opfergelt, 2020; Groeneveld et al., 2020). In addition to molecular composition and a host of environmental factors that typically affect organic matter decomposition (e.g., microbial activity, nutrient availability) (Kothawala et al., 2021), mineralization of POC in stream networks depends on transport vs. deposition. When settled out, mineralization of POC can be reduced by ∼ 50 % (Richardson et al., 2013) or more, particularly if contained in anoxic sediments (Peter et al., 2016), though carbon release can shift to be in the form of methane (Schädel et al., 2016). Fractions of POC with different density and size therefore not only experience a different settling and transport trajectory but also may have differing processes and rates affecting OC dynamics (Tesi et al., 2016). If biodegradability varies across size and density fractions, this could alter realized mineralization during transport relative to measurements on bulk OC (Tesi et al., 2016).
Warming and intensifying precipitation across the ice-rich terrain of the Peel Plateau in western Canada have triggered an acceleration of thaw-driven landscape erosion in the form of retrogressive thaw slumps (hereafter, slumps) (Kokelj et al., 2021). Thaw slumping along stream sites in this region can increase total organic carbon (TOC) yields by orders of magnitude almost entirely due to increases in POC (Shakil et al., 2020). Slump-derived DOC in the region is relatively more labile than background DOC, as shown by chemical composition and incubations (Littlefair et al., 2017; Littlefair and Tank, 2018). Slump-derived POC chemical composition suggests lower bioavailability as POC sources shift from the active layer and some periphyton material to Pleistocene-aged organic carbon and petrogenic organic carbon mobilized from permafrost (Shakil et al., 2020; Bröder et al., 2021). However, POC bioavailability has not been experimentally assessed. Given that slump-derived carbon occurs almost entirely as POC in this region (Shakil et al., 2020), understanding the fate of this carbon remains a critical knowledge gap.
Our objectives were to assess the potential for slump POC to be mineralized to CO2 during transport in streams. To do this, we undertook experimental incubations to (a) determine whether slump POC differs in biodegradability from POC present in unimpacted waters and (b) quantify and assess the biodegradability of slump-POC fractions relative to their transport potential. This work provides insight into the fate of an understudied component of permafrost-mobilized OC.
2.1 Region and field sampling
Slumping occurs across the Peel Plateau (Fig. 1) and typically mobilizes terrestrial material from three distinct sources: (1) Pleistocene-age tills that have remained preserved within permafrost since deposition by the Laurentide Ice Sheet and subsequent permafrost aggradation; (2) Holocene-age permafrost developed from tills following active layer deepening and/or slumping in previous warm periods, followed by permafrost aggradation during a cooler climate; and (3) a contemporary active layer. Thus, the relative contribution of biogeochemical substrate from these three terrestrial sources to streams can depend on thaw depth (Shakil et al., 2020; Bröder et al., 2021). Source composition can also vary west–east as vegetation (elevation) and geology change along this gradient (Duk-Rodkin and Hughes, 1992; Norris, 1985).
Sampling occurred during July–August, within the Stony Creek and Vittrekwa River watersheds of the Gwich'in Settlement Region on the Peel Plateau (Fig. 1). In 2015, substrate from streams near and within three slump sites (HA, HB, HD) was used to test if mobilization of slump POC and nutrients affect biodegradability of OC in streams. Stream water samples were obtained from channelized runoff within each thaw slump (IN), a downstream location where all runoff entered the valley-bottom stream (DN), and an unimpacted reference stream upstream of slump inflow (UP) (Fig. 1b). Site HD-UP experienced some encroachment of slump runoff and thus was not a fully unimpacted site (Fig. S4). In 2016, substrate was collected upstream of, within, immediately downstream of, and 2.79 km downstream of slump site SE to assess variations in biodegradability with transport potential. In 2019, substrate was collected within and downstream of slump FM3 to follow up results from 2015 and 2016 (details below). Slump sites had varied elevation and morphology, with maximum headwall heights (Fig. 1a) ranging from 7.1 to 23 m (see Shakil et al., 2020). All samples were processed (i.e., filtered) within 24 h of collection, apart from within-slump and downstream samples used for adding particles to “unfiltered” treatments in 2016 that were stored in the dark at 4 ∘C until the start of the experiment. Experiments were initiated within 24 h (2015, 2019) or 48 h (2016) after processing. The extra hold time for the 2016 experiment was due to the extra time needed for size fractionation of samples (see below and Supplement S2). For further sample collection details, see Supplement S1.
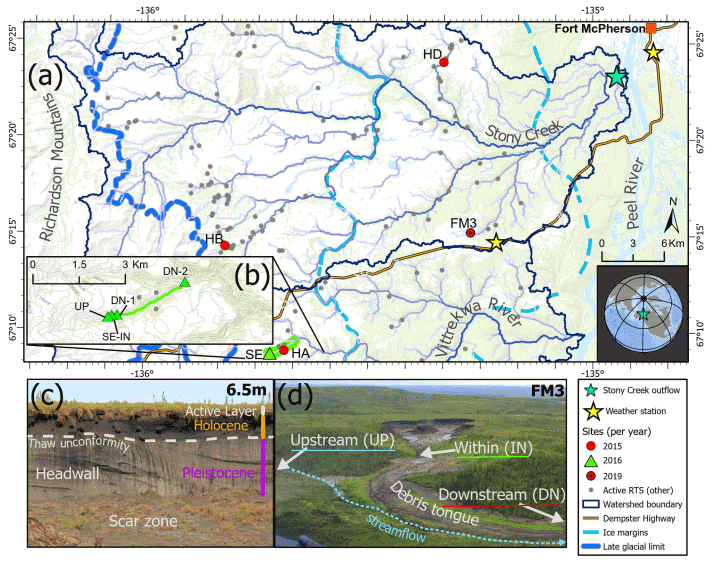
Figure 1(a) Location of slump sites sampled for experiments. (b) 2016 sampling points (green triangles) show sampling locations along a transect which began just upstream of the point where slump SE runoff enters a valley bottom stream. Panel (c) shows headwall units of a slump. Panel (d) shows stream sampling points relative to a slump site, as sampling design used in the 2015 experiment. HA, HB, HD, SE, and FM3 are slump site IDs. Active RTS (retrogressive thaw slump) features are from Segal et al. (2016). Former glacial limits of the Laurentide Ice Sheet (ice margins and late-glacial limit) are delineated from Duk-Rodkin and Hughes (1992). Service layer credits: (1) world topographic map: Northwest Territories, ESRI, © OpenStreetMap contributors 2020, HERE, Garmin, USGS, NGA, EPA, USDA, NPS, AAFC, NRCan. Distributed under the Open Data Commons Open Database License (ODbL) v 1.0. (2) World ocean base: Esri, Garmin, GEBCO, NOAA NGDC, and other contributors. (3) World continents.
2.2 Biodegradation experiments
2.2.1 Effects of POC source, dissolved constituents, and settling (2015)
To test the effect of POC source (Table 1), we incubated unfiltered upstream water (upstream POC; treatment “UU”) and filtered upstream water with a 2 mL addition of slump runoff (slump POC; “SU”) in 120 mL glass serum bottles for 7 d at ca. 20 ∘C in the dark, with continuous end-over-end rotation (4 rpm; Richardson et al., 2013) (Supplement S2, Fig. 2). Control bottles accounted for DOC contained in filtered upstream water alone (no POC control; “UF”). Additionally, we tested for (a) the effect of particle deposition by allowing a replicate set of SU bottles to settle out (“SS”) and (b) the slump-derived release of additional solutes (e.g., nutrients) by mixing slump POC with filtered downstream water (“SD”). Bottles were filled to have no headspace.
2.2.2 Variability as a function of transport potential (2016)
SE within-slump runoff was split into three sieve size fractions (63–2000, 20–63, < 20 µm) by sieving a 0.5 mL aliquot and adding the resultant size fractions to filtered downstream water in 60 mL glass biological oxygen demand (BOD) bottles (Supplement S2, Fig. 2). An unfractionated control (0.5 mL of slump runoff in 60 mL downstream water) was also created, and bottles were incubated for 8 d in the dark at ca. 20 ∘C as above. Since relative concentrations of each size fraction were maintained, the < 20 µm fraction had orders of magnitude greater total suspended solid (TSS) concentrations than the two larger fractions (Table S2). We also incubated filtered and unfiltered (but diluted; Table S2) stream water from sites upstream, downstream, and 2.79 km downstream of SE to accompany size fraction incubations. We characterized POC differences between size fractions using (a) 14C age, (b) percent POC (%POC; POC : TSS), and (c) absorbance and fluorescence spectra of base-extracted particulate organic matter (BEPOM) (Osburn et al., 2012) (Supplement S3). Bottles were filled to have no headspace.

Figure 2Flow chart for processing of (a) 2015 and (b) 2016 experiment. Note that time point two for 2015 occurred shortly after time point one due to rapid oxygen loss. Due to this, and the fact that some bottle replicates had to be removed because of anoxia, only data for time point one are presented in the main paper. Analyses show particulate (POC) and dissolved (DOC) organic carbon and dissolved organic matter (DOM) optics (SUVA254). Flow chart for 2019 is provided in Appendix D.
2.2.3 Measurements
We measured (a) concentrations of DOC, POC, TOC, and SUVA254 (an optical proxy for dissolved organic matter (DOM) aromaticity) (Weishaar et al., 2003) at the beginning and end of incubations and (b) O2 concentrations approximately daily (PreSens, Fibox 4, SP-PSt3-NAU-D5-YOP) to provide insight on rate of change (Richardson et al., 2013). We initially assumed heterotrophic breakdown of OC would be the dominant O2 consumption pathway as respiratory quotients across several freshwater sites have been noted to vary around 1 (Berggren et al., 2012). Incubation O2 concentrations presented never dropped below 2 mg L−1, a threshold well above O2 limiting concentrations for different bacterial species (Stolper et al., 2010, and references therein). One exception was one of four replicates for the SE unfractionated treatment, which was removed and replaced with the mean of replicates for statistics. Our experiments aimed to mimic conditions downstream of slump inflows; thus slump-affected incubations had POC concentrations ranging from 1.4 to 18.6 times DOC concentrations. Samples for TSS concentration were collected alongside POC. Further details are available in Supplement S3.
2.2.4 Follow-up experiments
To assess processes that could consume O2 and/or generate OC (due to O2 losses coupled with OC gains observed in 2015 and 2016), we undertook two follow-up experiments. First, we combined 0.15 mg of sterilized HD debris tongue sediments (collected in 2016) (Zolkos and Tank, 2020) with 18.2 Ω Milli-Q (MQ) water to assess abiotic O2 loss. MQ water was sourced from a machine with a carbon filter and was quality controlled to have less than 10 ppb TOC. We incubated 60 mL glass BOD bottles on a shaker table in the dark at ca. 20 ∘C for 7 d, monitoring O2 as above. Second, we measured the change in dissolved and particulate inorganic carbon (DIC, PIC), in addition to the change in DOC and POC, in an incubation combining FM3 slump runoff with downstream water, including sterilized replicates. The treatments were designed to replicate treatment “SD” in 2015. Sterilization was achieved by autoclaving and adding ZnCl2 as a poison and was validated using plate counts (Supplement S4). We hypothesized that chemosynthesis associated with nitrification and sulfide oxidation (Eqs. 1–2) could generate OC, and so we additionally measured dissolved inorganic nitrogen (NH, NO, NO) via automated colorimetry and sulfate (SO) via ion chromatography at the Canadian Association of Laboratory Accreditation (CALA)-certified Biogeochemical Analytic Service Laboratory (BASL; University of Alberta, further details in Supplement S3.3).
Note that Eq. (2) is a general equation of chemolithoautotrophic reduced sulfur oxidation that can have a variable stoichiometry and assumes sulfur oxidizing bacteria exclusively produce SO rather than both SO and S0 (Klatt and Polerecky, 2015; Nelson et al., 1986). Equation (3) shows a net reaction for a model of pyrite oxidation at circumneutral pH (Percak-Dennett et al., 2017). We note that pH in the streams in this study can be quite variable but tend to be circumneutral, often varying around pH 7 and mostly ranging from pH 6 to 8 (see Supplement data of Shakil et al., 2020). This sulfide oxidation can generate sulfuric acid that can weather carbonates (e.g., Eq. 4) or silicates (Zolkos and Tank, 2020; Zolkos et al., 2020).
Sediments in sterilized and unsterilized bottles were additionally characterized using X-ray diffraction (XRD) (Supplement S3.4), while absorbance and fluorescence spectra of BEPOM and DOM were assessed at the beginning and end of the experiment (see Supplement for further details).
2.3 Data analyses
Two-way ANOVAs, with site and treatment as fixed effects, were used to assess the effect of POC presence (UF vs. SU), source (UU vs. SU), dissolved matrix (SU vs. SD), and settling (SU vs. SS) on percent changes in OC (DOC, POC, and TOC), DOM aromaticity (SUVA254), and O2 loss rate. One-way ANOVAs were also used to assess differences in the aforementioned changes between size fractions (2016 experiment). Two-way ANOVAs were used to assess the effect of distance and filtration (fixed effects) for the 2016 transect experiments. Significant ANOVA tests were followed up with Tukey-adjusted pairwise t tests (Zar, 2010). We also calculated 95 % confidence intervals to evaluate whether OC changes significantly differed from zero. Principal component analyses were used to visualize differences in optical indices between size fractions (2016) and changes in DOM and BEPOM (2019), following the calculation of SUVA254 (DOM only; Weishaar et al., 2003; Poulin et al., 2014) and slope ratios (Helms et al., 2008) on absorbance data, as well as humification indices (HIX; Ohno, 2002), biological indices (BIX; Huguet et al., 2009), the proportion of peaks C and M (Coble, 2007), and previously identified BEPOM peaks (Shakil et al., 2020) on fluorescence data (Supplement 3.6–3.9). To assess factors controlling in situ CO2 and O2 dynamics we calculated departures of O2 and CO2 from atmospheric equilibrium (Vachon et al., 2019) using 2015 in situ measurements of dissolved O2 at several slump sites (Shakil et al., 2020) and coupled CO2 departures (Zolkos et al., 2019). For further details, see Appendix A.
3.1 Effects of POC presence and source (2015)
Across experiments, declines in POC were not observed, and in some cases, POC increased (Fig. 3). Slump runoff addition into filtered upstream water (SU) did not significantly alter %ΔDOC (the percent change in DOC from beginning to end of the experiment), ΔSUVA254 (absolute change in DOM aromaticity), or %ΔTOC (p > 0.05; Table A1, Fig. 3) relative to the upstream filtered control (UF). Similarly, POC source (slump, SU, vs. unfiltered upstream, UU) did not significantly affect %ΔTOC or ΔSUVA254 (p > 0.05; Table A1, Fig. 3). However, %ΔPOC was significantly lower when particles were sourced from slump runoff (SU vs. UU; p < 0.001; Table A1) potentially because particle concentrations were orders of magnitude lower in upstream bottles (Table S2). DOC increased in the presence of upstream particles (UU) but decreased in the presence of slump particles (SU), though this difference was marginally insignificant (Table A1, p=0.053). Despite no effect on %ΔTOC (Table A1), the addition of slump particles (SU) did significantly increase rates of O2 consumption compared to upstream filtered and unfiltered treatments (UF and UU; Fig. 3a–c), though this effect was dependent on slump site (significant interactions; Table A1; note lack of increase for site HD where slump runoff encroached the upstream site).
Table 1Summary of experiments and main results with reference to figures and text sections for details.
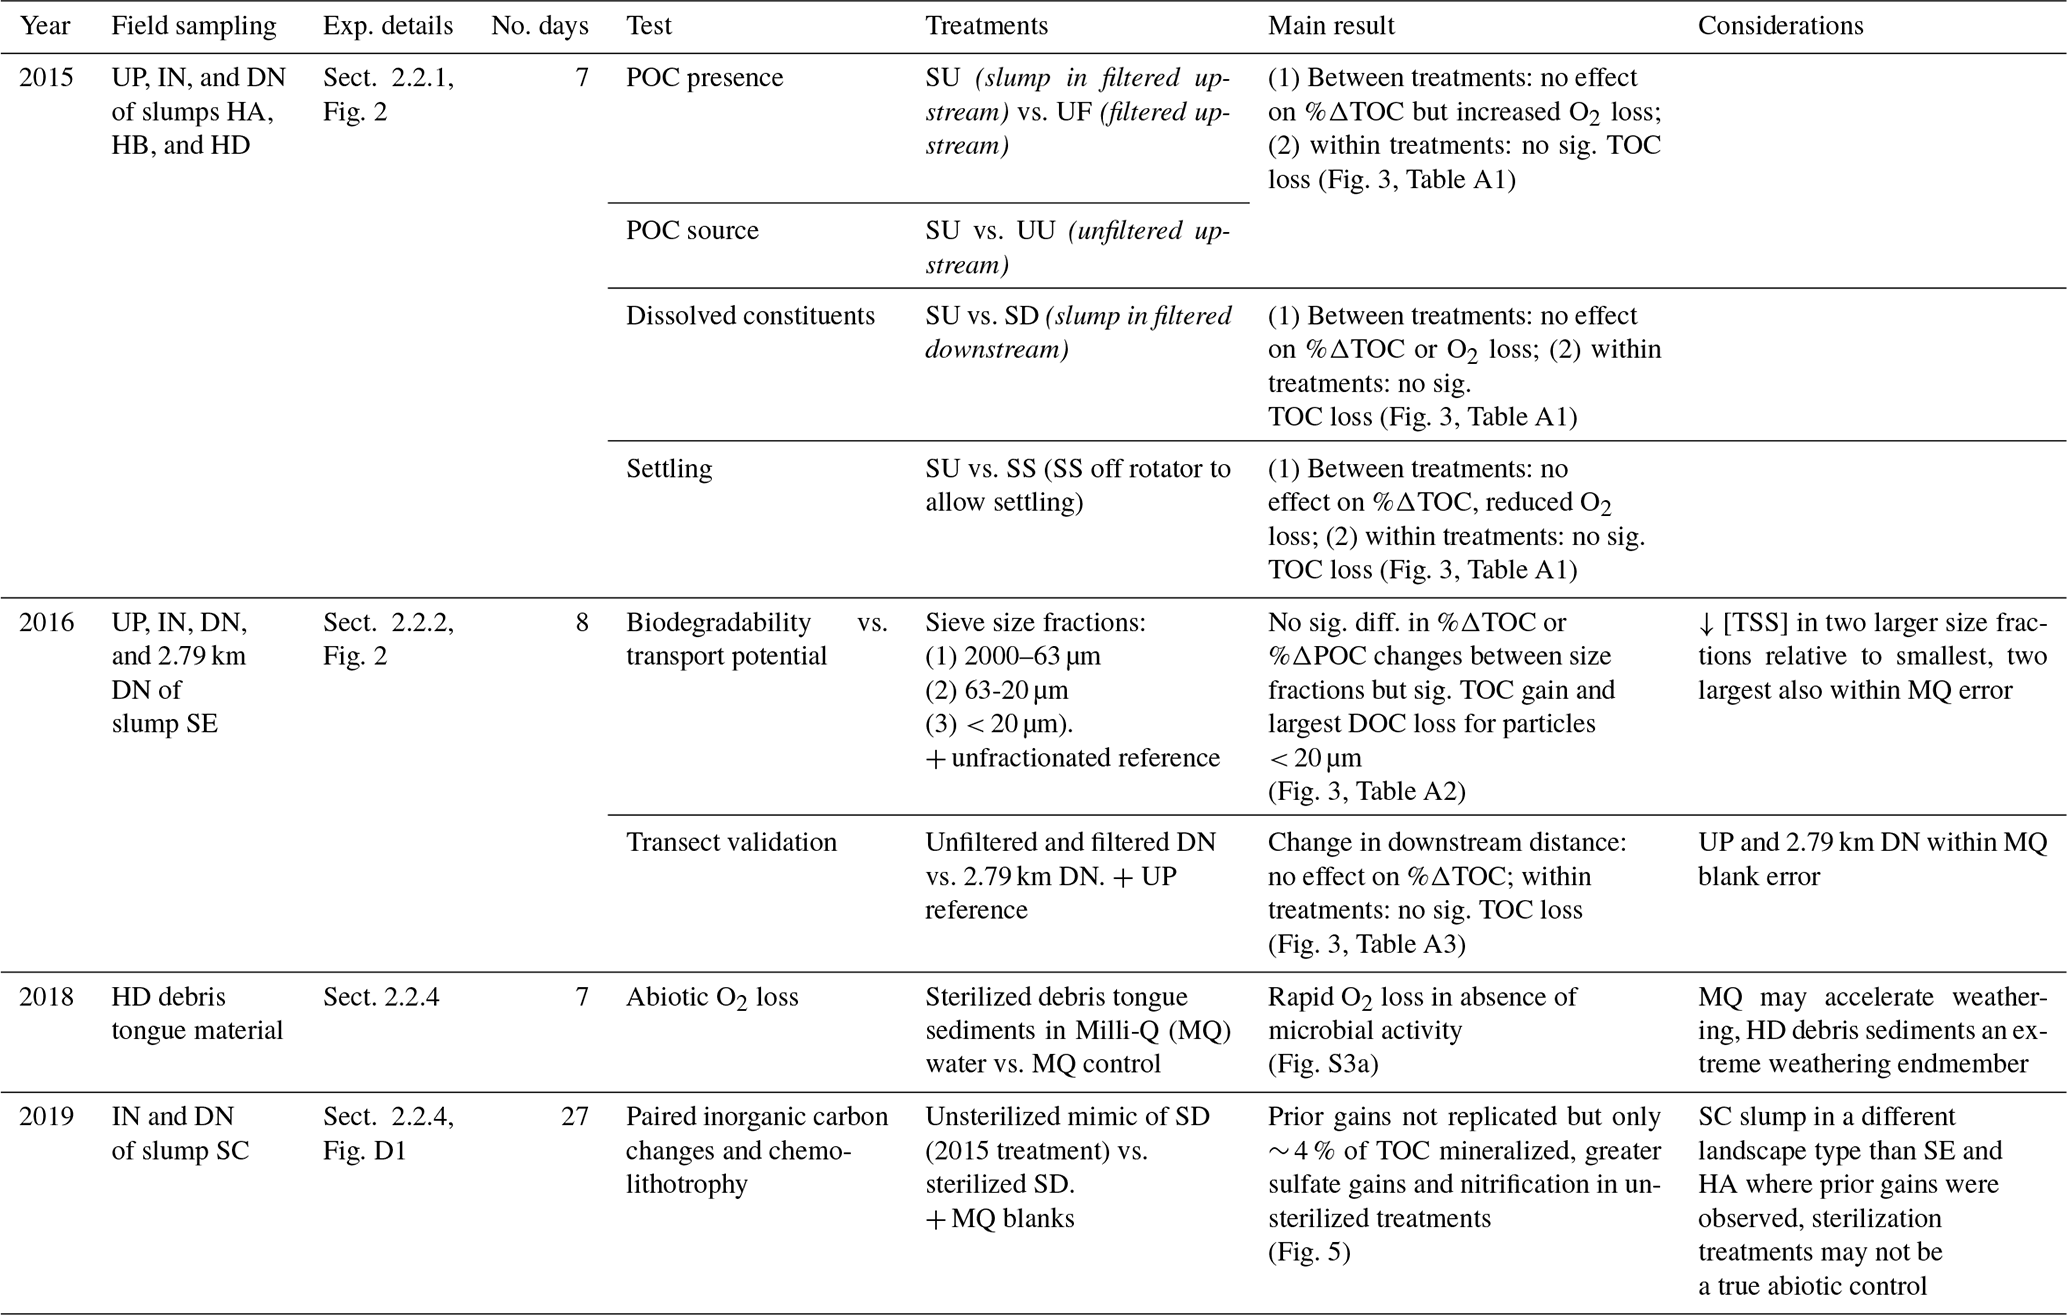
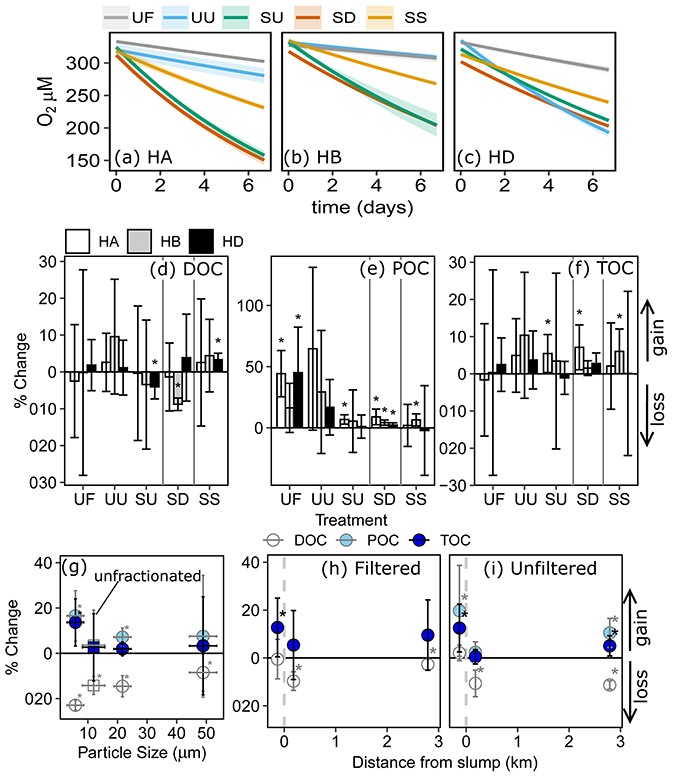
Figure 3(a–c) Modelled (line) O2 (mg L−1) across combinations of source material and settling effects. Percent change in DOC, POC, and TOC in comparison to (d–f) combinations of source material and settling effects, (g) geometric mean particle size, and (h–i) distance from slump site. Vertical errors are 95 % confidence intervals with asterisks marking significant differences from zero. Horizontal errors (e) are particle-size geometric standard deviation. Codes (a–f): filtered (UF) and unfiltered (UU) upstream, slump material in upstream (SU) and downstream (SD) filtrate, and SU settled out (SS). HA, HB, and HD are slump sites. For measured O2 data, see Figs. S1 (2015), S2 (2016), and S3 (2018–2019).
3.2 Effects of background dissolved constituents and settling (2015)
Changing filtrate to downstream water, which has higher ion and nutrient concentrations (Shakil et al., 2020), had no significant effect on any parameter measured in the experiment (SU vs. SD; Table A1). Allowing slump particles to settle (SU vs. SS) did not affect %ΔTOC but did significantly reduce O2 consumption rates. Mean DOC concentrations also switched from decreasing (SU) to increasing (SS) (Fig. 3d), though the difference was not significant (p=0.10; Table A1).
3.3 Variability dependent on transport potential (2016)
Based on 14C age, %POC, and the relative contribution of fluorescent peak C (Coble, 2007), larger particle size fractions appeared to be associated with fresher terrestrial-origin organic matter than smaller size fractions (Appendix B). POC associated with particles < 20 µm dated to > 27 000 cal BP, while POC associated with particles ranging from 20–63 and 63–2000 µm dated to ∼ 19 600 and ∼ 8000 cal BP respectively (Table B1). The majority of POC (73 %; Table B1) was associated with particles less than 20 µm.
Although bottles containing particles < 20 µm displayed significant gains in TOC (95 % CI; Fig. 3g), ANOVA analyses did not uncover a significant difference in %ΔTOC or %ΔPOC between size fractions (Table A2). DOC losses occurred in all treatments downstream of slumps, to a greater degree when particles were present (i.e., unfiltered treatments) (Fig. 3h–i; p < 0.05; Table A3), and were significantly greater when particles were < 20 µm (p < 0.05; Fig. 3g, Table A2). Increases in SUVA254 were also significantly greater for < 20 µm particle treatments (p < 0.05; Tables A2 and C1), as were TSS concentrations (Table S2). The percent DOC loss was also significantly greater 2.79 km downstream of slump SE compared to immediately downstream (Table A3).
3.4 O2 vs. carbon
Change in O2 and TOC generally did not follow the 1:1 trend expected if heterotrophic respiration dominated metabolic processing (Fig. 4a–c). The greatest deviations from 1:1 were observed in treatments containing slump runoff, in which despite large losses in O2, we saw non-significant changes to gains in TOC. Increases in TOC from upstream, filtered, and 2.79 km downstream bottles were within the range of experimental blanks (Fig. 4c).
Although the rate of O2 consumption within and across experiments was generally greater in treatments with greater initial TSS (Fig. 4d), there was no consistent relationship between TOC changes and initial TSS (Fig. 4e). However, some of the greatest TOC increases occurred during incubations of slump SE particles < 20 µm and slump HA particles in upstream (SU) and downstream (SD) filtrate, treatments amongst those with the greatest initial TSS (Fig. 4a, b, e).
In situ comparisons of O2 vs. CO2 showed within-slump samples to have the greatest excess CO2, with several samples substantially departing from the 1 CO2 : −1 O2 stoichiometry associated with heterotrophic respiration (Fig. 4f). In contrast, several downstream and upstream sites displayed measurements close to atmospheric equilibrium for CO2 but were supersaturated for O2 potentially due to temperature changes and lower solubility of O2 (Vachon et al., 2020).
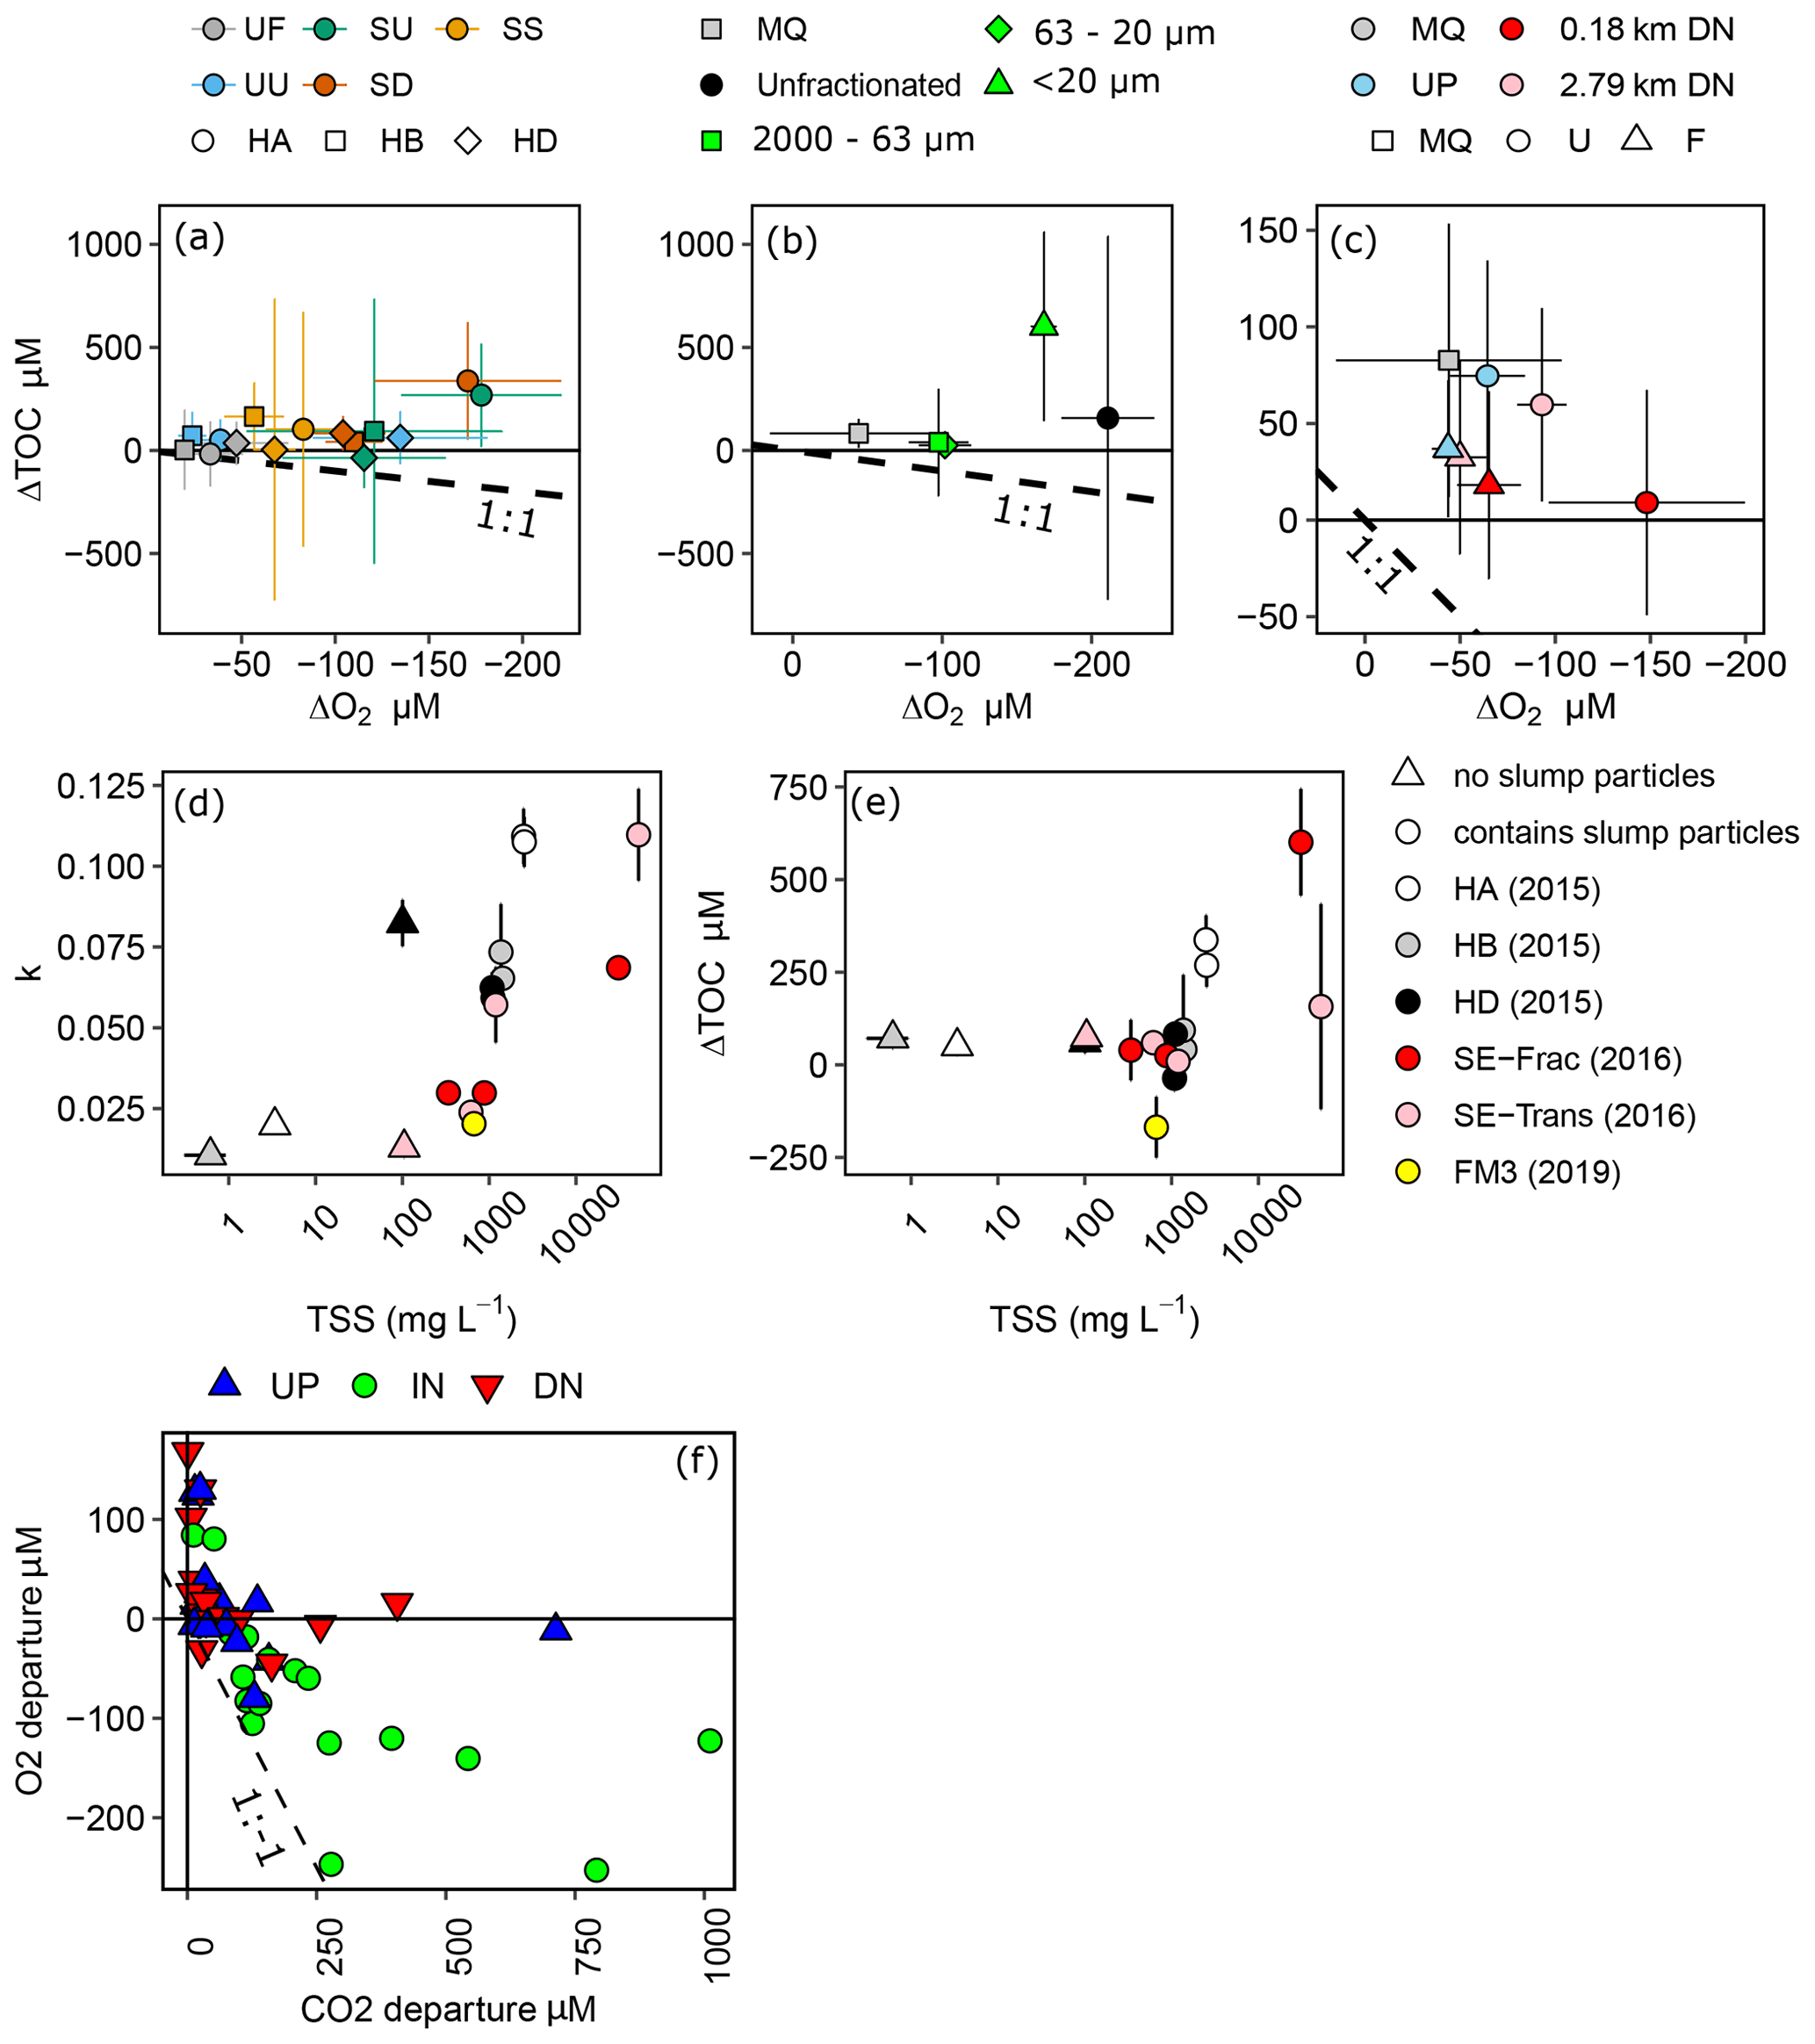
Figure 4Concentration changes in TOC vs. changes in dissolved O2 for (a) 2015 experiments, (b) 2016 site SE fractionation experiment, and (c) 2016 site SE transect experiment. Dashed lines in (a)–(c) represent predicted loss of OC for respiratory quotient = 1, and error bars show 95 % confidence intervals. (d–e) Exponential rate of O2 consumption (k) or changes in TOC vs. initial TSS for treatments across experiments, excluding filtered, settled, and sterilized treatments from (a)–(c). SE-Frac indicates the fractionated treatments from panel (b). (f) Departures of O2 and CO2 from atmospheric equilibrium in samples collected upstream (UP), downstream (DN), and within (IN) a series of slump sites on the Peel Plateau. Error bars in (d) and (e) show standard error of the mean. Codes in (a) are filtered (UF) and unfiltered (UU) upstream, slump material in upstream (SU) and downstream (SD) filtrate, and SU settled out (SS). HA, HB, and HD are slump sites.
3.5 Follow-up experiments
3.5.1 Sterilized debris sediments in Milli-Q water (2018)
Oxygen was completely consumed (∼ 226 µM) in bottles containing sterilized HD debris tongue material suspended in MQ water within 4–5 d, exceeding the O2 loss rates previously observed (Table S1, Fig. S3a). Bottles containing sterilized sediments had lower pH (5.52–6.09) following incubation than MQ controls (6.53–6.91).
3.5.2 Inorganic carbon changes and potential chemolithoautotrophy (2019)
Oxygen consumption occurred in sterilized treatments (−15 ± 6 µM, mean ± 95 % CI, t=27 d) but was more pronounced in unsterilized bottles (−124 ± 15 µM). The pronounced O2 decline in unsterilized bottles was accompanied by a significant loss of DOC (−83 ± 26 µM) and a non-significant loss of POC (−85 ± 261 µM), balancing to a non-significant loss of TOC (−170 ± 262 µM, Fig. 4). Total inorganic carbon (TIC) increased significantly in unsterilized treatments, driven by increases in DIC. In sterilized bottles, modest O2 losses were accompanied by significant DOC losses (−93 ± 51 µM) and significant POC gains (141 ± 33 µM), balancing to a modest non-significant gain in TOC (48 ± 66 µM). TIC in sterilized bottles had a minor significant decrease (−25 ± 20 µM), driven by losses in DIC.
Ammonium (NH) decreased from 8.68 ± 0.47 µM to below detection (0.2 µM) in unsterilized bottles, while NO and NO increased by 2.58 ± 2.36 and 1.33 ± 1.67 µM respectively. In sterilized bottles, NH increased by 6.74 ± 1.80 µM alongside negligible changes in NO and NO. Sulfate (SO) generation was greater in unsterilized (90 ± 6 µM) than sterilized (54 ± 23 µM) bottles, but for both treatments SO increased more than would be expected via pyrite oxidation (Fig. 5d, based on oxygen stoichiometry in Eq. 3). However, the only sulfur-bearing mineral detected in sediments (XRD; 1 wt %–5 wt % detection limit) was pyrite (Table S3).
A biplot of principal component analysis (PCA) components 1 and 2 did not reveal any shifts in BEPOM or DOM optical characteristics during incubation of unsterilized treatments (Fig. 5d–e). However, DOM from sterilized treatments shifted towards lower molecular weight (SR, slope ratio) and lower aromatic material (SUVA254) of greater biological origin (BIX). PC1 separated DOM in sterilized and unsterilized bottles, suggesting the sterilization processes increased the proportion of simple compounds. Since the sterilization process itself appears to increase the proportion of simple compounds, the results caution against its use as an abiotic baseline.
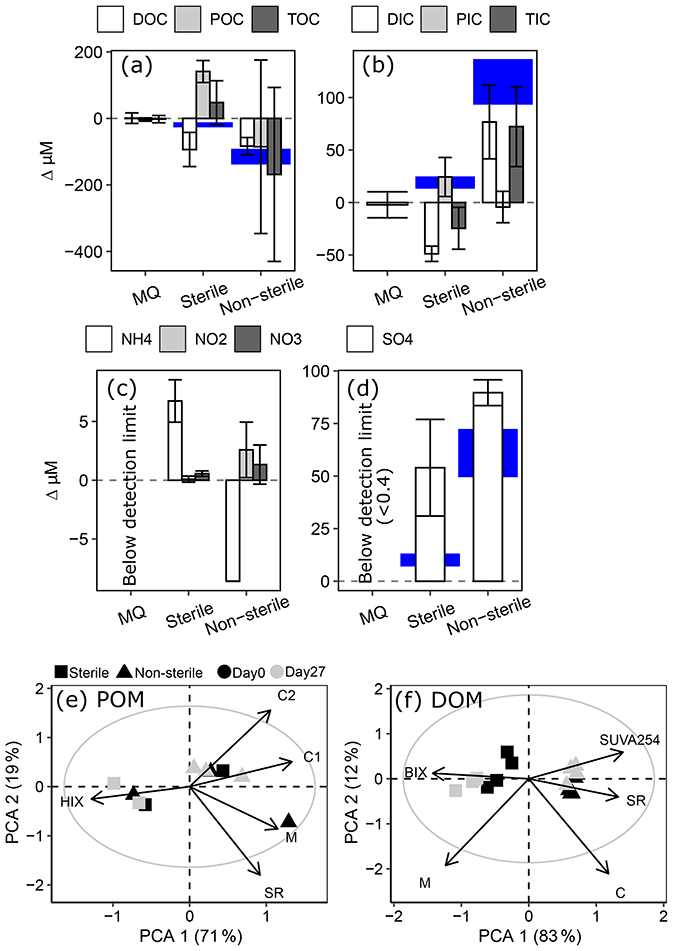
Figure 5Changes in millimolar concentrations of (a) organic carbon; (b) inorganic carbon; (c) ammonium (NH), nitrite (NO), and nitrate (NO); and (d) sulfate (SO) in 2019 test of interferences. Note difference in scales between panels. Blue shading highlights potential carbon gains or losses based on O2 loss and a respiratory quotient of 1 (a–b) and potential SO generated from pyrite oxidation (d; Eq. 3). Error bars and height of blue shading both show a range representing 95 % confidence intervals. (e–f) PCA biplots of components 1 and 2 showing variation in POM (e) and DOM (f) optical properties. Grey circle outlines circle of equilibrium contribution, and plot is shown in scaling 1. Abbreviations of optical indices are provided in Table S5.
Our incubations, coupled with multiple studies examining slump-POC composition (Shakil et al., 2020; Bröder et al., 2021; Keskitalo et al., 2021) indicate that slump-derived POC in glacial landscapes of western Canada has low biodegradability on the Peel Plateau. We found no significant losses of POC or TOC or evidence that %ΔTOC increased due to the presence of slump-derived POC. This finding was consistent across slump sites and for varying size fractions and distances downstream of slump inputs. While %ΔTOC did not significantly differ across size fractions of slump SE particles, particles most likely to remain in transport (< 20 µm) enabled the greatest loss in DOC (linked to greater TSS) and significant gains in TOC. A coupled transect experiment showed that downstream of SE, TOC gains were not significant or were within error of blanks (2.79 km downstream), though both downstream treatments had orders of magnitude lower TSS than the < 20 µm size fraction treatment sourced directly from slump runoff.
The lack of loss in TOC and POC contrasted with elevated O2 consumption rates in incubations using water collected within and downstream of slumps, except for slump HD, where slump runoff encroached into the upstream site (Fig. S4). Despite a lack of TOC or POC loss, oxygen consumption rates in treatments containing particles were always elevated relative to their DOC controls, highlighting that oxygen consumption could not be solely accounted for by DOC mineralization. Instead, TOC gains suggest the potential for chemoautotrophic carbon sequestration. Further, abiotic processes (e.g., mineral oxidation) appear to have the potential to consume oxygen rapidly enough to decouple oxygen and carbon dynamics from the 1:1 relationship associated with heterotrophic respiration, as suggested by sterile incubations of HD debris material. The excess in situ CO2 concentrations we observe are likely from mineral weathering that can generate CO2 in this system (Zolkos et al., 2018).
Our finding of low POC biodegradability is likely conservative since incubations focus on the most labile period (initial 7–27 d) (Richardson et al., 2013). Our longest incubation (27 d; Fig. 5 non-sterile) did not show significant TOC losses, though 95 % error spanning losses expected from a 1:1 relationship with O2 suggests that detection of change may be masked by error in POC measurements (Fig. 5a). Using ΔTIC from our 2019 experiment as an alternate metric of carbon mineralization, we estimate that a maximum of 4 % of the initial TOC pool may have been mineralized within 27 d. The difference in the landscape position and slump morphology of the slump site (SC is further east than slumps HA, HB, and SE) and the longer time period of the incubation (27 d vs. 7–8 d) could have both played a role in the average loss in TOC vs. the gain seen in previous comparable experiments in which slump material was added to downstream water. Time series experiments on TOC degradation from similarly glacially conditioned Qikiqtaruk (Herschel Island) indicate that CO2 production tied to organic matter mineralization ceased by the end of a 120 d incubation, while more than half (∼ 58 %) of total CO2 was produced within the first 27 d (Tanski et al., 2019). Assuming a similar rate for OC mineralization, we can scale up our findings beyond the time of our incubation to estimate that ∼ 7 % of slump-derived TOC on the Peel Plateau may be mineralized during the entirety of time it is transported in streams. Our findings of minimal TOC mineralization are consistent with measures of little change in CO2 concentrations downstream relative to upstream of slumps (Zolkos et al., 2019) despite orders of magnitude increases in POC and thus TOC (Shakil et al., 2020).
While the upper bound of 7 % TOC mineralization calculated from observations in this study is elevated relative to slow rates of mineralization within permafrost (Leewis et al., 2020), it is considerably lower than estimates that greater than 60 % of TOC mobilized by hillslope abrupt thaw will be mineralized on a decadal timescale (e.g., Table S1 in Turetsky et al., 2020), which have been based on mineralization rates observed for DOC in Pleistocene Yedoma landscapes (Vonk et al., 2013). Although similarly elevated rates of DOC mineralization have been noted in other studies (e.g., Spencer et al., 2015; Abbott et al., 2014), these DOC-specific findings have not been consistent in landscapes across the Arctic (e.g., Burd et al., 2020; Wickland et al., 2018) likely due to differences in landscape factors and permafrost composition (Tank et al., 2020). Past studies have also generally not included POC within their assessments of permafrost carbon mineralization, even though POC concentrations within thaw streams can be orders of magnitude greater than for DOC (Vonk et al., 2013; Shakil et al., 2020). Notably, percent TOC loss from this study is substantially lower than percent DOC loss previously observed for this study area (Littlefair and Tank, 2018) likely due to substantial differences in biogeochemical processes occurring in the DOC vs. POC pool upon thaw, interaction with mineral surfaces exposed (see further discussion below), and contrasting headwall sources (Shakil et al., 2020). Our loss estimate is comparable to Tanski et al. (2019), who observed 2 % to 9 % loss rates for incubations of permafrost TOC mixed with seawater and incubated at 16∘C for 120 d. Clearly, our results highlight the need to better understand the relative lability of different organic matter fractions (i.e., DOC vs. POC) and how mineralization rates of these fractions may vary with source (i.e., across landscapes) and receiving environments (lacustrine, fluvial, marine). This increased understanding appears critical for better constraining the magnitude and effective time span of permafrost carbon degradation in Earth system models.
This study and work by Tanski et al. (2019) both suggest DOC contributes substantially more to heterotrophic CO2 production than POC in glacial margin landscapes even where hillslope thermokarst increases fluvial POC by orders of magnitude (Shakil et al., 2020). This seemingly contrasts with the protection of DOM by adsorption to mineral surfaces (Littlefair et al., 2017); however adsorption onto minerals tends to favour humic-like, oxygen-rich compounds, typically considered recalcitrant, over protein-like compounds (Groeneveld et al., 2020). Thus, sorption could “sort” labile carbon into the dissolved phase and relegate intrinsically recalcitrant (“humic-like”, aromatic) carbon to mineral protection as POC. Evidence of this effect includes elevated lability of slump-derived DOM relative to upstream DOM (Littlefair et al., 2017; Littlefair and Tank, 2018), low lability of slump POM (Shakil et al., 2020; this study) and striking compositional similarity of DOC from slump-impacted streams on the Peel Plateau to that from other circumpolar regions with mineral soils (Wologo et al., 2021). However, when particles settle out, anoxia could result in release of adsorbed DOC to the overlying water column (Peter et al., 2016), which may explain the switch from mean DOC decreases to DOC increase in comparisons between rotated and settled slump treatments. Since both selective sorption in the water column and desorption in sediment deposits are likely to happen along the aquatic continuum, it may be difficult to detect or quantify either of these processes in situ. Sorption appeared to occur in 2019 sterilized bottles as DOC concentrations declined but POC increased, and DOM aromaticity and molecular weight decreased. No change in DOM in unsterilized bottles may reflect sorption (loss of aromaticity) and degradation (gain of aromaticity) acting simultaneously, which further underlines challenges in quantifying the process by measuring OC changes in bulk incubations and why DOC declines were not consistently followed by increases or decreases in SUVA254 across experiments, even when losses were consistent as in 2016.
We note that rapid within-slump processing of labile TOC fractions prior to entrainment within streams may still occur, as supported by high within-slump NH concentrations (Shakil et al., 2020) indicative of decomposition (Tanski et al., 2017), low representation of labile compounds in the slump scar zone and stream sediments relative to headwall sources (active layer) (Keskitalo et al., 2021), and excess CO2 in within-slump rill water resulting from both heterotrophic respiration and geogenic production (Zolkos et al., 2019) (Fig. 3f). Past work indicates that OC rapidly lost within-slump may predominantly originate from the active layer (Bröder et al., 2021) and Holocene-age permafrost in areas where organic material buried in colluvial deposits from past slumping has preserved organics (Lacelle et al., 2019). In addition to serving as a possible marker for decomposition, high concentrations of NH may stimulate nitrification and associated chemosynthetic carbon sequestration. Though we did not see significant TOC gains in our 2019 experiment, ammonia loss coupled with nitrite production suggests active nitrification. Nitrifying bacteria have slow growth rates (Sinha and Annachhatre, 2007; Bock and Wagner, 2013), with the molar ratio of NH consumed to carbon fixed ranging from 25–100 (Ward, 2013). Using this stoichiometry and initial NH concentrations estimated across 2015–2016 incubations (Table S4) indicates that nitrification would be unlikely to fix more than 1 µM of carbon, in comparison to OC gains of 601 ± 459 µM (mean ± 95 % CI of SE < 20 µm incubation; Fig. 3b, Table S4). Chemolithoautotrophy by sulfur oxidizing bacteria can also sequester carbon (Klatt and Polerecky, 2015) with the ratio of CO2 sequestered to O2 consumed ranging from 0.09 to 0.41 for aerobic thiosulfate oxidizers (Klatt and Polerecky, 2015). The process has been noted to be an important carbon sequestration mechanism in mine tailings (Li et al., 2019). Although the role of aerobic microorganisms in sulfide oxidation is commonly associated with acidic-pH conditions as in Li et al. (2019), this process can also occur at circumneutral pH (Percak-Dennett et al., 2015). Given the high sediment concentration in streams affected by slumping (can exceed 800 g L−1; Shakil et al., 2020) and the prevalence of sulfide minerals and oxidation across the Peel Plateau (Zolkos et al., 2018), chemolithoautotrophy associated with sulfide oxidation is a mechanism worth exploring as a counterbalance to OC mineralization. Precise techniques such as isotope labelling (Spona-Friedl et al., 2020) and the tracking of genes associated with carbon fixation processes (Percak-Dennett et al., 2017) may circumvent challenges associated with POC measurement errors and tracking multiple processes acting on OC end-point measurements.
Permafrost thaw slumping is increasing TOC concentrations in streams across the Peel Plateau (Canada) by orders of magnitude, almost entirely in the form of POC (Kokelj et al., 2021; Shakil et al., 2020; Keskitalo et al., 2021). Across incubations conducted including slump POC, we found a maximum of 4 % of the initial TOC was lost within 27 d and estimate that this would scale to approximately 7 % of slump-derived TOC being lost during transport in streams. Changes in DOC and POC fractions suggest that this loss is primarily driven by losses in DOC, with slump POC displaying low biodegradability across our incubations. This finding, in addition to previous findings that show that the majority of sediment lost from slumps is quickly deposited in debris tongues rather than immediately transported downstream (Kokelj et al., 2021; Shakil et al., 2020), suggests that the majority of the TOC exiting the slump scar zone is likely to be sequestered in sediments after mobilization to streams. While our experiments examine material exiting rather than within the slump scar zone, thus missing potential within-slump degradation, our estimates highlight that POC degradation rates may be much lower than those for DOC – an important consideration for models of permafrost organic matter degradation, particularly given the dominance of organic matter export in the particulate form from thermokarst features. Our results indicate that even when in suspension, thaw slump-derived POC on the Peel Plateau may be subject to far slower rates of degradation than estimates used in models of carbon release from abrupt permafrost thaw (Turetsky et al., 2020), underlying the need to constrain regional variation in a component of the carbon cycle that has undergone substantial perturbation. Further, increased input of minerals alongside increases in organic carbon into streams creates significant potential for carbon sequestration via abiotic (sorption, mineral protection) and biotic (chemolithotrophy) processes. Targeted investigations of these multiple processes acting simultaneously on carbon dynamics require specific quantification in landscapes experiencing rapid change.
The percent change in OC was used to measure differences in biodegradability:
In Eq. (A1) above, is the DOC, POC, or TOC measured at an end time point, and OCTOaverage is the mean OC measured at the beginning of the experiment. Since multiple outcomes were tested for ANOVAs, p values of main tests were corrected for false discovery rate using p.adjust from R package “emmeans” (Lenth, 2021). For 2015, main tests were corrected for 19 tests since the SU treatment was tested in four comparisons, and three to four outcomes were tested per comparison. For 2016, main tests were corrected for four to five tests since four to five outcomes were tested per ANOVA. Follow-up Tukey- or Games–Howell-adjusted pairwise t tests were conducted only when an interaction or main test of interest was significant. Prior to PCA we (a) used Pearson correlations to remove variables such that no variables within the PCA had a Pearson correlation greater than 0.9, (b) log-transformed all variables to prevent skew, and (c) conducted a detrended correspondence analysis to ensure linearity of the dataset.
Table A1Two-way ANOVAs of tests of sources, filtrate, and settling on biodegradability of POC in 2015 experiments. Follow-up Tukey-adjusted pairwise t tests are shown where significant interactions were present. Since SU treatments were tested three times and multiple outcomes were tested, p values reported in two-way ANOVAs were corrected for false discovery rate (19 tests). Degrees of freedom associated with treatment, site, interaction, and residuals are 1, 2, 2, and 12 respectively for all tests. P values below 0.05 are in bold font. Italic font is used to differentiate follow-up Tukey-adjusted pairwise t tests from two-way ANOVA tests.
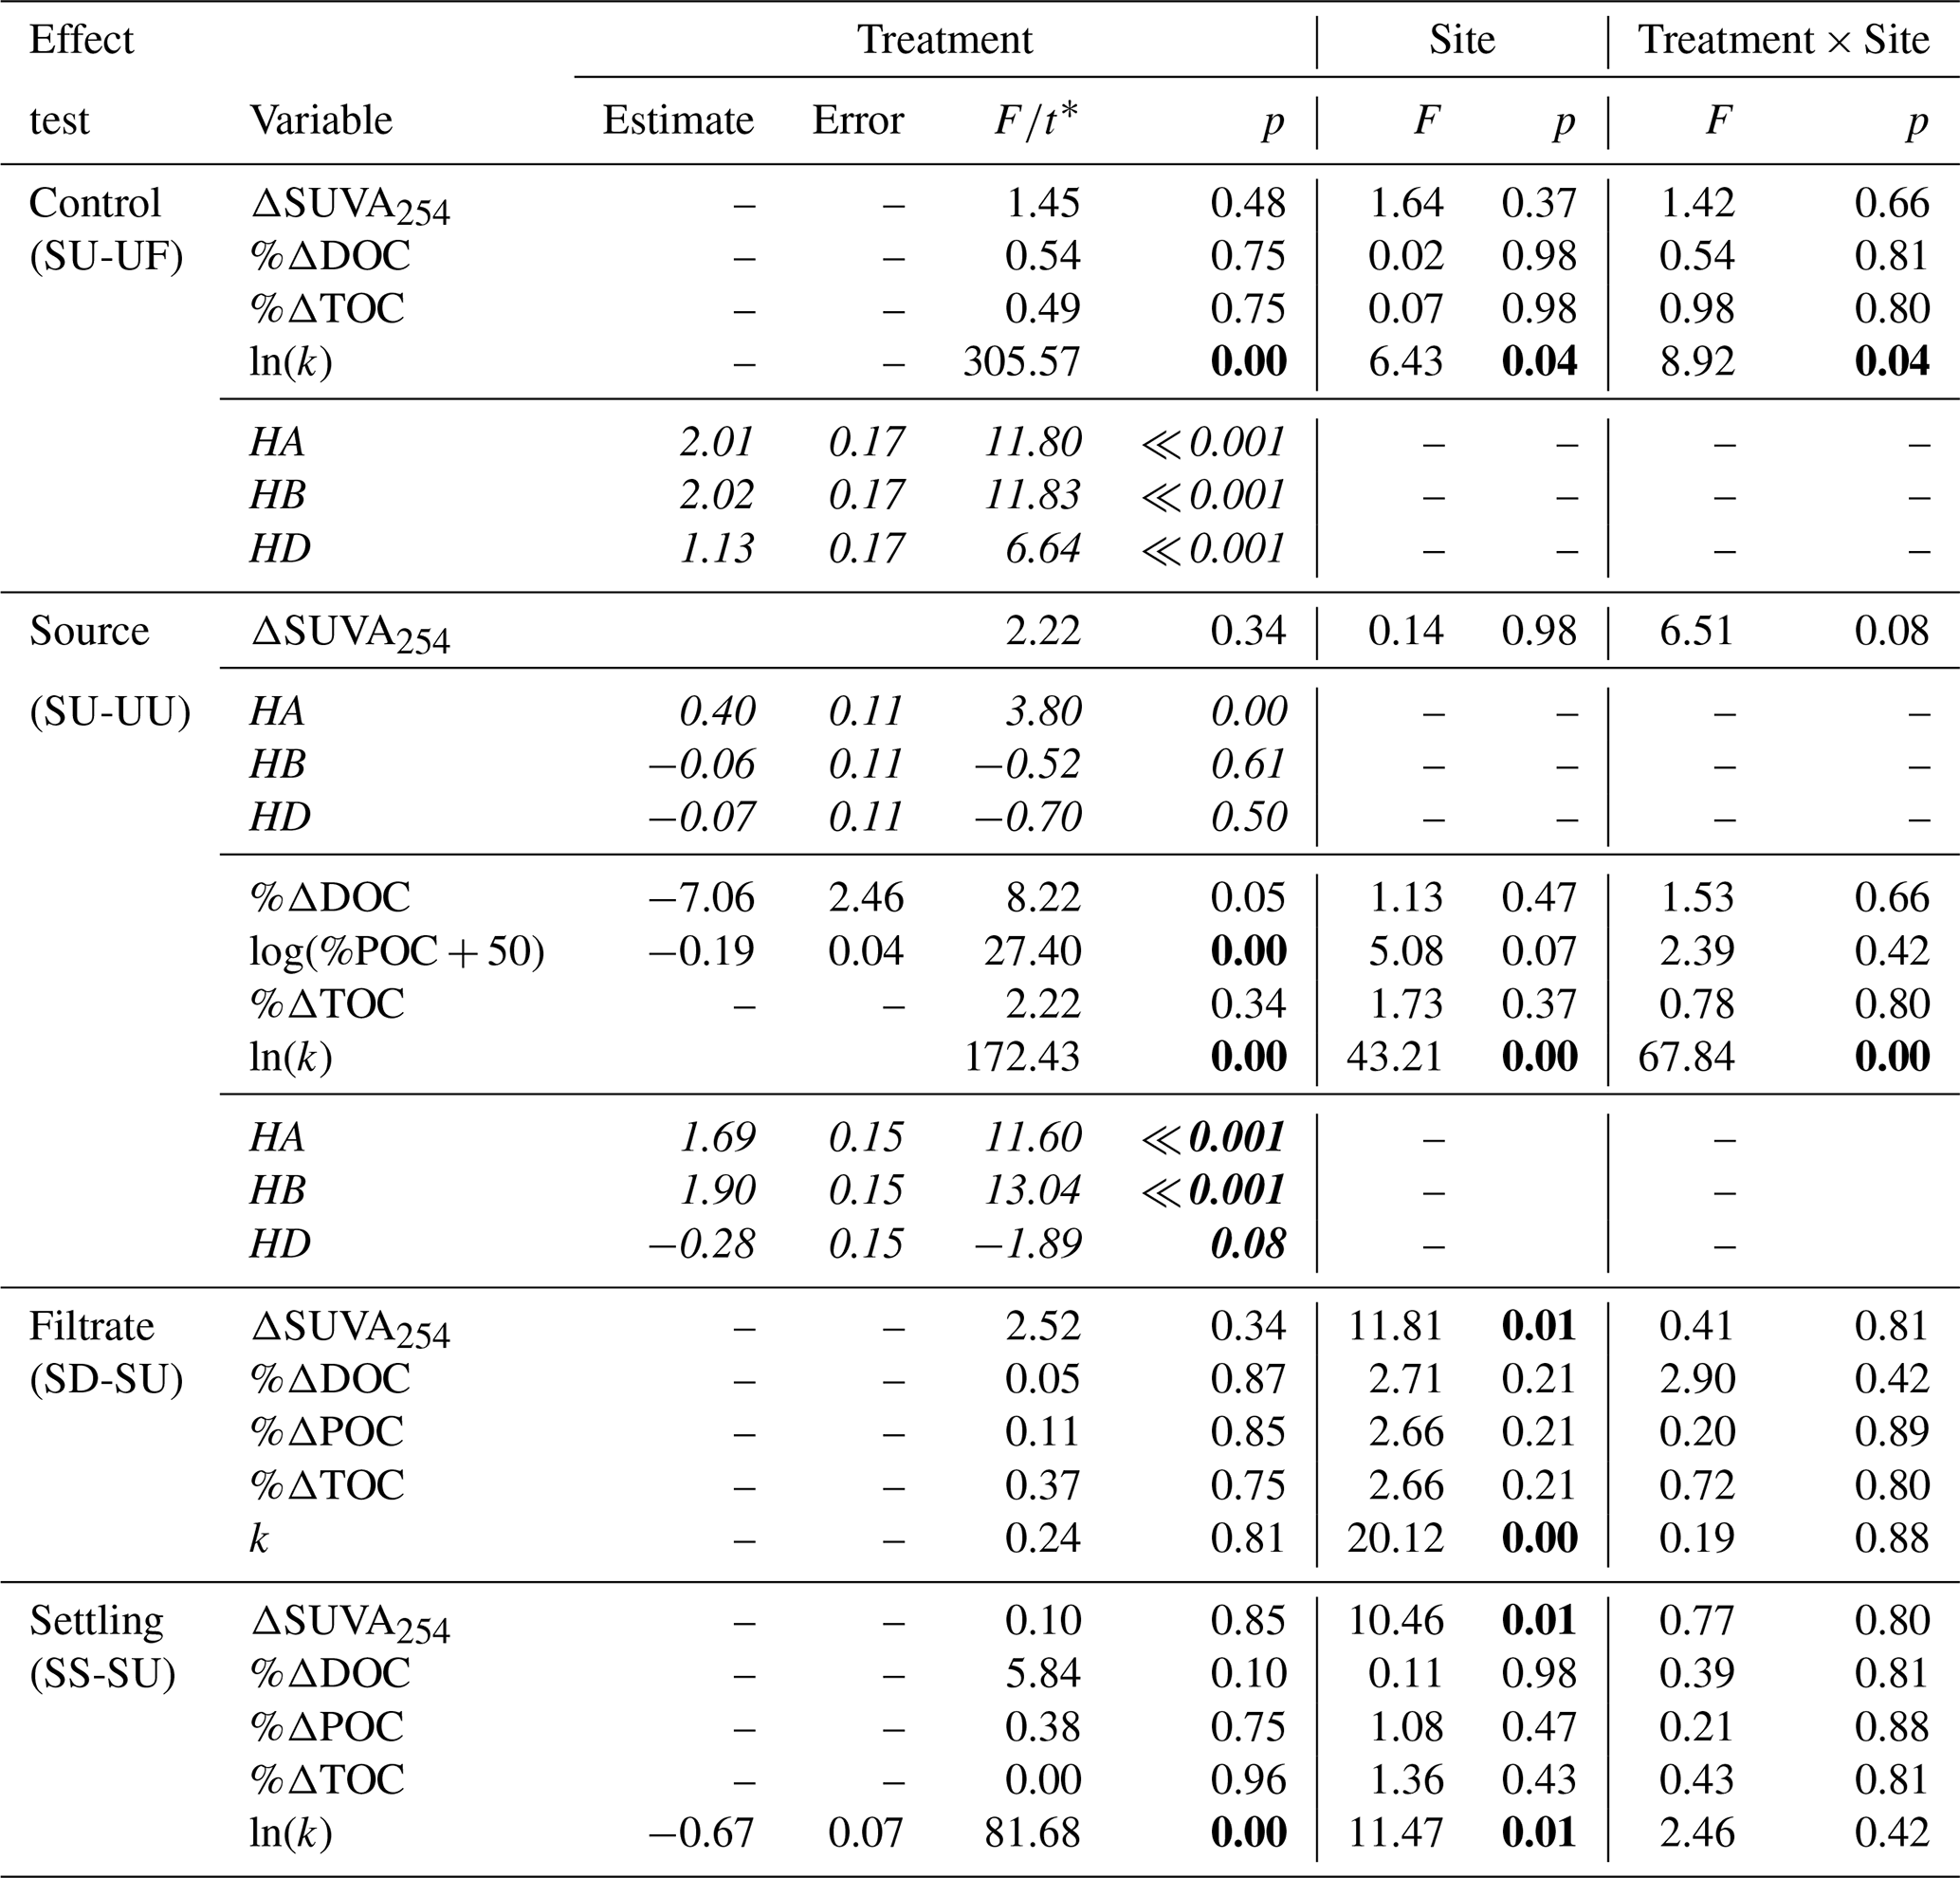
* F values are reported for two-way ANOVAs, and t values are reported for follow-up pairwise t tests.
Table A2Welch’s ANOVA and follow-up Games–Howell pairwise t tests of differences between size fractions (2016 experiment). P values for main ANOVAs are adjusted for false discovery rate to account for multiple outcomes tested (five tests). Follow-up tests were only conducted when main ANOVA tests showed a significant difference. Size fractions: SN = 63–2000 µm, SL = 20–63 µm, SMSC = < 20 µm. P values below 0.05 are in bold font.
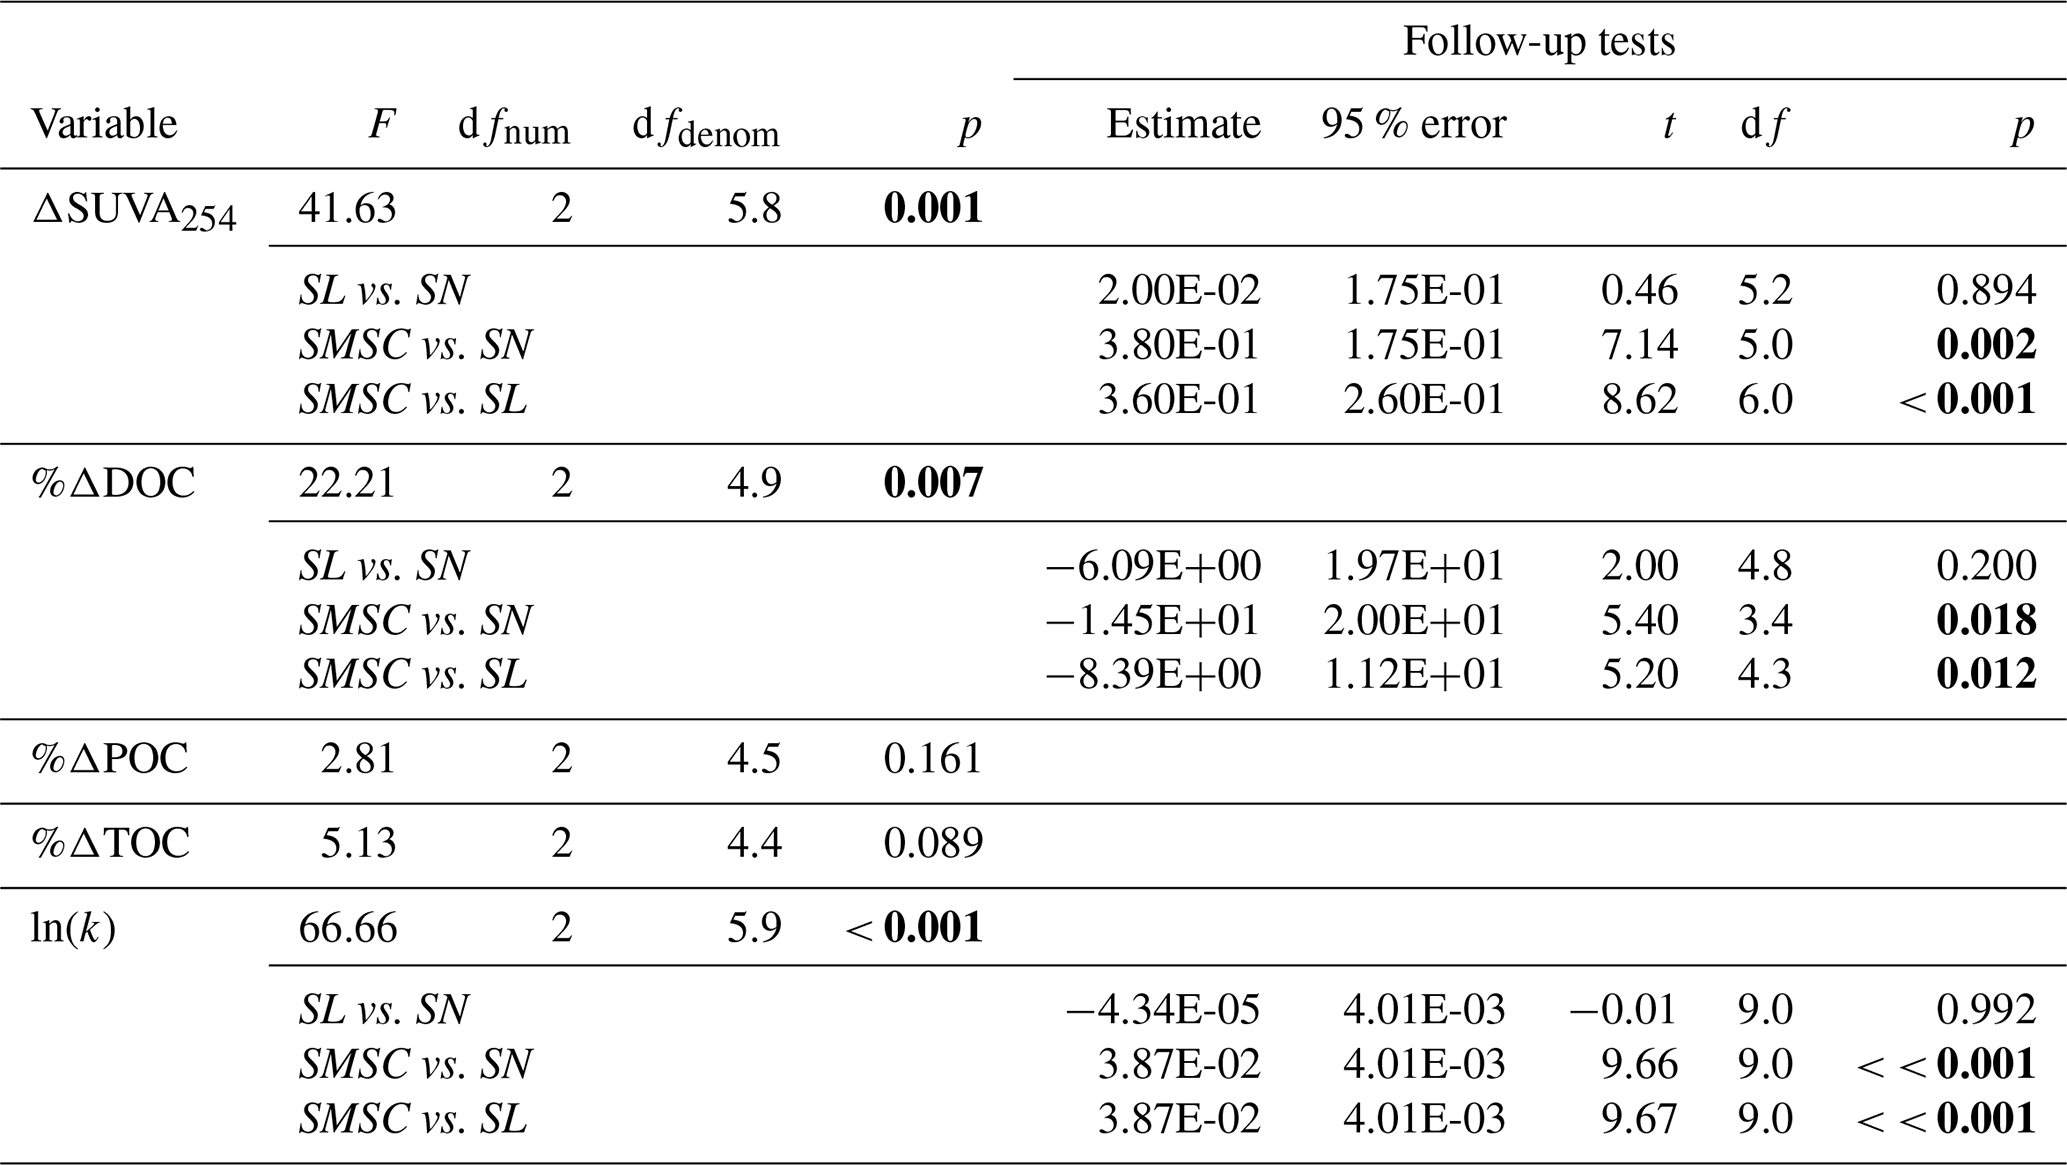
Table A3Two-way ANOVAs for transect experiment examining effects of filtrations (unfiltered vs. filtered) and distance (immediately downstream vs. 2.79 km downstream) from slump SE and interactions between the two. Since multiple (four to five) parameters from the same experiment are tested, p values (in bold if less than 0.050) were corrected for false discovery rate. Degrees of freedom associated with distance, filtration, interaction, and residuals are 1, 1, 1, and 12 respectively for all tests, except %ΔPOC for which degrees of freedom for distance and residuals are 1 and 14 respectively.
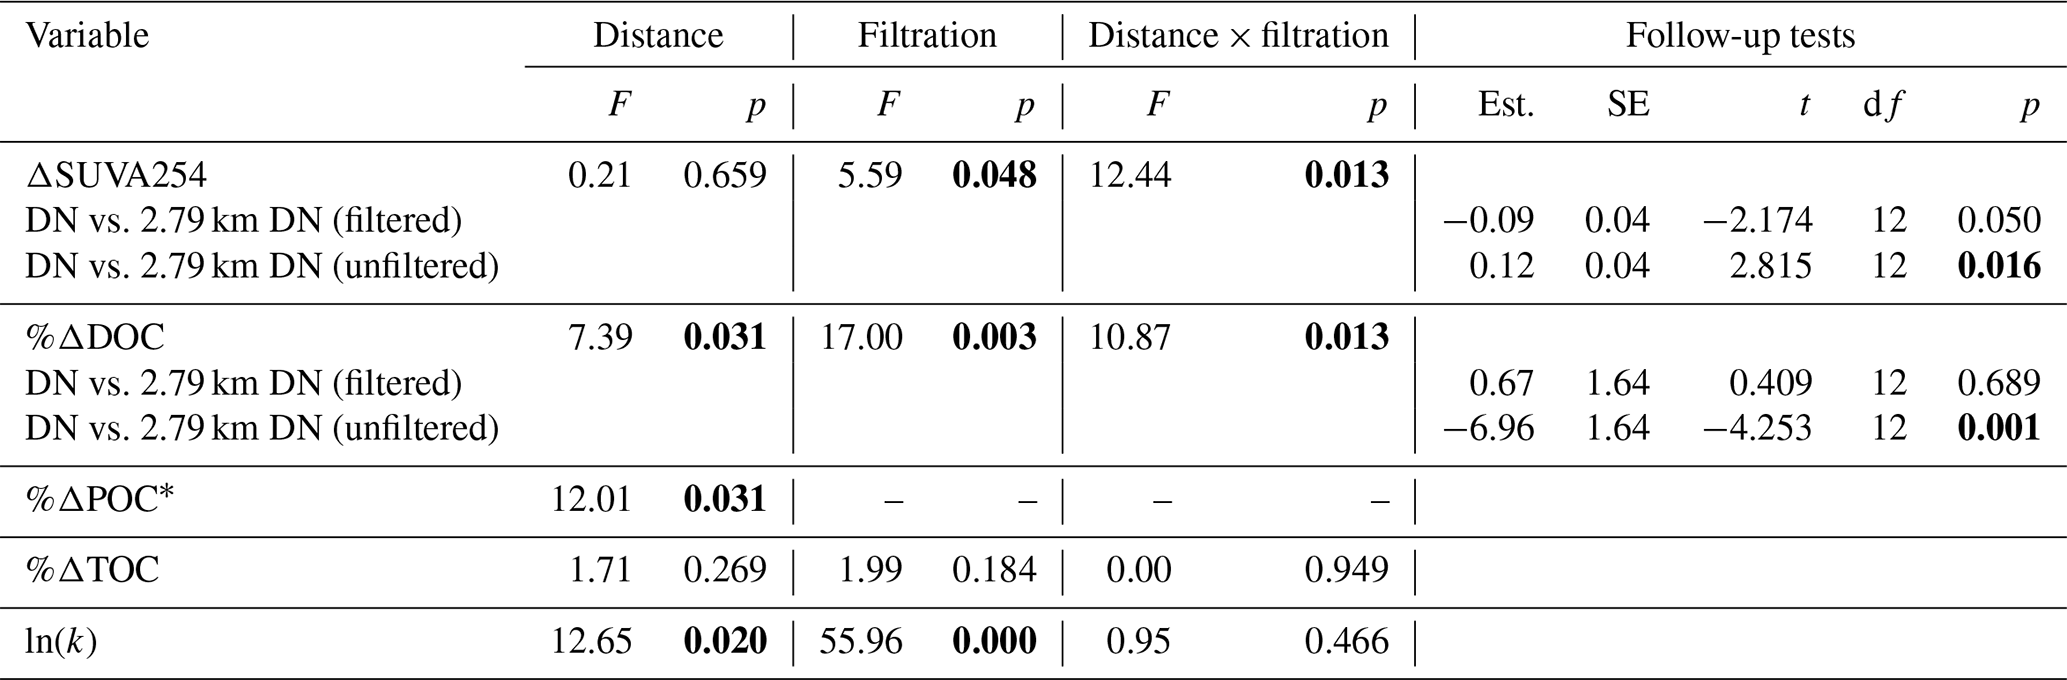
* Percent change in POC not tested for filtration or interaction effect because negligible POC concentrations in filtered treatments.
Size fractions with smaller particle sizes had lower organic matter content (lower percent organic carbon), and associated organic matter had a greater 14C age (Table B1). Extraction of size fractions was conducted in triplicate, but one replicate of the size fraction > 63 µm had to be removed due to optical density concerns (Supplement S3.8). A biplot of PCA components 1 and 2 that explained 92 % of the variation in optical indices of BEPOM revealed that extractions of organic matter in the clay and silt size fractions had a greater relative contribution of UVA humic-like peak C (Fig. B1), which has been characterized as terrigenous organic matter that has undergone less chemical reworking than peak A (Stubbins et al., 2014). While peak C was not negatively correlated with peak A, it was strongly correlated with total absorbance per unit of sediment extracted (Table S6).
Table B1Characteristics of size fractions used in 2016 experiment. %POC indicates POC : TSS. SD = standard deviation. SEM = standard error of the mean.
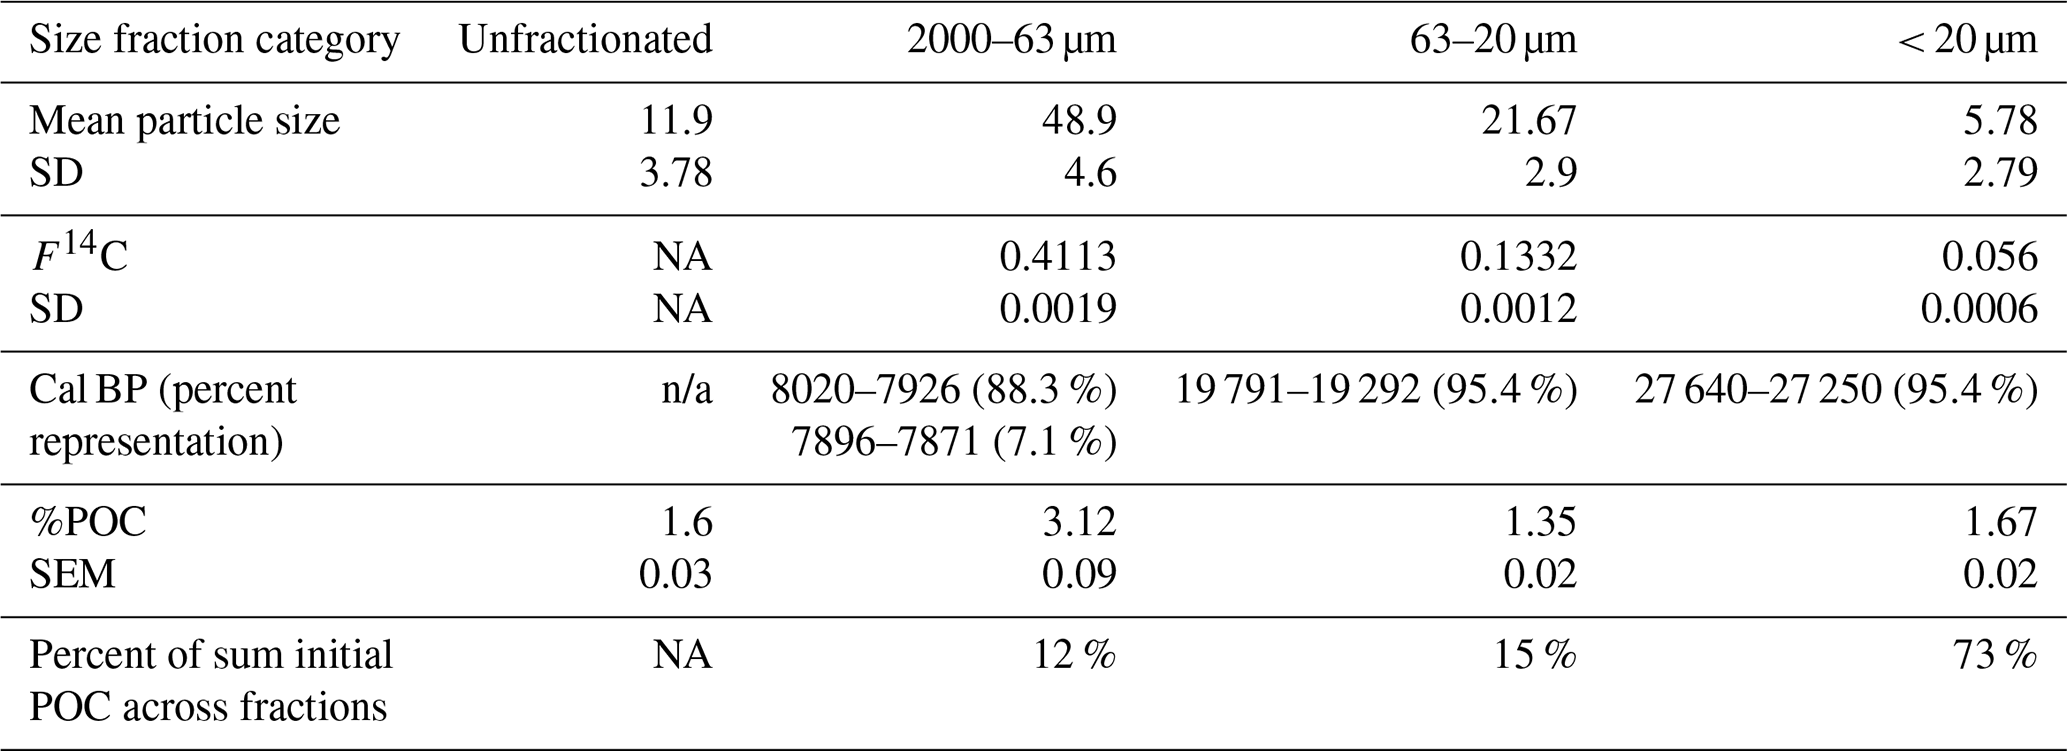
NA: not available. n/a: not applicable.

Figure B1Principal component analysis of optical indices for BEPOM of different size fractions. PCA is shown in scaling 1. The grey circle marks the circle of equilibrium contribution. Abbreviations of optical indices are as in Table S5; SN = 63–2000 µm, SL = 20–63 µm, SMSC = < 20 µm.
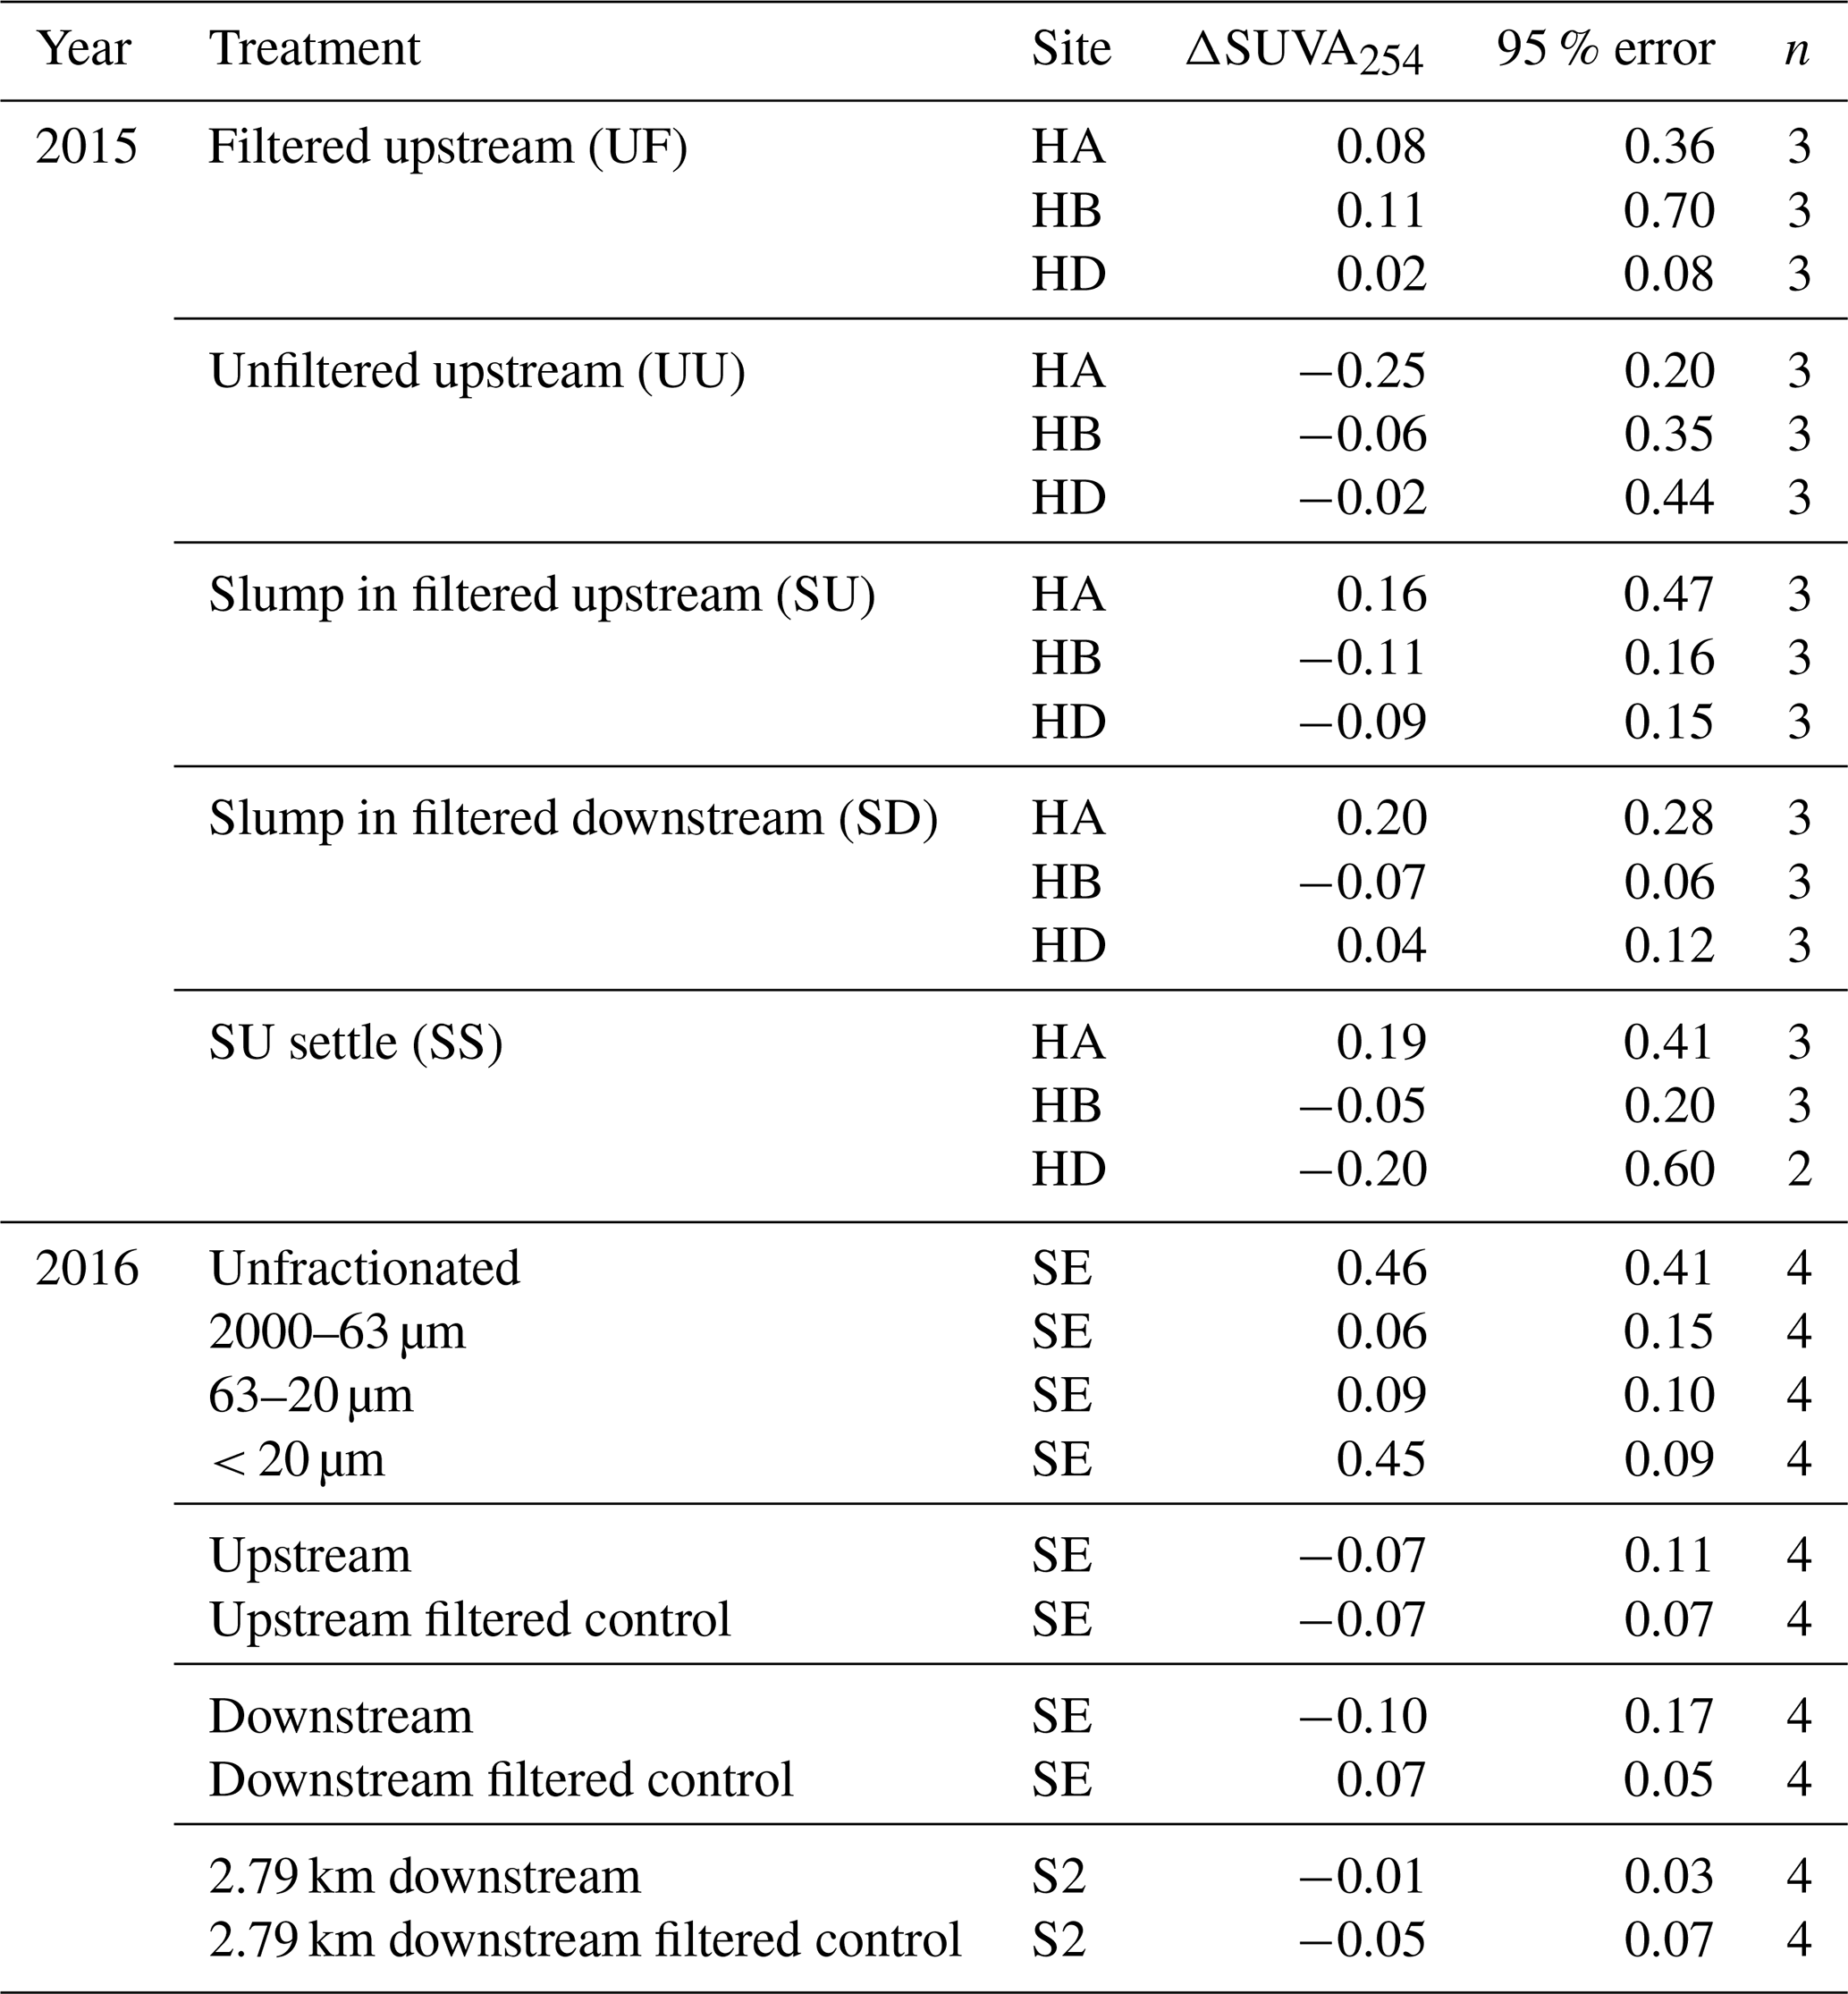

Figure D1Flow chart for processing of 2019 experiment. Note that only two bottle replicates were used to assess changes in base-extracted particulate organic matter (BEPOM) for sterilized treatments. Analyses show particulate (POC) and dissolved (DOC) organic carbon, dissolved organic matter (DOM) optics (absorbance and fluorescence), dissolved (DIC) and particulate (PIC) inorganic carbon, percent particulate nitrogen (PN) and sulfur (PS), dissolved inorganic nitrogen (DIN), SO, weathering ions, and BEPOM.
Data are openly available through the Polar Data Catalogue (CCIN reference no.: 13237) (Shakil et al., 2021).
The supplement related to this article is available online at: https://doi.org/10.5194/bg-19-1871-2022-supplement.
SS and SET led the design of the study. SS led data collection, data analysis and interpretation, and manuscript writing. JEV contributed to the initial development of the idea, and JEV and SZ contributed to study design and data interpretation. SZ contributed to laboratory methods for data collection. All authors contributed to manuscript writing.
The contact author has declared that neither they nor their co-authors have any competing interests.
Publisher’s note: Copernicus Publications remains neutral with regard to jurisdictional claims in published maps and institutional affiliations.
This work took place within the Gwich'in Settlement Region, and we are thankful for support from the Tetlit Gwich'in Renewable Resources Council and Western Arctic Research Centre. We are further thankful for the field assistance of Christine Firth, Elizabeth Jerome, Andrew Koe, Joyce Kendon, Maya Guttman, Luke Gjini, and Lindsay Stephen. Maya Guttman and Joyce Kendon also helped experiment set-up and sample processing. Hailey Verbonac assisted with O2 measurements during our 2015 experiments conducted in Inuvik. This paper also benefitted from helpful discussions with Steve Kokelj with regards to field sampling and perspectives on landscape changes in the region, Matthias Koschorreck and Rafael Marcé with regards to chemoautotrophic processes, and Alex Wolfe who first provided advice to broaden consideration of what affects oxygen and carbon dynamics. The rotator used for incubations was designed and manufactured by technical services staff in the Department of Mechanical Engineering at the University of Alberta, supervised by Roger Marchand. Funding for this study was provided by the Natural Sciences and Engineering Research Council (NSERC), Polar Continental Shelf Program (Natural Resources Canada), Campus Alberta Innovates Program, ArcticNet, CICan Cleantech Internship Program, Environment Canada Science Youth Horizons Internship, Northern Scientific Training Program, University of Alberta and UAlberta North, and the Aurora Research Institute. Personal support to Sarah Shakil was provided by NSERC and the Garfield Weston Foundation. Research for this paper was conducted under NWT research licences 15685 (2015), 15685 (2016), 15887 (2017), and 16575 (2019).
This research has been supported by the Natural Sciences and Engineering Research Council of Canada (grant nos. 430696, 444873, CGS-M, CGS-D, and USRA), the Aurora Research Institute (Aurora Research Fellowship grant), the W. Garfield Weston Foundation (MSc Northern Research Scholarship grant), the University of Alberta (U of A Northern Research Award grant), the Environment Canada (Science Youth Horizons Internship GCXE16S064 and Cleantech Internship grant), the Arctic Institute of North America (Grant-in-Aid grant), and the ArcticNet (project #13 grant), the Polar Continental Shelf Program (Natural Resources Canada) and the Campus Alberta Innovates Program (University of Alberta).
This paper was edited by Nicolas Brüggemann and reviewed by two anonymous referees.
Abbott, B. W., Larouche, J. R., Jones, J. B., Bowden, W. B., and Balser, A. W.: Elevated dissolved organic carbon biodegradability from thawing and collapsing permafrost, J. Geophys. Res.-Biogeo., 119, 2049–2063, https://doi.org/10.1002/2014JG002678, 2014.
Attermeyer, K., Catalán, N., Einarsdottir, K., Freixa, A., Groeneveld, M., Hawkes, J. A., Bergquist, J., and Tranvik, L. J.: Organic Carbon Processing During Transport Through Boreal Inland Waters: Particles as Important Sites, J. Geophys. Res.-Biogeo., 123, 2412–2428, https://doi.org/10.1029/2018JG004500, 2018.
Berggren, M., Lapierre, J.-F., and del Giorgio, P. A.: Magnitude and regulation of bacterioplankton respiratory quotient across freshwater environmental gradients, ISME J., 6, 984–993, https://doi.org/10.1038/ismej.2011.157, 2012.
Bock, E. and Wagner, M.: Oxidation of Inorganic Nitrogen Compounds as an Energy Source, in: The Prokaryotes, edited by: Rosenberg, E., DeLong, E. F., Lory, S., Stackebrandt, E., and Thompson, F., Springer Berlin Heidelberg, Berlin, Heidelberg, 83–118, https://doi.org/10.1007/978-3-642-30141-4_64, 2013.
Bröder, L., Keskitalo, K., Zolkos, S., Shakil, S., Tank, S. E., Kokelj, S. V., Tesi, T., van Dongen, B. E., Haghipour, N., Eglinton, T. I., and Vonk, J. E.: Preferential export of permafrost-derived organic matter as retrogressive thaw slumping intensifies, Environ. Res. Lett., 16, 054059, https://doi.org/10.1088/1748-9326/abee4b, 2021.
Burd, K., Estop-Aragonés, C., Tank, S. E., and Olefeldt, D.: Lability of dissolved organic carbon from boreal peatlands: interactions between permafrost thaw, wildfire, and season, Can. J. Soil Sci., 100, 1–13, https://doi.org/10.1139/cjss-2019-0154, 2020.
Calmels, D., Gaillardet, J., Brenot, A., and France-Lanord, C.: Sustained sulfide oxidation by physical erosion processes in the Mackenzie River basin: Climatic perspectives, Geology, 35, 1003, https://doi.org/10.1130/G24132A.1, 2007.
Coble, P. G.: Marine Optical Biogeochemistry: The Chemistry of Ocean Color, Chem. Rev., 107, 402–418, 2007.
Duk-Rodkin, A. and Hughes, O. L.: Surficial geology, Fort McPherson-Bell River, Yukon-Northwest Territories, Geol. Surv. Can., Series Map 1745A, https://doi.org/10.4095/184002, 1992.
Groeneveld, M., Catalán, N., Attermeyer, K., Hawkes, J., Einarsdóttir, K., Kothawala, D., Bergquist, J., and Tranvik, L.: Selective Adsorption of Terrestrial Dissolved Organic Matter to Inorganic Surfaces Along a Boreal Inland Water Continuum, J. Geophys. Res.-Biogeo., 125, e2019JG005236, https://doi.org/10.1029/2019JG005236, 2020.
Helms, J. R., Stubbins, A., Ritchie, J. D., Minor, E. C., Kieber, D. J., and Mopper, K.: Absorption spectral slopes and slope ratios as indicators of molecular weight, source, and photobleaching of chromophoric dissolved organic matter, Limnol. Oceanogr., 53, 955–969, https://doi.org/10.4319/lo.2008.53.3.0955, 2008.
Hemingway, J. D., Rothman, D. H., Grant, K. E., Rosengard, S. Z., Eglinton, T. I., Derry, L. A., and Galy, V. V.: Mineral protection regulates long-term global preservation of natural organic carbon, Nature, 570, 228–231, https://doi.org/10.1038/s41586-019-1280-6, 2019.
Hugelius, G., Strauss, J., Zubrzycki, S., Harden, J. W., Schuur, E. A. G., Ping, C.-L., Schirrmeister, L., Grosse, G., Michaelson, G. J., Koven, C. D., O'Donnell, J. A., Elberling, B., Mishra, U., Camill, P., Yu, Z., Palmtag, J., and Kuhry, P.: Estimated stocks of circumpolar permafrost carbon with quantified uncertainty ranges and identified data gaps, Biogeosciences, 11, 6573–6593, https://doi.org/10.5194/bg-11-6573-2014, 2014.
Huguet, A., Vacher, L., Relexans, S., Saubusse, S., Froidefond, J. M., and Parlanti, E.: Properties of fluorescent dissolved organic matter in the Gironde Estuary, Org. Geochem., 40, 706–719, https://doi.org/10.1016/j.orggeochem.2009.03.002, 2009.
Keskitalo, K. H., Bröder, L., Shakil, S., Zolkos, S., Tank, S. E., van Dongen, B. E., Tesi, T., Haghipour, N., Eglinton, T. I., Kokelj, S. V., and Vonk, J. E.: Downstream Evolution of Particulate Organic Matter Composition From Permafrost Thaw Slumps, Front. Earth Sci., 9, 181, https://doi.org/10.3389/feart.2021.642675, 2021.
Klatt, J. M. and Polerecky, L.: Assessment of the stoichiometry and efficiency of CO2 fixation coupled to reduced sulfur oxidation, Front. Microbiol., 6, 484, https://doi.org/10.3389/fmicb.2015.00484, 2015.
Kokelj, S. V., Kokoszka, J., van der Sluijs, J., Rudy, A. C. A., Tunnicliffe, J., Shakil, S., Tank, S. E., and Zolkos, S.: Thaw-driven mass wasting couples slopes with downstream systems, and effects propagate through Arctic drainage networks, The Cryosphere, 15, 3059–3081, https://doi.org/10.5194/tc-15-3059-2021, 2021.
Kothawala, D. N., Kellerman, A. M., Catalán, N., and Tranvik, L. J.: Organic Matter Degradation across Ecosystem Boundaries: The Need for a Unified Conceptualization, Trends Ecol. Evol., 36, 113–122, https://doi.org/10.1016/j.tree.2020.10.006, 2021.
Lacelle, D., Fontaine, M., Pellerin, A., Kokelj, S. V., and Clark, I. D.: Legacy of Holocene Landscape Changes on Soil Biogeochemistry: A Perspective From Paleo-Active Layers in Northwestern Canada, J. Geophys. Res.-Biogeo., 124, 2662–2679, https://doi.org/10.1029/2018JG004916, 2019.
Lenth, R. V.: emmeans: Estimated Marginal Means, aka Least-Squares Means. R package version 1.6.0, https://CRAN.R-project.org/package=emmeans, last access: 1 June 2021.
Leewis, M.-C., Berlemont, R., Podgorski, D. C., Srinivas, A., Zito, P., Spencer, R. G. M., McFarland, J., Douglas, T. A., Conaway, C. H., Waldrop, M., and Mackelprang, R.: Life at the Frozen Limit: Microbial Carbon Metabolism Across a Late Pleistocene Permafrost Chronosequence, Front. Microbiol., 11, 1753, https://doi.org/10.3389/fmicb.2020.01753, 2020.
Li, Y., Wu, Z., Dong, X., Xu, Z., Zhang, Q., Su, H., Jia, Z., and Sun, Q.: Pyrite oxidization accelerates bacterial carbon sequestration in copper mine tailings, Biogeosciences, 16, 573–583, https://doi.org/10.5194/bg-16-573-2019, 2019.
Littlefair, C. A. and Tank, S. E.: Biodegradability of Thermokarst Carbon in a Till-Associated, Glacial Margin Landscape: The Case of the Peel Plateau, NWT, Canada, J. Geophys. Res.-Biogeo., 123, 3293–3307, https://doi.org/10.1029/2018JG004461, 2018.
Littlefair, C. A., Tank, S. E., and Kokelj, S. V.: Retrogressive thaw slumps temper dissolved organic carbon delivery to streams of the Peel Plateau, NWT, Canada, Biogeosciences, 14, 5487–5505, https://doi.org/10.5194/bg-14-5487-2017, 2017.
Mann, P. J., Eglinton, T. I., McIntyre, C. P., Zimov, N., Davydova, A., Vonk, J. E., Holmes, R. M., and Spencer, R. G. M.: Utilization of ancient permafrost carbon in headwaters of Arctic fluvial networks, Nat. Commun., 6, 7856, https://doi.org/10.1038/ncomms8856, 2015.
Nelson, D. C., Jørgensen, B. B., and Revsbech, N. P.: Growth Pattern and Yield of a Chemoautotrophic Beggiatoa sp. in Oxygen-Sulfide Microgradients, Appl. Environ. Microbiol., 52, 225–233, 1986.
Norris, D. K.: Geology of the Northern Yukon and Northwestern District of Mackenzie Ottawa, Canada, Geol. Surv. Can., Series Map 1581A, https://doi.org/10.4095/120537, 1985.
Ohno, T.: Fluorescence Inner-Filtering Correction for Determining the Humification Index of Dissolved Organic Matter, Environ. Sci. Technol., 36, 742–746, https://doi.org/10.1021/es0155276, 2002.
Olefeldt, D., Goswami, S., Grosse, G., Hayes, D., Hugelius, G., Kuhry, P., McGuire, A. D., Romanovsky, V. E., Sannel, A. B. K., Schuur, E. A. G., and Turetsky, M. R.: Circumpolar distribution and carbon storage of thermokarst landscapes, Nat. Commun., 7, 13043, https://doi.org/10.1038/ncomms13043, 2016.
Opfergelt, S.: The next generation of climate model should account for the evolution of mineral-organic interactions with permafrost thaw, Environ. Res. Lett., 15, 091003, https://doi.org/10.1088/1748-9326/ab9a6d, 2020.
Osburn, C. L., Handsel, L. T., Mikan, M. P., Paerl, H. W., and Montgomery, M. T.: Fluorescence Tracking of Dissolved and Particulate Organic Matter Quality in a River-Dominated Estuary, Environ. Sci. Technol., 46, 8628–8636, https://doi.org/10.1021/es3007723, 2012.
Percak-Dennett, E., He, S., Converse, B., Konishi, H., Xu, H., Corcoran, A., Noguera, D., Chan, C., Bhattacharyya, A., Borch, T., Boyd, E., and Roden, E. E.: Microbial acceleration of aerobic pyrite oxidation at circumneutral pH, Geobiology, 15, 690–703, https://doi.org/10.1111/gbi.12241, 2017.
Peter, S., Isidorova, A., and Sobek, S.: Enhanced carbon loss from anoxic lake sediment through diffusion of dissolved organic carbon, J. Geophys. Res.-Biogeo., 121, 1959–1977, https://doi.org/10.1002/2016JG003425, 2016.
Poulin, B. A., Ryan, J. N., and Aiken, G. R.: Effects of Iron on Optical Properties of Dissolved Organic Matter, Environ. Sci. Technol., 48, 10098–10106, https://doi.org/10.1021/es502670r, 2014.
Richardson, D. C., Newbold, J. D., Aufdenkampe, A. K., Taylor, P. G., and Kaplan, L. A.: Measuring heterotrophic respiration rates of suspended particulate organic carbon from stream ecosystems: Measuring respiration rates of POC, Limnol. Oceanogr. Methods, 11, 247–261, https://doi.org/10.4319/lom.2013.11.247, 2013.
Schädel, C., Bader, M. K.-F., Schuur, E. A. G., Biasi, C., Bracho, R., Čapek, P., De Baets, S., Diáková, K., Ernakovich, J., Estop-Aragones, C., Graham, D. E., Hartley, I. P., Iversen, C. M., Kane, E., Knoblauch, C., Lupascu, M., Martikainen, P. J., Natali, S. M., Norby, R. J., O'Donnell, J. A., Chowdhury, T. R., Šantrůčková, H., Shaver, G., Sloan, V. L., Treat, C. C., Turetsky, M. R., Waldrop, M. P., and Wickland, K. P.: Potential carbon emissions dominated by carbon dioxide from thawed permafrost soils, Nat. Clim. Change, 6, 950–953, https://doi.org/10.1038/nclimate3054, 2016.
Schuur, E. A. G., McGuire, A. D., Schädel, C., Grosse, G., Harden, J. W., Hayes, D. J., Hugelius, G., Koven, C. D., Kuhry, P., Lawrence, D. M., Natali, S. M., Olefeldt, D., Romanovsky, V. E., Schaefer, K., Turetsky, M. R., Treat, C. C., and Vonk, J. E.: Climate change and the permafrost carbon feedback, Nature, 520, 171–179, https://doi.org/10.1038/nature14338, 2015.
Segal, R. A., Lantz, T. C., and Kokelj, S. V.: Acceleration of thaw slump activity in glaciated landscapes of the Western Canadian Arctic, Environ. Res. Lett., 11, 034025, https://doi.org/10.1088/1748-9326/11/3/034025, 2016.
Shakil, S., Tank, S. E., Kokelj, S. V., Vonk, J. E., and Zolkos, S.: Particulate dominance of organic carbon mobilization from thaw slumps on the Peel Plateau, NT: Quantification and implications for stream systems and permafrost carbon release, Environ. Res. Lett., 15, 114019, https://doi.org/10.1088/1748-9326/abac36, 2020.
Shakil, S., Tank, S., Vonk, J., and Zolkos, S.: Incubation Data Assessing Biodegradability of Organic Carbon Mobilized from Permafrost Thaw Slumps (Peel Plateau, NT, Canada), Waterloo, Canada: Canadian Cryospheric Information Network (CCIN), https://doi.org/10.21963/13237, 2021.
Sinha, B. and Annachhatre, A. P.: Partial nitrification – operational parameters and microorganisms involved, Rev. Environ. Sci. Biotechnol., 6, 285–313, https://doi.org/10.1007/s11157-006-9116-x, 2007.
Spencer, R. G. M., Mann, P. J., Dittmar, T., Eglinton, T. I., McIntyre, C., Holmes, R. M., Zimov, N., and Stubbins, A.: Detecting the signature of permafrost thaw in Arctic rivers, Geophys. Res. Lett., 42, 2830–2835, https://doi.org/10.1002/2015GL063498, 2015.
Spona-Friedl, M., Braun, A., Huber, C., Eisenreich, W., Griebler, C., Kappler, A., and Elsner, M.: Substrate-dependent CO2 fixation in heterotrophic bacteria revealed by stable isotope labelling, FEMS Microbiol. Ecol., 96, fiaa080, https://doi.org/10.1093/femsec/fiaa080, 2020.
Stolper, D. A., Revsbech, N. P., and Canfield, D. E.: Aerobic growth at nanomolar oxygen concentrations, P. Natl. Acad. Sci. USA, 107, 18755–18760, https://doi.org/10.1073/pnas.1013435107, 2010.
Stumm, W. and Morgan, J. J.: Aquatic Chemistry: Chemical Equilibria and Rates in Natural Waters, John Wiley & Sons, 884 pp., ISBN 978-0-471-51185-4, 2012.
Tank, S. E., Vonk, J. E., Walvoord, M. A., McClelland, J. W., Laurion, I., and Abbott, B. W.: Landscape matters: Predicting the biogeochemical effects of permafrost thaw on aquatic networks with a state factor approach, Permafr. Periglac. Process., 31, 358–370, https://doi.org/10.1002/ppp.2057, 2020.
Tanski, G., Lantuit, H., Ruttor, S., Knoblauch, C., Radosavljevic, B., Strauss, J., Wolter, J., Irrgang, A. M., Ramage, J., and Fritz, M.: Transformation of terrestrial organic matter along thermokarst-affected permafrost coasts in the Arctic, Sci. Total Environ., 581/582, 434–447, https://doi.org/10.1016/j.scitotenv.2016.12.152, 2017.
Tanski, G., Wagner, D., Knoblauch, C., Fritz, M., Sachs, T., and Lantuit, H.: Rapid CO2 Release From Eroding Permafrost in Seawater, Geophys. Res. Lett., 46, 11244–11252, https://doi.org/10.1029/2019GL084303, 2019.
Tesi, T., Semiletov, I., Dudarev, O., Andersson, A., and Gustafsson, Ö.: Matrix association effects on hydrodynamic sorting and degradation of terrestrial organic matter during cross-shelf transport in the Laptev and East Siberian shelf seas, J. Geophys. Res.-Biogeo., 121, 731–752, https://doi.org/10.1002/2015JG003067, 2016.
Turetsky, M. R., Abbott, B. W., Jones, M. C., Anthony, K. W., Olefeldt, D., Schuur, E. A. G., Grosse, G., Kuhry, P., Hugelius, G., Koven, C., Lawrence, D. M., Gibson, C., Sannel, A. B. K., and McGuire, A. D.: Carbon release through abrupt permafrost thaw, Nat. Geosci., 13, 138–143, https://doi.org/10.1038/s41561-019-0526-0, 2020.
Vachon, D., Sadro, S., Bogard, M. J., Lapierre, J.-F., Baulch, H. M., Rusak, J. A., Denfeld, B. A., Laas, A., Klaus, M., Karlsson, J., Weyhenmeyer, G. A., and Giorgio, P. A. del: Paired O2–CO2 measurements provide emergent insights into aquatic ecosystem function, Limnol. Oceanogr. Lett., 5, 287–294, https://doi.org/10.1002/lol2.10135, 2020.
Vonk, J. E., Mann, P. J., Davydov, S., Davydova, A., Spencer, R. G. M., Schade, J., Sobczak, W. V., Zimov, N., Zimov, S., Bulygina, E., Eglinton, T. I., and Holmes, R. M.: High biolability of ancient permafrost carbon upon thaw, Geophys. Res. Lett., 40, 2689–2693, https://doi.org/10.1002/grl.50348, 2013.
Vonk, J. E., Tank, S. E., Mann, P. J., Spencer, R. G. M., Treat, C. C., Striegl, R. G., Abbott, B. W., and Wickland, K. P.: Biodegradability of dissolved organic carbon in permafrost soils and aquatic systems: a meta-analysis, Biogeosciences, 12, 6915–6930, https://doi.org/10.5194/bg-12-6915-2015, 2015a.
Vonk, J. E., Tank, S. E., Bowden, W. B., Laurion, I., Vincent, W. F., Alekseychik, P., Amyot, M., Billet, M. F., Canário, J., Cory, R. M., Deshpande, B. N., Helbig, M., Jammet, M., Karlsson, J., Larouche, J., MacMillan, G., Rautio, M., Walter Anthony, K. M., and Wickland, K. P.: Reviews and syntheses: Effects of permafrost thaw on Arctic aquatic ecosystems, Biogeosciences, 12, 7129–7167, https://doi.org/10.5194/bg-12-7129-2015, 2015b.
Ward, B. B.: Nitrification, in: Encyclopedia of Ecology, Elsevier, 351–358, https://doi.org/10.1016/B978-0-12-409548-9.00697-7, 2013.
Weishaar, J. L., Aiken, G. R., Bergamaschi, B. A., Fram, M. S., Fujii, R., and Mopper, K.: Evaluation of Specific Ultraviolet Absorbance as an Indicator of the Chemical Composition and Reactivity of Dissolved Organic Carbon, Environ. Sci. Technol., 37, 4702–4708, https://doi.org/10.1021/es030360x, 2003.
Wickland, K. P., Waldrop, M. P., Aiken, G. R., Koch, J. C., Jorgenson, M. T., and Striegl, R. G.: Dissolved organic carbon and nitrogen release from boreal Holocene permafrost and seasonally frozen soils of Alaska, Environ. Res. Lett., 13, 065011, https://doi.org/10.1088/1748-9326/aac4ad, 2018.
Wologo, E., Shakil, S., Zolkos, S., Textor, S., Ewing, S., Klassen, J., Spencer, R. G. M., Podgorski, D. C., Tank, S. E., Baker, M. A., O'Donnell, J. A., Wickland, K. P., Foks, S. S. W., Zarnetske, J. P., Lee-Cullin, J., Liu, F., Yang, Y., Kortelainen, P., Kolehmainen, J., Dean, J. F., Vonk, J. E., Holmes, R. M., Pinay, G., Powell, M. M., Howe, J., Frei, R. J., Bratsman, S. P., and Abbott, B. W.: Stream Dissolved Organic Matter in Permafrost Regions Shows Surprising Compositional Similarities but Negative Priming and Nutrient Effects, Global Biogeochem. Cy., 35, e2020GB006719, https://doi.org/10.1029/2020GB006719, 2021.
Zar, J. H.: Biostatistical Analysis, 5th Edn., Prentice Hall, Upper Saddle River, N.J., 944 pp., ISBN 9780131008465, 2010.
Zolkos, S. and Tank, S. E.: Experimental Evidence That Permafrost Thaw History and Mineral Composition Shape Abiotic Carbon Cycling in Thermokarst-Affected Stream Networks, Front. Earth Sci., 8, 152, https://doi.org/10.3389/feart.2020.00152, 2020.
Zolkos, S., Tank, S. E., and Kokelj, S. V.: Mineral Weathering and the Permafrost Carbon-Climate Feedback, Geophys. Res. Lett., 45, 9623–9632, https://doi.org/10.1029/2018GL078748, 2018.
Zolkos, S., Tank, S. E., Striegl, R. G., and Kokelj, S. V.: Thermokarst Effects on Carbon Dioxide and Methane Fluxes in Streams on the Peel Plateau (NWT, Canada), J. Geophys. Res.-Biogeo., 124, 1781–1798, https://doi.org/10.1029/2019JG005038, 2019.
Zolkos, S., Tank, S. E., Striegl, R. G., Kokelj, S. V., Kokoszka, J., Estop-Aragonés, C., and Olefeldt, D.: Thermokarst amplifies fluvial inorganic carbon cycling and export across watershed scales on the Peel Plateau, Canada, Biogeosciences, 17, 5163–5182, https://doi.org/10.5194/bg-17-5163-2020, 2020.
- Abstract
- Introduction
- Methods
- Results
- Discussion
- Conclusions
- Appendix A: Data analysis details and ANOVA results
- Appendix B: Characterization of each size fraction
- Appendix C: Absolute changes in SUVA254
- Appendix D: Flow chart of 2019 experiment
- Data availability
- Author contributions
- Competing interests
- Disclaimer
- Acknowledgements
- Financial support
- Review statement
- References
- Supplement