the Creative Commons Attribution 4.0 License.
the Creative Commons Attribution 4.0 License.
 | 20 Jun 2022
To what extent can soil moisture and soil Cu contamination stresses affect nitrous species emissions? Estimation through calibration of a nitrification–denitrification model
Laura Sereni
Bertrand Guenet
Charlotte Blasi
Olivier Crouzet
Jean-Christophe Lata
Isabelle Lamy
Continental biogeochemical models are commonly used to predict the effect of land use, exogenous organic matter input or climate change on soil greenhouse gas emission. However, they cannot be used for this purpose to investigate the effect of soil contamination, while contamination affects several soil processes and concerns a large fraction of land surface. For that, in this study we implemented a commonly used model estimating soil nitrogen (N) emissions, the DeNitrification DeCompostion (DNDC) model, with a function taking into account soil copper (Cu) contamination in nitrate production control. Then, we aimed at using this model to predict N2O-N, NO2-N, NO-N and NH4-N emissions in the presence of contamination and in the context of changes in precipitations. Initial incubations of soils were performed at different soil moisture levels in order to mimic expected rainfall patterns during the next decades and in particular drought and excess of water. Then, a bioassay was used in the absence or presence of Cu to assess the effect of the single (moisture) or double stress (moisture and Cu) on soil nitrate production. Data of nitrate production obtained through a gradient of Cu under each initial moisture incubation were used to parameterise the DNDC model and to estimate soil N emission considering the various effects of Cu. Whatever the initial moisture incubation, experimental results showed a NO3-N decreasing production when Cu was added but depending on soil moisture. The DNDC-Cu version we proposed was able to reproduce these observed Cu effects on soil nitrate concentration with r2 > 0.99 and RMSE < 10 % for all treatments in the DNDC-Cu calibration range (> 40 % of the water holding capacity) but showed poor performances for the dry treatments. We modelled a Cu effect inducing an increase in NH4-N soil concentration and emissions due to a reduced nitrification activity and therefore a decrease in NO3-N, N2O-N and NOx-N concentrations and emissions. The effect of added Cu predicted by the model was larger on N2-N and N2O-N emissions than on the other N species and larger for the soils incubated under constant than variable moisture. Our work shows that soil contamination can be considered in continental biogeochemical models to better predict soil greenhouse gas emissions.
- Article
(883 KB) - Full-text XML
-
Supplement
(670 KB) - BibTeX
- EndNote


The increase in atmospheric greenhouse gases (GHG) like CO2, CH4 or N2O is expected to induce a global climate change with higher mean temperature or changes in rainfall patterns with projections of increased precipitations or droughts depending on regions (Knutti and Sedláček, 2012). These modifications in rainfall patterns may impact soil moisture, which is one of the main drivers of soil microbial activity (Moyano et al., 2013; Schimel, 2018; Stark and Firestone, 1995). Microbial communities ensure key activities supporting numerous ecosystem functions, such as those involved in nitrogen (N) cycle influencing N2O emissions (Butterbach-Bahl et al., 2013; Galloway et al., 2008) and are at the origin of more than 80 % of N2O fluxes (IPCC, 2019). In particular, nitrification–denitrification processes are largely controlled by the local (an-)oxic treatments and therefore by soil moisture (Borken and Matzner, 2009; Fierer et al., 2003; Guo et al., 2014; Schimel, 2018), denitrification being the main source of soil N2O emission for moist soils whereas for dry soils N2O emissions are mainly due to nitrification (Bateman and Baggs, 2005). N soil flux dynamics are thus particularly difficult to predict at a large scale because of this strong dependency on local soil O2 availability (Khalil et al., 2004). Despite this, some continental biogeochemical models have shown improved predictions when the N cycle was explicitly represented (Butterbach-Bahl et al., 2009; Kesik et al., 2005; Vuichard et al., 2019).
In addition to climate change, human activities introduce significant quantities of contaminants into the environment, such as trace elements (TEs), which are persistent and can be toxic for soil biota (Bech et al., 1997; Giller et al., 2009). Indeed, the contamination of soils by TE has become a major concern at the global scale (De Vleeschouwer et al. 2007; Khan et al. 2008) coming from atmospheric sources (Steinnes et al., 1997) or through the use of pesticides (Nicholson et al., 2003). In particular, TE contaminations are known to largely affect soil microorganisms (Bååth, 1989; Giller et al., 2009) and their activities, such as nitrification–denitrification processes (Broos et al., 2007; Mertens et al., 2010). Therefore, the combined effect of climate change and of soil contamination may largely impact the emissions of NOx and N2O from soils (Holtan-Hartwig et al., 2002; Vásquez-Murrieta et al. 2006). However, the effect of the interactions between climate change and soil contamination on the GHG emissions is still poorly documented (Rillig et al., 2019; Zandalinas et al., 2021).
Despite recent progress, the Earth system models (ESMs) used to predict future climate change still do not take into account the soil contamination effect on GHG emissions (Anav et al., 2013) in spite of the fact that at a large spatial scale many soils are listed as contaminated (Rodríguez-Eugenio, 2018; Lado et al., 2008). Furthermore, soil biogeochemical models are often used to estimate loss or accumulation of N species (ammoniac NH4 volatilisation, nitrate NO3 leaching) (Giltrap et al., 2010) or their respective concentrations under scenarios of organic fertiliser amendments but do not take into account the contamination which often occurs simultaneously (Wuana and Okieimen, 2011). Thus, there is a growing need to provide continental models combining ecotoxicological/contamination and climate change concerns. Among the biogeochemical models, DeNitrification DeCompostion (DNDC, Li et al., 1992) is a relatively simple model handling both biogeochemistry of denitrification and microbial growth (Li et al., 2000), and on which the land surface model soil N component – a part of ESMs like ORCHIDEE – is built (Vuichard et al., 2019).
In order to improve model outputs, this study combines, in an innovative way, experimental and modelling approaches to evaluate the impact of soil moisture on the sensitivity of nitrification to copper (Cu) toxicity and consequently on GHG N emissions. Cu was chosen as a model of soil contamination due to both its relevance in agricultural soils and available data in the literature (Broos et al., 2007; Mertens et al., 2010; Sauvé et al., 1999). It is not straightforward to assess distinct effects between punctual or chronic contamination on microbial structure or soil functions (Brandt et al., 2010; Oorts et al., 2006; Smolders et al., 2009). Here, we designed experiments to assess the conjugated effects of trace metal contamination and soil moisture stress on soil N cycle. Soil initial incubations were run for 5 weeks by applying a given soil moisture from drought to water saturation. Then, a bioassay with a gradient of Cu added by spiking was performed to estimate production. The experimental data were used to calibrate a new model, DNDC-Cu, able to predict NOx and N2O emissions with the implementation of new functions considering the effect of Cu concentration ([Cu]) on nitrification–denitrification processes. Our hypothesis is that the building of such a model allows a gain in the understanding of the effect of a soil [Cu] on NOx and N2O and NH4 cycling in a climate change context. Hence, data are also used here to discuss knowledge gaps in such modelling approaches and to question the matter of soil contamination data in climate change scenarios.
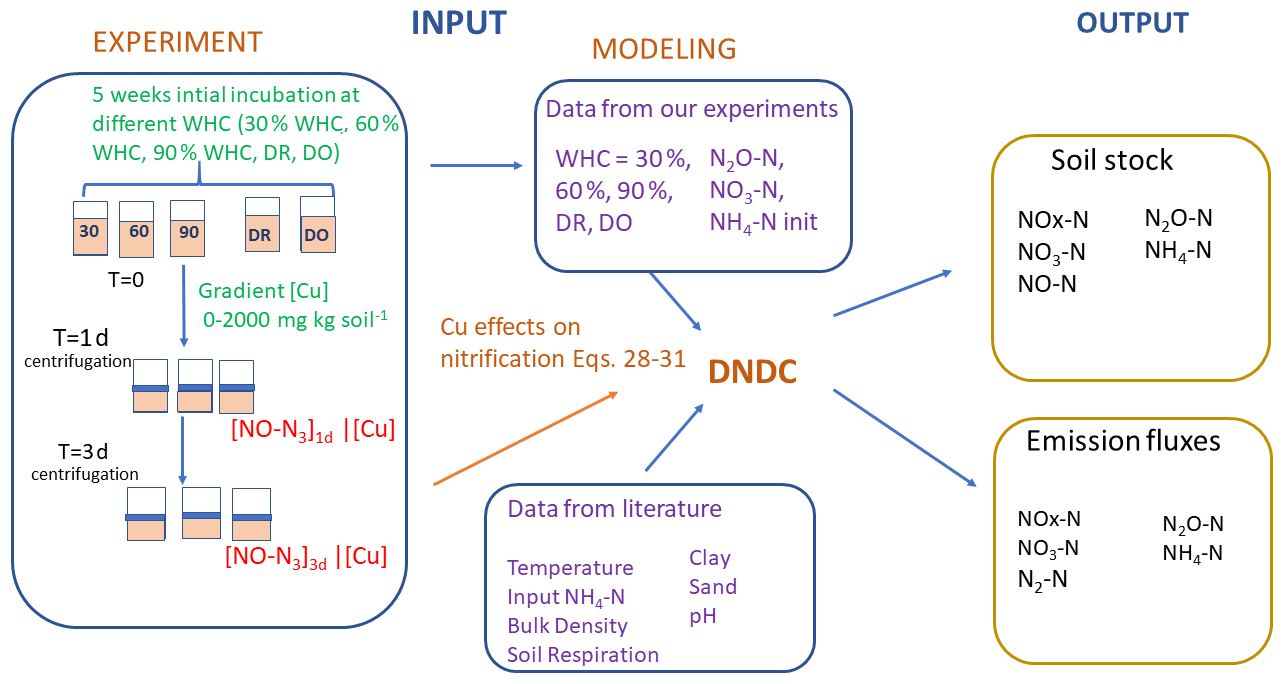
Figure 1Schematic representation of the experimental and modelling procedures. Left refers to the experimental part and centre to right to the modelling part. Soils were first incubated 5 weeks at different constant percentages of the water holding capacity (WHC) or at two variable moisture levels, Dry-Only (DO) and Dry-Rewet (DR). Then NO2-N, NO3-N and NH4-N soil concentrations were measured after this initial incubation, and values were used to initialise DNDC, while a bioassay was also applied to soil aliquots. The 3 d bioassay included in excess and copper (Cu) spikes at 0, 50, 100, 250, 500, 750, 1000 and 2000 mg Cu kg soil−1 of soil. After 1 and 3 d of bioassay incubation, NO3-N production was measured in the supernatant. NO3-N productions against [Cu] gradients were used to define the functions of Eqs. (28) to (31) in Sect. 3.1 (see text). Soil respiration values were extracted from the curve Ci of Fig. 1 in Annabi et al. (2007).
2.1 Soil sampling
The soil was sampled in January 2017 at the surface layer (0–20 cm) of a control plot at the QualiAgro experimental site (48∘87′ N, 1∘97′ E – https://www6.inrae.fr/valor-pro_eng/Experimental-devices/QualiAgro/QualiAgro-web-site, last access: 2 November 2021). The soil sample was immediately wet sieved at 5 mm and shortly stored at 4 ∘C until microcosm build-up. Aliquots of this sieved soil were used to measure the initial water content in addition to the maximum water holding capacity (WHC) for the further microcosm experiments. This site is located at Feucherolles near Paris, France, and had been designed to evaluate urban compost fertility together with the monitoring of contaminant inputs (Cambier et al., 2019). Soil is a Luvisol with 15 % clay, 78 % silt and 7 % sand; a pH of 6.9; organic carbon (Corg) and total N contents at 10.5 ± 0.2 and 1.00 ± 0.03 g kg−1 soil, respectively; and a catatonic exchange capacity (CEC) of 7.9 ± 0.8 soil. This soil is not contaminated with Cu, and geochemical [Cu] background measured by inductively coupled plasma atomic emission spectroscopy (ICP-AES) after HF-HClO4 extraction was 12 mg Cu kg−1 soil.
2.2 Experimental setup
In order to evaluate the impact of soil moisture on the sensitivity of nitrification to Cu toxicity, we carried out a two-step experiment. The first step consisted in initial incubations at five different WHCs over 5 weeks, and the second step was a 3 d bioassay with a spiked Cu gradient (Fig. 1).
For the 5-week initial incubation, five microcosms were built up with about 5 g of sampled soil. Three of them were set up with a constant moisture corresponding to 30 %, 60 % and 90 % of their WHC in order to span, respectively, limiting, optimal and saturating conditions for the microbial activities. These three samples will hereafter be called 30 %, 60 % and 90 %, respectively. Their water contents were verified by weighting every 2 d and water was added if necessary. The two other microcosms were incubated in order to simulate two kinds of drought and dry–rewet cycles. One, hereafter called “Drought” (or DO), started with 1 week at 60 % WHC, and then the soil was left for 3 weeks without added water to mimic a dry period until 10 % of the WHC before rewetting at the initial 60 % WHC. The other, hereafter called “Dry-Rewet” (or DR) encountered two cycles of a 1-week near-saturation period (90 % WHC) followed by a 1-week dry period (10 % of the WHC) and ending with a 1-week near-saturation period. Drying was performed by natural evaporation (gentle air-drying at the laboratory temperature, i.e. 20 ∘C) and controlled by weighting.
At the end of the initial incubation period, we performed a nitrification bioassay using three replicates originating from soils and following an adaptation of the method proposed by Petersen et al. (2012). The bioassay consisted in nitrate production measurement over a short-term aerobic incubation in soil slurries (ratio of soil to solution was 1:10) with ammonium in excess and in the presence of gradients of Cu. Briefly, 3.5 g of fresh soil (approximately 3 g of soil equivalent dry weight) was mixed in 50 mL Falcon® tubes with 29 mL of a 10 mM HEPES buffer solution (hydroxyethyl piperazineethanesulfonic acid, Sigma-Aldrich, France) to maintain a constant pH under Cu spiking and nitrification activity and containing the substrate (NH4)2SO4 (3 mM) (Sigma-Aldrich, France). Soils were first spiked with a gradient of increasing Cu2+ in the presence of an excess of , and the resulting potential nitrification activity (PNA) was measured.
The microcosms incubated at constant moisture were kept at their moisture level (30 %, 60 % or 90 % of WHC), whereas those incubated at variable moisture levels were set at 60 % WHC. The production rates were measured in soil slurries over a short-term aerobic incubation, for each Cu added concentration. Briefly, 1 mL of Cu solution at different concentrations was added in soil slurries to reach added [Cu] of 50, 100, 250, 500, 750, 1000 and 2000 mg Cu kg−1 of soil (final soil [Cu] of 62, 112, 262, 512, 762, 1012 and 2012 mg Cu kg−1 of soil and control with 12 mg Cu kg−1 of soil). The pH was adjusted to 7. Then, microcosms were incubated on a rotary shaker (150 rpm) under aerobic conditions at 25 ∘C until 72 h. After 0, 24 and 72 h of incubation, 2 mL aliquots of 3 g were transferred in Eppendorf vials and centrifuged. The supernatants were collected and stored in microplates at −20 ∘C until analyses of and by colorimetric determinations, following the reduction of in by vanadium(III) and then the detection of by the acidic Griess reaction (Miranda et al., 2001). Finally, PNA () was calculated on the basis of + concentrations measured at different time steps. In our bioassay, [] was negligible and PNA was thus calculated following Eq. (1), by checking the linear production rate of between 2, 24 and 72 h:
where Vs is volume of solution, W is weight of fresh soil and T is time of incubation.
Cu in solution was measured by centrifugation of the soil–solution mixture of each bioassay, followed by a determination of Cu in solution by flame atomic absorption spectroscopy. Cu-in-solution values are provided in Table S1 in the Supplement.
2.3 Nitrification–denitrification model
Nitrification and denitrification processes are represented following the DNDC model proposed by Li et al. (1992, 2000). In this study, we used a simplified version of DNDC adapted by Zaehle and Friend (2010) initially calibrated for soil WHC > 40 %, which we intended here to test for 30 % of WHC. This simplified version needs less boundary data but keeps a mechanistic description of the main processes. Modelled N species are expressed in amount of N, i.e. NH4-N, NO3-N, NOx-N and N2O-N. To be able to represent both nitrification and denitrification processes occurring in aerobic and anaerobic sites, the soil is split into aerobic and anaerobic fractions based on an empirical relationship linking O2 consumption to soil respiration. In aerobic microsites, nitrification takes place following Eq. (2):
with NH4-N being the stock of ammonium (in g N m−2); (1−anvf) the aerobic fraction of the soil described thereafter in Eq. (21); kNit the nitrification rate (d−1); f(SWC), f(temp) and f(pH) three rate modifiers representing the effect of soil water content (m3 m−3); and temperature (K) and pH as scalars, respectively. They are described by the following Eqs. (3)–(5).
The NH4-N nitrified is transformed into N2O-N, NO-N or NO3-N due to microbial processes and chemonitrification following Eqs. (6)–(8).
Here and are two fixed rates (d−1), ftv a rate modifier controlled by temperature and given in Eq. (9), and R the ideal gas constant.
Then, the NO3-N produced during the nitrification process enters the denitrification module where it is reduced sequentially into NOx-N, N2O-N or N2-N following Eqs. (10) to (12).
The anaerobic fraction anvf is described following Eq. (13):
with and being the partial pressure in the air and in the soil, respectively. is calculated following Eq. (14).
Here SOC is the soil organic carbon stock (g C m−2), k the decomposition rate, the O2 partial pressure related to the respiration and fCu the effect of Cu on CO2 emissions as defined in Eq. (15), following (Sereni et al., 2021; Eq. 5)
The relative growth rate of NO3-N, NOx-N and N2O-N denitrifiers is described, respectively, by , and following Eqs. (16)–(18).
Here fdenit(temp), , , and are rate modifiers depending on air temperature and soil pH described in Eqs. (19) to (22).
The denitrifier biomass dynamic B (kg m−2) is described following Eq. (23).
Finally, all the gaseous forms of mineral N are emitted into the atmosphere. It is important to note that we did not directly use the DNDC model but a simplified version adapted by Zaehle and Friend (2010). The original code was in Fortran, and we translated it into R to facilitate its manipulation. The time step of the model was 30 min, and most of the parameters were kept to the original values of Li et al. (1992, 2000), except k_nit, which was modified to 0.1743 instead of 0.2 to better fit the data from the control. Furthermore, the amounts of NH4-N fixed to the clay were reduced to 0 as the bioassay was performed in excess of NH4-N (see 2.2.0).
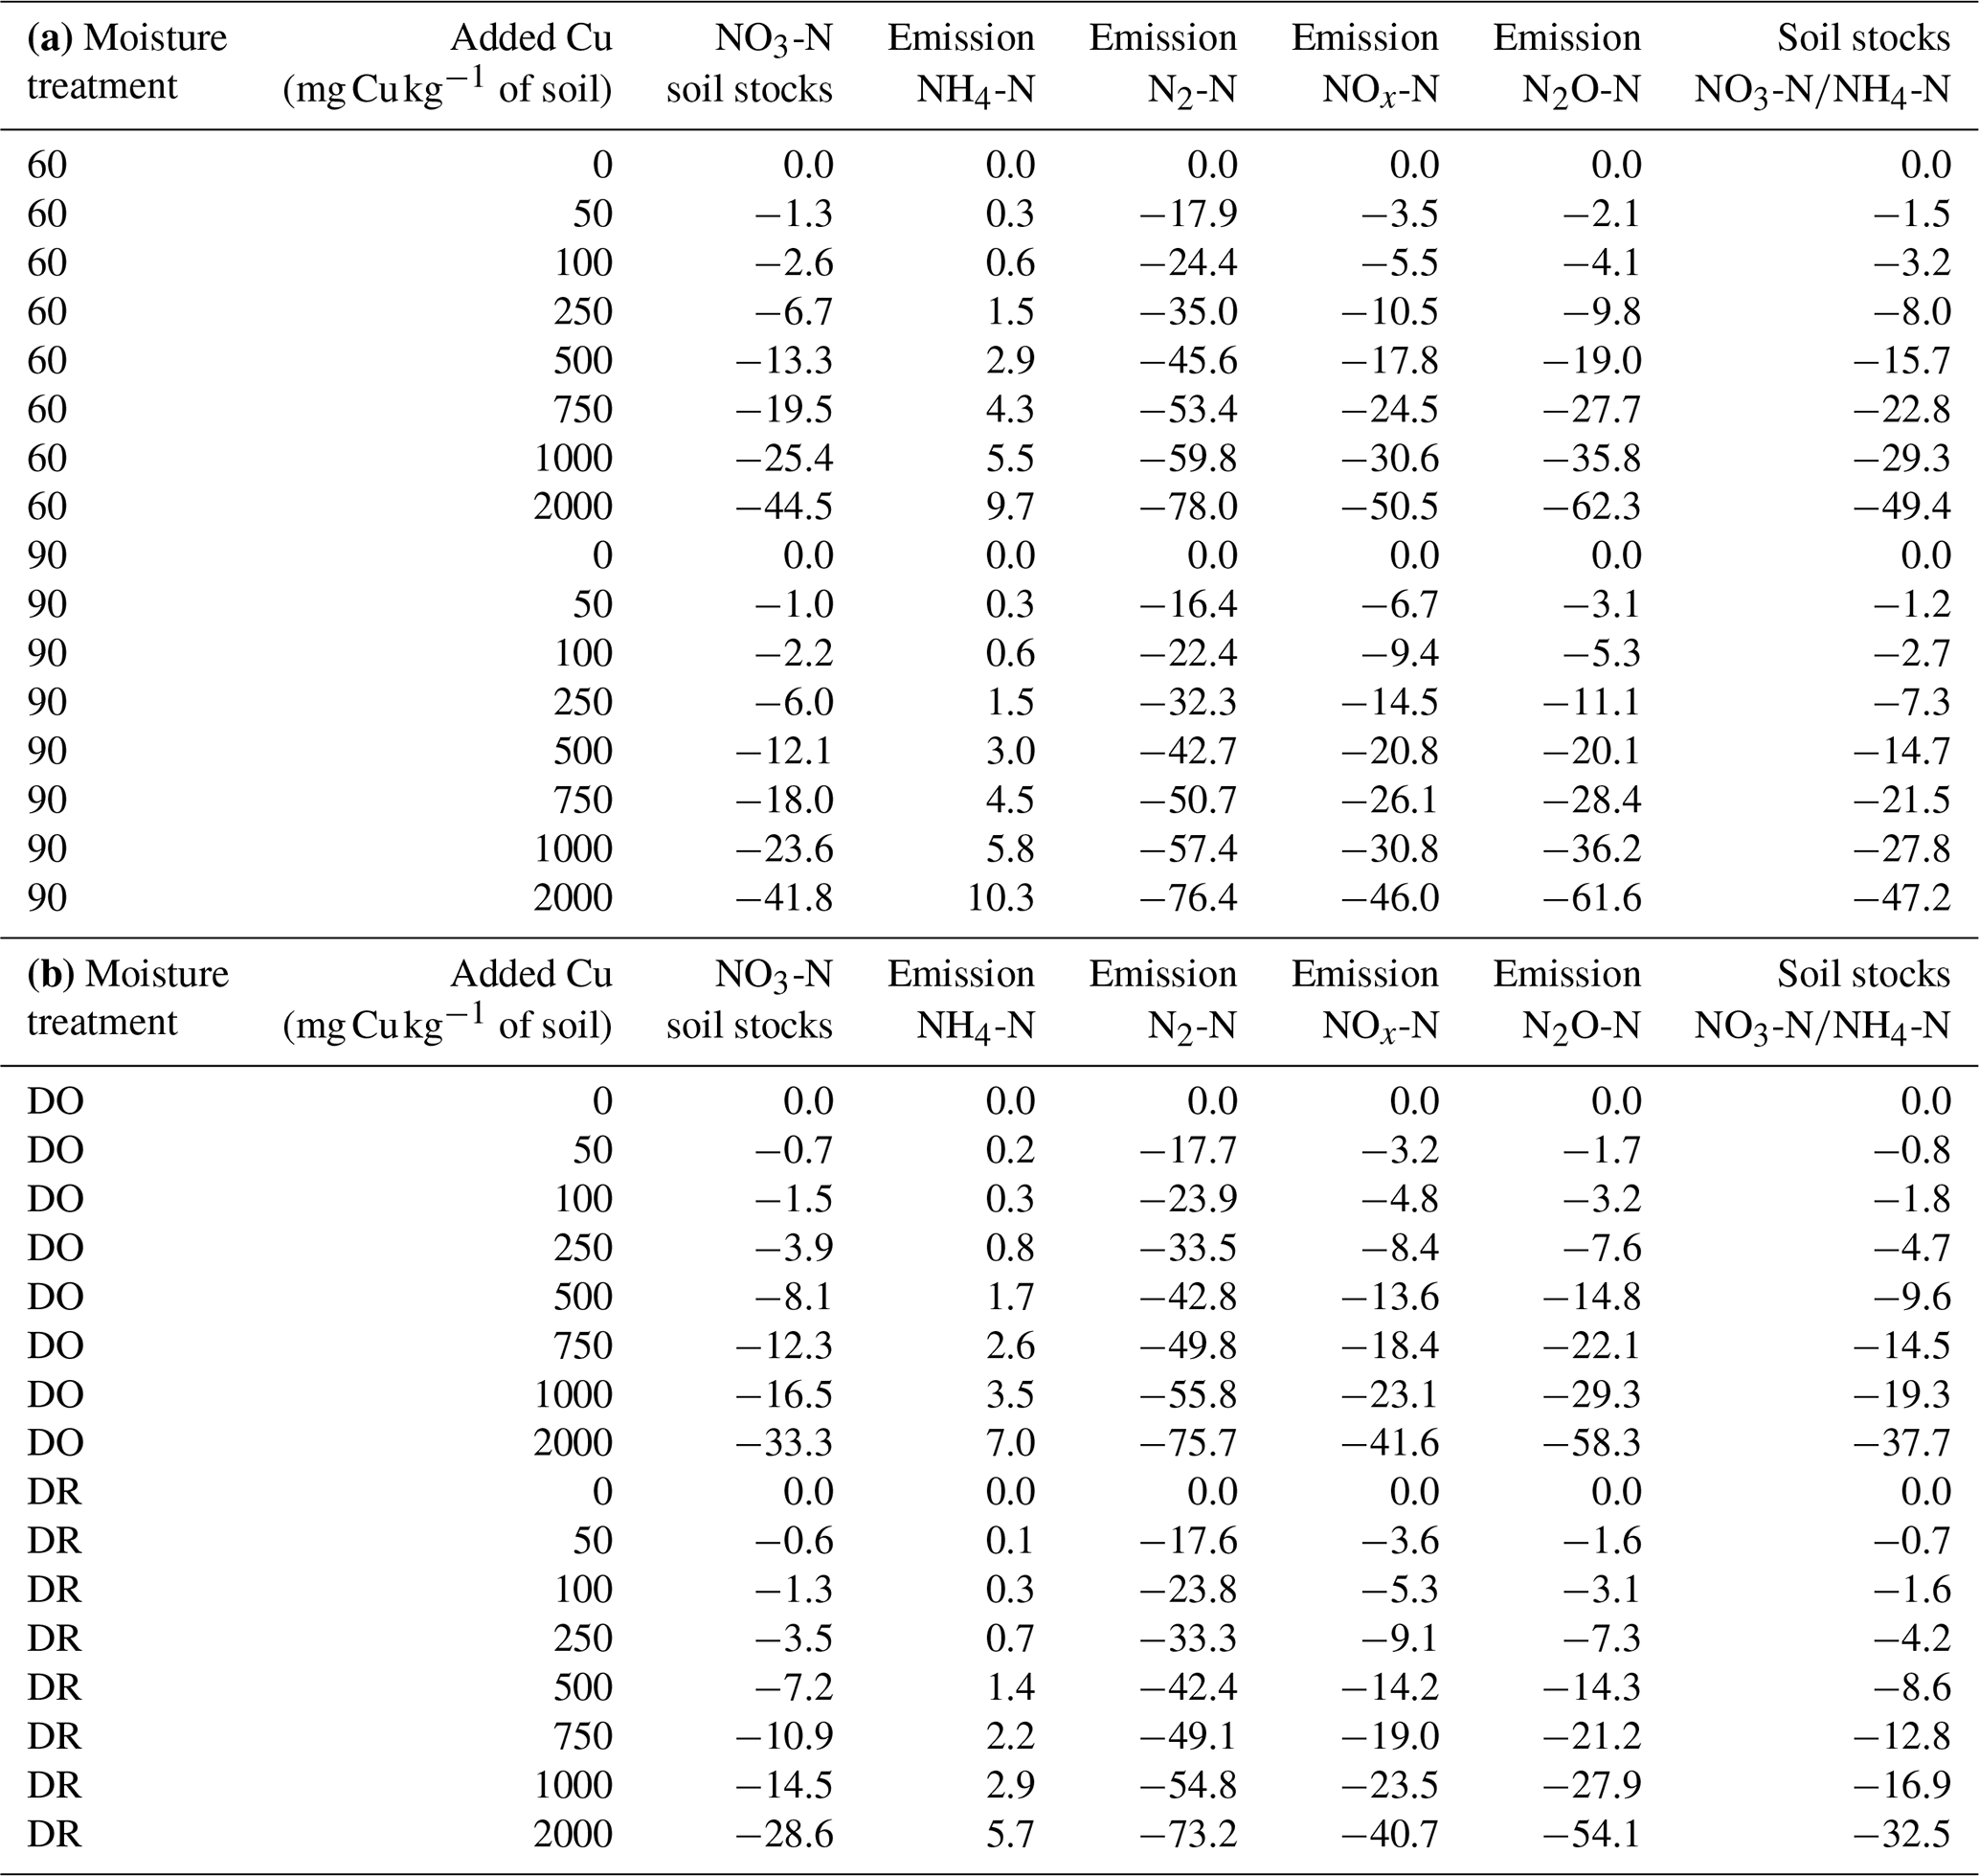
Table 1N species measured in the soils at the end of initial incubation period further used to initialise the DNDC model, mean modelled NO3-N stocks and mean emissions of NH4-N, N2-N, N2O-N and NOx-N modelled without Cu. Notation is as follows: 90 is 90 % WHC, 60 is 60 % WHC, DO is Dry-Only and DR is Dry-Rewet treatment during initial incubation. A, B and C are replicates.
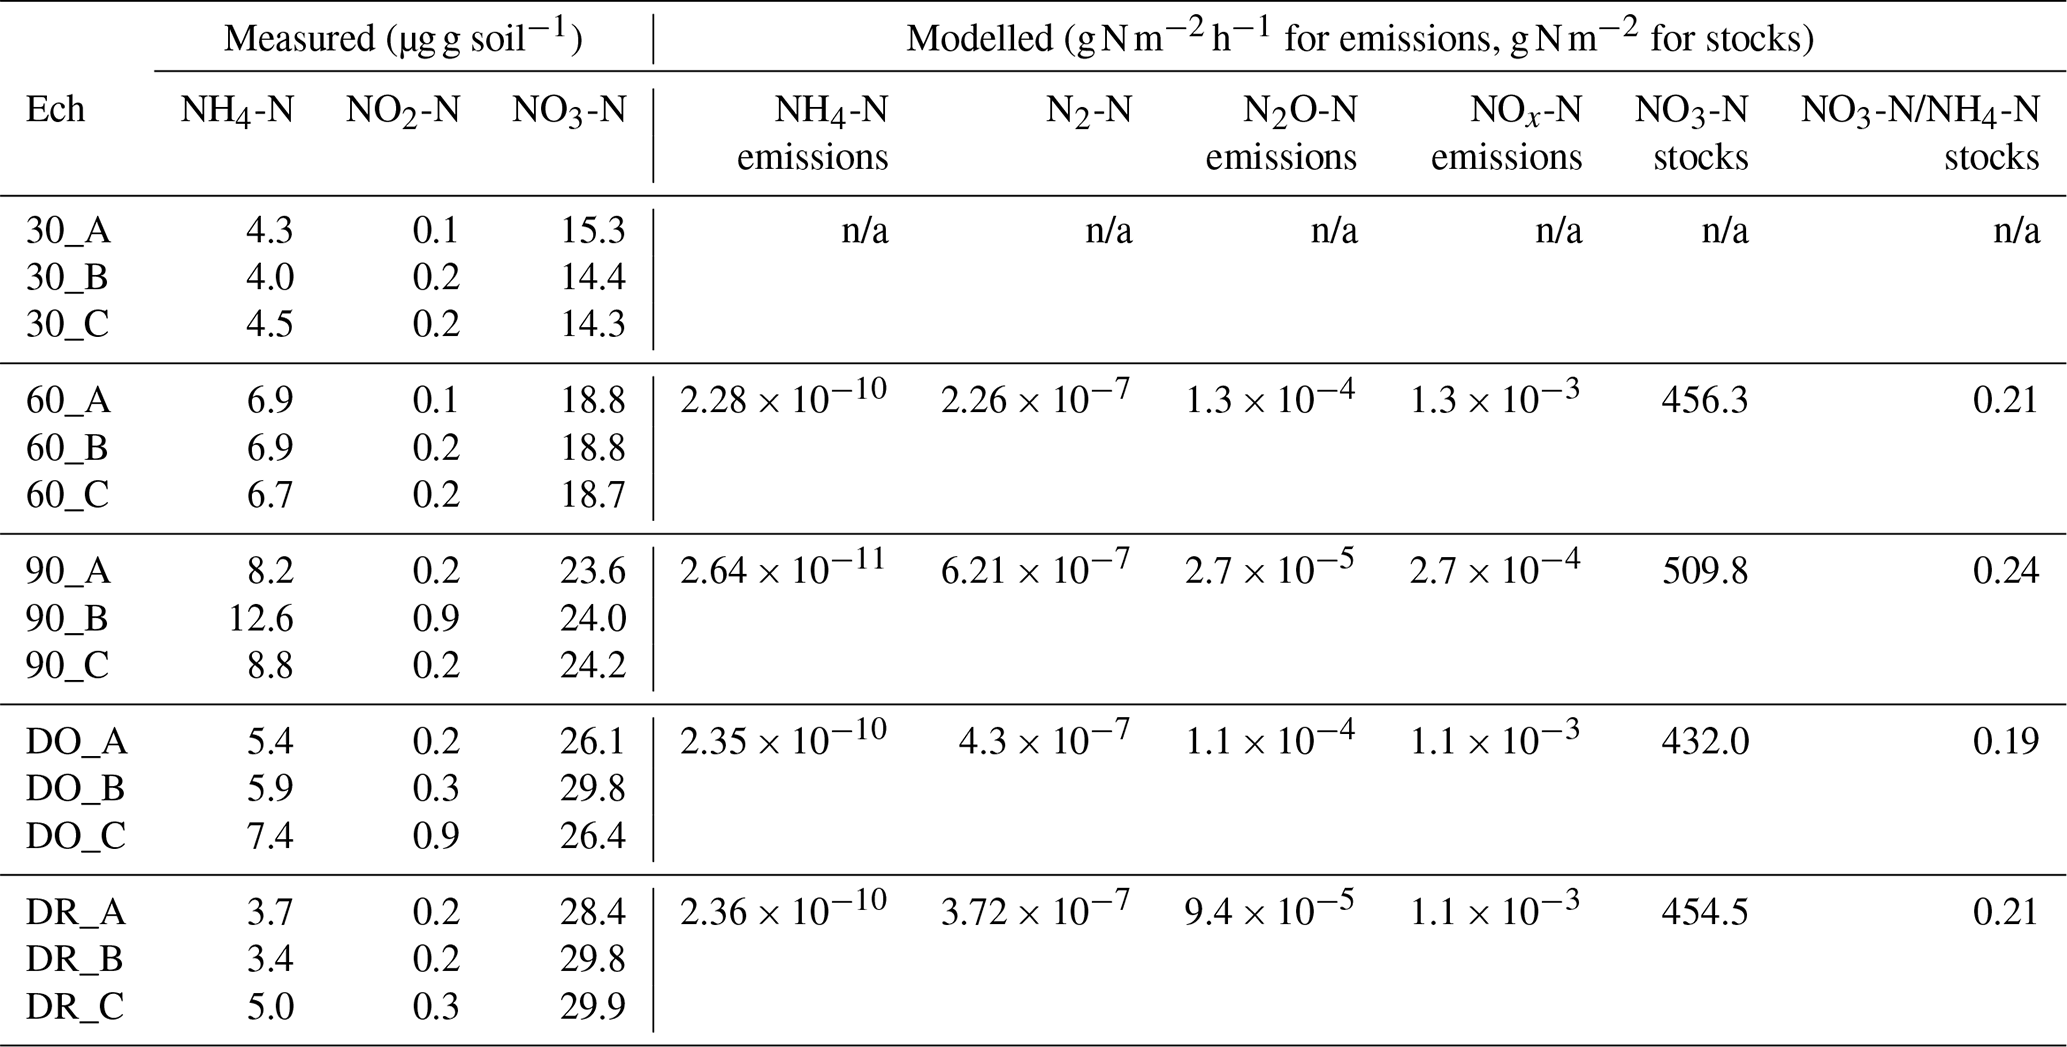
n/a: not applicable.
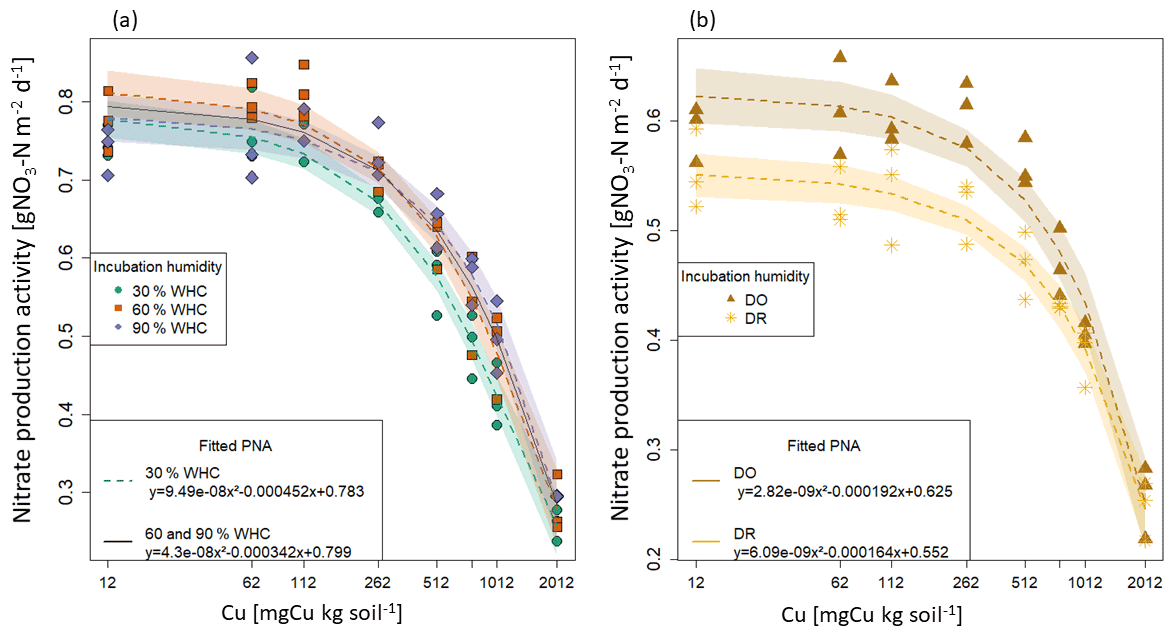
Figure 2Fitted functions of potential nitrifying activities (PNA) against total soil copper concentrations [Cu] for each initial moisture incubation treatment. Points are the measured nitrate production and lines the fitted quadratic function with their 95 % confidence interval. (a) Constant moisture treatments: the green circle is for 30 % WHC, the red square for 60 % WHC and the purple diamond for 90 % WHC. The black line is the common fitting function used for 60 % and 90 % WHC moisture treatments. (b) Variable initial moisture treatments: the brown star is for Dry-Rewet (DR) and the yellow triangle for Dry-Only (DO).
We used measures of N species at the end of the initial incubation period as initial values of N species for DNDC (Table 1a and Fig. 2). To estimate the anaerobic volume fraction during the 3 d bioassay, we used a C mineralisation rate k (Eq. 14) determined on the basis of measurements performed on the same soil (Annabi et al., 2007) and ran DNDC for a 45 d equilibrium period. We then extracted the initial anaerobic volume fraction and partial O2 pressure.
2.4 Statistical analysis
The dose–response curves of PNA during the bioassay to Cu gradient were plotted and tested with linear, quadratic or cubic functions as fitting models. Our aim was to find, if possible, a similar modelling fit function for all initial moisture incubation treatments. Thus, for each moisture treatment, the two best functions of fit were selected through Akaike information criterion (AIC) and R2 criteria and compared with ANOVA. After selection of a common type of functions, the permutability of the different function parameters was tested with the Chow test (gap v.1.2.2 package, which tested regression 1 on the basis of sample 2 and vice versa). If the p.v. (p value) exceeds its critical values, regressions cannot be considered equal (Zhao, 2007).
To estimate the effect of [Cu] and soil moisture on the different variables measured, we used the nonparametric Kruskal–Wallis test. The fits between the model and the data of soil nitrate concentration during the bioassays were measured using root-mean-square error (RMSE, Eq. 2):
where i is the number of observations (1 to N), X is the predicted value and Y is the observed value. RMSE was decomposed in standard bias (Eq. 25), non-unity slope (Eq. 26) and lack of correlation (Eq. 27) components following Gauch et al. (2003), with and the mean modelled and observed values, b the slope of the least-square regression of Y on X and r2 the square of the correlation.
All analyses were done with R 3.2.3 (R Core Team, 2015).
3.1 Effect of Cu on potential nitrification activity (PNA): statistical model selection
The soil N species measured at the end of the soil initial incubations in each soil moisture treatment were used to initialise the DNDC model (Table 1). Two anomalous points leading to anomalous calculated NO2-N values were excluded from the experimental results because of technical problems during measurements (the C replicates in the DR and DO cases).
The bioassay experiments performed at the end of the soil initial incubations allowed us to determine the rate of nitrate production as a function of soil [Cu] for each soil moisture level (Fig. 1). In all cases, the PNA values were found to decrease with the increase in soil [Cu] but at different rates depending on the moisture treatment. Based on AIC values (Table S2 in the Supplement), we first selected one model per moisture incubation that better fit the data. For 30 % and 60 % of WHC, a quadratic model was found to provide the better compromise between the number of parameters and the prediction capacity. For 90 % WHC, no significant difference was found between the cubic and the quadratic models (ANOVA, p.v = 0.07). For DR, no significant difference was found between linear and quadratic models (Table S2a and b), whereas for DO the cubic model provided a substantially better fit than the quadratic model (AIC and adj. R2 score, Table S2). Finally, we found that the quadratic model fitted all the sets of data correctly, allowing homogeneity across the initial moisture incubation treatments (Fig. 2b). The quadratic function was thus chosen to quantify the Cu effect on PNA including the DO treatment.
The parameters of the five quadratic functions (one for each moisture treatment) were found to be different from each other, except for 60 % and 90 % WHC (p.v. = 0.001, Chow test). A single function was thus used to adjust PNA to soil [Cu] curves at 60 % and 90 % WHC but with different intercepts for these two WHC treatments (Table S3 in the Supplement and Fig. 2).
The final four quadratic equations are as follow: Eq. (28) for 30 % WHC, Eq. (29) for 60 % and 90 % WHC, Eq. (30) for DR, and Eq. (31) for DO (Fig. 2).
with b = 0.795 for 60 % WHC and b = 0.796 for 90 % WHC
According to the fitted equations, the decrease in nitrate production rates as a function of soil [Cu] depended on initial incubation treatment. Decreases were found to be steeper following 30 % WHC > 60 %–90 % WHC > DO > DR.
These four equations were then added in the DNDC model, allowing us to adjust Eq. (2), which regulates the nitrate production to soil Cu contents.
3.2 Modelling soil nitrate concentrations in Cu-contaminated treatments using the DNDC-Cu model
3.2.1 Setup of the DNDC-Cu model
The DNDC model was originally constructed to model both C and N soil cycles. The relative proportion of nitrification and denitrification processes thus depends on soil aerobic fraction determined by both soil C respiration and soil moisture (Eqs. 13 and 14). Before any addition of Cu function in DNDC, we estimated this soil aerobic fraction using C mineralisation. Previous data from 366 d incubations made on the same uncontaminated soil (Annabi et al., 2007) were first used to fit a C mineralisation coefficient rate, k. The resulting k coefficient (k = 1.234 × 10⁻⁴ ) was introduced in the DNDC model and forced to equilibrium (45 d) without soil Cu contamination effect. This provided a basal aerobic volume fraction for each soil moisture through Eq. (13), corresponding to 3.52 × 10⁻³ at 30 %, 6.167 × 10⁻³ at 60 % (and DR–DO to which bioassays were performed at 60 % WHC) and 2.705 × 10⁻² at 90 % of the WHC. The partial O2 pressure was calculated as 211.4 hPa at 30 % WHC; 210.7 hPa at 60 % WHC, DR and DO; and 205.4 hPa at 90 % WHC. These values were used to initiate the DNDC-Cu version. We then ran the DNDC-Cu version for a 3 d simulation. The constant rate of C mineralisation, k, was adjusted to take into account the Cu contents with Eq. (14) while Eqs. (28)–(31) were used to adjust NO3-N production rate (Fig. 1) to Cu.
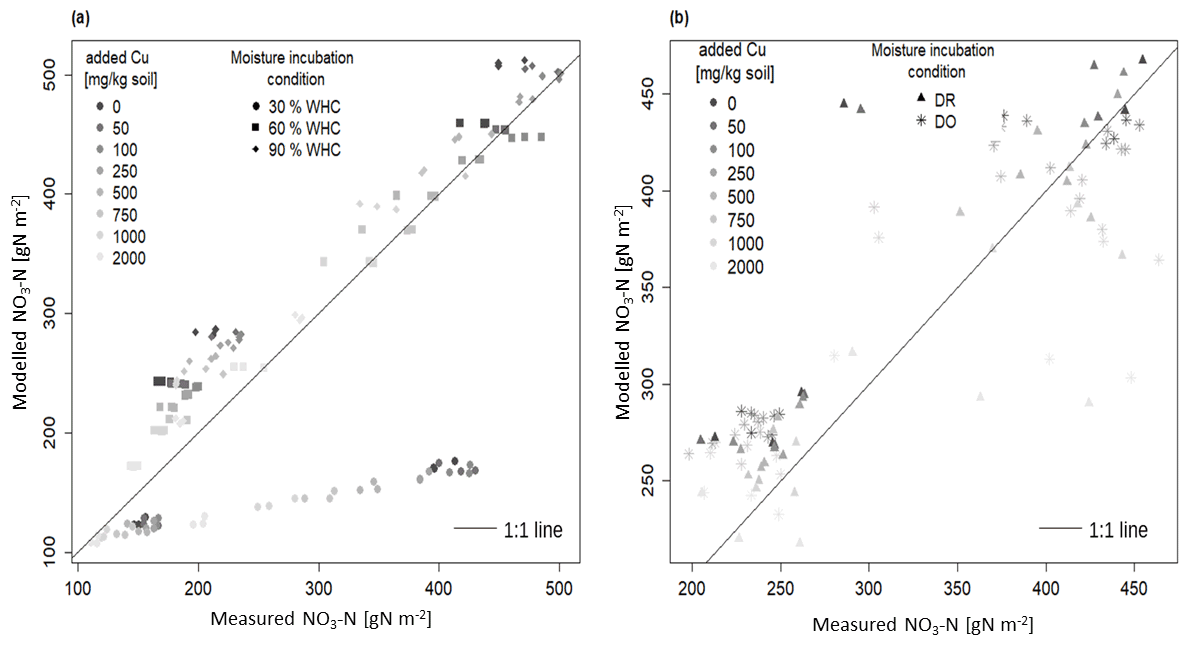
Figure 3Comparison between modelled and measured soil nitrate concentration incubated in different moisture levels with 1:1 line: (a) the three initial incubations under constant moisture and (b) the two initial incubations under variable moisture Dry-Rewet (DR) and Dry-Only (DO) treatments. For 30 % WHC, model = 1.84 ⋅ measure and R2 = 0.93; for 60 % WHC model = 0.93 ⋅ measure. R2 = 0.99; for 90 % WHC model = 0.90 ⋅ measure. R2 = 0.99; for Dry-Rewet (DR) model = 0.96 ⋅ measure. R2 = 0.98; for Dry-Only (DO) model = 0.95 ⋅ measure. R2 = 0.99.
3.2.2 DNDC-Cu model validation
Our DNDC-Cu model has been evaluated by comparing experimental data of soil nitrate concentration measured after 1 and 3 d of the bioassay incubation with the model outputs. A good fit was provided for 60 % and 90 % of WHC in the range of the DNDC calibration compared to 30 % WHC where the nitrate production is largely underestimated (by a factor of 2 after 3 d of incubation, Fig. 3a). The regression slopes between modelled and measured soil nitrate concentration for 60 % and 90 % WHC were, respectively, 0.94 ± 0.01 and 0.91 ± 0.01 (R2 = 0.99 in both cases, Fig. 3a), whereas for 30 % WHC the regression slope was 1.21 ± 0.08 (R2 = 0.92) (Fig. 3a). For DR, the soil nitrate stocks were either overestimated (at 762 mg Cu kg−1 of soil) or underestimated (at 2012 mg Cu kg−1 of soil, Fig. 3b), but overall modelling adequately fit the data with a regression slope at 0.95 ± 0.02 and R2 = 0.99. For DO, the regression slope between modelled and measured soil nitrate stocks was 0.95 ± 0.02 too. The Fig. S1 in the Supplement shows the improvement of the DNDC-Cu version to model NO3-N soil concentration for contaminated soils, with the differences between modelled and measured [NO3-N] using the default DNDC version compared to our DNDC-Cu version for each [Cu].
Considering all the moisture treatments, RMSE was about 57.3 as a mean (46.4 g NO3-N m−2 standard error) for a mean soil nitrate measured at 390 g NO3-N m−2 (69 g NO3-N m−2 standard error) after 3 d of incubation. However, for the 30 % WHC, RMSE was 139.9, thus 3.7 times more than for the other treatments (Fig. S2 in the Supplement). Despite the reduction in nitrate production rate from 0.20 to 0.18 g N h−1 (see Material and methods), soil nitrate stock was still slightly overestimated in the 90 % WHC as shown by the largest lack of correlation in this case compared to the 60 % WHC treatment (Figs. 3a and S2). Lack of correlation was reduced for all tested moisture treatments (mean = 23.0, standard error = 5.4, which is roughly of the produced nitrate in 3 d in the uncontaminated treatment). Results showed that our DNDC-Cu version was able to reproduce the variability observed in Cu-contaminated soils except for the 30 % WHC treatment where soil nitrate stocks were largely underestimated. The following results thus focused on the use of DNDC-Cu for DR, DO, and 60 % and 90 % WHC treatments to predict soil N emissions.
3.3 Use of DNDC-Cu to predict N fluxes in contaminated soils
3.3.1 Effect of soil [Cu] on soil N stocks
The soil Cu function we included in the DNDC-Cu model specifically modified the default nitrification equation in response to pH, soil moisture and O2 availability (Eq. 2). In the presence of low [Cu] (12–512 mg Cu kg−1 of soil), the predicted NO3-N soil stocks were found to be equivalent between 60 % WHC and DO and, to a less extent, DR treatments (Fig. S3 in the Supplement). When soil [Cu] increased, soil [NO3-N] decreased but with different rates depending on the moisture of initial incubations (Eqs. 28–31). The evolutions of concentrations in soils and emissions fluxes of each species in response to [Cu] gradient were also found highly different depending on the species and on the moisture of initial incubations. However, the relative evolution in terms of both soil concentration and emissions fluxes was identical for each species and each initial incubation treatment and is represented in Table 2. The largest variations were modelled for N2O-N decrease (around −63 % for the constant moisture treatments and −54 % for the DR at 2012 mg Cu kg−1 of soil) while the smallest variations were modelled for NH4-N increase (8 %–10 % for the 60 % and 90 % WHC against 5 %–7 % for the DR and DO initially incubated soils at 2012 mg Cu kg−1 of soil). Due to the different evolutions with Cu gradient, concentrations or intensities of fluxes for a given species may reverse between two moisture treatments with an increase in soil [Cu].
For instance, up to 548 mg Cu kg−1 of soil, we modelled the lowest NO3-N stocks in DR incubated soils. Above this level, NO3-N soil stocks were the smallest for the 60 % WHC treatment as a result of the sharpest decrease in NO3-N production due to soil [Cu]. NO3-N soil stock for initial incubation at 90 % WHC was the highest for soil [Cu] below 1432 mg Cu kg−1 of soil. Between 1432 and 2000 mg Cu kg−1 of soil, NO3-N soil stocks were similar for 90 % WHC, DR and DO (Fig. S3).
Table 2Percentage of variation in soil NO3-N stocks; soil stocks; and NH4-N, N2-N, NOx-N and N2O-N emissions in response to soil [Cu] in the various initial incubation treatments for a 3 d modellisation.
In the absence of Cu, ratios were similar among soil moisture treatments. However, the variations in NH4-N and NO3-N stocks in response to Cu gradient were different across soil moisture levels. Indeed, the increase in soil [Cu] resulted in a decrease in nitrification rate and thus in an increase in soil NH4-N stocks (Fig. S4 in the Supplement). The stock ratios decreased faster for 60 %–90 % WHC than for DR and DO with an increase in soil [Cu] (Fig. S5 in the Supplement, Table 2).
The decrease in soil NO3-N stocks at high [Cu] induced a decrease in the modelled growth of denitrifying bacteria that is directly related to [NO3-N] (Eq. 13). Consequently, the modelled denitrifying bacterial pool was reduced when soil [Cu] increases (Fig. 4). Whatever the soil [Cu], denitrification was modelled as being larger by roughly a factor of 2 in the soils incubated at 90 % WHC compared to the other treatment as this moist treatment is defined as the perfect condition for denitrifying bacteria in the DNDC model (Li et al., 1992). Soils incubated at 60 % WHC were modelled with the lowest denitrifying bacterial pool. No difference between the DR and DO soils was found due to uncertainties in the modelled denitrifying bacterial pool, which resulted from the different concentrations in N species used to initialise DNDC-Cu (Table 1). The soil N2O-N stocks and dissolved NOx-N being directly related to denitrifying bacteria, they followed trends similar to those of soil NO3-N stocks with a global decrease in soil stocks with an increase in soil [Cu] (table 2) and larger stocks at the wetter treatment.
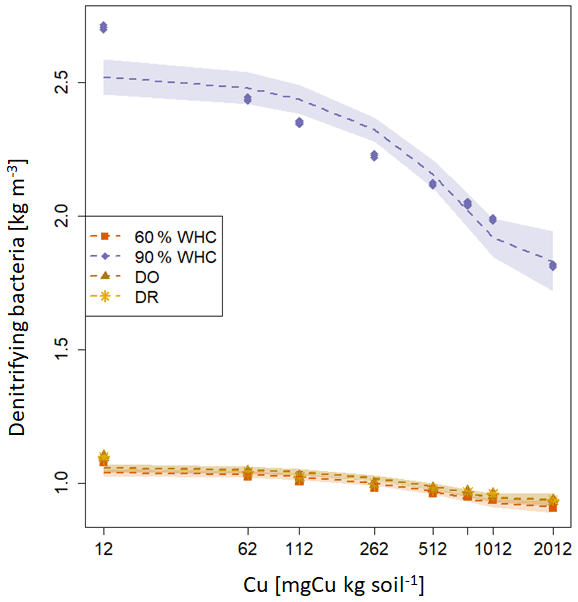
Figure 4Modelled soil denitrifying bacterial pool after 3 d (kg m−3 soil) for the four moisture treatments. The purple diamond is for 90 % WHC, red square for 60 % WHC, brown star for Dry-Rewet (DR) and yellow triangle for Dry-Only (DO). Red, brown and yellow curves are superposed. Pools were modelled for 12, 62, 112, 262, 512, 762, 1012 and 2012 mg Cu kg−1 of soil as represented by stars. Quadratic fits were used for representation.
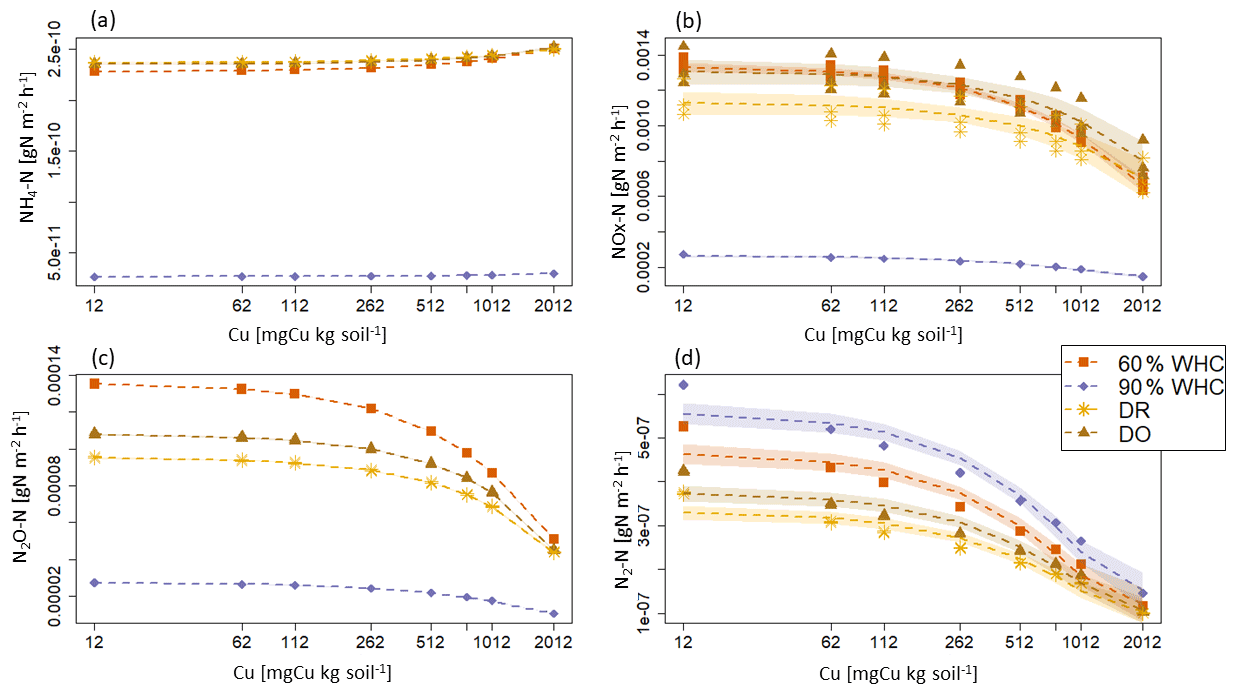
Figure 5Modelled N emission fluxes at 3 d in under the different moisture treatments. (a) NH4-N emission fluxes. (b) NOx-N emission flues, (c) N2O-N emission fluxes and (d) N2-N emission fluxes. The purple diamond is for 90 % WHC, red square for 60 % WHC, brown star for Dry-Rewet (DR) and yellow triangle for Dry-Only (DO). Fluxes were modelled for 12, 62, 112, 262, 512, 762, 1012 and 2012 mg Cu kg−1 of soil as represented by stars. Quadratic fits were used for representation.
3.3.2 Estimation of soil N emissions under various moisture levels
Large differences are predicted in the NH4-N, NOx-N and N2O-N fluxes between the 90 % WHC soil and the three other soil moisture treatments (Fig. 5). Due to the different evolutions of fluxes in response to Cu, NH4-N fluxes were modelled as being the smallest for the DR soils compared to the 60 % WHC incubated for soil Cu below 1774 mg Cu kg−1 of soil and higher above 1774 mg Cu kg−1 of soil (Fig. 5a). The emissions of NH4-N in the DO treatment were predicted to be higher than those of the DR treatment for soil Cu higher than 1290 mg Cu kg−1 of soil and the smallest below 1290 mg Cu kg−1 (Fig. 5a). In the studied range of added Cu, NOx-N fluxes predicted by the model are largest from 60 % WHC to DO, DR and 90 % WHC (Fig. 5b) for a moderate Cu input (∼ below 1380 mg Cu kg−1 of soil). The decrease in NOx-N emission with the increase in soil [Cu] was however steeper for soils incubated at 60 % WHC (Tables 2a and b). Hence, at 2012 mg Cu kg−1 of soil NOx-N fluxes in soil incubated at 60 % WHC were similar to those in the soils incubated under drought treatment (Fig. 5b). The smallest fluxes of N2O-N were predicted for the wetter treatment despite higher modelled N2O-N stocks at 90 % WHC whatever the [Cu] (Table 2a and Fig. 5c). The N2O-N emissions fluxes in the presence of Cu were predicted to be 4 times smaller in the 90 % WHC treatment compared to the others. N2O-N fluxes had similar trends to NOx-N for moderate Cu inputs, but fluxes were still the largest from 60 % WHC to DO, DR and 90 % WHC (Fig. 5c), and N2-N emissions were larger in the wettest treatment (Fig. 5d). The ratio of emitted N2O-N per denitrification product (i.e. ) was hence the smallest in the moistest soils, which means that the largest soil N2O-N stocks in the case of 90 % WHC had more chance to be transformed rather than emitted (Fig. 6).
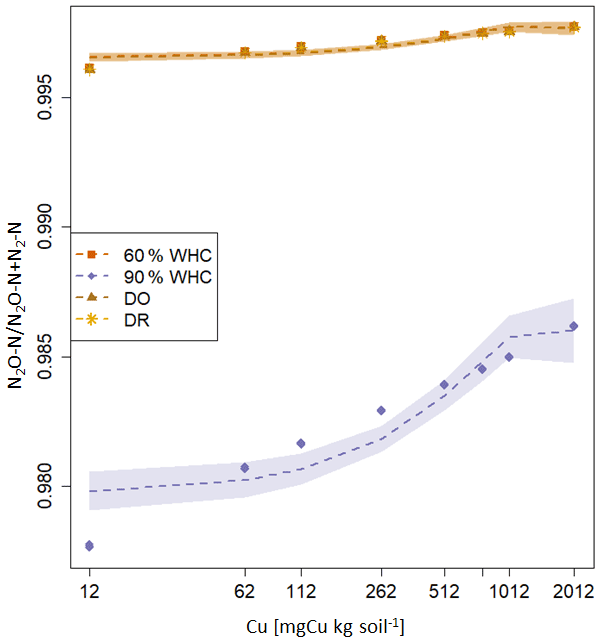
Figure 6Proportion of N2O-N emitted arising from the denitrification calculated as modelled fluxes in response to soil Cu concentration for the various moisture treatments. The red square is for 60 % WHC, purple diamond is for 90 % WHC, yellow circle for Dry-Rewet (DR) and brown star for Dry-Only (DO). Red, yellow and brown curves are superposed. Fluxes were modelled for 12, 62, 112, 262, 512, 762, 1012 and 2012 mg Cu kg−1 of soil as represented by stars. Quadratic fits were used for representation.
4.1 From laboratory experiment to soil N emission modelling
Thanks to our laboratory experiments, we were able to define a function modulating the soil NO3-N production rates in relation with soil [Cu] and depending on soil moisture. Our results showed that soil nitrate decreases with an increase in soil [Cu]. Initial incubation treatment significantly affects the response of soil nitrate production rate to subsequent Cu stress, with a steeper decrease on the order 30 % WHC > 60 %–90 % WHC > DO > DR for the Cu range studied. The lowest sensitivity of Cu in soils initially incubated with dry–rewet events suggests that it might have selected more resistant communities (Barnard et al., 2013; Gleeson et al., 2008). More complex dose–response functions have been used in Sereni et al. (2022) to assess thresholds and loss of function after such a double stress. These results are in relatively good agreement with those presented here using the quadratic fit, especially for the highest half of [Cu]. However, they also presented a limited increase in nitrification rate for small Cu input that we were not able to emphasise in the present study. In the present article we used simple functions of fit to describe the response of soil nitrate production to Cu gradient after the first moisture stress as they further have to be included in the DNDC model. After implementing these quadratic Cu modulating functions into the DNDC-Cu model, we were however able to reproduce the observed soil nitrate stock, particularly for the soils incubated at 60 % and 90 % WHC. The variability around the mean due to the Cu effect was also reproduced by our DNDC-Cu version at 30 % of WHC despite strong underestimation of mean soil nitrate stocks due to model moisture limit (Li et al., 1992). In the case of the DR and DO incubated soils, the so-called “Cu function” also accounted for the effect of drought stress. In fact, our Cu functions were defined on the basis of soil nitrate production against the whole gradient of Cu, thus also considering the control without Cu. However, the double-stress effect was also well reproduced in nitrate production.
4.2 Expected ecological implications of soil Cu contamination
Based on nitrate production measurements, we modelled a decrease in denitrifying activities with an increase in soil [Cu] as a consequence of the decrease in soil nitrate stocks. However, the experiments performed here did not allow us to determine if the soil Cu contamination rather affects nitrifying bacteria (e.g. decrease in nitrifying activity and in NO3-N production) or denitrifying bacteria (e.g. increase in denitrifying activities and NO3-N consumption). The effect of soil contamination on N2O-N production is debated because (i) microbial species involved are not clearly identified (Wrage-Mönnig et al., 2018), (ii) species richness is not necessarily related to soil functions (Ruyters et al., 2013) and (iii) denitrifying communities could have different sensitivities than nitrification to soil contamination (Hund-Rinke and Simon, 2008; Vásquez-Murrieta et al., 2006). Also, our approach to model N2O-N, N2-N and NOx-N production in the contaminated context could have been more constrained with measurement of denitrification rate to assess the effect of Cu on proportion of production and consumption of NO3-N.
Based on our simulations, the soil Cu contamination was expected to substantially modify the proportion of available N in soils with the increase in NH4-N stock at the expense of NO3-N. NH4-N accumulation and the large expected decrease in ratio in contaminated soils (around 50 % for the 60 % WHC) may lead to a shift in plant community structures with different preferences in N assimilation (Cui and Song, 2007; Peacock et al., 2001). Therefore, Cu stress could not only have implications in microbial community patterns as a stressor but could also induce further shifts due to N species redistributions in soils.
4.3 From N2O-N, N2-N and NOx-N soil stocks to emissions
In the present study, we predicted the highest soil N2-N, N2O-N and NOx-N stocks in the moistest treatments. Indeed these species are produced by the denitrifying bacteria expected to behave optimally at 90 % WHC or after DR cycles (Li et al., 1992; Homyak et al., 2017). However, N2O-N and NOx-N emissions were modelled as higher in the driest soils, whereas numerous studies (Dobbie and Smith 2003; Xiong et al. 2007; Manzoni et al. 2012) reported high measured N2O-N emissions with high moisture. In the present version of DNDC-Cu, the soil N emissions were directly controlled by their diffusion in soil, calculated on the basis of clay and soil moisture content. The diffusion of each species would hence be 11 times smaller under the 90 % WHC (D_s = 0.00357) than under the 60 % WHC treatment (D_s = 0.0306) because the model described the diffusion as a whole and did not separate pores with or without water. Diffusion was hence slower in the water than in the air. Thus, the weighted mean diffusion was lower in the high-moisture treatment. In the absence of Cu soil nitrous stocks being roughly 1.6 times and soil N2-N stocks 11.1 times larger under 90 % WHC treatment than the other, the emissions of N2O-N were larger under the driest treatment even if stocks were smaller.
Several studies also reported flushing events with Dry–rewet cycles which would enhance C mineralisation, known as the Birch effect (Birch, 1958; Göransson et al., 2013), hence reducing soil O2 concentration. Moreover, soil [O2] is closely related to the pore size distribution, being of major importance in nitrification–denitrification control (Khalil et al., 2004), with a dominating nitrification for aggregates up to 0.25 cm (Kremen et al., 2005). Pore size distribution under dry–rewet events is controlled by cracking, (des)aggregation (Cosentino et al., 2006; Denef et al., 2001) or gas displacement (Kemper et al., 1985) that we were not able to take into account in the present study. In DNDC, the calculation of denitrification rate and diffusion was based on a rough description of the anaerobic zone with approximation of soil pore space distribution (Blagodatsky et al., 2011; Li et al., 2000). The soil pore space distribution approach has been demonstrated to be more generally applicable (Arah and Vinten 1995; Schurgers et al. 2006), whereas soil aggregates have been shown to control the extent of nitrification and denitrification (Kremen et al., 2005; Schlüter et al., 2018). However, if models have been proposed to take O2 availability at the aggregate size into account in the nitrous oxide production (Kremen et al., 2005; Leffelaar, 1988), they also point out the difficulty in parameterisation that needs a large panel of soil measurements. Moreover, they are rarely transposable at the mesoscale and regional scale due to high spatial variations in soil structure (Butterbach-Bahl et al., 2013). The DNDC-Cu version we used here in particular pointed out the difficulty in dealing with a biogeochemistry model with physical processes, with large discrepancies between modelled soil stocks and emissions. The validation we performed focused on soil nitrate stocks, and a second step to go further on would be the measure of gaseous species to ensure that emissions were also impacted by soil treatment. Moreover, we assumed here that soil [Cu] affected the C mineralisation with a decrease in soil O2 production leading to an increase in denitrification and N2O-N and NOx-N. Nevertheless, the present DNDC-Cu version did not take into account the retroaction between C and N cycles. Further research would thus be required to include Cu contamination in interacting C and N cycles.
4.4 Climate change could substantially modify contaminated soil N emission
It is well known that climate change and rainfall patterns could substantially modify the soil N balance and its GHG emissions (Galloway et al. 2003, 2008; Butterbach-Bahl et al. 2013). Despite limitation in DNDC accuracy for nitrous emissions (Foltz et al., 2019), our results tend to show that increased Cu contamination might also affect soil N emissions, producing the smallest emissions of NOx-N and N2O-N. These two gases are of major importance in GHG mitigation with a warming potential per mass 300 and 40 times greater than CO2, respectively. Agricultural soils being the dominating source of N2O-N (Beauchamp, 1997; Signor and Cerri, 2013), even a limited decrease in their emissions could have major implications for climate. Based on our modelling, the combined effect of soil moisture and [Cu] was particularly important with larger differences in N2O-N and NOx-N emissions between rainfall patterns at high [Cu] (Sect. 3.3.2). Sereni et al. (2022) also showed that soil Cu contamination differently affects soil nitrification depending on primary soil moisture stress. Here we showed that the N2O-N and NOx-N emission variations are significantly more sensitive to the combined effect of Cu and precipitation regime than the nitrate stock. Based on these results, Cu inputs to moist soils would lead to larger decreases in soil N2O-N and NOx-N emissions compared to drier soils, with the strongest effects likely to occur on soils subjected to abrupt and intense shifts in rainfall patterns.
In the present study, we aimed at combining ecotoxicological experiments and biogeochemical modelling focusing on the effect of soil Cu contamination on soil N emission under different soil moisture treatments of constant moisture (30, 60 or 90 % WHC) or a single long drought period (DO) or several dry–rewet (DR) cycles. We showed that the effect of soil Cu contamination was different among moisture treatments and N species. For instance, we modelled that the largest [Cu] (2012 mg Cu kg−1 of soil) provoked a decrease in soil nitrate stocks from −28 % in the DR case to −44 % in the 60 % WHC, whereas N2O-N emissions were expected to decrease up to 63 % in the 90 % WHC (−62 % in the 60 % WHC case, −54 % in the DO case). However, our results tended to show that the amount of N2O-N emitted from denitrification would decrease with an increase in soil [Cu] and from 60 % WHC to DR, DO and 90 % WHC, so that less N2O-N produced would be converted to N2-N. This result points out two main difficulties in biogeochemical modelling: (i) the difficulty to take into account hydrological dynamics (produced NO3-N and NH4-N could be expected to leach) and soil structures at different spatial scales (denitrification is estimated based on rough estimation of anaerobic soil volume which also controlled emissions rates through diffusion processes) and (ii) linking soil function to microbial dynamics, in particular in this case, where only the NO3-N stock was measured (without dealing between production and consumption for instance). Despite these two main points of uncertainty, the combination of incubations and of modellisation we conducted here emphasises the need to account for soil contamination when dealing with soil GHG emission modelling and climate change, as both contamination and rainfall patterns affect the soil NOx-N and N2O-N emissions in a different way.
DNDC-Cu version and data used for are available at https://doi.org/10.15454/ZUKN90 (Sereni, 2021).
The supplement related to this article is available online at: https://doi.org/10.5194/bg-19-2953-2022-supplement.
CB performed experiments and initialized the draft. LS performed the formal analysis, processed and interpreted data, and wrote the original draft. BG, OC and IL designed the study. BG, OC, JCL and IL participated in analysis of results, supervision, and review and editing of initial draft. IL supervised project administration and funding acquisition.
The contact author has declared that neither they nor their co-authors have any competing interests.
Publisher's note: Copernicus Publications remains neutral with regard to jurisdictional claims in published maps and institutional affiliations.
Parts of this study were financially supported by the French National Research Agency ANR CESA-13-0016-01 through the CEMABS project and the Labex BASC through the Connexion project. Laura Sereni thanks the Ecole Normale Supérieure (ENS) for funding her PhD. The authors thank Amélie Trouvé for her help in soil data analysis, Sébastien Breuil for soil processing and Christelle Marrauld for bioassay design.
This research has been supported by the Agence Nationale de la Recherche (grant no. CESA-13-0016-01).
This paper was edited by Ben Bond-Lamberty and reviewed by Julie Zilles and Ben Bond-Lamberty.
Anav, A., Friedlingstein, P., Kidston, M., Bopp, L., Ciais, P., Cox, P., Jones, C., Jung, M., Myneni, R., and Zhu, Z.: Evaluating the Land and Ocean Components of the Global Carbon Cycle in the Cmip5 Earth System Models, J. Climate, 26, 6801–6843, https://doi.org/10.1175/JCLI-D-12-00417.1, 2013.
Annabi, M., Houot, S., Francou, C., Poitrenaud, M., and Le Bissonnais, Y.: Soil Aggregate Stability Improvement with Urban Composts of Different Maturities, Soil Sci. Soc. Am. J., 71, 413–423, https://doi.org/10.2136/sssaj2006.0161, 2007.
Arah, J. R. M. and Vinten, A. J. A.: Simplified Models Of Anoxia And Denitrification In Aggregated And Simple-Structured Soils, Eur. J. Soil Sci., 46, 507–517, https://doi.org/10.1111/j.1365-2389.1995.tb01347.x, 1995.
Bååth, E.: Effects of heavy metals in soil on microbial processes and populations (a review), Water. Air. Soil Pollut., 47, 335–379, https://doi.org/10.1007/BF00279331, 1989.
Barnard, R. L., Osborne, C. A., and Firestone, M. K.: Responses of soil bacterial and fungal communities to extreme desiccation and rewetting, ISME J., 7, 2229–2241, https://doi.org/10.1038/ismej.2013.104, 2013.
Bateman, E. J. and Baggs, E. M.: Contributions of nitrification and denitrification to N2O emissions from soils at different water-filled pore space, Biol. Fert. Soils, 41, 379–388, https://doi.org/10.1007/s00374-005-0858-3, 2005.
Beauchamp, E. G.: Nitrous oxide emission from agricultural soils, Can. J. Soil Sci., 77, 113–123, https://doi.org/10.4141/S96-101, 1997.
Bech, J., Poschenrieder, C., Llugany, M., Barceló, J., Tume, P., Tobias, F. J., Barranzuela, J. L., and Vásquez, E. R.: Arsenic and heavy metal contamination of soil and vegetation around a copper mine in Northern Peru, Sci. Total Environ., 203, 83–91, https://doi.org/10.1016/S0048-9697(97)00136-8, 1997.
Birch, H. F.: The effect of soil drying on humus decomposition and nitrogen availability, Plant Soil, 10, 9–31, https://doi.org/10.1007/BF01343734, 1958.
Blagodatsky, S., Grote, R., Kiese, R., Werner, C., and Butterbach-Bahl, K.: Modelling of microbial carbon and nitrogen turnover in soil with special emphasis on N-trace gases emission, Plant Soil, 346, 297–330, https://doi.org/10.1007/s11104-011-0821-z, 2011.
Borken, W. and Matzner, E.: Reappraisal of drying and wetting effects on C and N mineralization and fluxes in soils, Glob. Change Biol., 15, 808–824, https://doi.org/10.1111/j.1365-2486.2008.01681.x, 2009.
Brandt, K. K., Frandsen, R. J. N., Holm, P. E., and Nybroe, O.: Development of pollution-induced community tolerance is linked to structural and functional resilience of a soil bacterial community following a five-year field exposure to copper, Soil Biol. Biochem., 42, 748–757, https://doi.org/10.1016/j.soilbio.2010.01.008, 2010.
Broos, K., Warne, M. S. J., Heemsbergen, D. A., Stevens, D., Barnes, M. B., Correll, R. L., and McLaughlin, M. J.: Soil factors controlling the toxicity of copper and zinc to microbial processes in Australian soils, Environ. Toxicol. Chem., 26, 583–590, https://doi.org/10.1897/06-302R.1, 2007.
Butterbach-Bahl, K., Kahl, M., Mykhayliv, L., Werner, C., Kiese, R., and Li, C.: A European-wide inventory of soil NO emissions using the biogeochemical models DNDC/Forest-DNDC, Atmos. Environ., 43, 1392–1402, https://doi.org/10.1016/j.atmosenv.2008.02.008, 2009.
Butterbach-Bahl, K., Baggs, E. M., Dannenmann, M., Kiese, R., and Zechmeister-Boltenstern, S.: Nitrous oxide emissions from soils: How well do we understand the processes and their controls?, Philos. T. Roy. Soc. B, 368, 20130122, https://doi.org/10.1098/rstb.2013.0122, 2013.
Cambier, P., Michaud, A., Paradelo, R., Germain, M., Mercier, V., Guérin-Lebourg, A., Revallier, A., and Houot, S.: Trace metal availability in soil horizons amended with various urban waste composts during 17 years – Monitoring and modelling, Sci. Total Environ., 651, 2961–2974, https://doi.org/10.1016/j.scitotenv.2018.10.013, 2019.
Cosentino, D., Chenu, C., and Le Bissonnais, Y.: Aggregate stability and microbial community dynamics under drying-wetting cycles in a silt loam soil, Soil Biol. Biochem., 38, 2053–2062, https://doi.org/10.1016/j.soilbio.2005.12.022, 2006.
Cui, X. and Song, J.: Soil /NO3-nitrogen characteristics in primary forests and the adaptability of some coniferous species, Front. For. China, 2, 1–10, https://doi.org/10.1007/s11461-007-0001-8, 2007.
Denef, K., Six, J., Bossuyt, H., Frey, S. D., Elliott, E. T., Merckx, R., and Paustian, K.: Influence of dry-wet cycles on the interrelationship between aggregate, particulate organic matter, and microbial community dynamics, Soil Biol. Biochem., 33, 1599–1611, https://doi.org/10.1016/S0038-0717(01)00076-1, 2001.
De Vleeschouwer, F., Gérard, L., Goormaghtigh, C., Mattielli, N., Le Roux, G., and Fagel, N.: Atmospheric lead and heavy metal pollution records from a Belgian peat bog spanning the last two millenia: Human impact on a regional to global scale, Sci. Total Environ., 377, 282–295, https://doi.org/10.1016/j.scitotenv.2007.02.017, 2007.
Dobbie, K. E. and Smith, K. A.: Nitrous oxide emission factors for agricultural soils in Great Britain: The impact of soil water-filled pore space and other controlling variables, Glob. Change Biol., 9, 204–218, https://doi.org/10.1046/j.1365-2486.2003.00563.x, 2003.
Fierer, N., Schimel, J. P., and Holden, P. A.: Influence of drying-rewetting frequency on soil bacterial community structure, Microb. Ecol., 45, 63–71, https://doi.org/10.1007/s00248-002-1007-2, 2003.
Foltz, M. E., Zilles, J. L., and Koloutsou-Vakakis, S.: Prediction of N2O emissions under different field management practices and climate conditions, Sci. Total Environ., 646, 872–879, https://doi.org/10.1016/j.scitotenv.2018.07.364, 2019.
Galloway, J. N., Aber, J. D., Erisman, J. W., Seitzinger, S. P., Howarth, R. W., Cowling, E. B. And Cosby, B. J.: The Nitrogen Cascade, Bioscience, 53, 341–356, https://doi.org/10.1641/0006-3568(2003)053[0341:tnc]2.0.co;2, 2003.
Galloway, J. N., Townsend, A. R., Erisman, J. W., Bekunda, M., Cai, Z., Freney, J. R., Martinelli, L. A., Seitzinger, S. P., and Sutton, M. A.: Transformation of the nitrogen cycle: Recent trends, questions, and potential solutions, Science (80-.), 320, 889–892, https://doi.org/10.1126/science.1136674, 2008.
Gauch, H. G., Hwang, J. T. G., and Fick, G. W.: Model Evaluation by Comparison of Model-Based Predictions and Measured Values, Agron. J., 95, 1442–1446, https://doi.org/10.2134/agronj2003.1442, 2003.
Giller, K. E., Witter, E., and McGrath, S. P.: Heavy metals and soil microbes, Soil Biol. Biochem., 41, 2031–2037, https://doi.org/10.1016/j.soilbio.2009.04.026, 2009.
Giltrap, D. L., Li, C., and Saggar, S.: DNDC: A process-based model of greenhouse gas fluxes from agricultural soils, Agr. Ecosyst. Environ., 136, 292–300, https://doi.org/10.1016/j.agee.2009.06.014, 2010.
Gleeson, D. B., Herrmann, A. M., Livesley, S. J., and Murphy, D. V.: Influence of water potential on nitrification and structure of nitrifying bacterial communities in semiarid soils, Appl. Soil Ecol., 40, 189–194, https://doi.org/10.1016/j.apsoil.2008.02.005, 2008.
Göransson, H., Godbold, D. L., Jones, D. L., and Rousk, J.: Bacterial growth and respiration responses upon rewetting dry forest soils: Impact of drought-legacy, Soil Biol. Biochem., 57, 477–486, https://doi.org/10.1016/j.soilbio.2012.08.031, 2013.
Guo, X., Drury, C. F., Yang, X., Daniel Reynolds, W., and Fan, R.: The Extent of Soil Drying and Rewetting Affects Nitrous Oxide Emissions, Denitrification, and Nitrogen Mineralization, Soil Sci. Soc. Am. J., 78, 194–204, https://doi.org/10.2136/sssaj2013.06.0219, 2014.
Holtan-Hartwig, L., Bechmann, M., Risnes Høyås, T., Linjordet, R., and Reier Bakken, L.: Heavy metals tolerance of soil denitrifying communities: N2O dynamics, Soil Biol. Bioch., 34, 1181–1190, https://doi.org/10.1016/S0038-0717(02)00055-X, 2002.
Homyak, P. M., Allison, S. D., Huxman, T. E., Goulden, M. L., and Treseder, K. K.: Effects of Drought Manipulation on Soil Nitrogen Cycling: A Meta-Analysis, J. Geophys. Res.-Biogeo., 122, 3260–3272, https://doi.org/10.1002/2017JG004146, 2017.
Hund-Rinke, K. and Simon, M.: Bioavailability assessment of contaminants in soils via respiration and nitrification tests, Environ. Pollut., 153, 468–475, https://doi.org/10.1016/j.envpol.2007.08.003, 2008.
IPCC: IPCC Special Report on Climage Change and Land: Chapter 4: Land Degradation, 1–112, https://www.ipcc.ch/report/srccl/ (last access: 2 November 2021), 2019.
Kemper, W. D., Rosenau, R., and Nelson, S.: Gas Displacement and Aggregate Stability of Soils, Soil Sci. Soc. Am. J., 49, 25–28, https://doi.org/10.2136/sssaj1985.03615995004900010004x, 1985.
Kesik, M., Ambus, P., Baritz, R., Brüggemann, N., Butterbach-Bahl, K., Damm, M., Duyzer, J., Horváth, L., Kiese, R., Kitzler, B., Leip, A., Li, C., Pihlatie, M., Pilegaard, K., Seufert, S., Simpson, D., Skiba, U., Smiatek, G., Vesala, T., and Zechmeister-Boltenstern, S.: Inventories of N2O and NO emissions from European forest soils, Biogeosciences, 2, 353–375, https://doi.org/10.5194/bg-2-353-2005, 2005.
Khalil, K., Mary, B., and Renault, P.: Nitrous oxide production by nitrification and denitrification in soil aggregates as affected by O2 concentration, Soil Biol. Biochem., 36, 687–699, https://doi.org/10.1016/j.soilbio.2004.01.004, 2004.
Khan, S., Cao, Q., Zheng, Y. M., Huang, Y. Z., and Zhu, Y. G.: Health risks of heavy metals in contaminated soils and food crops irrigated with wastewater in Beijing, China, Environ. Pollut., 152, 686–692, https://doi.org/10.1016/j.envpol.2007.06.056, 2008.
Knutti, R. and Sedláček, J.: Robustness and uncertainties in the new CMIP5 climate model projections, Nat. Clim. Change, 3, 369–373, https://doi.org/10.1038/nclimate1716, 2012.
Kremen, A., Bear, J., Shavit, U., and Shaviv, A.: Model demonstrating the potential for coupled nitrification denitrification in soil aggregates, Environ. Sci. Technol., 39, 4180–4188, https://doi.org/10.1021/es048304z, 2005.
Lado, L. R., Hengl, T., and Reuter, H. I.: Heavy metals in European soils: A geostatistical analysis of the FOREGS Geochemical database, Geoderma, 148, 189–199, https://doi.org/10.1016/j.geoderma.2008.09.020, 2008.
Leffelaar, P. A.: Dynamics of partial anaerobiosis, denitrification, and water in a soil aggregate: Simulation, Soil Sci., 146, 427–444, https://doi.org/10.1097/00010694-198812000-00004, 1988.
Li, C., Frolking, S., and Frolking, T. A.: A model of nitrous oxide evolution from soil driven by rainfall events: 1. Model structure and sensitivity, J. Geophys. Res., 97, 9759–9776, https://doi.org/10.1029/92jd00509, 1992.
Li, C., Aber, J., Stange, F., Butterbach-Bahl, K., and Papen, H.: A process-oriented model of N2O and NO emissions from forest soils: 1. Model development, J. Geophys. Res.-Atmos., 105, 4369–4384, https://doi.org/10.1029/1999JD900949, 2000.
Manzoni, S., Schimel, J. P., and Porporato, A.: Responses of soil microbial communities to water stress: Results from a meta-analysis, Ecology, 93, 930–938, https://doi.org/10.1890/11-0026.1, 2012.
Mertens, J., Wakelin, S. A., Broos, K., Mclaughlin, M. J., and Smolders, E.: Extent of copper tolerance and consequences for functional stability of the ammonia-oxidizing community in long-term copper-contaminated Soils, Environ. Toxicol. Chem., 29, 27–37, https://doi.org/10.1002/etc.16, 2010.
Miranda, K. M., Espey, M. G., and Wink, D. A.: A rapid, simple spectrophotometric method for simultaneous detection of nitrate and nitrite, Nitric Oxide-Biol. Ch., 5, 62–71, https://doi.org/10.1006/niox.2000.0319, 2001.
Moyano, F. E., Manzoni, S., and Chenu, C.: Responses of soil heterotrophic respiration to moisture availability: An exploration of processes and models, Soil Biol. Biochem., 59, 72–85, https://doi.org/10.1016/j.soilbio.2013.01.002, 2013.
Nicholson, F. A., Smith, S. R., Alloway, B. J., Carlton-Smith, C., and Chambers, B. J.: An inventory of heavy metals inputs to agricultural soils in England and Wales, Sci. Total Environ., 311, 205–219, https://doi.org/10.1016/S0048-9697(03)00139-6, 2003.
Oorts, K., Bronckaers, H., and Smolders, E.: Discrepancy of the microbial response to elevated copper between freshly spiked and long-term contaminated soils, Environ. Toxicol. Chem., 25, 845–853., 2006.
Peacock, A. D., Mullen, M. D., Ringelberg, D. B., Tyler, D. D., Hedrick, D. B., Gale, P. M., and White, D. C.: Soil microbial community responses to dairy manure or ammonium nitrate applications, Soil Biol. Biochem., 33, 1011–1019, https://doi.org/10.1016/S0038-0717(01)00004-9, 2001.
Petersen, D. G., Blazewicz, S. J., Firestone, M., Herman, D. J., Turetsky, M., and Waldrop, M.: Abundance of microbial genes associated with nitrogen cycling as indices of biogeochemical process rates across a vegetation gradient in Alaska, Environ. Microbiol., 14, 993–1008, https://doi.org/10.1111/j.1462-2920.2011.02679.x, 2012.
R Core Team: R: A language and environment for statistical computing. R Foundation for Statistical Computing, Vienna, Austria, https://www.R-project.org/ (last access: 12 June 2021), 2020.
Rillig, M. C., Ryo, M., Lehmann, A., Aguilar-Trigueros, C. A., Buchert, S., Wulf, A., Iwasaki, A., Roy, J., and Yang, G.: The role of multiple global change factors in driving soil functions and microbial biodiversity, Science (80-.), 366, 886–890, https://doi.org/10.1126/science.aay2832, 2019.
Rodríguez-Eugenio, N., McLaughlin, M., and Pennock, D.: Soil Pollution: a hidden reality, Rome, FAO, 142 pp., 2018.
Ruyters, S., Springael, D., and Smolders, E.: Recovery of Soil Ammonia Oxidation After Long-Term Zinc Exposure Is Not Related to the Richness of the Bacterial Nitrifying Community, Microb. Ecol., 66, 312–321, https://doi.org/10.1007/s00248-013-0210-7, 2013.
Sauvé, S., Dumestre, A., McBride, M., Gillett, J. W., Berthelin, J., and Hendershot, W.: Nitrification potential in field-collected soils contaminated with Pb or Cu, Appl. Soil Ecol., 12, 29–39, https://doi.org/10.1016/S0929-1393(98)00166-8, 1999.
Schimel, J. P.: Life in Dry Soils: Effects of Drought on Soil Microbial Communities and Processes, Annu. Rev. Ecol. Evol. S., 49, 409–432, https://doi.org/10.1146/annurev-ecolsys-110617-062614, 2018.
Schlüter, S., Henjes, S., Zawallich, J., Bergaust, L., Horn, M., Ippisch, O., Vogel, H. J., and Dörsch, P.: Denitrification in soil aggregate analogues-effect of aggregate size and oxygen diffusion, Front. Environ. Sci., 6, https://doi.org/10.3389/fenvs.2018.00017, 2018.
Schurgers, G., Dörsch, P., Bakken, L., Leffelaar, P., and Haugen, L. E.: Modelling soil anaerobiosis from water retention characteristics and soil respiration, Soil Biol. Biochem., 38, 2637–2644, https://doi.org/10.1016/j.soilbio.2006.04.016, 2006.
Sereni, L.: Données de réplication pour: To what extend soil moisture and contamination stresses can affect greenhouse gas emissions? An attempt to calibrate a nitrification/denitrification model, INRAE [data set], https://doi.org/10.15454/ZUKN90, 2021.
Sereni, L., Guenet, B., and Lamy, I.: Does Copper Contamination Affect Soil CO2 Emissions? A Literature Review, Front. Environ. Sci., 9, 29, https://doi.org/10.3389/fenvs.2021.585677, 2021.
Sereni, L., Guenet, B., Crouzet, O., and Lamy, I.: Responses of Soil Nitrification Activities To Copper After A Moisture Stress, Environ. Sci. Pollut. Res., 1–18, https://doi.org/10.1007/s11356-022-19093-2, 2022.
Signor, D. and Cerri, C. E. P.: Nitrous oxide emissions in agricultural soils: a review, Pesqui. Agropecu. Trop., 43, 322–338, https://doi.org/10.1590/s1983-40632013000300014, 2013.
Smolders, E., Oorts, K., Van Sprang, P., Schoeters, I., Janssen, C. R., McGrath, S. P., and McLaughlin, M. J.: Toxicity of trace metals in soil as affected by soil type and aging after contamination: Using calibrated bioavailability models to set ecological soil standards, Environ. Toxicol. Chem., 28, 1633–1642, https://doi.org/10.1897/08-592.1, 2009.
Stark, J. M. and Firestone, M. K.: Mechanisms for soil moisture effects on activity of nitrifying bacteria, Appl. Environ. Microbiol., 61, 218–221, https://doi.org/10.1128/aem.61.1.218-221.1995, 1995.
Steinnes, E., Allen, R. O., Petersen, H. M., Rambæk, J. P., and Varskog, P.: Evidence of large scale heavy-metal contamination of natural surface soils in Norway from long-range atmospheric transport, Sci. Total Environ., 205, 255–266, https://doi.org/10.1016/S0048-9697(97)00209-X, 1997.
Vásquez-Murrieta, M. S., Cruz-Mondragón, C., Trujillo-Tapia, N., Herrera-Arreola, G., Govaerts, B., Van Cleemput, O., and Dendooven, L.: Nitrous oxide production of heavy metal contaminated soil, Soil Biol. Biochem., 38, 931–940, https://doi.org/10.1016/j.soilbio.2005.08.007, 2006.
Vuichard, N., Messina, P., Luyssaert, S., Guenet, B., Zaehle, S., Ghattas, J., Bastrikov, V., and Peylin, P.: Accounting for carbon and nitrogen interactions in the global terrestrial ecosystem model ORCHIDEE (trunk version, rev 4999): multi-scale evaluation of gross primary production, Geosci. Model Dev., 12, 4751–4779, https://doi.org/10.5194/gmd-12-4751-2019, 2019.
Wrage-Mönnig, N., Horn, M. A., Well, R., Müller, C., Velthof, G., and Oenema, O.: The role of nitrifier denitrification in the production of nitrous oxide revisited, Soil Biol. Biochem., 123, A3–A16, https://doi.org/10.1016/j.soilbio.2018.03.020, 2018.
Wuana, R. A. and Okieimen, F. E.: Heavy Metals in Contaminated Soils: A Review of Sources, Chemistry, Risks and Best Available Strategies for Remediation, ISRN Ecol., 2011, 1–20, https://doi.org/10.5402/2011/402647, 2011.
Xiong, Z.-Q., Xing, G.-X. And Zhu, Z.-L.: Nitrous Oxide And Methane Emissions As Affected By Water, Soil And Nitrogen, Pedosphere, 17, 146–155, https://doi.org/10.1016/s1002-0160(07)60020-4, 2007.
Zaehle, S. and Friend, A.: Carbon and nitrogen cycle dynamics in the O-CN land surface model: 1. Model description, site-scale evaluation, and sensitivity to parameter estimates, Global Biogeochem. Cy., 24, https://doi.org/10.1029/2009GB003521, 2010.
Zandalinas, S. I., Fritschi, F. B., and Mittler, R.: Global Warming, Climate Change, and Environmental Pollution: Recipe for a Multifactorial Stress Combination Disaster, Trends Plant Sci., 26, 1–12, https://doi.org/10.1016/j.tplants.2021.02.011, 2021.
Zhao, J. H.: Gap: Genetic analysis package, J. Stat. Softw., 23, 1–18, https://doi.org/10.18637/jss.v023.i08, 2007.