the Creative Commons Attribution 4.0 License.
the Creative Commons Attribution 4.0 License.
 | 04 Jul 2022
Variation in CO2 and CH4 fluxes among land cover types in heterogeneous Arctic tundra in northeastern Siberia
Mika Aurela
Juha-Pekka Tuovinen
Viktor Ivakhov
Maiju Linkosalmi
Aleksi Räsänen
Tarmo Virtanen
Juha Mikola
Johanna Nyman
Emmi Vähä
Marina Loskutova
Alexander Makshtas
Tuomas Laurila
Arctic tundra is facing unprecedented warming, resulting in shifts in the vegetation, thaw regimes, and potentially in the ecosystem–atmosphere exchange of carbon (C). However, the estimates of regional carbon dioxide (CO2) and methane (CH4) budgets are highly uncertain. We measured CO2 and CH4 fluxes, vegetation composition and leaf area index (LAI), thaw depth, and soil wetness in Tiksi (71∘ N, 128∘ E), a heterogeneous site located within the prostrate dwarf-shrub tundra zone in northeastern Siberia. Using the closed chamber method, we determined the net ecosystem exchange (NEE) of CO2, ecosystem respiration in the dark (ER), ecosystem gross photosynthesis (Pg), and CH4 flux during the growing season. We applied a previously developed high-spatial-resolution land cover map over an area of 35.8 km2 for spatial extrapolation. Among the land cover types varying from barren to dwarf-shrub tundra and tundra wetlands, the NEE and Pg at the photosynthetically active photon flux density of 800 µmol m−2 h−1 (NEE800 and Pg800) were greatest in the graminoid-dominated habitats, i.e., streamside meadow and fens, with NEE800 and Pg800 of up to −21 (uptake) and 28 mmol m−2 h−1, respectively. Vascular LAI was a robust predictor of both NEE800 and Pg800 and, on a landscape scale, the fens were disproportionately important for the summertime CO2 sequestration. Dry tundra, including the dwarf-shrub and lichen tundra, had smaller CO2 exchange rates. The fens were the largest source of CH4, while the dry mineral soil tundra consumed atmospheric CH4, which on a landscape scale amounted to −9 % of the total CH4 balance during the growing season. The largest seasonal mean CH4 consumption rate of 0.02 mmol m−2 h−1 occurred in sand- and stone-covered barren areas. The high consumption rate agrees with the estimate based on the eddy covariance measurements at the same site. We acknowledge the uncertainty involved in spatial extrapolations due to a small number of replicates per land cover type. This study highlights the need to distinguish different land cover types including the dry tundra habitats to account for their different CO2 and CH4 flux patterns, especially the consumption of atmospheric CH4, when estimating tundra C exchange on a larger spatial scale.
- Article
(7691 KB) - Full-text XML
- BibTeX
- EndNote


It is uncertain whether the Arctic tundra is a sink or a source of atmospheric carbon (C). The current estimates suggest a sink of 13–110 Tg C yr−1, but their uncertainty range crosses the zero balance (McGuire et al., 2012; Virkkala et al., 2021). Improving these estimates is vital, because the Arctic tundra covers a vast area of 7.6 million km2 (Walker, 2000) that is experiencing substantial warming (IPCC, 2013; Chen et al., 2021). Warming can alter C exchange, either amplifying or mitigating climate change through ecosystem–atmosphere interactions. Some local-scale studies suggest that the Arctic tundra is shifting from a small sink to a source of C (Webb et al., 2016; Euskirchen et al., 2017). It is likely that the climate change response of the ecosystem carbon dioxide (CO2) sink strength and methane (CH4) emissions, whether an increase or a decrease, depends on site-specific changes in thawing, wetness, temperature, and vegetation (McGuire et al., 2018). Dynamics of C exchange need to be quantified across the arctic habitats to improve the upscaling of arctic CO2 and CH4 balances and to monitor how ecosystems respond to environmental changes.
The uncertainty in the Arctic C balance estimates arises from the sparse and uneven observation network, which provides poor support for model-based spatial extrapolation (cf. McGuire et al., 2018; Virkkala et al., 2021; Kuhn et al., 2021). On a local scale, landscape heterogeneity and the related difficulty of mapping the spatial distribution of habitats and their C fluxes add to this uncertainty (McGuire et al., 2012; Treat et al., 2018; Saunois et al., 2020). Furthermore, year-to-year variations in seasonal features, particularly the timing of spring, summer temperatures, and snow depth have been found to cause substantial variation in the annual CO2 and CH4 balances (Aurela et al., 2004; Humphreys and Lafleur, 2011; Zhang et al., 2019). Fine-scale spatial heterogeneity in soil water saturation, thaw depth, vegetation characteristics, and soil organic content is typical of the tundra landscape (e.g., Virtanen and Ek, 2014; Mikola et al., 2018; Lara et al., 2020). These factors control CO2 and CH4 exchange, and on an annual scale, tundra wetlands typically act as net CO2 sinks while upland tundra areas have a close-to-neutral CO2 balance (e.g., Marushchak et al., 2013; Virkkala et al., 2021). While tundra wetlands are substantial sources of CH4, dry tundra acts as a small sink or small source of atmospheric CH4 (Bartlett and Harriss, 1993; Kuhn et al., 2021).
Mineral soil tundra barrens, however, have been found to have high consumption rates of atmospheric CH4, which is due to the high-affinity methane oxidizing bacteria (Emmerton et al., 2014; Jørgensen et al., 2014; D'Imperio et al., 2017; Oh et al., 2020). These bacteria can utilize atmospheric CH4 as energy source at low atmospheric concentrations, opposite to the low-affinity methane oxidizers that require higher CH4 concentrations and occur in wetlands (e.g., Oh et al., 2020). A modeling exercise that introduced the high-affinity methanotrophy for mineral-rich soils resulted in a doubling of the circumpolar soil CH4 sink above 50∘ N compared to previous estimates (Oh et al., 2020). Thus, distinguishing dry and wet tundra with their moisture and vegetation characteristics is crucial when mapping C exchange within the tundra biome. Treat et al. (2018) tested spatial resolution requirements for such mapping on a landscape level and found that a 20 m pixel size captured the spatial variation in a reasonable manner, while a coarser resolution resulted in underestimation of both the landscape-scale CO2 uptake and CH4 emissions. In addition, understanding the spatial heterogeneity of ecosystem C exchange substantially improves analyses of eddy covariance (EC) measurements that, while in principle representing spatially integrated fluxes, may provide biased gas flux balances in a highly heterogeneous source and sink environment, as the spatial integration of EC involves non-uniform weighting of the surface elements that contribute to the measured flux (Tuovinen et al., 2019).
The aim of this study was to assess the spatial patterns and magnitudes of CO2 and CH4 fluxes within heterogeneous prostrate dwarf-shrub tundra in Tiksi, located in northeastern Russia. Growing season fluxes of CO2 (ecosystem net exchange, photosynthesis, and respiration) and CH4 were determined using the chamber method to answer the questions: (i) what is the magnitude of these fluxes in different land cover types and (ii) how do they depend on vegetation characteristics and soil wetness? In addition, we extrapolated the plot-level measurements in space and compared them with the ecosystem-level data measured with the EC technique.
2.1 Study site
The study site is located near the Tiksi Observatory in Sakha (Yakutia) (see Uttal et al., 2016), northeastern Russia (71.5943∘ N, 128.8878∘ E), 500 m inland from the Laptev Sea coast and, on average, 7 m above sea level (Fig. 1a). The area belongs to the middle-Arctic prostrate dwarf-shrub tundra subzone (Walker, 2000) and has continuous permafrost. At the end of the growing season, the maximum thaw depth is ca. 40 cm (Mikola et al., 2018). The climate in Tiksi is defined by cold winters and cool summers. The long-term mean annual temperature and mean annual precipitation were −12.7 ∘C and 232 mm, respectively, during the climate normal period 1981–2010. The growing season lasts about 3 months, the soils typically freeze in the end of September, and the permanent snow falls in October and thaws in June (AARI, 2018).
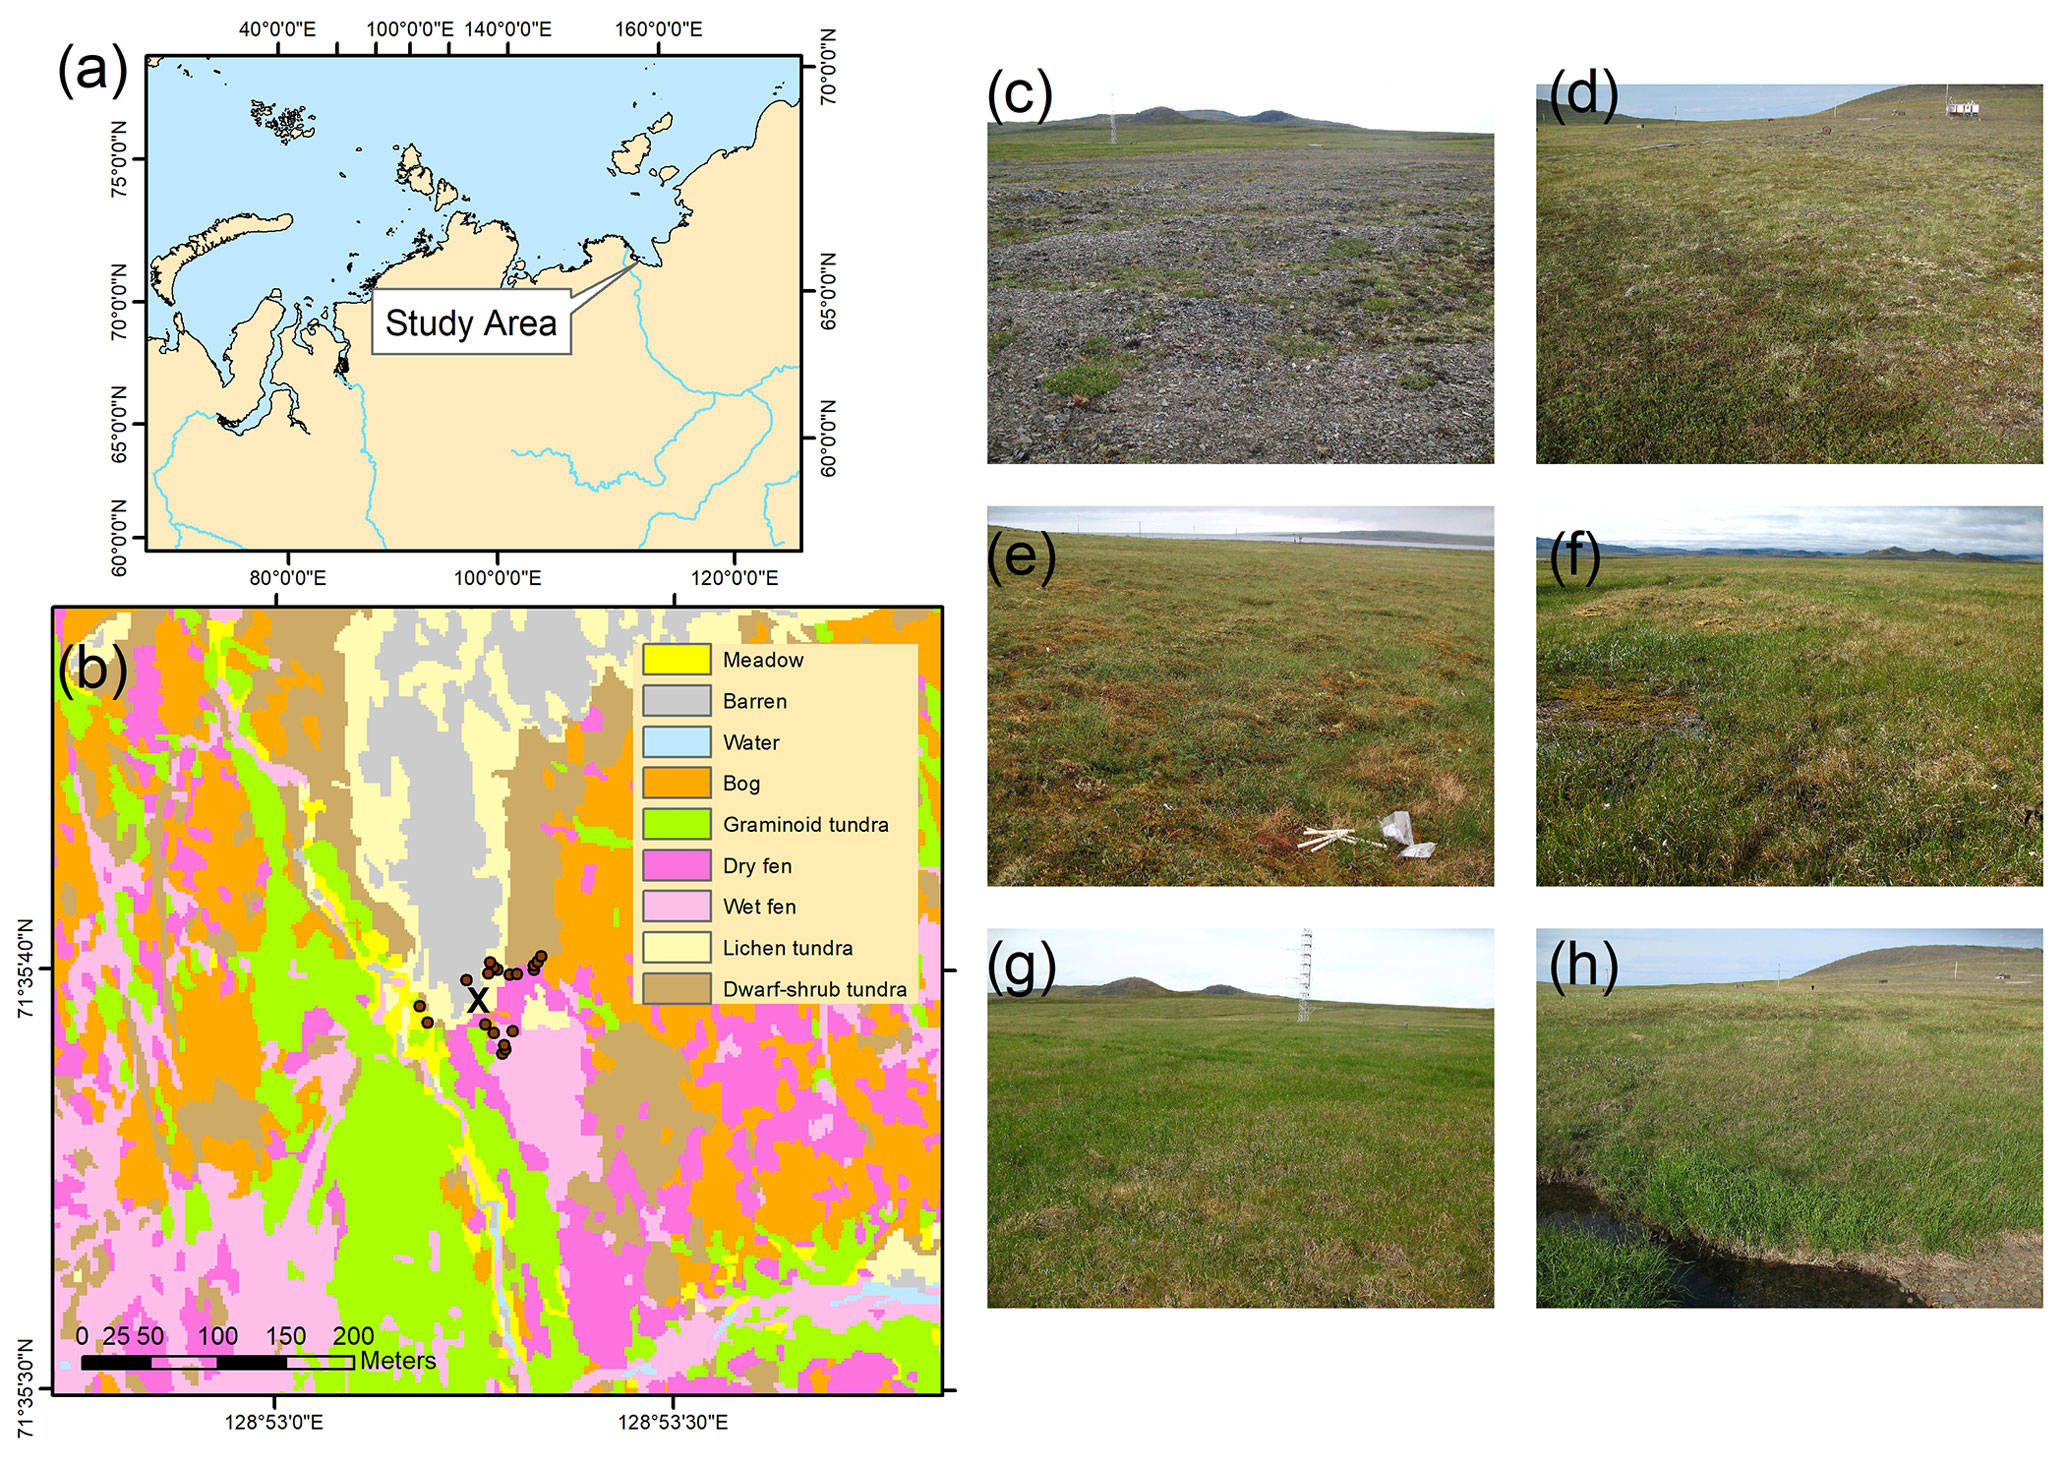
Figure 1(a) Location of the study area in Tiksi, Yakutia, Russia. (b) Land cover map with the chamber flux measurement points (dark dots) and the EC mast (cross), and photos of the land cover types: (c) lichen tundra with barren ground and patches of vegetation, (d) dwarf-shrub tundra, (e) bog, (f) wet and dry fen, (g) graminoid tundra, and (h) meadow by the stream. See Tuovinen et al. (2019) for the EC footprint climatology.
Bedrock is alkaline, resulting in high plant species richness. Vegetation consists of mosses, lichens, grasses, sedges, prostrate dwarf-shrubs such as willows (Salix spp.), dwarf birch (Betula nana) and Diapensia lapponica, and forb species (Table 1). The average height of dwarf-shrub species is 4–6 cm, and the leaf area index (LAI) of vascular plants reaches up to 1 m2 m−2 in the fen and meadow habitats with graminoid vegetation (Juutinen et al., 2017). The land cover at the site has been classified a priori and mapped based on a combination of field inventories and high-spatial-resolution satellite images (Mikola et al., 2018). The a priori land cover types (LCTs) consist of wet fen, dry fen, graminoid tundra, bog, meadow at the stream bank, dwarf-shrub tundra, and lichen tundra that consists of barren ground with rocks, sand, and patches of vegetation (Table 1, Fig. 1c–h; for a closer view see Appendix Fig. A1). The depth of organic layer is negligible in lichen tundra and a few centimeters in dwarf-shrub tundra, meadow, and graminoid tundra. In bog, dry fen, and wet fen, the organic layer depth is at least the maximum depth of the active layer, ca. 30–40 cm. Soil organic content can reach ca. 40 % in tundra wetlands (Mikola et al., 2018). A section of the wet and dry fen within the EC footprint area is disturbed by vehicle tracks that create open water surfaces, and there is also an area of eroded bare-peat surface on a dry fen.
Table 1Soil and vegetation characteristics of the land cover types (LCT) and their proportions in the EC impact area (90 % of the cumulative footprint).
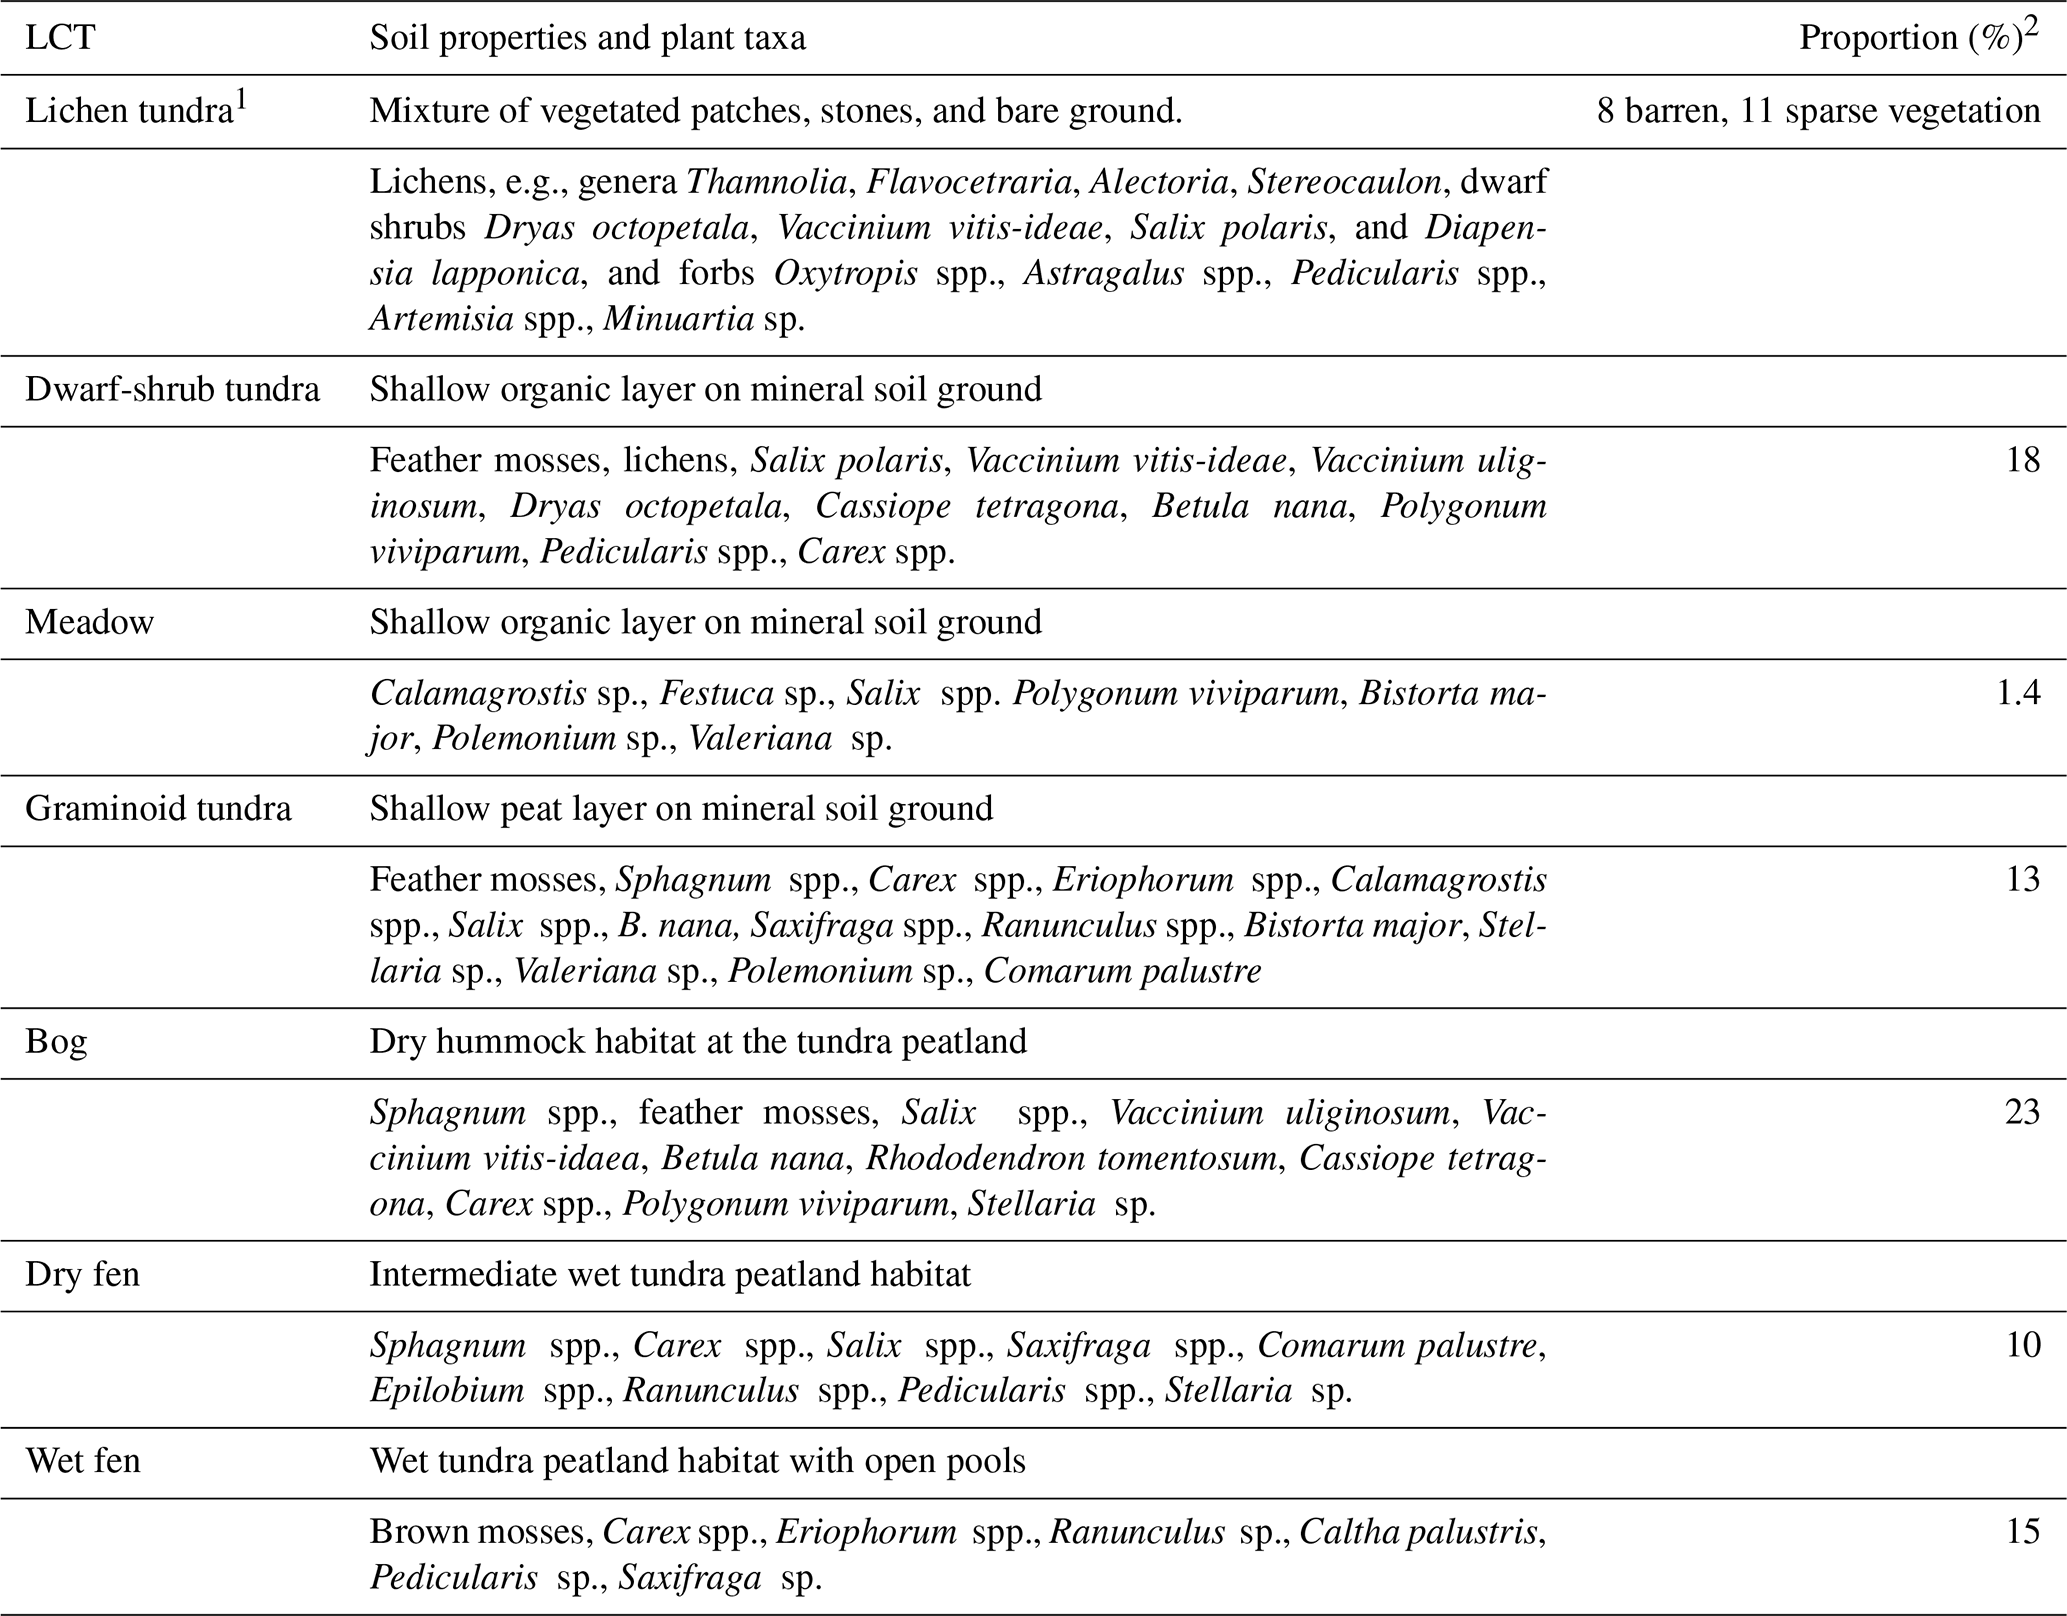
1 Combines the bare and lichen tundra LCTs defined in Juutinen et al. (2017), Mikola et al. (2018), and Tuovinen et al. (2019). 2 Proportion within the 90 % coverage of the mean EC footprint area during the growing season of 2014 (Tuovinen et al., 2019).
2.2 CO2 and CH4 flux measurements
Fluxes of CO2 and CH4 were measured using static chambers equipped with a fan and set on pre-installed collars of 50 cm × 50 cm in area. The measurement points (collars) were set to cover the heterogeneity in land cover, and in each study year, there were 1–4 measurement points per LCT (Table 2). Most of the data were collected during a study campaign during 15 July–16 August 2014 (12 collars). The growing season had started earlier due to a warm period, and the daily mean air temperature had stayed over 5 ∘C since 5 July (Fig. 2 and Tuovinen et al., 2019). The net ecosystem exchange of CO2 (NEE) and ecosystem respiration of CO2 in the dark (ER) were measured using transparent and opaque chambers (transparent chamber covered with a hood), respectively, allowing the partitioning of ecosystem gross photosynthesis (Pg) and ER. Fluxes of CH4 were determined from closures of both transparent and opaque chambers, but because there was no difference between them when performed consecutively, the data from opaque chamber measurements were used for flux calculations. In addition, CH4 fluxes were measured during shorter campaigns in 2012, 2013, 2016, and 2019 (Table 2). These data also included the plots disturbed by vehicle tracks and an eroded bare-peat surface, which were measured in 2019.
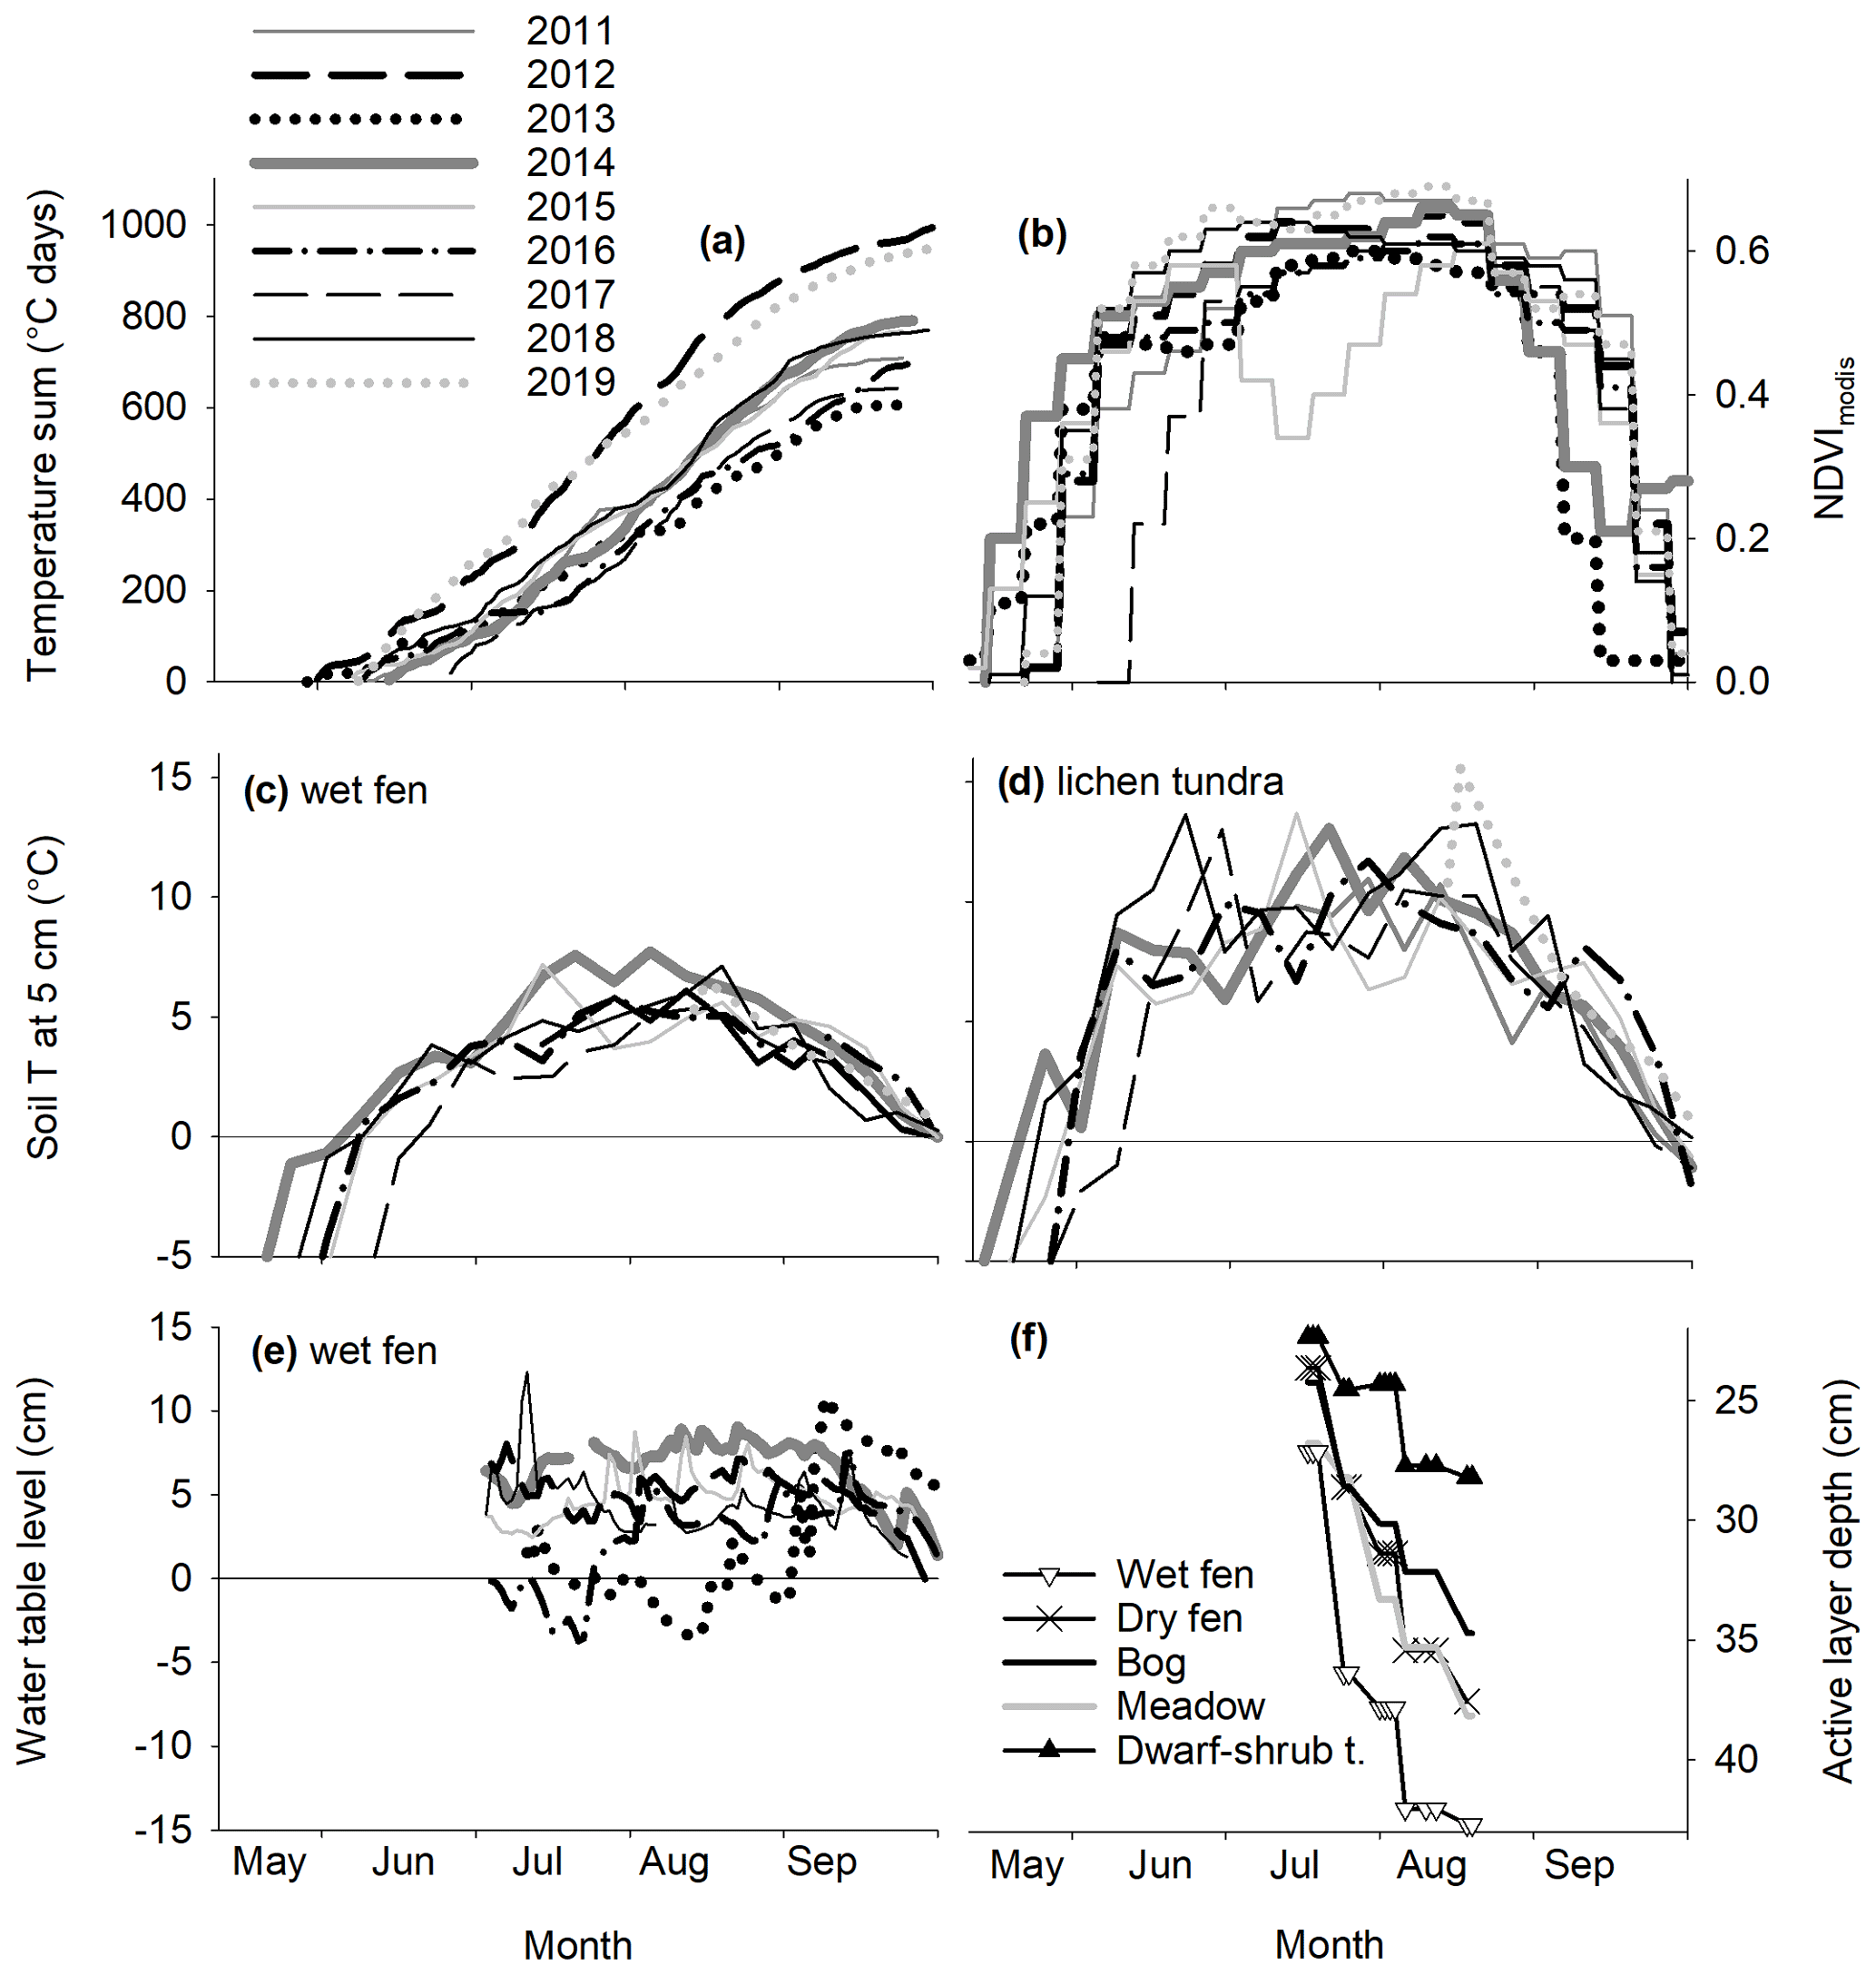
Figure 2(a) Air temperature accumulation with the threshold Tair and surface Tsoil of 0 ∘C, (b) seasonal dynamics of NDVI in the study area (16 d MODIS data), (c) weekly means of soil temperature at a depth of 5 cm in wet fen and (d) in lichen tundra, (e) water-table level relative to the ground surface in wet fen, and (f) LCT-specific means of thaw depth in the measurement collars in 2014. Rocks in the ground prevented detecting the thaw depth of lichen tundra.
In 2012 and 2013, four air samples were taken from the chambers using syringes. The samples were stored in glass vials prior to the analysis. First, a vial was flushed with the sample and then filled to overpressure. The samples were analyzed for CH4 concentration using a TSVET 500 M gas chromatograph (Chromatek, Russia) with a flame ionization detector at the laboratory of the Voeikov Main Geophysical Observatory within a month of sampling. Each measurement was accompanied by calibration using standard gas mixtures with known CH4 concentrations (the NOAA2004 scale). The vials were tested prior to the field sampling using a standard gas: after 2 weeks, the vials were still overpressurized and the sample CH4 concentrations were within ±3 ppb of the initial standard gas concentration. Since July 2014, CH4 and CO2 concentrations inside the chambers were recorded every second during closures of about 5 min using a gas analyzer (DLT-100, Los Gatos Research, Inc., San Jose, CA, USA) (see Appendix Fig. A2 for examples).
Gas fluxes between the ecosystem and the atmosphere were calculated from the linear concentration change in the chamber head space over time, accounting for temperature, volume, and atmospheric pressure. The concentration change during each chamber closure was evaluated visually to determine the closure start time and to remove cases showing nonlinearity due to leaks, ebullition, or saturation. The first data points were generally neglected when determining the slope of concentration change over time. The linearity was screened also on the basis of the coefficient of determination of the fit (R2). An R2 greater than 0.9 was required, except for nearzero fluxes. There were a few ebullition cases at the vehicle track measurement points that had only sparse or no vegetation cover, and those measurements were included in the final data. When determining the NEE fluxes measured using the transparent chamber, data were screened for variation in photosynthetically active photon flux density (PPFD), measured during the chamber closure, and the flux measurement was rejected if the PPFD variation exceeded 100 µmol m−2 s−1 during the closure.
The fluxes of CO2 and CH4 were also measured by the micrometeorological EC method, which provides continuous data of the atmosphere–biosphere fluxes averaged on an ecosystem scale. The EC system consisted of a three-dimensional sonic anemometer (USA-1, METEK GmbH, Elmshorn, Germany), a closed-path CH4 analyzer (RMT-200, Los Gatos Research, Inc., San Jose, CA, USA), and a closed-path CO2 H2O analyzer (LI-7000, LI-COR, Inc., Lincoln, NE, USA). The fluxes were calculated as 30 min averages and processed using standard methods (Aubinet et al., 2012). The EC measurement system and the post-processing procedures have been presented in more detail by Tuovinen et al. (2019).
Supporting meteorological measurements including air temperature (Tair) (HMP, Vaisala), soil temperature (Tsoil) (IKES, Nokeval), PPFD (PQS1, Kipp & Zonen), and water table level relative to the ground surface (WT) (8438.66.2646, Trafag) were collected by a Vaisala QML datalogger as 30 min averages. We also present meteorological data for the period 2011–2019 to relate the conditions during the measurement campaigns in 2012, 2013, 2014, 2016, and 2019, to longer-term variations.
2.3 Vegetation and topographic wetness index
On a site level, vegetation and soil characteristics were inventoried in plots assigned into a systematic grid outside the area covered by the gas flux measurement points in 2014 (see Juutinen et al., 2017; Mikola et al., 2018). The projection cover (%) of plant species and species groups, and the mean canopy height of each species group were recorded. Eight species groups were included in the inventory: Sphagnum mosses, feather mosses, brown mosses, dwarf shrubs, Betula nana, Salix species, forbs, and graminoids. A subset of the plots was harvested, and vascular plant leaves were scanned to determine the one-sided LAI for empirical relationships between LAI and %-cover and canopy height, which were used to estimate the LAI in the collars (see Juutinen et al., 2017). In the collars, the projection cover and canopy height of each species group were recorded weekly during the gas flux measurement campaign during 15 July–16 August 2014. Because there were no observational vegetation data for the other years than 2014, the green chromatic coordinate (GCC) calculated from digital photographs was used as a proxy for the amount of green above-ground vascular plants (e.g., Richardson, 2019). The GCC was calculated from the digital numbers of red (R), green (G), and blue (B) color channels as the proportion of green in the RGB images, GCC = G (R + G + B), of the vegetation inside the collars. The photographs were taken at the time of measurements. We determined an empirical relationship between LAI and GCC by using a data set of harvested plots with digital photographs and measured LAI data (n=91). For the LAI estimation, we used a linear relationship (R2=0.46, p<0.001) between LAI and GCC determined using the entire data set (see Fig. A3 for the data and equation).
Table 2Measurement periods, measured fluxes (CH4, ER, NEE), and number of measurement points in each land cover type (LCT) across the study years.
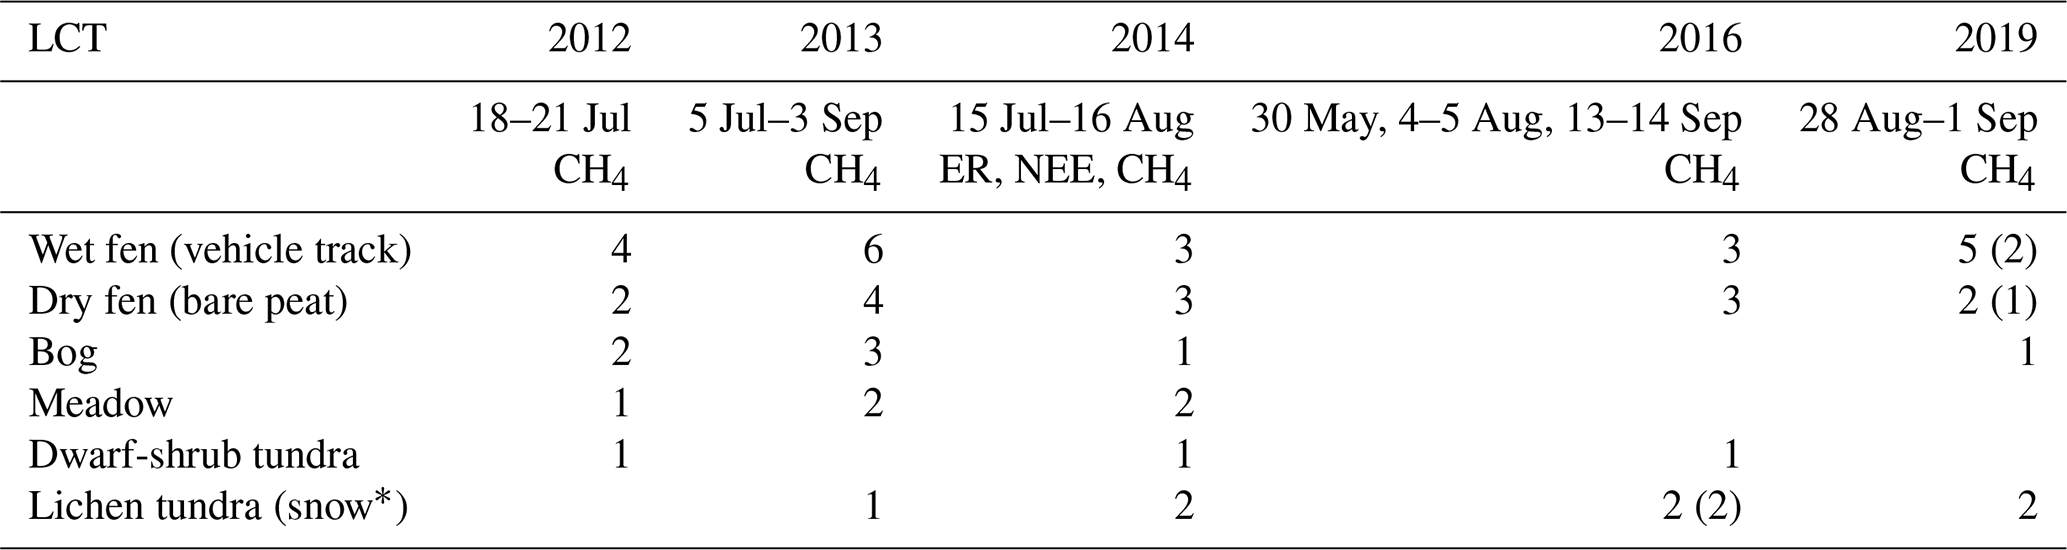
* Measured only on 30 May 2016.
To quantify the potential soil wetness at each measurement point, we calculated the mean topographic wetness index (TWI) based on a 2 m spatial resolution digital elevation model (Mikola et al., 2018). To characterize differences between growing seasons as manifested by vegetation greenness, the MODIS Normalized Difference Vegetation Index (NDVI) with 16 d temporal and 500 m spatial resolution was calculated for a circular area with a 300 m radius from the flux tower using Google Earth Engine (Gorelick et al., 2017). NDVI was derived for 2011–2019 to place the measurement years in the context of year-to-year variation in weather and plant growth.
2.4 Data analyses
When examining the role of the LCTs in CO2 and CH4 exchange, we applied the land cover classification presented by Mikola et al. (2018). The data collected in 15 July–16 August 2014 were used for examining gas exchange in relation to the variation in LAI, GCC, WT, and TWI among the collars. The light-normalized Pg and NEE at PPFD = 800 µmol m−2 s−1 (Pg800 and NEE800, respectively), were estimated by fitting a hyperbolic response function of CO2 vs PPFD utilizing the ER and NEE flux data:
where Pgmax is the asymptotic maximum of photosynthetic CO2 uptake rate, and β is the half-saturation PPFD. Fluxes of CH4 are expressed as temporal averages for each collar. We used a sign convention where a positive flux means net release to the atmosphere and a negative flux denotes net uptake by the ecosystem. Fluxes of CH4 measured over all study years, 2012–2019, were averaged for each LCT.
Regression analyses were used to test the relationships between gas flux estimates and vascular LAI, GCC, WT, and TWI. All CH4 flux data from the years 2012–2014, 2016, and 2019 were used to quantify the mean growing season CH4 flux for each LCT and examine the relationship between CH4 and GCC and TWI. To find the main factors and gradients in the plant community, gas flux, and environmental variables data measured in the flux collars in 2014, we performed a detrended correspondence analysis (DCA) of the species group data with a post-hoc fit of environmental variables, including gas fluxes, WT, LAI, GCC, elevation, and thaw depth as supplementary variables. The DCA was performed on logarithmically transformed, centered species data (species or species groups) using Canoco 5 (Šmilauer and Leps, 2014).
We compared the LCT-specific flux estimates obtained from the chamber measurements with the estimates based on EC measurements during the same period (15 July–16 August 2014). Partitioning of the EC-based CO2 fluxes to Pg and ER and the estimates of Pg800 and NEE800 were calculated similarly to those derived from the chamber data (Eq. 1). The EC flux data were classified into five wind sectors (30–125, 125–185, 185–239, 239–310, 310–360∘) based on the mean EC flux footprint, modeled for the growing season of 2014 by Tuovinen et al. (2019). The sectors distinguished areas dominated by different LCTs, especially tundra heaths and wetlands, and similarly those with a large and small vascular LAI. For each sector, the footprint-weighted areal proportions of LCTs and mean vascular LAI were derived from the high-spatial-resolution LCT and LAI maps (Mikola et al., 2018). For this comparison, sector averages of Pg800, ER, NEE800, and CH4 flux were calculated from the chamber data by weighting the LCT-specific flux estimates with the above-mentioned LCT proportions in each sector. Because there were no chamber measurement points within graminoid tundra, we applied wet fen (for CO2) and dry fen (for CH4) flux estimates for the graminoid tundra based on the observed similarities in LAI and soil wetness, respectively. Overall, graminoid tundra can be considered part of the fen continuum in terms of soil characteristics (notably high organic content) and CH4 exchange (Mikola et al., 2018; Tuovinen et al., 2019).
Finally, to synthesize the CO2 and CH4 exchange variability across the tundra, we upscaled the LCT-specific NEE800, Pg800, ER, and CH4 flux (2014 data) estimate averages to the 35.8 km2 area surrounding our study site, for which a LCT map was produced by Mikola et al. (2018).
3.1 Environmental conditions
In 2014, when we collected most of the flux data, temperature sum accumulation (with a 0 ∘C Tair threshold) took place at a near-average rate during the thaw period (the period when soil surface temperature was continuously above 0 ∘C), but the spring and mid-growing season were warmer than on average (Fig. 2a). The average air temperature was 15 ∘C during the gas flux measurements. Accordingly, the MODIS NDVI showed an early start of greening (Fig. 2b), and vegetation development had already started at the beginning of the measurement period. In 2011–2019, which includes all the CH4 measurement years, the thaw period lasted for 74–124 d, creating a temperature sum range of 642–1003 ∘C days (Fig. 2a). Surface soils thawed between 28 May and 9 July and froze again between 21 September and 1 October. Among the observation years, the years 2012 and 2019 had notably longer and warmer thaw periods than the other years. The driest habitat, lichen tundra, with least snow accumulation, thawed 10–15 d earlier than the other habitats and had an about 3 ∘C higher soil temperature at the depth of 5 cm than wet fen (Fig. 2c–d). Water table level, measured at a wet fen location, showed only subtle interannual variation (Fig. 2e). In 2014, the active layer depth, measured close to the collars during the flux measurement period, was deepest in the end of August, reaching ca. 40 cm in wet fen but remaining <30 cm in the dwarf-shrub tundra (Fig. 2f). Lichen tundra had rocks underneath the loose surface layer, which made it impossible to measure the actual thaw depth.
3.2 Exchange of CO2 and CH4
Among different LCTs, the estimates of Pg800 varied from about 5 mmol m−2 h−1 in lichen tundra to 22 and 27 mmol m−2 h−1 in wet fen and meadow, respectively (Table 3a). Pg800 was strongly and positively correlated with the vascular plant LAI and the greenness index GCC (Fig. 3). There was also a positive correlation between Pg800 and both WT and TWI, possibly because the highest LAI occurred at the wet fen and meadow plots. However, the TWI values for the two meadow plots located on an elevated bank of the stream were disproportionately high in relation to the WT at these plots, probably because of insufficient spatial accuracy or an artifact of the digital elevation model. Ecosystem respiration was highest in the two meadow plots, on average 18 mmol m−2 h−1. The relationship between ER and LAI was weaker than between Pg800 and LAI (Fig. 3). NEE800 varied from about zero in the lichen tundra plots to a net CO2 uptake of 16 mmol m−2 h−1 in the meadow and wet fen plots (Table 3a). NEE800 was more tightly linked to Pg800 than to ER and it was correlated with LAI, GCC, WT, and TWI (Fig. 3).
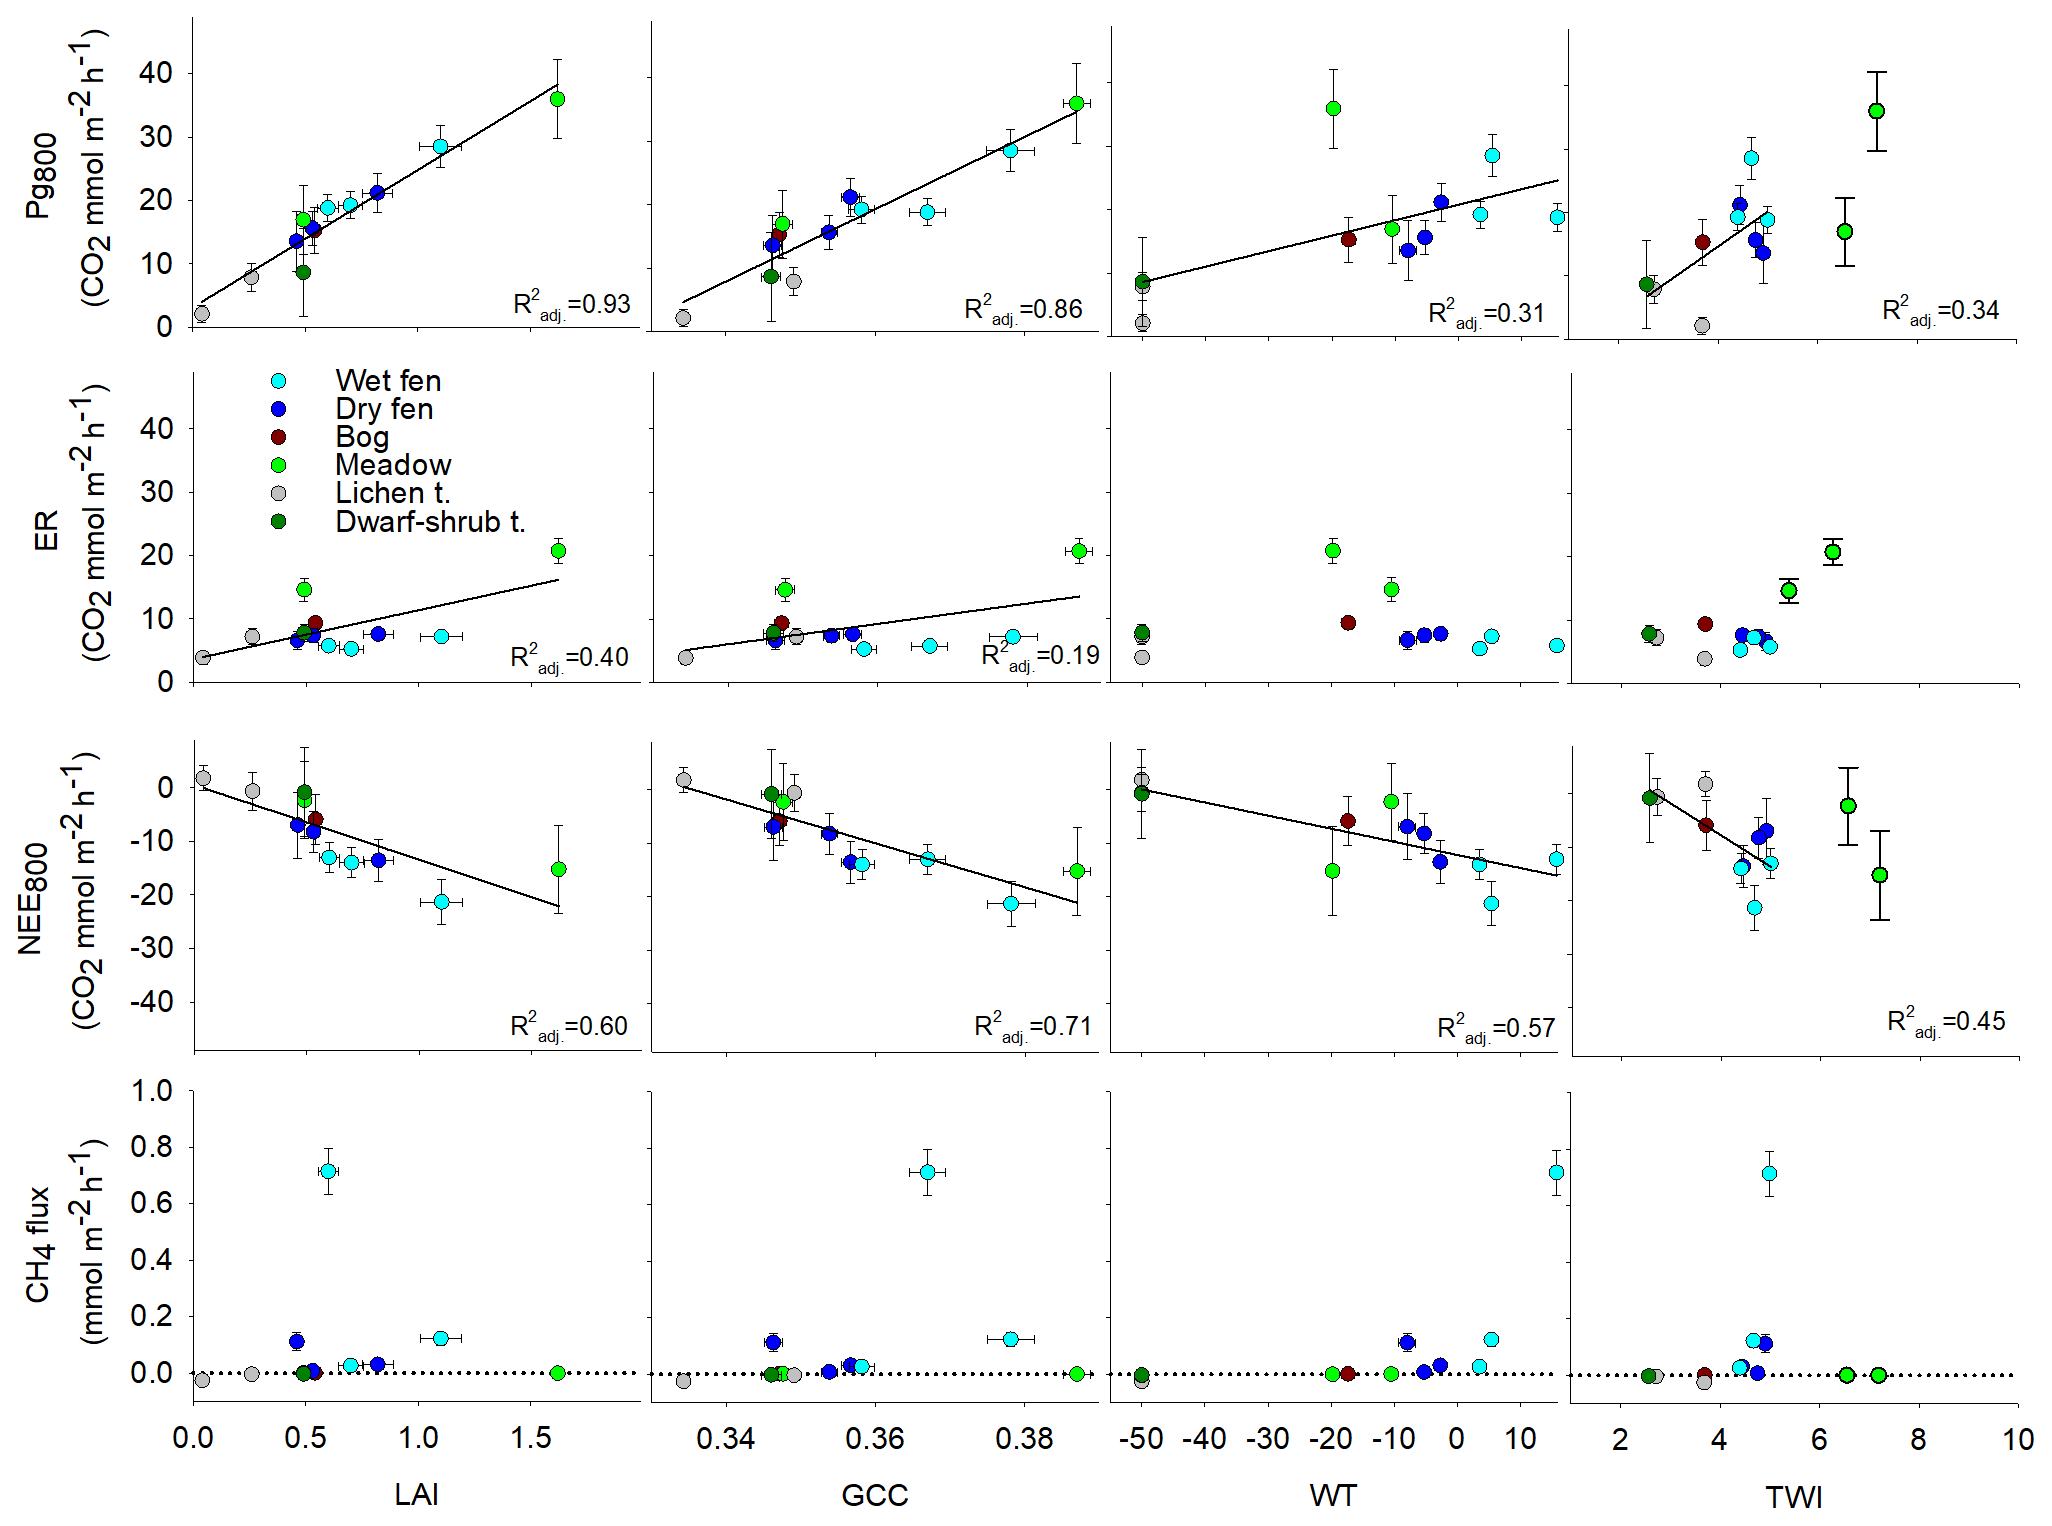
Figure 3Variation in the estimates of Pg800, ER, and NEE800 (Eq. 1) and collar means of CH4 fluxes in relation to variation in the collar means of LAI, GCC, WT, and TWI during 6 July–16 August 2014. Error bars denote the standard error of estimate (n=15 or 16). Fitted regression lines and adjusted coefficients of determination () are included for the significant linear relationships. The two meadow plots were not included in the TWI regressions.
Table 3(a) Means, medians, and standard deviations (sd) of LCT specific CO2 and CH4 fluxes in 2014 calculated from collar specific estimates (CO2) or seasonal means (CH4). There were 15 or 16 data points per each collar and 1–3 collars per LCT (see Table 2). (b) Proportions of LCTs in landscape totals of area, and Pg800, NEE800, and CH4 fluxes based on the LCT means (part a). (c) LCT specific means, medians, and standard deviations of CH4 fluxes based on multiyear data (n is number of the observations).
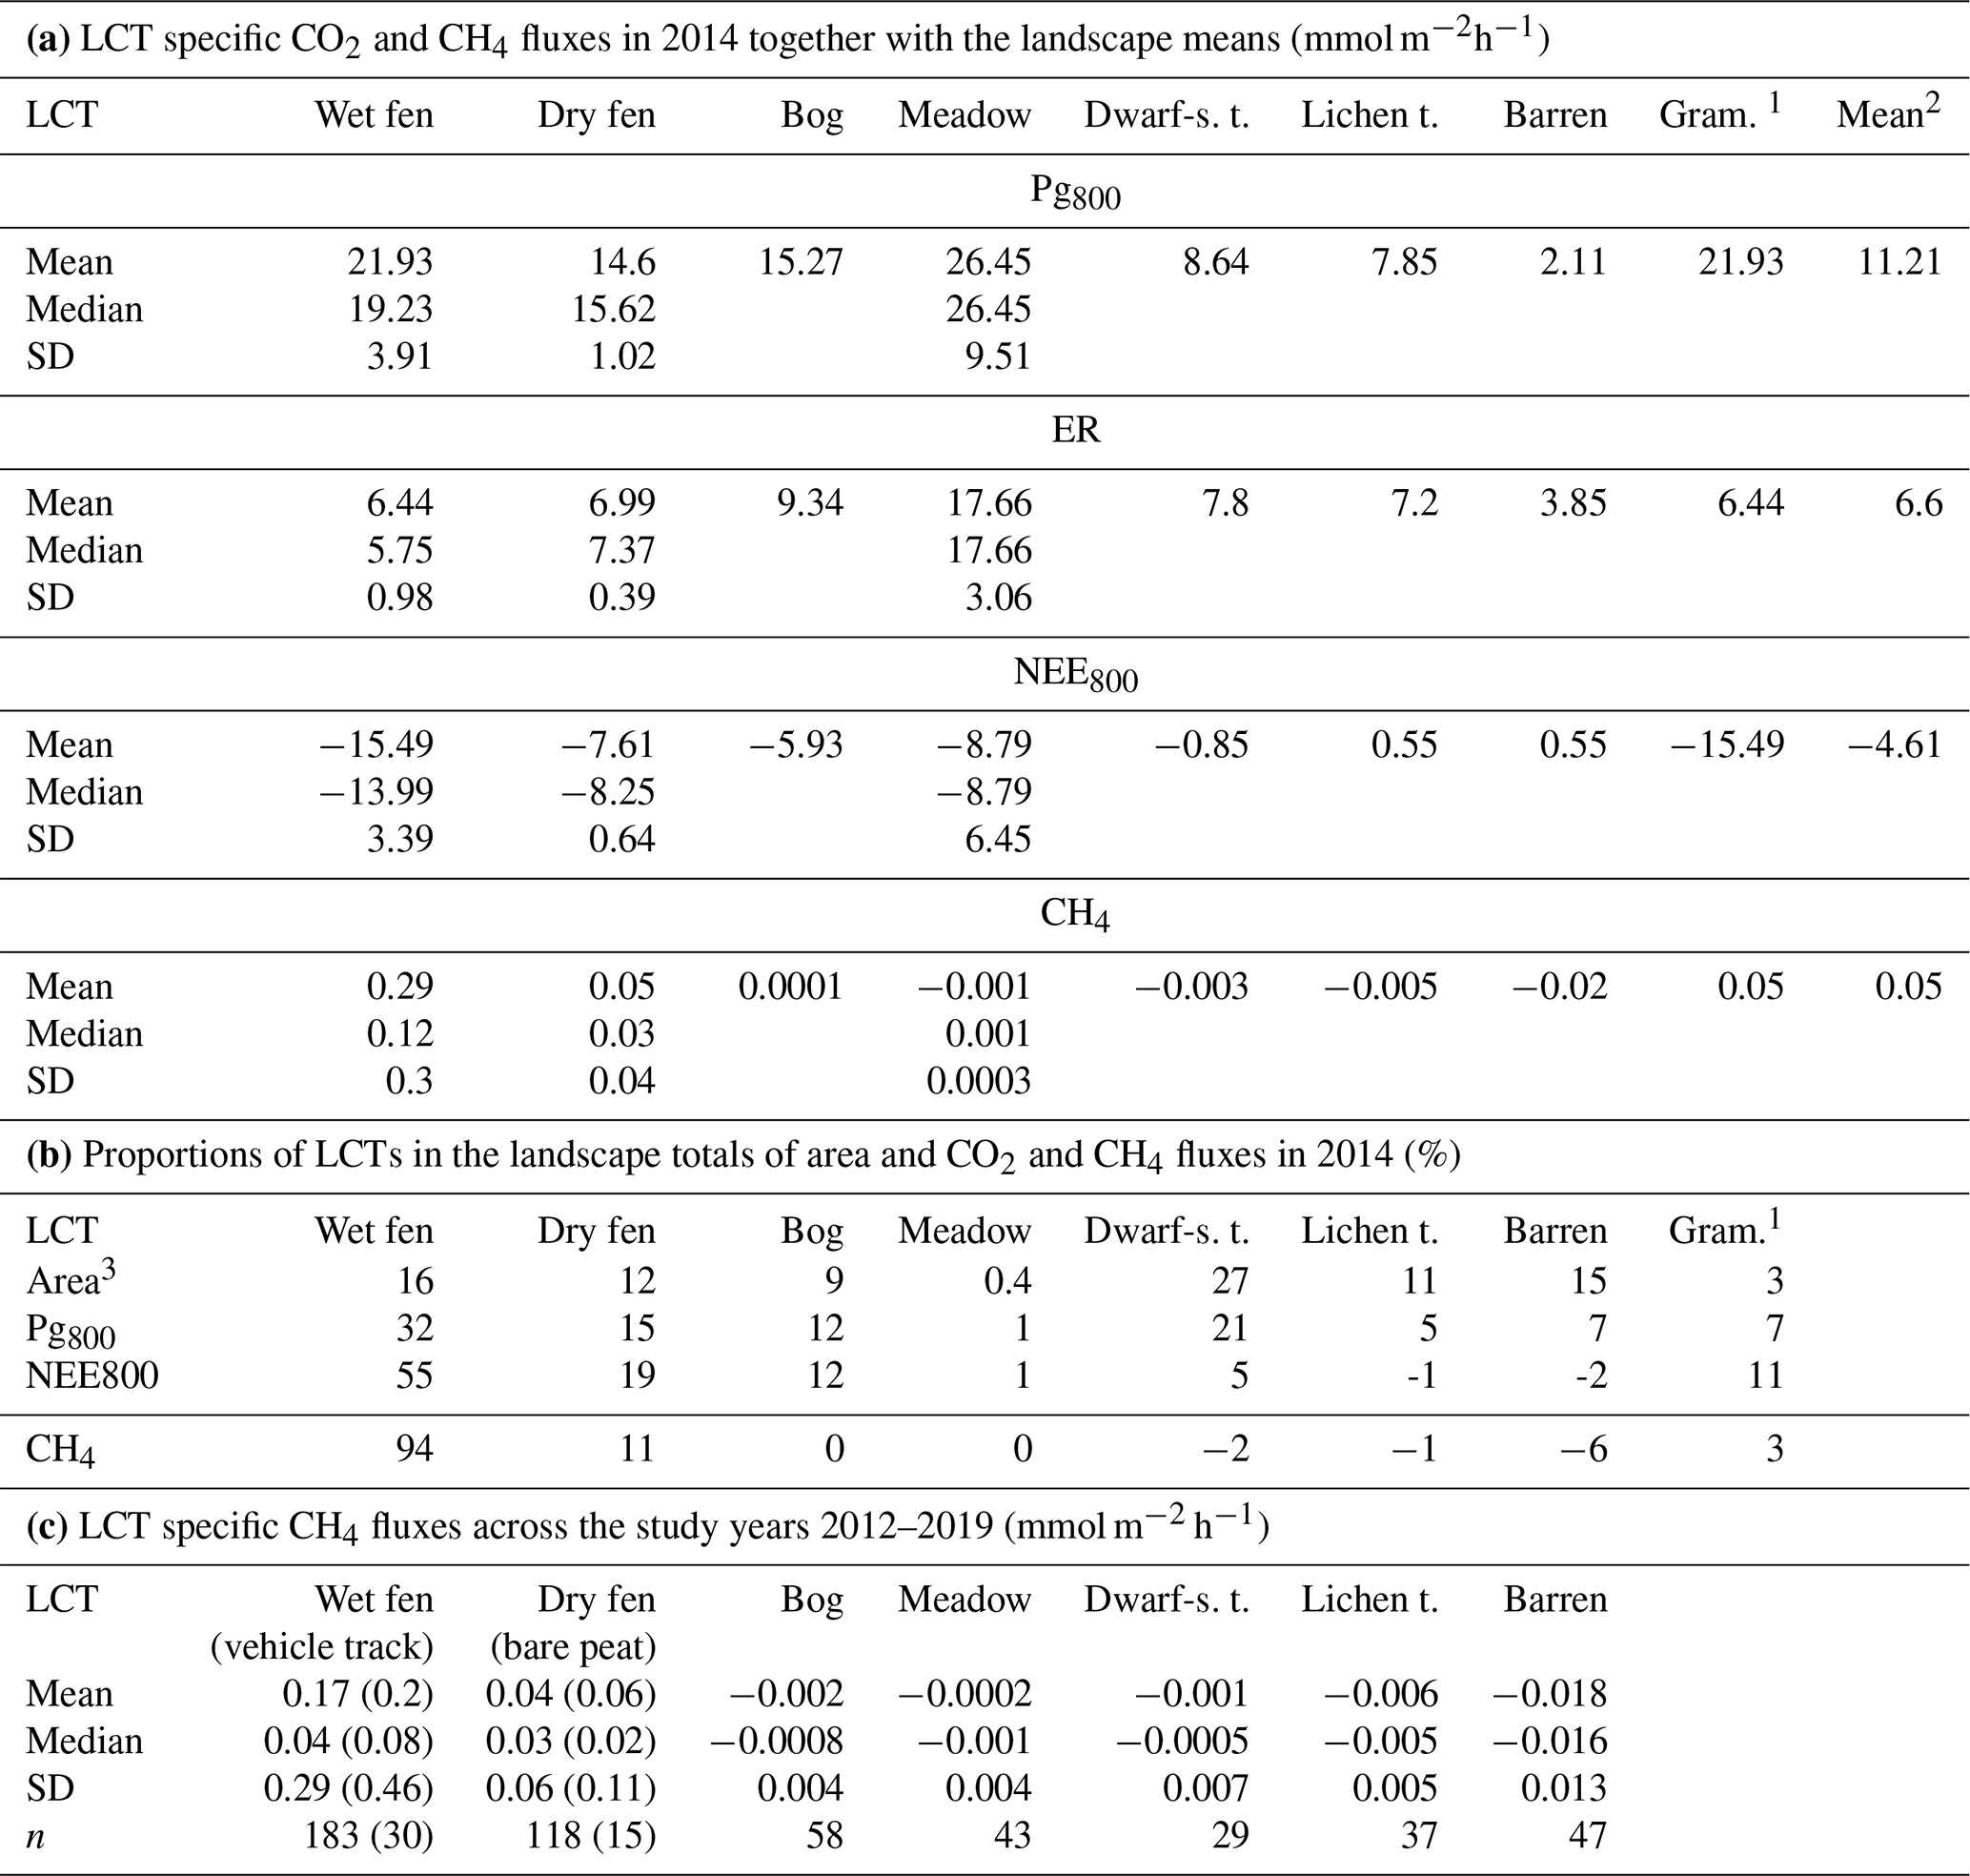
1 Graminoid tundra contribution estimated using values for wet fen (CO2) and dry fen (CH4), 2 Area-weighted mean. 3 Water not shown.
There was substantial consumption of atmospheric CH4 in the barren tundra, where the mean of all measured fluxes was −0.018 mmol m−2 h−1, and in the vegetated lichen tundra with a mean of −0.005 mmol m−2 h−1 (Table 3c, Figs. 4 and 5). Minor consumption occurred in the bog, meadow, and dwarf-shrub tundra plots (mean fluxes from −0.0002 to −0.001 mmol m−2 h−1), while efflux to the atmosphere was observed in the dry fen (mean 0.04 mmol m−2 h−1) and wet fen plots (mean 0.17 mmol m−2 h−1). Fluxes were also high in the eroded bare-peat plot within the dry fen habitat and the vehicle-track plots in wet fen (Table 3c).
Variation among the plot means (Fig. 3 for 2014) and LCT means (Fig. 5 for all years) of CH4 flux was related to WT, and CH4 emissions occurred when TWI was greater than 4. The two meadow plots that showed net consumption of CH4 had an unrealistically high TWI relative to their WT (see above and Figs. 3 and 5). Variation in CH4 fluxes was incoherently related to the variation in LAI and GCC because of the high emission cases in plots with little vegetation, including the wettest wet fen, vehicle-track, and bare-peat plots (Fig. 5).
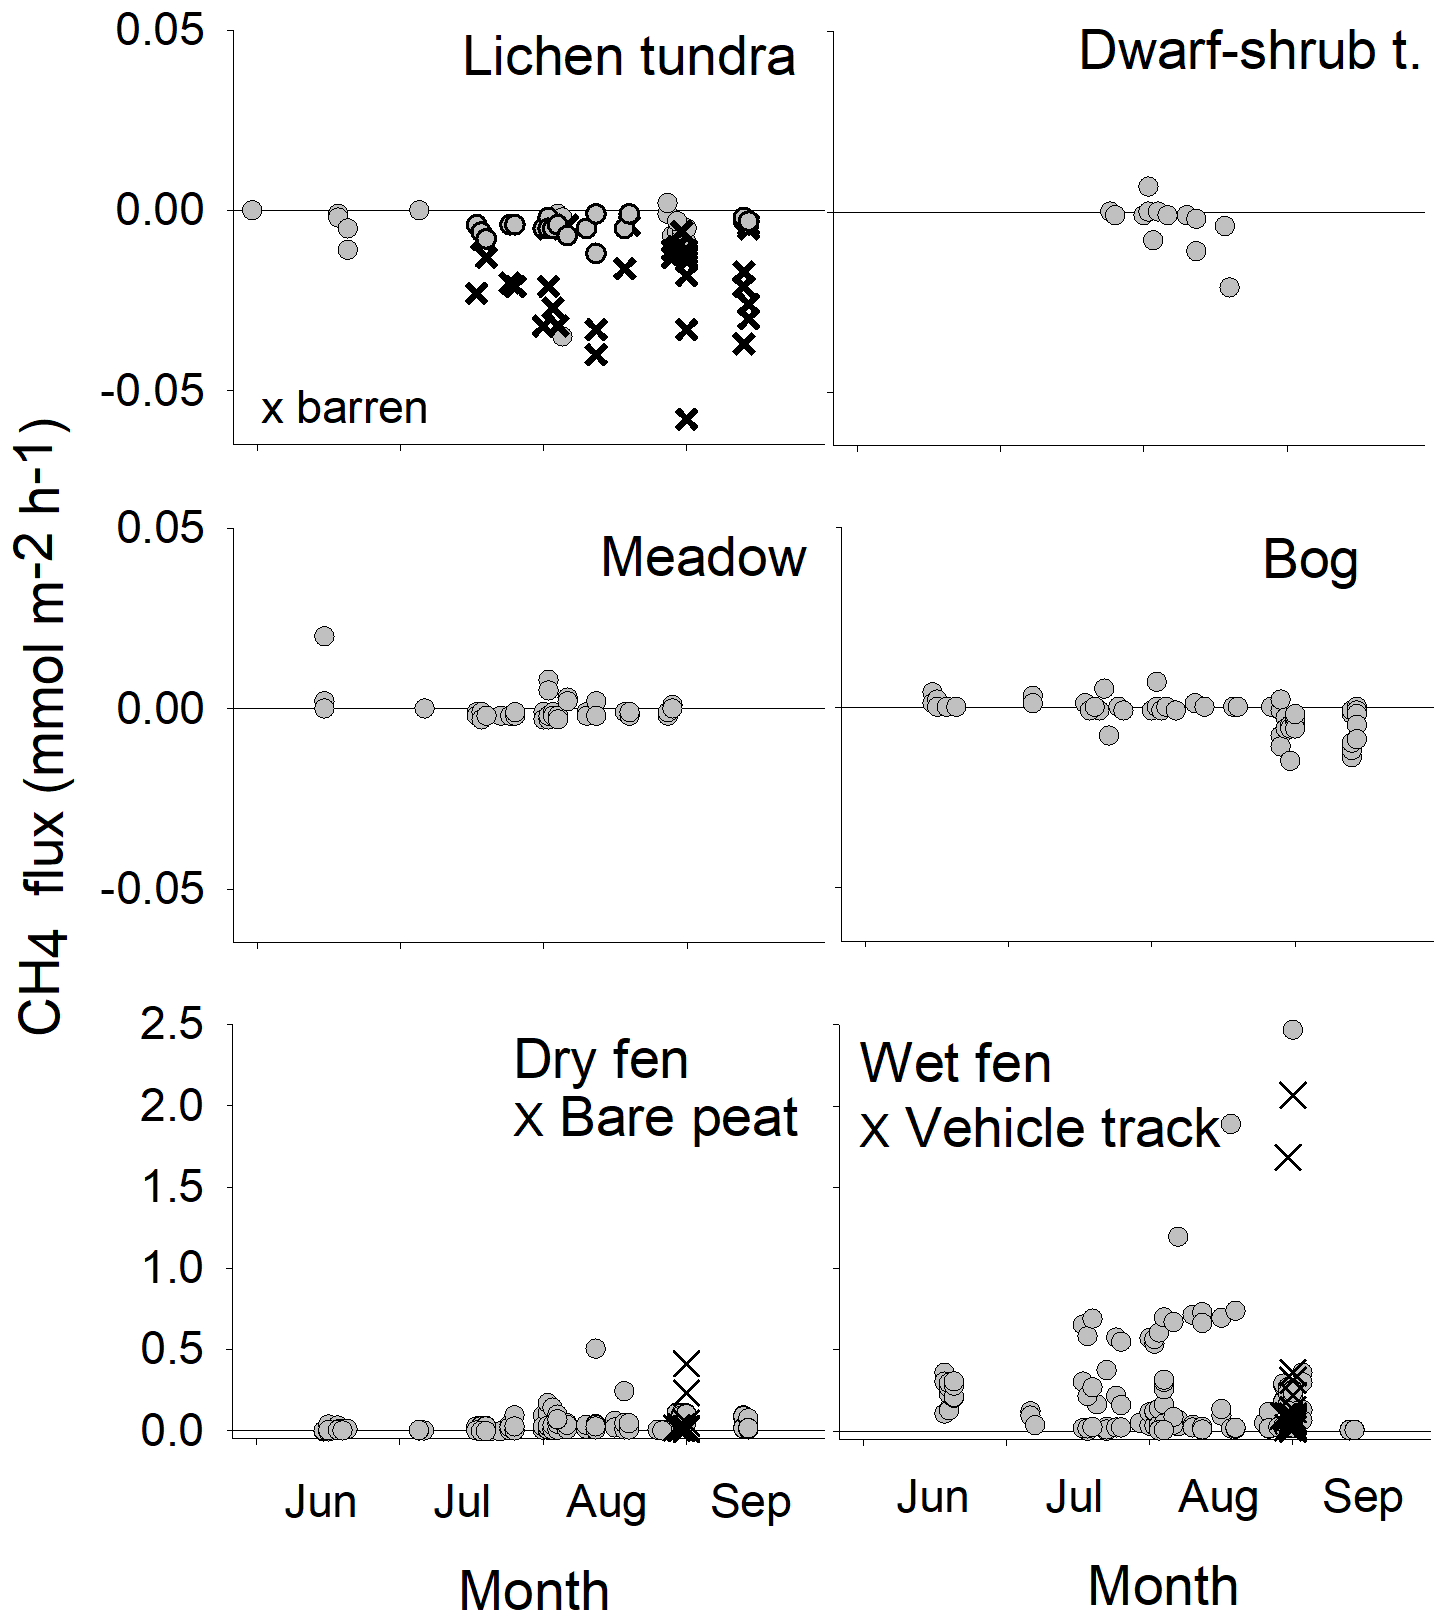
Figure 4Instantaneous CH4 fluxes in each LCT. The data are a composite of all study years. Barren surfaces are indicated among the lichen tundra data. The eroded bare-peat and vehicle-track plots (crosses) are plotted as part of the dry fen and wet fen data, respectively. Note that the panel groups have different y-axis scales.
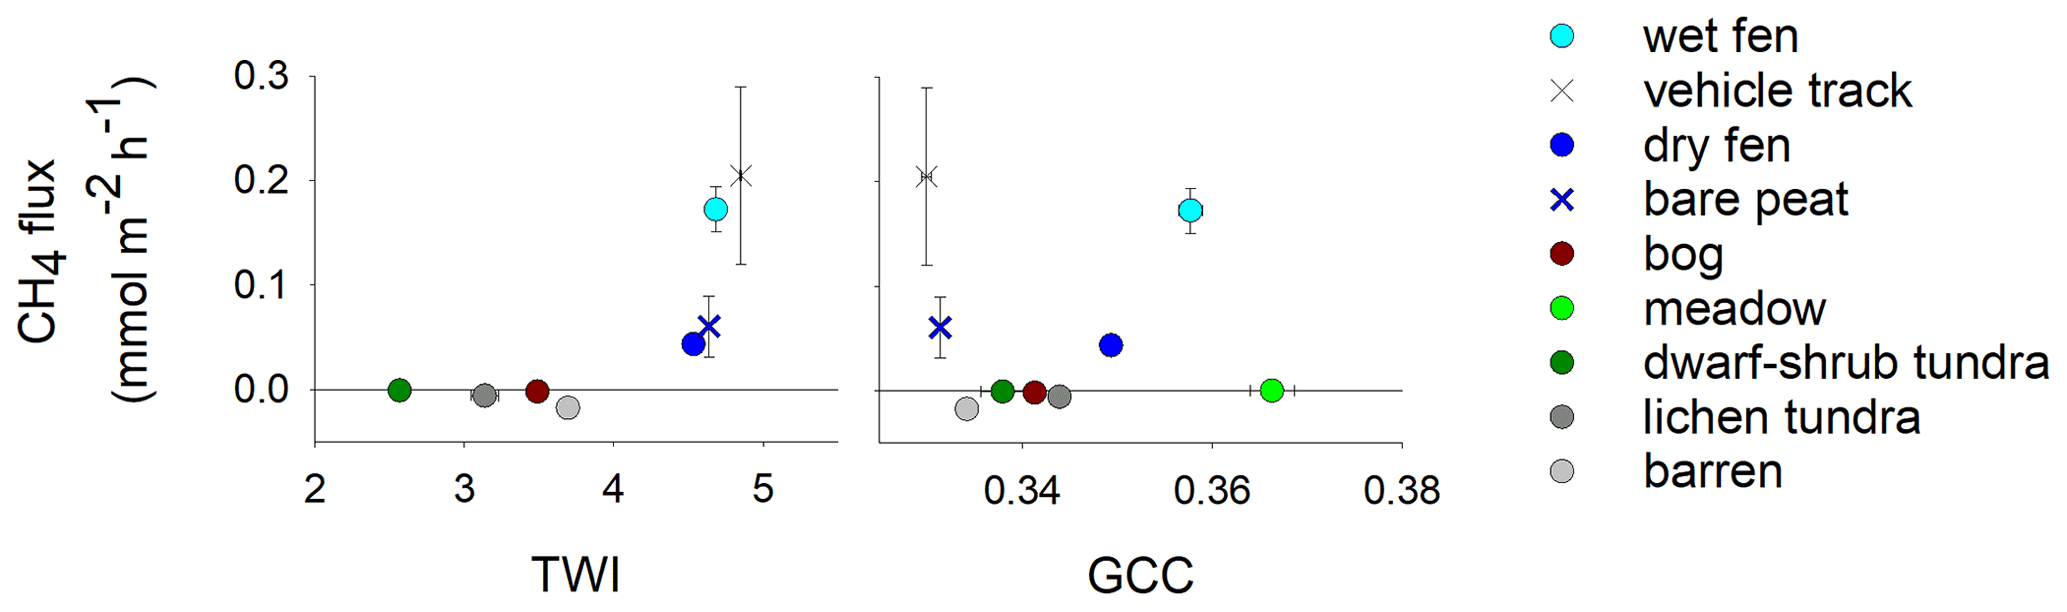
Figure 5LCT mean (± SE) CH4 fluxes in relation to the corresponding mean (± SE) TWI (excluding the meadow) and mean GCC. Data from years 2012–2019; see Table 3c for the number of measurements.
The DCA ordination of species groups with a post-hoc fit of environmental variables (elevation, WT, thaw depth, LAI, GCC, and CO2 and CH4 exchange) showed that species distributed along a moisture gradient. Axis 1 explained 49 % of the variation in the species data and distinguished the wet and dry LCTs (Fig. 6). Graminoids and brown mosses occurred in the wet end of the gradient, while evergreen dwarf-shrubs, Betula nana, and lichens occurred in the dry end of it. The barren plot (the other lichen tundra plot) with its negligible vegetation differed most from the other plots. Axis 2 explained additional 14 % of the variation in the species data (Fig. 6). The supplementary variables WT, vascular plant LAI, thaw depth, GCC, Pg800, NEE800, and CH4 flux correlated positively with Axis 1 having post-hoc correlations (r) of 0.6–0.9, as derived from the DCA-weighted correlation matrix, while plot's elevation and ER had positive correlations with Axis 2 (r=0.8 and 0.4, respectively).

Figure 6DCA ordination diagram based on species (species groups) data from the measurement collars in 2014. The explained variation in the species data is indicated for the axes. The scores are indicated for species groups (crosses), sample plots (small circles), and post-hoc fits of the supplementary variables (blue arrows). Land cover types of the sample plots are indicated in gray and the plots assigned to each LCT are circled (dashed ellipses).
In both the southern (125–185∘) and southwestern (185–239∘) wind sectors, vegetation mainly consisted of graminoids, as the LCTs dry fen, wet fen, graminoid tundra, and meadow comprised 80 % of the total EC footprint-weighted area (Fig. 7a). The northern sector (310–360∘) was characterized by lichen tundra and bare ground that accounted for 68 % of the footprint-weighted LCT areas, while all the other LCTs covered less than 18 % in total. The other wind direction sectors had more even LCT distributions. The differences between the sectors were similar in the EC-based and spatially weighted chamber-based averages of CO2 exchange (Fig. 7b–d). Both Pg800 and NEE800 were largest in the southern and south-western sectors and clearly smallest in the barren–lichen tundra-dominated sector in the north. The chamber-based estimates of CO2 exchange were, however, lower: on average, Pg800 was 57 %, ER 93 %, and NEE800 44 % of the mean EC-based fluxes among the wind direction sectors.
The southern and southwestern wind sectors with abundant dry and wet fens and graminoid tundra had clearly the largest CH4 fluxes (Fig. 7f). The estimate based on chamber measurements was 30 % and 50 % larger than the mean EC-based flux in the east sector (dominated by dry fen and bog) and south sector (dominated by dry fen and wet fen), respectively. In contrast, the chamber-based estimate was smaller than the EC flux for the other sectors, which were dominated by graminoid tundra, lichen tundra, and barren ground. Both the EC- and chamber-based measurements showed consumption of atmospheric CH4 in the northernmost sector, of which barren ground and lichen tundra covered 50 % and 20 %, respectively. The mean EC flux was three times the chamber-based estimate.
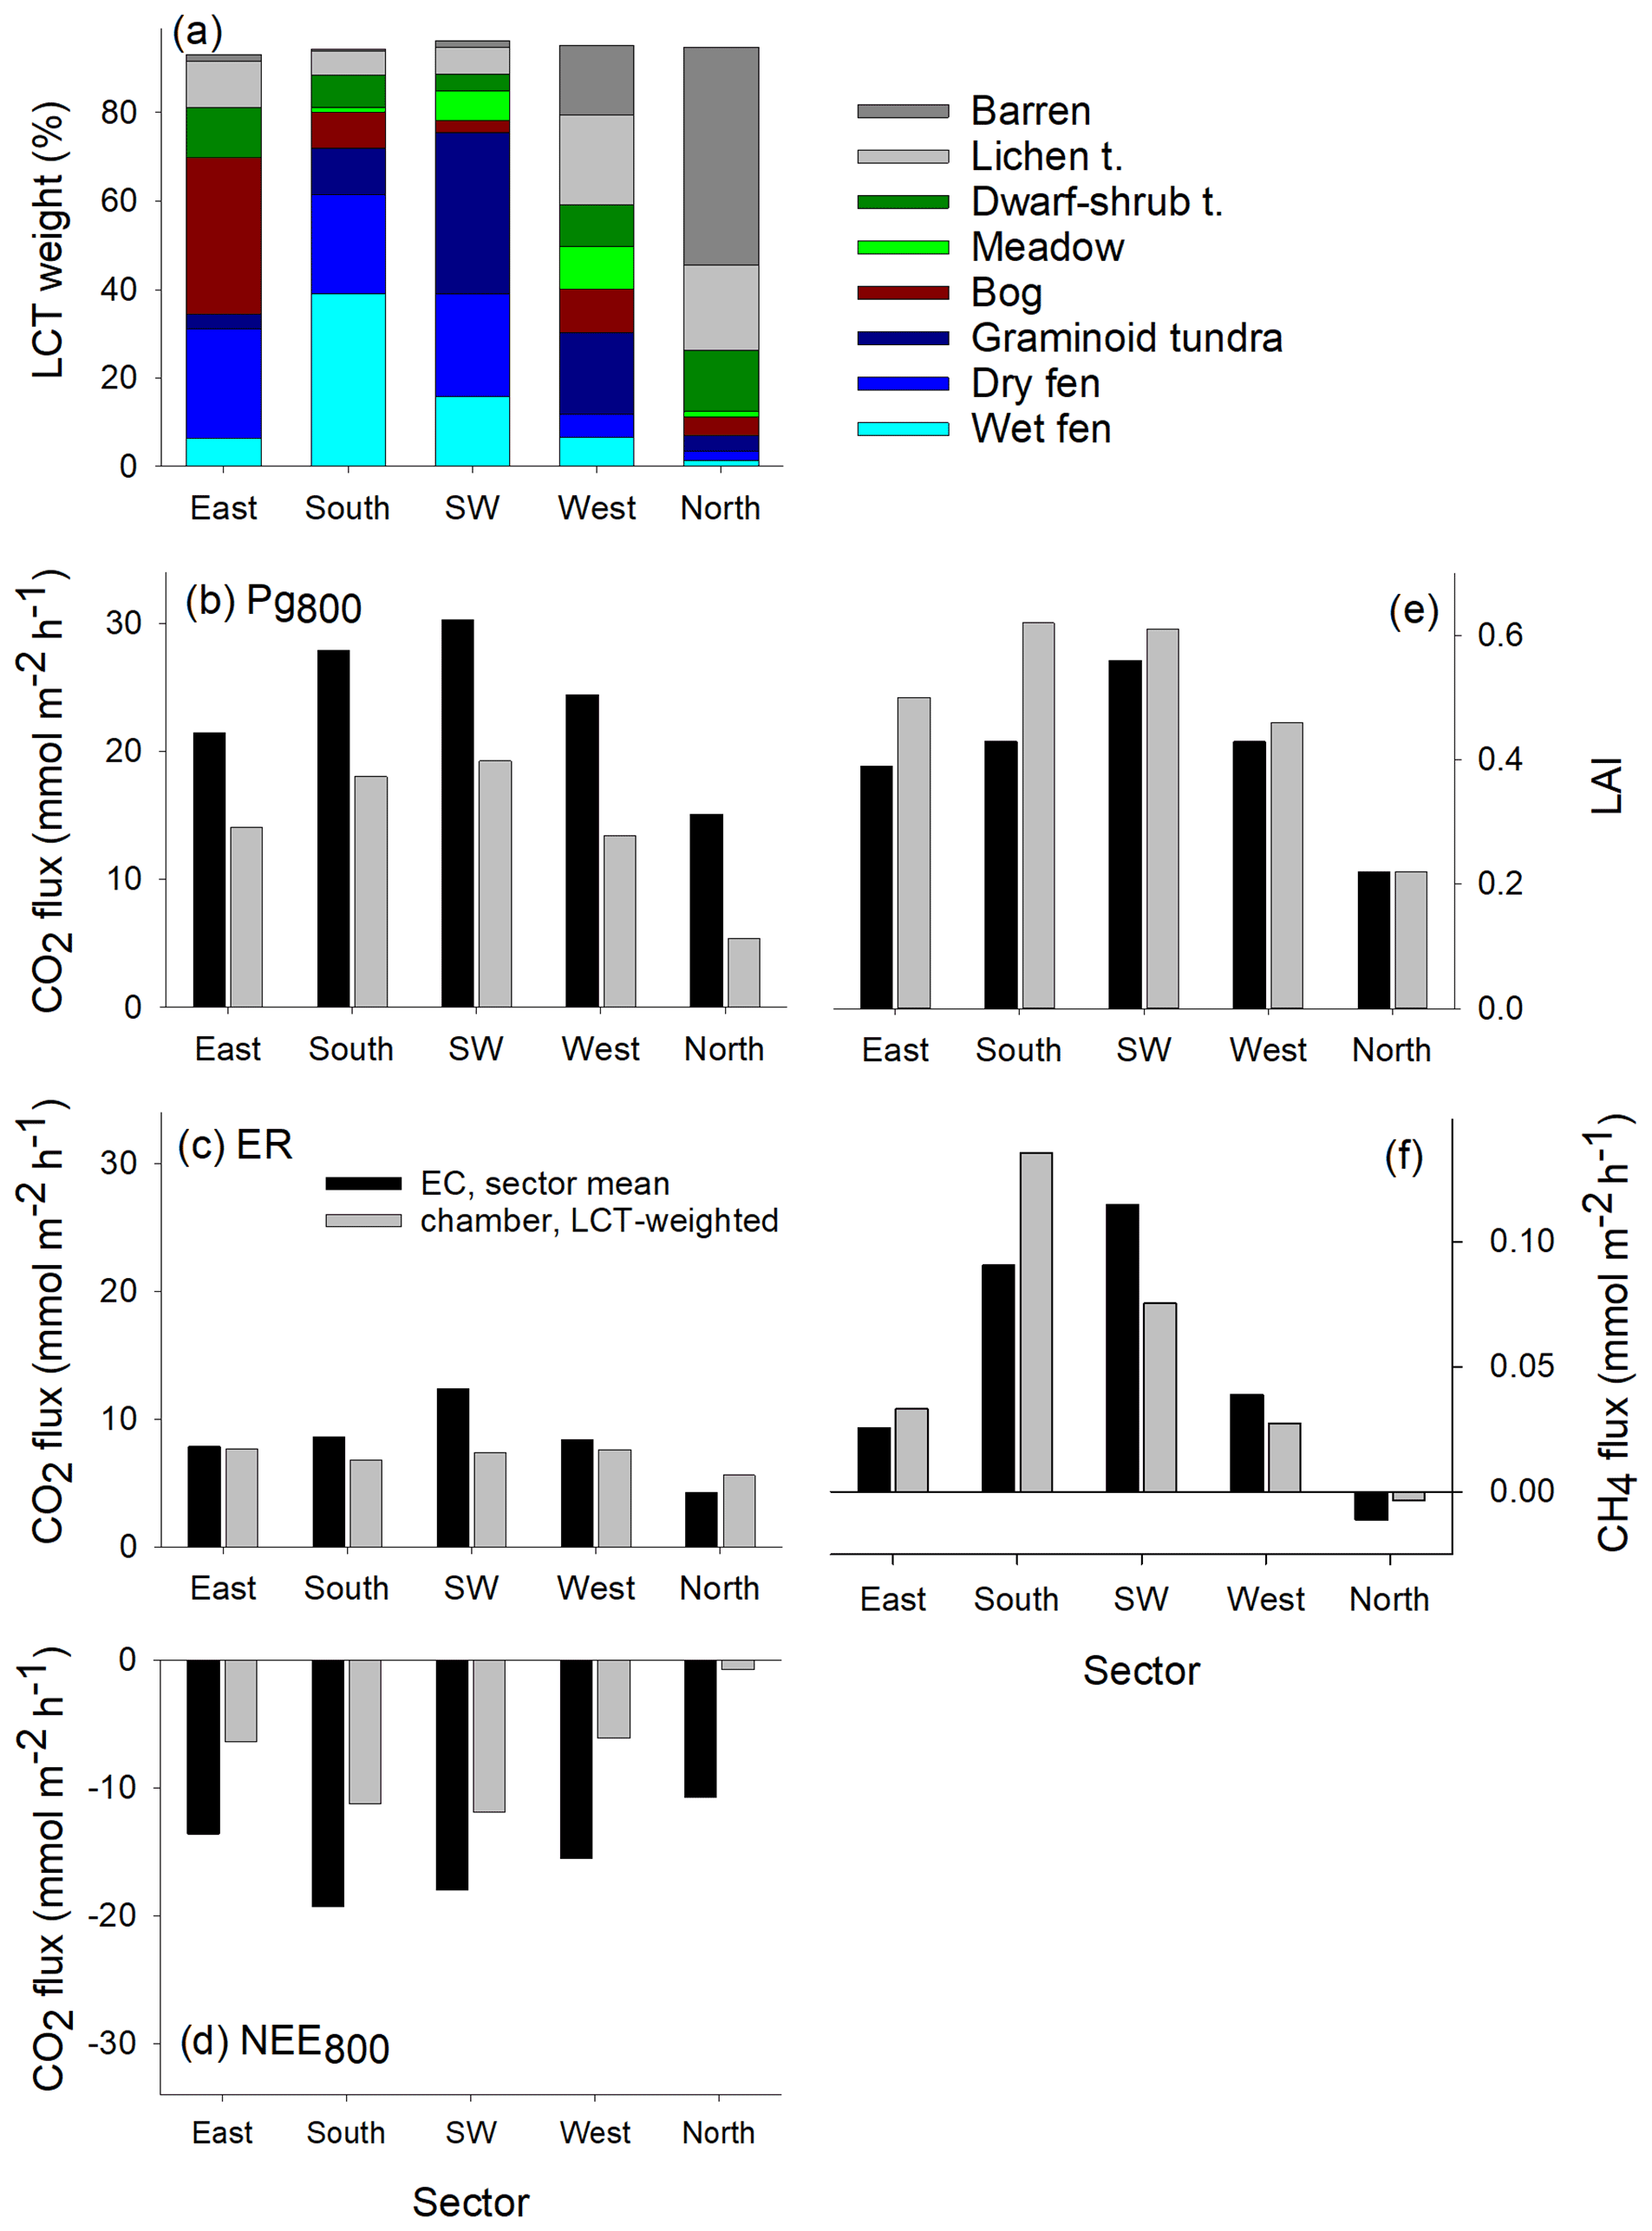
Figure 7Footprint-weighted mean contribution of each LCT to the EC measurements divided into wind direction sectors (a), and comparison of EC and chamber-based sector means of CO2 exchange (Pg800, ER, and NEE800) (b–d) vascular plant LAI (e), and CH4 fluxes (f). The chamber-based data are weighted by the LCT proportions shown in panel a. All data were measured in 2014. Map of LAI (Tuovinen et al., 2019) and the LAI measured in the collars were used to estimate the EC – and chamber – related sector means, respectively, in panel (e).
Within the extended study area of 35.8 km2, the LCT-weighted mean NEE800 was −4.6 mmol m−2 h−1 (uptake relative to the atmosphere). The corresponding mean Pg800 was 11 mmol m−2 h−1, and the mean CH4 flux was 0.05 mmol m−2 h−1 (Table 3a). Relative to their spatial cover (28 % in total), wet and dry fens were disproportionally important for the landscape-level Pg800, NEE800, and CH4 emissions, because the fens contributed 47 % of total Pg800 and 74 % of NEE800, and were the largest source of CH4 (Table 3b). Consumption of CH4 by barren and lichen tundra, dwarf-shrub tundra, and meadow tundra soils contributed −9 % of the CH4 balance, and the barren ground dominated the sink. It should be noted that these data represent the growing season conditions when both the CH4 emissions and consumption of atmospheric CH4 were at their highest during the year due to high temperatures, thawed soils and active vegetation.
The studied tundra site in Tiksi in northeastern Siberia has heterogeneous land cover, which is reflected as equally heterogeneous CO2 and CH4 exchange. We found that the LAI of vascular plants was a robust predictor of Pg800 and NEE800 across the LCTs. On the one hand, the tundra wetlands had a disproportionate role in the landscape-level CO2 uptake capacity. The fens also dominated the landscape's CH4 emissions. On the other hand, our results highlight the substantial CH4 consumption of atmospheric CH4 within the dry tundra areas, particularly in barrens. The CH4 consumption by dry tundra contributed −9 % of the total CH4 balance estimated for this landscape from the data collected during the growing season. This finding is in agreement with other studies and suggests distinguishing non-vegetated dry tundra habitats when upscaling plot-scale CH4 fluxes (Table 4). In Tiksi, the barren was characterized by sand and rocks underlain by schists (Fig. A1). The consumption of CH4 was smaller if the sand and stones were partly covered with vegetation (Figs. 5 and A1).
Table 4Summary of reported CH4 fluxes in mineral soil dry tundra.
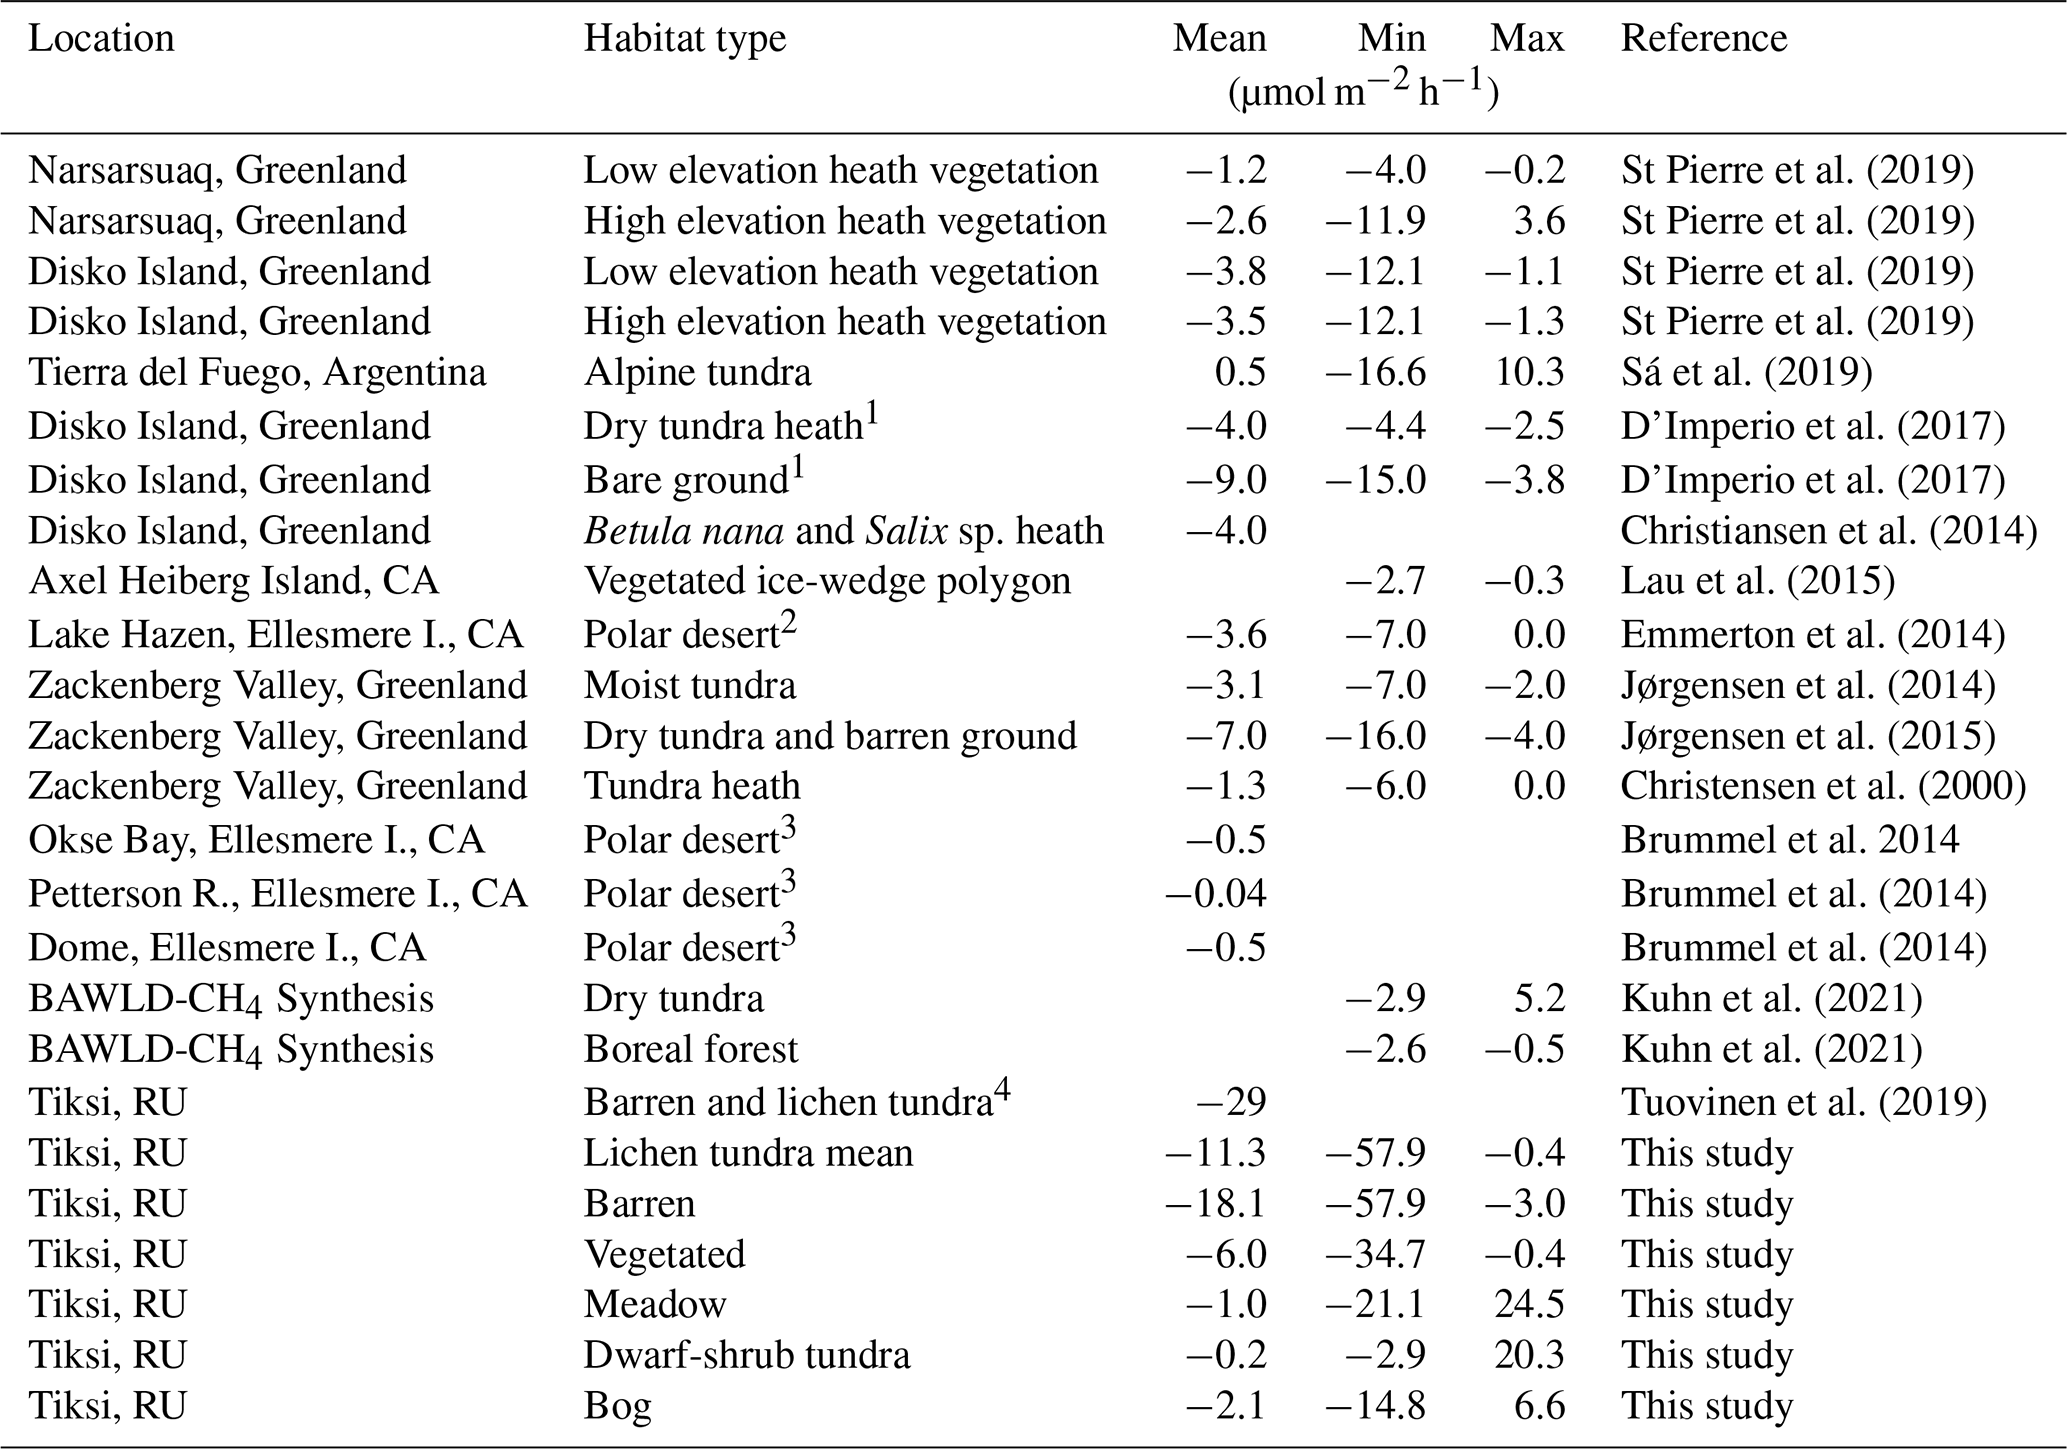
1 Mean estimated from a figure. 2 Minimum and maximum estimated from a figure. 3 Three day measurement. 4 Estimated from EC measurements with a statistical model.
The land-cover-categorical approach serves to distinguish the basic features of spatial variation in CO2 and CH4 fluxes, and the extreme ends of the moisture and vegetation gradients from barren to wet fen are clearly distinguishable, also in terms of CO2 and CH4 exchange (Fig. 6). Overall, microrelief, moisture gradient, vegetation types, and ecosystem functions are connected. For instance, barren areas are wind swept and thus have minimal snow accumulation, while in wet depressions snow accumulation further increases soil moisture (Fig. 6; Callaghan et al., 2011). The spatial extrapolation of fluxes, however, is here sensitive to a small number of chamber measurement points as there is large within-LCT variation in fluxes and LAI, as observed in the wet fen and meadow data. Moreover, the LCTs share common features and form a continuum as shown by the DCA ordination (Fig. 6). Mikola et al. (2018) used a larger soil and vegetation data set from Tiksi and also found that the neighboring LCTs overlapped in terms of soil and plant attributes. Despite the limited number of observations, our conclusions drawn from the chamber data are corroborated by the temporally matching section of EC data, which show high similarity to the chamber data (Fig. 7). Furthermore, the statistical analysis of EC data by Tuovinen et al. (2019) showed that it is possible to find significant differences between different LCT categories representing high and low CH4 emitters and CH4 sinks. However, for spatial modeling of ecosystem functions, maps of key variables, such as LAI and WT, that drive CO2 and CH4 exchange would be preferable to categorical LCT classification (Räsänen et al., 2021).
The spatial pattern of the growing season Pg800 and NEE800 was strongly related to the corresponding pattern of the LAI of vascular plants (Fig. 3). Hence, the abundance of graminoid (Cyperaceae and Poaceae) vegetation was associated with a large NEE800, which varied from near zero in lichen tundra up to −25 mmol m−2 h−1 in wet fen. Ecosystem respiration had a smaller role than Pg in determining NEE, but we note that our data cover only a section of the growing season with warmer temperatures and half- to full-grown vegetation. The importance of ER is likely to be different when considering the full annual balance (e.g., Hashemi et al., 2021). While our data represent only the growing season, a similar relationship has also been found between the annual NEE and LAI at a tundra site with a mixture of wet and dry tundra in northeastern Europe (Marushchak et al., 2013), in a multi-site EC study in Alaskan tundra (McFadden et al., 2003), in Canadian low arctic tundra wetlands (Lafleur et al., 2012), and across tundra sites (Street et al., 2007; Shaver et al., 2007).
The magnitude of Pg800 and NEE800 in the fen and meadow plots of this study were similar to the maximum Pg and NEE found in a tundra wetland in Seida in northeastern Europe (Marushchak et al., 2013), at low tundra wetland sites in eastern Canada (Lafleur et al., 2012), and at a wetland-dominated but more continental site (with an equally long growing season) in northeastern Siberia (van der Molen et al., 2007). The vegetation and Pg800 of lichen tundra and dwarf-shrub tundra in our study resembled those observed within the polygon rim habitat of the polygon tundra in the Lena River delta, while those of meadow, dry fen, and wet fen resembled the wet polygon center habitats (Eckhardt et al., 2019). In our study, the spatial variation of ecosystem respiration resulted from the variation in vascular plant LAI, soil organic content, and water saturation: the highest ER occurred in the mineral soil meadow plots with a high LAI, suggesting substantial autotrophic respiration and likely deep rooting and large root biomass contributing to ecosystem respiration (Fig. 3).
Our chamber-based estimate of the average CH4 flux within the 35.8 km2 upscaling area was 0.05 mmol m−2 h−1, which is close to 0.04 mmol m−2 h−1 obtained by Tuovinen et al. (2019), who combined EC data with footprint modeling to statistically determine LCT group-specific CH4 fluxes. Within this upscaling area, we estimate that 28 % of the area emitted CH4, while the other habitats either consumed atmospheric CH4 (barren and lichen tundra, dwarf-shrub tundra, meadow) or were close to neutral (bog) relative to the atmosphere (Fig. 4, Table 3a–b). The relationship between the vascular plant LAI and CH4 flux was confused by the occurrence of large CH4 fluxes in plots with little or no vegetation. Those fluxes were observed at the wettest fen plot and the bare-peat and vehicle track plots (Figs. 4–5). A high LAI, a high WT, and a high CH4 emission systematically co-occurred in wet fen (Fig. 6). In addition, in the bare-peat and vehicle-track plots, erosion or anthropogenic disturbance may have created CH4 flux hotspots due to permafrost scars, water saturation, and recently thawed organic matter (e.g., Bubier et al., 1995; McCalley et al., 2014; Wickland et al., 2020). These are small-scale landscape features, while on a larger scale our data encourage applying indices of wetness and vegetation as a means of CH4 flux upscaling in a tundra environment.
The recognition of CH4 consuming tundra habitats is important for accurately estimating the net CH4 balance of tundra. The substantial uptake of atmospheric CH4 by lichen tundra (here a mixture of bare ground and sparse vegetation) in Tiksi was inferred by Tuovinen et al. (2019) based on a source allocation analysis of EC data: the average flux of the consuming area was estimated at −0.03 mmol m−2 h−1, which corresponded to −22 % of the total upscaled CH4 balance. In this study, the average seasonal CH4 flux was −0.02 mmol m−2 h−1 in the barren tundra and an order of magnitude lower in meadow and dwarf-shrub tundra. This difference between the estimates likely originates from the LCT-weighting and the small sample of the chamber-based data and, in general, demonstrates the inherent sensitivity involved in upscaling of fluxes of opposite direction.
High consumption of atmospheric CH4 in barrens is associated with the high affinity methanotrophs (Emmerton et al., 2014; Jørgensen et al., 2014; D'Imperio et al., 2017; St Pierre et al., 2019). Our summary of the CH4 fluxes in mineral-rich dry tundra (Table 4) shows that the consumption rates in Tiksi are higher than those observed elsewhere. This may be due to a local feature associated with the parent material of the ground. Similar rates, however, have been recorded at other dry tundra sites with little or no vegetation. For instance, on Disko Island, Greenland, which consists of similar land cover types to Tiksi, CH4 uptake by bare ground was 0.005–0.01 mmol m−2 h−1 during the growing season, while a mean uptake of 0.003–0.004 mmol m−2 h−1 was observed in dry tundra heath (D'Imperio et al., 2017). These consumption rates associated with tundra barrens and high-affinity methanotrophs can be even higher than those measured on north-boreal forest soils (e.g., Lohila et al., 2016).
Our results provide new observations of carbon exchange for the prostrate dwarf-shrub tundra sub-zone, which covers a substantial area of the Arctic. These data augment the knowledge on the functional diversity, namely the distribution of different land cover types and their emission factors, across the vast Arctic tundra and will lend support to bottom-up and top-down extrapolations across the Arctic. Graminoid vegetation that favored the wet and moist habitats, such as wet fens, was characterized by large CO2 uptake and CH4 emissions. In addition, our data support the observation of notable consumption of atmospheric CH4 in barren tundra that has substantial coverage across the Arctic. The heterogeneity of landscape and the related large spatial variability of CO2 and CH4 fluxes observed in this study encourage to monitor the Arctic sites for changes in habitat type distribution. Such changes can include the forming of meadows and wet fens and appearance of new vegetation communities, such as erect shrubs, that benefit from warming-induced changes in thaw depth and soil wetness. The spatial extrapolation based on a small number of measurement points involves inherent uncertainty but still allowed us to identify key relationships between CO2 and CH4 fluxes and vegetation and moisture features, which can be utilized in more robust upscaling studies that make use of EC measurements.
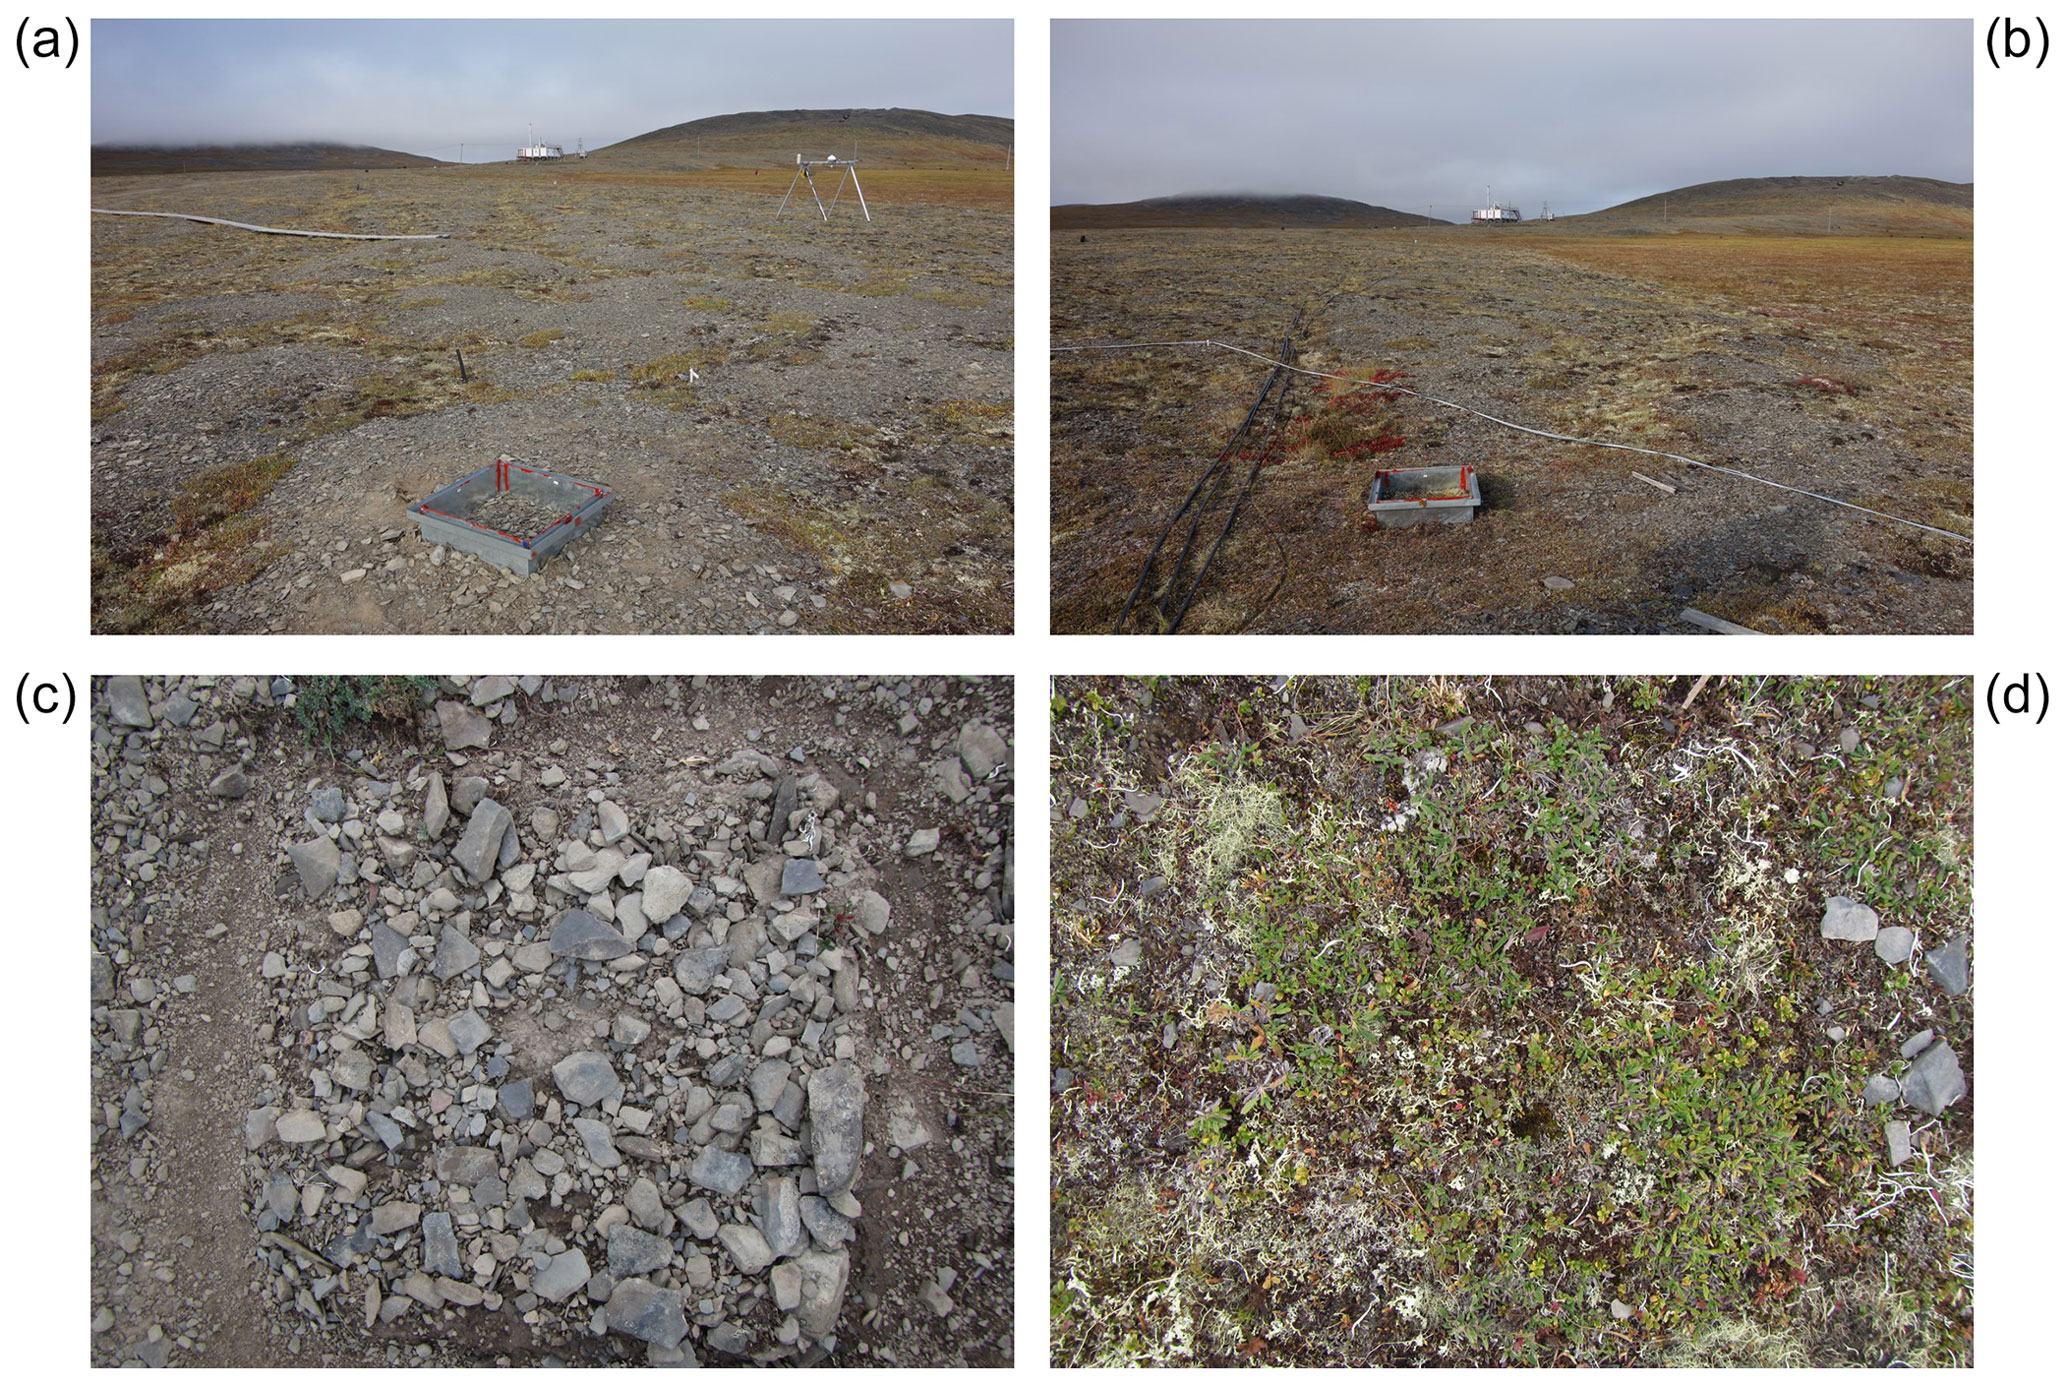
Figure A1Examples of the barren (a, c) and lichen tundra (b, d) plots with close views (c, d). Vegetation consists of lichens Flavocetraria sp., Thamnolia sp., Alectoria sp., dwarf-shrubs Dryas octopetala, Vaccinium vitis-idaea, Cassiope tetragona, and graminoids and forbs such as Carex spp. and Polygonum viviparum.
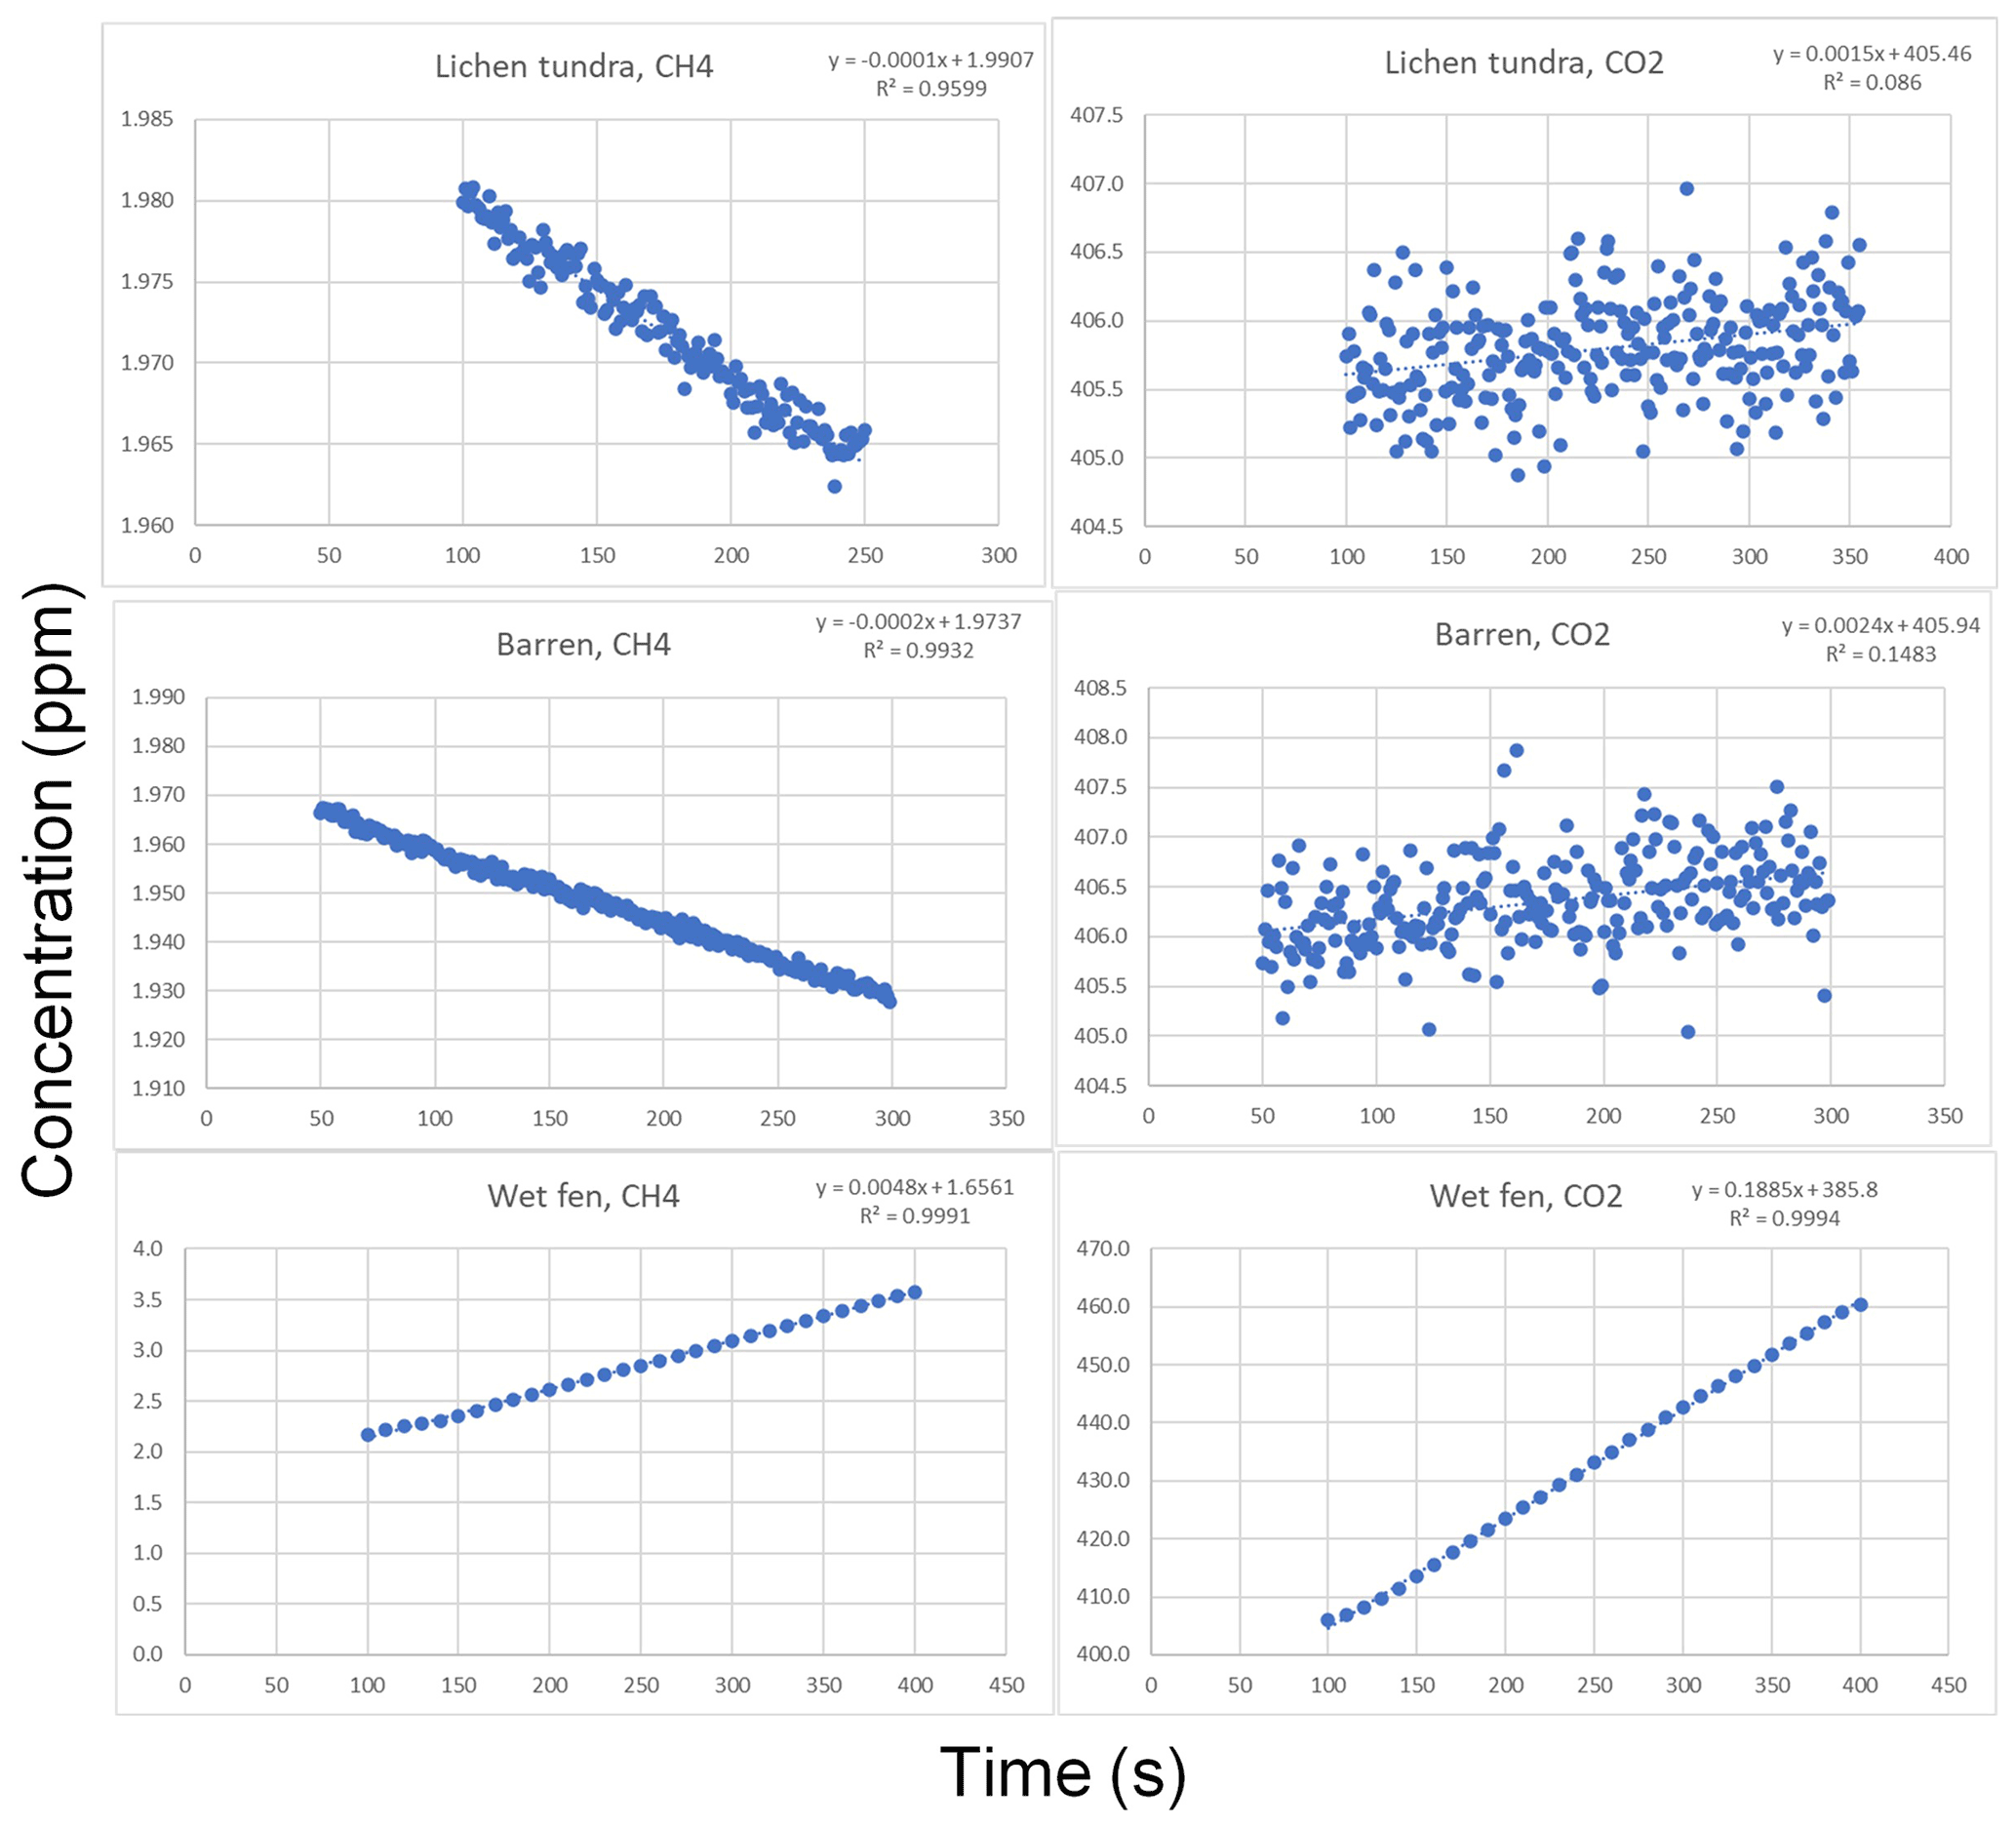
Figure A2Examples of gas concentration variations during chamber closures measured using the gas analyzer (DLT-100, Los Gatos Research, Inc., San Jose, CA, USA). The examples represent lichen tundra, barren, and wet fen.
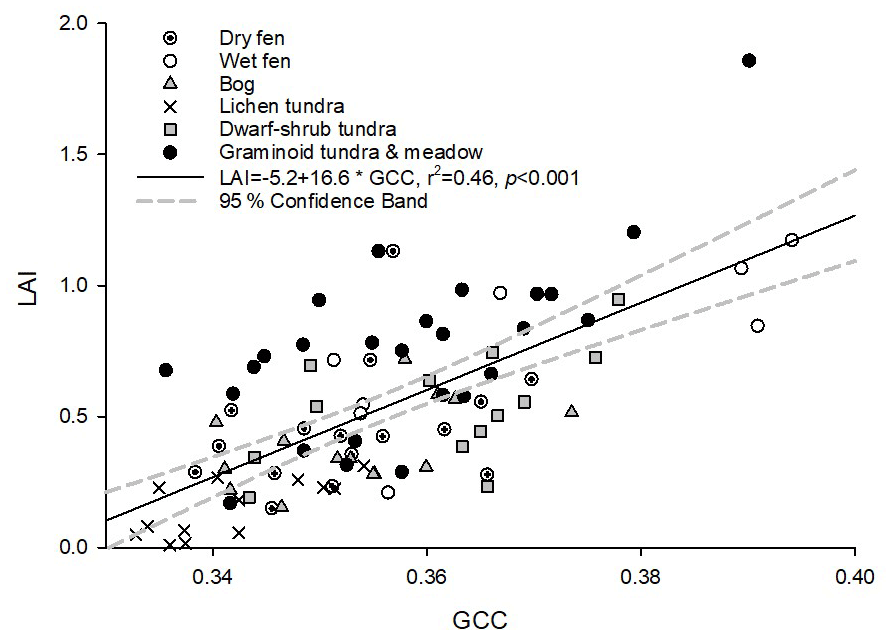
Figure A3Relationship between GCC and vascular plant LAI in the harvested plots. LCTs are indicated with symbols. In the LCT-specific regressions (not shown), the coefficient of determination () was lowest for dry fen (0.06) and highest for wet fen (0.54). Regression slopes varied from 8.3 for dry fen to 17.8 for the combined graminoid tundra and meadow LCT.
The flux data used in this study can be accessed via the Zenodo data https://doi.org/10.5281/zenodo.5825705 (Juutinen, 2022).
TL, MA, and SJ designed the study. TL, MA, and AM took care of the overall site governance and maintenance. VI, ML, TL, JM, JN, EV, TL, TV, and MA conceived the field measurements of CO2 and CH4, vegetation, and environmental variables. In addition, ML calculated green chromatic coordinates, and MA and JPT postprocessed the EC data and JPT modeled the footprint and estimated footprint LCT fractions. AR and TV processed and modeled the land cover data and estimated TWI and NDVI for the plots and area. SJ compiled the chamber flux data and conducted the data analyses and spatial extrapolations and wrote the manuscript with contributions from all co-authors.
The contact author has declared that neither they nor their co-authors have any competing interests.
Publisher’s note: Copernicus Publications remains neutral with regard to jurisdictional claims in published maps and institutional affiliations.
We thank Galina Chumachenko, Olga Dmitrieva, and Evgeniy Volkov at the Tiksi Observatory and the Yakutian Hydrometeorological Service for their kind assistance in carrying out and organizing the field campaigns and Lauri Rosenius for assistance in the field work. We sincerely thank Katharina Jentzsch and the anonymous reviewer for their time and insightful suggestions.
This research has been supported by the Academy of Finland (grant nos. 269095, 285630, 291736, and 296888), the European Commission, Seventh Framework Programme (PAGE21 (grant no. 282700)), and the NordForsk (DEFROST Nordic Centre of Excellence grant).
This paper was edited by Paul Stoy and reviewed by Katharina Jentzsch and one anonymous referee.
AARI: Archive of Tiksi standard meteorological observations (1932–2016), Russian Federal Service for Hydrometeorology and Environmental Monitoring, St Petersburg, Russia, available at: http://www.aari.ru/resources/d0024/archive/description_e.html, last access: 13 September 2018.
Aubinet, M., Vesala, T., and Papale, D. (Eds.): Eddy Covariance: A Practical Guide to Measurement and Data Analysis, Springer, Dordrecht, Heidelberg, London, New York, 2012.
Aurela, M., Laurila, T., and Tuovinen, J.-P.: The timing of snow melt controls the annual CO2 balance in a subarctic fen, Geophys. Res. Lett., 31, L16119, https://doi.org/10.1029/2004GL020315, 2004.
Bartlett, K. B. and Harriss, R. C.: Review and assessment of methane emissions from wetlands, Chemosphere, 26, 261–320, 1993.
Brummel, M. E., Farrell, R. E., Hardy, S. P., and Siciliano, S. D.: Greenhouse gas production and consumption in High Arctic deserts, Soil Biol. Biochem., 68, 158–165, https://doi.org/10.1016/j.soilbio.2013.09.034, 2014.
Bubier, J. L., Moore, T. R., Bellisario, L., Comer, N. T., and Crill, P. M.: Ecological controls on methane emissions from a northern peatland complex in the zone of discontinuous permafrost, Manitoba, Canada, Global Biogeochem. Cy., 9, 455–470, 1995.
Callaghan, T., Johansson, M., Brown, R., Groisman, P., Labba, N., Radionov, V., Barry, R., Bulygina, O., Essery, R., Frolov, D., Golubev, V., Grenfell, T., Petrushina, M., Razuvaev, V., Robinson, D., Romanov, P., Shindell, D., Shmakin, A., Sokratov, S., Warren, S., and Yang, D.: The changing face of Arctic snow cover: A synthesis of observed and projected changes, Ambio, 40, 17-31, https://doi.org/10.1007/s13280-011-0212-y, 2011.
Chen, L., Aalto, J., and Luoto, M.: Significant shallow–depth soil warming over Russia during the past 40 years, Glob. Planet. Change, 197, 103394, doi.org/10.1016/j.gloplacha.2020.103394, 2021.
Christensen, T. R., Friborg, T., Sommerkorn, M., Kaplan, J., Illeris, L., Soegaard, H., Nordstroem, C., and Jonasson, S., Trace gas exchange in a high-Arctic valley: 1. Variations in CO2 and CH4 Flux between tundra vegetation types, Global Biogeochem. Cy., 14, 701–713, https://doi.org/10.1029/1999GB001134, 2000.
Christiansen, J. R., Romero, A. J. B., Jørgensen, N. O. G., Glaring, M. A., Jørgensen, C. J., Berg, L. K., and Elberling, B.: Methane fluxes and the functional groups of methanotrophs and methanogens in a young Arctic landscape on Disko Island, West Greenland, Biogeochemistry, 122, 15–33, 2014.
D'Imperio, L., Skov Nielsen, C., Westergaard-Nielsen, A., Michelsen, A., and Elberling, B.: Methane oxidation in contrasting soil types: responses to experimental warming with implication for landscapeintegrated CH4 budget, Glob. Change Biol., 23, 966–976, https://doi.org/10.1111/gcb.13400, 2017.
Eckhardt, T., Knoblauch, C., Kutzbach, L., Holl, D., Simpson, G., Abakumov, E., and Pfeiffer, E.-M.: Partitioning net ecosystem exchange of CO2 on the pedon scale in the Lena River Delta, Siberia, Biogeosciences, 16, 1543–1562, https://doi.org/10.5194/bg-16-1543-2019, 2019.
Emmerton, C. A., St. Louis, V. L., Lehnherr, I., Humphreys, E. R., Rydz, E., and Kosolofski, H. R.: The net exchange of methane with high Arctic landscapes during the summer growing season, Biogeosciences, 11, 3095–3106, https://doi.org/10.5194/bg-11-3095-2014, 2014.
Euskirchen, E. S., Bret-Harte, M. S., Shaver, G. R., Edgar, C. W., and Romanovsky, V. E.: Long-Term Release of Carbon Dioxide from Arctic Tundra Ecosystems in Alaska, Ecosystems, 20, 960–974, https://doi.org/10.1007/s10021-016-0085-9, 2017.
Gorelick, N., Hancher, M., Dixon, M., Ilyushchenko, S., Thau, D., and Moore, R.: Google Earth Engine: Planetary-scale geospatial analysis for everyone, Remote Sens. Environ., 202, 18–27, doi.org/10.1016/j.rse.2017.06.031, 2017.
Hashemi, J., Zona, D., Arndt, K. A., Kalhori, A., and Oechel, W. C.: Seasonality buffers carbon budget variability across heterogeneous landscapes in Alaskan Arctic Tundra, Environ. Res. Lett., 035008, https://doi.org/10.1088/1748-9326/abe2d1, 2021.
Humphreys, E. R. and Lafleur, P. M.: Does earlier snowmelt lead to greater CO2 sequestration in two low Arctic tundra ecosystems?, Geophys. Res. Lett., 38, L09703, https://doi.org/10.1029/2011GL047339, 2011.
IPCC: Climate Change 2013: The Physical Science Basis, Contribution of Working Group I to the Fifth Assessment Report of the Intergovernmental Panel on Climate Change, edited by: Stocker, T. F., Qin, D., Plattner, G.-K., Tignor, M., Allen, S. K., Boschung, J., Nauels, A., Xia, Y., Bex, V., and Midgley, P. M., Cambridge University Press, Cambridge, United Kingdom and New York, NY, USA, 1533 pp., ISBN 978-1-107-05799-1, 2013.
Jørgensen, C. J., Lund Johansen, K. M., Westergaard-Nielsen, A., and Elberling, B.: Net regional methane sink in High Arctic soils of northeast Greenland, Nat. Geosci., 8, 20–23, https://doi.org/10.1038/NGEO2305, 2014.
Juutinen, S., Virtanen, T., Kondratyev, V., Laurila, T., Linkosalmi, M., Mikola, J., Nyman, J., Räsänen, A., Tuovinen, J.-P., and Aurela, M.: Spatial variation and seasonal dynamics of leafarea index in the arctic tundra – implications for linking ground 85 observations and satellite images, Environ. Res. Lett., 12, 095002, https://doi.org/10.1088/1748-9326/aa7f85, 2017.
Juutinen, S.: Dataset for a manuscript entitled Variation in CO2 and CH4 Fluxes Among Land Cover Types in Heterogeneous Arctic Tundra in Northeastern Siberia, Zenodo [Data set], https://doi.org/10.5281/zenodo.5825705, 2022.
Kuhn, M. A., Varner, R. K., Bastviken, D., Crill, P., MacIntyre, S., Turetsky, M., Walter Anthony, K., McGuire, A. D., and Olefeldt, D.: BAWLD-CH4: a comprehensive dataset of methane fluxes from boreal and arctic ecosystems, Earth Syst. Sci. Data, 13, 5151–5189, https://doi.org/10.5194/essd-13-5151-2021, 2021.
Lafleur, P. M., Humphreys, E. R., St Louis, V. L., Myklebust, M. C., Papakyriakou, T., Poissant, L., Barker, J. D., Pilote, M., and Swystun, K. A.: Variation in Peak Growing Season Net Ecosystem Production Across the Canadian Arctic, Environ. Sci. Technol., 46, 7971–7977, doi.org/10.1021/es300500m, 2012.
Lara, M. J., McGuires, A. D., Euskirchen, E. S., Genet H., Yi, S., Rutter, R., Iversen, C., Sloan, V., and Wullschleger, S. D.: Local-scale Arctic tundra heterogeneity affects regional-scale carbon dynamics, Nat. Commun., 11, 4925, https://doi.org/10.1038/s41467-020-18768-z, 2020.
Lau, M. C. Y., Stackhouse, B. T., Layton, A. C., Chauhan, A., Vishnivetskaya, T. A., Chourey, K., Ronholm, J., Mykytczuk, N. C. S., Bennett, P. C., Lamarche-Gagnon, G., Burton, N., Pollard, W. H., Omelon, C. R., Medvigy, D. M., Hettich, R. L., Pfiffner, S. M., Whyte, L. G., and Onstott, T. C.: An active atmospheric methane sink in high Arctic mineral cryosols, ISME J., 9, 1880–1891, https://doi.org/10.1038/ismej.2015.13, 2015.
Lohila, A., Aalto, T., Aurela, M., Hatakka, J., Tuovinen, J.-P., Kilkki, J., Penttilä, T., Vuorenmaa, J., Hänninen, P., Sutinen, R., Viisanen, Y., and Laurila, T.: Large contribution of boreal upland forest soils to a catchment-scale CH4 balance in a wet year, Geophys. Res. Lett., 43, 2946–2953, doi.org/10.1002/2016GL067718, 2016.
Marushchak, M. E., Kiepe, I., Biasi, C., Elsakov, V., Friborg, T., Johansson, T., Soegaard, H., Virtanen, T., and Martikainen, P. J.: Carbon dioxide balance of subarctic tundra from plot to regional scales, Biogeosciences 10, 437–452, https://doi.org/10.5194/bg-10-437-2013, 2013.
McCalley, C. K., Woodcroft, B. J., Hodgkins, S. B., Wehr, R. A., Kim, E.-H., Mondav, R., Crill, P. M., Chanton, J. P., Rich, V. I., Tyson, G. W., and Saleska, S. R.: Methane dynamics regulated by microbial community response to permafrost thaw, Nature 514, 478–451, https://doi.org/10.1038/nature13798, 2014.
McFadden, J. P., Eugster, W., and Chapin III, F. S.: A regional study of the controls on water vapor and CO2 exchange in arctic tundra, Ecology, 84, 2762–2776, https://doi.org/10.1890/01-0444, 2003.
McGuire, A. D., Christensen, T. R., Hayes, D., Heroult, A., Euskirchen, E., Kimball, J. S., Koven, C., Lafleur, P., Miller, P. A., Oechel, W., Peylin, P., Williams, M., and Yi, Y.: An assessment of the carbon balance of Arctic tundra: comparisons among observations, process models, and atmospheric inversions, Biogeosciences, 9, 3185–3204, https://doi.org/10.5194/bg-9-3185-2012, 2012.
McGuire, A. D., Lawrence, D. M., Koven, C., Clein, J. C., Burke, E., Chen, G., Jafarov, E., MacDougall, A. H., Marchenko, S., Nicolsky, D., Peng, S., Rinke, A., Ciais, P., Gouttevin, I., Hayes, D. J., Jin, D., Krinner, G., Moore, J. C., Romanovsky, V., Schädel, C., Schaefer, K., Schuur, E. A. G., and Zhuang, Q.: Dependence of the evolution of carbon dynamics in the northern permafrost region on the trajectory of climate change, P. Natl. Acad. Sci. USA, 115, 3882–3887, doi/10.1073/pnas.1719903115, 2018.
Mikola, J., Virtanen, T., Linkosalmi, M., Vähä, E., Nyman, J., Postanogova, O., Räsänen, A., Kotze, D. J., Laurila, T., Juutinen, S., Kondratyev, V., and Aurela, M.: Spatial variation and linkages of soil and vegetation in the Siberian Arctic tundra – coupling field observations with remote sensing data, Biogeosciences, 15, 2781–2801, https://doi.org/10.5194/bg-15-2781-2018, 2018.
Oh, Y., Zhuang, Q., Liu, L., Welp, L. R., Lau, M. C. Y., Onstott, T. C., Medvigy, D., Bruhwiler, L., Dlugokencky, E. J., Hugelius, G., D'Imperio, L., and Elberling, B.: Reduced net methane emissions due to microbial methane oxidation in a warmer Arctic, Nat. Clim. Change, 10, 317–321, 2020.
Räsänen, A., Manninen, T., Korkiakoski, M., Lohila, A., and Virtanen, T.: Predicting catchment-scale methane fluxes with multi-source remote sensing, Landscape Ecol., 36, 1177–1195, https://doi.org/10.1007/s10980-021-01194-x, 2021.
Richardson, A. D.: Tracking seasonal rhythms of plants in diverse ecosystems with digital camera imagery, New Phytol., 222, 1742–1750, https://doi.org/10.1111/nph.15591, 2019.
Sá, M. M. F., Schaefer, C. E. G. R., Loureiro, D. C., Simas, F. N. B., Alves, B. J. R., de Sá Mendonça, E., Barretto de Figueiredo, E., La Scala, N., and Panosso, A. R.: Fluxes of CO2, CH4, and N2O in tundra-covered and Nothofagus forest soils in the Argentinian Patagonia, Sci. Total Environ., 659, 401–409, https://doi.org/10.1016/j.scitotenv.2018.12.328, 2019.
Saunois, M., Stavert, A. R., Poulter, B., Bousquet, P., Canadell, J. G., Jackson, R. B., Raymond, P. A., Dlugokencky, E. J., Houweling, S., Patra, P. K., Ciais, P., Arora, V. K., Bastviken, D., Bergamaschi, P., Blake, D. R., Brailsford, G., Bruhwiler, L., Carlson, K. M., Carrol, M., Castaldi, S., Chandra, N., Crevoisier, C., Crill, P. M., Covey, K., Curry, C. L., Etiope, G., Frankenberg, C., Gedney, N., Hegglin, M. I., Höglund-Isaksson, L., Hugelius, G., Ishizawa, M., Ito, A., Janssens-Maenhout, G., Jensen, K. M., Joos, F., Kleinen, T., Krummel, P. B., Langenfelds, R. L., Laruelle, G. G., Liu, L., Machida, T., Maksyutov, S., McDonald, K. C., McNorton, J., Miller, P. A., Melton, J. R., Morino, I., Müller, J., Murguia-Flores, F., Naik, V., Niwa, Y., Noce, S., O'Doherty, S., Parker, R. J., Peng, C., Peng, S., Peters, G. P., Prigent, C., Prinn, R., Ramonet, M., Regnier, P., Riley, W. J., Rosentreter, J. A., Segers, A., Simpson, I. J., Shi, H., Smith, S. J., Steele, L. P., Thornton, B. F., Tian, H., Tohjima, Y., Tubiello, F. N., Tsuruta, A., Viovy, N., Voulgarakis, A., Weber, T. S., van Weele, M., van der Werf, G. R., Weiss, R. F., Worthy, D., Wunch, D., Yin, Y., Yoshida, Y., Zhang, W., Zhang, Z., Zhao, Y., Zheng, B., Zhu, Q., Zhu, Q., and Zhuang, Q.: The Global Methane Budget 2000–2017, Earth Syst. Sci. Data, 12, 1561–1623, https://doi.org/10.5194/essd-12-1561-2020, 2020.
Shaver, G. R., Street, L. E., Rastetter, E. B., van Wijk, M. T., and Williams, M.: Functional convergence in regulation of net CO2 flux in heterogeneous tundra landscapes in Alaska and Sweden, J. Ecol., 95, 802–817, 2007.
Šmilauer, P. and Leps, J.: Multivariate analysis of ecological data using CANOCO 5, 2nd Edn., Cambridge University Press, ISBN 978-1-107-69440-8, 2014.
St Pierre, K. A., Kortegaard Danielsen, B., Hermesdorf, L., D'Imperio, L., Lønsmann Iversen, L., and Elberling, B.: Drivers of net methane uptake across Greenlandic dry heath tundra landscapes, Soil Biol. Biochem., 138, 107605, https://doi.org/10.1016/j.soilbio.2019.107605, 2019.
Street, L. E., Shaver, G. R., Williams, M., and van Wijk, M. T.: What is the relationship between changes in canopy leaf area and changes in photosynthetic CO2 flux in arctic ecosystems?, J. Ecol., 95, 139–150, 2007.
Treat, C. C., Marushchak, M. E., Voigt, C., Zhang, Y., Tan, Z., Zhuang, Q., Virtanen, T. A., Räsänen, A., Biasi, C., Hugelius, G., Kaverin, D., Miller, P. A., Stendel, M., Romanovsky, V., Rivkin, F., Martikainen, P. J., and Shurpali, N. J.: Tundra landscape heterogeneity, not interannual variability, controls the decadal regional carbon balance in the Western Russian Arctic, Glob. Change Biol., 24, 5188–5204, https://doi.org/10.1111/gcb.14421, 2018.
Tuovinen, J.-P., Aurela, M., Hatakka, J., Räsänen, A., Virtanen, T., Mikola, J., Ivakhov, V., Kondratyev, V., and Laurila, T.: Interpreting eddy covariance data from heterogeneous Siberian tundra: land-cover-specific methane fluxes and spatial representativeness, Biogeosciences, 16, 255–274, doi.org/10.5194/bg-16-255-2019, 2019.
Uttal, T., Starkweather, S., Drummond, J. R., Vihma, T., Makshtas, A. P., Darby, L. S., Burkhart, J. F., Cox, C. J., Schmeisser, L. N., Haiden, T., Maturilli, M., Shupe, M. D., de Boer, G., Saha, A., Grachev, A. A., Crepinsek, S. M., Bruhwiler, L., Goodison, B., McArthur, B., Walden, V. P., Dlugokencky, E. J., Persson, P. O. G., Lesins, G., Laurila, T., Ogren, J. A., Stone, R., Long, C. N., Sharma, S., Massling, A., Turner, D. D., Stanitski, D. M., Asmi, E., Aurela, M., Skov, H., Eleftheriadis, K., Virkkula, A., Platt, A., Førland, E. J., Iijima, Y., Nielsen, I. E., Bergin, M. H., Candlish, L., Zimov, N. S., Zimov, S. A., O'Neill, N. T., Fogal, P. F., Kivi, R., Konopleva-Akish, E. A., Verlinde, J,. Kustov, V.Y., Vasel, B., Ivakhov, V. M., Viisanen, Y., and Intrieri, J. M.: International Arctic Systems for Observing the Atmosphere: An International Polar Year Legacy Consortium, Bull. Am. Meteorol. Soc., 97, 1033–1056, https://doi.org/10.1175/BAMS-D-14-00145.1, 2016.
van der Molen, M. K., van Huissteden, J., Parmentier, F. J. W., Petrescu, A. M. R., Dolman, A. J., Maximov, T. C., Kononov, A. V., Karsanaev, S. V., and Suzdalov, D. A.: The growing season greenhouse gas balance of a continental tundra site in the Indigirka lowlands, NE Siberia, Biogeosciences 4, 985–1003, doi.org/10.5194/bg-4-985-2007, 2007.
Virkkala, A.-M., Aalto, J., Rogers, B. M., Tagesson, T., Treat, C. C., Natali, S. M., Watts, J. D., Potter, S., Lehtonen, A., Mauritz, M., Schuur, E. A. G., Kochendorfer, J., Zona, D., Oechel, W., Kobayashi, H., Humphreys, E., Goeckede, M., Iwata, H., Lafleur, P. M., Euskirchen, E. S., Bokhorst, S., Marushchak, M., Martikainen, P. J., Elberling, B., Voigt, C., Biasi, C., Sonnentag, O., Parmentier, F.-J. W., Ueyama, M., Celis, G., St.Louis, V. L., Emmerton, C. A., Peichl, M., Chi, J., Järveoja, J., Nilsson, M. B., Oberbauer, S. F., Torn, M. S., Park, S.-J., Dolman, H., Mammarella, I., Chae, N., Poyatos, R., López-Blanco, E., Christensen, T. R., Kwon, M. J., Sachs, T., Holl, D., and Luoto, M.: Statistical upscaling of ecosystem CO2 fluxes across the terrestrial tundra and boreal domain: Regional patterns and uncertainties, Glob. Change Biol., 27, 4040–4059, https://doi.org/10.1111/gcb.15659, 2021.
Virtanen, T. and Ek, M.: The fragmented nature of tundra landscape, Int. J. Appl. Earth Obs., 27, 4–12, 2014.
Walker, D. A.: Hierarchical subdivision of Arctic tundra based on vegetation response to climate, parent material and topography, Glob. Change Biol., 6, 19–34, 2000.
Webb, E. E., Schuur, E. A. G., Natali, S. M., Oken, K. L., Bracho, R., Krapek, J. P., Risk, D., and Nickerson, N. R.: Increased wintertime CO2 loss as a result of sustained tundra warming, J. Geophys. Res.-Biogeo., 121, 249–265, https://doi.org/10.1002/2014JG002795, 2016.
Wickland, K. P., Jorgenson, M. T., Koch, J. C., Kanevskiy, M., and Striegl, R. G.: Carbon dioxide and methane flux in a dynamic Arctic tundra landscape: Decadal-scale impacts of ice wedge degradation and stabilization, Geophys. Res. Lett., 47, e2020GL089894, https://doi.org/10.1029/2020GL089894, 2020.
Zhang, W., Jansson, P.-E., Sigsgaard, C., McConnell, A., Manon Jammet, M., Westergaard-Nielsen, A., Lund, M., Friborg, T., Michelsen, A., and Elberling, B.: Model-data fusion to assess year-round CO2 fluxes for an arctic heath ecosystem in West Greenland (69∘ N), Agr. Forest Meteorol., 272/273, 176–186, 2019.