the Creative Commons Attribution 4.0 License.
the Creative Commons Attribution 4.0 License.
 | 09 Aug 2022
The effect of static chamber base on N2O flux in drip irrigation
Asher Bar-Tal
Alon Gal
Shmulik P. Friedman
David Russo
Static chambers are commonly used to provide in situ quantification of nitrous oxide (N2O) fluxes. Despite their benefits, when left in the field, the physicochemical conditions inside the chamber's base may differ from the ambient, especially in drip-irrigated systems. This research aimed to study the effects of static chamber bases on water and N distribution and the subsequent impact on N2O fluxes. N2O emissions were measured in a drip-irrigated avocado orchard for 2 years, using bases with a dripper at their center (In) and bases installed adjacent to the dripper (adjacent). During the irrigation and fertigation season, the measured N2OIn fluxes were greater than the N2OAdjacent fluxes (0.015 ± 0.003 vs. 0.006 ± 0.001 g m−2 d−1). By contrast, during the winter, when the orchard is not irrigated or fertilized, insignificant differences were observed between the measured N2OAdjecent and N2OIn fluxes. Three-dimensional simulations of water flow, N transport, and N transformations showed two opposing phenomena: (a) increased water contents, N concentrations, and downward flushing when the dripper is placed inside the base, and (b) hampering of the lateral distribution of water and solutes into the most bio-active part of the soil inside the base when the base is placed adjacent to the dripper. It also showed that both “In” and “adjacent” practices underestimate the “true” cumulative flux from a dripper with no base by ∼ 25 % and ∼ 50 %, respectively. A nomogram in a non-dimensional form corresponding to all soil textures, emitter spacings, and discharge rates was developed to determine the optimal diameter of an equivalent cylindrical base to be used along a single dripline. Further studies under variable conditions (soil types, wetting patterns, nutrient availabilities), rather than a single study, are needed to test the constructiveness of the suggested methodologies.
- Article
(4232 KB) - Full-text XML
-
Supplement
(877 KB) - BibTeX
- EndNote


Static chambers are commonly used to provide in situ quantification of nitrous oxide (N2O) fluxes from soil–plant systems (Clough et al., 2020). Ideally, such cambers should be as large as feasibly possible in order to capture spatial variation, where most chambers cover a surface area of 0.03–0.25 m−2. Commonly, static chambers are built from two separate parts: (a) bases (also known as “collars” or “anchors”) that are pushed into the ground, and (b) chambers that are placed and sealed onto the bases during flux measurements.
It is acknowledged that static chambers suppress the gas concentration gradient at the soil–atmosphere interface. The magnitude of the chamber-induced errors is known to increase with increased chamber deployment time, decreased chamber height, and greater soil air-filled porosity (Venterea, 2010). Different methods have been developed to quantify and correct these errors (Venterea, 2010; Venterea et al., 2020). Proper use of static chambers calls for minimal disturbance of the soil surface and the prevention of lateral diffusion of N2O beneath the base's wall. To reduce perturbation of the soil structure, which can release pulses of gases, and to minimize the influence on the carbon (C) and nitrogen (N) turnover in the bases (mainly the decaying process of cut roots) (Clough et al., 2020), bases are installed prior to the beginning of the experiment and left in the same location for the duration of the project. During installation, bases need to be inserted to at least the depth where N2O concentrations are not being perturbed by feedback effects from the chamber (Rochette and Eriksen-Hamel, 2008; Healy et al., 1996; Hutchinson and Livingston, 2001). Despite their benefits, when bases are left in the field, atypical soil water contents, aeration, temperature, and microbial processes may develop in them (Clough et al., 2020). Such perturbations must be minimized or avoided, especially in drip-fertigation systems where the localized concentrations of N and water content may increase the potential for N2O emissions (Smart et al., 2011; Baram et al., 2018; Burton et al., 2008; Zebarth et al., 2008).
A review of the published literature in which static chambers were used in drip-irrigated fields shows inconsistency regarding the chamber's location relative to the emitter (dripper). In many studies, chamber's bases (i.e., metal or polyvinyl chloride (PVC) frame) are installed adjacent to the drip lines to depths of 5–13 cm, prior to the beginning of the experiment and left in the same location for the duration of the project (Garland et al., 2014; Baram et al., 2018; Alsina et al., 2013; Verhoeven and Six, 2014; Tian et al., 2017; Scheer et al., 2008; Fentabil et al., 2016). An additional strategy is to install the bases to similar depths, a day to a few hours before sampling (Sanchez-Martín et al., 2010, 2008). Both strategies are applied to reduce perturbation of the soil structure following the base's insertion, as discussed earlier. In such practices, the base serves as a hydraulic barrier that prevents lateral movement of water from the dripper into the soil volume confined by it, especially close to the soil surface. Accordingly, the water-filled pore-space (WFPS; the ratio between the volumetric water content and the porosity, also known as “water saturation degree”, S) and the N-species concentrations in the base will most likely differ from the ambient ones. Sanchez-Martín et al. (2010) acknowledged these biases (especially in the water content) and, therefore, removed the bases after sampling, enabling lateral redistribution between sampling days. Wolff et al. (2017) and Vallejo et al. (2014) tried to overcome these limitations by installing the bases and sampling the fluxes directly after the fertigation event. However, as mentioned before, such a sampling method could be affected by perturbation of the soil structure and root damage (Clough et al., 2020). Placement of drippers above the bases was also suggested as a way to minimize the differences between the soil water content and N concentrations inside the bases and those of the surroundings (Heller et al., 2010; Garland et al., 2014). Another suggestion was to split the dripper discharge into two separate drippers, one in the bases and the other outside (Fentabil et al., 2016). Although these latter methods seem to overcome the base's disturbance of water and solute distribution in the topsoil, their actual impact on water and N-species distribution in the soil inside the base and their effect on the N2O fluxes were never tested.
Many models have been developed to simulate N2O emissions from soils. In all models, N2O emission results mainly from nitrification and denitrification reactions, which in turn are affected by the following parameters in the soil: (a) mineral N concentration ([namely, nitrate (NO) and ammonium (NH), (b) WFPS as a proxy for soil aeration and gas diffusion coefficient, (c) temperature, (d) pH, (e) redox potential, and (f) carbon availability (Rabot et al., 2015; Hénault et al., 2019; Wu and Zhang, 2014). This research aimed to study the effects of static chamber bases on the distribution of water and N-forms inside the base and the impact it has on N2O emission measurements during drip irrigation. We used both field measurements and three-dimensional (3-D) simulations of flow and transport to test the effect of the base diameter and its location relative to the dripper lateral on N2O emissions.
2.1 Study site and N2O measurements
N2O fluxes were measured over a 2-year period in a drip-irrigated avocado orchard. The orchard is located near Kibbutz-Yasur in Western Galilee, Israel. The soil at the site is a Vertisol (58 % clay dominated by montmorillonite) (Nemera et al., 2020). The climate at the site is Mediterranean, characterized by a relatively long dry season (April–October) requiring irrigation and a distinct rainy period during the winter (November–March). The trees are planted 3.5 m apart on ridges (1.6 m wide, 0.4 m high), with 6 m between rows. Each row of trees was irrigated with a set of two driplines (laterals), located 0.9 m apart along both sides of the trees, with 0.5 m spaced 1.6 L h−1 drippers (UNIRAM, Netafim). From April through November, the orchard was fertigated every other day, using treated wastewater enriched with an ammonium sulfate nitrate solution (NH4 : NO3 = 3 : 1), maintaining 50–70 mg-N L−1 in the fertigation solution.
From June 2018 through June 2020, N2O fluxes were measured at mid-morning using accumulation static chambers that were installed at 12 random locations in the avocado orchard. At each location, two chamber bases were inserted, one with a dripper at its center (In) and one adjacent to the dripper (adjacent) (Fig. 1). The bases were made from opaque PVC rings, 10 cm high and 19 cm i.d. (surface area of 283.5 cm2). The rings were inserted to a depth of 6–8 cm 2 weeks prior to the start of the sampling campaign and remained in the soil for the duration of the experiment. The chambers were built from a 20 cm sewer PVC cup (volume of 3119 cm3), equipped with a vent (3 mm Swagelok bulkhead union with a 12 cm long coiled copper tube, 1.5 mm i.d.), covered with a bubble reflective foil and a rubber skirt to ensure sealing with the base. Fluxes were measured in real time by circulating the headspace in the static gas chamber via Teflon tubes into a Fourier-transform infrared spectrometer (FTIR; Gasmet DX4000, Gasmet Technologies, Finland). During the enclosure period, N2O concentrations were recorded every 5 s, each measuring point represents an average of 50 reads. N2O fluxes (q) [g cm−2 s−1] were calculated based on the linear slope, representing the increase in N2O concentration throughout a 4–8 min enclosure time (Eq. 1). Pearson's correlation coefficient (r2) was calculated for the linearity of the slope, and readings were accepted when r2 was >0.70:
where Cgas is the measured gas concentration [µL L−1], t is the time [s], Vchamber [cm3] and Achamber [cm2] are the chamber volume and surface area, respectively, P is the ambient pressure [atm], R is the gas law constant [0.08206 L atm mol−1 K−1], T is the temperature [K], and Mw is the molecular weight of the gas
[g mol−1]. Daily values for each chamber were obtained by linear interpolation and numerical integration between sampling times. Cumulative N2O flux estimates for N2OIn and N2OAdjacent were taken as the average of the cumulative fluxes of the 12 individual chambers (Parkin and Kaspar, 2006).
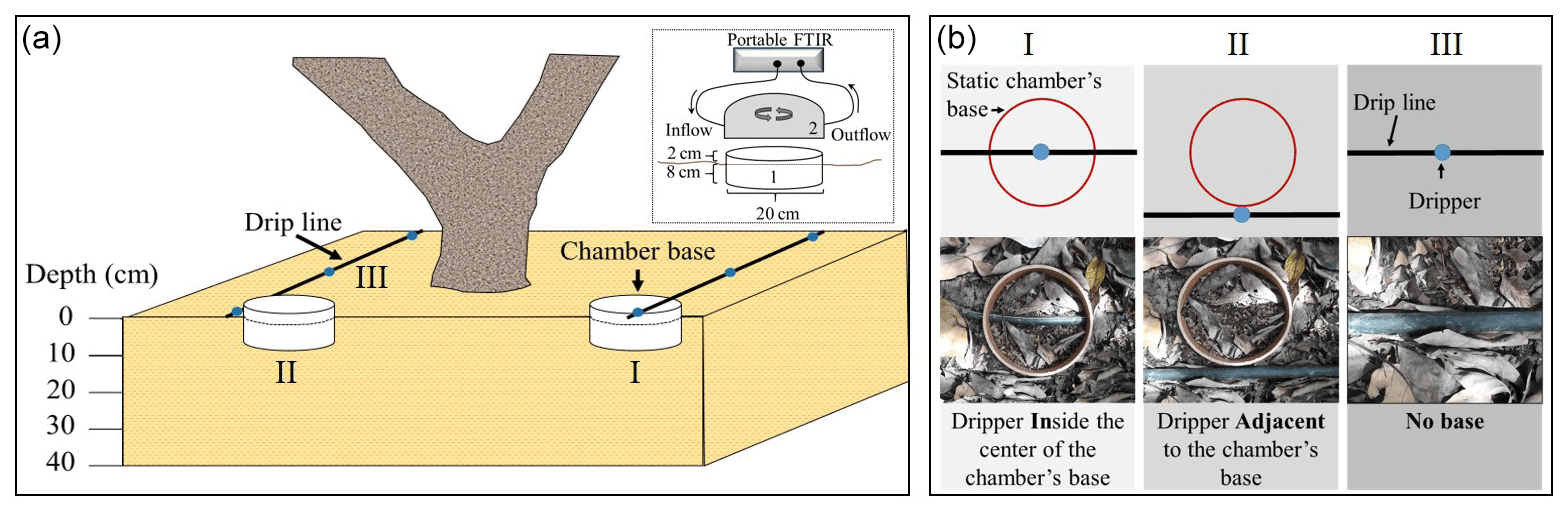
Figure 1Schematic side view (a) and top view (b) representation of the static chamber setup used to measure N2O fluxes in an avocado orchard and their locations (I, II, III) relative to the drip line and the drippers.
2.2 Modeling water flow, nutrients fate, and N2O emissions
2.2.1 The physical domain and its parametrization
Employing a Cartesian coordinate system (x1, x2, x3), where x1 is directed downwards, a subplot of the orchard consisting of a 3-D, spatially heterogeneous, variably saturated flow domain which extends over L1=2 m, L2=15 m, and L3=10 m along the x1, x2, and x3 axes, respectively, is considered here. The subplot includes two adjacent tree rows, located 6 m apart, with four trees, located 3.5 m apart, along each row (Fig. S1 in the Supplement).
Following Russo et al. (2020), the van Genuchten (1980) (VG) five-parameter model (i.e., saturated conductivity, Ks, shape parameters, α and n, the saturated, θs, and residual, θr, values of water content, θ) was implemented here for the local description of the constitutive relationships for unsaturated flow. Based on previous studies (e.g., Russo et al., 1997; Russo and Bouton, 1992), it is assumed here that each of the VG parameters is a second-order stationary, statistically anisotropic, random space function, characterized by a constant mean and a two-point covariance. Parameters of the latter, the variance and the correlation length scales, were adopted from Russo and Bouton (1992). Grain-size distribution data were obtained by the laser diffraction method (Eshel et al., 2004) from 0.3 m segments of five soil cores extending to a depth of 1.2 m. The data were used to estimate the local-scale VG parameters by an optimization procedure. For more details, see Russo et al. (2020). Mean values of the VG parameters were estimated using the soil texture-based procedure suggested by Mishra et al. (1989). Details of the generation of the 3-D, cross-correlated realizations of the spatially heterogeneous VG parameters are given in Russo et al. (2006). Mean values and coefficients of variation (CV) of the resultant VG parameters are given in Table 1 of Russo et al. (2020). The numerical grid used for the generation of the 3-D VG parameter field was modified in order to account for the application of water by the drip irrigation system and for the geometry of the ridges. For more details, see Russo et al. (2020).
In addition, deterministic molecular diffusion coefficients for chloride (Cl−), nitrate (NO) and ammonium (NH) in water, m2 d−1, dimensionless Henry's constant for N2O, KH=0.2, and pore-scale dispersion tensor (with longitudinal dispersivity, m, and transverse dispersivity, m; Perkins and Johnston, 1963) were considered in the simulations. First-order rate constants for nitrification and denitrification, K1 and K2, respectively, and a liquid–solid partitioning coefficient for ammonium, Kd1, were taken into account following Lotse et al. (1992). Estimates of the root uptake coefficients for ammonium and nitrate, Ku1 and Ku2, respectively, were calculated by extending the method of Nye and Tinker (1977); for more details, see Russo et al. (2013). Root distribution data, adopted from Salgado and Cautin (2008), were employed in order to construct a time-invariant, normalized root depth-distribution function for the avocado trees.
2.2.2 Quantification of the flow and the transport
Considering water and N extraction by plant roots, water flow and solute (NH, NO, and Cl−) transport in the 3-D, unsaturated, spatially heterogeneous flow system were simulated employing numerical solutions of the 3-D Richards equation and the 3-D single-region, advection-dispersion equation (ADE), respectively. Following Russo et al. (2015), the flow model was modified to account for irrigation by drippers. The iterative procedure described in Russo et al. (2006) was employed to determine the size of the time-dependent ponding area that may develop around the drippers at the soil surface during an irrigation event. Furthermore, following Russo et al. (2020), the sink term representing water uptake by the plant roots, which appears on the right-hand side of the Richards equation, was modified to account for the effect of the oxygen availability on water uptake. The maximization iterative (MI) approach proposed by Neuman et al. (1975) was adopted here in order to calculate water uptake by the plant roots and, concurrently, actual transpiration rate, τa(t).
Following Russo et al. (2013), the ADE was modified to account for N transformations and uptake by plant roots in the soil–water–plant–atmosphere system. In addition, the competition between Cl− and NO and its effect on the extraction of N by the plant roots, ass well as the inhibition of nitrification induced by Cl−, were taken into account. For more details, see Russo and Kurtzman (2019). The uptake of NO and NH by the plant roots was also calculated through an MI approach described by Eq. (6) in Russo et al. (2013).
Emissions of N2O were calculated based on Hénault et al. (2005) and Hénault et al. (2019), accounting for nitrification- and denitrification-driven emissions. N2O flux during denitrification (N2Odenit; mg-N m−2 d−1) was calculated as a combination of the potential denitrification rate (DP; mg-N m−2 d−1) and response functions to several environmental factors (Hénault et al., 2005):
where FW is the denitrification response factor to the soil WFPS, assuming the WFPS parameter serves as a proxy of the oxygen availability for microorganisms (Eq. S1 in the Supplement). FN is the denitrification response factor to soil NO content (dimensionless; based on Michaelis–Menten saturation curve) (Eq. S2), FT is the denitrification response factor to soil temperature (Eq. S3), and rmax is the maximum ratio of N2O to denitrified NO under anaerobic incubations (in this study ). N2O production during nitrification (mg-N m−2 d−1) was defined by Eq. (3) (Hénault et al., 2005):
where z is the proportion of nitrified nitrogen emitted as N2O (in this study z=0.006) and NA is the actual areal nitrification rate (mg-N m−2 d−1).
Details of the flow and the transport equations as well as of the numerical schemes employed to solve them are given elsewhere (Russo and Kurtzman, 2019; Russo et al., 2013).
2.2.3 Implementation
Meteorological data collected in the Yasur orchard were used to estimate the reference evapotranspiration, ET0(t), using the Penman–Monteith method. Potential evapotranspiration rates, (where ε: evaporation, τ – transpiration), were estimated from the ET0(t) data using the time-dependent crop coefficients actually used in the Yasur site. Assuming that the wetted soil surface area of the ridge is completely covered by the tree canopy, a negligibly low soil evaporation rate was adopted for the surface area of the ridges, i.e., τp(t)=ετp(t). For the soil surface area between the ridges outside the rooted zone, a negligibly small transpiration rate was assumed, i.e., εp(t)=ετp(t). Actual rates of water loss by evaporation, εa(t), were implemented by an MI approach described in Russo et al. (2006).
The chamber base was modeled as a cuboid whose axes coincide with the coordinates of the flow system. The center of a given chamber base is located at a given user-controlled point, , in the x2x3-horizontal plane; it extends vertically from the soil surface, x1=0, to the depth of x1=Zbot, and horizontally from to and from to , where Zbot=0.10 m and δx2=δx3 vary between 0.1 and 0.2 m. Unit head gradient is specified at x1=Zbot, and no-flow is specified at x1=0 and at the vertical planes of the chamber located at xc21 and xc22 and at xc31 and xc32.
Appropriate initial conditions for the present analyses were created by considering the measured water content and solute concentration profiles obtained prior to the irrigation season. For the flow, a second-type upper boundary condition was imposed on the top boundary (x1=0) with flux that is determined by the drippers' discharge and by the time-dependent potential soil evaporation flux. A unit head gradient boundary was specified at the bottom boundary (x1=L1). For the transport, a first-type upper boundary condition was imposed on the top boundary with inlet concentrations corresponding to the irrigation water concentrations. A zero-gradient boundary was specified at the bottom boundary. No-flow conditions are assumed for the vertical boundaries located at x2=0, x2=L2, x3=0, and x3=L3 (Fig. S1)
For a given location at the horizontal x2x3-plane and a given horizontal extent of the chamber base, starting at the beginning of the irrigation season (1 May), flow and transport simulations proceeded for an irrigation period of 180 d. Actual concentrations of NO and NH in the irrigation water (including amounts added as fertilizers) and concentrations of Cl− in the irrigation water used in the field experiments were implemented in the simulations.
2.2.4 Recommendation on the diameter of the chamber base
An additional model, DIDAS (Friedman et al., 2016, https://app.agri.gov.il/didas/, last access: 26 July 2022), was used to recommend the optimal diameter of a cylindrical base to be used along a single dripline. A simplified analysis of steady water flow from either a dripper (emitter) with no base (an undisturbed dripline) or a dripper surrounded by the cylindrical base (i.e., “In”) is used. The diameter of the cylindrical base (dcyl, cm), is determined as “optimal” when the water potential (or water content) at a chosen depth below the dripper (dref, cm) equals that generated at the same depth below an undisturbed dripline with equally spaced (demit, cm) drippers, depending on the soil capillary length (α−1, cm). The matric flux potential in this location (ϕref, cm2 h−1) is evaluated with analytical solutions to the linearized, steady water flow equation for a surface point source confined in a strip (its width equals demit), imitating an undisturbed single dripline, and for a surface point source in the center of a laterally confined cylindrical domain, mimicking the dripper surrounded by the base wall inserted into the soil (Eqs. 19 and 31 in Communar and Friedman, 2011, respectively). Initially, we compute the ϕref generated at depth dref under the undisturbed dripper and then determine dcyl that will generate the same ϕref at the same depth in an iterative, trial-and-error procedure.
All relevant lengths (dcyl, demit, dref, cm) were normalized by the soil capillary length, (α−1, cm), to provide a non-dimensional form corresponding to all soil textures, inter-emitter spacing, and discharge rates (q, cm3 h−1). The soil capillary length describes the exponential decrease of the soil's hydraulic conductivity upon drying according to Gardner's (1958) function, K=Ksexp (αh) (K, hydraulic conductivity (cm h−1); Ks, hydraulic conductivity at water saturation (cm h−1); h, pressure head (cm)), and reflects the dominance of capillarity over gravity forces in driving the water in partially saturated soils. Coarse-textured, sandy soils are characterized by large α (cm−1) values, and fine-textured, clayey soils by small values.
2.3 Statistical analysis
Data were analyzed using JMP® Pro Statistical Software version 15.0 (SAS Institute Inc., USA). For each base size or location, we used a t test to analyze the effects of the base on the different variables. The data met the assumption of homogeneity of variances. The presented data are means ± standard error (SE), with p values (p) representing the level of statistical significance.
3.1 Measured N2O fluxes in the field
Results from 2 years of measuring showed that the N2O fluxes (g m−2 d−1) were higher during the fertigation season (April–October) than during the winter period (November–March). During the winter, no significant differences were observed between the measured N2OIn and N2OAdjecent fluxes. By contrast, during the irrigation and fertigation season, the N2O fluxes from the chambers with a dripper at their bases (N2OIn) were on average 3.8 ± 0.56 times greater than the fluxes from the chambers adjacent to the dripper (N2OAdjecent) (0.015 ± 0.003 vs. 0.006 ± 0.001 g m−2 d−1) (Fig. 2). In 4.3 % of the samples, N2OAdjecent fluxes were higher than the N2OIn fluxes. This phenomenon only occurred when the measured fluxes were very low (<0.001 g m−2 d−1) in both locations and only following irrigation events and not fertigation events (Fig. 2). In 17 % of the measurements, the N2OIn and N2OAdjecent fluxes differed by 20 % or less (Fig. 2). The cumulative N2O emission measured in 2018, 2019, and 2020 showed the N2OIn flux to be 40 %–70 % higher than the N2OAdjecent flux (0.82–1.2 g m−2 vs. 0.25–0.65 g m−2).

Figure 2N2O fluxes measured in static chambers with a dripper in their base (N2OIn) and in static chambers with a dripper adjacent to their base (N2OAdjacent), and the ratio between N2OIn and N2OAdjacent at each one of the 12 sampling locations on all sampling days.
3.2 Simulation results
Simulation results show that during irrigation, the WFPS down the soil profile under the chamber's base (20 cm i.d.), with a dripper at its center (WFPSIn), was higher than the WFPS under a normal representative dripper with no base (WFPSNo) (Figs. 3a and 4d). A day after the irrigation, the WFPSIn decreased faster, leaving the soil profile under the WFPSNo treatments wetter. Throughout the simulation period (i.e., from day 5 onwards), the WFPS at depths of 10, 20, and 30 cm hardly differ, and the WFPSIn ranged from 0.77 to 0.63, while the WFPSNo ranged from 0.74 to 0.65.
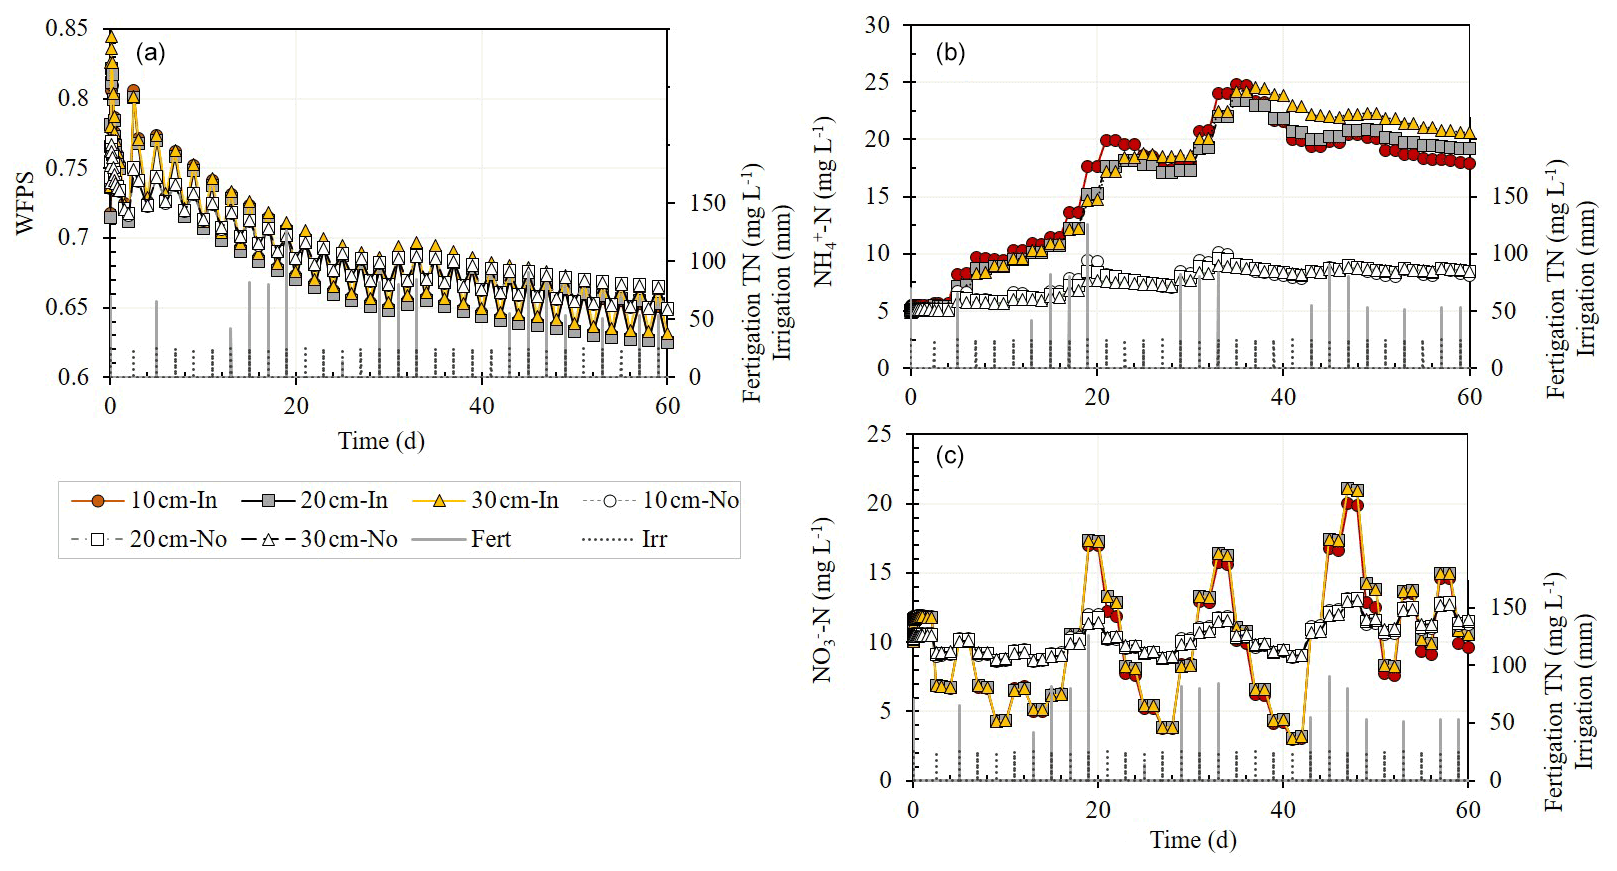
Figure 3Simulation results of the change over time in (a) water-filled pore space (WFPS), (b) NH-N, and (c) NO-N concentrations at three depths (10, 20, and 30 cm) under a base of a static chamber with a dripper at its center (filled shapes – In) and under a dripper without a base (light empty shapes – No) following irrigation every other day, and fertigation events. The top right corner of (a) shows a zoom-in of the WFPS cycle during 3 consecutive days: the day after fertigation (day 14), the day of fertigation (day 15), and the day following the fertigation event (day 16). Total nitrogen (TN) concentration in the fertigation solution is the sum of NO-N and NH-N concentrations.
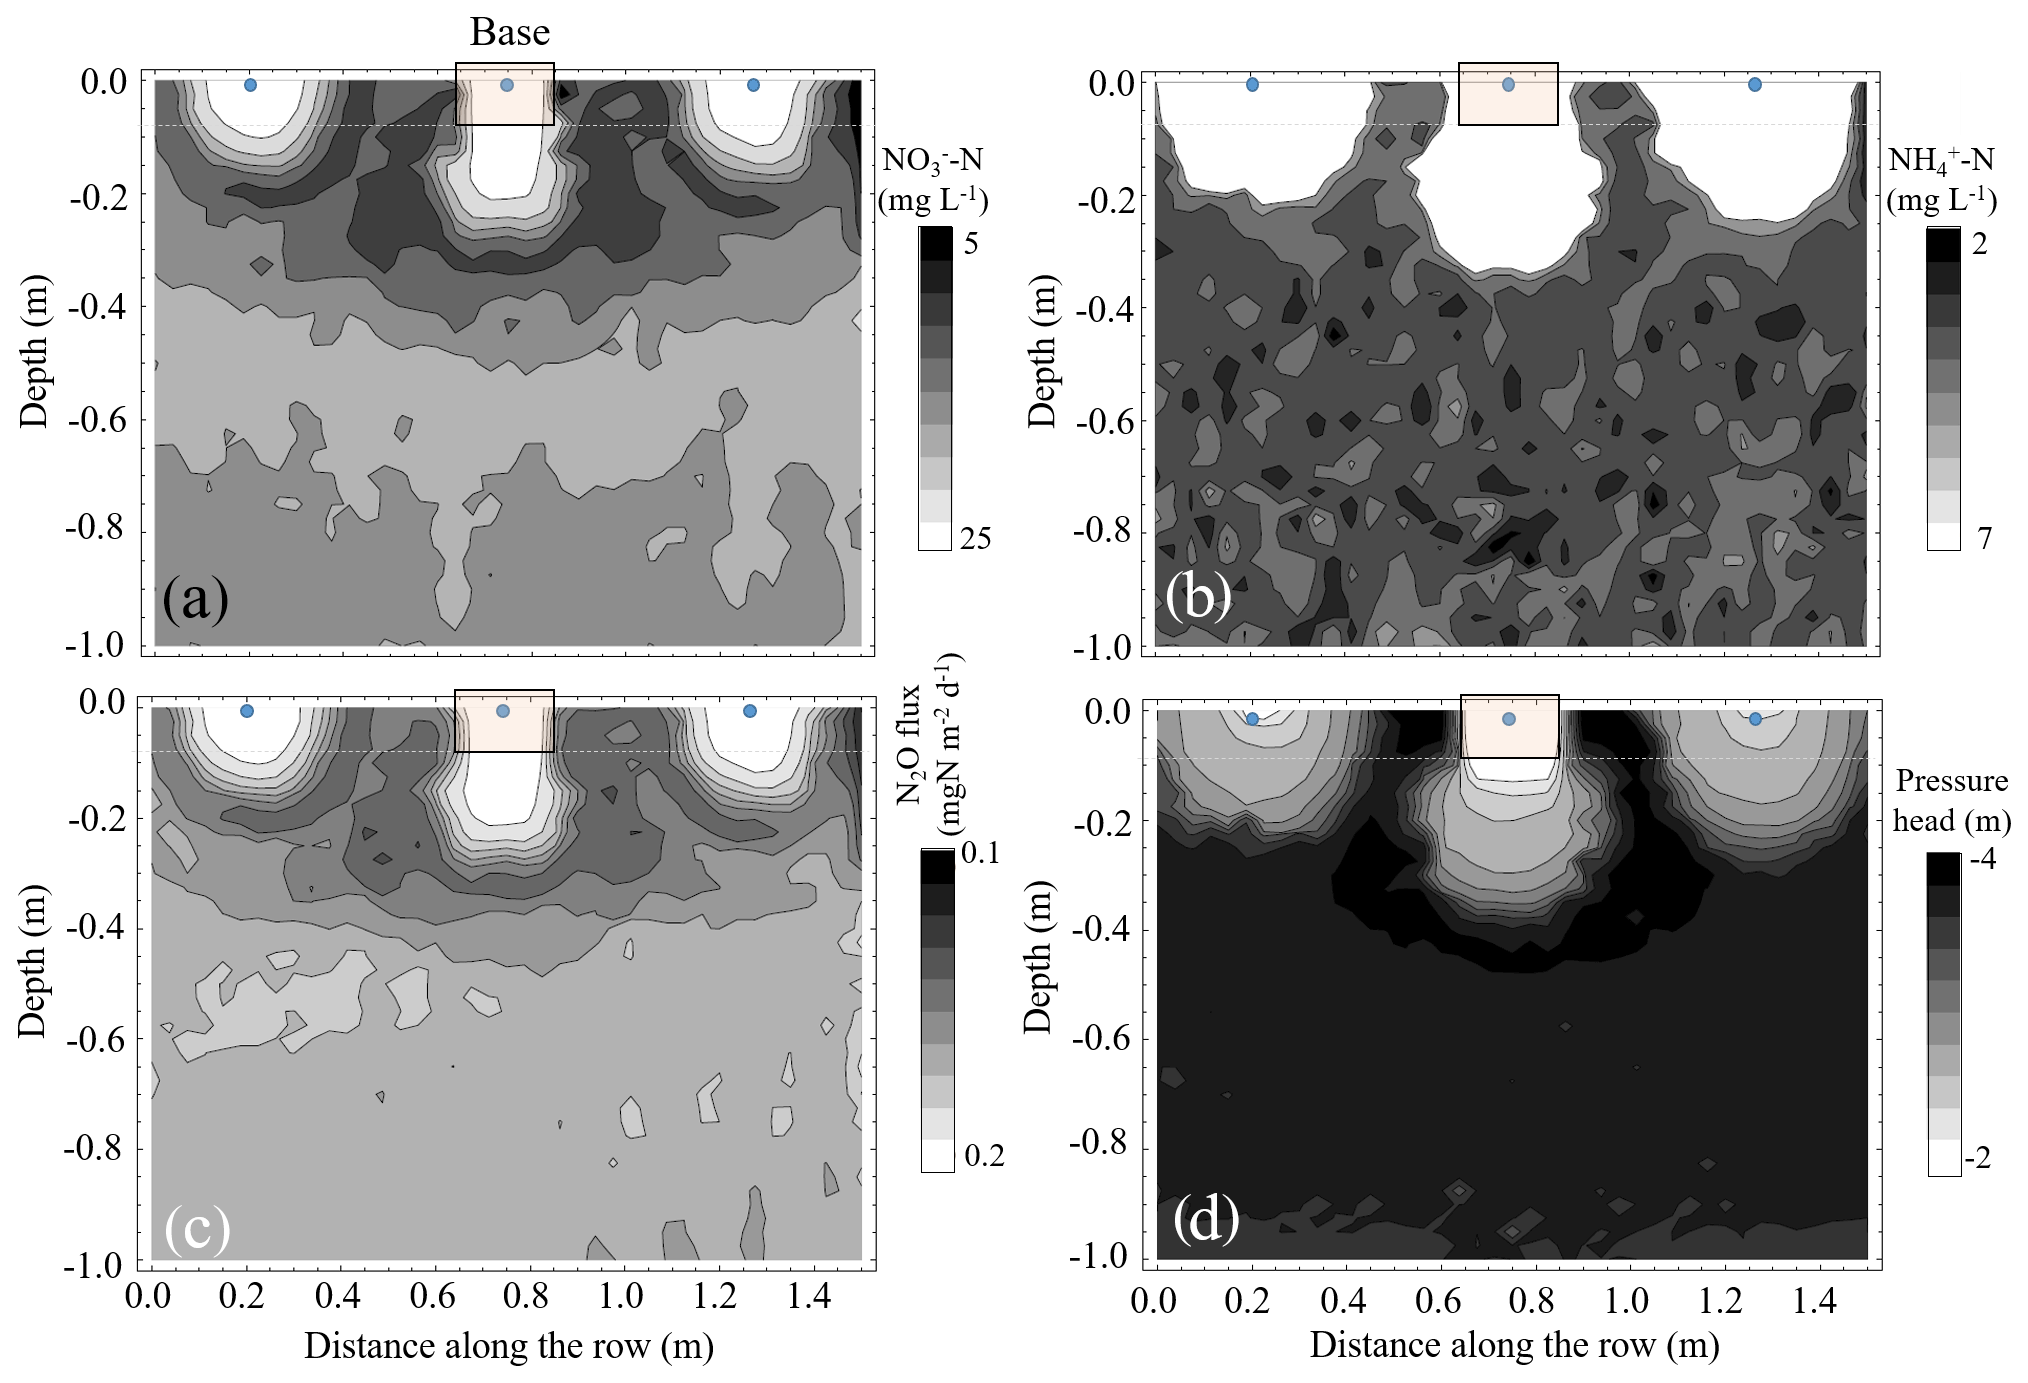
Figure 4Contours of the simulated (a) nitrate-N (NO-N) and (b) ammonium-N (NH-N) concentrations, (c) vertical N2O flux (positive upwards) and (d) pressure head distributions in the vertical x1x3 plane of the flow domain in the vicinity of one of the dripper line laterals along one of the ridges whose center is located at x2=5.1 m (Fig. S1). The figure shows three adjacent drippers, where the center dripper is confined by a static chamber base. The presented data are a snapshot following 30 d of fertigation.
Ammonium-N (NH-N) concentrations in and under the chamber base (NH-NIn) increased at all depths from ∼ 5 mg L−1 at the start of the simulation to ∼ 25 mg L−1 following 20 d. After 20 d, the concentrations remained high with minor changes. By contrast, the concentrations under a normal representative dripper with no base (NH-NNo) slightly increased during the 60 d of simulation (from 5 to 8 mg L−1) (Fig. 3b). Unlike with the NH-N concentration, nitrate-N (NO-N) concentrations showed a clear oscillating trend over time that corresponded to the N concentration in the fertigation solution (Fig. 3c). The amplitude of change was higher when the dripper was placed inside the base.
Simulations with bases of variable sizes (i.e., no base, 20, 30, and 40 cm i.d.) showed a clear size impact on the average NH-N and NO-N concentrations in the top 10 cm of the soil (Fig. 5). For NO-N, the smaller the base inside diameter, the higher the deviation from ambient (no base) concentrations. During fertigation events, NO-N concentrations inside the 20, 30, and 40 cm bases increased by up to 212 %, 159 %, and 137 %, respectively, relative to a dripper with no base around it. By contrast, between fertigation events, the concentrations decreased down to 10 %, 32 %, and 61 % of the concentrations under a dripper with no base. Unlike the oscillating trend of NO-N concentrations, NH-N concentrations during the simulated 60 d of fertigation gradually accumulated in the soil until they stabilized at around 20 mg L−1. The sharpest buildup was observed under the 20 and 30 cm i.d. bases where the NH-N concentrations were up to 300 times greater than the concentrations under a dripper with no base (Fig. 5).

Figure 5Simulation results of the change over time in NO-N and NH-N concentrations in the top soil (0–10 cm) under bases of variable sizes (i.e., no base, 20, 30, and 40 cm i.d.) with a dripper at their centers. Total nitrogen (TN) concentration in the fertigation solution is the sum of NO-N and NH-N concentrations.
Simulated N2O emissions showed a clear oscillating trend over time, which was affected by the irrigation and fertigation regime (Fig. 6). During fertigation events, N2O fluxes from the 20 cm i.d. base were on average higher by 14 ± 6 % (p=0.0345) than the fluxes from a dripper with no base, with higher fluxes from deeper parts (<10 cm) of the soil (Fig. 4c). However, the fluxes from the 30 and 40 cm i.d. bases were lower by 10 ± 5 % and 26 ± 4 %, respectively (p < 0.001, both). One day after a fertigation event, the fluxes from the 20, 30, and 40 cm i.d. chambers were −4 ± 10 %, −14 ± 5 %, and −26 ± 3 % lower than the fluxes from a dripper with no base (p < 0.008, all). More than 1 d after fertigation, the fluxes from the 20, 30, and 40 cm i.d. chambers were significantly lower than from a dripper with no base, with the greatest reduction in the 20 cm i.d. base (−69 ± 3 %, −42 ± 4 %, and −24 ± 3 %). Irrigation events 1 or 2 d following fertigations drastically reduced the N2O fluxes, leading to fluxes that equaled 33 ± 6 %, 67 ± 8 %, and 85 ± 5 % of the fluxes measured from a dripper with no base.
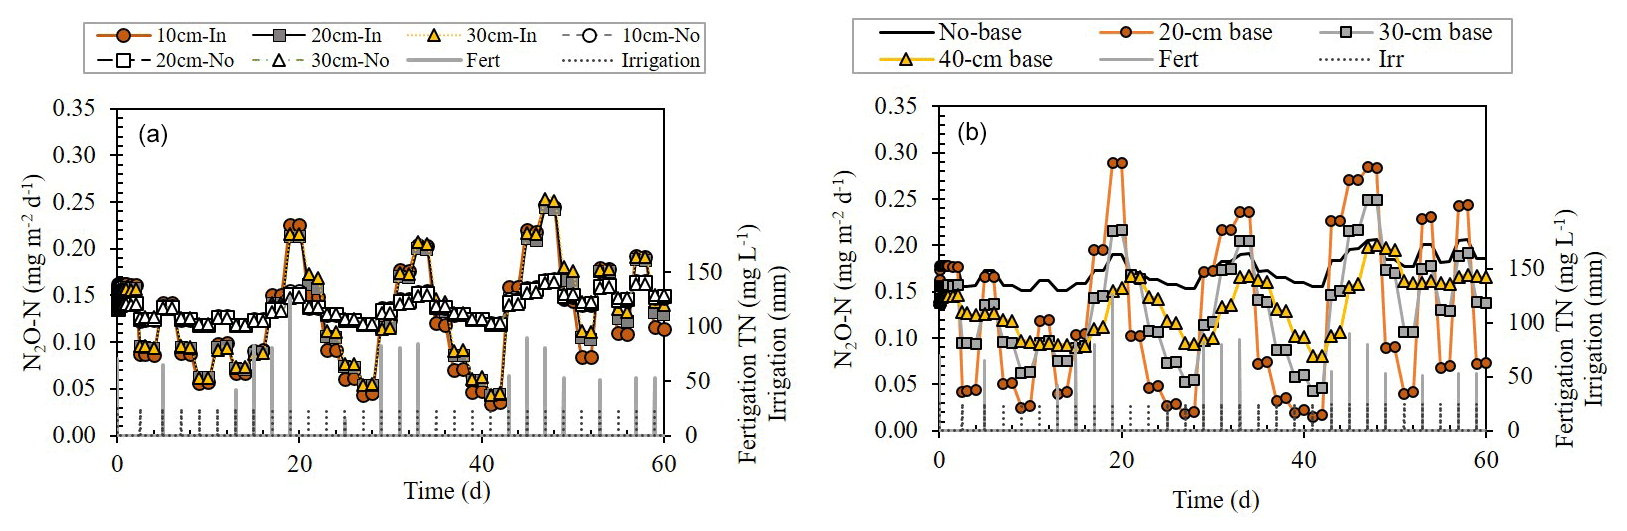
Figure 6Simulation results of the change over time in N2O-N fluxes (a) at 10, 20, and 30 cm below a base with a dripper at its center (In) vs. a dripper without a base (No), and (b) in the topsoil (0–10 cm) under bases of variable sizes (i.e., no base, 20, 30, and 40 cm i.d.) with a dripper at their centers. Total nitrogen (TN) concentration in the fertigation solution is the sum of NO-N and NH-N concentrations.
Under a dripper with no base and a 40 cm i.d. base, simulated N2O emission was significantly (p < 0.05) affected by the simulated WFPS, NH-N, and NO-N concentrations at depths of 10, 20, and 30 cm below the surface, with R2 regression of 0.10, 0.20, and 0.99, respectively (Tables S2 and S3). By contrast, under bases with a 20 and 30 cm i.d., simulated N2O emissions were significantly affected only by the simulated NO-N concentrations (Tables S1, S2, S3).
Integration of the daily simulation fluxes for a period of 60 d showed the cumulative N2O emissions from the 20 cm i.d. base (N2OIn) to be ∼ 47 % higher than under a base placed adjacent to a dripper (9.53 vs. 6.48 g N2O-N m−2) (Fig. 7b). The highest cumulative flux was measured under a dripper with no base (12.67 g N2O-N m−2).
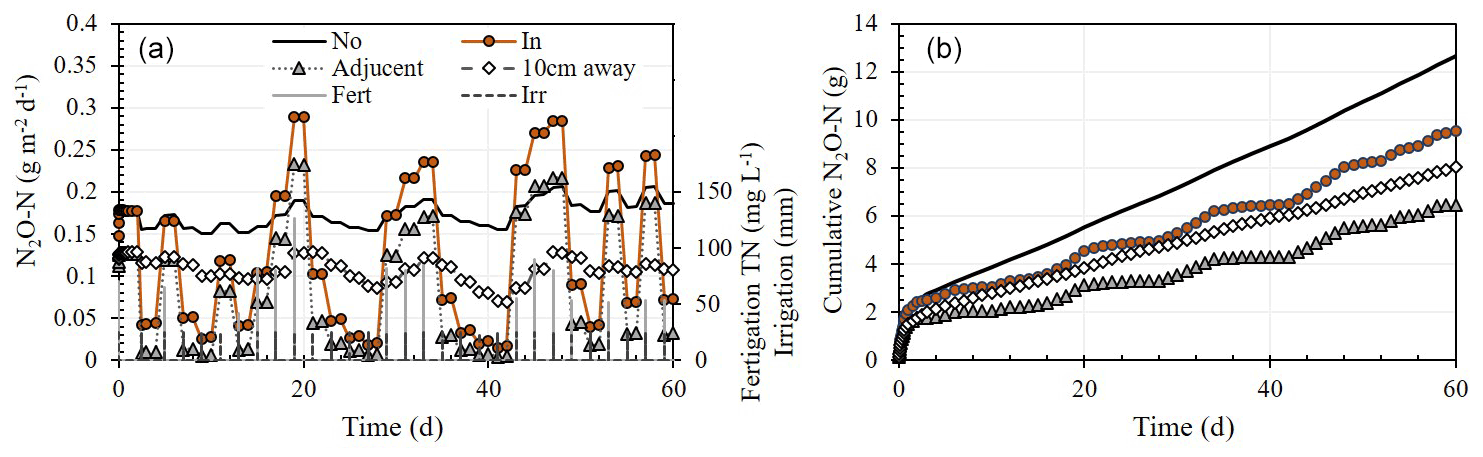
Figure 7Simulation results of (a) daily and (b) cumulative N2O-N emissions from the soil surface under (No) and 10 cm away from a dripper without a chamber base, from a chamber base with a dripper at its center (In), and a base adjacent to the dripper (adjacent), during consecutive fertigation events over a period of 60 d.

Figure 8(a) Non-dimensional matric flux potential (Φref) and (b) the ratio between the equivalent cylindrical base diameter (dcyl) and the emitter spacing (demit), as a function of the non-dimensional distance between emitters (αdemit), for different non-dimensional depths (αdref) below the emitter. The dash–dotted lines in (a) represent Φref at the given depth below a single emitter. , α is the soils capillary lengths, q is the emitter discharge rate.
Computations with the DIDAS code are summarized as reference water potential (Fig. 8a) and cylindrical base nomogram (Fig. 8b). Both are presented in a non-dimensional form corresponding to all soil textures, inter-emitter spacing, and discharge. The dimensionless matric flux potential (, , or water content, or pressure head (h) for a given soil (α) and dripper discharge rate (q)) decreases sharply with increasing distance between emitters (demit) or with coarsening (increasing α) of the soil texture. What counts is only their product αdemit. It also decreases with increasing dimensionless reference depth below the emitter (αdref) (Fig. 8a). At a dimensionless inter-emitter distance (αdemit) of about 2, the Φref (αdemit) lines flatten as the effect of the neighboring emitters weakens and the potentials converge to those generated by a single emitter (not in a dripline, dash–dotted lines, Eq. 10 in Communar and Friedman, 2010b). The diameter of the equivalent cylindrical base decreases sharply with increasing distance between emitters or for more sandy soils (αdemit); the plotted ratio, , is approximately proportional to (Fig. 8b).
Our field measurements show that N2OAdjecent fluxes may be higher than the N2OIn fluxes following irrigation events or several days after fertigation events (Fig. 2). These relatively high N2OAdjacent fluxes probably reflect conditions that are more conducive to denitrification (e.g., higher WFPS) or nitrification (e.g., higher NHconcentrations). Simulation results show that the differences in the WFPS between a base with a dripper at its center and between an undisturbed dipper are in the range of ±4 % following irrigations every other day (Fig. 3a). It also shows that these differences can be greater (±8 %), especially at a depth of 30 cm, following sporadic irrigation events or irrigation events at the start of the growing season (Figs. 3a and 4d). Analysis of the simulation results shows that the WFPS had a significant impact on the N2O fluxes only when no base was used (R2<0.004, p>0.598 vs. R2<0.094, p<0.009) (Table S3). Published literature shows that the WFPS–N2O relation is not always clear. N2O emissions were thought to have their optimum in the range of 70 %–80 % WFPS, depending on soil type (Davidson et al., 2000). At higher soil water content, the major end product of denitrification is N2. Nevertheless, a comprehensive study of 51 soils across Europe showed that most soils had their optimum N2O emissions under WFPS wetter than 80 % (Zechmeister-Boltenstern et al., 2007). Similarly, Keller and Reiners (1994) found that N2O emissions increased exponentially with WFPS, even at WFPS > 80 %. Bateman and Baggs (2005) showed that the relative contribution of nitrification and denitrification to N2O emission depended on the WFPS. Whereas at 70 % and 20 % WFPS, most N2O originated from denitrification (with the latter being 3 orders of magnitude lower), at 35 %–60 % WFPS, nitrification was the main process producing N2O. Overall, the simulated WFPS indicated that the micropores in the soil remained water-filled, which permits microbial activity without water stress, while the soil macropores are air-filled, which permits relatively good aeration of the bulk of the soil, although anaerobic microsites may exist. At such WFPS, both oxidative (nitrification) and reductive (denitrification) processes are active in the soil.
It is well established that higher N concentrations lead to higher N2O emissions (Wolff et al., 2014, 2017; Baram et al., 2018; Schellenberg et al., 2012; Alsina et al., 2013; Butterbach-Bahl et al., 2013). A clear indication of this phenomenon can be seen in Figs. 3 and 4, with the model simulation of water flow and NO and NH transport in the subsurface. When the dripper is placed in the center of the base, NOIn concentrations in the top 30 cm may be 50 %–64 % higher during fertigation events and up to 67 % lower following irrigation or on the days following fertigation events. Inspection of the trend over time shows that, on average, NOIn concentrations are decreased by −19 % ± 5 % (p=0.017) relative to a dripper with no base. This phenomenon results from the higher WFPS and the geometry of the base that limits lateral flow. As such, the water flow in the base is essentially 1-D in the vertical direction, which expedites downward water flow and N transport into the subsurface. Ammonium, unlike NO, is positively charged, hence readily adsorbs to the clays in the soil. Accordingly, the NHIn concentrations in the top 30 cm increased by 280 % relative to a dripper with no base and remained higher throughout the season (p<0.001) (Fig. 3).
Inspection of the correlations between the simulated N2O fluxes and the NH and NO concentrations show that N2O emissions were mainly influenced by the NH and NO concentrations (Tables S2 and S3). These, in turn, were affected by the inside diameter of the base, with higher inside diameters leading to fewer bias. It is known that N2O emission fluxes vary from one fertilizer event to another, even at the same site with the same fertilizer type under similar environmental conditions (Cowan et al., 2020). Here we show that an additional factor that must be accounted for is the location of the chamber base relative to the water source and the perturbation that the base has on water and N-species distribution. Simulation results show that placing the dripper inside the base may increase the N2O flux during a fertigation event by up to 52 % relative to a dripper without a base. In tandem, N2O fluxes following irrigation events or on the days following fertigation may be up to 91 % lower when the dripper is placed inside the base (Fig. 7a). A similar effect is observed when the chamber base is positioned adjacent to the dripper (i.e., up to 23 % increase during fertigation and up to 97 % decrease following irrigation events or on the days following fertigation). One should note that the modeled N2O fluxes resulted mainly from denitrification, as suggested by Eq. (3) and its relation to the WFPS (Fig. 3a, Tables S2, and S3). It is evident that under a different WFPS-N2Onit pattern, the base impact on the N2O may increase in tandem with the higher NH concentrations. All of these results provide a good indication of the two opposing phenomena: (a) increased WFPS, N concentrations, and downward flushing when the dripper is placed inside the base, and (b) hampering of the lateral distribution of water and solutes into the most bio-active part of the soil inside the base when the base is placed adjacent to the dripper.
Comparison of cumulative N2O emission measured in 2018, 2019, and 2020 and the simulated cumulative emissions (over 60 d) showed the N2OIn flux to be 40 %–70 % higher than the N2OAdjecent (Fig. 7b). It also shows that both methods underestimate the “true” cumulative flux from a dripper with no base by ∼ 25 % and ∼ 50 %, respectively. These values suggest that in addition to measurement errors due to suppression of the gas concentration gradient at the soil–atmosphere in static chambers (e.g., Venterea et al., 2020; Venterea, 2010), the impact of the chamber base on the water and N distribution provides an additional level of complexity, leading to an erroneous estimate of the true N2O flux. Accordingly, the emission factors measured in such setups (e.g., Alsina et al., 2013; Baram et al., 2018; Fentabil et al., 2016; Garland et al., 2014; Scheer et al., 2008; Tian et al., 2017; Verhoeven and Six, 2014) are likely lower than the actual emission factors.
The degree to which the location of the chamber base relative to the dripper affects the N2O flux will depend on the soil properties and on the chamber inside diameter. Overall, an increase in the chamber inside diameter will decrease the aforementioned biases by reducing the lateral flow constraints posed by the chamber base. An indication of this process can be seen in Fig. 5 for the clayey soil used in this study. Such clayey soils have a large capillary length (i.e., tens of centimeters long), which supports high lateral capillary flow. Accordingly, the use of a chamber with a larger inside diameter (i.e., the simulated 40 cm or even larger) is required to reduce the negative effects of the base on the water distribution near the surface and to provide a more reliable representation of the ambient fluxes around drippers.
The upper limit of the dimensionless inter-emitter distance (αdemit) in the depicted cylindrical base nomogram (Fig. 8b) is 2, as larger spacings are not recommended to assure overlap between the wetted bulbs (Communar and Friedman, 2010b), and that of the dimensionless reference depth (αdemit) is 1, as the processes leading to N2O emission are occurring at shallow depths. The sharp decrease in the diameter of the equivalent cylindrical base with increasing distance between emitters or for more sandy soils (αdemit) is because of the relative (dimensionless) effect of the parallel strip walls (i.e., of the neighboring emitters) increases with demit. However, the dependence of on the reference depth (αdref) is mild, a slight increase with depth of reference locations for small inter-emitter spacings (or for clayey soils), and there is virtually no dependence for large inter-emitter spacings (or for sandy soils). This is good news, as it means that an equivalent cylindrical base of chosen diameter can provide similar water contents at a range of depths below the dripper. The diameter of the equivalent cylindrical base is larger than the inter-emitter spacing () for smaller inter-emitter spacing, or for fine-texture soils, and slightly smaller than the inter-emitter spacing () for larger inter-emitter spacing, or for coarse-texture soils (Fig. 8b). As stated earlier, intuitively, it is expected that since an infinitely deep cylinder confines lateral water flow in all directions, while the symmetry of vertical planes between drippers along the dripline confines it only in the direction of the dripline, dcyl should be larger than demit. These results agree with the simulation results discussed earlier, demonstrating mostly larger differences compared to undisturbed drippers for bases of smaller diameters (Figs. 5 and 6). As a sensible inter-emitter spacing is about one capillary length, i.e., αdemit=1, the recommended is about one (Fig. 8b), a base diameter equal to the inter-emitter spacing. Note that the nomogram is independent of the dripper discharge rate (q), since according to the linearized water flow equation used for the analysis (Eq. 5 in Communar and Friedman, 2010a), the matric flux potential generated by the drippers (point sources) is simply proportional to q, whatever the geometry of the flow field.
The use of the nomogram is very simple. Suppose we want to determine the diameter of a cylindrical base (dcyl) that will optimally reproduce the wetting patterns under 50 cm-spaced drippers (demit) along a single dripline in a clayey soil with a capillary length (α−1) of 100 cm, by requiring that the water potential (content) at a depth (dref) of 25 cm below the dripper will be the same. The dimensional emitter spacing (αdemit) is thus 0.5, and the vertical arrow stops at the dimensionless reference depth (αdref) of 0.25 (solid black line in Fig. 8b), from which the horizontal arrow stretches to approximately , i.e., the cylindrical base diameter should be larger by 21 % compared to the inter-emitter spacing, about 60 cm. The soil capillary lengths (α−1) of most agricultural soils vary between approximately 10 cm for sandy soils and 100 cm for structureless, clayey soils with common values of 20–40 cm for loams and fine sands (Friedman et al., 2016). If the value of the hydraulic conductivity at saturation is known, the soil capillary length can be evaluated with the universal relationship (in which α is measured in cm−1 and Ks in cm h−1) (Fig. 12 in Communar and Friedman, 2010a, also used in DIDAS).
The analysis used for constructing the nomogram is based on addressing only water flow and applying multiple simplifying assumptions of steady flow, assuming an infinitely deep confining cylinder (as opposed to the insertion of just a few centimeters of the chamber base, although the effect of 10 cm insertion seems to affect the wetting patterns at large depths, Fig. 4d) and disregarding water uptake by plant roots and evaporation from the soil surface. Yet, it is believed that it provides plausible guidelines for choosing the optimal inserted-into-the-soil base diameter. It will take many users in many conditions (soil types, wetting patterns, variable N, C, and O regimes), rather than a single study, to ascertain whether these methodologies are constructive or not. In parallel, minimizing the depth to which bases are inserted to 1–2 cm will lower its impact on the water and N-species distribution inside it. This is especially true when short closure times are needed, such as when portable gas analyzers are used in the field. An alternative option is to develop a static chamber that does not need a base. All of the above are crucial steps that are required to obtain accurate observations on which small- and large-scale climate prediction models are built.
This study aims to address the problem of the systematic, 3-D heterogeneities around a dripper, present relevant measured and simulated results, and propose pertinent methodologies to assist in decisions regarding the size and placement of static chamber bases in drip irrigation. Based on 2 years of field measurements and numerical simulations of water flow, N-species transport and reactions (i.e., nitrate and ammonium), and N2O emissions, we concluded that static chamber methodology, which requires the insertion of bases into the soil, underestimates N2O emissions when used in drip irrigation. This is an outcome of (a) increased water contents and N concentrations, and downward flushing when the dripper is placed inside the base, and (b) hampering of the lateral distribution of water and solutes into the most bio-active part of the soil inside the base when the base is placed adjacent to the dripper. These effects can be mitigated by optimizing the chamber design. A nomogram is proposed to determine the optimal diameter of a cylindrical base to be used along a single dripline. Further study is suggested to determine the validity of the developed nomogram and the optimal insertion depth of bases on the basis of the enclosure period. An alternative option is to develop a static chamber that does not need a base. It will take many users in many conditions (soil types, wetting patterns, variable N, C, and O regimes), rather than a single study, to ascertain whether these methodologies are constructive.
The code is not publicly accessible. For further information, please contact David Russo at vwrosd@volcani.agri.gov.il.
The field data was uploaded to Mendeley Data repository (https://doi.org/10.17632/4ffkytvssp.1, Baram, 2022).
The supplement related to this article is available online at: https://doi.org/10.5194/bg-19-3699-2022-supplement.
SB and ABT supervised the project and acquired financial support. SB designed the experiments, analyzed the data, and wrote the manuscript with contributions from all co-authors. DR performed the detailed numerical simulations, and SPF devised the equivalent cylinder nomogram. AG collected the data in the field.
The contact author has declared that none of the authors has any competing interests.
Publisher’s note: Copernicus Publications remains neutral with regard to jurisdictional claims in published maps and institutional affiliations.
The Authors would like to thank the growers at Kiutz Yasur, that allowed us to conduct the experiment, and Rami Bar-Ziv and Yael Bar-Noy from the Acco experiments farm – Western Galilee Agricultural R&D Center – for managing the orchard.
The study was funded by The Office of the Chief Scientist, Ministry of Agriculture and Rural Development, Israel, grant no. 20-03-0027.
This paper was edited by Kees Jan van Groenigen and reviewed by two anonymous referees.
Alsina, M. M., Fanton-Borges, A. C., and Smart, D. R.: Spatiotemporal variation of event related N2O and CH4 emissions during fertigation in a California almond orchard, Ecosphere, 4, 1–21, https://doi.org/10.1890/ES12-00236.1, 2013.
Baram, S.: Data for The effect of static chamber base on N2O flux in drip irrigation, V1, Mendeley Data [data set], https://doi.org/10.17632/4ffkytvssp.1, 2022.
Baram, S., Dabach, S., Jerszurki, D., Stockert, C. M., and Smart, D. R.: Upscaling point measurements of N2O emissions into the orchard scale under drip and microsprinkler irrigation, Agr. Ecosyst. Environ., 265, 103–111, https://doi.org/10.1016/j.agee.2018.05.022, 2018.
Bateman, E. J. and Baggs, E. M.: Contributions of nitrification and denitrification to N2O emissions from soils at different water-filled pore space, Biol. Fertil. Soils, 41, 379–388, https://doi.org/10.1007/s00374-005-0858-3, 2005.
Burton, D. L., Zebarth, B. J., Gillam, K. M., and MacLeod, J. A.: Effect of split application of fertilizer nitrogen on N2O emissions from potatoes, Can. J. Soil Sci., 88, 229–239, https://doi.org/10.4141/CJSS06007, 2008.
Butterbach-Bahl, K., Baggs, E. M., Dannenmann, M., Kiese, R., and Zechmeister-Boltenstern, S.: Nitrous oxide emissions from soils: how well do we understand the processes and their controls?, Philos. T. Roy. Soc. B, 368, 20130122, https://doi.org/10.1098/rstb.2013.0122, 2013.
Clough, T. J., Rochette, P., Thomas, S. M., Pihlatie, M., Christiansen, J. R., and Thorman, R. E.: Global Research Alliance N2O chamber methodology guidelines: Design considerations, J. Environ. Qual., 49, 1081–1091, https://doi.org/10.1002/jeq2.20117, 2020.
Communar, G. and Friedman, S. P.: Relative Water Uptake Rate as a Criterion for Trickle Irrigation System Design: I. Coupled Source–Sink Steady Water Flow Model, Soil Sci. Soc. Am. J., 74, 1493–1508, https://doi.org/10.2136/sssaj2009.0338, 2010a.
Communar, G. and Friedman, S. P.: Relative Water Uptake Rate as a Criterion for Trickle Irrigation System Design: II. Surface Trickle Irrigation, Soil Sci. Soc. Am. J., 74, 1509–1517, https://doi.org/10.2136/sssaj2009.0339, 2010b.
Communar, G. and Friedman, S. P.: General Solution for Steady Infiltration and Water Uptake in Strip-Shaped, Rectangular, and Cylindrical Domains, Soil Sci. Soc. Am. J., 75, 2085–2094, https://doi.org/10.2136/sssaj2011.0088, 2011.
Cowan, N., Levy, P., Maire, J., Coyle, M., Leeson, S. R., Famulari, D., Carozzi, M., Nemitz, E., and Skiba, U.: An evaluation of four years of nitrous oxide fluxes after application of ammonium nitrate and urea fertilisers measured using the eddy covariance method, Agr. Forest Meteorol., 280, 107812, https://doi.org/10.1016/j.agrformet.2019.107812, 2020.
Davidson, E. A., Keller, M., Erickson, H. E., Verchot, L. V., and Veldkamp, E.: Testing a Conceptual Model of Soil Emissions of Nitrous and Nitric Oxides Using two functions based on soil nitrogen availability and soil water content, the hole-in-the-pipe model characterizes a large fraction of the observed variation of nitric oxide and nitrous oxide emissions from soils, Bioscience, 50, 667–680, https://doi.org/10.1641/0006-3568(2000)050[0667:tacmos]2.0.co;2, 2000.
Eshel, G., Levy, G. J., Mingelgrin, U., and Singer, M. J.: Critical Evaluation of the Use of Laser Diffraction for Particle-Size Distribution Analysis, Soil Sci. Soc. Am. J., 68, 736–743, https://doi.org/10.2136/sssaj2004.7360, 2004.
Fentabil, M. M., Nichol, C. F., Jones, M. D., Neilsen, G. H., Neilsen, D., and Hannam, K. D.: Effect of drip irrigation frequency, nitrogen rate and mulching on nitrous oxide emissions in a semi-arid climate: An assessment across two years in an apple orchard, Agr. Ecosyst. Environ., 235, 242–252, 2016.
Friedman, S. P., Communar, G., and Gamliel, A.: DIDAS – User-friendly software package for assisting drip irrigation design and scheduling, Comput. Electron. Agr., 120, 36–52, https://doi.org/10.1016/J.COMPAG.2015.11.007, 2016.
Gardner, W. R.: Some steady-state solutions of the unsaturated moisture flow equation with application to evaporation from a water table, Soil Sci., 4, 228–232, https://doi.org/10.1097/00010694-195804000-00006, 1958.
Garland, G. M., Suddick, E., Burger, M., Horwath, W. R., and Six, J.: Direct N2O emissions from a Mediterranean vineyard: Event-related baseline measurements, Agr. Ecosyst. Environ., 195, 44–52, https://doi.org/10.1016/j.agee.2014.05.018, 2014.
Healy, R. W., Striegl, R. G., Russell, T. F., Hutchinson, G. L., and Livingston, G. P.: Numerical Evaluation of Static-Chamber Measurements of Soil–Atmosphere Gas Exchange: Identification of Physical Processes, Soil Sci. Soc. Am. J., 60, 740–747, https://doi.org/10.2136/sssaj1996.03615995006000030009x, 1996.
Heller, H., Bar-Tal, A., Tamir, G., Bloom, P., Venterea, R. T., Chen, D., Zhang, Y., Clapp, C. E., and Fine, P.: Effects of Manure and Cultivation on Carbon Dioxide and Nitrous Oxide Emissions from a Corn Field under Mediterranean Conditions, J. Environ. Qual., 39, 437, https://doi.org/10.2134/jeq2009.0027, 2010.
Hénault, C., Bizouard, F., Laville, P., Gabrielle, B., Nicoullaud, B., Germon, J. C., and Cellier, P.: Predicting in situ soil N2O emission using NOE algorithm and soil database, Glob. Change Biol., 11, 115–127, https://doi.org/10.1111/j.1365-2486.2004.00879.x, 2005.
Hénault, C., Bourennane, H., Ayzac, A., Ratié, C., Saby, N. P. A., Cohan, J.-P., Eglin, T., and Le Gall, C.: Management of soil pH promotes nitrous oxide reduction and thus mitigates soil emissions of this greenhouse gas, Sci. Rep.-UK, 9, 20182, https://doi.org/10.1038/s41598-019-56694-3, 2019.
Hutchinson, G. L. and Livingston, G. P.: Vents and seals in non-steady-state chambers used for measuring gas exchange between soil and the atmosphere, Eur. J. Soil Sci., 52, 675–682, https://doi.org/10.1046/j.1365-2389.2001.00415.x, 2001.
Keller, M. and Reiners, W. A.: Soil-atmosphere exchange of nitrous oxide, nitric oxide, and methane under secondary succession of pasture to forest in the Atlantic lowlands of Costa Rica, Global Biogeochem. Cy., 8, 399–409, https://doi.org/10.1029/94GB01660, 1994.
Lotse, E. G., Jabro, J. D., Simmons, K. E., and Baker, D. E.: Simulation of nitrogen dynamics and leaching from arable soils, J. Contam. Hydrol., 10, 183–196, https://doi.org/10.1016/0169-7722(92)90060-R, 1992.
Mishra, S., Parker, J. C., and Singhal, N.: Estimation of soil hydraulic properties and their uncertainty from particle size distribution data, J. Hydrol., 108, 1–18, https://doi.org/10.1016/0022-1694(89)90275-8, 1989.
Nemera, D. B., Bar-Tal, A., Levy, G. J., Lukyanov, V., Tarchitzky, J., Paudel, I., and Cohen, S.: Mitigating negative effects of long-term treated wastewater application via soil and irrigation manipulations: Sap flow and water relations of avocado trees (Persea americana Mill.), Agr. Water Manage., 237, 106178, https://doi.org/10.1016/j.agwat.2020.106178, 2020.
Neuman, S. P., Feddes, R. A., and Bresler, E.: Finite Element Analysis of Two-Dimensional Flow in Soils Considering Water Uptake by Roots: I. Theory, Soil Sci. Soc. Am. J., 39, 224–230, https://doi.org/10.2136/sssaj1975.03615995003900020007x, 1975.
Nye, P. and Tinker, P. B.: Solute Movement in the Soil-Root System, Blackwell Scientific Publications, Hoboken, NJ, USA, 342 pp., ISBN 9780520034518, 1977.
Parkin, T. B. and Kaspar, T. C.: Nitrous oxide emissions from corn-soybean systems in the midwest, J. Environ. Qual., 35, 1496–1506, 2006.
Perkins, T. K. and Johnston, O. C.: A Review of Diffusion and Dispersion in Porous Media, Soc. Petrol. Eng. J., 3, 70–84, https://doi.org/10.2118/480-PA, 1963.
Rabot, E., Cousin, I., and Hénault, C.: A modeling approach of the relationship between nitrous oxide fluxes from soils and the water-filled pore space, Biogeochemistry, 122, 395–408, https://doi.org/10.1007/s10533-014-0048-1, 2015.
Rochette, P. and Eriksen-Hamel, N. S.: Chamber Measurements of Soil Nitrous Oxide Flux: Are Absolute Values Reliable?, Soil Sci. Soc. Am. J., 72, 331–342, https://doi.org/10.2136/sssaj2007.0215, 2008.
Russo, D. and Bouton, M.: Statistical analysis of spatial variability in unsaturated flow parameters, Water Resour. Res., 28, 1911–1925, https://doi.org/10.1029/92WR00669, 1992.
Russo, D. and Kurtzman, D.: Using Desalinated Water for Irrigation: Its Effect on Field Scale Water Flow and Contaminant Transport under Cropped Conditions, Water, 11, 687, https://doi.org/10.3390/w11040687, 2019.
Russo, D., Russo, I., and Laufer, A.: On the spatial variability of parameters of the unsaturated hydraulic conductivity, Water Resour. Res., 33, 947–956, https://doi.org/10.1029/96WR03947, 1997.
Russo, D., Zaidel, J., Fiori, A., and Laufer, A.: Numerical analysis of flow and transport from a multiple-source system in a partially saturated heterogeneous soil under cropped conditions, Water Resour. Res., 42, W06415, https://doi.org/10.1029/2006WR004923, 2006.
Russo, D., Laufer, A., Shapira, R. H., and Kurtzman, D.: Assessment of solute fluxes beneath an orchard irrigated with treated sewage water: A numerical study, Water Resour. Res., 49, 657–674, https://doi.org/10.1002/wrcr.20085, 2013.
Russo, D., Laufer, A., Bardhan, G., and Levy, G. J.: Salinity control in a clay soil beneath an orchard irrigated with treated waste water in the presence of a high water table: A numerical study, J. Hydrol., 531, 198–213, https://doi.org/10.1016/j.jhydrol.2015.04.013, 2015.
Russo, D., Laufer, A., and Bar-Tal, A.: Improving water uptake by trees planted on a clayey soil and irrigated with low-quality water by various management means: A numerical study, Agr. Water Manage., 229, 105891, https://doi.org/10.1016/j.agwat.2019.105891, 2020.
Salgado, E. and Cautin, R.: Avocado root distribution in fine and coarse-textured soils under drip and microsprinkler irrigation, Agr. Water Manage., 95, 817–824, 2008.
Sánchez-Martín, L., Arce, A., Benito, A., Garcia-Torres, L., and Vallejo, A.: Influence of drip and furrow irrigation systems on nitrogen oxide emissions from a horticultural crop, Soil Biol. Biochem., 40, 1698–1706, https://doi.org/10.1016/j.soilbio.2008.02.005, 2008.
Sanchez-Martín, L., Meijide, A., Garcia-Torres, L., and Vallejo, A.: Combination of drip irrigation and organic fertilizer for mitigating emissions of nitrogen oxides in semiarid climate, Agr. Ecosyst. Environ., 137, 99–107, https://doi.org/10.1016/j.agee.2010.01.006, 2010.
Scheer, C., Wassmann, R., Kienzler, K., Ibragimov, N., and Eschanov, R.: Nitrous oxide emissions from fertilized, irrigated cotton (Gossypium hirsutum L.) in the Aral Sea Basin, Uzbekistan: Influence of nitrogen applications and irrigation practices, Soil Biol. Biochem., 40, 290–301, https://doi.org/10.1016/J.SOILBIO.2007.08.007, 2008.
Schellenberg, D. L., Alsina, M. M., Muhammad, S., Stockert, C. M., Wolff, M. W., Sanden, B. L., Brown, P. H., and Smart, D. R.: Yield-scaled global warming potential from N2O emissions and CH4 oxidation for almond (Prunus dulcis) irrigated with nitrogen fertilizers on arid land, Agr. Ecosyst. Environ., 155, 7–15, 2012.
Smart, D. R., Alsina, M. M., Wolff, M. W., Matiasek, M. G., Schellenberg, D. L., Edstrom, J. P., Brown, P. H., and Scow, K. M.: N2O Emissions and Water Management in California Perennial Crops, in: Understanding Greenhouse Gas Emissions from Agricultural Management, edited by: Guo, L., Gunasekara, A., and McConnell, L., ACS Symposium Series, American Chemical Society, Washington, DC, 227–255, ISBN 9780841226548, 2011.
Tian, D., Zhang, Y., Mu, Y., Zhou, Y., Zhang, C., and Liu, J.: The effect of drip irrigation and drip fertigation on N2O and NO emissions, water saving and grain yields in a maize field in the North China Plain, Sci. Total Environ., 575, 1034–1040, https://doi.org/10.1016/j.scitotenv.2016.09.166, 2017.
Vallejo, A., Meijide, A., Boeckx, P., Arce, A., García-torres, L., Aguado, P. L., and Sanchez-martin, L.: Nitrous oxide and methane emissions from a surface drip-irrigated system combined with fertilizer management, Eur. J. Soil Sci., 65, 386–395, https://doi.org/10.1111/ejss.12140, 2014.
van Genuchten, M. T.: A Closed-form Equation for Predicting the Hydraulic Conductivity of Unsaturated Soils, Soil Sci. Soc. Am. J, 44, 892–898, 1980.
Venterea, R. T.: Simplified Method for Quantifying Theoretical Underestimation of Chamber-Based Trace Gas Fluxes, J. Environ. Qual., 39, 126–135, https://doi.org/10.2134/jeq2009.0231, 2010.
Venterea, R. T., Petersen, S. O., de Klein, C. A. M., Pedersen, A. R., Noble, A. D. L., Rees, R. M., Gamble, J. D., and Parkin, T. B.: Global Research Alliance N2O chamber methodology guidelines: Flux calculations, J. Environ. Qual., 49, 1141–1155, https://doi.org/10.1002/jeq2.20118, 2020.
Verhoeven, E. and Six, J.: Biochar does not mitigate field-scale N2O emissions in a Northern California vineyard: An assessment across two years, Agr. Ecosyst. Environ., 191, 27–38, https://doi.org/10.1016/j.agee.2014.03.008, 2014.
Wolff, M. W., Schellenberg, D. L., Sanden, B. L., Brown, P. H., and Smart, D. R.: Reducing Reactive-N Loss from Fertigation: High-Frequency Application and Fertilizer Selection, in: Poster presented at the annual meeting of the Almond Board of California, Sacramento, California, USA, 2014.
Wolff, M. W., Hopmans, J. W., Stockert, C. M., Burger, M., Sanden, B. L., and Smart, D. R.: Effects of drip fertigation frequency and N-source on soil N2O production in almonds, Agr. Ecosyst. Environ., 238, 67–77, 2017.
Wu, X. and Zhang, A.: Comparison of three models for simulating N2O emissions from paddy fields under water-saving irrigation, Atmos. Environ., 98, 500–509, https://doi.org/10.1016/j.atmosenv.2014.09.029, 2014.
Zebarth, B. J., Rochette, P., Burton, D. L., and Price, M.: Effect of fertilizer nitrogen management on N2O emissions in commercial corn fields, Can. J. Soil Sci., 88, 189–195, https://doi.org/10.4141/CJSS06010, 2008.
Zechmeister-Boltenstern, S., Schaufler, G., and Kitzler, B.: NO2, N2O, CO2 and CH4 fluxes from soils under different land use: temperature sensitivity and effects of soil moisture, Geophys. Res. Abstr., 8, 7968, SRef-ID: 1607-7962/gra/EGU2007-A-07968, 2007.