the Creative Commons Attribution 4.0 License.
the Creative Commons Attribution 4.0 License.
 | 12 Oct 2022
Seed traits and phylogeny explain plants' geographic distribution
Kevin S. Burgess
Fangliang He
Xiang-Yun Yang
De-Zhu Li
Understanding the mechanisms that shape the geographic distribution of plant species is a central theme of biogeography. Although seed mass, seed dispersal mode and phylogeny have long been suspected to affect species distribution, the link between the sources of variation in these attributes and their effects on the distribution of seed plants are poorly documented. This study aims to quantify the joint effects of key seed traits and phylogeny on species distribution. We collected the seed mass and seed dispersal mode from 1426 species of seed plants representing 501 genera of 122 families and used 4 138 851 specimens to model species distributional range size. Phylogenetic generalized least-squares regression and variation partitioning were performed to estimate the effects of seed mass, seed dispersal mode and phylogeny on species distribution. We found that species distributional range size was significantly constrained by phylogeny. Seed mass and its intraspecific variation were also important in limiting species distribution, but their effects were different among species with different dispersal modes. Variation partitioning revealed that seed mass, seed mass variability, seed dispersal mode and phylogeny together explained 46.82 % of the variance in species range size. Although seed traits are not typically used to model the geographic distributions of seed plants, our study provides direct evidence showing seed mass, seed dispersal mode and phylogeny are important in explaining species geographic distribution. This finding underscores the necessity to include seed traits and the phylogenetic history of species in climate-based niche models for predicting the response of plant geographic distribution to climate change.
- Article
(978 KB) - Full-text XML
- BibTeX
- EndNote


Understanding the ecological and evolutionary processes that govern the geographic range of species can provide insights into the species' potential adaptive response to global climate change (Gaston and Fuller, 2009; Kubota et al., 2018). It is well known that the geographic ranges of species can span 12 orders of magnitude, and closely related species may vary enormously in their range (Brown et al., 1996). Many factors contribute to this variation, although dispersal ability and energy requirements associated with establishment and persistence in varying habitats have been considered to be the two most important ones (Morin and Chuine, 2006; Zhou et al., 2021). Given that seeds are the predominately mobile stage of sessile plants and seed mass generally reflects the amount of energy that a seed contains and its mobility (Coomes and Grubb, 2003), it seems likely that seed mass could play an important role in governing the geographic ranges of seed plants.
Seed mass can influence the colonization and competition ability of plant species along different environmental gradients (Chen et al., 2018; Bu et al., 2019). Large-seeded species more often occupy habitats that have high levels of energy (i.e., tropical or low-elevation habitats) and tend to be better competitors in these environments (Moles and Westoby, 2004), where they typically have higher germination rates (Akaffou et al., 2021) and greater seedling survivorship (Mukherjee et al., 2019). Small-seeded species, however, usually occupy low-energy habitats. They often produce a large number of seeds, allowing them to arrive in new (possibly harsher) habitats through wind dispersal (Greene and Quesada, 2005; Morin and Chuine, 2006; Sonkoly et al., 2017). Furthermore, seed mass has been shown to decrease along increasing environmental extremes, indicative of the superior colonization ability of small-seeded species in low-energy habitats compared to that of large-seeded species (Procheş et al., 2012; DeMalach et al., 2019). While some studies (e.g., Morin and Chuine, 2006; Procheş et al., 2012) indicate that species with small and light seeds tend to possess large geographic ranges, there is a need to further quantify the relationship between seed mass and distributional range size across a broader suite of species and at a wider spatial scale.
Seed traits, including seed mass, could also vary considerably within species, which may be driven by plasticity genes or even molecular signals across the genome (Nicotra et al., 2010). Therefore, intraspecific seed mass variation reflecting a species' high genetic diversity can enable adaptive response to varying environmental conditions and changing climate (Cochrane et al., 2015; Yang et al., 2016), to occupy more local habitats (Silvertown, 1989; Sides et al., 2014). Although intraspecific seed mass variation could be an important factor influencing the geographic distribution of plants, few studies have evaluated this source of variation on a regional scale.
The seed dispersal mode of a particular species, a key trait responsible for dispersal distance, can also greatly influence species geographic range (Akwood et al., 1993; Chen et al., 2019b). The seed dispersal ability of a plant species is often a tradeoff with other life-history characteristics, such as seed mass, morphologies and persistence in the soil, which in turn can affect seed germination and the survival and growth of seedlings (Nathan, 2001; Chen and Valone, 2017). However, little is known about the effect of dispersal modes on species distribution. It is also because of the tradeoff between dispersal modes and seed mass variation (Moles et al., 2007; Chen et al., 2019a) that discerning the relative importance of seed mass and dispersal for the geographic distribution of seed plants is important but elusive.
Because species from a common ancestor typically experience similar selection pressures in similar habitats, e.g., adaptive niche convergence (Losos, 2008; Grossenbacher et al., 2015), the geographic distribution of species is likely correlated in phylogenetic relationships. Furthermore, phylogenetic relatedness could also influence other ecological processes such as niche partitioning in overlapping habitats or variation in life-history traits, seed traits included, which in turn may influence the distribution range size of species (Moles et al., 2005). Therefore, a species' age or the degree of phylogenetic relatedness could invoke biogeographic limits to expansion (Martin and Husband, 2009) or promote the evolutionary divergence of species and the variation in seed traits (Donoghue et al., 2001; Moles et al., 2005). Although a species' geographic range could well be dependent on its evolutionary history (Felsenstein, 1985), few studies have included phylogeny to discern the effect of seed traits on species distribution.
In this study, we attempted to quantify the effects of seed mass, intraspecific seed mass variation, dispersal mode and phylogeny on species geographic range size. We hypothesized that species possessing small seeds with high variability in seed mass, coupled with a strong dispersal capacity, would have larger distributional range sizes than species with contrasting seed traits and, furthermore, species distribution range would be phylogenetically conserved. We collected data on seed mass and seed dispersal mode from 1426 plant species distributed mainly across China. We specifically aimed to answer two questions: (1) what are the joint effects of seed mass, seed dispersal and phylogeny on species geographic range size? And (2) are there significant phylogenetic signals associated with species geographic range size?
2.1 Seed mass data
Our dataset contains seeds of 1426 species, representing 501 genera and 122 families of seed plants. All species occur in China, of which about 30 % are endemic to China. Seeds from 2 to 136 populations for each of the species (a total of 17 223 populations) were obtained from the Germplasm Bank of Wild Species (GBOWS, http://www.genobank.org/, last access: 6 May 2022). In addition, 549 populations for 454 of the 1426 species (1 to 6 populations per species) were obtained from the Kew Gardens Seed Information Database (https://www.kew.org/kew-gardens, last access: 6 May 2022). Seeds stored in GBOWS were collected from populations within the natural distribution range of the species and dried for 1 to 6 months in a drying room where the relative humidity and temperature were maintained at 15 % and 15 ∘C, respectively. After drying, 50 seeds were randomly sampled from each population five times (sampling with replacement), and the sampled seeds were weighed to the nearest 0.1 mg each time, resulting in five weights for the population. The five weights were averaged and converted to the 1000-seed weight of the population. For each species, the 1000-seed weights across all populations were further averaged, and this “grand” average was used as the seed mass for the species. Seed mass variability (i.e., intraspecific variation in seed mass), ranging from zero to 1, was calculated for each species as the absolute difference between the maximum 1000-seed weight and the minimum 1000-seed weight across all the populations of the species divided by the maximum value, which is a common measure of plant trait variation (Valladares et al., 2000; Rozendaal et al., 2006). This measure is more suitable than the coefficient of variation (CV), which is sensitive to small changes in mean values when the mean is close to zero; and some plants in this study, such as orchids, have very small seed mass.
2.2 Species distributional range size
In this study, we estimated the distributional range size for each of the 1426 species using ArcGIS 10.2 (Esri, Redlands, CA, USA) from the global distribution of the species. Thus, the range sizes of the species were the global distribution range. Firstly, the specimen distributional information of each species was obtained from the Global Biodiversity Information Facility (GBIF, https://doi.org/10.15468/dl.umswqd), the Chinese Virtual Herbarium (http://www.cvh.ac.cn/, last access: 6 May 2022), and the Biodiversity of the Hengduan Mountains and adjacent areas of south-central China database (BHMAASCC, http://hengduan.huh.harvard.edu/fieldnotes, last access: 6 May 2022). Specimens lacking data on GPS locations, having duplication, containing incorrect coordinates, and taken from gardens and small oceanic islands were filtered out from our analysis. In addition, species that were cultivated, introduced, invasive or naturalized were also excluded from our dataset. After excluding these species records, 4 138 851 specimens of the 1426 seed plant species were obtained. Secondly, a shapefile (containing points) of each species was produced from the coordinates of the specimens. The shapefile was transformed into a raster using the world sinusoidal projection at a spatial resolution of 100 km using ArcGIS 10.2. The distributional range size of each species was calculated by multiplying the number of grids the raster contained by 10 000 km2 (100×100 km). In order to assess the impact of different spatial resolutions used in calculating species distributional range size, the raster with the spatial resolution of 50 km was also used to calculate the range size. Because the distributional range size calculated at this resolution was highly correlated with the distributional range size calculated at the resolution of 100 km (r=0.993, P<0.001; Fig. B1), we only used the distributional range size calculated at the spatial resolution of 100 km in subsequent analyses.
2.3 Dispersal modes
Based on the published literature and floras, dispersal modes were classified to autochory (self-dispersal, e.g., by explosive seed release from fruits or gravity, n=223 species), zoochory (dispersal by animals through ingestion or attachment to an animal body, n=468 species) and anemochory (dispersal by wind, n=735 species) according to the morphological features of their seeds or fruits (Pérez-Harguindeguy et al., 2013). For example, seeds or fruits with wings, hairs or pappus were considered wind dispersed (anemochory), seeds or fruits with an aril or flesh offering a succulent reward for consumers were classified as zoochory, and seeds or fruits lacking modifications pertaining to the other two categories were classed as autochory (unassisted dispersal) (Qi et al., 2014).
2.4 Construction of phylogenetic tree and statistical analyses
For all the species used in our analysis, the scientific names were checked and standardized according to The Plant List (http://www.theplantlist.org/, last access: 6 May 2022). Different varieties and subspecies of a given species were considered to belong to the same species. The phylogenetic tree was extracted from a previously published supertree using the “phylo.maker” function in the R package V.PhyloMaker (Jin and Qian, 2019), which was based on the Angiosperm Phylogeny Group classification of flowering plants (Zanne et al., 2014). The “multi2di” function in the ape package was used to randomly resolve polytomies in the phylogenetic tree. To test the phylogenetic signal in species distribution, the “phylosig” function in the R package phytools was used to calculate Pagel's λ, which ranges between 0 and 1. λ=0 means that the evolution of the trait is phylogenetically independent, and λ=1 indicates that trait evolution follows the Brownian motion. Any value of λ significantly higher than zero is regarded as having a phylogenetic signal approaching Brownian motion to a different degree (Arène et al., 2017).
Because closely related species tend to have similar traits, interspecific analyses can be compromised by phylogenetic relatedness (Felsenstein, 1985; Lynch, 1991). In our case, species range size is not phylogenetically independent. We thus used a phylogenetic generalized least-squares (PGLS) regression to determine the effects of seed mass (SM), intraspecific variation in seed mass (ISM) and dispersal mode (DM) on the distributional range size (RS) of species (Swenson, 2014). The SM × DM and ISM × DM interaction terms were also included in the PGLS model in order to show effects of SM and ISM on distributional range size among dispersal modes. The regression model was RS SM + β2ISM + β3DM + β4SM × DM + β5ISM × DM. The PGLS was implemented using the “gls” function in the nlme package, and the possible phylogenetic dependence in species range size was incorporated in the form of a phylogenetic variance–covariance matrix in gls.
We further used the “varpart” function in the vegan package to partition the variances in range size explained by seed mass, seed mass variability, dispersal mode and genus (regarded as phylogeny). Because our phylogenetic tree had some polytomies at the species level, genera were used as a surrogate in the phylogeny. Variation partitioning is a linear model which does not require explanatory variables and hence is suitable to our data structure (Borcard et al., 2018).
In the analyses of this study, the values of species range size and seed mass were loge-transformed to reduce data skewness and downplay extreme values; and the loge-transformed seed mass and seed mass variability were standardized to make their coefficients (i.e., effect size) comparable. Seed mass and seed mass variability were each standardized by subtracting the smallest value across all 1426 species and dividing by the difference between the largest value and the smallest value. All statistical analyses in this study were conducted using R4.0.2 (R Core Team, 2020).
3.1 Effects of phylogeny on species distributional range size
We detected a strong phylogenetic signal in species distributional range size for the sampled species (λ=0.627, P<0.001), with the signal being stronger in gymnosperms (λ=0.975, P<0.05) than in angiosperms (λ=0.423, P<0.001). The phylogenetically closely related species had more similar range size than did distantly related species.
3.2 Effects of seed traits on species distributional range size
The results of the phylogenetic generalized least-squares regression showed that seed mass had a negatively strong association with species distributional range size (effect size of −13.974, P<0.001; Fig. 1, Table A1), while the effect of seed mass variability on species distributional range size was not significant (effect size of 0.459, P=0.109). Dispersal mode was also significantly associated with species range size. In the PGLS model, autochorous (explosive/gravity dispersal) species was treated as the baseline dispersal mode. Compared to zoochory (dispersal by animal ingestion or attachment to an animal body) and anemochory (dispersal by wind), autochorous species had significantly larger range size after the effects of seed mass and seed mass variability were accounted for in the interaction terms between seed traits and dispersal modes (Fig. 1, Table A1). The interaction terms between seed mass/seed mass variability and dispersal mode (i.e., seed mass × anemochory, seed mass × zoochory and seed mass variability × zoochory) were significantly positive (effect size of 7.527, P<0.001; effect size of 12.637, P<0.001; effect size of 1.824, P<0.001, respectively), indicating the distributional range sizes of anemochorous and zoochorous species were strongly subject to seed mass and its intraspecific variation (Fig. 1, Table A1).
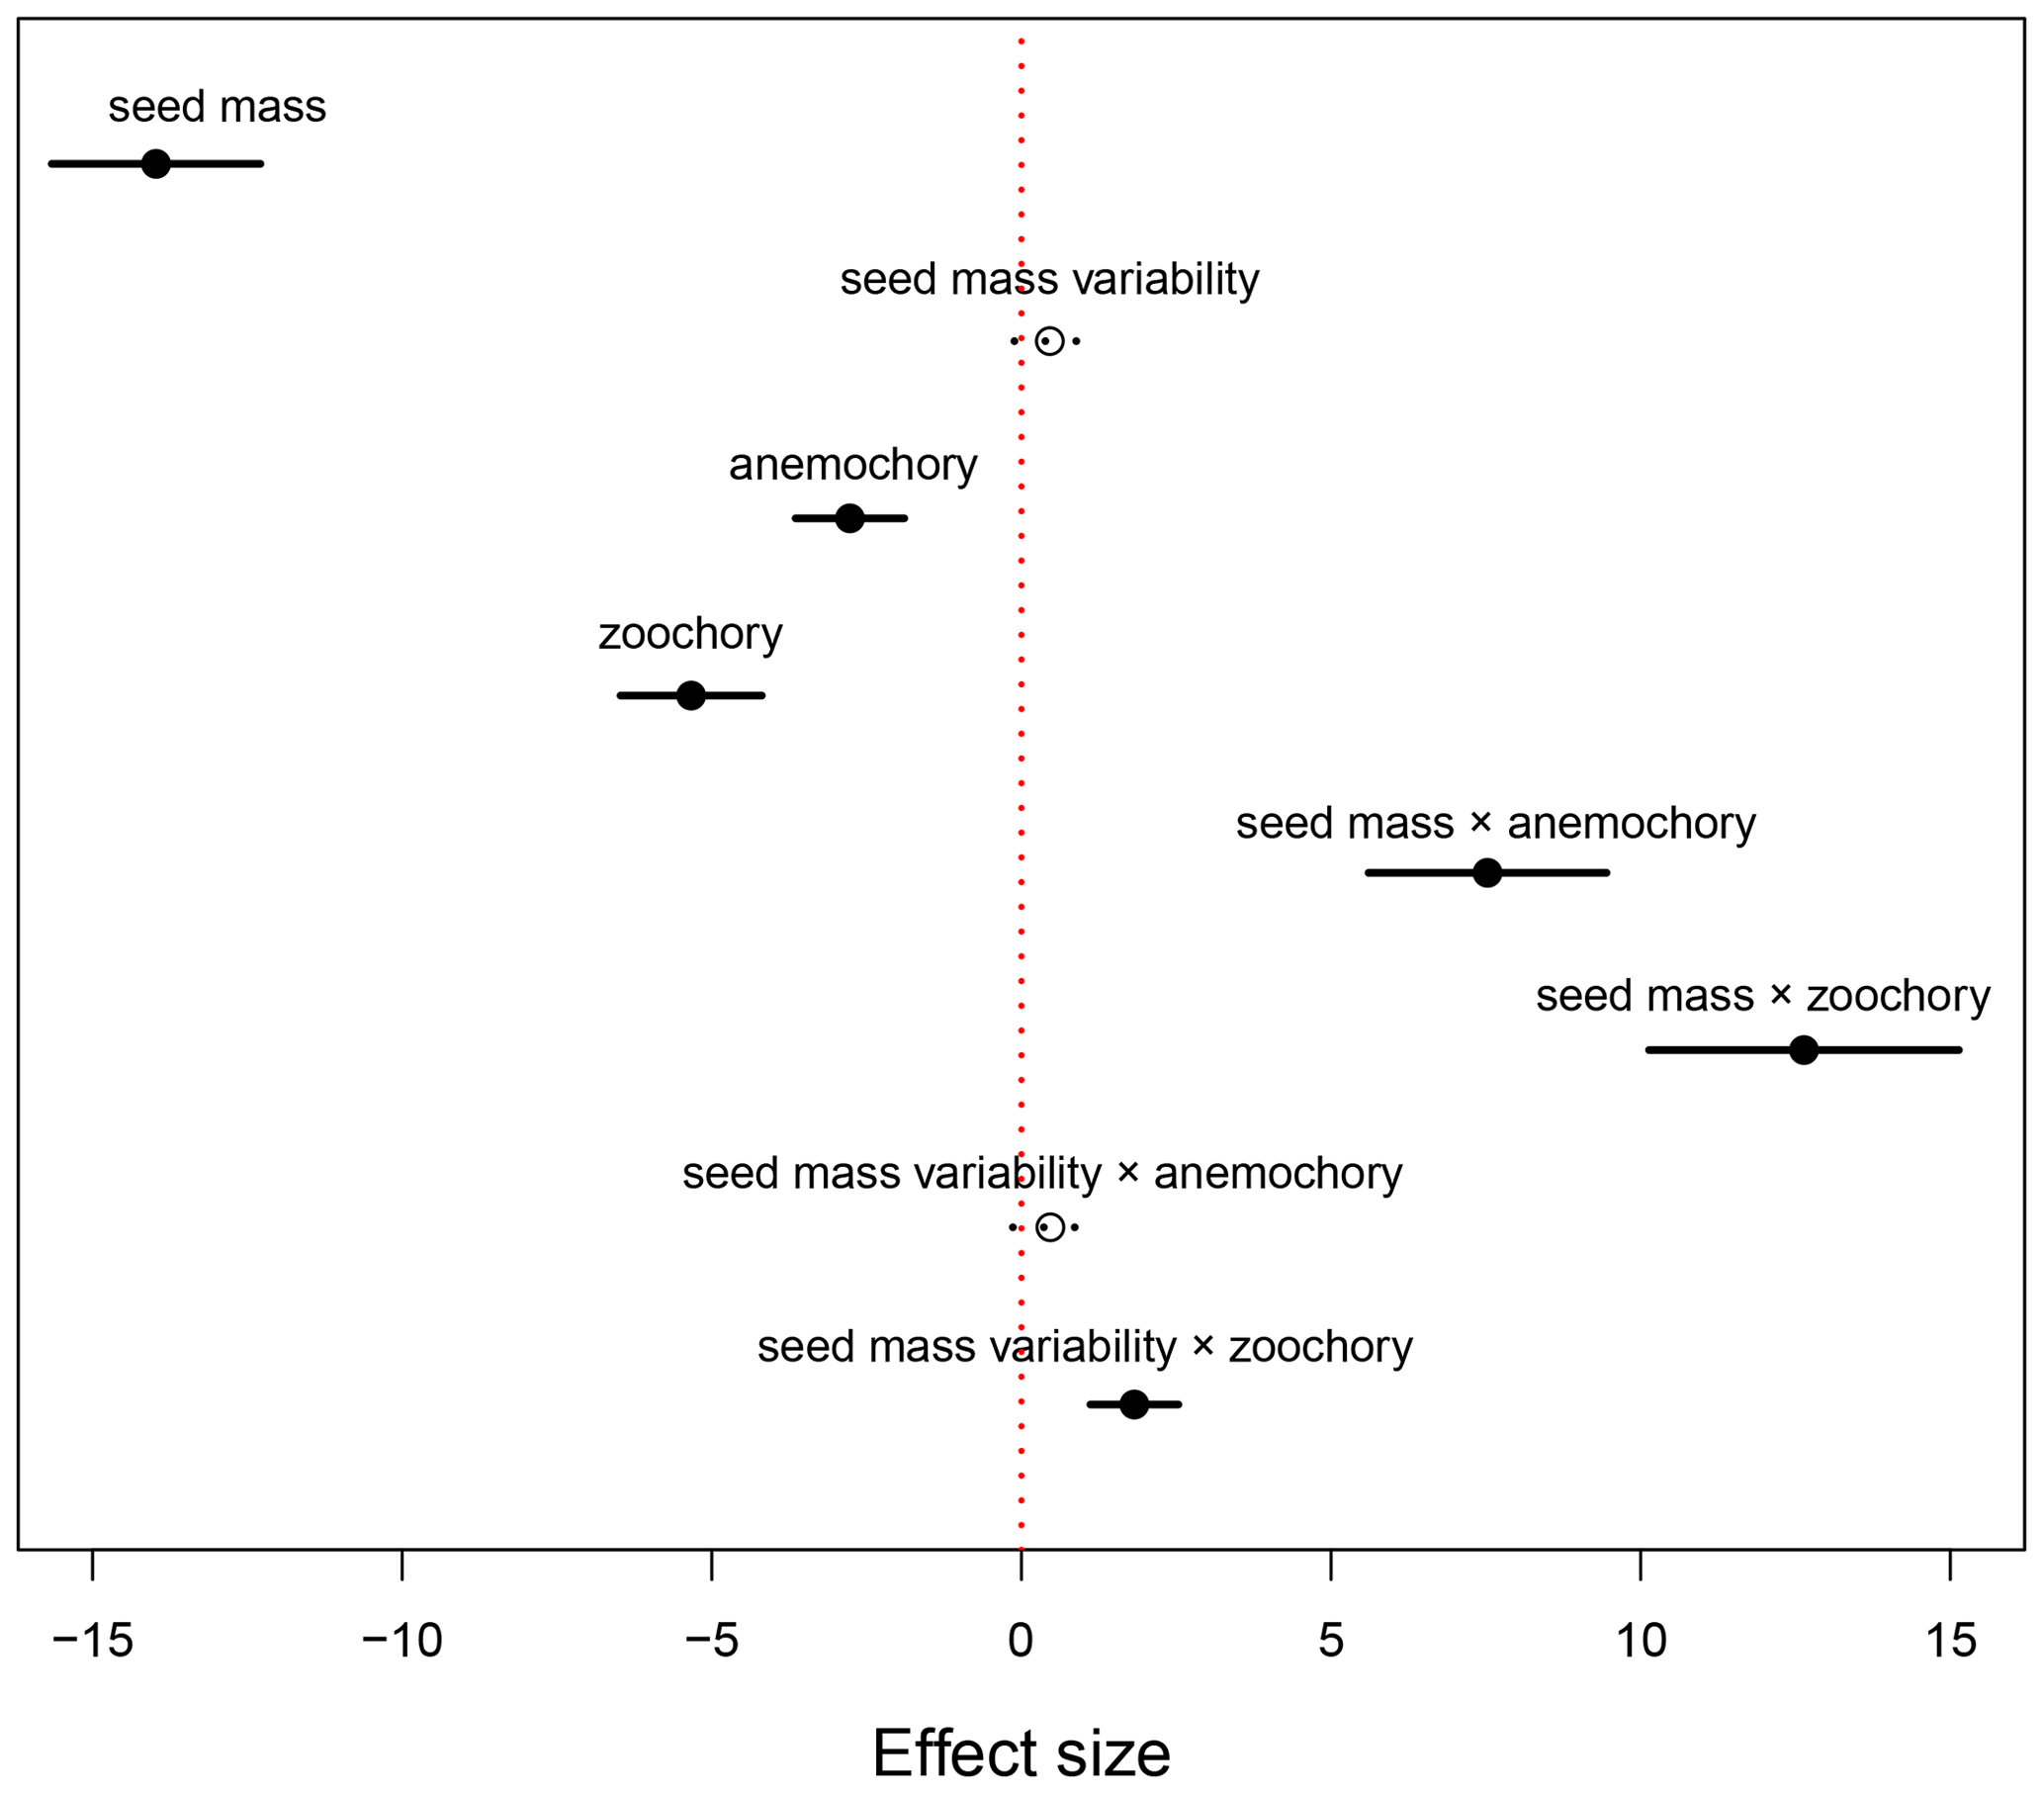
Figure 1Effects of seed mass and seed mass variability on species distributional range size in autochorous, zoochorous and anemochorous species. In the PGLS model, autochory was treated as a baseline dispersal mode. The black segments represent the effect sizes that are statistically significantly different from 0 (P<0.05), while the dotted lines with open circles indicate non-significant effect sizes.
3.3 Joint effects of seed traits and phylogeny on species range size
Variation partitioning showed that the effects of seed mass, seed mass variability, dispersal mode and phylogeny together explained 46.82 % of the variance of species range size (Fig. 2). Of the explained variation, seed mass (including mass variability) contributed a pure 11.38 % fraction and phylogeny contributed a pure 21.31 % fraction, and a small fraction came from the pure dispersal mode (0.72 %). We also noted a considerable joint effect of seed traits and phylogeny (13.41 %) on species range size (Fig. 2).
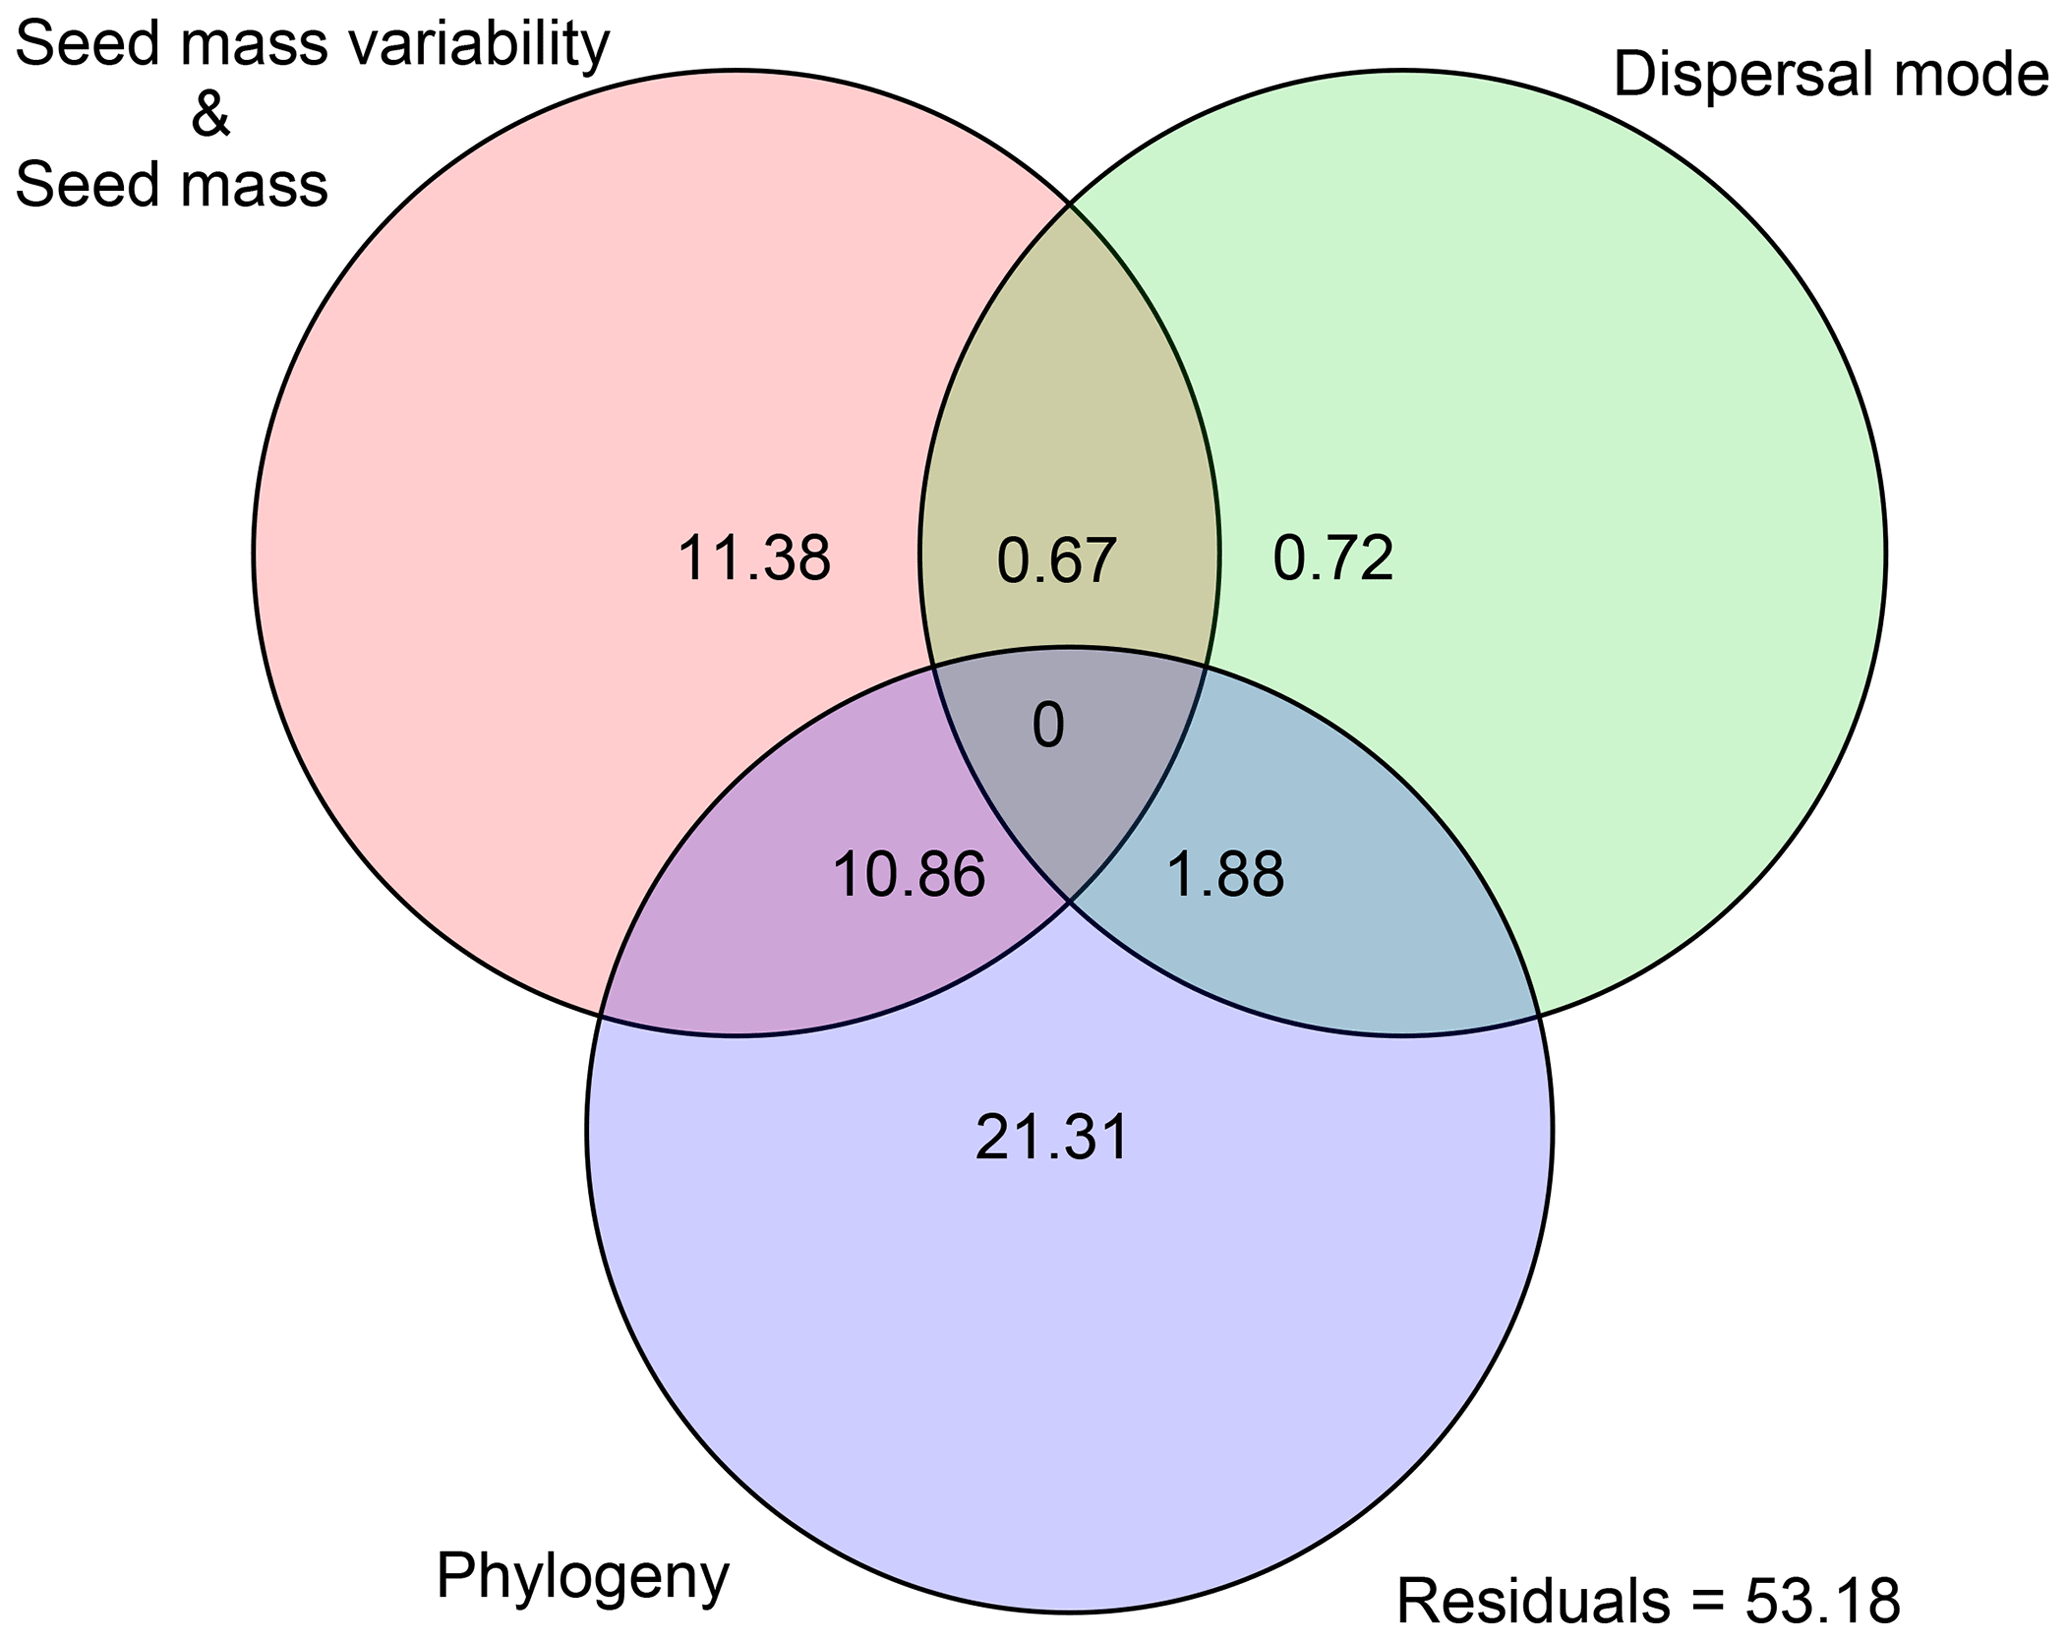
Figure 2Variation partitioning of seed mass, seed mass variability, dispersal mode and phylogeny for species distributional range size.
4.1 The relationship between phylogeny and species distributional range size
We found a significant phylogenetic signal associated with species distributional range size. This result suggests that closely related species are more similar in distribution range size than distantly related species. It corroborates some studies (e.g., Hunt et al., 2005; Martin and Husband, 2009) but does not support those of Webb and Gaston (2003), which showed the distributional range sizes of closely related species were not more similar to each other than expected by chance. This discrepancy may be due to the different evolutionary history of the studied taxa as well as the heritability of their life-history traits, which can play a critical role in the establishment and persistence of species and thus influence their distributional range sizes (Angert and Schemske, 2005; Umaña et al., 2018). It is worth noting that Webb and Gaston (2003) studied birds, which have much stronger dispersal ability than seed plants, and this may explain the difference between the two studies. Seed traits associated with range size can also change over evolutionary time, which in turn could alter the range size of a species' distribution (Blomberg et al., 2003). Furthermore, the geographic distribution range of a species can be influenced by its ecological tolerances associated with life-history traits (Geber and Griffen, 2003; Latimer and Zuckerberg, 2021). Our results imply that the geographic distribution of related plant species may have a similar response to patterns of climate change at a regional scale due, in part, to phylogenetic constraints on the distributional range of species. Here, it seems likely that closely related species have commonly evolved seed traits that result in shared adaptive strategies to climate change, although this causal mechanism requires further empirical study in the field.
4.2 Effects of seed traits on the distribution of species
We found a very strong negative relationship between seed mass and species range size, meaning larger seeds having smaller range size (Fig. 1, Table A1). This result is consistent with previous studies that also found a significant relationship between seed mass and range size (Morin and Chuine, 2006; Procheş et al., 2012). Differently from the effect of seed mass, seed mass variability had no or a weak positive association with distributional range size.
The PGLS model showed that the range sizes of zoochorous (animal-dispersed) and anemochorous (wind-dispersed) species were significantly smaller than that of autochorous (explosive/gravity dispersed) species (Fig. 1). This may appear counterintuitive at first glance but resulted after the effects of the interactions between seed mass (and mass variability) and dispersal mode were taken into account. These strong positive interaction terms (except the interaction between seed mass variability and wind dispersal) shown in Fig. 1 indicate that the range sizes of species with different dispersal modes are strongly subject to seed mass (and also mass variability). For example, zoochorous species with large seed mass and mass variability have significantly larger range size than species that have similar seed traits but are dispersed by explosive gravity. This dependence of species distributional range size on the interactions between seed mass and dispersal mode is further confirmed by a simpler PGLS model that excludes all the interactive terms between seed mass (and mass variability) and dispersal mode. The results of this model in Appendix Table A2 show that zoochorous species had significantly larger range size than autochorous and anemochorous species (P<0.001), while the latter two groups were not significantly different (P=0.257).
Although intraspecific seed mass variability did not seem to affect distributional range size of autochorous and anemochorous species, the variability was strongly positively associated with range size of zoochorous species. This may be because species with large variation in seed mass could have greater colonization ability in various habitats and seeds of zoochorous species with long dispersal distance have more chances to arrive at heterogeneous habitats than seeds of autochorous and anemochorous species. Given that small- and large-seeded species are shown to adapt to different habitats (Silvertown, 1989), it seems likely that zoochorous species may experience tradeoffs between competition ability and dispersal ability through seed mass variation (Chen et al., 2018), resulting in a similar effect for seed mass on species distributional range size at the geographic scale.
It is interesting to note that Sides et al. (2014) found that species with greater intraspecific variation in specific leaf area (SLA) have wider ecological breadth. Due to its potential role in modulating the response of plant species to environmental changes, greater intraspecific functional variability enables species to adjust to a wider range of competitive and abiotic conditions (Sides et al., 2014; Basnett and Devy, 2021). Plastic responses of seed mass to heterogeneous environments may be related to molecular signals at a single gene or across the entire genome (Nicotra et al., 2010) and thus influence the distributional range size of species (Savolainen et al., 2007). Distributional patterns of plant species may reflect the fact that individuals within a species have different levels of genetic variation in association with seed mass, thus facilitating the species to adapt to a broad spectrum of environments (Völler et al., 2012).
4.3 Effects of seed mass, seed dispersal and phylogeny on species range size
Our results show that seed traits and phylogeny jointly affect species distributional range size, indicating that species distribution may be limited by ecological and evolutionary processes (Fig. 2). There are two possible reasons for this relationship: (1) the evolution of both seed mass and dispersal mode is phylogenetically conserved (Gallagher and Leishman, 2012; Chen et al., 2018; Kang et al., 2021); and (2) seed mass and seed dispersal mode are not evolutionarily independent but are constrained by evolutionary history; e.g., phylogenetic divergence in dispersal syndrome is related to divergences in seed mass (Moles et al., 2005). However, we also need to recognize that more than 50 % of the variance in species distribution in our study remains unexplained. This result suggests that climatic tolerance, competition, colonization ability and other geographic factors could also be important for affecting species distribution (Morin and Chuine, 2006).
This study provides evidence that seed mass, intraspecific seed mass variation, seed dispersal mode and phylogeny contribute to explaining species distribution variation on the geographic scale. We found that (1) species distributional range size was significantly constrained by phylogeny, seed mass and its intraspecific variability, and seed dispersal mode; (2) the effects of seed mass and seed mass variability on species distribution varied among dispersal modes; and (3) seed mass, dispersal mode and phylogeny together explained 46.82 % of the variance associated with species distributional range size. Despite the fact that more than half of the variation in species distribution is left unexplained, our study clearly shows the importance of including seed life-history traits in modeling and predicting the impact of climate change on species distribution of seed plants.
Table A1The phylogenetic generalized least-squares regression for modeling the effects of seed mass, seed mass variability, dispersal mode, seed mass × dispersal mode and seed mass variability × dispersal mode interaction terms on species distributional range size. The graphic presentation of the results of this table is given in Fig. 1 in the main text.

Table A2The phylogenetic generalized least-squares regression for modeling the effects of seed mass, seed mass variability and dispersal mode, without interaction terms, on species distributional range size. In the model, autochory (explosive/gravity dispersal) was treated as the baseline dispersal mode. The results in the table show zoochorous species had significantly larger range size than autochorous species (P<0.001), while the range size of anemochorous (wind dispersal) species and that of autochorous species were similar (P=0.257).
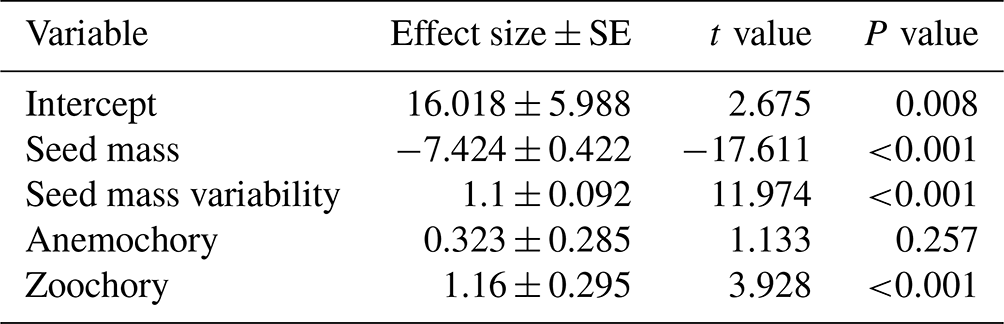
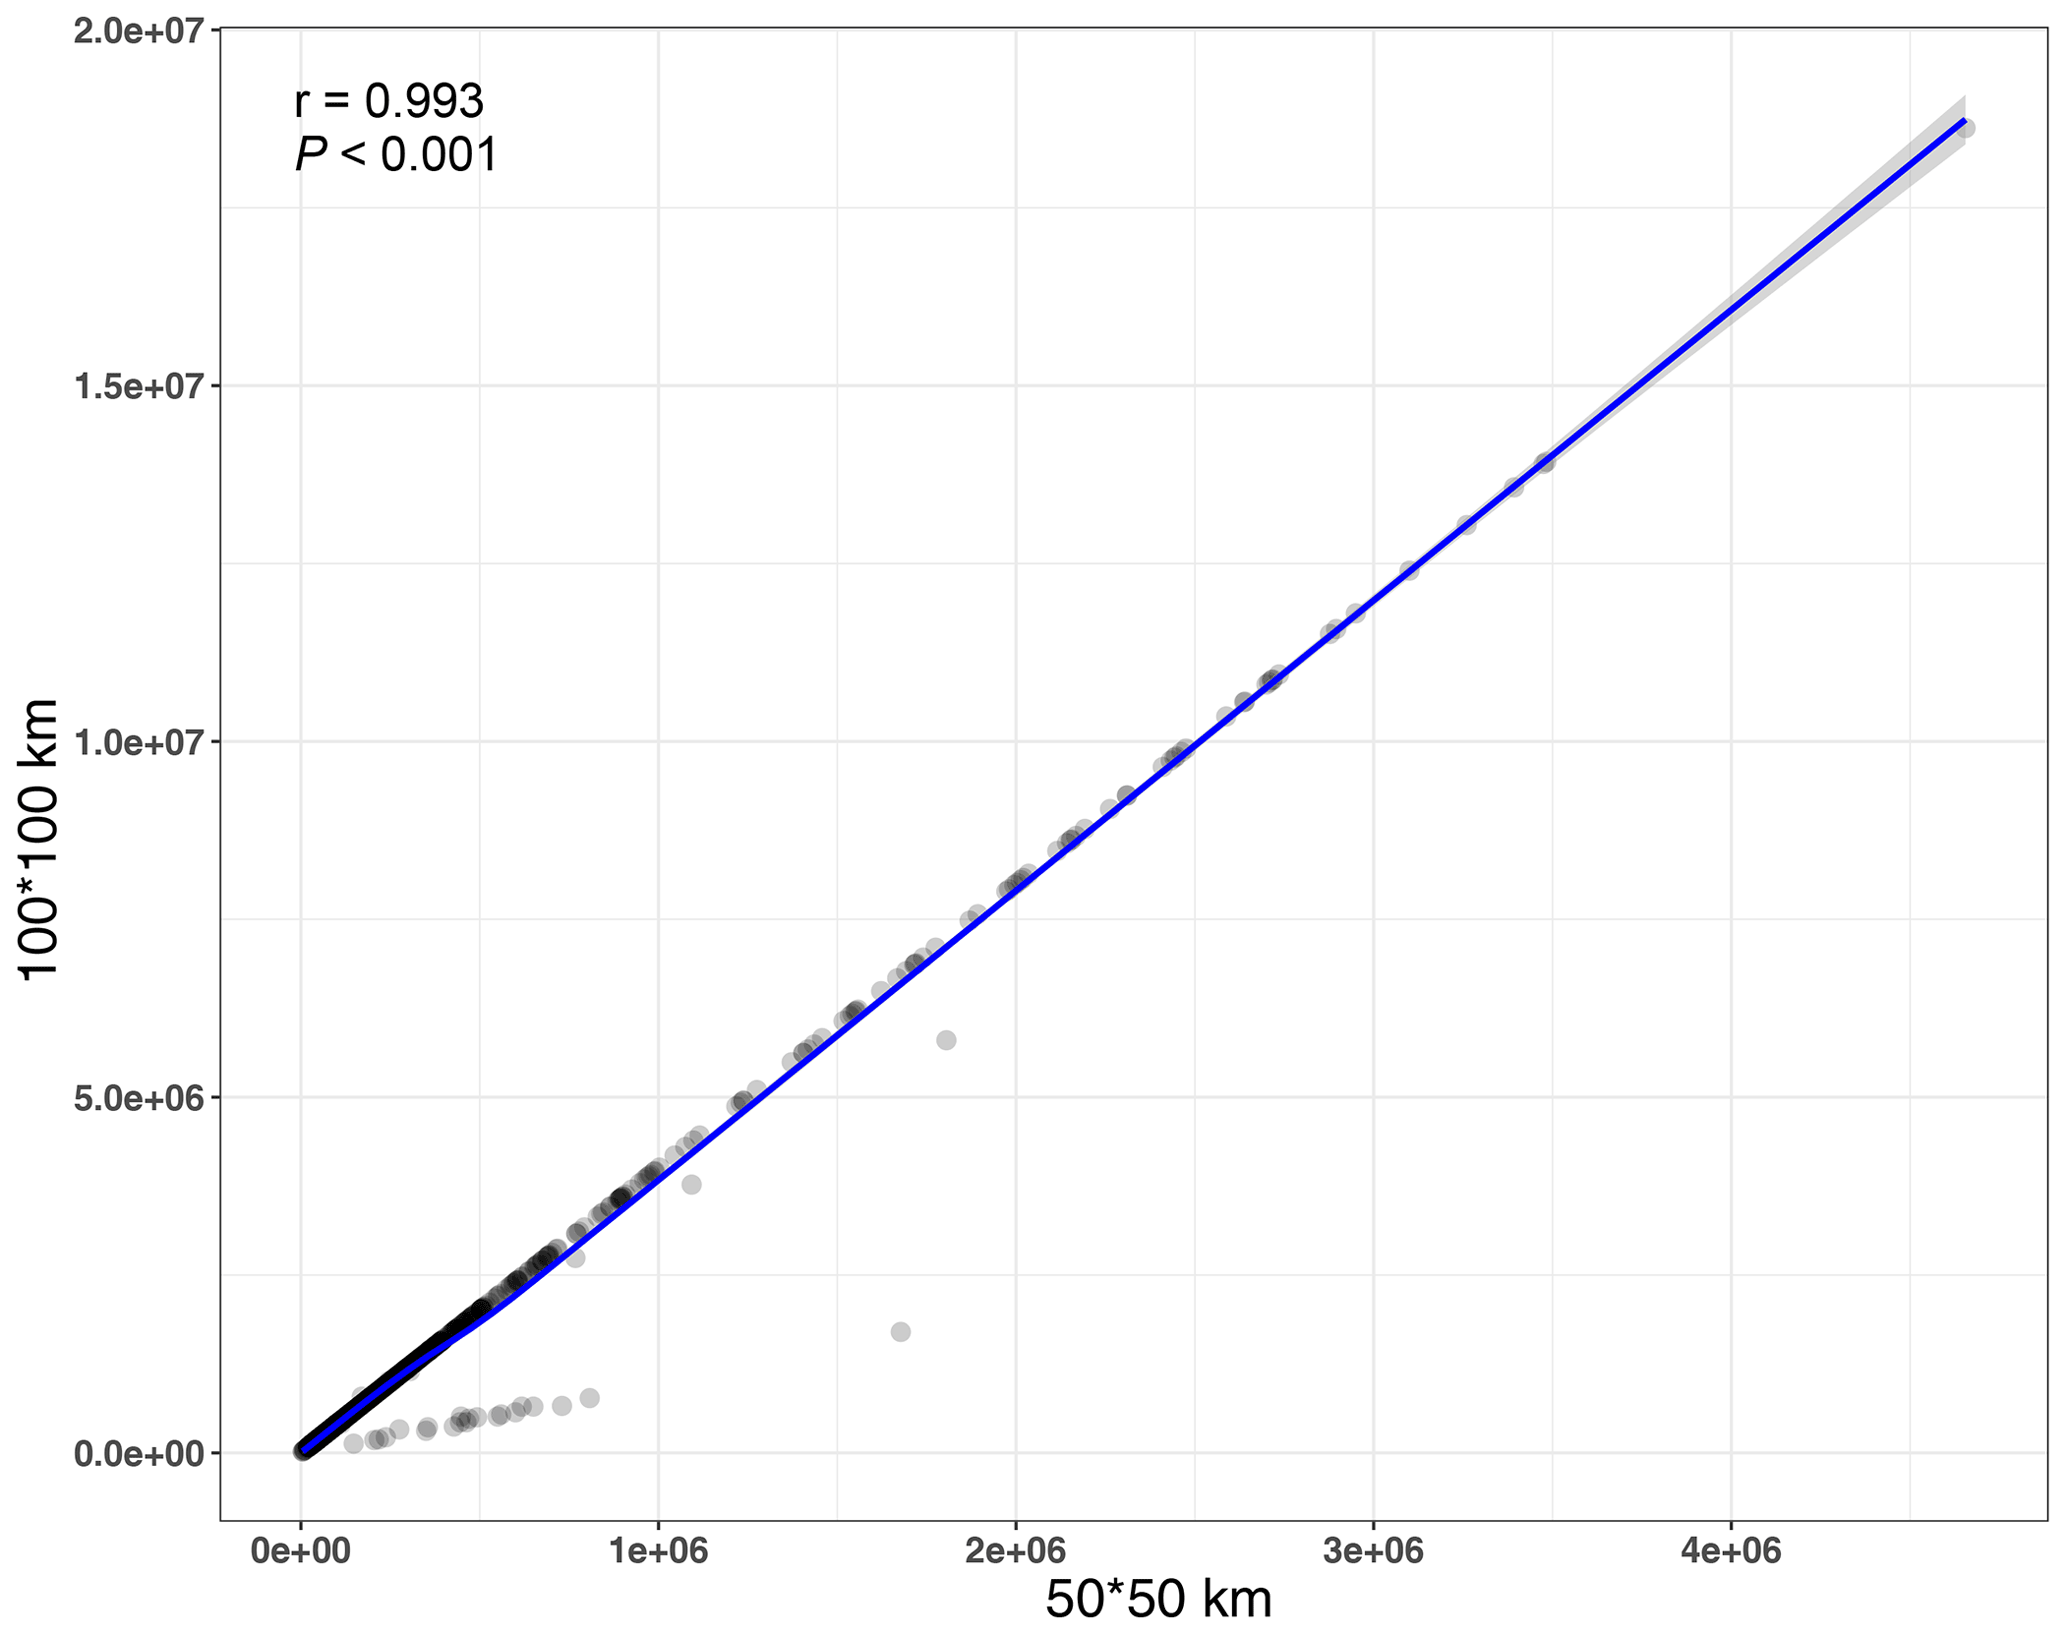
Figure B1Relationship between distributional range size calculated at the spatial resolution of 50 km and the range size calculated at the spatial resolution of 100 km.
The data are available from GBOWS (http://www.genobank.org/, last access: 6 May 2022).
DZL, LMG and FH designed the study; KC and XYY collected data; KC conducted statistical analysis and generated the graphs; KC, KSB and LMG wrote the manuscript; DZL, FH and XYY revised the manuscript. All authors reviewed and approved the final paper.
The contact author has declared that none of the authors has any competing interests.
Publisher’s note: Copernicus Publications remains neutral with regard to jurisdictional claims in published maps and institutional affiliations.
We are grateful to Xie He, Jie Cai, Ting Zhang, Jian-Jun Jin, Hua-Jie He, Tuo-Jing Li and other members of the staff of the Germplasm Bank of Wild Species for facilitating the study and providing access to the seed mass data and/or specimen collection data. We also thank Ming-Cheng Wang for helping calculate species range size.
This study was supported by the Strategic Priority Research Program of the Chinese Academy of Sciences (XDB31000000), the International Partnership Program of the Chinese Academy of Sciences (151853KYSB20190027), the National Natural Science Foundation of China (32160078) and the National Basic Research Program of China (2014CB954100).
This paper was edited by Anja Rammig and reviewed by two anonymous referees.
Akaffou, S. D., Kouame, A. K., Gore, N. B. B., Abessika, G. Y., Kouassi, H. K., Hamon, P., Sabatier, S., and Duminil, J.: Effect of the seeds provenance and treatment on the germination rate and plants growth of four forest trees species of Côte d'Ivoire, J. For. Res., 32, 161–169, https://doi.org/10.1007/s11676-019-01064-y, 2021.
Akwood, M. O., Jurado, E., Leishman, M., and Westoby, M.: Geographic ranges of plant species in relation to dispersal morphology, growth form and diaspore weight, J. Biogeogr., 20, 563–571, https://doi.org/10.2307/2845727, 1993.
Angert, A. L. and Schemske, D. W.: The evolution of species' distributions: Reciprocal transplants across the elevation ranges of Mimulus cardinalis and M. lewisii, Evolution, 59, 1671–1684, https://doi.org/10.1111/j.0014-3820.2005.tb01817.x, 2005.
Arène, F., Affre, L., Doxa, A., and Saatkamp, A.: Temperature but not moisture response of germination shows phylogenetic constraints while both interact with seed mass and lifespan, Seed Sci. Res., 27, 110–120, https://doi.org/10.1017/S0960258517000083, 2017.
Basnett, S. and Devy, S. M.: Phenology determines leaf functional traits across Rhododendron species in the Sikkim Himalaya, Alp. Botany, 131, 63–72, https://doi.org/10.1007/s00035-020-00244-5, 2021.
Blomberg, S. P., Garland Jr., T., and Ives, A. R.: Testing for phylogenetic signal in comparative data: Behavioral traits are more labile, Evolution, 57, 717–745, https://doi.org/10.1111/j.0014-3820.2003.tb00285.x, 2003.
Borcard, D., Gillet, F., and Legendre, P. (Eds.): Numerical ecology with R, New York, America, Springer New York, https://doi.org/10.1007/978-1-4419-7976-6, 2018.
Brown, J. H., Stevens, G. C., and Kaufman, D. M.: The geographic range: Size, shape, boundaries, and internal structure, Annu. Rev. Ecol. Syst., 27, 597–623, https://doi.org/10.1146/annurev.ecolsys.27.1.597, 1996.
Bu, H. Y., Zhang, Y. M., Zhao, D., Wang, S. Y., Jia, P., Qi, W., Liu, K., Xu, D. H., Ge, W. J., and Wang, X. J.: The evolutionary correlation associated with seed mass and altitude on nutrient allocation of seeds, Seed Sci. Res., 29, 38–43, https://doi.org/10.1017/S0960258518000387, 2019.
Chen, K., Burgess, K. S., Yang, X. Y., Luo, Y. H., Gao, L. M., and Li, D. Z.: Functional trade-offs and the phylogenetic dispersion of seed traits in a biodiversity hotspot of the Mountains of Southwest China, Ecol. Evol., 8, 2218–2230, https://doi.org/10.1002/ece3.3805, 2018.
Chen, S. C., Pahlevani, A. H., Malíková, L., Riina, R., Thomson, F. J., and Giladi, I.: Trade-off or coordination? Correlations between ballochorous and myrmecochorous phases of diplochory, Funct. Ecol., 33, 1469–1479, https://doi.org/10.1111/1365-2435.13353, 2019a.
Chen, S. C., Tamme, R., Thomson, F. J., and Moles, A. T.: Seeds tend to disperse further in the tropics, Ecol. Lett., 22, 954–961, https://doi.org/10.1111/ele.13255, 2019b.
Chen, T. C. and Valone, T. J.: Rodent granivory strengthens relationships between seed size and plant abundance in a desert annual community, J. Veg. Sci., 28, 808–814, https://https://doi.org/10.1111/jvs.12529, 2017.
Cochrane, A., Yates, C. J., Hoyle, G. L., and Nicotra, A. B.: Will among-population variation in seed traits improve the chance of species persistence under climate change?, Global Ecol. Biogeogr., 24, 12–24, https://doi.org/10.1111/geb.12234, 2015.
Coomes, D. A. and Grubb, P. J.: Colonization, tolerance, competition and seed-size variation within functional groups, Trends Ecol. Evol., 18, 283–291, https://doi.org/10.1016/S0169-5347(03)00072-7, 2003.
DeMalach, N., Ron, R., and Kadmon, R.: Mechanisms of seed mass variation along resource gradients, Ecol. Lett., 22, 181–189, https://doi.org/10.1111/ele.13179, 2019.
Donoghue, M. J., Bell, C. D, and Li, J. H.: Phylogenetic patterns in northern hemisphere plant geography, Int. J. Plant Sci., 162, S41–S52, https://doi.org/10.1086/323278, 2001.
Felsenstein, J.: Phylogenies and the comparative method, Am. Nat., 125, 1–15, https://doi.org/10.1086/284325, 1985.
Gallagher, R. V. and Leishman, M. R.: A global analysis of trait variation and evolution in climbing plants, J. Biogeogr., 39, 1757–1771, https://doi.org/10.1111/j.1365-2699.2012.02773.x, 2012.
Gaston, K. J. and Fuller, R. A.: The sizes of species' geographic ranges, J. Appl. Ecol., 46, 1–9, https://doi.org/10.1111/j.1365-2664.2008.01596.x, 2009.
Geber, M. A. and Griffen, L. R.: Inheritance and natural selection on functional traits, Int. J. Plant Sci., 164, S21–S42, https://doi.org/10.1086/368233, 2003.
Greene, D. F. and Quesada, M.: Seed size dispersal and aerodynamic constraints within the Bombacaceae, Am. J. Bot., 92, 998–1005, https://doi.org/10.3732/ajb.92.6.998, 2005.
Grossenbacher, D., Briscoe-Runquist, R., Goldberg, E. E., and Brandvain, Y.: Geographic range size is predicted by plant mating system, Ecol. Lett., 18, 706–713, https://doi.org/10.1111/ele.12449, 2015.
Hunt, G., Roy, K., and Jablonski, D.: Species-level heritability reaffirmed: A comment on “on the heritability of geographic range sizes”, Am. Nat., 166, 129–135, https://doi.org/10.1086/430722, 2005.
Jin, Y. and Qian, H.: V.PhyloMaker: An R package that can generate very large phylogenies for vascular plants, Ecography, 42, 1353–1359, https://doi.org/10.1111/ecog.04434, 2019.
Kang, X., Zhou, J., Abuman, Du, G., and Qi, W.: Multi-factor control of seed mass of species on the eastern part of the Qinghai-Tibetan Plateau: Integration of environmental filters, local adaptation and correlated evolution, Environ. Exp. Bot., 187, 104471, https://doi.org/10.1016/j.envexpbot.2021.104471, 2021.
Kubota, Y., Kusumoto, B., Shiono, T., and Ulrich, W.: Environmental filters shaping angiosperm tree assembly along climatic and geographic gradients, J. Veg. Sci., 29, 607–618, https://doi.org/10.1111/jvs.12648, 2018.
Latimer, C. E. and Zuckerberg, B.: Habitat loss and thermal tolerances influence the sensitivity of resident bird populations to winter weather at regional scales, J. Anim. Ecol., 90, 317–329, https://doi.org/10.1111/1365-2656.13332, 2021.
Losos, J. B.: Phylogenetic niche conservatism, phylogenetic signal and the relationship between phylogenetic relatedness and ecological similarity among species, Ecol. Lett., 11, 995–1003, https://doi.org/10.1111/j.1461-0248.2008.01229.x, 2008.
Lynch, M.: Methods for the analysis of comparative data in evolutionary biology, Evolution, 45, 1065–1080, https://doi.org/10.1111/j.1558-5646.1991.tb04375.x, 1991.
Martin, S. L. and Husband, B. C.: Influence of phylogeny and ploidy on species ranges of North American angiosperms, J. Ecol., 97, 913–922, https://doi.org/10.1111/j.1365-2745.2009.01543.x, 2009.
Moles, A. T. and Westoby, M.: Seedling survival and seed size: A synthesis of the literature, J. Ecol., 92, 372–383, https://doi.org/10.1111/j.0022-0477.2004.00884.x, 2004.
Moles, A. T., Ackerly, D. D., Webb, C. O., Tweddle, J. C., Dickie, J. B., Pitman, A. J., and Westoby, M.: Factors that shape seed mass evolution, P. Natl. Acad. Sci. USA, 102, 10540–10544, https://doi.org/10.1073/pnas.0501473102, 2005.
Moles, A. T., Ackerly, D. D., Tweddle, J. C., Dickie, J. B., Smith, R., Leishman, M. R., Mayfield, M. M., Pitman, A., Wood, J. T., and Westoby, M.: Global patterns in seed size, Global Ecol. Biogeogr., 16, 109–116, https://doi.org/10.1111/j.1466-8238.2006.00259.x, 2007.
Morin, X. and Chuine, I.: Niche breadth competitive strength and range size of tree species: A trade-off based framework to understand species distribution, Ecol. Lett., 9, 185–195, https://doi.org/10.1111/j.1461-0248.2005.00864.x, 2006.
Mukherjee, J. R., Jones, T. A., Monaco, T. A., and Adler, P. B.: Relationship between seed mass and young-seedling growth and morphology among nine blue bunch wheatgrass populations, Rangeland Ecol. Manag., 72, 283–291, https://doi.org/10.1016/j.rama.2018.11.006, 2019.
Nathan, R.: The challenges of studying dispersal, Trends Ecol. Evol., 16, 481–483, https://doi.org/10.1016/S0169-5347(01)02272-8, 2001.
Nicotra, A. B., Atkin, O. K., Bonser, S. P., Davidson, A. M., Finnegan, E. J., Mathesius, U., Poot, P., Purugganan, M. D., Richards, C. L., Valladares, F., and van Kleunen, M.: Plant phenotypic plasticity in a changing climate, Trends Plant Sci., 15, 684–692, https://doi.org/10.1016/j.tplants.2010.09.008, 2010.
Pérez-Harguindeguy, N., Díaz, S., Garnier, E., Lavorel, S., Poorter, H., Jaureguiberry, P., Bret-Harte, M. S., Cornwell, W. K., Craine, J. M., Gurvich, D. E., Urcelay, C., Veneklaas, E. J., Reich, P. B., Poorter, L., Wright, I. J., Ray, P., Enrico, L., Pausas, J. G., de Vos, A. C., Buchmann, N., Funes, G., Quétier, F., Hodgson, J. G., Thompson, K., Morgan, H. D., ter Steege, H., van der Heijden, M. G. A., Sack, L., Blonder, B., Poschlod, P., Vaieretti, M. V., Conti, G., Staver, A. C., Aquino, S., and Cornelissen, J. H. C.: New handbook for standardised measurement of plant functional traits worldwide, Aus. J. Bot., 61, 167–234, 2013.
Procheş, Ş., Wilson, J. R. U., Richardson, D. M., and Rejmánek, M.: Native and naturalized range size in Pinus: Relative importance of biogeography introduction effort and species traits, Global Ecol. Biogeogr., 21, 513–523, https://doi.org/10.1111/j.1466-8238.2011.00703.x, 2012.
Qi, W., Guo, S., Chen, X., Cornelissen, J. H. C., Bu, H., Du, G., Cui, X., Li, W., and Liu, K.: Disentangling ecological allometric and evolutionary determinants of the relationship between seed mass and elevation: Insights from multiple analyses of 1355 angiosperm species on the eastern Tibetan Plateau, Oikos, 123, 23–32, https://doi.org/10.1111/j.1600-0706.2013.00448.x, 2014.
R Core Team.: R: A language and environment for statistical computing, R Foundation for Statistical Computing, Vienna, Austria, https://www.R-project.org/ (last access: 24 August 2022), 2020.
Rozendaal, D. M. A., Hurtado, V. H., and Poorter, L.: Plasticity in leaf traits of 38 tropical tree species in response to light; relationships with light demand and adult stature, Funct. Ecol., 20, 207–216, https://doi.org/10.1111/j.1365-2435.2006.01105.x, 2006.
Savolainen, O., Pyhäjärvi, T., and Knürr, T.: Gene flow and local adaptation in trees, Annu. Rev. Ecol. Evol. S., 38, 595–619, https://doi.org/10.1146/annurev.ecolsys.38.091206.095646, 2007.
Sides, C. B., Enquist, B. J., Ebersole, J. J., Smith, M. N., Henderson, A. N., and Sloat, L. L.: Revisiting Darwin's hypothesis: Does greater intraspecific variability increase species' ecological breadth?, Am. J. Bot., 101, 56–62, https://doi.org/10.3732/ajb.1300284, 2014.
Silvertown, J.: The paradox of seed size and adaptation, Trends Ecol. Evol., 4, 24–26, https://doi.org/10.1016/0169-5347(89)90013-X, 1989.
Sonkoly, J., Deák, B., Valkó, O., Molnár V., A., Tóthmérész, B., and Török, P.: Do large-seeded herbs have a small range size? The seed mass-distribution range trade-off hypothesis, Ecol. Evol., 7, 11204–11212, https://doi.org/10.1002/ece3.3568, 2017.
Swenson, N. G. (Eds.): Functional and phylogenetic ecology in R, New York, America, Springer New York, https://doi.org/10.1007/978-1-4614-9542-0, 2014.
Umaña, M. N., Zhang, C., Cao, M., Lin, L., and Swenson, N. G.: Quantifying the role of intra-specific trait variation for allocation and organ-level traits in tropical seedling communities, J. Veg. Sci., 29, 276–284, https://doi.org/10.1111/jvs.12613, 2018.
Valladares, F., Wright, S.J., Lasso, E., Kitajima, K., and Pearcy, R. W.: Plastic phenotypic responses to light of 16 congeneric shrubs from a Panamanian rain forest, Ecology, 81, 1925–1936, https://doi.org/10.1890/0012-9658(2000)081[1925:PPRTLO]2.0.CO;2, 2000.
Völler, E., Auge, H., Prati, D., Fischer, M., Hemp, A., and Bossdorf, O.: Geographical and land-use effects on seed-mass variation in common grassland plants, Basic Appl. Ecol., 13, 395–404, https://doi.org/10.1016/j.baae.2012.06.006, 2012.
Webb, T. J. and Gaston, K. J.: On the heritability of geographic range sizes, Am. Nat., 161, 553–566, https://doi.org/10.1086/368296, 2003.
Yang, X., Huang, Z., Venable, D. L., Wang, L., Zhang, K., Baskin, J. M., Baskin, C. C., and Cornelissen, J. H. C.: Linking performance trait stability with species distribution: The case of Artemisia and its close relatives in northern China, J. Veg. Sci., 27, 123–132, https://doi.org/10.1111/jvs.12334, 2016.
Zanne, A. E., Tank, D. C., Cornwell, W. K., Eastman, J. M., Smith, S. A., FitzJohn, R. G., McGlinn, D. J., O'Meara, B. C., Moles, A. T., Reich, P. B., Royer, D. L., Soltis, D. E., Stevens, P. F., Westoby, M., Wright, I. J., Aarssen, L., Bertin, R. I., Calaminus, A., Govaerts, R., Hemmings, F., Leishman, M. R., Oleksyn, J., Soltis, P. S., Swenson, N. G., Warman, L., and Beaulieu, J. M.: Three keys to the radiation of angiosperm into freezing environments, Nature, 506, 89–92, https://doi.org/10.1038/nature12872, 2014.
Zhou, Q., Wu, J., Cui, X., Li, X., Liu, Z., Musa, A., Ma, Q., Yu, H., Liang, W., Jiang S., and Wang, Y.: Geographical distribution of the dispersal ability of alien plant species in China and its socio-climatic control factors, Sci. Rep., 11, 7187, https://doi.org/10.1038/s41598-021-85934-8, 2021.