the Creative Commons Attribution 4.0 License.
the Creative Commons Attribution 4.0 License.
 | 26 Oct 2022
Growth and actual leaf temperature modulate CO2 responsiveness of monoterpene emissions from holm oak in opposite ways
Michael Staudt
Juliane Daussy
Joseph Ingabire
Nafissa Dehimeche
Climate change can profoundly alter volatile organic compound (VOC) emissions from vegetation and thus influence climate evolution. Yet, the short- and long-term effects of elevated CO2 concentrations on emissions in interaction with temperature are not well enough understood, especially for VOCs other than isoprene. To gain additional insight, we conducted a study on holm oak, which is known for its strong foliar monoterpene emissions that are directly linked to their synthesis. We measured CO2-response curves of emissions, CO2–H2O gas exchanges and chlorophyll fluorescence at two assay temperatures (30 and 35 ∘C) on saplings of four populations grown under normal and double CO2 concentrations combined with two temperature growth regimes differing by 5 ∘C (day/night: 25/15 and 30/20 ∘C). A stepwise reduction in CO2 resulted in a decrease in emissions, occasionally preceded by an increase, with the overall decrease in emissions being greater at 35 ∘C than at 30 ∘C assay temperature. During ramping to high CO2, emissions remained mostly unchanged at 35 ∘C, whereas at 30 ∘C they often dropped, especially at the highest CO2 levels (≥ 1200 ppm). In addition to the actual leaf temperature, the high CO2 responsiveness of emissions was modulated by the plant's growth temperature with warm-grown plants being more sensitive than cool-grown plants. In contrast, growth CO2 had no significant effect on the CO2 sensitivity of emissions, although it promoted plant growth and the leaf emission factor. Correlation analyses suggest that the emission response to CO2 depended primarily on the availability of energetic cofactors produced by photosynthetic electron transport. This availability was likely limited by different processes that occurred during CO2 ramping including photooxidative stress and induction of protective and repair mechanisms as well as competition with CO2 fixation and photorespiration. In addition, feedback inhibition of photosynthesis may have played a role, especially in leaves whose emissions were inhibited only at very high CO2 levels. Overall, our results confirm an isoprene-analogous behavior of monoterpene emissions from holm oak. Emissions exhibit a non-linear response curve to CO2 similar to that currently used for isoprene emission in the MEGAN model, with no difference between major individual monoterpene species and plant chemotype. Simulations estimating the annual VOC releases from holm oak leaves at double atmospheric CO2 indicate that the observed high-CO2 inhibition is unlikely to offset the increase in emissions due to the predicted warming.
- Article
(3912 KB) - Full-text XML
-
Supplement
(1374 KB) - BibTeX
- EndNote


Terrestrial vegetation has been identified as the main source of biogenic volatile organic compounds (BVOCs). Besides their multiple biological functions, BVOCs influence several climate forcing components in the atmosphere, notably the concentrations of the greenhouse gases methane and ozone, and in pristine environments the formation of secondary organic aerosols (SOAs; Fuentes et al., 2001; Arneth et al., 2010). Aerosols can have a cooling effect on the earth climate by increasing the diffusive fraction of radiation and by changing cloud properties in the atmosphere (Zhu et al., 2019; Yli-Juuti et al., 2021). Furthermore, increased diffusive light can favor photosynthesis, possibly enhancing carbon sequestration in forest ecosystems (Ezhova et al., 2018; Rap et al., 2018). Consequently, large-scale alteration of BVOC emissions due to global change could feed back into future climate evolution (Scott et al., 2018; Sporre et al., 2019). Yet, the interacting effects of climate change factors on emissions are currently not well enough understood. Among these, increasing atmospheric concentrations of carbon dioxide [CO2] and temperature are major factors with no or relatively weak regional differences compared to other factors such as precipitation.
Globally, volatile isoprenoids constitute the largest fraction of BVOCs (Guenther et al., 2012). Isoprene alone accounts for about half and is produced at high rates in the photosynthesizing tissues of about 30 % of vascular plant species with a higher presence in woody species than in herbs (Monson et al., 2012; Fineschi et al., 2013; Sharkey et al., 2013; Dani et al., 2014a). Accordingly, most studies have focused on isoprene emissions (for recent reviews see Sharkey and Monson, 2014; Lantz et al., 2019a; Monson et al., 2021). Isoprene is synthesized in chloroplasts from dimethylallyl diphosphate (DMADP) by isoprene synthase, an enzyme with relatively low affinity for its substrate (Lehning et al., 1999; Sharkey et al., 2013). Isoprene synthesis and emissions are strongly regulated by temperature and light, which are mainly related to changes in the pool size of DMADP. DMADP is built in the chloroplastic methyl-D-erythritol 4-phosphate (MEP) pathway from the C3 substrates glyceraldehyde 3-phosphate (triose phosphate) and pyruvate, plus reduction power (NADPH or equivalents) and phosphorylation power (ATP or equivalents) as energetic cofactors. Glyceraldehyde 3-phosphate and energetic cofactors come directly from ongoing photosynthesis, while a large fraction of pyruvate is formed from phosphoenolpyruvate (PEP), which is imported from the cytosol in exchange for inorganic phosphate (Pi) and thus can stem from “older” carbon sources (Lantz et al., 2019a, and references therein). Regarding CO2 effects, many studies have observed that isoprene emissions decrease rapidly at high [CO2] (e.g., Monson and Fall, 1989; Loreto and Sharkey, 1990; Monson et al., 1991; Rasulov et al., 2009; Wilkinson et al., 2009; Possell and Hewitt, 2011; Morfopoulos et al., 2014), potentially counteracting the expected increase in emissions from rising temperatures and CO2 fertilization acting on plant growth in a future warmer, high-CO2 world (Pacifico et al., 2012; Bauwens et al., 2018). This CO2 responsiveness however can be variable from one species to another (e.g., Sharkey et al., 1991; Lantz et al., 2019b; Niinemets et al., 2021) and be modulated by the atmospheric CO2 regimes in which the plants were grown or acclimated (e.g., Wilkinson et al., 2009; Possell and Hewitt, 2011; Sun et al., 2013). Further, it depends on the actual leaf temperature; high temperatures generally suppress the high-CO2 sensitivity of isoprene emissions (e.g., Affek and Yakir, 2002; Rasulov et al., 2010; Sun et al., 2013; Potosnak et al., 2014; Dani et al., 2014b; Monson et al., 2016).
Monoterpenes (MTs) are less emitted globally (<15 %; Guenther et al., 2012). However, in some vegetation types such as boreal, temperate mountainous and Mediterranean forests, MTs can largely dominate the total BVOC release (e.g., Rantala et al., 2015; Seco et al., 2017; Tani and Mochizuki, 2021, and references therein), and due to their bigger size and high reactivity, these emissions might be particularly relevant for local and regional SOA formation (Jokinen et al., 2015; Zhang et al., 2018; McFiggans et al., 2019). MTs are essentially produced in the same pathway as isoprene (but see Pazouki and Niinemets, 2016, for exceptions). However, the responses of MT emissions to elevated [CO2] are less understood and show more contrasting results ranging from no effect to increases and decreases (Arneth et al., 2008; Peñuelas and Staudt, 2010; Feng et al., 2019; Daussy and Staudt, 2020). There are several reasons why MT emissions may behave differently than isoprene. First, in many plants MTs are synthesized outside photosynthetic source tissues in glandular organs (trichomes, resin ducts), where they can be accumulated in high concentrations (e.g., Huang et al., 2018; Dehimeche et al., 2021). As a result, emission rates vary independently from their biosynthesis rates, which, furthermore, are less coupled to ongoing photosynthesis due to additional regulatory processes associated with the partitioning and transport of photosynthates. Second, the biosynthesis of MTs involves at least two other enzymes (i.e., one MT synthase and one geranyl diphosphate synthase) whose in planta catalytic rates may be less substrate regulated than isoprene due to their high substrate affinities (Harrison et al., 2013; Rasulov et al., 2014, and references therein). In addition, MT emitters typically produce several MTs formed by several MT synthases, thus introducing further complexity in their responses to [CO2].
One of the best-studied MT emitter is the Mediterranean evergreen oak Quercus ilex L. (QI, holm oak). Its strong MT emissions are highly analogous to isoprene in terms of quantity and responses to environmental factors (Loreto et al., 1996a; Staudt and Bertin, 1998). Regarding CO2 effects on emissions, two studies have reported that emissions become significantly inhibited at high [CO2] but not at moderately increased [CO2] (Loreto et al., 1996b; Staudt et al., 2001). Yet, Loreto et al. (2001) compared emissions from QI trees growing in open top chambers with normal and double [CO2] and concluded that 700 ppm [CO2] significantly inhibits the emissions of some of the major MTs while enhancing others. However, because in that study emissions at different CO2 levels were determined on different trees, the seeming compound specificity could be confounded with the chemotype of the tree, a possible misinterpretation mentioned by the authors. Later, Rapparini et al. (2004) investigated emissions from QI trees growing near natural CO2 springs. Switching from 350 to 1000 ppm [CO2] reduced all emissions in the control site but not in the elevated CO2 site. They also found unexplained seasonal differences in CO2 responsiveness possibly associated with water stress. Long-term, seasonal CO2 effects were also reported by Staudt et al. (2001), who observed that the emission factor (EF, i.e., the foliar emission rate under standard temperature, light and [CO2]) of elevated-CO2-grown plants was significantly increased during the winter season but not during the warm season. Thus, while previous studies provide evidence that MT emissions from QI can be inhibited by elevated [CO2], the exact CO2 response, its compound specificity, and its dependence on actual temperature and growth conditions are unclear or not known. To gain additional insight, we conducted a study in which we measured CO2-response curves of foliar MT emissions, CO2–H2O gas exchanges and chlorophyll fluorescence at two assay temperatures on four QI populations that were grown under two [CO2] levels in combination with two temperature regimes. In particular, we addressed the following questions: do MT emissions respond to low and/or high [CO2], and how are these responses related to the leaf emission factor and primary metabolism? Does the CO2 responsiveness differ between individual MT compounds? Is the CO2 responsiveness affected by the actual leaf temperature? Do seedlings grown under warmer and/or higher-CO2 regimes differ in their leaf emission factors and/or responsiveness to CO2? Are the observed effects relevant for estimating MT emissions in a future warmer and CO2-enriched world?
2.1 Plants and growth conditions
QI acorns were sampled in fall from various adult trees growing around Montpellier. They were stored in boxes with humidified paper tissues in a cold chamber at 5 ∘C, where they started to germinate during winter and early spring. The germinating acorns were subsequently potted in PVC pipes (diameter 16, height 100 cm) containing a mix of sand, clay and peat and were immediately transferred into four identical, controlled-environment greenhouse compartments. Temperature regimes and atmospheric [CO2] of the compartments were set to 400 ppm CO2 and 15/25 ∘C night/day temperature (denoted 400/20), 800 ppm CO2 and 15/25 ∘C (denoted 800/20), 400 ppm CO2 and 20/30 ∘C (denoted 400/25), and 800 ppm CO2 and 20/30 ∘C (denoted 800/25). Currently in the Montpellier region, a temperature range of 15–25 ∘C is common in late spring when new leaf growth is at its peak, whereas 20–30 ∘C is typical of the summer (see Table S1 in Supplement 1). However, in a future atmosphere with 800 ppm [CO2], such high temperatures are expected to occur more frequently outside the summer season especially in the Mediterranean, where climate warming proceeds faster than the global average (Seneviratne et al., 2016). Plants were grown in these compartments under the same temperature and CO2 regimes for 4–5 months until measurements started. The greenhouse facility of our institute consists of eight serial compartments in an approximately east–west direction with the southern facades exposed to a large open field (grassland). To avoid any edge effect and uneven light exposure, the four inner compartments were used for the experiment. In addition, plants were regularly moved within the greenhouse compartments as well as between greenhouse compartments after having interchanged the growth temperature and CO2 regimes.
2.2 CO2-response curve measurements
Leaf MT emissions (E), CO2–H2O gas exchange and chlorophyll fluorescence were measured using two LI-6400 portable photosynthesis systems (LI-COR Biosciences, Lincoln, NE, USA). The large majority of measurements were made with the small 2 cm2 LI-6400-40 leaf chamber equipped with a blue–red LED light source and an integrated chlorophyll fluorometer. At the beginning of the experiment, a few additional measurements were conducted with a 6 cm2 broadleaf chamber equipped with an LED source but without a fluorometer. For measuring the CO2 response of volatile organic compound (VOC) emission, a mature, healthy leaf of a sapling was gently clamped into the chamber and subsequently exposed to seven [CO2] levels in the following order: 400, 200, 100, 800, 1200, 1600 and 2000 ppm. The flow rate of air was set at 300 µmol s−1 (ca. 450 mL min−1), the photosynthetic photon flux density (PPFD) at 1000 µmol m−2 s−1 (10 % blue, 90 % red LEDs), and the chamber block temperature at either 30 or 35 ∘C. Leaves were acclimatized at every [CO2] level for at least 30 min before starting data recording and VOC sampling. We applied a relatively long waiting period compared to analog studies on isoprene (e.g., Monson et al., 2016; Lantz et al., 2019b) because MT emissions need longer to come to a new steady state due to their lower volatility (Niinemets et al., 2002a; Staudt et al., 2003). BVOCs were sampled with a programmable air sampler (Gilian GilAir Plus, Sensidyne, LP, USA) passing 2.4 L of chamber air at 150 mL min−1 through adsorption cartridges packed with about 180 mg Tenax TA and 130 mg Carbotrap B. The chamber air was taken from the air hose connecting the chamber and match valve via a three-way Teflon valve (BOLA, Bohlender GmbH, Germany). CO2–H2O gas exchange and chlorophyll fluorescence data were recorded before and after VOC sampling surveying each time that gas exchange was stable. The mean values of both records were used for further data evaluation. All photosynthetic variables (net CO2 assimilation (A), transpiration, conductance to water vapor (G), substomatal [CO2] (Ci)) were calculated by LI-COR software including corrections for diffusion leaks as recommended for small leaf chambers. On a few occasions when the 6 cm2 leaf chamber was used, the enclosed leaf did not completely cover the chamber surface. In this case, we measured the projected surface area of the enclosed leaf part and recalculated the gas exchange variables accordingly.
The integrated leaf chamber fluorimeter determined the actual quantum efficiency of photosystem II (PSII) electron transport in the light (ΦPSII) by measuring first the steady-state fluorescence (Fs) of the light-adapted leaf and then the maximum fluorescence () by applying a saturating light pulse of ca. 10 000 µmol m−2 s−1 PPFD (ΦPSII = () ) (Murchie and Lawson, 2013). ΦPSII is proportional to the flow of electrons in PSII (electron transport rate, ETR), which was calculated by multiplying ΦPSII with PPFD assuming that 87 % of the incident PPFD was absorbed by QI leaves, of which half is attributed to PSII (i.e., ETR =ΦPSII × PPFD × 0.87 × 0.5). It should be noted that these correction factors may have somewhat varied among individual leaves and measurements, for example due to differences in the leaf structure and light acclimation (Laisk and Loreto, 1996; Niinemets et al., 2006; McClain and Sharkey, 2019). However, leaf-to-leaf variation in calculated ETRs was not related to leaf structural variables (leaf dry mass per leaf area (LMA), chlorophyll concentration (R2<0.1, P>0.15)). In addition to measurements under light, foliar dark respiration and maximum quantum efficiency of PSII photochemistry (Fv Fm) were measured at the beginning and at the end of CO2 ramping after having leaves adapted to dark conditions and 400 ppm [CO2] for 30 min. Fv Fm is given as (Fm−Fo) , where Fo and Fm are the steady-state and maximum fluorescence of the dark-adapted leaf, respectively. Fm and data were further used to calculate the non-photochemical quenching (NPQ) as () . NPQ reflects the fraction of absorbed light energy dissipated as heat from PSII. NPQ reflects protective mechanisms against the absorption of excessive light energy, which otherwise leads to photodamage, as evidenced by a decrease in Fv Fm. Photodamage is caused by the over-reduction of PSII along with the formation of reactive oxygen species (ROS; mainly singlet oxygen, superoxide, hydroxyl radicals and hydrogen peroxide; Asada, 2006). NPQ processes are regulated by the acidification of the chloroplast thylakoid lumen leading to the activation of the integral membrane protein PsbS and the xanthophyll cycle, both triggering conformational changes in the PSII antenna (Ruban, 2016).
Other derived variables considered in the data evaluation were the ETR A, E A and E ETR ratios. ETR A is the quantity of electrons per net-assimilated CO2. Variation in ETR A reflects the excess of photochemical energy produced via PSII not used for CO2 reduction in the Calvin–Benson–Bassham (CBB) cycle and hence the amount of NADPH and ATP available for other metabolic pathways inside chloroplasts such as photorespiration, starch synthesis, nitrite reduction, Mehler reaction (oxygen reduction), the xanthophyll cycle and isoprenoid biosynthesis. Under physiologically normal conditions, about half of the ETR is used for CO2 reduction (Dani et al., 2014b), with about 4 to 5 mol of electrons required per assimilated mole of CO2. The E A and E ETR ratios are the percentage losses of assimilated carbon (C-loss) and PSII photosynthetic electron transport (e−-loss) by MT emissions, respectively, assuming that 1 mol of emitted MT consumes 10 mol of assimilated carbon and 56 mol of electrons (28 mol NADPH or equivalents and two electrons per NADPH; Niinemets et al., 2002b).
All response curves were run in the greenhouse compartments. The air for the LI-COR instrument was always taken from outside the greenhouse and filtered with charcoal to minimize [CO2] fluctuations and contamination with ambient VOC. The response curves at 30 and 35 ∘C were always measured on different mature leaves of a given sapling. Due to logistic constraints, the number of replicates per growth treatment varied between five and eight at 30 ∘C and between four and six at 35 ∘C assay temperature (in total 26 CO2-response curves at 30 ∘C and 20 CO2-response curves at 35 ∘C on 26 saplings). We favored running more replicates at 30 ∘C than at 35 ∘C due to the stronger and more variable CO2 responses at this assay temperature. The measurement of a CO2-response curve took about 6 h and was usually carried out between 10:00 and 16:00 CEST (UTC+2). In order to check whether BVOC emissions from QI leaves changed during the day independently of external factors, we repeatedly measured emissions from QI leaves in the same time frame under constant assay [CO2], temperature or PPFD conditions.
Additional ancillary measurements were made after each experiment: relative chlorophyll contents of the measurement leaves were assessed using a SPAD-502 instrument (Konica Minolta, Inc., Japan). SPAD data were converted to foliar chlorophyll concentration ([Chloro]) based on the calibration realized in a previous study on QI seedlings (Staudt et al., 2017). Further, the projected leaf area was determined by means of a scanner plus image software (Epson Perfection V800; Image J5 software, National Institutes of Health, Bethesda, MD, USA) and dry weights on a microbalance after oven-drying at 60 ∘C for 48 h. Plant growth was assessed by measuring the number of leaves and ramifications and total plant height.
2.3 BVOC analyses
Adsorption cartridges were analyzed using a gas chromatograph coupled with a mass spectrometer (GC-MS): a Shimadzu QP2010 Plus equipped with a Shimadzu TD-20 thermodesorber (Shimadzu, Kyoto, Japan). Prior to analysis, cartridges were purged for 1 min with dry N2 at room temperature to remove excess water. BVOCs were thermally desorbed from cartridges at 250 ∘C in a 30 mL min−1 He flow for 10 min on a cold trap filled with Tenax TA and maintained at −10 ∘C. The focused VOCs were then thermally injected into the GC column with a split ratio of 4 by flash heating the cold trap to 240 ∘C for 5 min. BVOCs were separated on a DB-5 column (30 m × 0.25 mm, 0.25 µm film thickness) with helium as a carrier gas (constant flow 1 mL min−1) using the following oven temperature program: 2 min at 40 ∘C, 5 ∘C min−1 to 200 ∘C and 10 ∘C min−1 to 270 ∘C held for 6 min. Eluting BVOCs were identified by comparison of mass spectra and arithmetic retention indices with commercial databases (NIST, Wiley, Adams) as well as with commercial pure standards (Fluka, Sigma-Aldrich) dissolved in methanol to achieve realistic concentrations. Liquid standards stepwise dissolved in methanol were also used to calibrate the GC-MS system. The present study was focused on the five predominantly emitted MTs, which were α-pinene, sabinene, β-pinene, myrcene and limonene. The emission rates were calculated by multiplying the chamber net BVOC concentration (i.e., the chamber BVOC concentration with the plant minus the BVOC concentration of the empty chamber) with the chamber flow rate divided by the enclosed leaf area, which in most cases was equal to the chamber area (see above). The empty chamber was measured either before or after CO2 ramping. The emission rates per leaf dry weight were calculated using the LMA of the measured leaf.
2.4 Data treatments and statistical tests
During CO2 ramping, stomatal conductance and transpiration frequently increased at low CO2 and diminished at high CO2. As a result, leaf temperature slightly changed during CO2 ramping, sometimes by as much as 1 ∘C owing to changes in evaporative cooling of the leaf by transpiration. To avoid that potential CO2 effects on emissions were biased by leaf temperature changes, we normalized the emissions rate to the same standard temperature of 30 ∘C using the temperature algorithm for light-dependent isoprenoid emission (Guenther et al., 1993) with coefficients adjusted for QI emissions according to Staudt and Bertin (1998). The 30 ∘C normalized emission rate measured on a leaf at the beginning of the CO2 ramping at 400 ppm [CO2] and 1000 µmol m−2 s−1 PPFD is hereafter referred to as the emission factor (EF).
To examine the relative changes in BVOC emissions and photosynthetic variables in response to CO2 ramping, the data of each CO2-response curve were normalized in two ways: (i) by dividing the individual values of a measurement series by the mean of the series () and (ii) by dividing the individual values of a measurement series by the initial value, i.e., the measurement made at 400 ppm [CO2] (). The first normalization is relatively insensitive to outliers and served to assess and illustrate the overall CO2 responsiveness of a measured variable. However, it is less suitable to differentiate the responsiveness to low CO2 from that to high CO2 because the response of one will affect the relative response of the other (see also Fig. S1 in Supplement 2 for an illustration of the potential biases generated by this data normalization). Hence, the second normalization was specifically used to analyze separately the responsiveness to low CO2 (two measurements at [CO2] <400 ppm) and to high CO2 (four measurements at [CO2] >400 ppm) of a measured variable. To describe the global responsiveness of a variable to low and high CO2, we used the mean values of the individual 400-CO2-normalized data measured in a response curve below 400 ppm CO2 (, n=2) and above 400 ppm CO2 (, n=4), respectively. The relative change in Fv Fm and dark respiration (R) was expressed as the difference between the value before and after CO2 ramping divided by its initial value (e.g., δFv Fm = (Fv Fm ini − Fv Fm end) Fv ).
The individual 400-CO2-normalized emission rates () were fitted to the algorithm described in Wilkinson et al. (2009) that is used in the MEGAN model (Guenther et al., 2012) to account for the CO2 response of isoprene emissions:
where CCi is the CO2 activity factor; Ci is the leaf-internal CO2 concentration; and Emax, C* and h are empirical coefficients. The algorithm simulates an inverse sigmoidal relationship between emissions and Ci, where CCI scales the emission rate at standard [CO2] (400 ppm) to the progressive inhibitory effects of increasing Ci.
The influence of growth conditions were assessed using analysis of variance (ANOVA) on each data set of the two assay temperatures after having tested for normality (Shapiro–Wilk test) and equal variance (Levene test). If tests failed, the non-parametric Kruskal–Wallis test was applied. Post hoc Tukey honestly significant difference (HSD) and Dunn tests were used for pairwise comparison. The influence of assay temperature on pooled data of growth conditions was examined using the Student or Mann–Whitney rank sum test. Paired Student tests or Wilcoxon signed-rank tests were used to compare data of two assays of [CO2] (400 vs. 800 ppm) measured during CO2 ramping on the same leaf. The differences between groups of measured variables were considered to be significant at the level α=0.05. Pearson correlation analyses were performed in order to test the degree of linear relationships among variables. Consistency of correlations (linearity, outliers) was visually checked by scatterplots. In general, the data distributions seen on scatterplots provided no clear evidence for non-linear relationships with one exception: the relation between G400 and A400 was slightly curved at the highest values. All statistical analyses were performed with the Addinsoft (2021) XLSTAT statistical and data analysis solution except the non-linear regression analyses (curve fitting), which were carried out with SigmaStat 2.0 (Jandel Scientific Software).
3.1 BVOC emission pattern and chemotypes
Foliar VOC emissions of all oak saplings were mainly composed of five MTs – α-pinene, sabinene, β-pinene, myrcene and limonene – accounting for 95 ± 5 %. The remainder were composed of α-thujene, camphene, 1,8-cineol and β-ocimene. Individual trees released the five major MTs in different proportions, roughly according to two types of emission profile: about two-thirds of the trees (17 of 26) produced α-pinene, β-pinene and sabinene in high proportions (60 %–90 %), while one-third (9 of 26) produced high proportions of limonene and myrcene (60 %–90 %). All replicate measurements made on the same or a different leaf of individual trees showed that the relative proportions of these five VOCs were not different between leaves and not influenced by assay temperature or [CO2] and hence tree specific (chemotype) (Fig. S2 in Supplement 1). Apart from the emission composition, there was no apparent difference between the two chemotypes in any of the measured variables including the total VOC emission rate and responses to CO2 (Figs. S3 and S4 in Supplement 1). These observations allowed us to restrict our data analyses on the sum of the major compounds.
3.2 Intraspecific variability in the emission factor
The mean emission rates across all growth treatments of the sum of the five major emitted MTs measured at the beginning of the CO2 ramping were 1491 ± 537 and 2456 ± 865 ng m−2 s−1 (11.0 ± 4.0 and 18.1 ± 6.4 nmol m−2 s−1, 32.6 ± 11.4 and 55.8 ± 21.4 µg g−1 h−1) for 30 and 35 ∘C assay temperature, respectively. The deduced temperature-normalized EF varied more than 4-fold at between 610 and 2686 ng m−2 s−1 (4.5–19.7 nmol m−2 s−1, 13.1–60.8 µg g−1 h−1) and averaged 1694 ± 589 ng m−2 s−1 (37.6 ± 13.6 µg g−1 h−1). There was no significant difference between the mean EF deduced from the 30 ∘C measurements and that from the 35 ∘C measurements (1626 ± 575 vs. 1781 ± 605 ng m−2 s−1 (P=0.38, t test on merged data of the growth regimes)). Regarding the effect of growth conditions, there was no significant difference between the four populations in terms of the EF or any other variable except plant leaf mass (i.e., the number of leaves per plant; ANOVA, P=0.030), with the lowest mass observed in plants grown under the 400/25 regime (Table S2 in Supplement 1). Pooling the 30 ∘C data of the two growth temperature regimes suggests that growth under elevated CO2 increased the emission factor. However, this effect was only significant for the EF per leaf area (t test, P=0.012; Table S2) and not for the EF per leaf dry weight (t test, P=0.087) as leaves grown under elevated CO2 had increased LMA values (t test, P=0.022). In addition, growth under double CO2 promoted the leaf mass of the saplings (t test, P=0.008). In contrast, pooling the data of the two growth CO2 regimes did not reveal any significant effect of growth temperature on leaf growth, leaf structure (LMA, [Chloro]), EFs or photosynthetic variables measured at the beginning of a series at either assay temperature.
Overall, the foliar EF varied considerably within and across growth regimes. Pearson correlation analyses revealed that the leaf-to-leaf variation in the EF measured at 30 ∘C assay temperature correlated most strongly with the plant's leaf growth (i.e., number of leaves per plant; Fig. 1f). In addition, the EF scaled positively with the actual CO2 assimilation (A400) and electron transport rate (ETR400) and negatively with the non-photochemical quenching NPQ400 (Fig. 1a, b, d). Leaf growth, A400, ETR400 and stomatal conductance (G400) were all positively correlated with each other (see Table S3a in Supplement 2). The same relationships held for the data gained at an assay temperature of 35 ∘C. However, the correlation of the deduced EFs with leaf growth was less strong than at 30 ∘C, while those with ongoing photosynthetic processes A400, ETR400 and NPQ400 were strengthened including a positive correlation between EF and G400 (Fig. 1c). By contrast, the variability in the EF was not correlated with Ci at either experimental temperature, which ranged from 150 to 260 ppm (Fig. 1e).
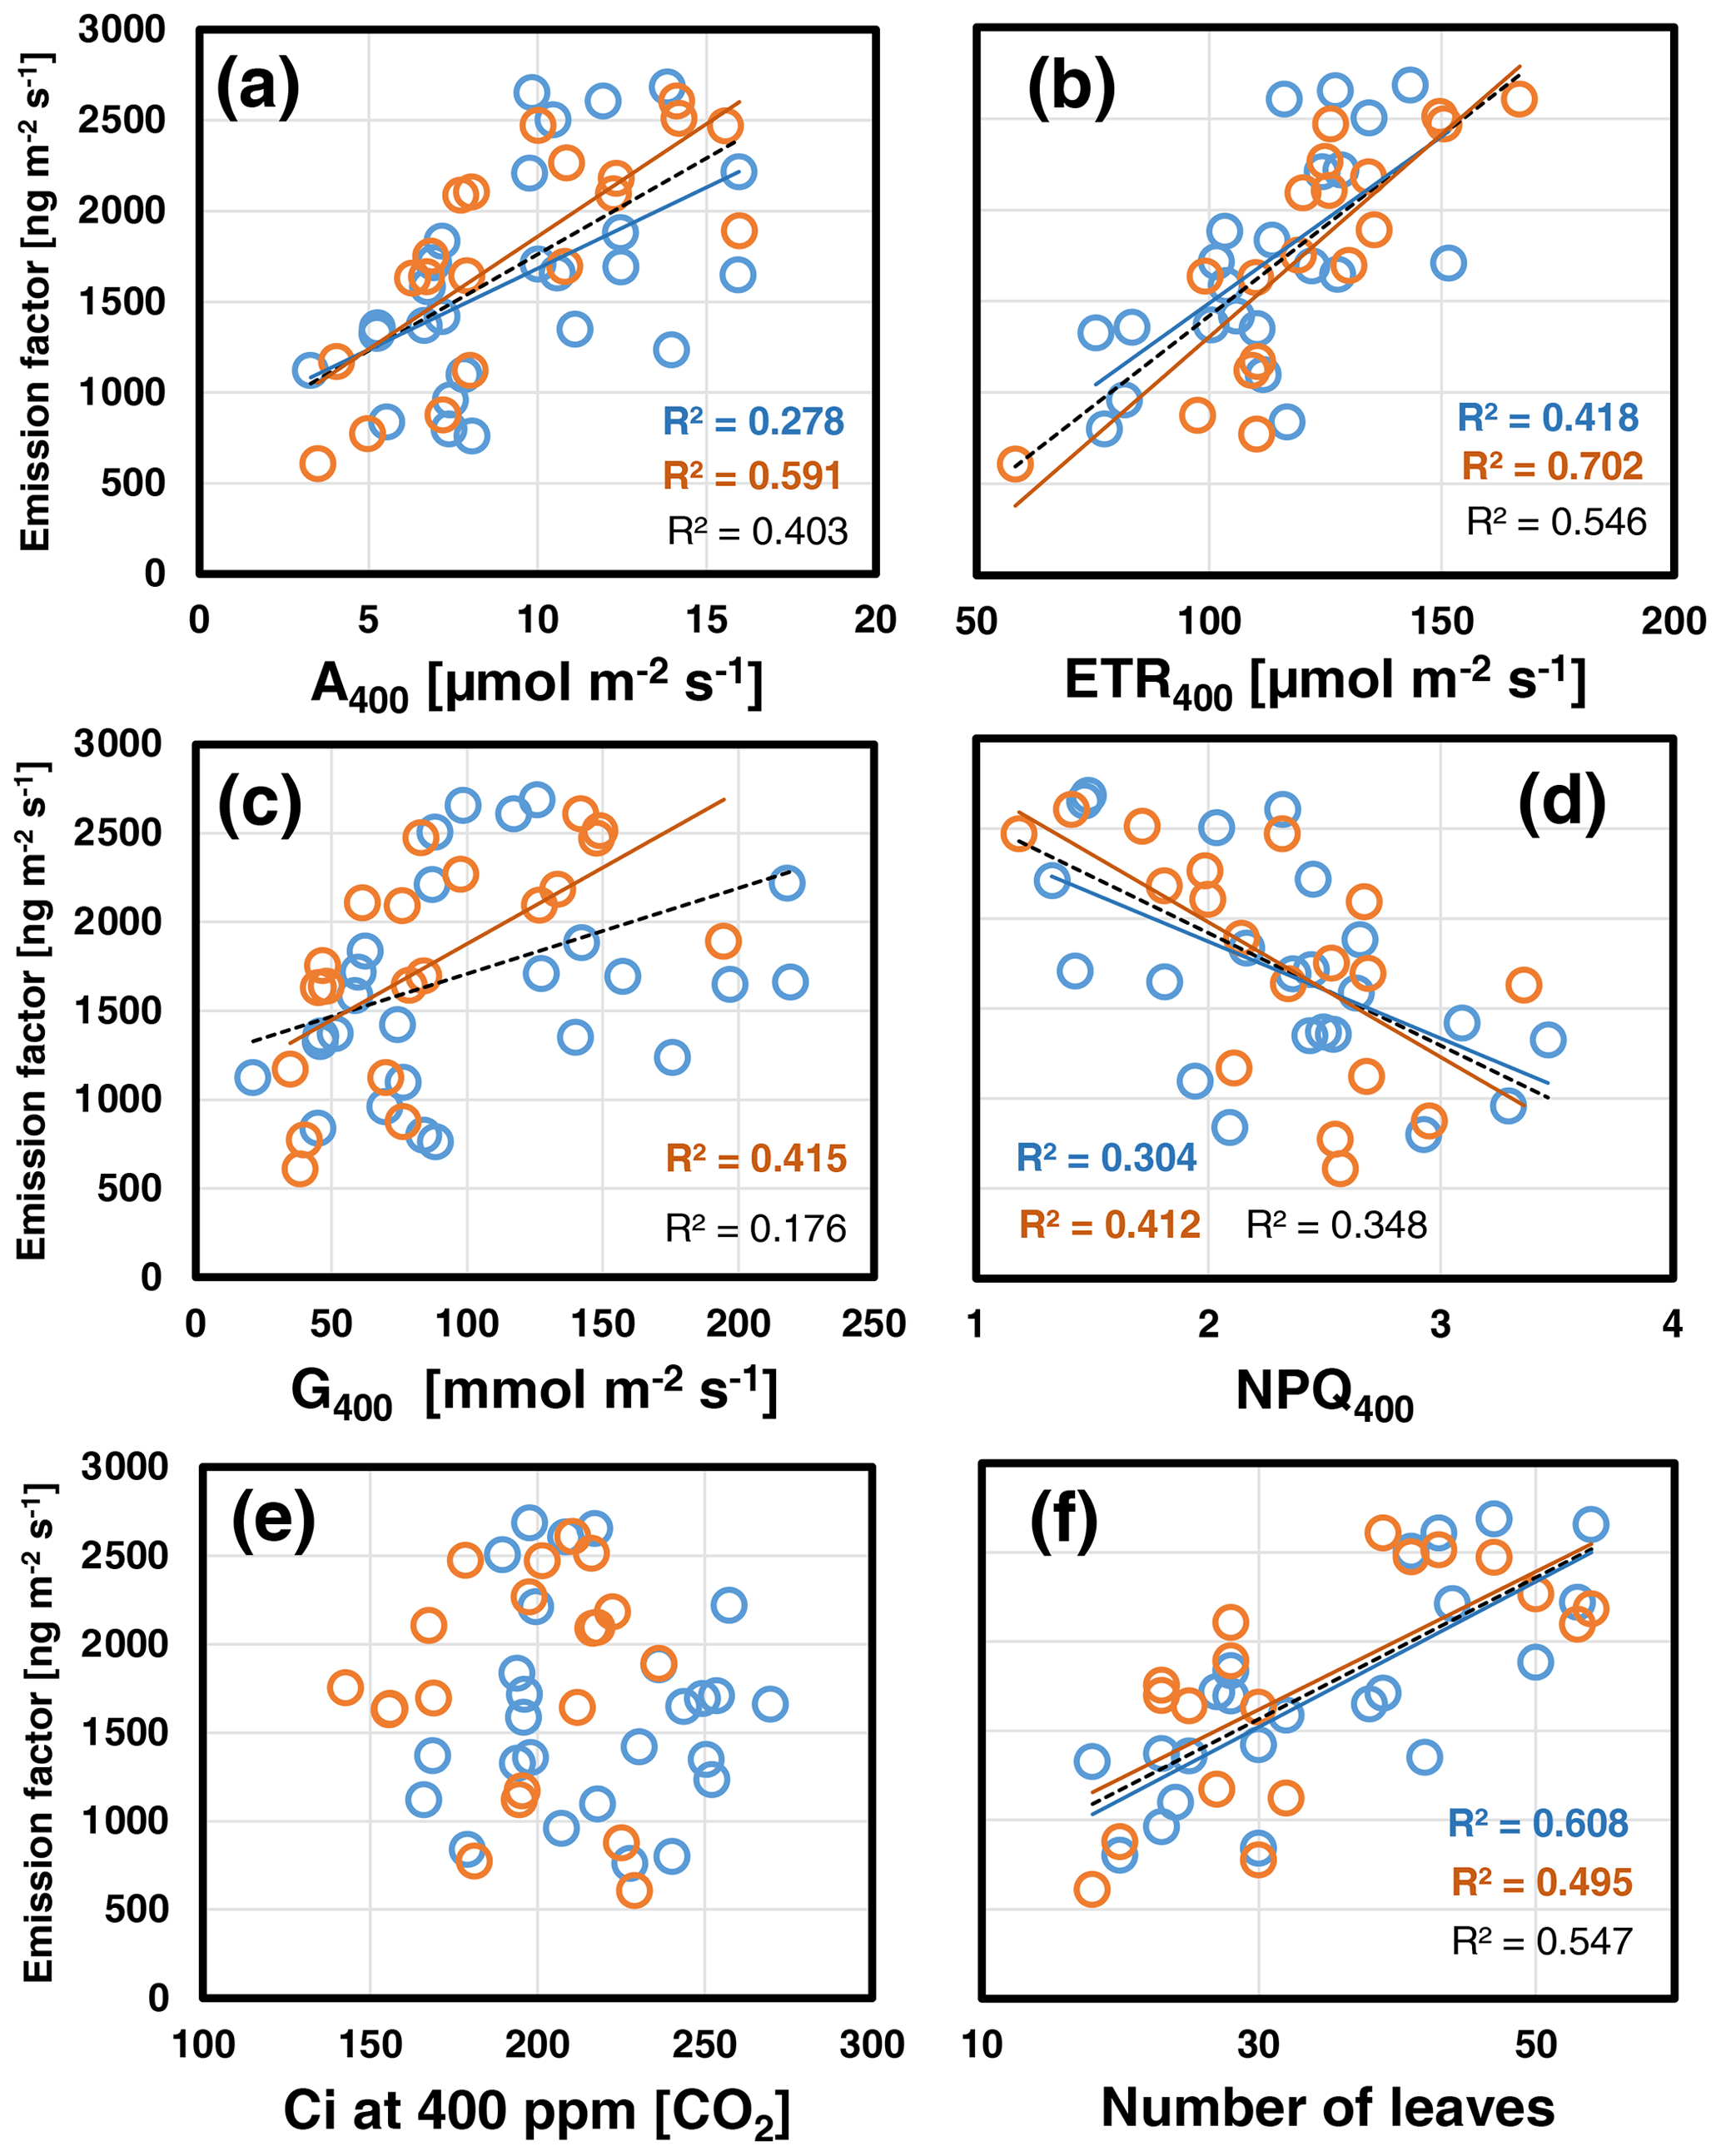
Figure 1Scatterplots of the foliar emission factors measured at the beginning of CO2 ramping at 400 ppm [CO2] and assay temperatures of 30 ∘C (blue) and 35 ∘C (red) against simultaneously measured photosynthetic variables (a–e) and the number of leaves per plant (f). Lines with determination coefficients R2 show best-fit results from Pearson correlation analyses with P<0.05. Dashed lines and R2 in black are from pooled data. See Table S3a in Supplement 2 for more information.
3.3 Response pattern of VOC emissions and photosynthetic variables during CO2 ramping
Control runs, in which repeated measurements were taken during the course of the day while temperature, PPFD and [CO2] were held under standard conditions, showed that leaf emission rates changed very little during the day (Fig. S5 in Supplement 1), ruling out a possible major bias in detecting CO2 effects due to endogenous diel variation in leaf emissions.
The relative changes in MT emissions and photosynthetic variables during CO2 ramping exhibited different pattern according to the assay temperature, regardless of whether the emission data were normalized to the means per series (Fig. 2) or to the initial measurements at 400 ppm CO2 (Fig. S6 in Supplement 1). Indeed, comparing the averages of E400-normalized emissions across all populations, relative emission changes at both low and high CO2 were significantly different between the two assay temperatures (: 1.03 ± 0.16 at 30 ∘C vs. 0.91 ± 0.16 at 35 ∘C, P=0.021 (t test); : 0.78 ± 0.16 at 30 ∘C vs. 0.97 ± 0.12 at 35 ∘C, P<0.001 (t test); Table S2 in Supplement 1). At 30 ∘C, emissions frequently decreased under high CO2 ([CO2] > 400) and showed variable responses to low CO2 ([CO2] < 400) (Figs. 2a, S6a). The variable response of emissions to low CO2 included both emission increases, which occurred more frequently at 200 ppm CO2, and emission decreases, which occurred more frequently at the subsequent exposure to 100 ppm CO2. CO2 assimilation (A; Figs. 2b, S6b) continuously increased until 400 to 600 ppm Ci and leveled off beyond this with occasional decreases at the highest Ci level. The amplitude of change in the ETR (Figs. 2c, S6c) was smaller than in A. Nevertheless, it generally dropped at Ci lower than 200 ppm and tended to decrease at the highest Ci. The pattern of NPQ changes somewhat mirrored that of ETR. NPQ increased at Ci below 400 ppm and mostly remained unchanged or slightly decreased at higher Ci (Figs. 2d, S6d). Fv Fm values were significantly lowered after CO2-response curves from 0.79 ± 0.02 to 0.71 ± 0.04 (δFv Fm, t test: P<0.001; Table S2 in Supplement 1), indicating that leaves did not fully recover from photoinhibition and were subject to oxidative stress that occurred during CO2 ramping. At 35 ∘C assay temperature (Figs. 2e–h, S6e–h in Supplement 1), the relative emission rates expressed a less variable responsiveness to CO2 than at 30 ∘C. They more frequently decreased at low Ci than at 30 ∘C but remained largely insensitive to high Ci. Photosynthesis leveled off later at higher Ci than at 30 ∘C with no or less inhibition at the highest Ci. Similarly, the ETR never decreased during high CO2 exposure compared to 30 ∘C but rather slightly increased with increasing Ci. Analogously, during the ramping to high CO2, relative NPQ decreased more and leveled off later at 35 ∘C than at 30 ∘C. The loss in Fv Fm was also significant at 35 ∘C (0.79 ± 0.03 vs. 0.73 ± 0.05, t test: P<0.001; Table S2 in Supplement 1), though smaller than at 30 ∘C. However, the difference between the two assay temperatures was not significant (δFv Fm: 8 ± 4 % vs. 11 ± 4 %, t test: P=0.06).
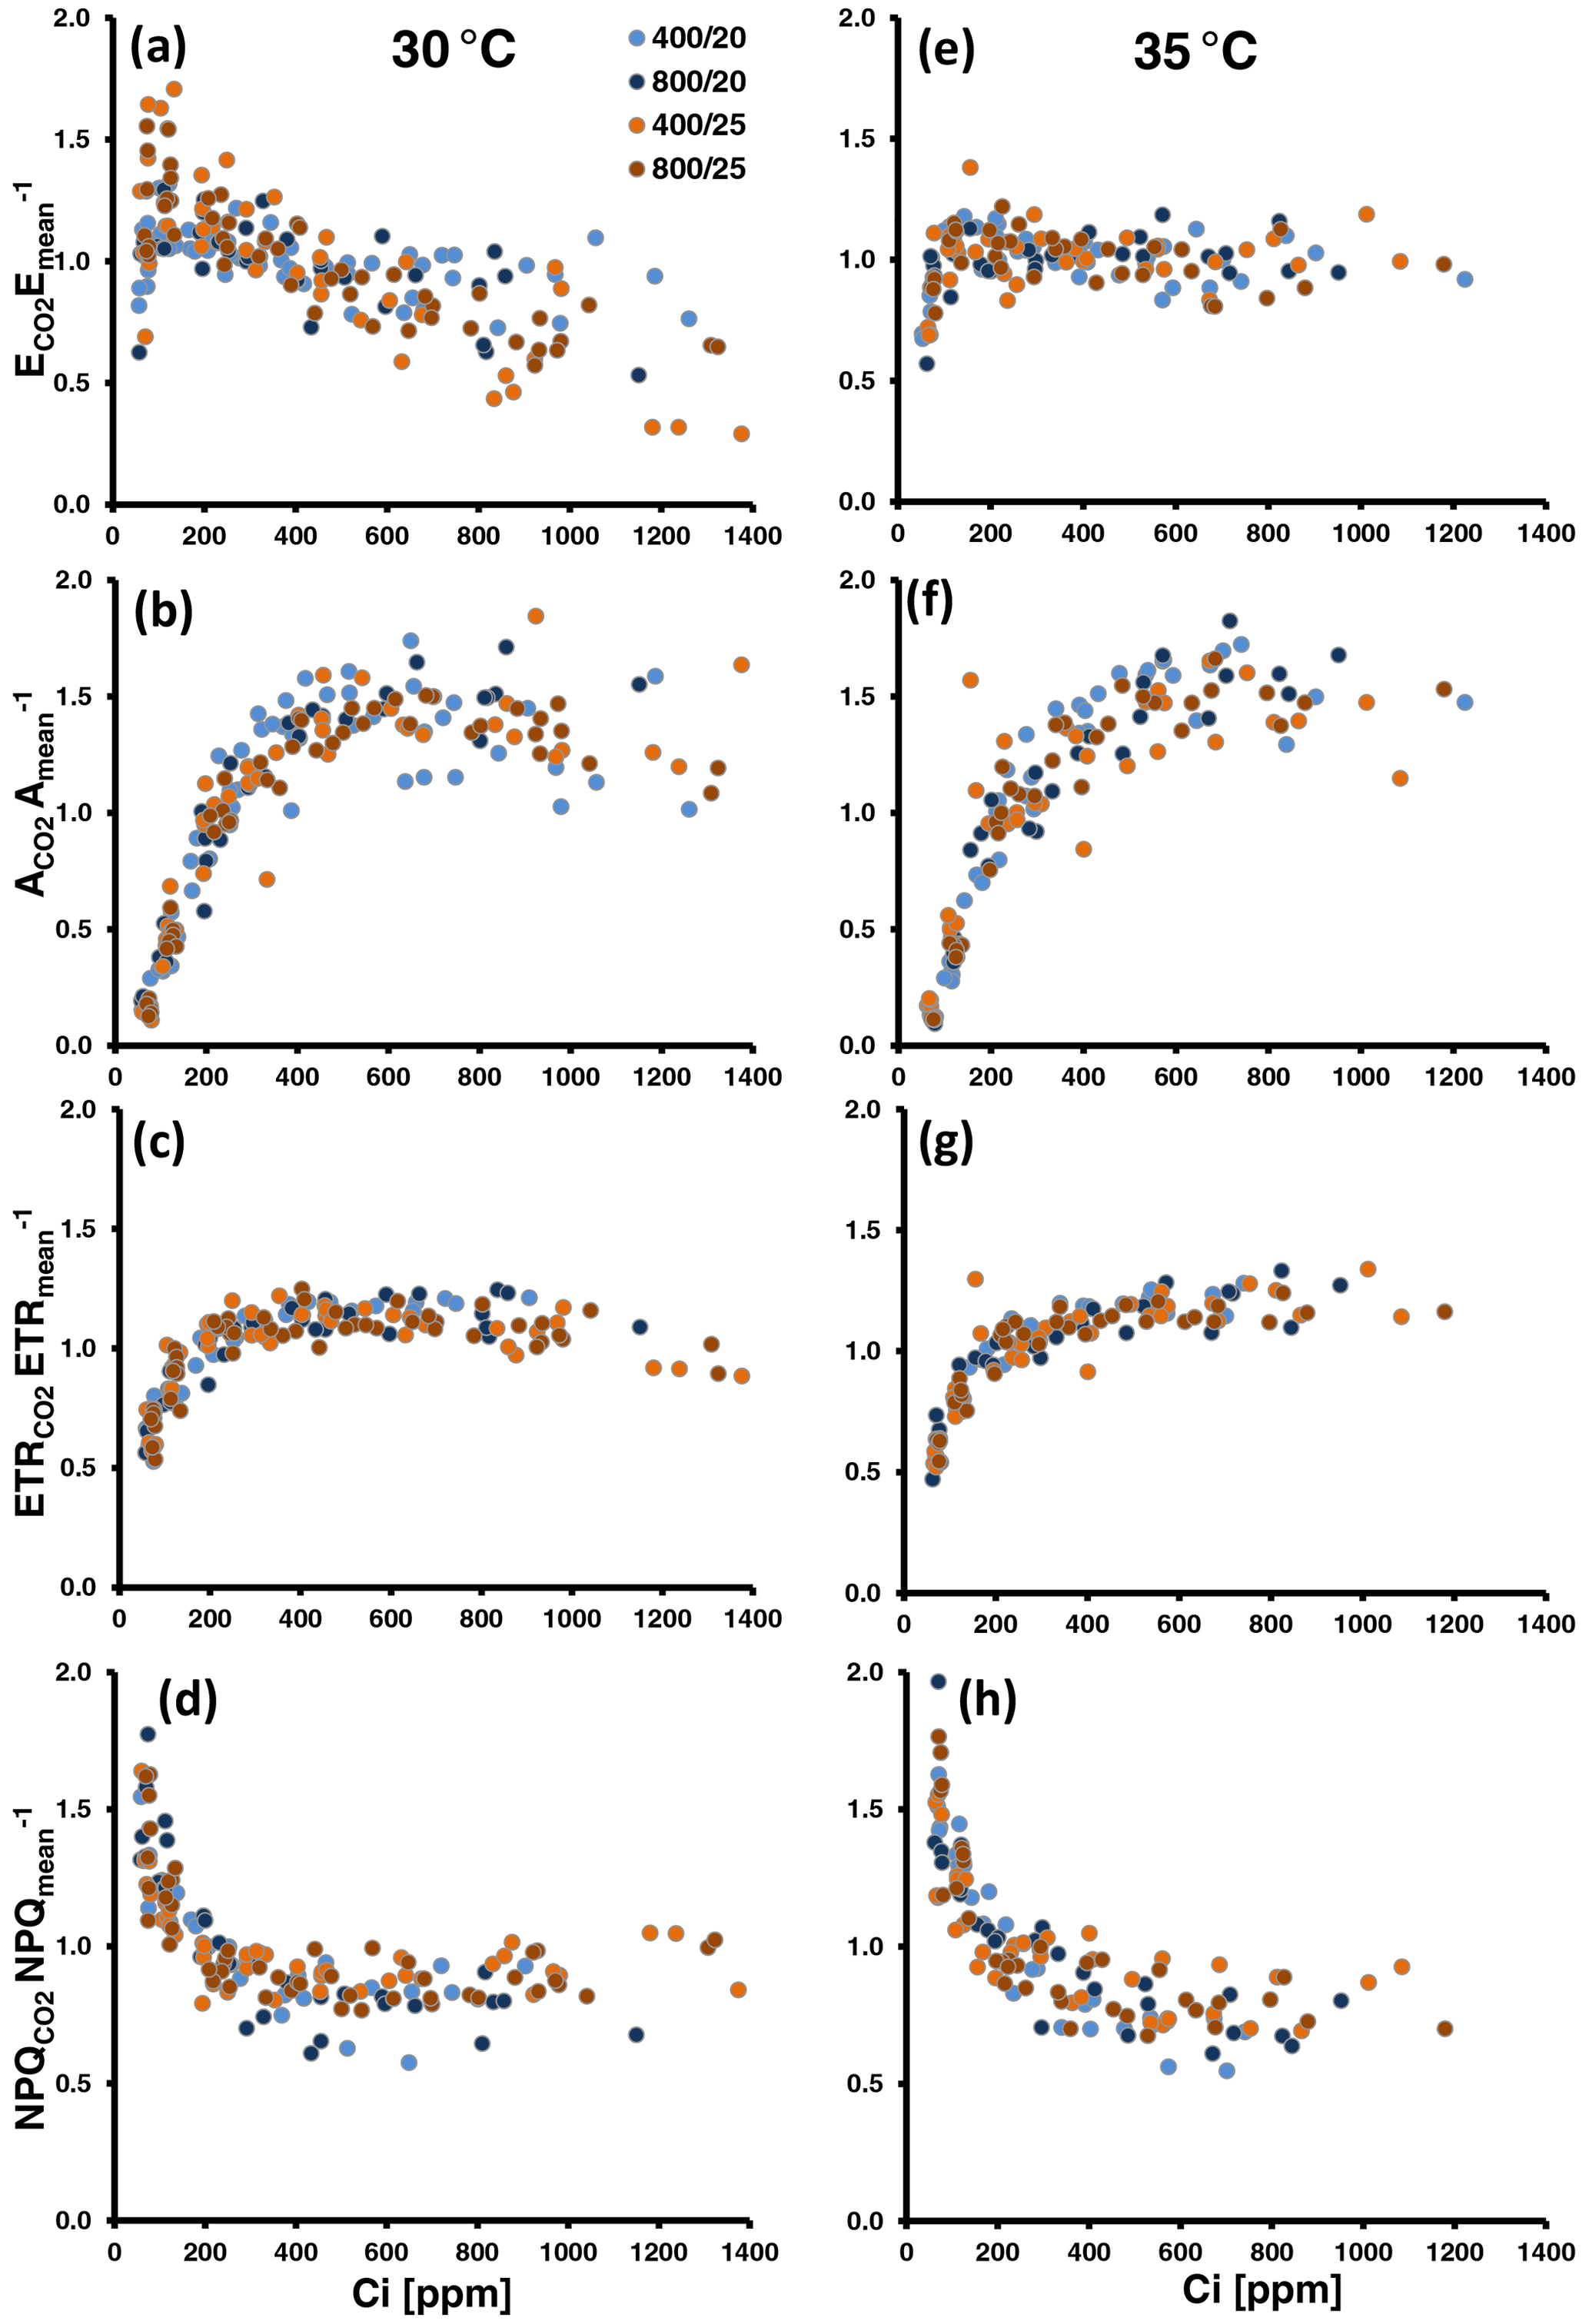
Figure 2Normalized MT emissions (a, e), CO2 assimilation (b, f), the electron transport rate (ETR; c, g) and non-photochemical quenching (NPQ; d, g) against leaf-internal CO2 concentration (Ci) measured during CO2 ramping at assay temperatures of 30 ∘C (a, b, c, d) and 35 ∘C (e, f, g, h). Altogether, 26 and 20 CO2-response curves were run at 30 and 35 ∘C, respectively. Colors of the dots denote the temperature and CO2 regimes in which plants were grown. Data were normalized by devising the individual data points of a CO2-response curve by their mean. To compare the overall amplitude of responses, all y axes were set to the same scale.
Correlation analyses (for overview see Table S3b and Fig. S7 in Supplement 2) revealed that at both assay temperatures, mean relative emissions at low CO2 () scaled positively with those of ETR (μETR<400ETR, P=0.004; Fig. 3a) and negatively with the leaf's initial C losses () measured at the beginning at normal [CO2] (30 ∘C: , P=0.006; 35 ∘C: , P=0.021; data not shown). The latter correlation should be viewed with caution because μETR<400ETR and contain E400 as a common variable. As a result, random variations in E400 due to limited precision of BVOC measurements will produce negative correlations. However at 35 ∘C, was also strongly correlated with the leaf's initial photosynthesis A400 (P=0.001; Fig. 3b) and stomatal conductance rate G400 (P<0.001; Fig. 3c). These correlations were not significant at 30 ∘C, mainly because two leaves exhibited increased emissions at reduced [CO2] along with a relatively high ETR, while their initial photosynthetic and stomatal conductance rates were rather low. At either assay temperature, μETR<400ETR was unrelated to A400, G400 and C-loss400 (Table S3b in Supplement 2). During subsequent ramping to high CO2, the emission reductions observed at 30 ∘C () were best explained by concomitant reductions in ETR (μETR>400ETR, P<0.001; Fig. 3d) and, anti-correlated with ETR, by increases in NPQ (μNPQ<400NPQ, P=0.003; Fig. 3e). was not related to any other variable except a weak negative correlation with relative emissions at low CO2 (, P=0.026; data not shown). By contrast at 35 ∘C, the minor emission changes observed under high CO2 () were positively correlated with (R=0.71, P<0.001), which is explained by their mathematical interdependency (common denominator, Fig. S1 in Supplement 2). Finally, when data of both assay temperatures were pooled, was negatively correlated with the leaf loss in Fv Fm (δFv Fm: P=0.014; Fig. 3f). Interestingly, δFv Fm was also negatively correlated with plant growth at both assay temperatures (30 ∘C: , P=0.015; 35 ∘C: , P=0.003).
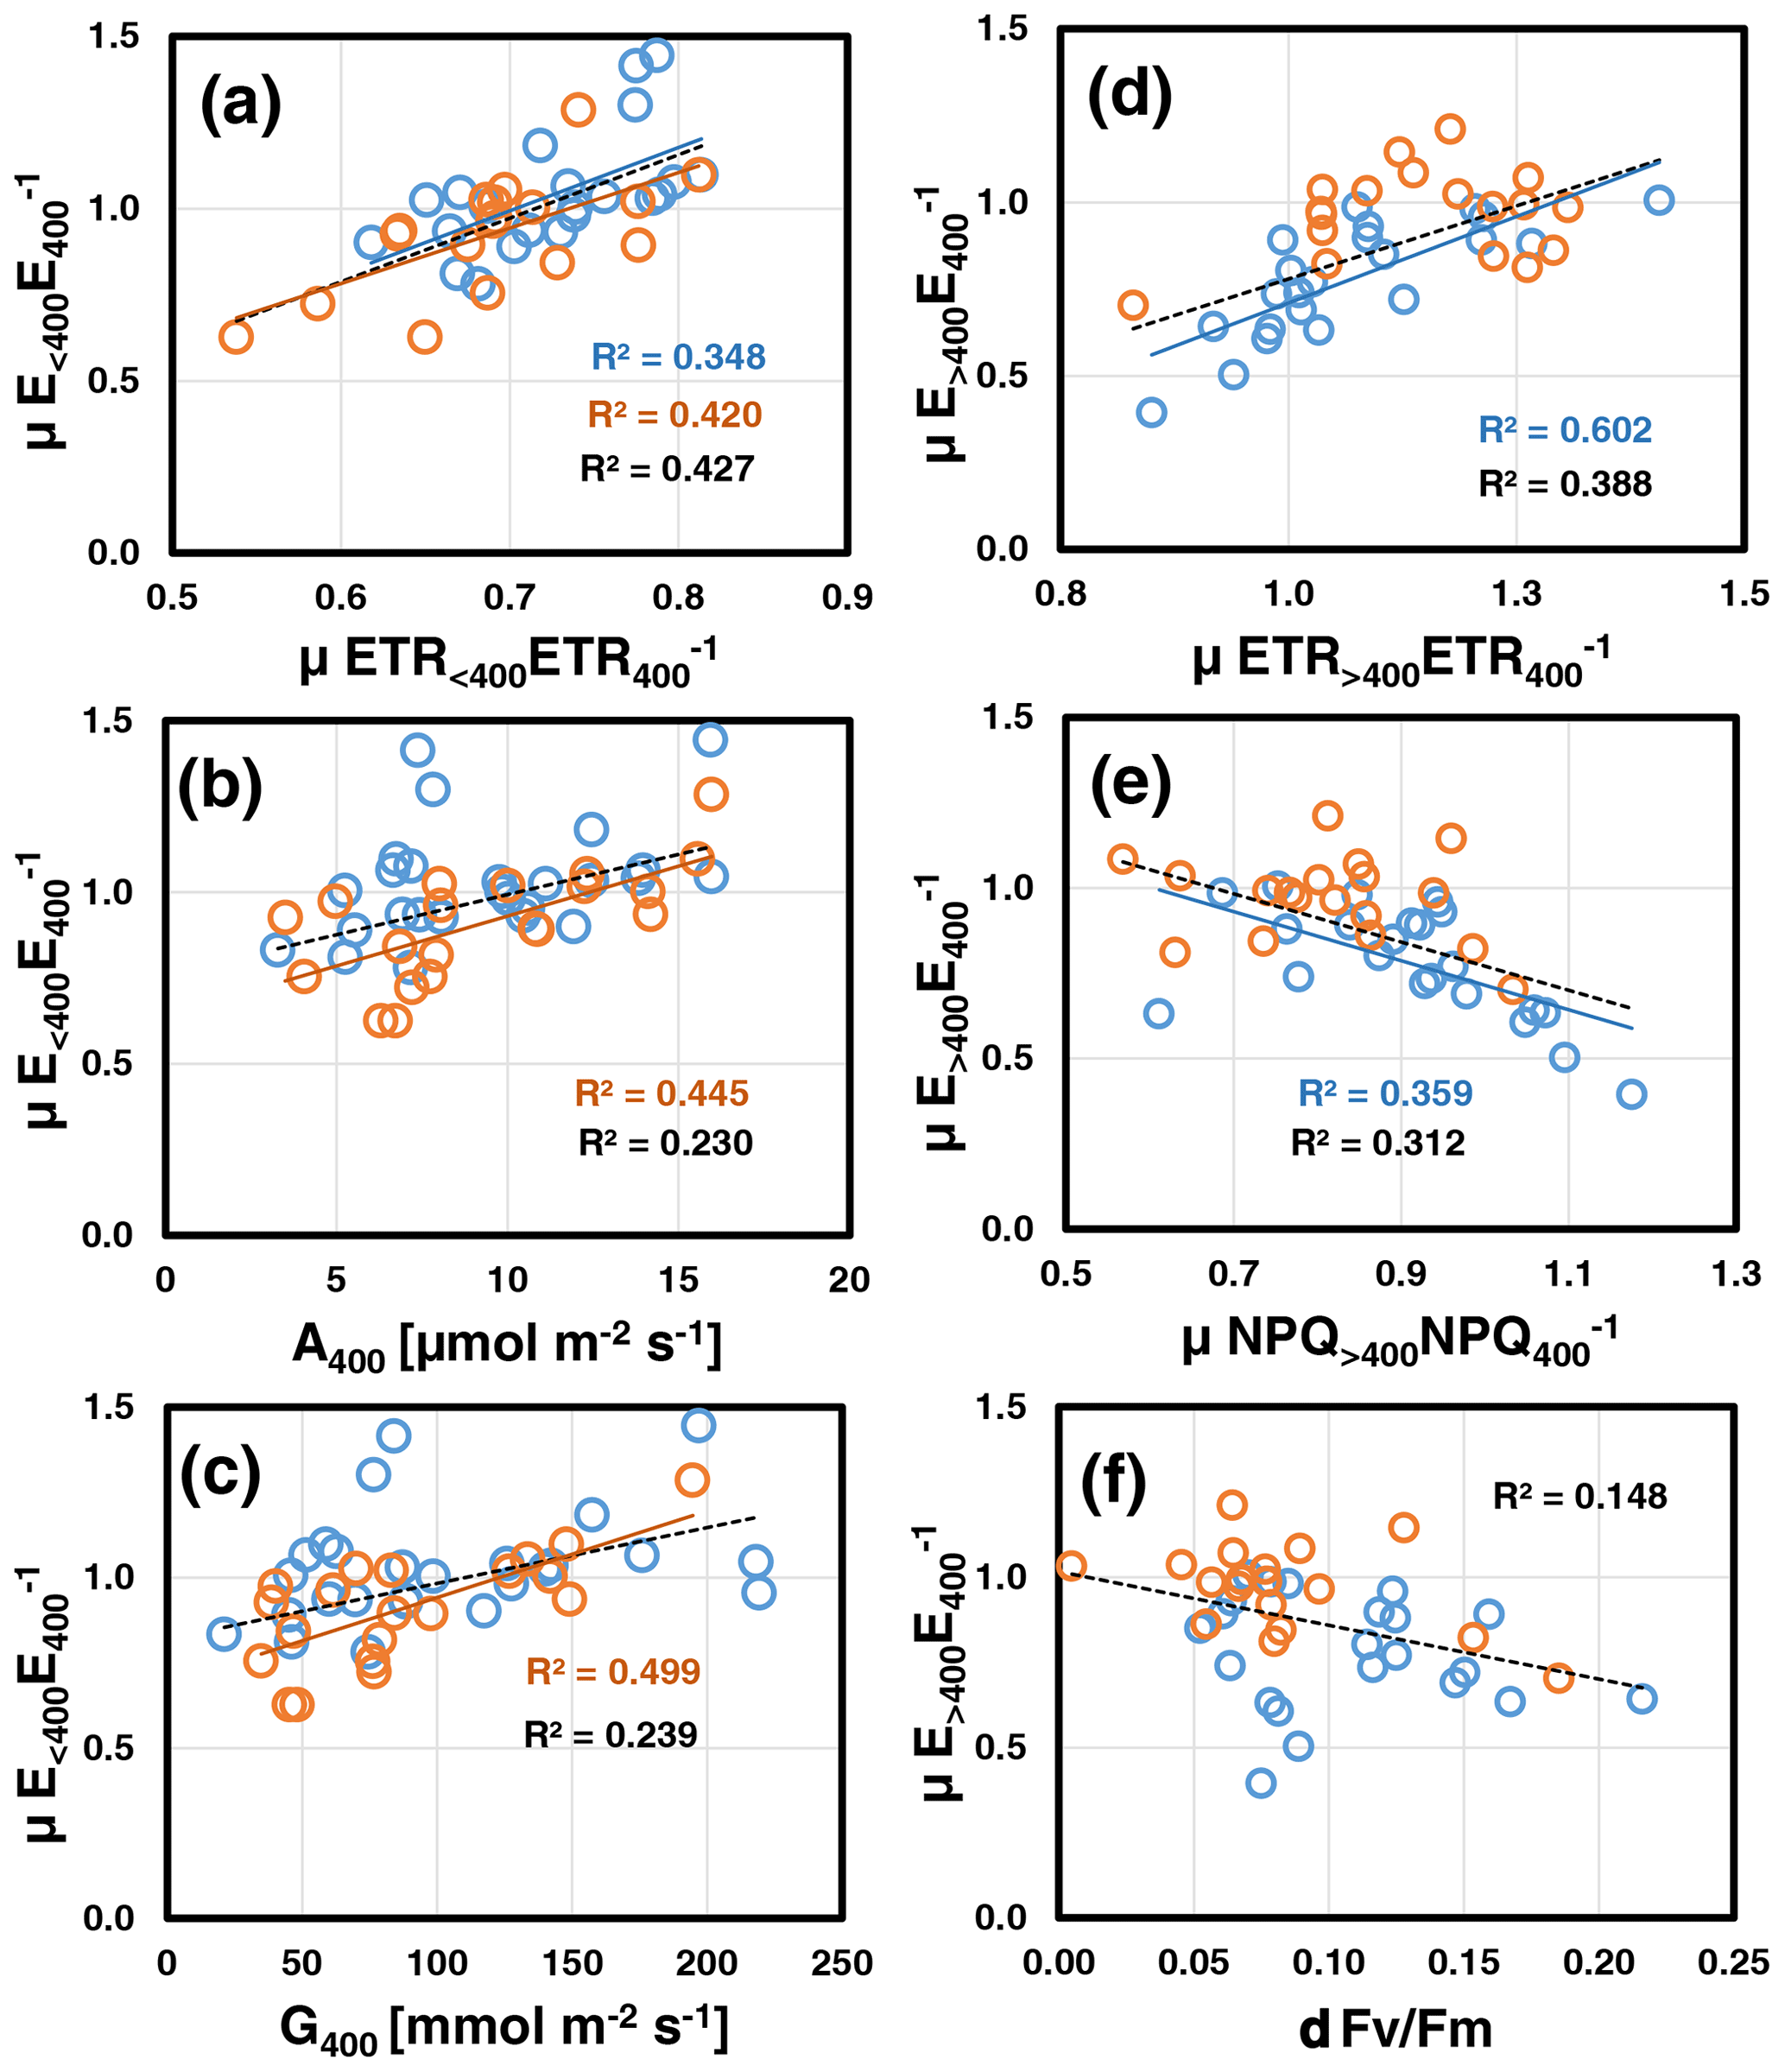
Figure 3Key relations of relative emissions to low CO2 (; a, b, c) and high CO2 (; d, e, f) measured at assay temperatures of 30 ∘C (blue) and 35 ∘C (red). Lines with determination coefficients R2 show best-fit results from Pearson correlation analyses with P<0.05 (lines and R2 in black are from pooled data). For a complete overview, see Table S3b and Fig. S7 in Supplement 2.
CO2 responses of emissions and photosynthetic variables did not differ significantly among the four growth populations with one exception (Table S2 in Supplement 1): at 30 ∘C, there was a significant difference in relative NPQ at high CO2 (μNPQ>400NPQ) with 800/25- and 400/25-grown plants showing less reduction in NPQ than 800/20-grown plants (ANOVA, P=0.006). When the data of the two CO2 growth regimes were pooled, growth temperature significantly affected the high-CO2 responses of emissions (: t test, P=0.008), the ETR (μETR>400ETR: t test, P=0.005) and NPQ (μNPQ>400NPQ: t test, P=0.001). In fact, at 30 ∘C assay temperature, warm-grown plants often continued to non-photochemically dissipate light energy at the expense of ETR and MT emissions, whereas NPQ of cool-grown plants frequently relaxed during high-CO2 ramping along with keeping a higher ETR and higher emission rates. Accordingly, Fv Fm was significantly more reduced in warm-grown plants compared to cool-grown plants (δFv Fm: t test, P=0.016). Growth temperature also affected the CO2 responsiveness of some photosynthetic variables at 35 ∘C assay temperature (Table S2 in Supplement 1): leaves grown at elevated temperature opened stomata less at low [CO2] and closed them more at high [CO2] than leaves grown at low temperature (t tests: , P=0.009; , P=0.003). Furthermore at high CO2, warm-grown leaves had lower CO2-assimilation rates (, P=0.017) and higher NPQ (t test: μNPQ>400NPQ, P=0.001) and ETR ratios (t test: μETR ETR , P=0.014) compared to leaves grown under low temperature. However, growth temperature had no significant effect on emission responses to low and high CO2 at 35 ∘C. Pooling the data of the two growth temperature regimes did not reveal any effect of growth CO2 on CO2 responsiveness of emissions or photosynthetic variables.
3.4 Implications for predicting future MT emissions from holm oak
We tested whether the MEGAN algorithm (Eq. 1) can be used to simulate the CO2 response of MT emissions at 30 ∘C (Fig. 4). Using the whole data set for the fit resulted in a response curve with coefficients close to that currently applied to predict the CO2 response of isoprene emissions under the current CO2 level (Table S4 in Supplement 3). However, as indicated by the statistics (see above) and which can be seen from Fig. 4, relative emissions considerably varied with data from the low-temperature-grown and high-temperature-grown plants predominately scattering above and below the total fit, respectively. Consequently, separate fits resulted in two distinct curves, which differed mainly in the coefficient C* determining the amplitude of the emission reduction and less in the coefficient h, which sets the Ci level at which emissions decline.
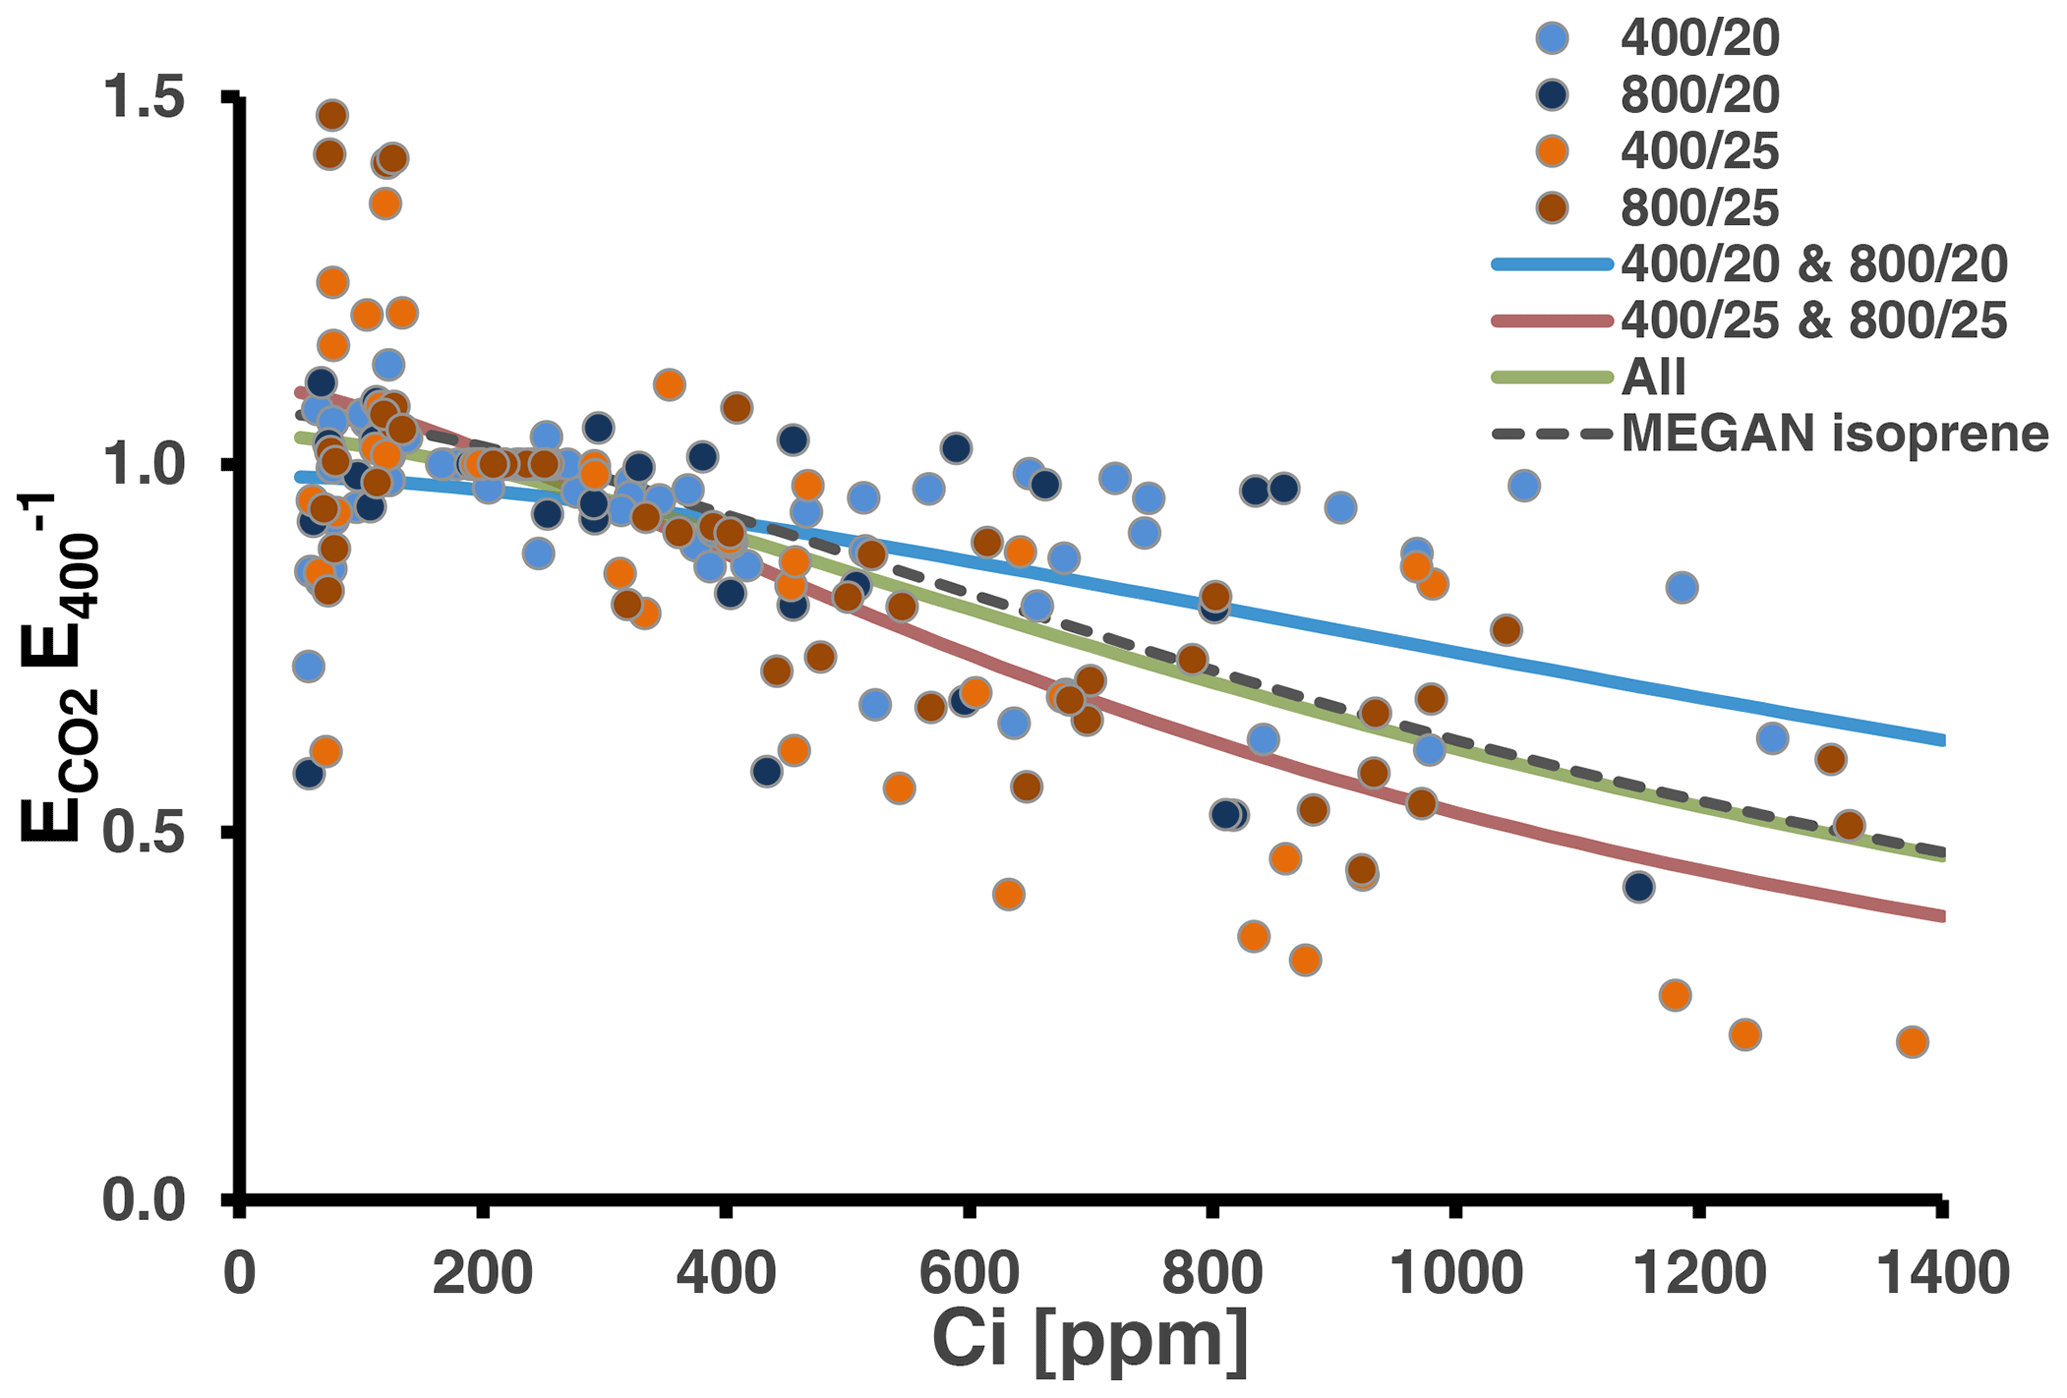
Figure 4Relative MT emission rates (normalized to the initial measurement at 400 ppm CO2) measured during CO2 ramping at the assay temperatures of 30 ∘C (26 response curves). Colors of the dots denote the CO2 and temperature regimes, in which plants have been grown. Solid lines present best fits to the algorithm of the MEGAN modeling framework accounting for the short-term effect of CO2 on isoprene emissions (Eq. 1). The green line shows the fit from all data and the red and blue lines from the warm- and cool-grown plants, respectively. The dashed black line depicts the CO2 scaling currently used in MEGAN (Guenther et al., 2012). All coefficients values and additional information are given in Table S4 of Supplement 3.
We further analyzed to what extent the observed emission inhibition by double CO2 could compensate for the increase in emissions due to global warming. Doubling assay [CO2] from 400 to 800 ppm reduced temperature-normalized emission rates on average by 8 % at 30 ∘C (1626 ± 575 vs. 1499 ± 538 ng m−2 s−1; P=0.001; paired t test; n=26) and had no effect at 35 ∘C (1781 ± 605 vs. 1800 ± 719; P=0.755; paired t test; n=20). However, the highest and significant decrease in 30 ∘C emissions by double CO2 was observed for plants grown at elevated CO2 and temperature (800/25) amounting to ca. 10 % (1808 ± 661 vs. 1625 ± 591; P=0.033; paired t test; n=7). Compared to the short-term effect of temperature on emissions, this decrease might compensate the emission increase by 1 ∘C warming, which is about 13 % in the range between 10 and 30 ∘C and then gradually decreases until the temperature optimum around 41 ∘C (Staudt and Bertin, 1998). Yet, it is very likely that the high-CO2 inhibition we observed becomes stronger at temperatures lower than 30 ∘C. Several studies on isoprene emissions suggest that the high-CO2 inhibition on emissions increases with decreasing temperature linearly and can suppress emissions by 50 % or more at the lowest temperatures (Rasulov et al., 2010; Potosnak et al., 2014; Sharkey and Monson, 2014, and references therein). Accordingly, the high-CO2 inhibition of MT emissions would be most relevant during the cooler daytime hours and, because QI is an evergreen species, throughout the cooler seasons, while it has less effect during the warm season and hours. There are additional factors that shape the seasonal course of emissions and hence will change the impact of CO2 inhibition on annual emissions. MT emissions from QI are strictly light dependent (Staudt and Bertin, 1998). Low temperatures are commonly associated with lower light levels and shorter day lengths, resulting in lower emissions during these periods. Moreover, the EF of QI leaves usually diminishes towards the winter season (Peñuelas and Llusià, 1999; Staudt et al., 2002; Ciccioli et al., 2003) along with the down-regulation of the activity of MT synthases (Fischbach et al., 2002; Grote et al., 2006), further reducing its contribution to the annual VOC budget. However, in summer the physiological activity of QI leaves is frequently restrained by drought, potentially reducing their emissions (Staudt et al., 2002; Lavoir et al., 2009).
To better understand the relative importance of CO2 inhibition in interaction with other determinants of leaf MT emissions from QI, we computed annual emissions by combining eight high-CO2-inhibition scenarios differing in their maximum high-CO2 inhibition with four warming scenarios (1–4 ∘C warming) and three scenarios of EF seasonality (seasonality without and with summer drought, no seasonality). The details of the procedure are described in Supplement 3. Briefly, simulations were based on climate data recorded over 2019–2021 by a flux tower in a nearby QI forest station. The temperature data were stepwise increased by 1 to 4 ∘C, encompassing the range predicted to occur with doubling [CO2] by the end of the century (2.8–4.6 ∘C relative to the 1850–1900 period, scenario SSP3-7.0; IPCC, 2021). The seasonal courses of EF were deduced from the results of a former rain exclusion experiment (Staudt et al., 2002; Fig. S9 in Supplement 3). The CO2 inhibition scenarios assume that emission inhibition is zero at an air temperature of 35 ∘C or higher and increases by 2 % per 1 ∘C decrease to reach eight different maximum inhibitions varying between 10 % and 100 %. Hence, in all scenarios the inhibition was the same between 30 ∘C (10 % as observed for elevated CO2 and warm-grown plants) and higher temperatures. Overall, 96 simulations were run, whose outputs are summarized in Fig. 5 and Table S5 in Supplement 3. Figure S10 in Supplement 3 shows an example of the diurnal and annual emission courses resulting from the simulations.
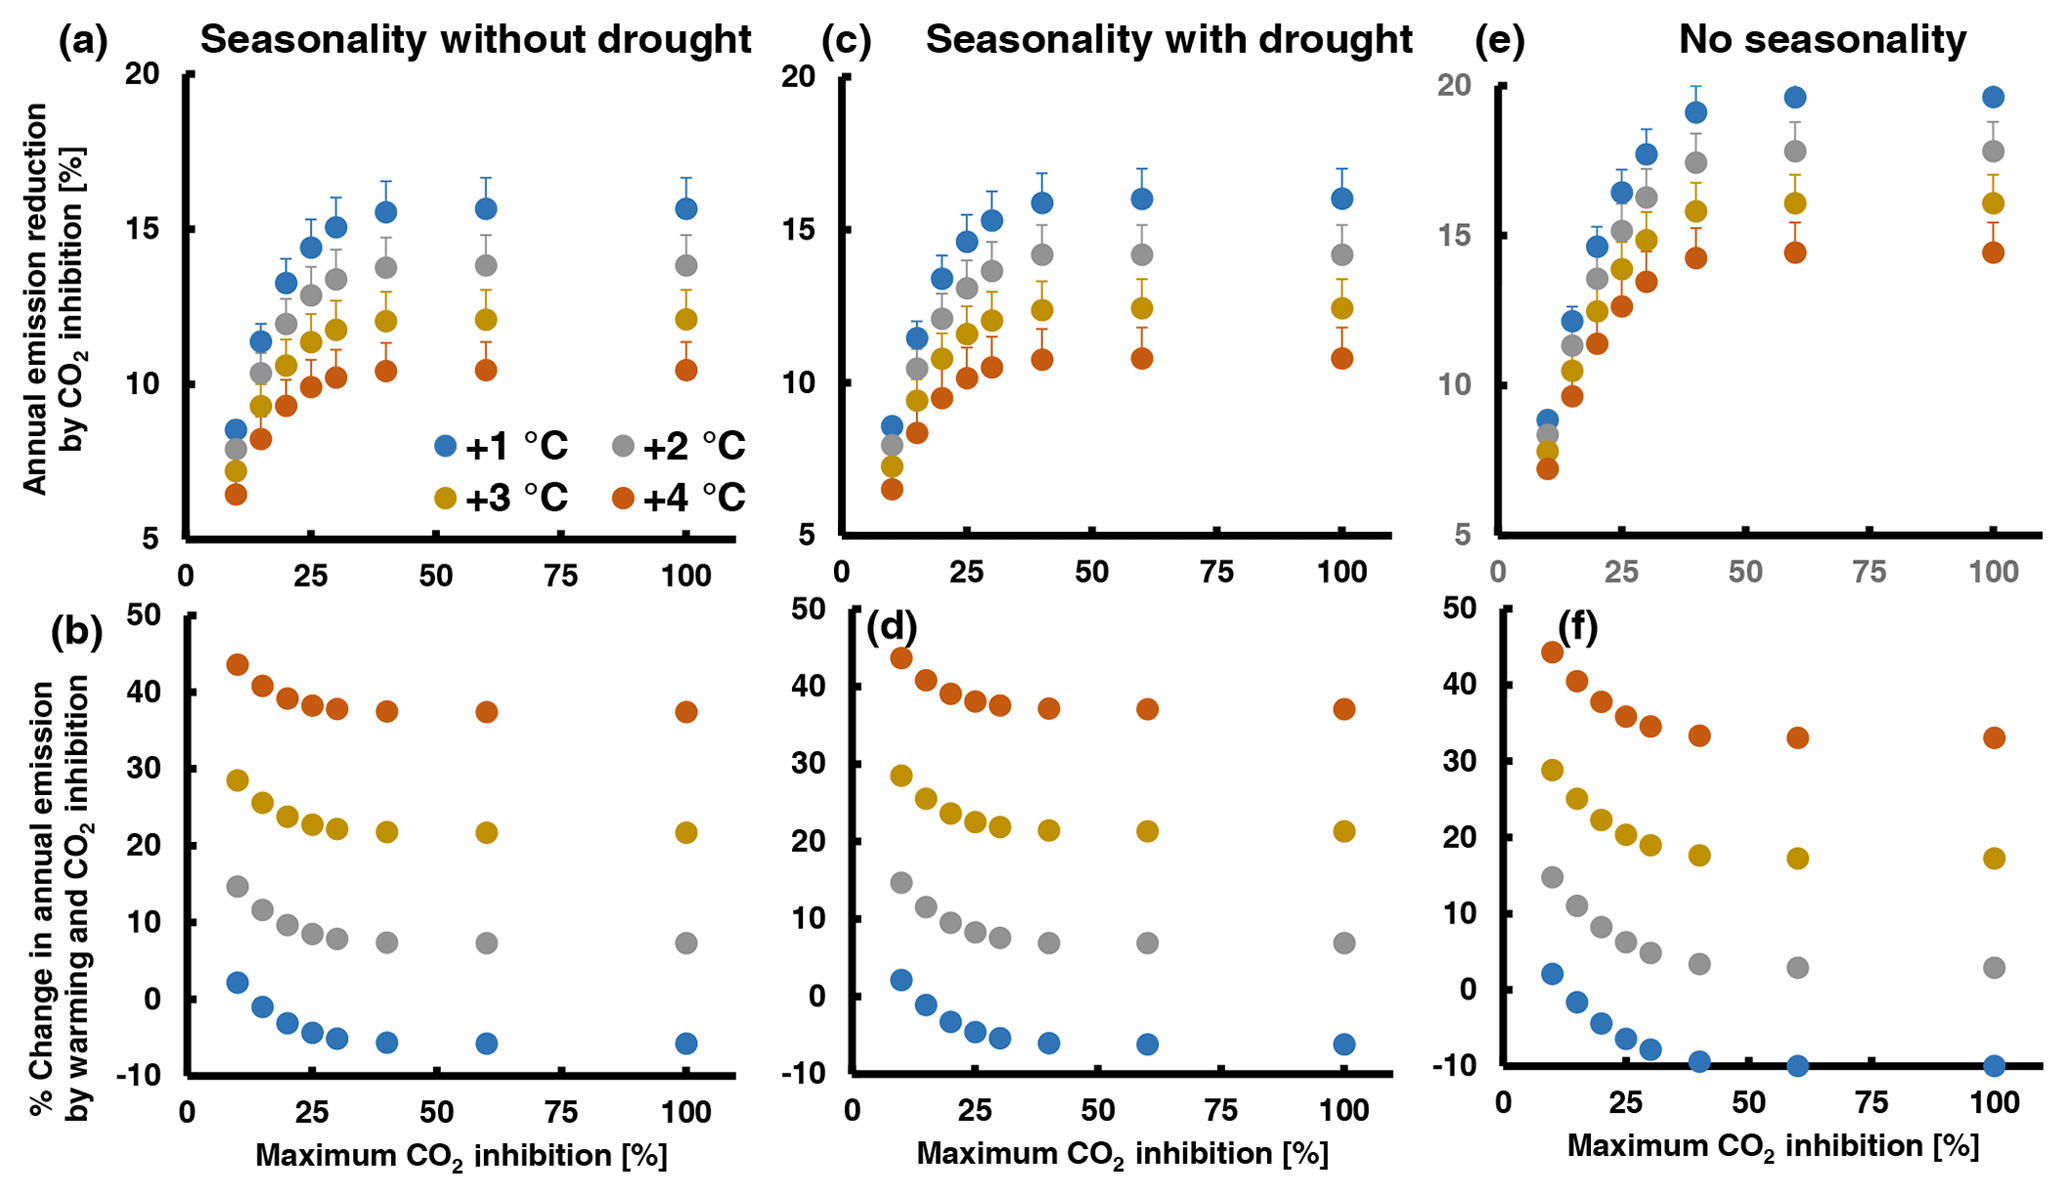
Figure 5Assessment of the potential effect of high CO2 inhibition on total annual MT emission from QI leaves under a future warmer climate with a doubled atmospheric [CO2] combining different scenarios of maximum CO2 inhibition (x axes), warming (color of dots) and seasonality of the emission factor: (a, b) EF seasonality without summer drought; (c, d) EF seasonality with summer drought; (e, f) no seasonality (constant EF). The lower graphs (b, d, e) show the percentage change in annual emission with respect to today's values ((future annual – today annual E) × today's annual E−1 × 100) and the upper graphs (a, c, d) the percentage reduction in the future annual emissions by CO2 inhibition ((annual E+T – annual ) × annual ). The simulations were run with temperature and PPFD data of the years 2019, 2020 and 2021. Data points and error bars (not visible in b, d, f) are means and standard errors of n=3 years. A detailed explanation of the simulations and additional illustrations of the results are given in Supplement 3. The assumed seasonal variations in the emission factor are shown in Fig. S9.
As expected, the relative importance of CO2 inhibition decreases with the level of climate warming. In the absence of summer drought (Fig. 5a, b), warming from 1 to 4 ∘C decreases the annual emission reduction by CO2 inhibition from 8.5 ± 0.3 to 6.5 ± 0.5 % at 10 % maximal CO2 inhibition and from 15.7 ± 1.0 to 10.5 ± 0.9 at 100 % maximal CO2 inhibition. Thus, even when CO2 inhibition of emissions continues to increase with decreasing temperature, its impact on the annual emission budget is moderate due to the non-linear effects of temperature and light on emissions and due to the strong seasonality of the EF. In fact, the calculated amounts of MT emitted from a leaf per day are about 2 orders of magnitude lower during the winter season than during the hot summer season (see examples in Fig. S10e and g in Supplement 3). As a result, assuming higher maximum inhibitions than 40 % at temperatures below 15 ∘C has no additional effect on the annual VOC budget (Fig. 5a, c and e). Drought or any event that significantly curtails summer emissions is expected to enhance the annual impact of CO2 inhibition. Indeed, running simulations with EF seasonality from drought-exposed QI trees instead of irrigated trees increased the annual CO2 inhibition by 0.1 %–0.5 % (Fig. 5c, d), which is attributable to the lower annual EF maximum and its delayed occurrence in the summer season when decreasing day length, light intensity and temperature already constrain the daily VOC release. Accordingly, the complete suppression of EF seasonality (a constant mean EF throughout the year) increased the annual CO2 effect by 0.5 %–4 % (Fig. 5e, f). However, even in this very unlikely seasonality scenario, CO2 inhibition did not reduce annual emissions by more than 20 %. A decrease in future annual VOC emissions relative to current levels was observed only in the simulations with 1 ∘C warming (negative values in Fig. 5b, d and f and Table S5 in Supplement 3), while warming of 2 ∘C or more always resulted in a net increase in annual emissions. Additional simulations with intermediate temperatures suggest that the emission inhibition by double CO2 could offset the emissions increase by 1.5 ∘C warming. This is at the low end of the 2.8–4.6 ∘C warming range predicted by the IPCC SSP3-7.0 scenario, considering that the temperatures recorded in 2019–2021 were already about 1 ∘C higher than in the pre-industrial period.
4.1 Variability in the emission factor
Growth at double CO2 enhanced the emission factor, while a 5 ∘C difference in growth temperature had no significant effect on the EF. The enhancement of EF by elevated growth CO2 was partly due to its positive effect on the LMA, as observed in a previous CO2 study on QI (Staudt et al., 2001). On the other hand, the non-effect of growth temperature on the EF diverges from the results of field studies (Peñuelas and Llusià, 1999; Staudt et al., 2002; Ciccioli et al., 2003; Lavoir et al., 2009) as well as a growth chamber study (Staudt et al., 2003) which showed that the EF of QI leaves is subject to strong seasonal cycles that are likely related to prevailing meteorological conditions. We explain this apparent contradiction as indicating that the long-term regulation of the leaf's emission capacity by temperature is non-linear and that persistently lower temperatures than that applied in the present study are necessary for its down-regulation. Furthermore, it is conceivable that the exposure to temperature changes rather than constant lifelong temperature differences induces acclimation processes in the EF (Staudt et al., 2003; Wiberley et al., 2008). Finally, moderate effects of growth temperature on the EF may have been overlooked in our study due to the large variability in the EF within the four populations.
The EF variability scaled positively with the leaf's actual photosynthetic activity and the individual plant's leaf growth, which was negatively related to the loss in Fv Fm that occurred during subsequent CO2 ramping. This suggests that the plant's overall capacity to use photosynthates for growth (sink capacity) was associated with the capacity of its individual leaves to fix carbon, to produce MTs and to avoid photooxidative stress. Positive relations between isoprenoid emissions, photosynthesis, growth performance and resistance to harsh environmental conditions within and across natural or genetically manipulated populations have already been reported (e.g., Monson and Fall, 1989; Staudt et al., 2001; Possell et al., 2004; Eller et al., 2012; Lantz et al., 2019a; Zuo et al., 2019; Niinemets et al., 2021; Dani et al., 2022), though negative or no relations have also been observed (e.g., Guidolotti et al., 2011; Behnke et al., 2012; Zuo et al., 2019; Monson et al., 2020; Sun et al., 2020). The positive association we observed with QI saplings may be due to the beneficial effects of chloroplastic volatile isoprenoid production on plant growth and stress resistance by modulating cellular signaling networks (Frank et al., 2021; Monson et al., 2021; Dani et al., 2022). However, it is also known that the sink capacity of a plant can constrain the photosynthetic activity of its leaves (Ainsworth and Bush, 2011). Therefore, QI saplings with lower growth could have lower EFs if their leaf monoterpene biosynthesis were limited by carbon substrates and/or energetic cofactors coming from photosynthesis. At 35 ∘C assay temperature, when terpene production was almost twice that at 30 ∘C, the correlations between the deduced EFs and photosynthetic variables, including stomatal conductance, were stronger than at 30 ∘C (Fig. 1). Given that stomatal opening has no direct control on the emissions of the MTs considered in the present study (Niinemets et al., 2014), this shift in the correlation pattern with assay temperature indicates that the leaf-to-leaf variability in the EF was indeed partly due to limitation by photosynthetic substrates. In addition, variations in leaf anatomy could explain the correlation of the leaf EF and photosynthesis, such as the quantity of photosynthetically active tissues per leaf surface and density of chloroplasts (Sun et al., 2012; Rasulov et al., 2015). However, we found no consistent correlation between estimated chlorophyll content or the LMA and photosynthesis or emission rates, suggesting that leaf anatomical differences were of minor importance. CO2 responsiveness of emissions was also not the main reason for the leaf-to-leaf variability in the EF (for an example see Guidolotti et al., 2011), since EF was not related to Ci at either assay temperatures (Fig. 1e).
4.2 CO2 responsiveness of emissions
If MT biosynthesis in leaves was already constrained by its photosynthetic activity at the beginning of CO2 ramping at 400 ppm CO2, it is likely that emissions declined under low CO2 when photosynthetic carbon fixation became rapidly reduced. Indeed at 35 ∘C all leaves that had low initial assimilation and stomatal conductance rates (A400, G400) showed the most pronounced emission decrease under low CO2 () (Fig. 3b, c), whereas at 30 ∘C this applied only to leaves having low assimilation together with high emission rates (high C-loss400). In addition and unrelated to the leaf's initial photosynthetic and MT production status, relative emission rates under low CO2 scaled positively with the relative ETR (μETR<400ETR) at both assay temperatures (Fig. 3a). We interpret these observations to mean that MT production during low CO2 ramping was curbed by two rather independent constraints, one associated with the availability of basic C3 substrates entering the MEP pathway and one with the availability of energetic cofactors necessary to reduce them further downstream. The latter predominated initially at moderate low Ci when energetic cofactors were still primarily used in the CBB cycle for CO2 reduction and photorespiration, whereas the former predominated when Ci approached the CO2 compensation point (i.e., when A=0) and more and earlier when the initial emission rates were high and assimilation low. Labeling studies have shown that the fraction of older carbon incorporated in the biosynthesis of isoprene increases during exposure to low [CO2] and/or high temperatures (Funk et al., 2004; Trowbridge et al., 2012; de Souza et al., 2018; Guidolotti et al., 2019; Yanez-Serrano et al., 2019) including the leaf-internal re-fixation of respired CO2 (Garcia et al., 2019).
The relative ETR was also by far the best predictor of emission changes to high CO2 at 30 ∘C (Fig. 3d), suggesting that the same mechanisms contributed to modulating emissions at moderate low and at high CO2. Earlier studies on isoprene emissions suggested that this high-CO2 inhibition results from an activation of the cytosolic PEP carboxylase under high [CO2] (but see Abadie and Tcherkez, 2019), leading to a reduction in PEP available for import into chloroplasts and in turn less pyruvate for isoprenoid biosynthesis (Rosenstiel et al., 2003). This hypothesis however does not explain its temperature dependency (Sun et al., 2013; Monson et al., 2016) and was not confirmed by experiments using competitive PEP-carboxylase inhibitors (Rasulov et al., 2018). An alternative hypothesis links the emission reduction at high CO2 to the occurrence of feedback inhibition of photosynthesis (Sharkey and Monson, 2014, and references therein). A lack of increase or decrease in A and the ETR at high CO2 is typically observed when the production of triose phosphate from CO2 fixation in the CBB cycle largely exceeds its utilization for starch and sucrose synthesis (triose phosphate utilization (TPU) limitation; McClain and Sharkey, 2019). As a result, the accumulation of sugar phosphates causes the depletion of inorganic phosphate (Pi) necessary to sustain ATP synthesis. This ultimately leads to an inhibition of photosynthetic light and dark reactions and also of the availability of pyruvate inside the chloroplasts by compromising its exchange rates from the cytosol via Pi transporters (Sharkey and Monson, 2014; de Souza et al., 2018). TPU limitation of photosynthesis occurs less under high temperature, mostly because sucrose synthesis and consumption in sink tissues are enhanced, thereby restoring Pi levels. Besides its direct effect on metabolic rates, high temperature decreases CO2 solubility (in pure water approx. −10 % from 30 to 35 ∘C), which may lower photosynthetic CO2 fixation (Potosnak et al., 2014) and hence alleviate TPU limitation. Growth conditions can affect TPU. Plants acclimatized to low temperature or elevated CO2 tend to have an increased Pi regeneration capacity, thus being less vulnerable to TPU limitation (McClain and Sharkey, 2019). Consistent with this, we found little evidence of TPU limitation in our study at 35 ∘C assay temperature. Moreover, the greatest decrease in emission and photosynthetic processes was observed in warm-grown plants, particularly in the 400/25 regime. These plants had the lowest leaf growth and thus a low capacity to utilize photosynthates, which is expected to favor TPU limitation. On the other hand, there was no overall correlation between the plant's growth rates and their emission responsiveness to high CO2 (Table S3b and Fig. S7 in Supplement 2). Furthermore, comparing the shape of response curves of individual normalized E and ETR data points, rather than their means, suggests that their evolutions during high and low CO2 ramping were partly disconnected in opposite ways (Figs. 2 and S6 in Supplement 1): during low CO2 ramping, emissions often increased while the ETR always decreased, and during high CO2 ramping, emissions frequently decreased earlier and more than the ETR. Similarly, Monson et al. (2016) and Lantz et al. (2019b) reported that isoprene emissions decreased in response to high CO2 before TPU limitation appeared. In our study, the ETR rarely decreased at a Ci lower than 800 ppm, which is consistent with the global minimum Ci value of TPU limitation concluded by Kumarathunge et al. (2019). Thus, with the exception of a few cases, MT emission began to decline when the ETR was mostly insensitive to increasing CO2, i.e., at a stage when CO2 fixation by the CBB cycle is limited by the production of energetic cofactors from the ETR to regenerate the primary CO2 O2 acceptor ribulose 1,5-bisphosphate. At this stage, A should still slightly increase with increasing Ci because photorespiration, the second most important electron sink, is progressively inhibited, as evidenced by a decrease in the ETR ratio. As a result, energetic cofactors might be less available for the MEP pathway, notably reduction power, which is consumed more during CO2 reduction than during photorespiration with respect to ATP (Niinemets et al., 2021, and references therein). This hypothesis has been used as the basis for photosynthesis-linked modeling of isoprene emissions named the “excess energy” or “energy status” model (e.g., Morfopoulos et al., 2014; Grote et al., 2014). The temperature dependence of the high CO2 inhibition is explained by the fact that at high temperatures, a high ETR is maintained while the fraction of electrons consumed in the CBB cycle is reduced. In the same context, isoprene emissions were assumed to be positively related to NPQ as an indicator of excess reduction power available for isoprenoid biosynthesis (Peñuelas et al., 2013; Filella et al., 2018). Our results provide partial support for the excess energy hypothesis: the ETR ratios (ETR ) were indeed generally higher at 35 ∘C than at 30 ∘C due to a higher ETR at 35 ∘C (Table S2 in Supplement 1). The difference was only significant for warm-grown plants, which is consistent with their stronger emission responsiveness to CO2 (t test, P=0.025). Furthermore, during initial CO2 ramping to low CO2 the ETR ratios strongly increased (Fig. S8a in Supplement 1), which would explain why emissions frequently increased under moderate low CO2 at 30 ∘C before presumably being constrained by the lack of basic C3 substrates (see discussion above). Yet, in response to high CO2, ETR ratios decreased little and were less related to the emission changes than the ETR (μETR ETR , Table S3b in Supplement 2; Fig. S8b and c in Supplement 1). Also, our study showed not a positive but a negative correlation between emission responses to high CO2 and NPQ (Fig. 3e), indicating that the maintenance of NPQ processes during high CO2 co-constrained the ETR, A and MT synthesis. Since our plants were adapted to greenhouse light conditions, the continuous exposure to high PPFD caused some photooxidative stress (Fv Fm reduction). Especially during exposure to the lowest [CO2] when the ETR and A rapidly declined, electrons or excitation energy from excessive light was likely transferred to O2, generating ROS. NPQ and ROS formation reduce the availability of reduction power in two ways: first by reducing its formation during PSII electron transport by diverting the absorption or the absorbed light energy from photosystems (thus lowering the ETR) and, second, by enhancing its consumption for ROS detoxification and NPQ mechanisms inside chloroplasts, notably in redox reactions associated with the xanthophyll cycle, the water–water cycle starting with the Mehler reaction, the glutathione–ascorbate cycle and the ferredoxin thioredoxin system (for overviews see, for example, Asada, 2006; Foyer and Noctor, 2016; Choudhury et al., 2016; Ruban, 2016; Kang et al., 2019). Thus during high CO2 ramping, when the ETR and A frequently co-evolved, a variable portion of PSII electrons were diverted from MT biosynthesis for repair and protective mechanisms in addition to those for the CBB cycle. We are unable to quantify the losses and altered allocation of photochemical energy in our experiments. Based on the measured Fv Fm values, the total loss of the leaf's capacity for PSII electron transport during CO2 ramping was about 10 %, to which would be added the use of reduction equivalents in stress-related redox systems. For comparison, the calculated quantity of electrons spent for MT emissions (e−-loss) rarely exceeded 1 % (0.57 ± 0.17 and 0.80 ± 0.21 at 30 and 35 ∘C respectively), of which less than half was used in the MEP pathway (12 of the total 28 mol reduction equivalents for 1 mol MT; Sharkey and Monson, 2014). Hence, the fraction of excess electrons used for MT synthesis was very small compared to the total stress-related ETR reduction and to other electron sinks in general (Dani et al., 2014b). Furthermore, photooxidative stress also occurred at 35 ∘C (albeit to a lower extent than at 30 ∘C), when emissions were much higher but hardly affected by high-CO2 exposure. These facts suggest that additional processes must have determined the availability of energetic cofactors and carbon intermediates for MT synthesis during high CO2 exposure. Given the relatively long exposure times applied in our study, these have likely included regulation of enzymes activities at the transcriptional level. For example, photooxidative stress induces the biosynthesis of higher isoprenoids downstream such as carotenoids and tocopherols via retrograde signals of ROS, MEP-pathway precursors or carotenoid degradation products (Xiao et al., 2012; Ramel et al., 2013; Foyer, 2018; Jiang and Dehesh, 2021). This might have curtailed the synthesis of MTs through competition for the same precursors or oppositely enhanced it by relieving feedback inhibitions in the MEP pathway, thus keeping precursors at higher levels (Behnke et al., 2009; Banerjee et al., 2013; Ghirardo et al., 2014; Rasulov et al., 2014; Zuo et al., 2019; Sun et al., 2020, and references therein).
4.3 Relevance for predicting MT emissions
The results of our simulations suggest that at annual scale, the observed emission inhibition under double CO2 is unlikely to compensate for the emission increase from projected warming. However, even though we combined a wide range of scenarios in these simulations, the general validity of these results and their extrapolation to other BVOC-emitting species should be viewed with caution for several reasons: an important determinant of the annual weight of CO2 inhibition was the degree of its temperature dependence. The slope (2 % ∘C−1; see Supplement 3) we derived from the measurements on plants grown at elevated CO2 and elevated temperature is only about half that reported in Potosnak et al. (2014) and Sharkey and Monson (2014). This may indicate that our simulations underestimated CO2 inhibition at temperatures below 30 ∘C. However, the results shown in those studies were obtained for isoprene with other tree species at more than double [CO2], limiting their validity for our study. Another issue that questions the transferability of our results concerns the Ci values. Because the sclerophyllous leaves of QI assimilate CO2 at relatively high rates with respect to their stomatal conductance, the Ci will be lower in QI than in many other tree species at the same ambient [CO2]. For example, in our study, the ratio of Ci to 400 ppm ambient [CO2] was 0.55, whereas global emission and vegetation models typically assume a ratio of 0.7 (e.g., Guenther et al., 2012; Grote et al., 2014). Therefore, QI emissions may be less inhibited under elevated [CO2] than other species. Changes in Ci may also play a role in emission responses to drought, which were not accounted for in our simulations. Under a moderate water deficit, when photosynthetic processes are still fully active, stomata partially close to conserve water. As a result, Ci decreases and leaf temperature increases (due to lower evaporative cooling), reducing the inhibition of emissions by high CO2. This phenomenon may explain why emissions sometimes increased during the initial phase of water stress (e.g., Pegoraro et al., 2007; Staudt et al., 2008). However, during severe drought events, which are expected to increase in the future (Gao and Giorgi, 2008), emissions decrease, as assumed in our simulations. There are other factors that could change the annual VOC budget of leaves in a warmer and CO2-rich world, such as earlier leaf development, longer leaf lifespan and the associated duration of emissions (Staudt et al., 2017; Mochizuki et al., 2020). Further studies are needed to gain in-depth knowledge of the variation in CO2 sensitivity of QI emissions, especially in mature trees under real field conditions. In particular, it would be interesting to know whether the temperature sensitivity is stable throughout the day and year or whether it changes with actual light conditions and photoperiod, plant water and phenological status due to changes in the production and allocation of energetic cofactors and precursors of the MEP pathway within the chloroplasts (see, for example, Sun et al., 2012; Grote et al., 2014; Monson et al., 2016).
The results from CO2-response curves measured at 30 ∘C assay temperature showed that MT emissions from QI become essentially inhibited under very high [CO2] (≥ 1200 ppm), whereas [CO2] lower than 400 ppm both increased and decreased emissions. This CO2 responsiveness was clearly temperature dependent. High assay temperature (here 35 ∘C) neutralized the high-CO2 inhibition of emissions and accentuated the emission decrease at low [CO2]. In addition, growth temperature influenced CO2 responsiveness and this in the opposite way to assay temperature. Emissions of plants grown under an elevated temperature regime were more inhibited by high [CO2] than plants grown under lower temperatures. Growth under elevated CO2 had no significant effect on the CO2 response of emissions though it enhanced the leaf growth of the plants. The CO2 responsiveness of emissions was also not different between chemotypes and was similar for all individual major MTs. Correlation analyses suggest that the changes in MT emissions in response to CO2 changes were mainly driven by concurrent changes in the availability of energetic cofactors from photosynthetic electron transport, which are required to maintain monoterpene synthesis in chloroplasts. However, at the lowest [CO2], MT production was likely co-constrained by the availability of basic carbon substrates as indicated by a relationship between the drop in emissions and the leaf's initial CO2-assimilation rate. We hypothesize that several processes, whose magnitudes changed during the different phases of CO2 ramping and which differed between leaf and plant replicates, determined the availability of energetic cofactors. These included, on the one hand, changes in their production due to photoinhibition and photooxidative damage or feedback inhibition of photosynthesis (TPU limitation) and, on the other hand, changes in their distribution between MT synthesis, CO2 fixation and photorespiration, non-photochemical quenching, and repair and detoxification mechanisms associated with oxidative stress. The results of the correlation analyses also suggest that the growth performance of the plants (leaf mass) was related to the ability of their leaves to produce photosynthates and MTs.
Overall, our results confirm an isoprene-analogous behavior of MT emissions from QI. Fitting the algorithm used in MEGAN to account for CO2 effects to our emission data obtained at 30 ∘C resulted in a non-linear response curve that is very similar to the curve currently used for isoprene emissions. In addition, we performed several simulations to estimate the annual BVOC release from QI leaves under a warmer climate at double atmospheric [CO2]. The results showed that the observed emission inhibition at 800 ppm CO2 would be insufficient to offset the increase in foliar emissions due to the projected warming.
The data used in this work are available from the corresponding author upon request (michael.staudt@cefe.cnrs.fr).
The supplement related to this article is available online at: https://doi.org/10.5194/bg-19-4945-2022-supplement.
MS designed the experiment, analyzed the data and wrote the manuscript; JD and JI performed the measurements; ND helped reviewing and editing the manuscript.
The contact author has declared that none of the authors has any competing interests.
Publisher’s note: Copernicus Publications remains neutral with regard to jurisdictional claims in published maps and institutional affiliations.
We are grateful to all staff members of the CEFE institute platforms PACE and TE for their technical assistance and in particular to Bruno Buatois and David Degueldre. Thanks also to Jean Kempf for providing the Puéchabon data.
This research has been supported by the Agence Nationale de la Recherche (ODORSCAPE project, grant no. ANR15-CE02-010-01, as well as grant no. ANR-10-LABX-04-01).
This paper was edited by Paul Stoy and reviewed by two anonymous referees.
Abadie, C. and Tcherkez, G.: In vivo phosphoenolpyruvate carboxylase activity is controlled by CO2 and O2 mole fractions and represents a major flux at high photorespiration rates, New Phytol., 221, 1843–1852, https://doi.org/10.1111/nph.15500, 2019.
Affek, H. P. and Yakir, D.: Protection by isoprene against singlet oxygen in leaves, Plant Physiol., 129, 269–277, https://doi.org/10.1104/pp.010909, 2002.
Ainsworth, E. and Bush, D.: Carbohydrate export from the leaf – a highly regulated process and target to enhance photosynthesis and productivity, Plant Physiol., 155, 64–96, 2011.
Arneth, A., Monson, R. K., Schurgers, G., Niinemets, Ü., and Palmer, P. I.: Why are estimates of global terrestrial isoprene emissions so similar (and why is this not so for monoterpenes)?, Atmos. Chem. Phys., 8, 4605–4620, https://doi.org/10.5194/acp-8-4605-2008, 2008.
Arneth, A., Harrison, S. P., Zaehle, S., Tsigaridis, K., Menon, S., Bartlein, P. J., Feichter, J., Korhola, A., Kulmala, M., O'Donnell, D., Schurgers, G., Sorvari, S., and Vesala, T.: Terrestrial biogeochemical feedbacks in the climate system, Nat. Geosci., 3, 525–532, https://doi.org/10.1038/ngeo905, 2010.
Asada, K.: Production and scavenging of reactive oxygen species in chloroplasts and their functions, Plant Physiol., 141, 391–396, https://doi.org/10.1104/pp.106.082040, 2006.
Banerjee, A., Wu, Y., Banerjee, R., Li, Y., Yan, H., and Sharkey, T. D.: Feedback inhibition of deoxy-d-xylulose-5-phosphate synthase regulates the methylerythritol 4-phosphate pathway, J. Biol. Chem., 288, 16926–16936, https://doi.org/10.1074/jbc.M113.464636, 2013.
Bauwens, M., Stavrakou, T., Müller, J. F., Van Schaeybroeck, B., De Cruz, L., De Troch, R., Giot, O., Hamdi, R., Termonia, P., Laffineur, Q., Amelynck, C., Schoon, N., Heinesch, B., Holst, T., Arneth, A., Ceulemans, R., Sanchez-Lorenzo, A., and Guenther, A.: Recent past (1979–2014) and future (2070–2099) isoprene fluxes over europe simulated with the megan-mohycan model, Biogeosciences, 15, 3673–3690, https://doi.org/10.5194/bg-15-3673-2018, 2018.
Behnke, K., Kleist, E., Uerlings, R., Wildt, J., Rennenberg, H., and Schnitzler, J.-P.: Rnai-mediated suppression of isoprene biosynthesis in hybrid poplar impacts ozone tolerance, Tree Physiol., 29, 725–736, https://doi.org/10.1093/treephys/tpp009, 2009.
Behnke, K., Grote, R., Brüggemann, N., Zimmer, I., Zhou, G., Elobeid, M., Janz, D., Polle, A., and Schnitzler, J.-P.: Isoprene emission-free poplars – a chance to reduce the impact from poplar plantations on the atmosphere, New Phytol., 194, 70–82, https://doi.org/10.1111/j.1469-8137.2011.03979.x, 2012.
Choudhury, F. K., Rivero, R. M., Blumwald, E., and Mittler, R.: Reactive oxygen species, abiotic stress and stress combination, Plant J., 90, 856–867, https://doi.org/10.1111/tpj.13299, 2017.
Ciccioli, P., Brancaleoni, E., Frattoni, M., Marta, S., Brachetti, A., Vitullo, M., Tirone, G., and Valentini, R.: Relaxed eddy accumulation, a new technique for measuring emission and deposition fuxes of volatile organic compounds by capillary gas chromatography and mass spectrometry, J. Chromatogr. A, 985, 283–296, https://doi.org/10.1016/S0021-9673(02)01731-4, 2003.
Dani, K. G. S., Jamie, I. M., Prentice, I. C., and Atwell, B. J.: Evolution of isoprene emission capacity in plants, Trend. Plant Sci., 19, 439–446, https://doi.org/10.1016/j.tplants.2014.01.009, 2014a.
Dani, K. G. S., Jamie, I. M., Prentice, I. C., and Atwell, B. J.: Increased ratio of electron transport to net assimilation rate supports elevated isoprenoid emission rate in eucalypts under drought, Plant Physiol., 166, 1059–1072, https://doi.org/10.1104/pp.114.246207, 2014b.
Dani, K. G. S., Pollastri, S., Pinosio, S., Reichelt, M., Sharkey, T. D., Schnitzler, J.-P., and Loreto, F.: Isoprene enhances leaf cytokinin metabolism and induces early senescence, New Phytol., 234, 961–974, https://doi.org/10.1111/nph.17833, 2022.
Daussy, J. and Staudt, M.: Do future climate conditions change volatile organic compound emissions from Artemisia annua? Elevated CO2 and temperature modulate actual VOC emission rate but not its emission capacity, Atmos. Environ. X, 7, 100082, https://doi.org/10.1016/j.aeaoa.2020.100082, 2020.
Dehimeche, N., Buatois, B., Bertin, N., and Staudt, M.: Insights into the intraspecific variability of the above and belowground emissions of volatile organic compounds in tomato, Molecules, 26, 237, https://doi.org/10.3390/molecules26010237, 2021.
de Souza, V. F., Niinemets, Ü., Rasulov, B., Vickers, C. E., Duvoisin Junior, S., Araujo, W. L., and Gonçalves, J. F. d. C.: Alternative carbon sources for isoprene emission, Trend. Plant Sci., 23, 1081–1101, https://doi.org/10.1016/j.tplants.2018.09.012, 2018.
Eller, A. S. D., de Gouw, J., Graus, M., and Monson, R. K.: Variation among different genotypes of hybrid poplar with regard to leaf volatile organic compound emissions, Ecol. Appl., 22, 1865–1875, https://doi.org/10.1890/11-2273.1, 2012.
Ezhova, E., Ylivinkka, I., Kuusk, J., Komsaare, K., Vana, M., Krasnova, A., Noe, S., Arshinov, M., Belan, B., Park, S. B., Lavric, J. V., Heimann, M., Petäjä, T., Vesala, T., Mammarella, I., Kolari, P., Bäck, J., Rannik, Ü., Kerminen, V. M., and Kulmala, M.: Direct effect of aerosols on solar radiation and gross primary production in boreal and hemiboreal forests, Atmos. Chem. Phys., 18, 17863–17881, https://doi.org/10.5194/acp-18-17863-2018, 2018.
Feng, Z., Yuan, X., Fares, S., Loreto, F., Li, P., Hoshika, Y., and Paoletti, E.: Isoprene is more affected by climate drivers than monoterpenes: A meta-analytic review on plant isoprenoid emissions, Plant Cell Environ., 42, 1939–1949, https://doi.org/10.1111/pce.13535, 2019.
Filella, I., Zhang, C., Seco, R., Potosnak, M., Guenther, A., Karl, T., Gamon, J., Pallardy, S., Gu, L., Kim, S., Balzarolo, M., Fernandez-Martinez, M., and Penuelas, J.: A MODIS photochemical reflectance index (PRI) as an estimator of isoprene emissions in a temperate deciduous forest, Remote Sens., 10, 557, https://doi.org/10.3390/rs10040557, 2018.
Fineschi, S., Loreto, F., Staudt, M., and Peñuelas, J.: Diversification of volatile isoprenoid emissions from trees: Evolutionary and ecological perspectives, in: Biology, controls and models of tree volatile organic compound emissions, edited by: Niinemets, Ü. and Monson, R. K., Tree physiology, Springer Netherlands, 1–20, https://doi.org/10.1007/978-94-007-6606-8_1, 2013.
Fischbach, R. J., Staudt, M., Zimmer, I., Rambal, S., and Schnitzler, J. P.: Seasonal pattern of monoterpene synthase activities in leaves of the evergreen tree Quercus ilex, Physiol. Plant., 114, 354–360, https://doi.org/10.1034/j.1399-3054.2002.1140304.x, 2002.
Foyer, C. H.: Reactive oxygen species, oxidative signaling and the regulation of photosynthesis, Environ. Exp. Bot., 154, 134–142, https://doi.org/10.1016/j.envexpbot.2018.05.003, 2018.
Foyer, C. H. and Noctor, G.: Stress-triggered redox signalling: What's in prospect?, Plant Cell Environ., 39, 951–964, https://doi.org/10.1111/pce.12621, 2016.
Frank, L., Wenig, M., Ghirardo, A., van der Krol, A., Vlot, A. C., Schnitzler, J.-P., and Rosenkranz, M.: Isoprene and β-caryophyllene confer plant resistance via different plant internal signaling pathways, Plant Cell Environ., 44, 1151–1164, https://doi.org/10.1111/pce.14010, 2021.
Fuentes, J. D., Hayden B. P., Garstang, M., Lerdau, M., Fitzjarrald, D., Baldocchi, D. D., Monson, R., Lamb, B., and Geron, C.: New directions: Vocs and biosphere-atmosphere feedbacks, Atmos. Environ., 35, 189–191, https://doi.org/10.1016/S1474-8177(02)80016-X, 2001.
Funk, J. L., Mak, J. E., and Lerdau, M. T.: Stress-induced changes in carbon sources for isoprene production in populus deltoides, Plant Cell Environ., 27, 747–755, https://doi.org/10.1111/j.1365-3040.2004.01177.x, 2004.
Gao, X. and Giorgi, F.: Increased aridity in the mediterranean region under greenhouse gas forcing estimated from high resolution simulations with a regional climate model, Glob. Planet. Change, 62, 195–209, https://doi.org/10.1016/j.gloplacha.2008.02.002, 2008.
Garcia, S., Jardine, K., Souza, V. F. d., Souza, R. A. F. d., Duvoisin Junior, S., and Gonçalves, J. F. d. C.: Reassimilation of leaf internal CO2 contributes to isoprene emission in the neotropical species Inga edulis Mart, Forests, 10, 472, https://doi.org/10.3390/f10060472, 2019.
Ghirardo, A., Wright, L. P., Bi, Z., Rosenkranz, M., Pulido, P., Rodríguez-Concepción, M., Niinemets, Ü., Brüggemann, N., Gershenzon, J., and Schnitzler, J.-P.: Metabolic flux analysis of plastidic isoprenoid biosynthesis in poplar leaves emitting and non-emitting isoprene, Plant Physiol., 165, 37–51, https://doi.org/10.1104/pp.114.236018, 2014.
Grote, R., Mayrhofer, S., Fischbach, R. J., Steinbrecher, R., Staudt, M., and Schnitzler, J. P.: Process-based modelling of isoprenoid emissions from evergreen leaves of Quercus ilex (l.), Atmos. Environ., 40, 152–165, https://doi.org/10.1016/j.atmosenv.2005.10.071, 2006.
Grote, R., Morfopoulos, C., Niinemets, Ü., Sun, Z., Keenan, T. F., Pacifico, F., and Butler, T. I. M.: A fully integrated isoprenoid emissions model coupling emissions to photosynthetic characteristics, Plant Cell Environ., 37, 1965–1980, https://doi.org/10.1111/pce.12326, 2014.
Guenther, A. B., Zimmerman, P. R., Harley, P. C., Monson, R. K., and Fall, R.: Isoprene and monoterpene emission rate variability: Model evaluations and sensitivity analyses, J. Geophys. Res., 98, 12609–12617, https://doi.org/10.1029/93jd00527, 1993.
Guenther, A. B., Jiang, X., Heald, C. L., Sakulyanontvittaya, T., Duhl, T., Emmons, L. K., and Wang, X.: The Model of Emissions of Gases and Aerosols from Nature version 2.1 (MEGAN2.1): an extended and updated framework for modeling biogenic emissions, Geosci. Model Dev., 5, 1471–1492, https://doi.org/10.5194/gmd-5-1471-2012, 2012.
Guidolotti, G., Calfapietra, C., and Loreto, F.: The relationship between isoprene emission, CO2 assimilation and water use efficiency across a range of poplar genotypes, Physiol. Plant., 142, 297–304, https://doi.org/10.1111/j.1399-3054.2011.01463.x, 2011.
Guidolotti, G., Pallozzi, E., Gavrichkova, O., Scartazza, A., Mattioni, M., Loreto, F., and Calfapietra, C.: Emission of constitutive isoprene, induced monoterpenes and other volatiles under high temperatures in Eucalyptus camaldulensis: A 13C labelling study, Plant Cell Environ., 42, 1929–1938, https://doi.org/10.1111/pce.13521, 2019.
Harrison, S. P., Morfopoulos, C., Dani, K. G. S., Prentice, I. C., Arneth, A., Atwell, B. J., Barkley, M. P., Leishman, M. R., Loreto, F., Medlyn, B. E., Niinemets, Ü., Possell, M., Peñuelas, J., and Wright, I. J.: Volatile isoprenoid emissions from plastid to planet, New Phytol., 197, 49–57, https://doi.org/10.1111/nph.12021, 2013.
Huang, J., Hartmann, H., Hellen, H., Wisthaler, A., Perreca, E., Weinhold, A., Racker, A., van Dam, N. M., Gershenzon, J., Trumbore, S., and Behrendt, T.: New perspectives on CO2, temperature, and light effects on BVOC emissions using online measurements by PTR-MS and cavity ring-down spectroscopy, Environ. Sci. Technol., 52, 13811–13823, https://doi.org/10.1021/acs.est.8b01435, 2018.
IPCC: Climate Change 2021: The Physical Science Basis, Contribution of Working Group I to the Sixth Assessment Report of the Intergovernmental Panel on Climate Change, edited by: Masson-Delmotte, V., Zhai, P., Pirani, A., Connors, S. L., Péan, C., Berger, S., Caud, N., Chen, Y., Goldfarb, L., Gomis, M.I., Huang, M., Leitzell, K., Lonnoy, E., Matthews, J. B. R., Maycock, T. K., Waterfield, T., Yelekçi, O., Yu, R., and Zhou, B., Cambridge University Press, Cambridge, United Kingdom and New York, NY, USA, in press, https://doi.org/10.1017/9781009157896, 2021.
Jiang, J. and Dehesh, K.: Plastidial retrograde modulation of light and hormonal signaling: An odyssey, New Phytol., 230, 931–937, https://doi.org/10.1111/nph.17192, 2021.
Jokinen, T., Berndt, T., Makkonen, R., Kerminen, V.-M., Junninen, H., Paasonen, P., Stratmann, F., Herrmann, H., Guenther, A. B., Worsnop, D. R., Kulmala, M., Ehn, M., and Sipilä, M.: Production of extremely low volatile organic compounds from biogenic emissions: Measured yields and atmospheric implications, P. Natl. Acad. Sci. USA, 112, 7123–7128, https://doi.org/10.1073/pnas.1423977112, 2015.
Kang, Z., Qin, T., and Zhao, Z.: Thioredoxins and thioredoxin reductase in chloroplasts: A review, Gene, 706, 32–42, https://doi.org/10.1016/j.gene.2019.04.041, 2019.
Kumarathunge, D. P., Medlyn, B. E., Drake, J. E., Rogers, A., and Tjoelker, M. G.: No evidence for triose phosphate limitation of light-saturated leaf photosynthesis under current atmospheric CO2 concentration, Plant Cell Environ., 42, 3241–3252, https://doi.org/10.1111/pce.13639, 2019.
Laisk, A. and Loreto, F.: Determining photosynthetic parameters from leaf CO2 exchange and chlorophyll fluorescence (ribulose-1,5-bisphosphate carboxylase/oxygenase specificity factor, dark respiration in the light, excitation distribution between photosystems, alternative electron transport rate, and mesophyll diffusion resistance, Plant Physiol., 110, 903–912, https://doi.org/10.1104/pp.110.3.903, 1996.
Lantz, A. T., Allman, J., Weraduwage, S. M., and Sharkey, T. D.: Isoprene: New insights into the control of emission and mediation of stress tolerance by gene expression, Plant Cell Environ., 42, 2808–2826, https://doi.org/10.1111/pce.13629, 2019a.
Lantz, A. T., Solomon, C., Gog, L., McClain, A. M., Weraduwage, S. M., Cruz, J. A., and Sharkey, T. D.: Isoprene suppression by CO2 is not due to triose phosphate utilization (tpu) limitation, Front. Forest. Glob. Change, 2, 8, https://doi.org/10.3389/ffgc.2019.00008, 2019b.
Lavoir, A. V., Staudt, M., Schnitzler, J. P., Landais, D., Massol, F., Rocheteau, A., Rodriguez, R., Zimmer, I., and Rambal, S.: Drought reduced monoterpene emissions from the evergreen mediterranean oak Quercus ilex: Results from a throughfall displacement experiment, Biogeosciences, 6, 1167–1180, https://doi.org/10.5194/bg-6-1167-2009, 2009.
Lehning, A., Zimmer, I., Steinbrecher, R., Brueggemann, N., and Schnitzler, J.-P.: Isoprene synthase activity and its relation to isoprene emission in quercus robur l. Leaves, Plant Cell Environ., 22, 495–504, https://doi.org/10.1046/j.1365-3040.1999.00425.x, 1999.
Loreto, F. and Sharkey, T.: A gas-exchange study of photosynthesis and isoprene emission in Quercus rubra l, Planta, 182, 523–531, https://doi.org/10.1007/BF02341027, 1990.
Loreto, F., Ciccioli, P., Cecinato, A., Brancaleoni, E., Frattoni, M., and Tricoli, D.: Influence of environmental factors and air composition on the emission of a-pinene from Quercus ilex leaves, Plant Physiol., 110, 267–275, 1996a.
Loreto, F., Ciccioli, P., Cecinato, A., Brancaleoni, E., Frattoni, M., Fabozzi, C., and Tricoli, D.: Evidence of the photosynthetic origin of monoterpene emitted by Quercus ilex l. Leaves by 13C labelling, Plant Physiol., 110, 1317–1322, https://doi.org/10.1104/pp.110.4.1317, 1996b.
Loreto, F., Fischbach, R., Schnitzler, J.-P., Ciccioli, P., Brancaleoni, E., Calfapietra, C., and Seufert, G.: Monoterpene emission and monoterpene synthase activities in the mediterranean evergreen oak Quercus ilex l. Grown at elevated CO2 concentrations, Glob. Change Biol., 7, 709–717, https://doi.org/10.1046/j.1354-1013.2001.00442.x, 2001.
McClain, A. M. and Sharkey, T. D.: Triose phosphate utilization and beyond: From photosynthesis to end product synthesis, J. Exp. Bot., 70, 1755–1766, https://doi.org/10.1093/jxb/erz058, 2019.
McFiggans, G., Mentel, T. F., Wildt, J., Pullinen, I., Kang, S., Kleist, E., Schmitt, S., Springer, M., Tillmann, R., Wu, C., Zhao, D., Hallquist, M., Faxon, C., Le Breton, M., Hallquist, A. M., Simpson, D., Bergström, R., Jenkin, M. E., Ehn, M., Thornton, J. A., Alfarra, M. R., Bannan, T. J., Percival, C. J., Priestley, M., Topping, D., and Kiendler-Scharr, A.: Secondary organic aerosol reduced by mixture of atmospheric vapours, Nature, 565, 587–593, https://doi.org/10.1038/s41586-018-0871-y, 2019.
Mochizuki, T., Ikeda, F., and Tani, A.: Effect of growth temperature on monoterpene emission rates of Acer palmatum, Sci. Total Environ., 745, 140886, https://doi.org/10.1016/j.scitotenv.2020.140886, 2020.
Monson, R. K. and Fall, R.: Isoprene emission from aspen leaves: Influence of environment and relation to photosynthesis and photorespiration, Plant Physiol., 90, 267–274, https://doi.org/10.1104/pp.90.1.267, 1989.
Monson, R. K., Hills, A. J., Zimmerman, P. R., and Fall, R. R.: Studies of the relationship between isoprene emission rate and CO2 or photon-flux density using a real-time isoprene analyser, Plant Cell Environ., 14, 517–523, https://doi.org/10.1111/j.1365-3040.1991.tb01522.x, 1991.
Monson, R. K., Jones, R. T., Rosenstiel, T. N., and Schnitzler, J.-P.: Why only some plants emit isoprene, Plant Cell Environ., 36, 503–516, https://doi.org/10.1111/pce.12015, 2012.
Monson, R. K., Neice, A. A., Trahan, N. A., Shiach, I., McCorkel, J. T., and Moore, D. J. P.: Interactions between temperature and intercellular CO2 concentration in controlling leaf isoprene emission rates, Plant Cell Environ., 39, 2404–2413, https://doi.org/10.1111/pce.12787, 2016.
Monson, R. K., Winkler, B., Rosenstiel, T. N., Block, K., Merl-Pham, J., Strauss, S. H., Ault, K., Maxfield, J., Moore, D. J. P., Trahan, N. A., Neice, A. A., Shiach, I., Barron-Gafford, G. A., Ibsen, P., McCorkel, J. T., Bernhardt, J. R., and Schnitzler, J.-P.: High productivity in hybrid-poplar plantations without isoprene emission to the atmosphere, P. Natl. Acad. Sci. USA, 117, 1596–1605, https://doi.org/10.1073/pnas.1912327117, 2020.
Monson, R. K., Weraduwage, S. M., Rosenkranz, M., Schnitzler, J.-P., and Sharkey, T. D.: Leaf isoprene emission as a trait that mediates the growth-defense tradeoff in the face of climate stress, Oecologia, 197, 885–902, https://doi.org/10.1007/s00442-020-04813-7, 2021.
Morfopoulos, C., Sperlich, D., Peñuelas, J., Filella, I., Llusià, J., Medlyn, B. E., Niinemets, Ü., Possell, M., Sun, Z., and Prentice, I. C.: A model of plant isoprene emission based on available reducing power captures responses to atmospheric CO2, New Phytol., 203, 125–139, https://doi.org/10.1111/nph.12770, 2014.
Murchie, E. H. and Lawson, T.: Chlorophyll fluorescence analysis: A guide to good practice and understanding some new applications, J. Exp. Bot., 64, 3983–3998, https://doi.org/10.1093/jxb/ert208, 2013.
Niinemets, Ü., Reichstein, M., Staudt, M., Seufert, G., and Tenhunen, J.D.: Stomatal constraints may effect emissions of oxygenated monoterpenes from the foliage of pinus pinea, Plant Physiol., 130, 1371–1385, https://doi.org/10.1104/pp.009670, 2002a.
Niinemets, Ü., Seufert, G., Steinbrecher, R., and Tenhunen, J. D.: A model coupling foliar monoterpene emissions to leaf photosynthetic characteristics in mediterranean evergreen quercus species, New Phytol., 153, 257–275, https://doi.org/10.1046/j.0028-646X.2001.00324.x, 2002b.
Niinemets, Ü., Cescatti, A., Rodeghiero, M., and Tosens, T.: Complex adjustments of photosynthetic potentials and internal diffusion conductance to current and previous light availabilities and leaf age in mediterranean evergreen species Quercus ilex, Plant Cell Environ., 29, 1159–1178, https://doi.org/10.1111/j.1365-3040.2006.01499.x, 2006.
Niinemets, Ü., Fares, S., Harley, P., and Jardine, K. J.: Bidirectional exchange of biogenic volatiles with vegetation: Emission sources, reactions, breakdown and deposition, Plant Cell Environ., 37, 1790–1809, https://doi.org/10.1111/pce.12322, 2014.
Niinemets, Ü., Rasulov, B., and Talts, E.: CO2-responsiveness of leaf isoprene emission: Why do species differ?, Plant Cell Environ., 44, 3049–3063, https://doi.org/10.1111/pce.14131, 2021.
Pacifico, F., Folberth, G. A., Jones, C. D., Harrison, S. P., and Collins, W. J.: Sensitivity of biogenic isoprene emissions to past, present, and future environmental conditions and implications for atmospheric chemistry, J. Geophys. Res.-Atmos., 117, D22302, https://doi.org/10.1029/2012JD018276, 2012.
Pazouki, L. and Niinemets, Ü.: Multi-substrate terpene synthases: Their occurrence and physiological significance, Front. Plant Sci., 7, 1019, https://doi.org/10.3389/fpls.2016.01019, 2016.
Pegoraro, E., Potosnak, M. J., Monson, R. K., Rey, A., Barron-Gafford, G., and Osmond, C. B.: The effect of elevated CO2, soil and atmospheric water deficit and seasonal phenology on leaf and ecosystem isoprene emission, Funct. Plant Biol., 34, 774–784, https://doi.org/10.1071/FP07021, 2007.
Peñuelas, J. and Llusià, J.: Seasonal emission of monoterpenes by the mediterranean tree Quercus ilex in field conditions: Relations with photosynthetic rates, temperature and volatility, Physiol. Plant., 105, 641–647, https://doi.org/10.1034/j.1399-3054.1999.105407.x, 1999.
Peñuelas, J. and Staudt, M.: BVOCs and global change, Trend. Plant Sci., 15, 133–144, https://doi.org/10.1016/j.tplants.2009.12.005, 2010.
Peñuelas, J., Marino, G., Llusia, J., Morfopoulos, C., Farré-Armengol, G., and Filella, I.: Photochemical reflectance index as an indirect estimator of foliar isoprenoid emissions at the ecosystem level, Nat. Commun., 4, 2604, https://doi.org/10.1038/ncomms3604, 2013.
Possell, M. and Hewitt, C. N.: Isoprene emissions from plants are mediated by atmospheric CO2 concentrations, Glob. Change Biol., 17, 1595–1610, https://doi.org/10.1111/j.1365-2486.2010.02306.x, 2011.
Possell, M., Heath, J., Hewitt, N. C., Ayres, E., and Kerstiens, G.: Interactive effects of elevated CO2 and soil fertility on isoprene emissions from quercus robur, Glob. Change Biol., 10, 1835–1843, https://doi.org/10.1111/j.1365-2486.2004.00845.x, 2004.
Potosnak, M. J., LeStourgeon, L., and Nunez, O.: Increasing leaf temperature reduces the suppression of isoprene emission by elevated CO2 concentration, Sci. Total Environ., 481, 352–359, https://doi.org/10.1016/j.scitotenv.2014.02.065, 2014.
Ramel, F., Mialoundama, A. S., and Havaux, M.: Nonenzymic carotenoid oxidation and photooxidative stress signalling in plants, J. Exp. Bot., 64, 799–805, https://doi.org/10.1093/jxb/ers223, 2013.
Rantala, P., Aalto, J., Taipale, R., Ruuskanen, T. M., and Rinne, J.: Annual cycle of volatile organic compound exchange between a boreal pine forest and the atmosphere, Biogeosciences, 12, 5753–5770, https://doi.org/10.5194/bg-12-5753-2015, 2015.
Rap, A., Scott, C. E., Reddington, C. L., Mercado, L., Ellis, R. J., Garraway, S., Evans, M. J., Beerling, D. J., MacKenzie, A. R., Hewitt, C. N., and Spracklen, D. V.: Enhanced global primary production by biogenic aerosol via diffuse radiation fertilization, Nat. Geosci., 11, 640–644, https://doi.org/10.1038/s41561-018-0208-3, 2018.
Rapparini, F., Baraldi, R., Miglietta, F., and Loreto, F.: Isoprenoid emission in trees of Quercus pubescens and Quercus ilex with lifetime exposure to naturally high CO2 environment, Plant Cell Environ., 27, 381–391, https://doi.org/10.1111/j.1365-3040.2003.01151.x, 2004.
Rasulov, B., Huve, K., Valbe, M., Laisk, A., and Niinemets, U.: Evidence that light, carbon dioxide, and oxygen dependencies of leaf isoprene emission are driven by energy status in hybrid aspen, Plant Physiol., 151, 448–460, https://doi.org/10.1104/pp.109.141978, 2009.
Rasulov, B., Huve, K., Bichele, I., Laisk, A., and Niinemets, U.: Temperature response of isoprene emission in vivo reflects a combined effect of substrate limitations and isoprene synthase activity: A kinetic analysis, Plant Physiol., 154, 1558–1570, 2010.
Rasulov, B., Bichele, I., Laisk, A. G. U., and Niinemets, Ü.: Competition between isoprene emission and pigment synthesis during leaf development in aspen, Plant Cell Environ., 37, 724–741, https://doi.org/10.1111/pce.12190, 2014.
Rasulov, B., Bichele, I., Hüve, K., Vislap, V., and Niinemets, Ü.: Acclimation of isoprene emission and photosynthesis to growth temperature in hybrid aspen: Resolving structural and physiological controls, Plant Cell Environ., 38, 751–766, https://doi.org/10.1111/pce.12435, 2015.
Rasulov, B., Talts, E., Bichele, I., and Niinemets, Ü.: Evidence that isoprene emission is not limited by cytosolic metabolites. Exogenous malate does not invert the reverse sensitivity of isoprene emission to high [CO2], Plant Physiol., 176, 1573–1586, https://doi.org/10.1104/pp.17.01463, 2018.
Rosenstiel, T., Potosnak, M. J., Griffin, K. L., Fall, R., and Monson, R. K.: Increased CO2 uncouples growth from isoprene emission in an agriforest ecosystem, Nature, 421, 256–259, https://doi.org/10.1038/nature01312, 2003.
Ruban, A. V.: Nonphotochemical chlorophyll fluorescence quenching: Mechanism and effectiveness in protecting plants from photodamage, Plant Physiol., 170, 1903–1916, https://doi.org/10.1104/pp.15.01935, 2016.
Scott, C. E., Arnold, S. R., Monks, S. A., Asmi, A., Paasonen, P., and Spracklen, D. V.: Substantial large-scale feedbacks between natural aerosols and climate, Nat. Geosci., 11, 44–48, https://doi.org/10.1038/s41561-017-0020-5, 2018.
Seco, R., Karl, T., Turnipseed, A., Greenberg, J., Guenther, A., Llusia, J., Peñuelas, J., Dicken, U., Rotenberg, E., Kim, S., and Yakir, D.: Springtime ecosystem-scale monoterpene fluxes from mediterranean pine forests across a precipitation gradient, Agr. Forest Meteorol., 237, 150–159, https://doi.org/10.1016/j.agrformet.2017.02.007, 2017.
Seneviratne, S. I., Donat, M. G., Pitman, A. J., Knutti, R., and Wilby, R. L.: Allowable CO2 emissions based on regional and impact-related climate targets, Nature, 529, 477–483, https://doi.org/10.1038/nature16542, 2016.
Sharkey, T. D. and Monson, R. K.: The future of isoprene emission from leaves, canopies and landscapes, Plant Cell Environ., 37, 1727–1740, https://doi.org/10.1111/pce.12289, 2014.
Sharkey, T. D., Loreto, F., and Delwiche, C. F.: High carbon dioxide and sun/shade effects on isoprene emissions from oak and aspen tree leaves, Plant Cell Environ., 14, 333–338, https://doi.org/10.1111/j.1365-3040.1991.tb01509.x, 1991.
Sharkey, T. D., Gray, D. W., Pell, H. K., Breneman, S. R., and Topper, L.: Isoprene synthase genes form a monophyletic clade of acyclic terpene synthases in the tps-b terpene synthase family, Evolution, 67, 1026–1040, https://doi.org/10.1111/evo.12013, 2013.
Sporre, M. K., Blichner, S. M., Karset, I. H. H., Makkonen, R., and Berntsen, T. K.: Bvoc-aerosol-climate feedbacks investigated using noresm, Atmos. Chem. Phys., 19, 4763–4782, https://doi.org/10.5194/acp-19-4763-2019, 2019.
Staudt, M. and Bertin, N.: Light and temperature dependence of the emission of cyclic and acyclic monoterpenes from holm oak (Quercus ilex l.) leaves, Plant Cell Environ., 21, 385–395, https://doi.org/10.1046/j.1365-3040.1998.00288.x, 1998.
Staudt, M., Joffre, R., Rambal, S., and Kesselmeier, J.: The effect of elevated CO2 on terpene emission, leaf structure and related physiological parameters of young Quercus ilex L. trees, Tree Physiol., 21, 437–445, https://doi.org/10.1093/treephys/21.7.437, 2001.
Staudt, M., Rambal, S. Joffre, R., and Kesselmeier, J.: Impact of drought on seasonal monoterpene emissions from Quercus ilex in southern France, J. Geophys. Res., 107, 4602, https://doi.org/10.1029/2001JD002043, 2002.
Staudt, M., Joffre, R., and Rambal, S.: How growth conditions affect the capacity of Quercus ilex leaves to emit monoterpenes, New Phytol., 158, 61–73, https://doi.org/10.1046/j.1469-8137.2003.00722.x, 2003.
Staudt, M., Morin, X., and Chuine, I.: Contrasting direct and indirect effects of warming and drought on isoprenoid emissions from mediterranean oaks, Reg. Environ. Change, 17, 2121–2133, https://doi.org/10.1007/s10113-016-1056-6, 2017.
Sun, Z., Niinemets, Ü., Hüve, K., Noe, S. M., Rasulov, B., Copolovici, L., and Vislap, V.: Enhanced isoprene emission capacity and altered light responsiveness in aspen grown under elevated atmospheric CO2 concentration, Glob. Change Biol., 18, 3423–3440, https://doi.org/10.1111/j.1365-2486.2012.02789.x, 2012.
Sun, Z., Hüve, K., Vislap, V., and Niinemets, Ü.: Elevated [CO2] magnifies isoprene emissions under heat and improves thermal resistance in hybrid aspen, J. Exp. Bot., 64, 5509–5523, https://doi.org/10.1093/jxb/ert318, 2013.
Sun, Z., Shen, Y., and Niinemets, Ü.: Responses of isoprene emission and photochemical efficiency to severe drought combined with prolonged hot weather in hybrid populus, J. Exp. Bot., 71, 7364–7381, https://doi.org/10.1093/jxb/eraa415, 2020.
Tani, A. and Mochizuki, T.: Review: Exchanges of volatile organic compounds between terrestrial ecosystems and the atmosphere, J. Agr. Meteorol., 77, 66–80, https://doi.org/10.2480/agrmet.D-20-00025, 2021.
Trowbridge, A. M., Asensio, D., Eller, A. S. D., Way, D. A., Wilkinson, M. J., Schnitzler, J.-P., Jackson, R. B., and Monson, R. K.: Contribution of various carbon sources toward isoprene biosynthesis in poplar leaves mediated by altered atmospheric CO2 concentrations, PLoS ONE, 7, e32387, https://doi.org/10.1371/journal.pone.0032387, 2012.
Wiberley, A. E., Donohue, A. R., Meier, M. E., Westphal, M. M., and Sharkey, T. D.: Regulation of isoprene emission in Populus trichocarpa leaves subjected to changing growth temperature, Plant Cell Environ., 31, 258–267, https://doi.org/10.1111/j.1365-3040.2007.01758.x, 2008.
Wilkinson, M. J., Monson, R. K., Trahan, N., Stanfield, L., Brown, E., Jackson, R. B., Polley, H. W., Fay, P. A., and Fall, R.: Leaf isoprene emission rate as a function of atmospheric CO2 concentration, Glob. Change Biol., 15, 1189–1200, https://doi.org/10.1111/j.1365-2486.2008.01803.x, 2009.
Xiao, Y., Savchenko, T., Baidoo, Edward E. K., Chehab, Wassim E., Hayden, Daniel M., Tolstikov, V., Corwin, Jason A., Kliebenstein, Daniel J., Keasling, Jay D., and Dehesh, K.: Retrograde signaling by the plastidial metabolite MEcPP regulates expression of nuclear stress-response genes, Cell, 149, 1525–1535, https://doi.org/10.1016/j.cell.2012.04.038, 2012.
Yanez-Serrano, A. M., Mahlau, L., Fasbender, L., Byron, J., Williams, J., Kreuzwieser, J., and Werner, C.: Heat stress causes enhanced use of cytosolic pyruvate for isoprene biosynthesis, J. Exp. Bot., 70, 5827–5838, https://doi.org/10.1093/jxb/erz353, 2019.
Yli-Juuti, T., Mielonen, T., Heikkinen, L., Arola, A., Ehn, M., Isokääntä, S., Keskinen, H.-M., Kulmala, M., Laakso, A., Lipponen, A., Luoma, K., Mikkonen, S., Nieminen, T., Paasonen, P., Petäjä, T., Romakkaniemi, S., Tonttila, J., Kokkola, H., and Virtanen, A.: Significance of the organic aerosol driven climate feedback in the boreal area, Nat. Commun., 12, 5637, https://doi.org/10.1038/s41467-021-25850-7, 2021.
Zhang, H., Yee, L. D., Lee, B. H., Curtis, M. P., Worton, D. R., Isaacman-VanWertz, G., Offenberg, J. H., Lewandowski, M., Kleindienst, T. E., Beaver, M. R., Holder, A. L., Lonneman, W. A., Docherty, K. S., Jaoui, M., Pye, H. O. T., Hu, W., Day, D. A., Campuzano-Jost, P., Jimenez, J. L., Guo, H., Weber, R. J., de Gouw, J., Koss, A. R., Edgerton, E. S., Brune, W., Mohr, C., Lopez-Hilfiker, F. D., Lutz, A., Kreisberg, N. M., Spielman, S. R., Hering, S. V., Wilson, K. R., Thornton, J. A., and Goldstein, A. H.: Monoterpenes are the largest source of summertime organic aerosol in the southeastern united states, P. Natl. Acad. Sci. USA, 115, 2038–2043, https://doi.org/10.1073/pnas.1717513115, 2018.
Zhu, J., Penner, J. E., Yu, F., Sillman, S., Andreae, M. O., and Coe, H.: Decrease in radiative forcing by organic aerosol nucleation, climate, and land use change, Nat. Commun., 10, 423, https://doi.org/10.1038/s41467-019-08407-7, 2019.
Zuo, Z., Weraduwage, S. M., Lantz, A. T., Sanchez, L. M., Weise, S. E., Wang, J., Childs, K. L., and Sharkey, T. D.: Isoprene acts as a signaling molecule in gene networks important for stress responses and plant growth, Plant Physiol., 180, 124–152, https://doi.org/10.1104/pp.18.01391, 2019.