the Creative Commons Attribution 4.0 License.
the Creative Commons Attribution 4.0 License.
 | 27 Oct 2022
How biogenic polymers control surfactant dynamics in the surface microlayer: insights from a coastal Baltic Sea study
Theresa Barthelmeß
Anja Engel
Surfactants can hamper gas exchange by up to 50 % in coastal seas; however, their small-scale temporal and spatial dynamics are poorly constrained. This study investigated possible biogenic sources of surfactants in the sea surface microlayer (SML) and the underlying water at a coastal Baltic Sea site. To relate surfactant dynamics to biogenic production, we conducted two field studies (June and September 2018) and focused on amino acids and carbohydrates as the main components of organic matter derived from phytoplankton. Furthermore the composition of the biochemicals provided insights into microbial degradation dynamics and was complemented by flow-cytometry-based community analysis. In total, 76 samples were collected within an area of approximately 50 km2, allowing for high spatial resolution. Moreover, morning and afternoon sampling enabled us to investigate diel cycles. Our results reveal that surfactant concentrations were tightly coupled to the abundance of nano-phytoplankton and generally higher in September than in June, with cell abundance 3 times higher. Surfactant concentration in June was best explained by the combined effect of the particulate fraction of the non-essential amino acid serine, the concentration of particulate combined carbohydrates (PCHO), and dissolved organic carbon (DOC). Surfactant and PCHO concentrations were significantly enriched in the SML and followed a pronounced diel cycle, possibly linked to microbial processing and/or photo-processing. In contrast to June, the surfactant pool in September correlated to a diverse mixture of semi-labile organic matter components, represented best by dissolved glucose and the essential amino acid isoleucine. We conclude that the surfactant pool in surface seawater is mainly composed of organic matter components that resist rapid microbial degradation. Elevated surfactant concentrations are triggered by the release of fresh organic matter. While the effect of the resistant but less surface-active stock is potentially longer-lasting, the additive effect of labile, highly surface-active agents on gas exchange may diminish on short timescales.
- Article
(3796 KB) - Full-text XML
-
Supplement
(802 KB) - BibTeX
- EndNote


The sea surface microlayer (SML) comprises the topmost ocean's surface layer and is approximately 50 to 1000 µm thin (Zhang et al., 1998, 2003b; Cunliffe et al., 2013). Within the SML, a naturally diverse organic matter pool is present, of which specific substances are attracted towards the air–sea interface due to their amphiphilic nature (Cunliffe et al., 2013). The presence of these “surfactants” at the air–sea interface modulates its properties (Jenkinson et al., 2018). A possible physicochemical barrier or viscous matrix, as induced by biogenic surfactants, hampers molecular diffusion of gas and/or reduces turbulence and thus the available surface area for gas exchange (e.g. Frew et al., 1990; Salter et al., 2011; Pereira et al., 2016; Engel et al., 2017a; Yang et al., 2021). Accelerating wind speed provokes surface turbulence, and, as a consequence, gas equilibration fluxes increase (Ho et al., 2011; Carpenter and Nightingale, 2015). However, surfactants may suppress gas exchange by up to 32 % in the open ocean (Pereira et al., 2018) and by up to 51 % in coastal regions (Pereira et al., 2016), irrespective of wind speed. Likewise, Schmidt and Schneider (2011) estimated that surfactants would reduce the CO2 net uptake in the Baltic Sea by a factor of 2. Parameterizations based on wind speed may provide a sufficient approximation for air–sea gas exchange on global and decadal scales; however, uncertainty rises with regard to smaller spatially and temporally scaled estimates (Woolf et al., 2019). This uncertainty can be attributed to the applied flux parameterizations which do not explicitly include the effect of e.g. surfactants (Woolf et al., 2019). Seasonally and regionally scaled estimates are especially important in coastal seas where the uncertainty in coastal net gas fluxes renders the global budget of greenhouse gases incomplete (Macreadie et al., 2019). Coastal seas play a major role in dampening global warming as diverse ecosystems accomplish greenhouse gas sequestration, for example, in standing phytoplankton stocks or seagrass meadows. But coastal seas are also natural sources of greenhouse gases (Bange, 2006; Humborg et al., 2019; Yang et al., 2019; Lohrberg et al., 2020). High organic matter loads and overall shorter residence times of gaseous compounds in shallow waters favour outgassing into the atmosphere (Bange, 2006). This variety of processes, affecting the release and uptake of greenhouse gases, causes great spatial and temporal heterogeneity in net gas fluxes (Gutiérrez-Loza et al., 2019; Yang et al., 2019). Better comprehension of the biogenic surfactant pool will help to improve seasonally and regionally scaled air–sea gas-exchange parameterization in coastal seas.
Surfactants are categorized according to their physicochemical and/or biochemical nature. Surfactants are described as “insoluble” (hydrophobic) versus “soluble” (hydrophilic) surfactants. Highly surface-active agents prevent less surface-active agents from adsorbing at the air–sea interface (Bock and Frew, 1993; Pogorzelski et al., 2006; Frka et al., 2012), but high concentration also favours coagulation and aggregation of surfactants (Bordes and Holmberg, 2015; Románszki and Telegdi, 2017). This competitive and dynamic replacement of chemically different surfactant species ultimately defines heterogeneous surface properties (Pogorzelski et al., 2006; Laß and Friedrichs, 2011; Frka et al., 2012). Surfactants are further classified according to their biochemical composition. Lipid-like surfactants exhibit stronger surface activity, while protein-like, followed by carbohydrate-like, surfactants decrease in activity (Ćosović and Vojvodić, 1998). Hydrophobic, lipid-dominated layers no longer represent the current model of a biogenic SML, although the influence of lipids and fatty acids is still under debate (Laß and Friedrichs, 2011; Frka et al., 2012). They may serve as condensation sites for amino-acid-enriched or carbohydrate-enriched films (Cunliffe et al., 2013). Instead, it is assumed that the major influence on gas exchange relates to carbohydrate- and protein-like material (Ćosović and Vojvodić, 1998; Cunliffe et al., 2009). While carbohydrates are acknowledged to notably influence the biogenic surfactant pool (Ẑutić et al., 1981; Frew et al., 1990; Mopper et al., 1995), natural amphiphiles based on amino acids are predominantly studied in commercial science (Messner, 1997; Satpute et al., 2010; Bordes and Holmberg, 2015). Apart from their chemical composition, surfactants also differ in size, ranging from monomeric to polymeric to colloidal structures (Jenkinson et al., 2018). Around 10 % of surface activity is attributed to the particulate pool of organic matter. During the productive season in the Adriatic Sea, 20 % to 55 % of surfactants originated from the particulate pool (Gašparovič and Ćosović, 2003).
It is widely acknowledged that natural surfactants originate from primary production and that variations in surfactants concentration relate to seasons (Ẑutić et al., 1981; Frew et al., 1990, 2001; Gašparovič and Ćosović, 2003; Croot et al., 2007). Accordingly, it has been suggested that the most refractory components of the total organic carbon (TOC) pool do not contribute to surface activity in oceanic regimes (Barthelmeß et al., 2021). It has been hypothesized that the major production of surfactants in the Baltic Sea occurs in spring (Schmidt and Schneider, 2011). Possible mechanisms explaining the release of surfactants during phytoplankton blooms include exudation, leakage, lysis by viral infection, or grazing (Ẑutić et al., 1981; Kujawinski et al., 2002; O'Dowd et al., 2015; Miyazaki et al., 2020). However, it has also been found that chlorophyll a (Chl a), which is commonly applied as a proxy for primary production, does not predict surfactant occurrence adequately on an ocean-wide scale (Sabbaghzadeh et al., 2017). As an alternative source, bacteria have been linked to the production of surfactants (Messner, 1997; Satpute et al., 2010). Kurata et al. (2016) reported that specific heterotrophic bacteria strains were associated with a surfactant-covered surface. Based on their amphiphilic nature, surfactants have been defined as agents to facilitate the uptake of insoluble substrates by microorganisms (Sekelsky and Shreve, 1999). Predominantly degraded material has been suggested to complement overall low surface activity in the subtropical North Atlantic (Van Pinxteren et al., 2020). In summary, peaks in surfactant concentrations decoupled from primary production may originate from e.g. microbial degradation, terrestrial run-off, grazing, or abiotic processing such as photochemical alteration (Kujawinski et al., 2002; Laß et al., 2013; Cuscov and Muller, 2015; Stolle et al., 2020). Corroborating this alternative hypothesis, two long-term field studies conducted in the Baltic Sea concluded that surfactant concentration peaks only several months after the spring bloom (Pogorzelski et al., 2006; Laß et al., 2013). Not only seasonal but also diurnal variations, which are likely coupled to microbial and/or photochemical turnover, have been suggested to influence the surfactant pool and affect air–sea gas exchange (Zhang et al., 2003a; Stolle et al., 2020).
This study investigates possible biogenic sources of surfactants in the surface water at a coastal Baltic Sea site. Seasonal dynamics in the Baltic Sea are well known, and hence this habitat was chosen as the study area. We aim to explore which biopolymer composition controls surface activity by setting the focus on amino acids and carbohydrates as the main components of phytoplankton-derived organic matter (Thornton, 2014; Benner and Amon, 2015) and possibly also the natural surfactant pool. Therefore, two seasons (late spring and late summer) are compared, which are potentially characterized by different phytoplankton communities. By substantially restricting the spatial scale of our study, we are able to resolve short-term temporal dynamics. Simultaneously, molecular analysis of organic matter complemented by flow-cytometry-based community analysis offers insights into whether surfactants potentially originate from autotrophic or heterotrophic production.
2.1 Study area and design
The Baltic Sea is brackish and subject to land run-off and river discharge. It is a semi-enclosed basin surrounded by industrialized countries with massive agricultural land use, wastewater treatment plants, and ship traffic, all of which increase the nutrient input into an already highly eutrophicated system (HELCOM, 2018). The study was conducted close to the time series station Boknis Eck, which has been operated since 1957 (Lennartz et al., 2014). Boknis Eck is located at the entrance of the Eckernförde Bay in the German Baltic Sea (54∘31′ N, 10∘02′ E) and belongs to the waters of the Danish straits (Kattegat). The coastal Baltic Sea is generally very shallow, and the water depth at the time series station is only 28 m. Although close to the coastline, nearby freshwater input is considered minor (Hoppe et al., 2013). Samples were collected in an area of approximately 50 km2 in June (AL510, 3–15 June 2018) and September (AL516, 13–22 September 2018) from on board the RV Alkor (Fig. 1). During the first and second cruise, morning sampling took place between 07:00 and 09:00 local time, while afternoon sampling was conducted between 18:00 and 20:00 and around 17:00 local time, respectively. In total, 23 and 19 stations were sampled during the first and second cruise, of which an overview is provided in Table S1 (in the Supplement). It is important to mention that SML sampling was conducted in parallel to a trace-gas release study, thus ensuring that a single waterbody was tracked within each cruise.
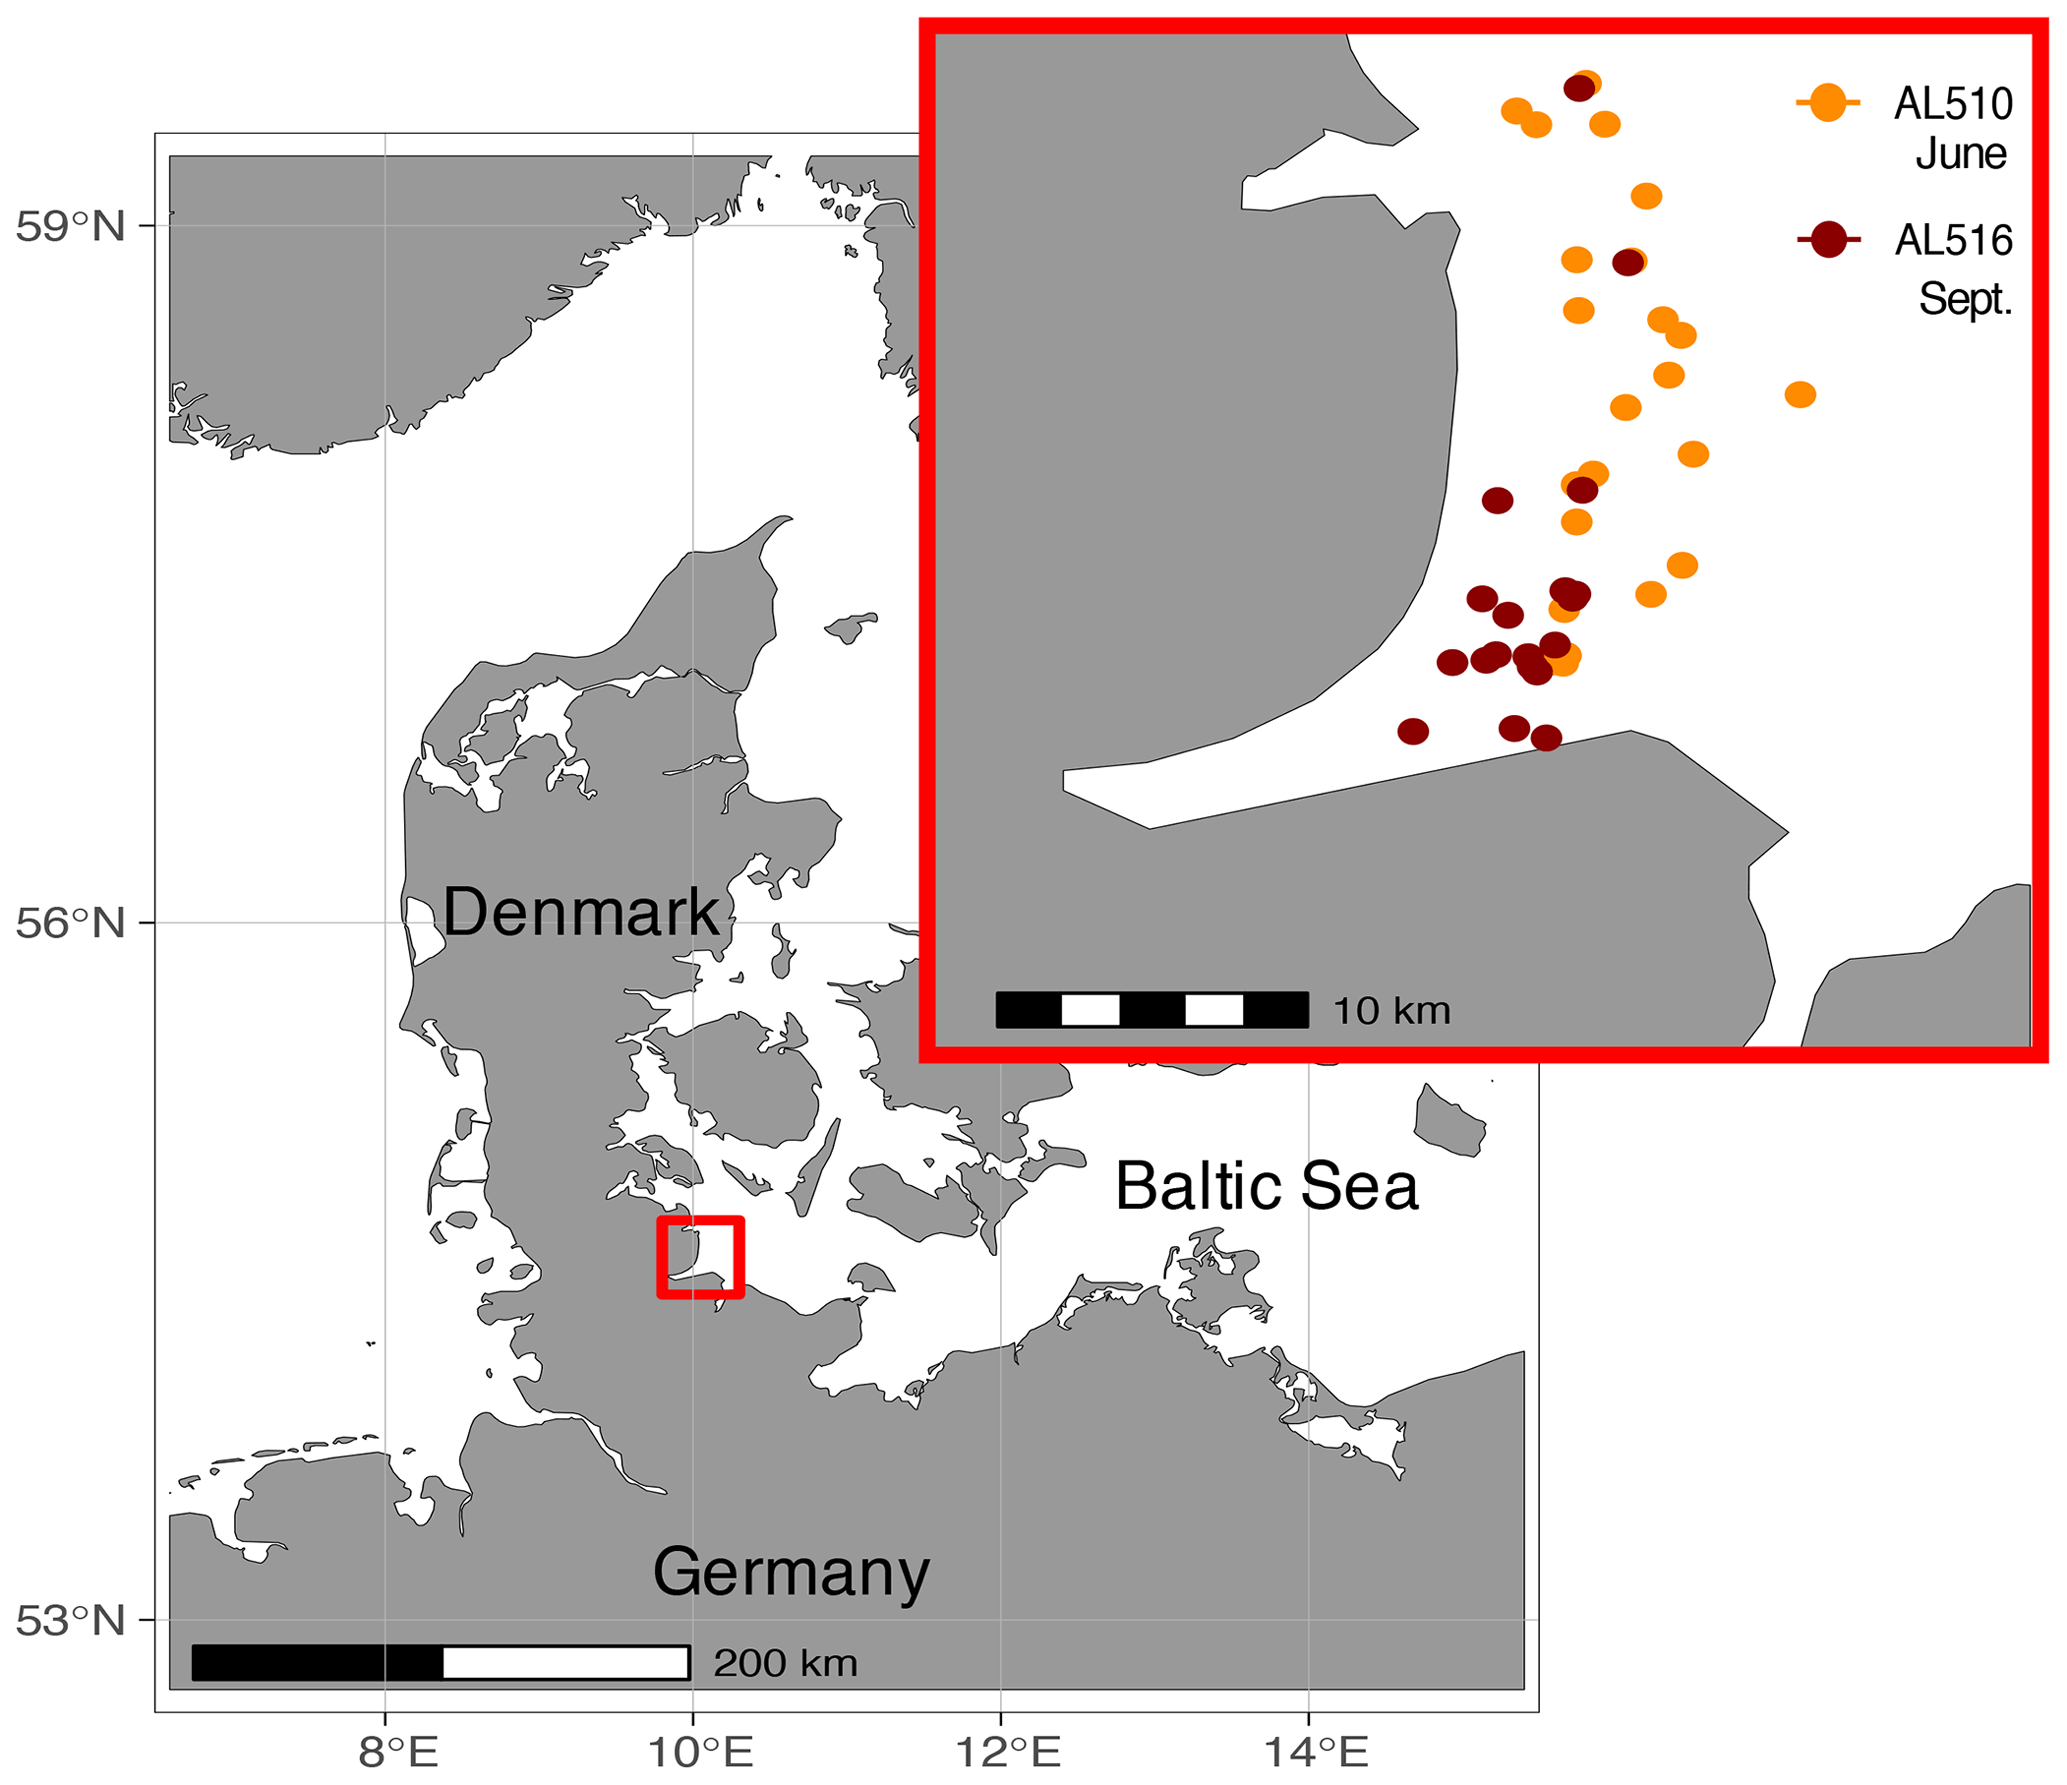
Figure 1Samples were collected in the northern Baltic Sea at the Eckernförde Bay entrance in proximity to the coast. The first cruise was conducted in July 2018 (AL510), and orange circles indicate the 23 stations sampled during the summer cruise. The second cruise was conducted in September 2018 (AL516) during which 19 stations were sampled (red circles).
2.2 Sampling
SML samples were collected from a small working boat, 500 m ahead of the vessel facing upwind. The SML was sampled with the glass plate technique and collected in brown borosilicate glass bottles (Cunliffe and Wurl, 2014; Harvey and Bruzell, 1972). As a reference, underlying water (ULW) was collected by dipping a closed borosilicate glass bottle underneath the surface, which was opened, filled, and closed again at an approximate depth of 20 cm. Plates and whippers were conditioned with seawater and, subsequently, with SML sample before sample collection started. Sampling bottles were rinsed twice with sample. Protected from light, the samples were stored in a cooling box for a maximum of 2 h. The glass plate and the glass bottles were cleaned with 10 % HCl and thoroughly rinsed with Milli-Q. The whipper, including the frame, was flushed with freshwater and rinsed with Milli-Q. Due to rough weather conditions, SML sampling had to be conducted from the vessel's bow at stations 16, 19, and 20 during the first cruise (AL510) and at station 18 during the second cruise (AL516) using the Garrett screen (Garrett, 1965) and following applied practice as described in detail for example by Barthelmeß et al. (2021) and Salter et al. (2011). Samples provided in such a manner were integrated as neither enrichment nor concentrations deviated from the rest of the sample set. The sampling thickness of the SML (h) resulting from the use of the glass plate is calculated following Eq. (1) (Harvey and Burzell, 1972; Cunliffe and Wurl, 2014):
where V is the sample volume, A the total area of the glass plate, and n the number of dips needed to collect V. It should be kept in mind that the thickness is only operationally defined. Other methods, such as the deployment of the Garrett screen, lead to a greater sampling thickness ranging from 150 to 500 µm depth (Cunliffe and Wurl, 2014). This is critical as the apparent sampling thickness does not necessarily represent the actual thickness of a natural SML. Zhang et al. (1998, 2003b) determined that several chemical and physical properties, including organic matter concentration and surface tension, suddenly change beyond a depth of 50 ± 10 µm. Therefore, the glass plate technique is best suited to representing the natural SML as the sampling thickness over a range from 20 to 150 µm (Cunliffe and Wurl, 2014). However, in the natural SML, not only dissolved but also loosely entangled particulate aggregates and organisms are enriched, which may extend its thickness down to a depth of approximately 1000 µm (Engel et al., 2017a).
The ship's weather station and underway system monitored the ambient air and water conditions. Parameters represented in Table S1 were averaged over the time of sampling. Conductivity, temperature, and depth (CTD) profiles were conducted daily at 06:00 and 18:00 local time.
2.3 Amino acids and carbohydrates
Duplicate samples for hydrolysable amino acids (4 mL) and combined carbohydrates (20 mL) were poured into combusted glass vials (8 h at 500 ∘C) and stored until analysis at −20 ∘C. For the dissolved pool, samples were filtered through 0.45 µm pore size Acrodisc filters. After hydrolysis, monomeric amino acids and carbohydrates were determined by high-performance liquid chromatography (HPLC) (1260 HPLC system, Agilent) and by high-performance anion-exchange chromatography (HPAEC) in combination with pulsed amperometric detection (PAD) (Dionex ICS-3000), respectively (Lindroth and Mopper, 1979; Dittmar et al., 2009; Engel and Händel, 2011). Thirteen amino acids were identified: the acidic amino acids aspartic acid (AspX) and glutamic acid (GlX); the basic amino acid arginine (Arg); the polar amino acids serine (Ser), glycine (Gly), tyrosine (Tyr), and threonine (Thr); the non-polar amino acids alanine (Ala), valine (Val), isoleucine (Iso), phenylalanine (Phe), and leucine (Leu); and the non-proteinaceous amino acid γ-aminobutyric acid (GABA). Twelve different carbohydrate monomers were assessed, including the neutral sugars glucose (Glc), galactose (Gal), mannose and xylose (ManXyl), rhamnose (Rha), fucose (Fuc), and arabinose (Ara) and the acidic sugars galacturonic acid (GalX) and glucuronic acid (GlcX) as well as the amino sugars glucosamine (GlcN) and galactosamine (GalN). Muramic acid and gluconic acid were not detected in the sample sets. The precision was calculated as the relative SD between analytical replicates. Replicates deviated by <10 % for 95 % of dissolved amino acid (DAA) samples (relative SD; AL510 3.8 ± 4.4 %, N=45; AL516 5.1 ± 10.2 %, N=38), while for total amino acids (TAA) replicates deviated by <20 % for 85 % of samples (relative SD; AL510 13.3 ± 6.3 %; AL516 6.6 ± 6.7 %). Carbohydrate analysis was more precise; the relative SD of the dissolved (DCHO) and the total carbohydrates (TCHO) was <5 % for at least 95 % of all samples (DCHO and TCHO relative SD; AL510 1.9 ± 1.5 %; AL516 1.9 ± 1.7 %). The particulate fractions of amino acids and carbohydrates (PAA and PCHO) were calculated by subtracting the dissolved from the total concentration. Subsequently, if PAA or PCHO are mentioned, this refers to the absolute concentration in µM including all molecular components if not stated otherwise. If single molecular fractions, for example “particulate Ser”, are mentioned, this refers to the mole percent (mol %); in exceptional cases, absolute concentrations of single components are discussed; however, they are denoted as such by explicit phrasing or units.
2.4 Dissolved organic carbon
For dissolved organic carbon (DOC), duplicate samples were filtered through 0.45 µm GMF GD/X filters (Whatman, GE Healthcare Life Science, UK) and poured into 20 mL pre-combusted glass ampules (8 h at 500 ∘C). Samples were acidified with 20 µL 32 % HCl (Suprapure, Sigma-Aldrich), subsequently sealed, and stored at 4 ∘C until analysis with a high-temperature catalytic oxidation TOC analyser (TOC-VCSH, Shimadzu) as established by Sugimura and Suzuki (1988) and modified by Engel and Galgani (2016). Precision calculated as the relative SD between four measurements was <1 % during both cruises.
2.5 Phytoplankton and bacteria
Duplicates of 1.7 mL samples were conserved with 85 µL glutaraldehyde (GDA), yielding a final concentration of 1.2 %, and stored at −80 ∘C. Phytoplankton and bacteria cells were analysed using a flow cytometer (Becton, Dickinson and Company FACSCalibur; software – BD Biosciences CellQuest Pro) and were calibrated with yellow-green latex beads (diameter of 0.5 and 1 µm). Heterotrophic cells (“bacteria”) were stained with SYBR Green, while autotrophic cells (“phytoplankton”) could be detected based on their autofluorescence (Marie et al., 1997). Bacteria were separated into subgroups based on high and low nucleic acid (HNA, LNA) content. This is commonly interpreted as a measure of cell activity (Gasol and Del Giorgio, 2000; Servais et al., 2003). Phytoplankton cells were divided according to size classes into pico- (<2 µm) (small, S) and nano-phytoplankton cells (2–20 µm) and according to the phytopigment Chl a and phycoerythrin into further subgroups. Pico-phytoplankton with phycoerythrin are affiliated to Synechococcus spp., while nano-phytoplankton cells, characterized by the same pigment, likely belong to the class Cryptophyta (Marie et al., 2010). Both categories are addressed as cyanobacteria-like (CBL) cells. Phytoplankton cells solely characterized by Chl a are addressed as non-cyanobacteria-like (NCBL) cells. Nano-NCBL cells are further divided into medium and large (M, L) cells. Procedures followed the standard protocol of our lab as described in Engel and Galgani (2016) and Zäncker et al. (2017).
2.6 Chlorophyll a and primary production
Duplicates of 500 mL were derived from the morning CTD cast (1 m) to assess Chl a concentration in the surface water. The samples were filtrated onto 25 mm GF/F filters (Whatman, GE Healthcare Life Science, UK) and stored at −80 ∘C until the analysis. Chl a was extracted using 90 % acetone and measured with a photometer (Turner Designs, USA) after the modified protocol of Evans et al. (1987). Relative SD between the two replicates was <6 % and <1 % for the June and September cruise, respectively. On-board sampling of Chl a concentration was complemented by satellite measurements of Chl a and gross primary production (GPP), which are available upon registration on the website http://www.satbaltyk.pl/?lng=eng#/ (last access: 15 November 2021). Data are derived from a consortium of operating satellites, including MODIS Aqua (Woźniak et al., 2011). Data were extracted for the mean location of the ship at a latitude of 54∘37′ N and a longitude of 10∘07′ E and at 54∘33′ N, 10∘04′ E for June and September, respectively. To cover the whole year and bridge the gap between the June and September campaign, daily based satellite data were pooled, which resulted in mean concentrations and rates.
2.7 Surface activity
Surface activity was assessed directly on board the RV Alkor by phase-sensitive alternating current voltammetry using a polarograph (797 VA Computrace, Metrohm, Switzerland) and following a method first introduced by Ćosović and Vojvodić (1982). This technique relies on the discharge of an electrochemical double layer building up at the polar–non-polar interface of a hanging mercury drop electrode and, therefore, interferes with surfactants present in the solvent (Scholz, 2015). The resulting change in the capacity current of a sample with respect to a pure electrolyte blank is used to assess the concentration of environmental surfactants. Samples were adjusted to an equal ionic strength by adding the adequate volume of a 3 M NaCl solution before the measurement. Three replicates of 10 mL were measured in glass vials at room temperature, applying a deposition time of 60 s and a voltage sweep from −0.6 to −1 V. The measuring vials were cleaned with 10 % HCl, rinsed with Milli-Q, and combusted at 500 ∘C overnight. Surface activity was calibrated against the artificial, non-ionic surfactant Triton X-100 (TX-100, Sigma-Aldrich, Germany, molecular weight 625 g mol−1). The precision of measurement was calculated as the relative SD between the three replicates and was <10 % for 98 % of the samples (N=40) in summer, with only one exception encountered at station 13 (ULW). In autumn, precision was <10 % for 92 % of the samples (N=36), with exceptions encountered at stations 3, 14, and 15 (ULW). The mean relative SD was 4.0 ± 2.4 % and 5.5 ± 4.0 % for the summer and autumn samples, respectively.
2.8 Statistics
Statistical analysis was executed in RStudio (Version 1.4.1106). Only stations at which surfactants measurements were conducted are included in the analysis. The SML condensed to a visible slick during the June cruise at station 12. Consequently, this station was excluded as an outlier (AL510 N=39; AL516 N=36). The values are given as the mean and standard deviation (mean ± SD) throughout the paper if not indicated otherwise.
The differences between seasons were assessed by applying the non-parametric Wilcoxon signed rank test (unpaired) to the pooled data (including the SML and ULW). Dissolved amino acids and carbohydrates are a major fraction of organic matter encountered in the surface ocean and are representative of fresh production. They are categorized as labile to semi-labile because their turnover rates range from days to months and sometimes up to years. Semi-labile DOC categorically excludes the most refractory components of the deep-ocean DOC reservoir (Davis and Benner, 2007; Benner and Amon, 2015; Hansell et al., 2009). In the following study, semi-labile DOC is defined as the fraction of DOC that is covered by DAA and DCHO and is indicated in mole percent of carbon (mol C %). Degradation indices (DIs) are based on dissolved amino acid compositions and are derived after the approach of Dauwe and Middelburg (1998). To assess the differences in the molecular amino acid composition between seasons, principal component analysis (PCA) was performed based on the R package tidyverse. From a multi-dimensional matrix, single scores are extracted, of which principal components (PCs) reflect the axes along which the major variance appears in the data set. The first PC is commonly interpreted to represent the differences in degradation states between samples or systems (Dauwe and Middelburg, 1998; Dauwe et al., 1999; Davis et al., 2009).
To characterize the SML further, enrichment factors (EFs) were calculated by dividing the SML concentration by the reference value of the ULW, as shown in Eq. (2):
where EFs <1 reflect a depletion and EFs >1 an enrichment of the SML. It was also evaluated if SML and ULW concentrations were correlated by using the non-parametric Spearman's rank correlation test. Normality and homoscedasticity of the data were investigated applying the Shapiro–Wilk test and Levene's test, respectively. Especially during the first cruise, data were non-normally distributed. Homoscedasticity was always given except for DOC in September. Although a normal distribution is not a prerequisite for Spearman's rank correlation statistics, homoscedasticity is an assumption that needs to be complied with. Therefore, correlation statistics regarding DOC concentration of the September cruise should be interpreted with caution. Apart from the difference in sampling depths (SML versus ULW), the time of day (morning versus afternoon) could have shaped organic matter concentrations and an organism's abundance within seasonal data sets. Accordingly, a rank-transformed ANOVA (package ARTool, commands applied “art” and “anova”) was conducted, complying with the requirements for multifactorial and non-normally distributed data sets.
The focus of this study was to unravel potential biological and/or molecular source dynamics which influence surfactants concentration over time, i.e. within and across seasons. Surfactants are therefore considered the product resulting from a particular set of biological conditions and/or a specific biochemical composition (explanatory variables). As a first step, non-parametric correlation statistics were performed (Spearman's rank correlation) to investigate if surfactant concentrations corresponded to specific molecular composition or the abundance of organisms. Non-parametric correlation statistics were also performed for the combined data sets (including and excluding the effect of season as achieved by centring around the overall mean or seasonal means). All explanatory variables were further integrated to construct multifactorial regression models. This resulted in two models representing each season, i.e. (I) June and (II) September; a model (III), which included the effect of seasons; and a further model (IV), which excluded the effect of seasons. For models I and II, single data sets were centred and scaled. For model III, in which the effect of seasons was included, both data sets were firstly pooled, subsequently centred, and scaled. For model IV, seasonal data sets were firstly centred and scaled and only subsequently pooled. Therefore, any effect of season is excluded in model IV. An overview of the statistical models is provided in Table A1. For each statistical model, parameters that best fit to represent surfactants dynamics, i.e. had a significant additive effect, were extracted and displayed by means of redundancy analysis (RDA). To reduce the number of explanatory variables, a forward model selection was applied. The highest adjusted R2 represented the best statistical model fit but was restricted to the scope of the adjusted R2 including all explanatory variables. The analysis was conducted using the R package vegan (commands applied “rda” and “ordi2step”), which is based on the theoretical considerations of Blanchet et al. (2008) and Legendre and Legendre (2012). The extracted formula was tested for significance with an ANOVA (package vegan, command applied “anova.cca”). Spearman's rank correlations were further applied to investigate which parameters were intercorrelated (command applied “heatmap”) and if the absolute concentrations of molecular carbohydrates and amino acids reflected surfactant concentrations.
3.1 Hydrology and meteorological conditions
The CTD profiles show the water column stratification based on temperature and salinity (Fig. 2). For surface waters (0–10 m), the mean temperature was slightly higher in June (18.16 ± 0.37 ∘C) than in September (17.13 ± 0.01 ∘C). Averaged salinity of the upper water column was lower in June (12.41 ± 0.17 PSU) than in September (18.24 ± 0.20 PSU). During the first cruise, the bottom water below 20 m exhibited a mean temperature and salinity of 6.15 ± 0.03 ∘C and 17.95 ± 0.82 PSU, respectively. During the second cruise, bottom waters had considerably warmed up (13.46 ± 1.05 ∘C) and salinity had increased (23.06 ± 0.43 PSU). The pycnocline was centred at ∼15 m depth. Temperature and salinity profiles caused a difference in the potential density of the surface and bottom layer of 6.1 and 4.4 kg m−3 during the first and second cruise, respectively. Hence, the seasonal stratification of the water column was still stable in September, although it was weaker than in June. The CTD profiles did not change from the morning to the afternoon stations (data not shown). Wind direction was mainly oriented south-southwest (195 ± 105∘), blowing at a moderate speed of 7.1 ± 3.4 m s−1 in June. Wind speed declined to a minimum of 1.2 m s−1 at station 12, on which a surface slick was present. In September, the wind direction was less variable; oriented southwest (227 ± 25∘); and, on average, reached a speed of 8.6 ± 2.8 m s−1. The sampling thickness of the SML changed according to season. While in June the average sampling thickness of the SML was 41.4 ± 2.9 µm, it declined to 33.5 ± 2.1 µm in September.
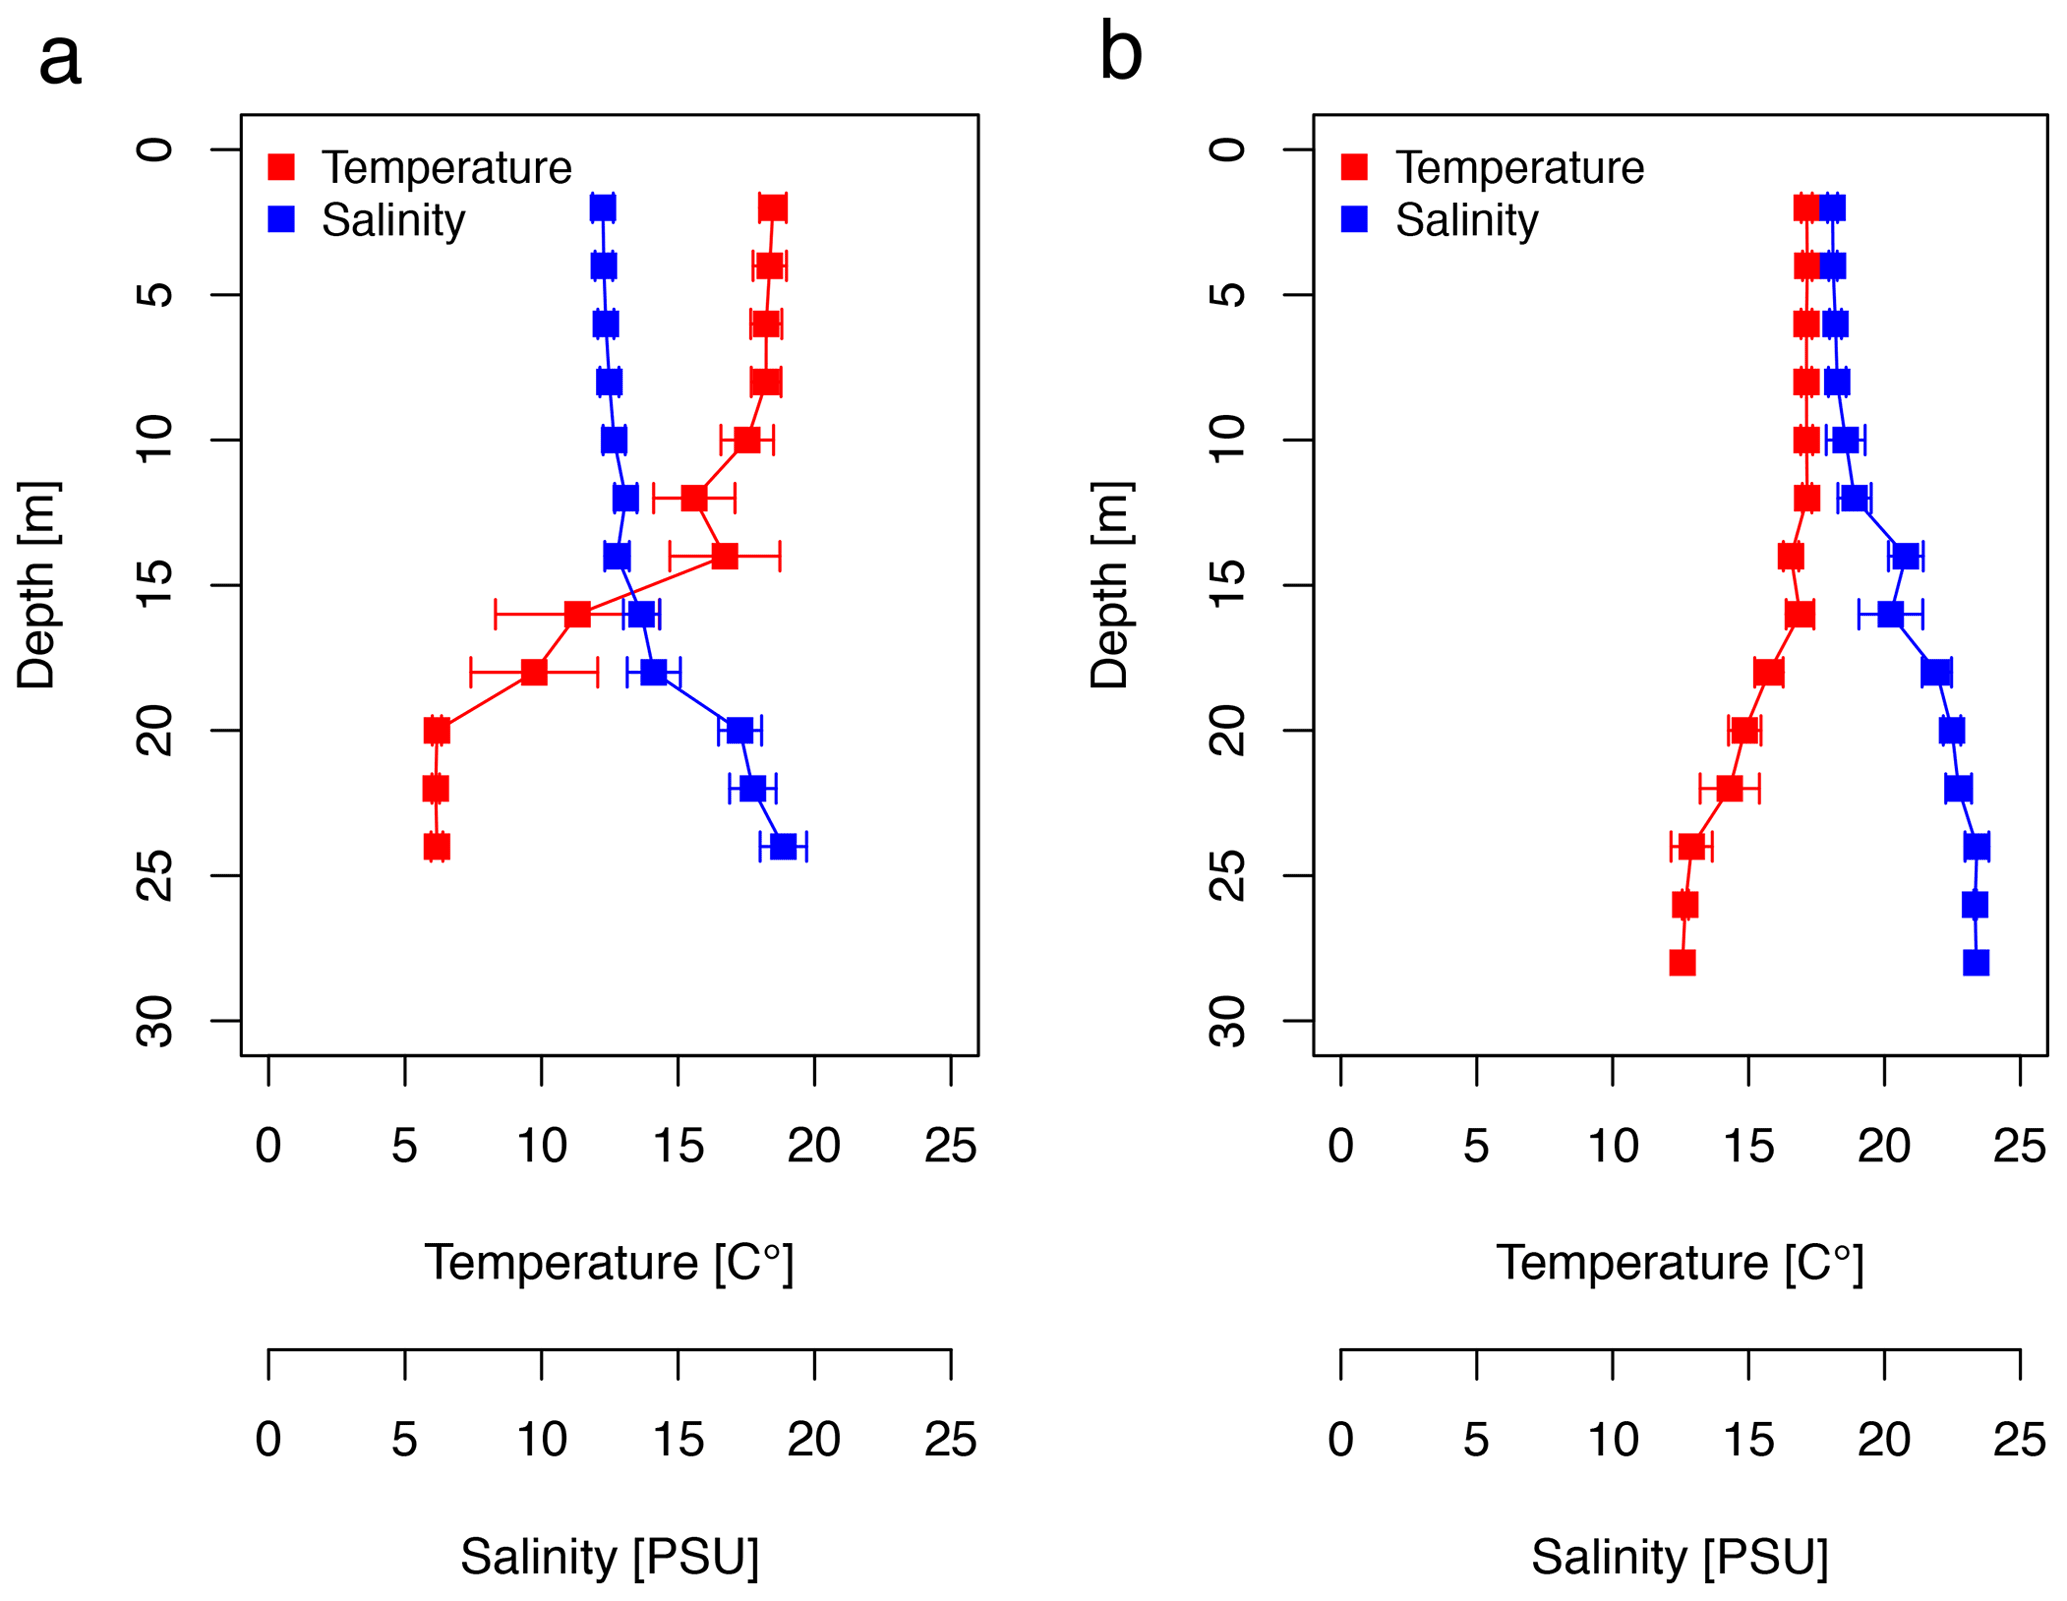
Figure 2Temperature and salinity (CTD) profiles for (a) the June cruise (AL510) and (b) the September cruise (AL516) averaged over 2 m depth bins.
3.2 The biogenic imprint of seasons
We integrated satellite-derived GPP and Chl a data (Fig. 3) to better understand the transition from spring to summer to autumn in 2018. Chl a concentration reached its annual spring maximum, accompanied by proportionally rising GPP, at the end of March 2018 (spring bloom). From April to mid-June 2018, Chl a concentration and GPP stayed low overall compared to the preceding spring and succeeding summer bloom peak (Fig. 3a). The first cruise coincided with this post-spring period of reduced GPP. However, the regime shifted from moderate to its annual maximum in GPP at the end of the first cruise (Fig. 3b). GPP was elevated and highly variable from July until mid-September (summer bloom phase) and then gradually declined until the autumn bloom, which started in early October (Fig. 3a). The end of the summer bloom period coincided with the second cruise. The development of Chl a and GPP suggests that two different seasonal regimes were encountered during the campaign. Also, the microbial community changed significantly between cruises (Table A2). Phytoplankton cell abundance increased considerably from June (75 ± 32 × 103 cells mL−1) to September (261 ± 52 × 103 cells mL−1), accompanied by changes in the phytoplankton composition (Fig. 4a). In June, pico-NCBL cells dominated the community with a total fraction of 47.6 ± 16.7 % (pico-NCBL 32 ± 13 × 103 cells mL−1) and were followed by pico-CBL abundance (pico-CBL 22 ± 19 × 103 cells mL−1). Pico-CBL cells increased in number towards the end of the first cruise (Fig. S1a in the Supplement). The phytoplankton community in September was dominated by pico-CBL cells (pico-CBL 201 ± 56 × 103 cells mL−1) with a total fraction of 76 ± 8 %, followed by medium-sized nano-NCBL cells (nano-NCBL M, 14 ± 6 %). Higher phytoplankton abundance in September was also reflected in higher Chl a concentration. Chl a concentration was on average 1.61 ± 0.69 µg L−1 and 1.94 ± 0.40 µg L−1 in June and September, respectively (extracted from CTD samples, 1 m depth, morning stations). Bacteria exhibited an average abundance of 1.67 ± 0.41 × 10⁶ cells mL−1 in June and significantly increased in September (2.16 ± 0.39 × 10⁶ cells mL−1). LNA cells dominated in June (63.2 ± 3.3 %), while HNA cells were more prevalent in September (72.2 ± 2.6 %) (Fig. 4b). Organic matter components changed significantly in concentration in concordance with community composition (Table A2). While most organic matter components generally increased in concentration from June to September, DOC and PAA concentrations decreased. To compare if the molecular pattern of organic matter composition differed between the two seasons, a PCA was performed. The PCA was based on the molecular DAA data. Following the approach of Dauwe and Middelburg (1998) and Davis et al. (2009), the first principal component (PC1) reflects the intermediate alteration of fresh to microbially degraded organic matter. PC1 explained 36.8 % of variance, and data were clustered according to seasons. In June, the variance was mainly driven by the relatively high contribution of the non-proteinaceous amino acid GABA and the non-essential amino acid Ala (Fig. 5). In contrast, the September cluster exhibited a pronounced contribution of various essential amino acids, including Iso, Phe, and Leu. Concomitantly, extracted DIs and the percentage of semi-labile DOC were lower in June than in September (Table A2).
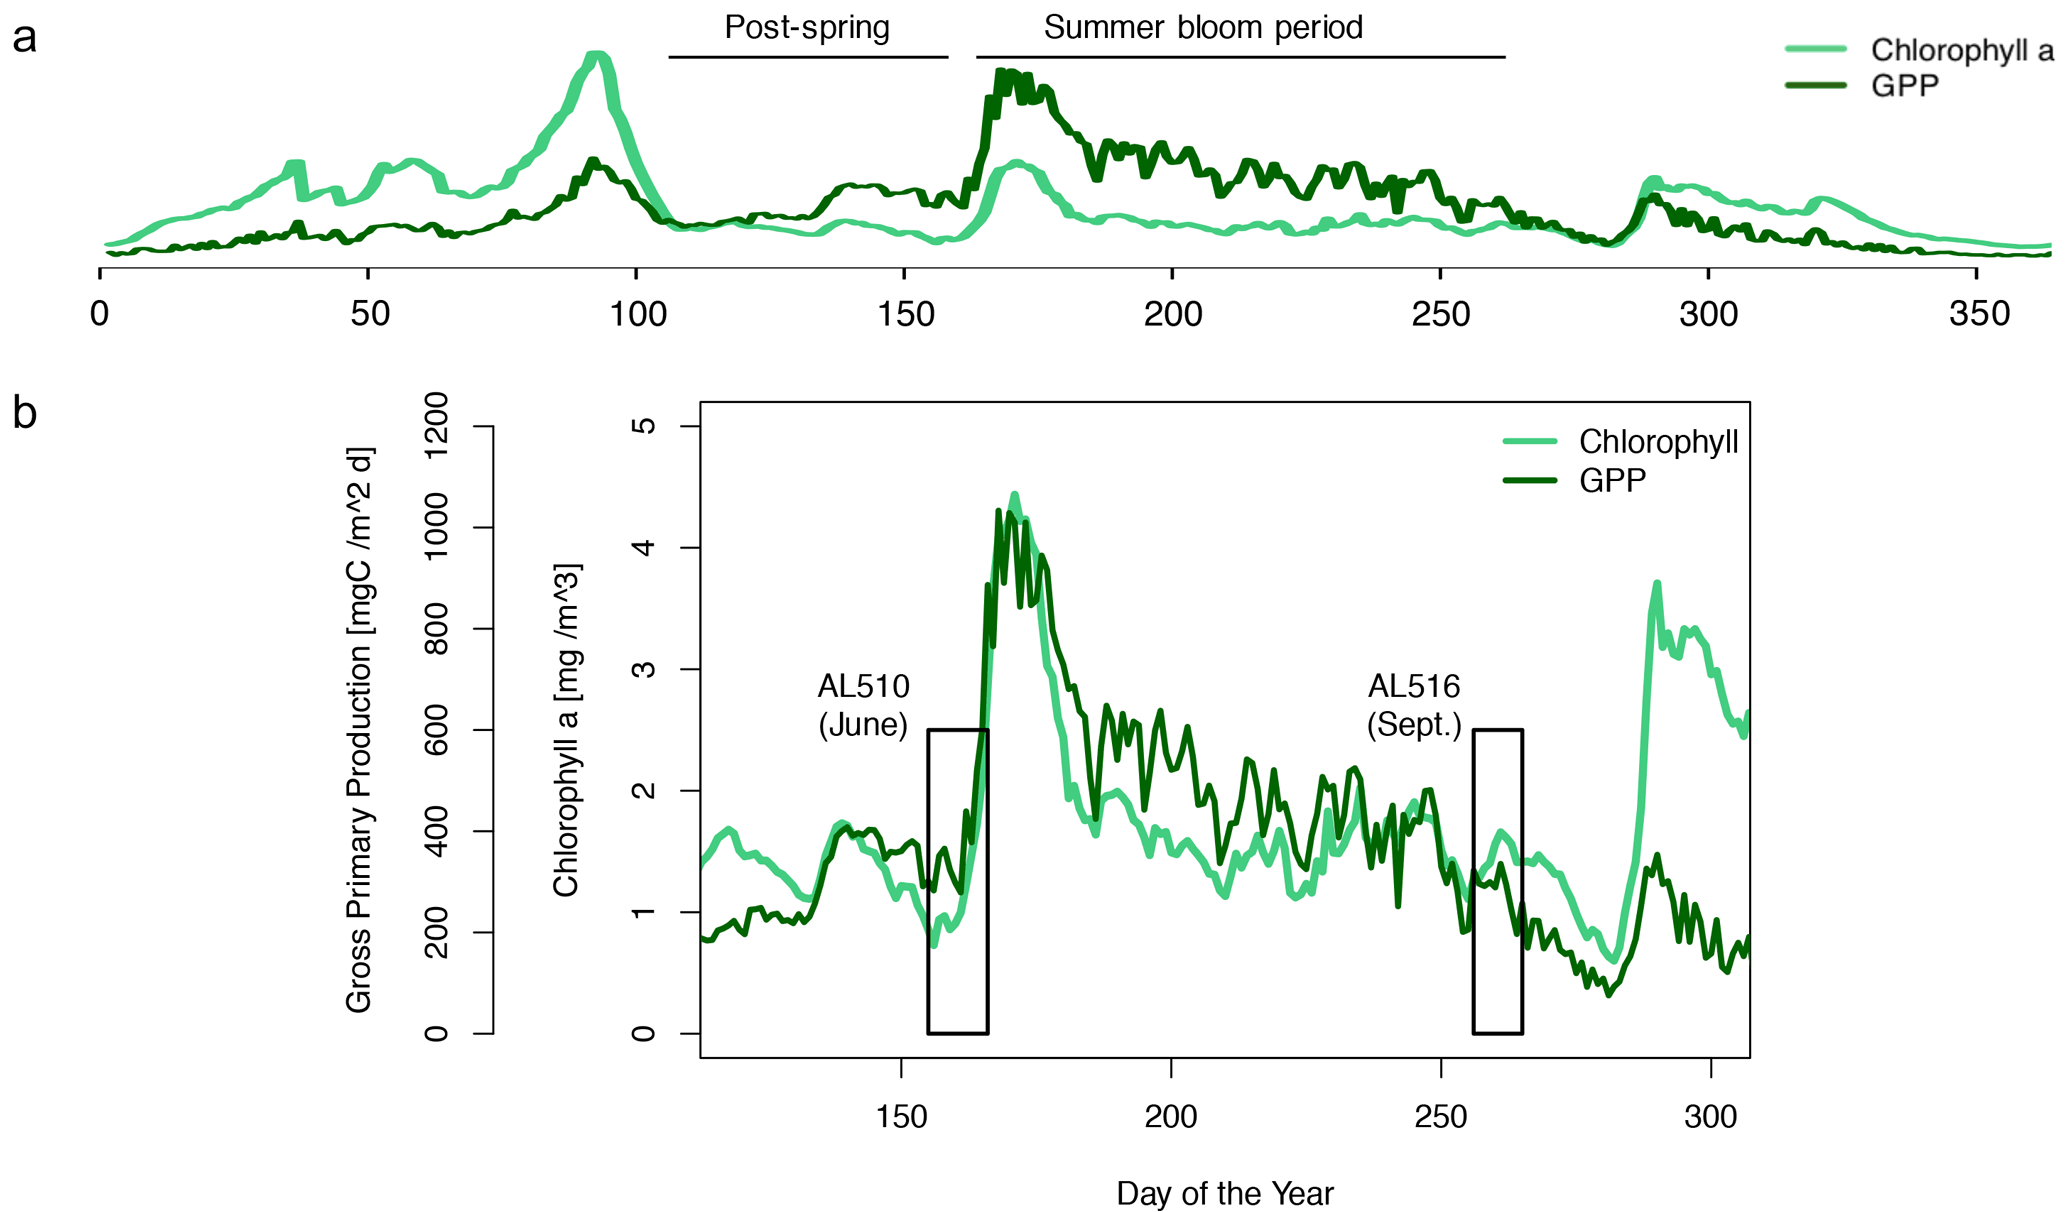
Figure 3Satellite-derived surface concentration of chlorophyll a (Chl a) and the gross primary production (GPP) rate. Data are freely available on the website http://www.satbaltyk.pl/?lng=eng#/ (last access: 15 November 2021). Data represent the average concentration and rate between the mean location of the ship in June and September. In (a) the complete year 2018 is represented, including the assigned phytoplankton regimes. In (b) the time frames are highlighted in which the cruises AL510 (June) and AL516 (September) were conducted.
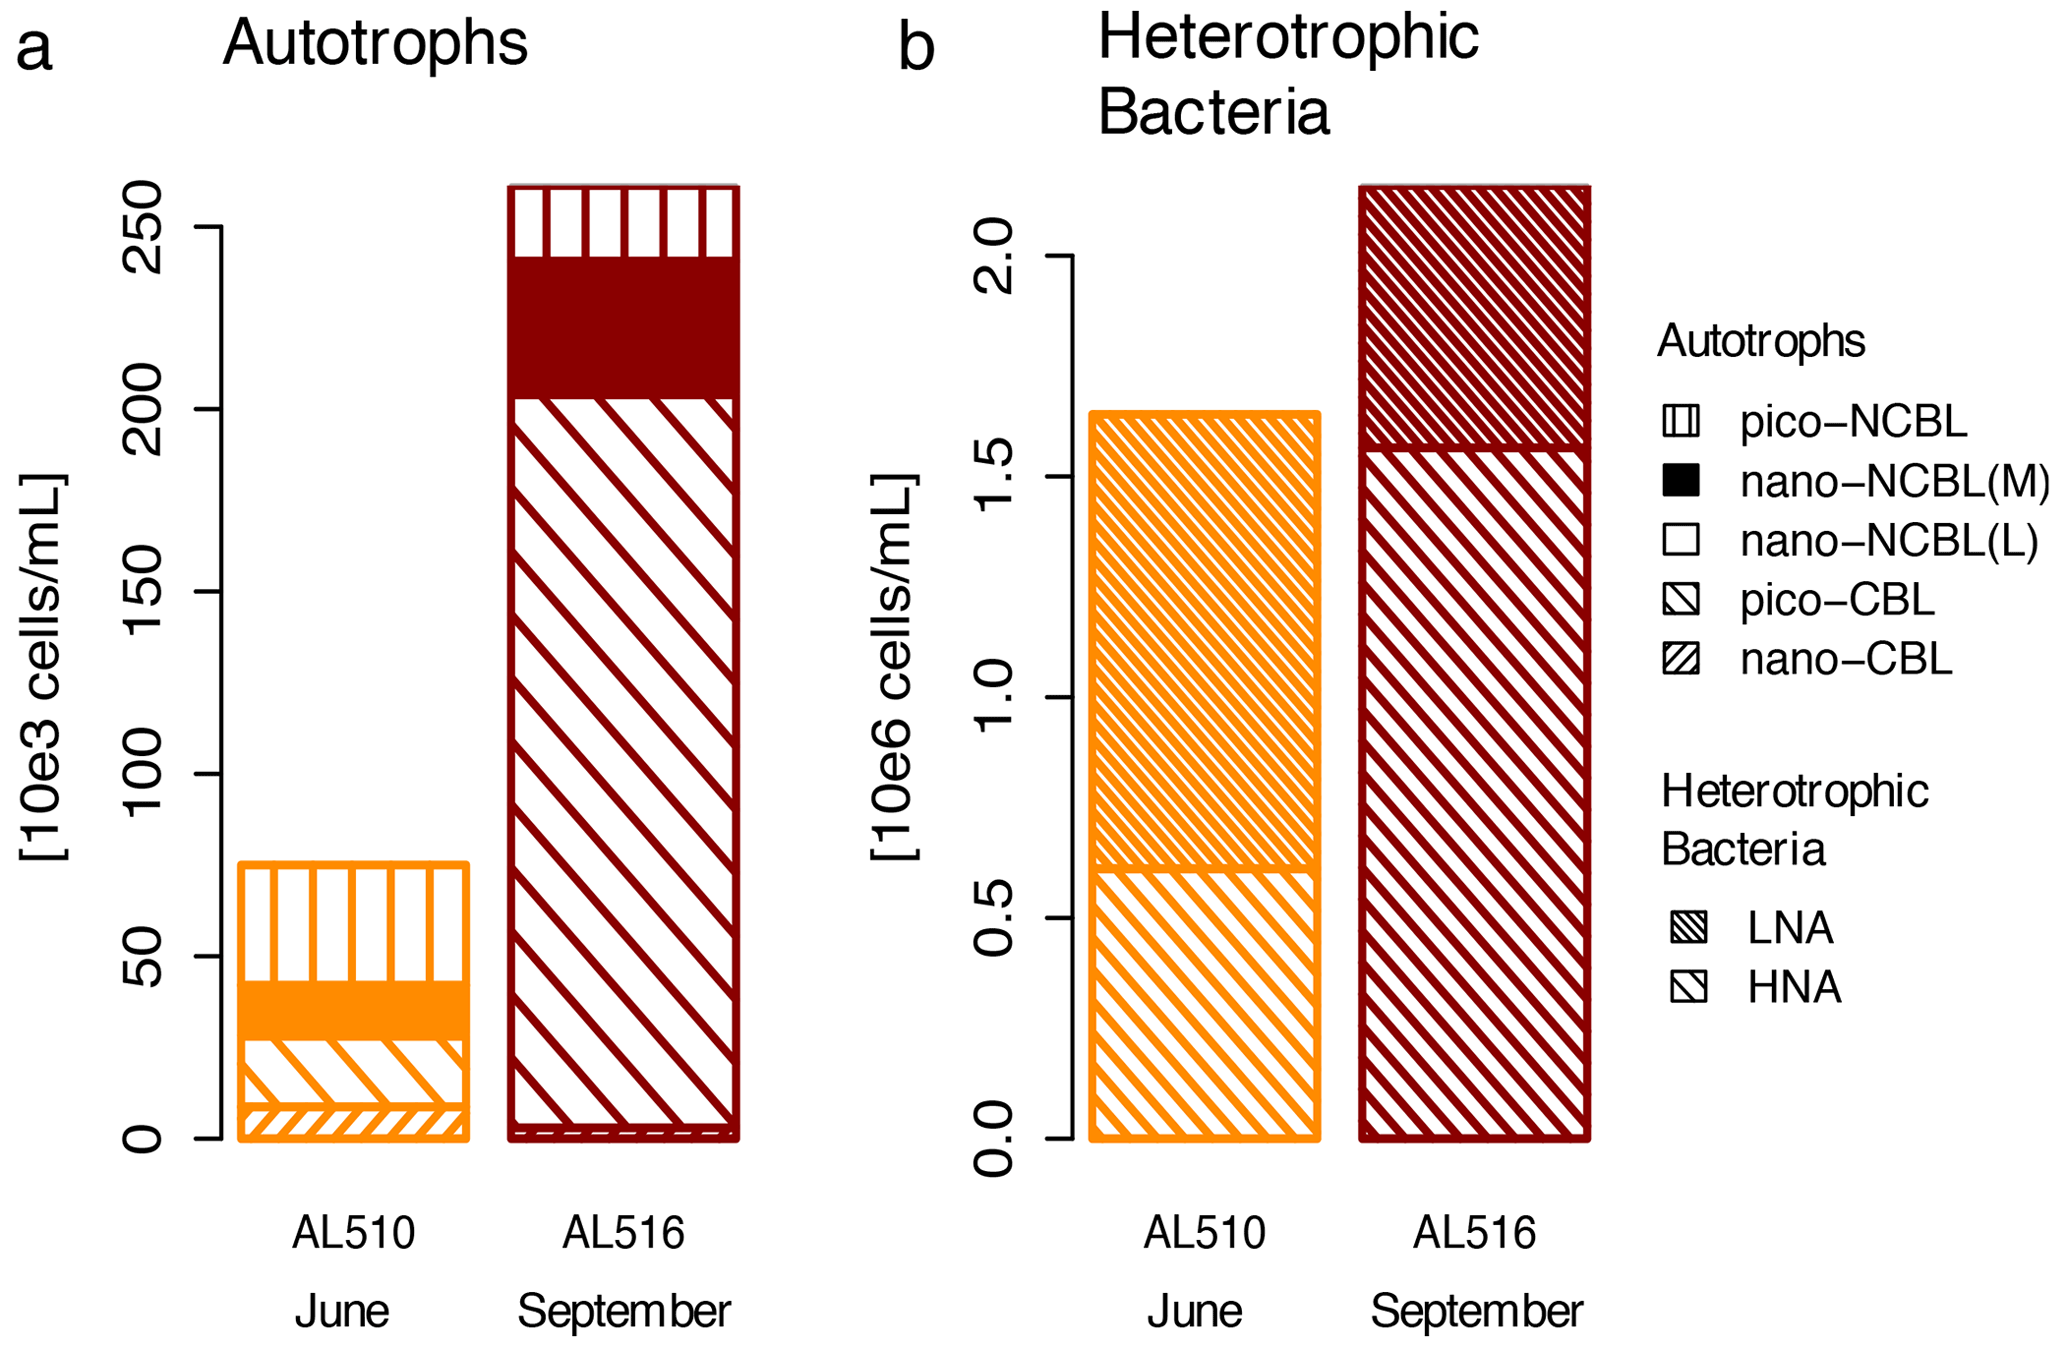
Figure 4Comparison of (a) autotrophic phytoplankton and (b) heterotrophic bacterioplankton community in June (AL510) and September (AL516). Cyanobacteria-like (CBL) cells contain the pigment phycoerythrin. Non-CBL (NCBL) cells contain solely chlorophyll a. Bacteria are categorized according to high or low nucleic acid content (HNA and LNA).
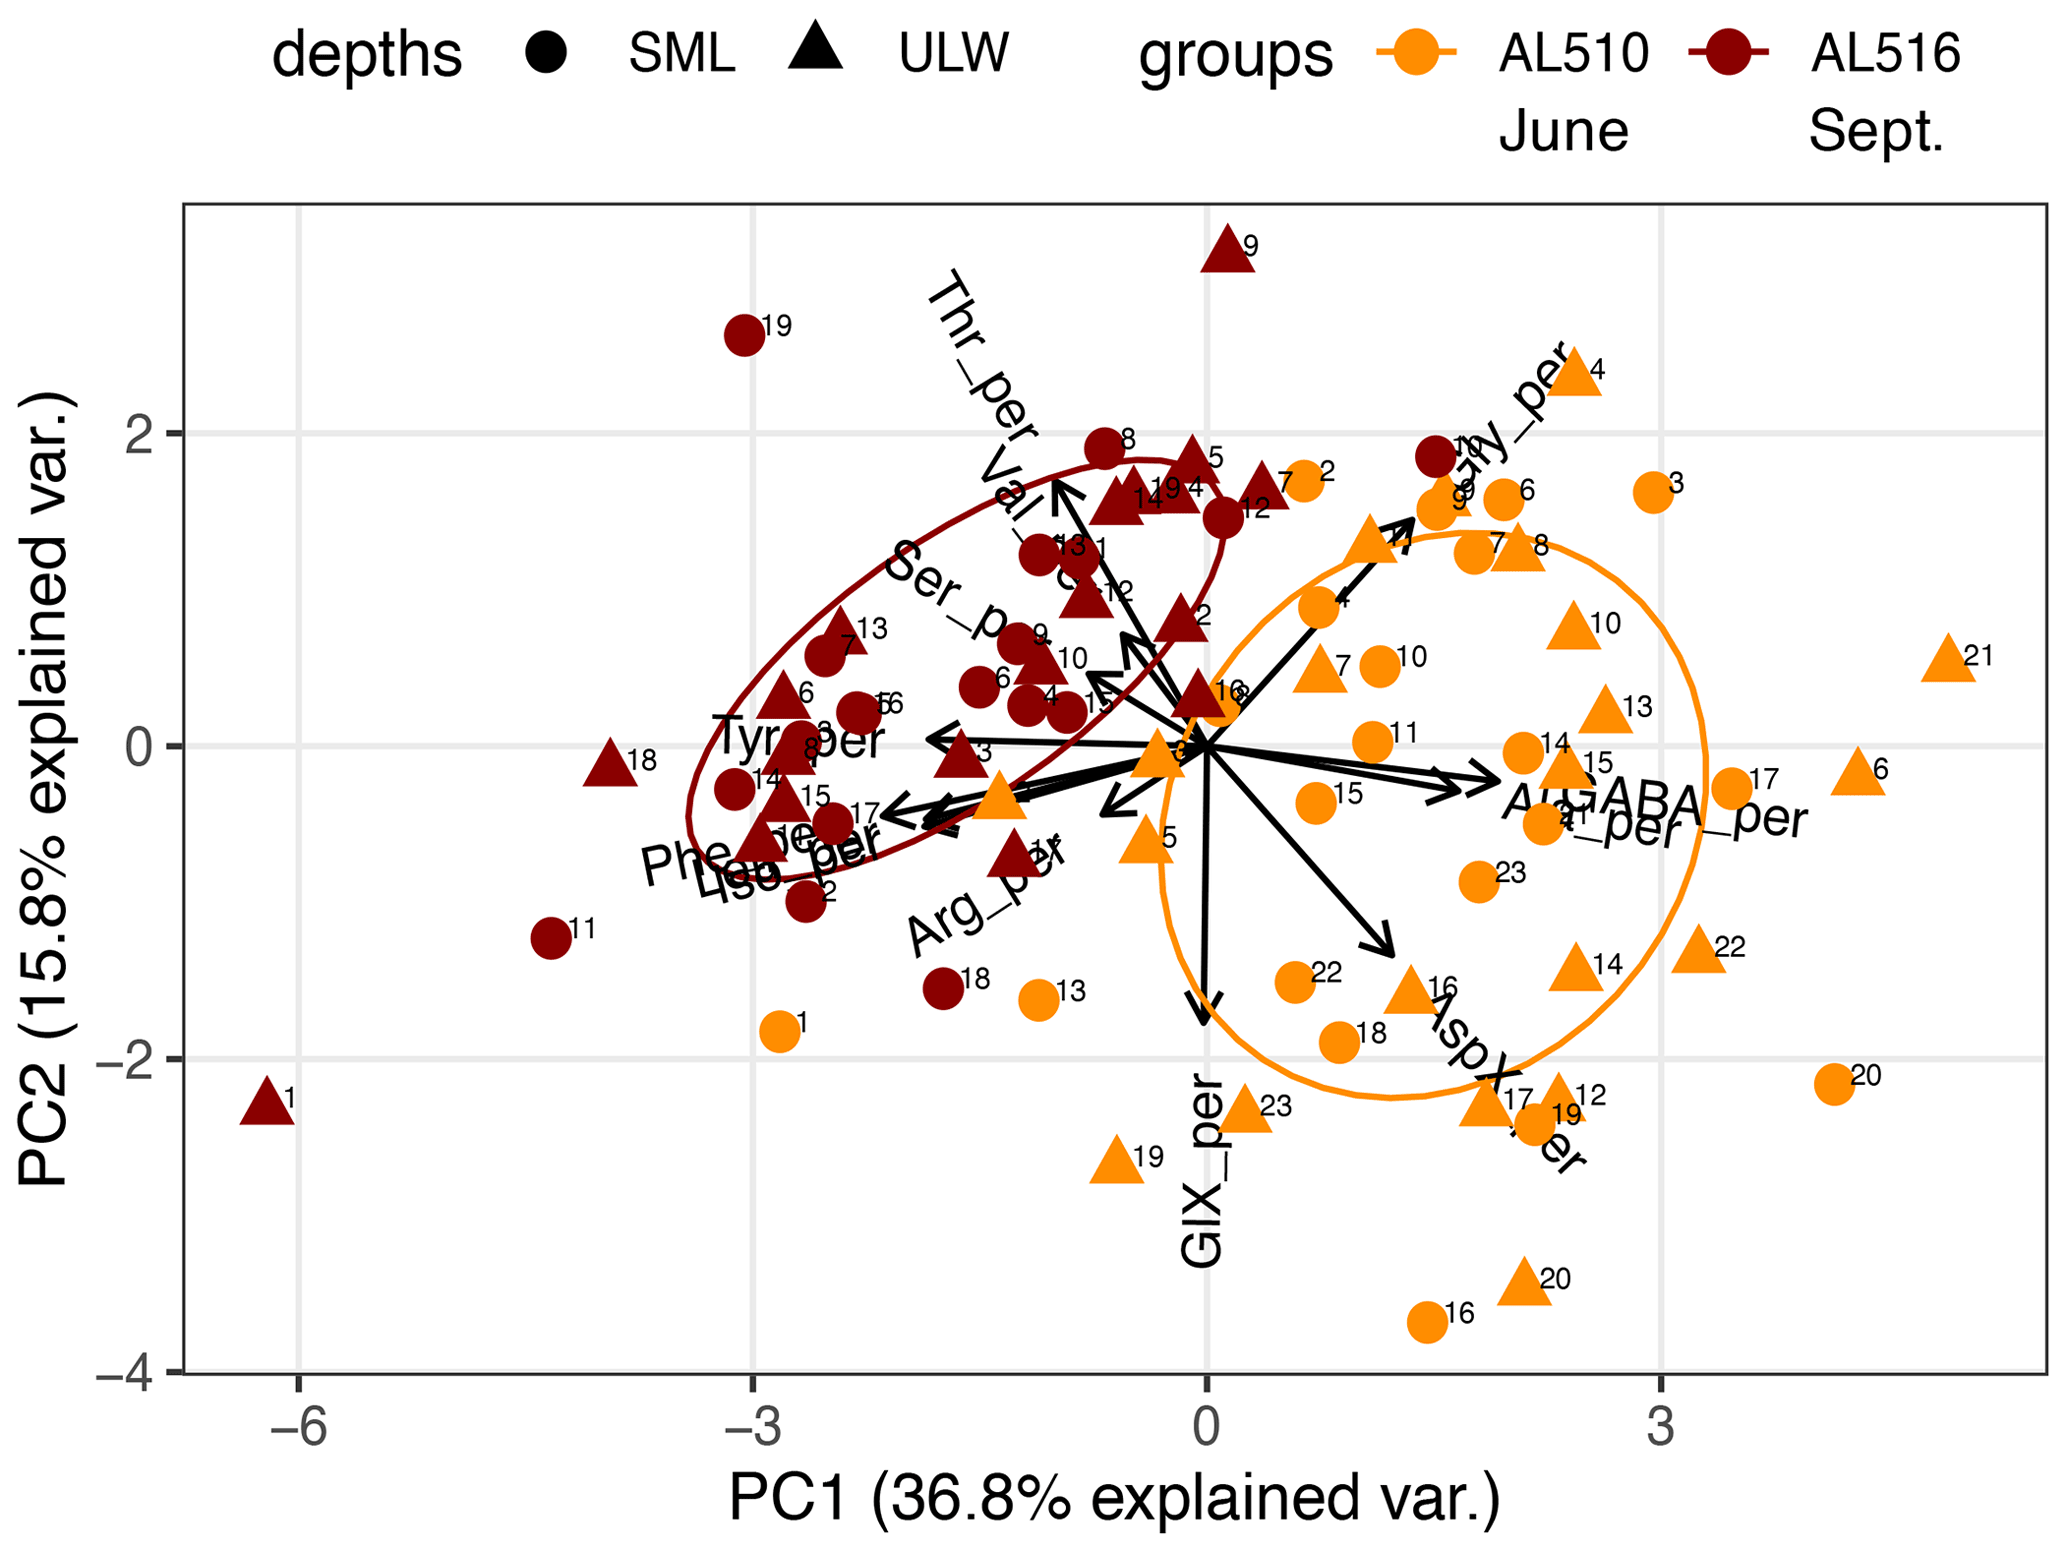
Figure 5Principal component analysis (PCA) on the molecular composition of dissolved amino acids. Data cluster according to the cruise conducted in June (AL510) and September (AL516). Abbreviations of amino acids: aspartic acid (AspX), glutamic acid (GlX), arginine (Arg), serine (Ser), glycine (Gly), tyrosine (Tyr), threonine (Thr), alanine (Ala), valine (Val), isoleucine (Iso), phenylalanine (Phe), leucine (Leu), and γ-aminobutyric acid (GABA).
In comparison to the dissolved phase, the particulate phase contained relatively high percentages of essential amino acids, including for example Arg, Iso, Leu, and Phe. However, the non-essential amino acid GlX was also elevated. Throughout seasons, only small changes occurred within the dissolved phase of amino acids. In contrast, the mole percent of Arg and Gly was elevated in the particulate phase of amino acids in September (Fig. 6a). Major differences in monomer composition occurred between the dissolved and particulate phase of carbohydrates. ManXyl contributed the largest fraction in the dissolved phase, while Glc contributed only 16 mol %. Within the particulate phase of carbohydrates, however, the fraction of Glc accounted for 50 mol % in June and further increased to almost 70 mol % in September (Fig. 6b). The particulate phase in June was further characterized by a higher mole percent of ManXyl, Ara, Fuc, and Rha.
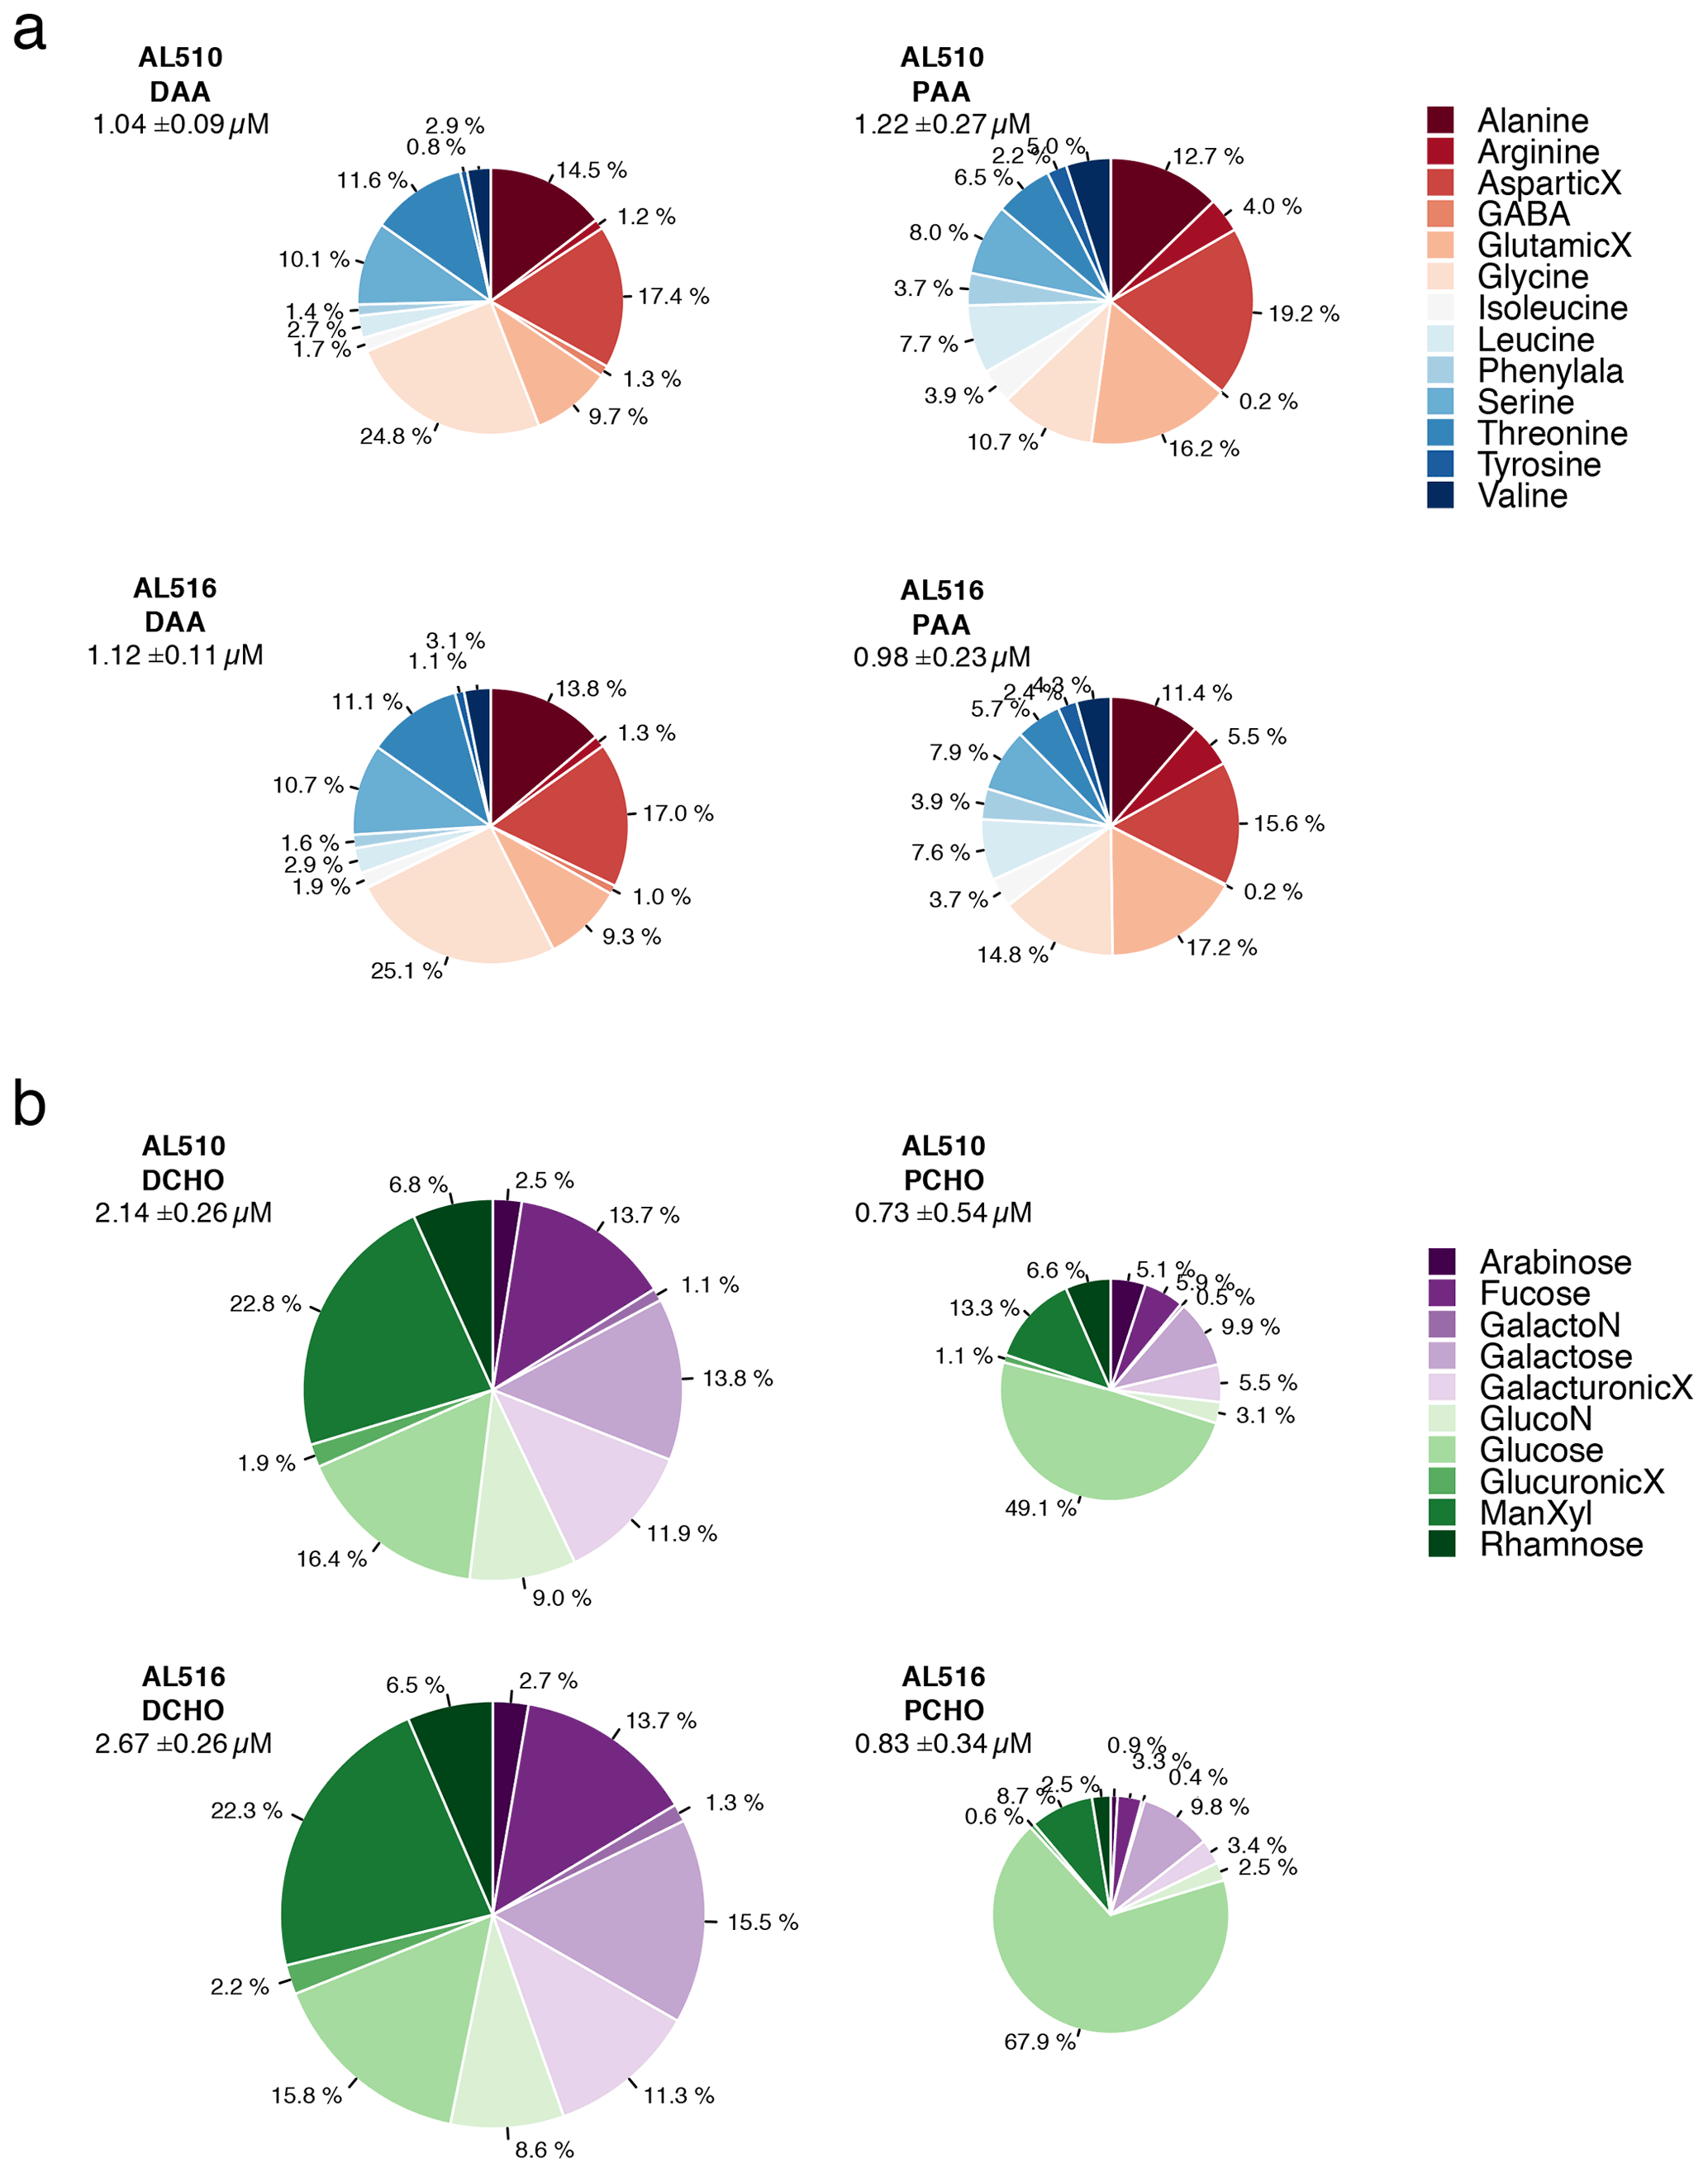
Figure 6(a) Comparison of amino acid composition of the dissolved phase (DAA) and particulate phase (PAA) and seasons (AL510, June, and AL516, September) relative to total concentrations. (b) Comparison of carbohydrate composition of the dissolved phase (DCHO) and particulate phase (PCHO) and seasons (AL510, June, and AL516, September) relative to total concentrations. An uppercase “X” at the end of a term indicates acid; Phenylala denotes phenylalanine; GalactoN denotes galactosamine; GlucoN denotes glucosamine.
3.3 The sea surface microlayer
As its enrichment in organic matter defines the SML, the main differences between the SML and ULW are highlighted in the following paragraph and presented in Table A3. Also, diurnal changes in organic matter concentrations and organisms' abundance are introduced (Table A4). Statistics are summarized in Table A5, including the effect of depth and the time of day. The SML and ULW differed significantly in DOC concentration, marked by a steady yet only slight enrichment over seasons (EFDOC June 1.04 ± 0.04; EFDOC September 1.09 ± 0.05). The percentage of semi-labile DOC was elevated in the ULW compared to the SML during both seasons, with a significant effect in September. DAA concentration was significantly elevated in the SML with an EFDAA of 1.06 ± 0.12 in both seasons. PAA tended to be enriched in the SML during the first cruise, while it was depleted during the second cruise in September. The time of day significantly affected PAA concentrations, which increased simultaneously in the SML and ULW towards the afternoon. In June, PCHO exhibited the highest EFs with a mean EFPCHO of 1.90 ± 1.76 and showed the largest differences between stations, with EFPCHO ranging from 0.56 to 7.08. In September, PCHO was generally depleted in the SML with a mean EFPCHO of 0.86 ± 0.47, covering a considerably smaller range with EFPCHO from 0.45 to 2.12 only. Enrichment and depletion of the SML were significant for both seasons, along with a significant change over the time of day. PCHO concentrations increased nearly 2-fold towards the afternoon (Fig. 7b), which was caused not exclusively by Glc but also by other minor molecular fractions. Particulate Glc was greatly affected by the time of day in both seasons, increasing 2-fold in concentration towards the afternoon. This caused likewise a change in its relative contribution to the particulate carbohydrate pool (Fig. 7c). The difference between mean surfactants concentrations in June (0.30 ± 0.03) in comparison to September (0.35 ± 0.05 mg L−1 TX-100 equiv.) was small but significant. However, surfactant concentrations in the SML ranged from 0.26 to 0.36 and from 0.31 to 0.49 mg L−1 TX-100 equiv. in June and September, respectively. Variability in surfactant concentration was therefore much smaller across seasons (11 %) than within seasons (June 28 %; September 37 %). In June, EFSurf was on average 1.15 ± 0.08, while in September a slightly lower EFSurf of 1.08 ± 0.10 was observed. Remarkably, surfactant concentrations increased towards the afternoon in both seasons (Fig. 7a). Only in June, depths and the time of day had a significant effect on surfactant concentration. DOC, PCHO, particulate Glc, and surfactants in the SML correlated significantly to ULW concentrations. Cell abundance was relatively similar between depths with a slightly stronger tendency towards SML depletion for pico-CBL cells and nano-NCBL (L) cells. In September, the time of day significantly affected the abundance of pico-NCBL cells and nano-NCBL (M) cells in the SML and the ULW (Fig. 7d, e). While the former decreased towards the afternoon, the latter increased. The abundance of organisms in the SML and ULW was highly correlated. In general, enrichment factors did not correlate with mean wind speed, except for EFLNA in June (Table S2).
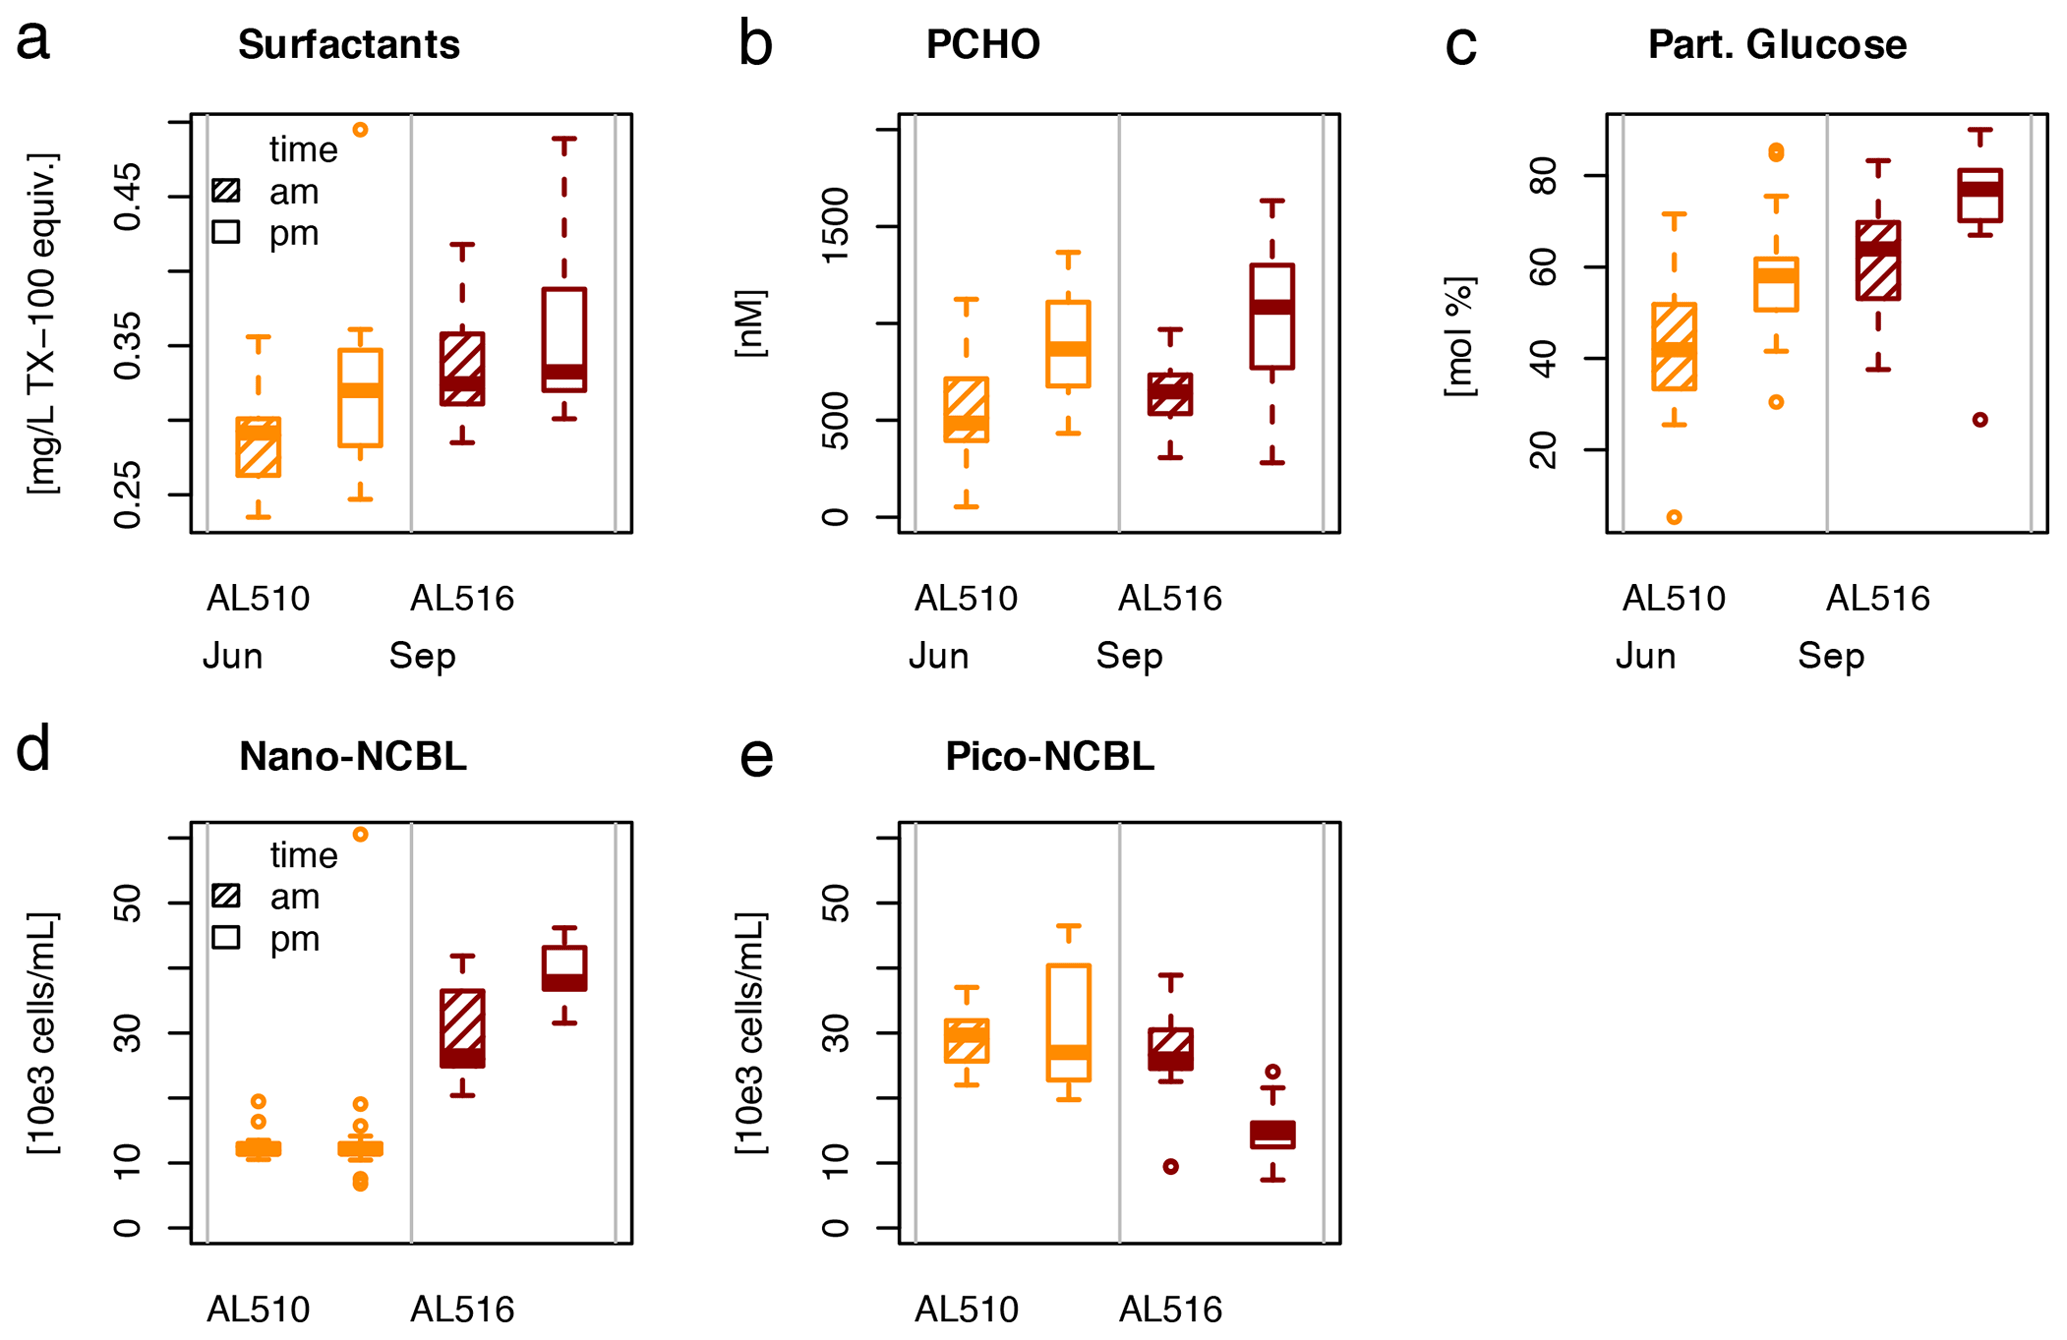
Figure 7Diurnal variability in (a) surfactant, (b) particulate carbohydrate (PCHO) concentration, (c) mole percent of particulate glucose, and selected phytoplankton groups: cyanobacteria-like (CBL) cells contain the pigment phycoerythrin while non-CBL (NCBL) cells contain solely chlorophyll a. NCBL cells represented here differ in size; i.e. they (d) range from approx. 2–10 µm (nano) or (e) are smaller than 2 µm in size (pico). Abbreviations: morning (am) and afternoon (pm).
3.4 Surface slick
During the first cruise at station 12, wind speed fell to the lowest observed value during the campaign (1.2 m s−1) and the SML condensed to a visible slick. Surface riffles were absent within the patch. The organic matter concentrations in the ULW matched the range observed at the other stations; however, the SML was extraordinarily enriched. The only exception was DOC (EFDOC 1.09). An EFDAA of 3.09 and an EFDCHO of 1.60 were recorded. Even higher enrichment was observed for the particulate phase (EFPAA6.37 and EFPCHO7.03). Surfactant concentration was enriched by an EFSurf of 1.73. Organism abundance in the SML was seemingly affected by the slick conditions encountered as enrichment ranged from 1.16 (EFCBL_S) to 5.34 (EFCBL_L) for autotrophic organisms and from 1.46 (EFHNA) to 1.57 (EFLNA) for bacteria. Maximal peaks in surfactant and nano-phytoplankton abundance were caused by slick conditions (day 160, Fig. S1b). As the slick represented unusual conditions with respect to wind, organic matter composition, and enrichments, this station was excluded from the correlation statistics in which surfactant dynamics were explored.
3.5 What determines surface activity?
The main goal of this work was to explore if specific molecular components of the amino acid and carbohydrate pool explain dynamics in surfactant concentrations within and across seasons. To better understand possible correlations with surfactant concentration, we also integrated data on bulk organic matter concentration and heterotrophic and autotrophic community composition. At first, the focus was placed on correlations occurring within seasonal data sets. Remarkably, only 7 significant correlations were identified in June (out of a total number of 59), of which 3 were positive (Table S3). DOC and PCHO concentration correlated positively with surfactant concentrations in June. The abundance of nano-NCBL (M) cells was negatively correlated to surfactant concentration. Within the pool of amino acids, the only significant positive correlation was detected for the particulate mole percent of Ser. Within the molecular pool of carbohydrates, dissolved ManXyl correlated negatively to surfactant concentration. In September, 11 significant positive and 7 significant negative correlations were identified (Table S3). Surfactant concentration was tightly linked to nano-NCBL (M) cell abundance in contrast to June. A linear regression model resulted in an adjusted R2 of 0.37 (p value <0.001), an acceptable level of confidence (F statistics – 22 on 1, 34 DFs), and a residual standard error of 17.8 %. The linear dependence of surfactant concentration on nano-NCBL (M) cell abundance is described in Eq. (3):
where a background level of 0.22 mg L−1 TX-100 equiv. remains unexplained by nano-NCBL (M) cell abundance. Pico-CBL cell abundance correlated negatively to surfactant concentration in September. A significant positive correlation was observed again for the particulate and non-essential amino acid Ser. A strong negative correlation was further observed for the particulate mole percent of AspX. As in June, fewer correlations were detected within the pool of carbohydrates compared to amino acids. However, the mole percent of dissolved Glc correlated most strongly to surfactant concentration.
A stepwise RDA was performed to investigate which of the significant correlations explained significant and additive variability in surfactant dynamics within seasons. The multifactorial regression model (model I) for June included the mole percent of particulate Ser, PCHO concentration, and DOC, which positively influenced surfactant concentration. In contrast, the influence of nano-NCBL (M) cells and dissolved ManXyl was negative (adjusted R2= 0.64; F statistics – 14.3 on 5, 33 DFs, p value <0.001) (Fig. 8a). The RDA for September (model II) revealed that two components were sufficient in explaining surfactants dynamics: the fraction of dissolved Glc positively influenced surfactant concentrations, while the influence of particulate AspX was negative (adjusted R2= 0.52; F statistics – 19.8 on 2, 33 DFs, p value <0.001) (Fig. 8b).
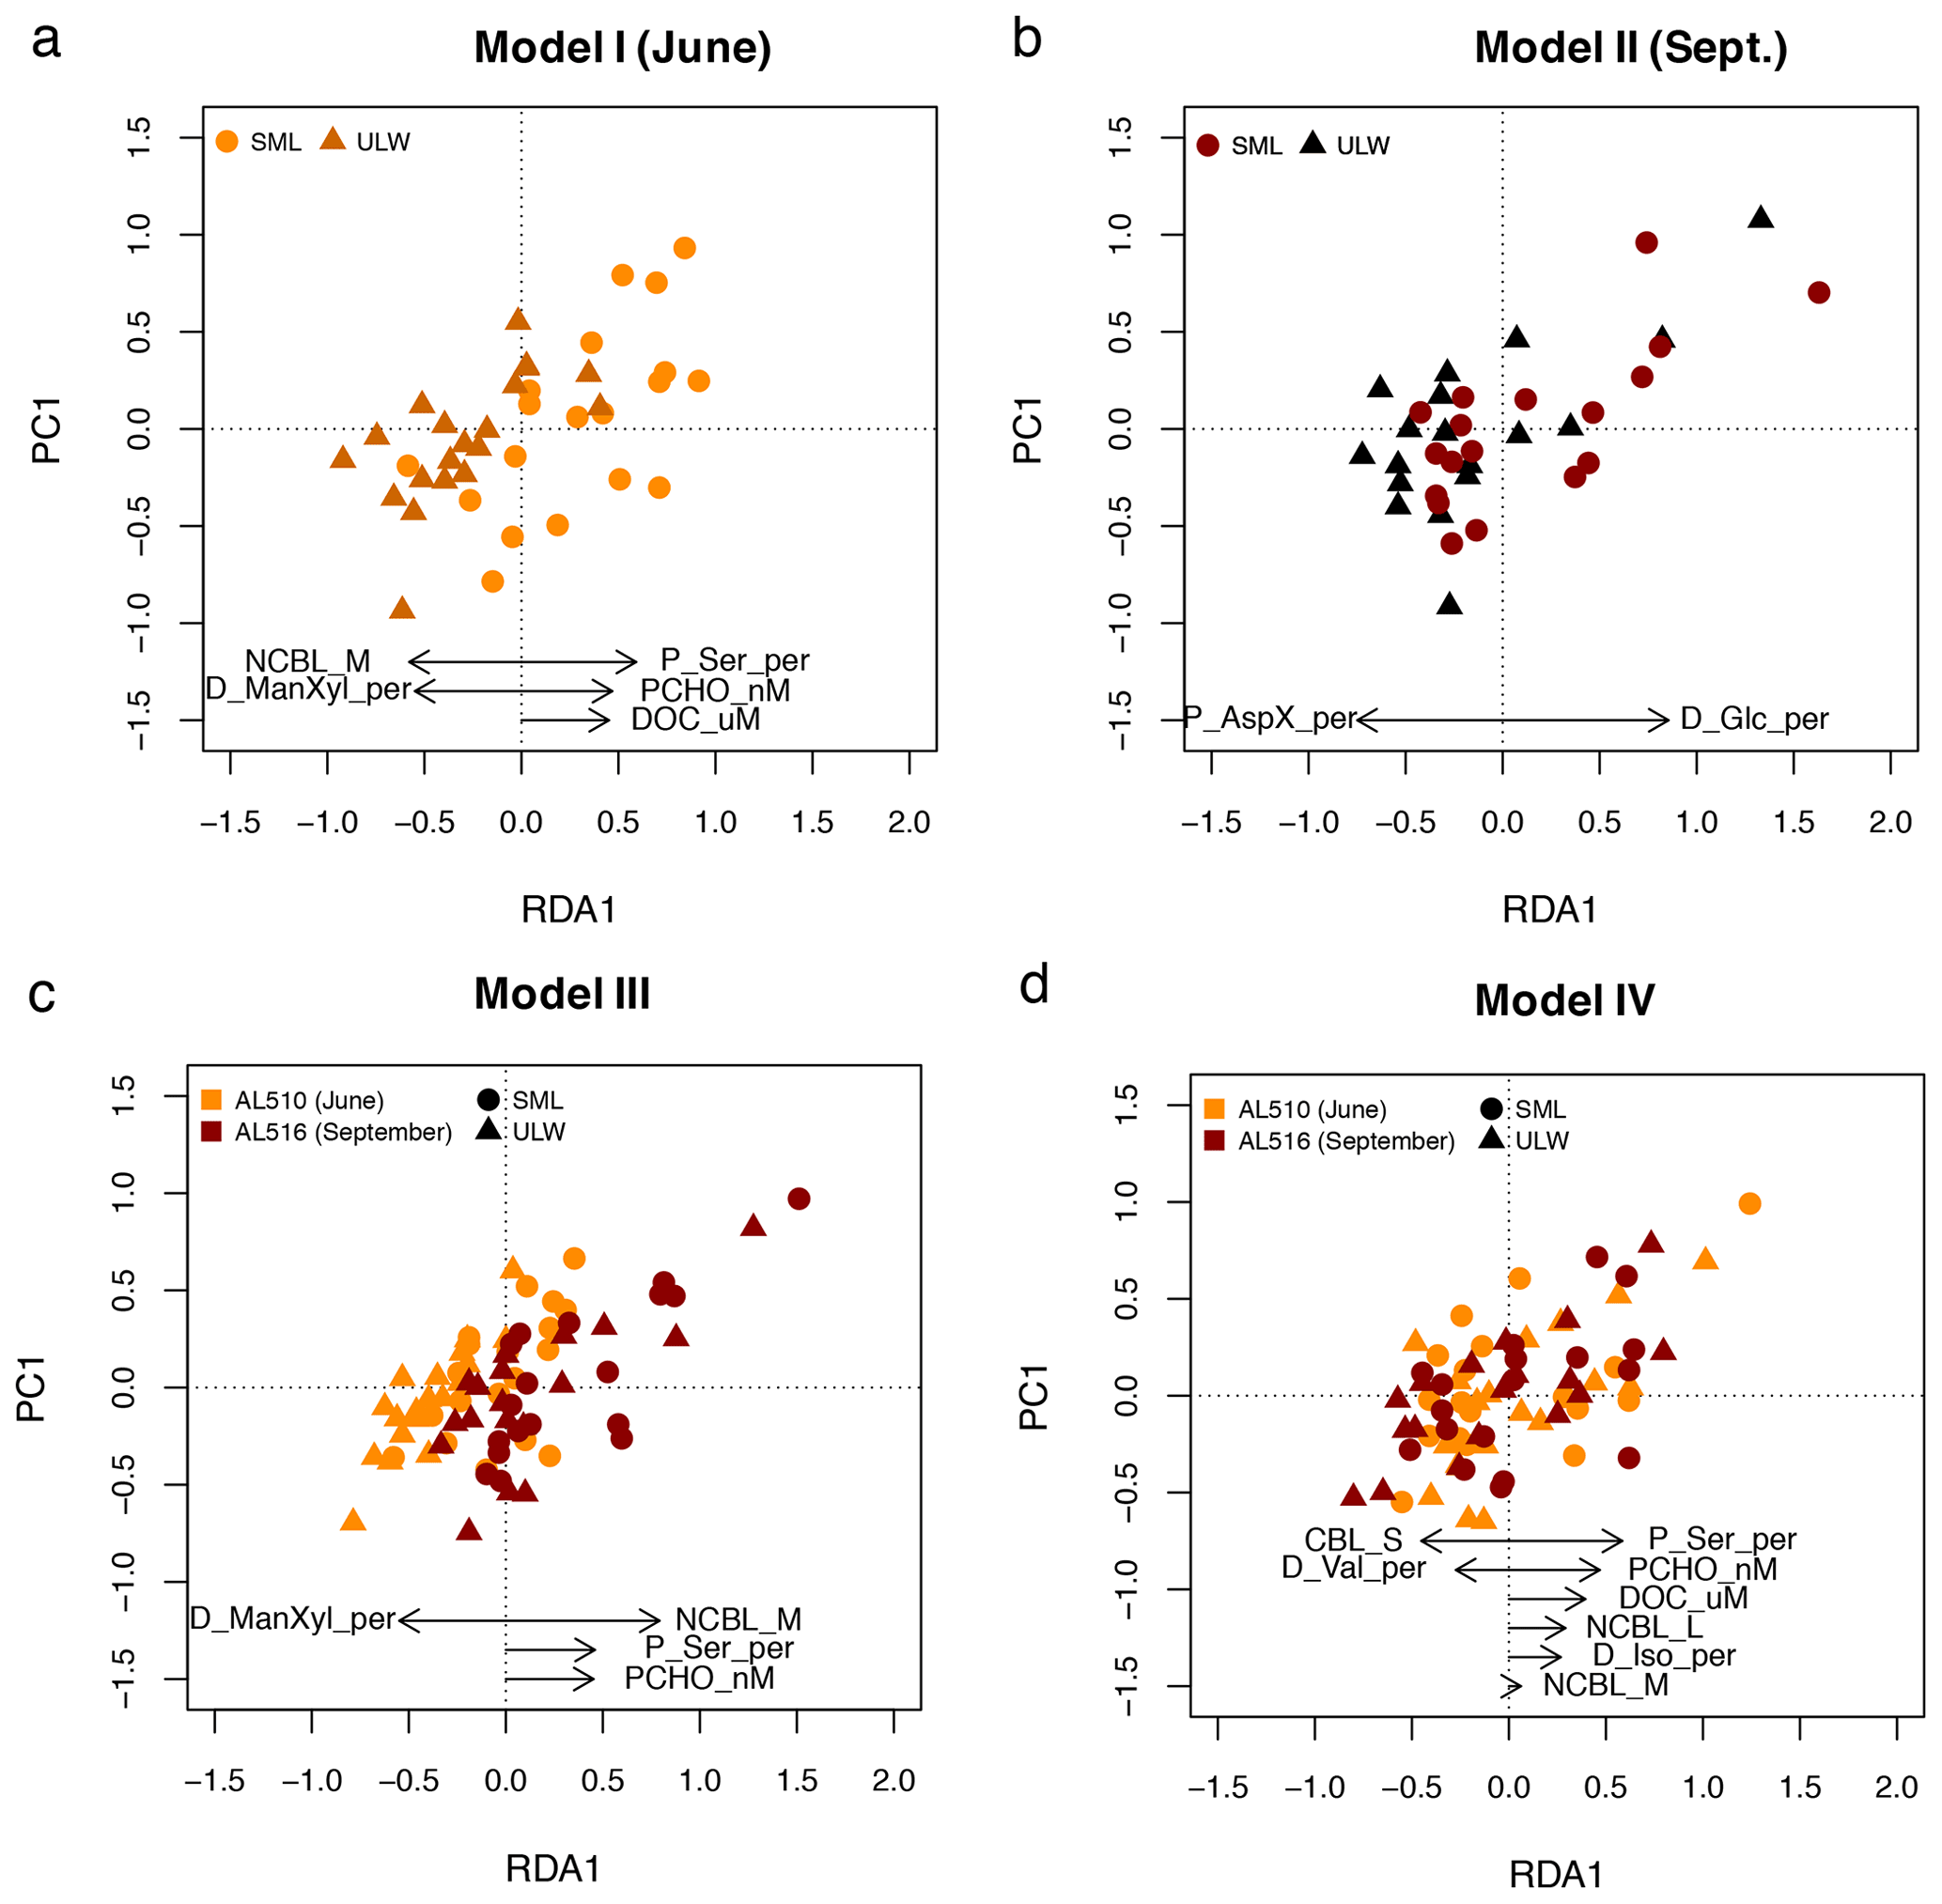
Figure 8Linear regression models derived from redundancy analysis (RDA) reflecting which components represent surfactant dynamics best. (a) In June, surfactant concentration (as depicted in PC1) positively correlate to the fraction of particulate serine (P_Ser_per), particulate carbohydrates (PCHO), and dissolved organic carbon (DOC). (b) In September, surfactants correlate positively to the fraction of dissolved glucose (D_Glc_per). (c) When the effect of seasons is included in the statistical model, nano-NCBL cell abundance (phytoplankton cells >2 µm containing the phytopigment chlorophyll a) correlates positively in concert with P_Ser_per and PCHO. (d) When the effect of seasons is excluded, P_Ser_per, PCHO, and DOC represent surfactant dynamics best. Other abbreviations: sea surface microlayer (SML) and the underlying water (ULW), dissolved mannose and xylose (D_ManXyl_per), isoleucine (D_Iso_per), and valine (D_Val_per).
We constructed rank-based correlation matrices for each season to unravel intercorrelation between molecular fractions, bulk organic matter concentration, and organisms (Figs. S3 and S4). The increased relative contribution of particulate Ser covaried positively with LNA and pico-NCBL cell abundance in June. On the other hand, DOC and PCHO concentration accompanied by the mole percent of dissolved ManXyl covaried with nano-CBL cell abundance (Fig. S3). In September, dissolved Glc exhibited the strongest positive intercorrelation to nano-NCBL (M and L) cell abundance, possibly explaining the same variance as dissolved Iso, particulate Ser, and others in surfactant dynamics (Fig. S4). Vice versa, these fractions exhibited strong negative intercorrelations to HNA and pico-CBL cell abundance. Other components (e.g. mole percent of particulate AspX and particulate Iso) covaried with an increase in HNA and pico-CBL cell abundance and correlated negatively to surfactant concentration (Fig. S4).
We constructed two subsequent multifactorial regression models (models III and IV) to investigate the combined effect of seasons on surfactant dynamics. In model III, the relative differences in concentration and abundance occurring from June to September are included. Model III resulted in an adjusted R2 of 0.60 (F statistics – 28.4 on 4, 70 DFs, p value <0.001) and included the positive effects of nano-NCBL (M) cell abundance, the mole percent of particulate Ser and PCHO concentration alongside the negative effect of dissolved ManXyl (Fig. 8c). Therefore, the model relies on the same predictors as the June data set but additionally includes the strong positive effect of nano-NCBL (M) cell abundance. To assess if these predictors are reliable even if the effect of seasons was excluded, a further multifactorial regression model was constructed (model IV). The mole percent of particulate Ser and PCHO concentration still prominently explained surfactant dynamics in model IV (adjusted R2=0.61; F statistics – 15.4 on 8, 66 DFs, p value <0.001), whereas the effect of nano-NCBL (M) cell abundance decreased considerably in explanatory power (Fig. 8d). DOC concentration gained in (positive) explanatory power. We conclude that PCHO concentration and the mole percent of particulate Ser explained surfactants dynamics independently of seasons and community composition. Nano-NCBL (M) cell abundance, on the other hand, was more important in explaining surfactant dynamics driven by season-specific organic matter and community composition.
Correlations between surfactants concentration and the absolute molecular concentrations of particulate carbohydrates and amino acids were also tested (data not shown). Particulate Gal was the only component which was consistent in its trend, no matter if the effect of seasons was included (coefficient ρ 0.29, p value <0.01) or excluded (coefficient ρ 0.23, p value <0.05), but yielded only low coefficients. For the absolute concentrations of the dissolved pool, only Glc exhibited a stable correlation to surfactant concentrations (Table S3). When the effect of seasons was included, the positive correlation was considerably stronger (coefficient ρ 0.47, p value <0.001) in comparison to when the effect of seasons was excluded (coefficient ρ 0.24, p value <0.04).
4.1 Plankton community shifts from June to September
Phyto- and bacterioplankton dynamics in the Baltic Sea follow explicit seasonal cycles controlled mainly by abiotic factors such as water column stratification, nutrient supply, light, and temperature (Wasmund et al., 2008; Bunse et al., 2019). During the spring bloom, diatoms dominate micro-phytoplankton abundance (Wasmund et al., 2008; Bunse et al., 2019; Alegria Zufia et al., 2021). However, eukaryotic pico-phytoplankton (summarized here as pico-NCBL cells) may substantially contribute to phytoplankton biomass at coastal sites (Alegria Zufia et al., 2021). Heterotrophic bacteria production increases shortly after the spring bloom but declines to low levels simultaneously with phytoplankton biomass at the beginning of June (Bunse et al., 2019). The post-spring bloom phase then lasts from April to mid-June, during which diatoms are lost from surface waters by sedimentation (Wasmund et al., 2008). In 2018, the first cruise (June) coincided with this post-bloom state as reflected in overall low GPP and Chl a concentration (Fig. 3a). Explicitly, pico-NCBL cell numbers were elevated compared to the second cruise and may be interpreted as a lasting imprint of the spring bloom in agreement with Alegria Zufia et al. (2021). Relative to September, we observed a reduced pool of semi-labile DOC, which coincided with overall lower bacterial abundance and the dominance of LNA cells, commonly interpreted as inactive cells (Servais et al., 2003). DAA composition in June differed from September mainly due to higher mole percent of GABA and Ala. GABA has been associated with increased bacterial decomposition (Dauwe et al., 1999). Ala synthesis pathways are universal in photoautotrophic and heterotrophic production, and therefore increased fractions indicate likewise microbially degraded organic matter (Cowie et al., 1992; Ziegler and Fogel, 2003). Towards the end of the first cruise, we encountered increasing pico-CBL cell abundance (Synechococcus spp.), synchronizing with a sharp increase in GPP and Chl a concentration. This change marked the transition from the post-spring to the summer bloom period.
As nutrient concentrations are greatly reduced during summer stratification, summer blooms rely primarily on the supply of recycled or freshly fixed nutrients in the upper water column (Lennartz et al., 2014; Bunse et al., 2019). In the central Baltic Sea, phytoplankton biomass increases based on nitrogen-fixing cyanobacteria blooms (Ohlendiek et al., 2000; Bunse et al., 2019). In the Danish straits, however, summer blooms are only sporadically supported by nitrogen-fixing cyanobacteria (Wasmund et al., 2008; Klais et al., 2017), which favour lower salinities (<11.5 PSU) and higher temperatures (>16 ∘C) (Wasmund, 1997). Nano-flagellates prevail in late summer and may contribute more than 80 % to total phytoplankton biomass in the central Baltic Sea (Bunse et al., 2019). Synechococcus spp. may contribute as much as 27 % to phytoplankton biomass (Alegria Zufia et al., 2021). The summer bloom period lasts approximately until the end of August (Wasmund et al., 2008). This productive period was apparent from intensified GPP (Fig. 3b). The second cruise started at the beginning of September 2018. In comparison to June, pico-CBL cell abundance had increased 10-fold and nano-NCBL cells also greatly increased, which aligns well with the expected high contribution of Synechococcus spp. and nano-flagellates (Bunse et al., 2019; Alegria Zufia et al., 2021). Therewith, the end of the first cruise overlapped with the transition into a highly productive summer bloom state, which collapsed just after the second cruise in the middle of September. Bacterial biomass and abundance generally increase towards summer in the Baltic Sea (Dreshchinskii and Engel, 2017; Bunse et al., 2019). In September, an elevated fraction of semi-labile DOC in September was accompanied by increased bacterial abundance and the dominance of HNA cells. They represent the productive, growing fraction in the heterotrophic bacterial community, and grazers prefer them in comparison to LNA cells (Gasol and Del Giorgio 2000; Servais et al., 2003). Bacterial production synchronizes sharply with the summer bloom period (Bunse et al., 2019) and, therefore, presumably with the release of labile compounds. In concordance, the PCHO pool in September contained greatly elevated amounts of Glc. Storage compounds such as laminarin are built of Glc and represent the largest share of freshly fixed carbon in phytoplankton cells (Hama et al., 1988; Grosse et al., 2017; Becker et al., 2020). In the surface ocean, particulate Glc and its homopolysaccharides correlate positively to Chl a concentration, which is interpreted to reflect primary production (Engel et al., 2012; Becker et al., 2020). The composition of DAA by September, which was elevated in essential amino acids such as Phe, Tyr, Iso, and Leu, also pointed to recent primary production (Amon et al., 2001).
Increased wind speed and declining seawater density differences support the onset of diapycnal mixing at Boknis Eck (Wasmund et al., 2008; Lennartz et al., 2014). This leads to the entrainment of remineralized nutrients and ultimately initiates the autumn bloom (Wasmund et al., 2008). Conclusively, we have witnessed different production states. The first cruise coincided with the post-spring bloom phase, in which GPP was low and a relatively degraded organic matter pool was present. Phytoplankton community production increased sharply thereafter, replenishing the pool of fresh organic matter until mid-September when the second cruise had just terminated.
4.2 Low surfactant enrichment in a coastal eutrophic regime
We observed slightly higher EFSurf in June (EFSurf 1.15 ± 0.08) than in September (EFSurf 1.08 ± 0.10), marked by relatively low surfactant concentrations (0.30 ± 0.03 mg L−1 TX-100 equiv.). Surfactant concentrations were comparable to concentrations measured in other eutrophic coastal seas. For example, SML concentrations of 0.25 to 0.38 mg L−1 TX-100 equiv. were measured in the British North Sea in summer and in close proximity to the coast (coast of Blyth), while surfactant concentrations decreased to a minimum of 0.08–0.27 mg L−1 TX-100 equiv. in winter (Pereira et al., 2016). In the same study, EFSurf ranged between 1.0 and 1.9 in reference to a sample collected at a depth of 1 m (Pereira et al., 2016). At a coastal station of the North Sea, surfactant concentration between 0.18 and 0.26 mg L−1 TX-100 equiv. was determined during spring, indicating overall low EFSurf (∼1.1), which is therefore comparable to our study (Stolle et al., 2020). To set our results into a broader context, oceanic surfactants range from very low (0.05; 0.08 mg L−1 TX-100 equiv.) to high concentrations (0.67; 0.49 mg L−1 TX-100 equiv.) (Mustaffa et al., 2020; Barthelmeß et al., 2021), while slicks may form above 0.65 and reach concentrations beyond 3 mg L−1 TX-100 equiv. (Mustaffa et al., 2020). Likewise, EFSurf varies widely in oceanic regimes with the majority of samples located between EFSurf 1.1 and 3.6 (Wurl et al., 2011a). Equivalently to surfactants, dissolved organic matter (DOM) components were only a little enriched in the SML during our campaign, which is supported by previous studies. For example, our EFDOC matches precisely with the enrichment assessed in two studies conducted in the coastal southern Baltic Sea (Stolle et al., 2010; Van Pinxteren et al., 2012). In conclusion, the enrichment of surfactants and DOM in oceanic regimes (Kuznetsova and Lee, 2002; Reinthaler et al., 2008; Wurl et al., 2011a; Sabbaghzadeh et al., 2017; Zäncker et al., 2017) often exceeds the low EFs which apparently characterize the Baltic Sea. The here-observed correlation coefficients of surfactant concentrations between the SML and ULW were high, and EFSurf was unrelated to the prevailing wind regime. Surfactant concentrations of the SML and ULW are often highly correlated (e.g. Pereira et al., 2016; Mustaffa et al., 2020), suggesting a continuous upward flux (Cunliffe et al., 2013). This can be explained by wind- and wave-driven intrusion of bubbles and the subsequent scavenging of surfactants (Stefan and Szeri, 1999). Thereby, induced turbulence by wind forcing does not interrupt the enrichment of surfactants and hydrophobic fluorescent DOM (Sabbaghzadeh et al., 2017; Mustaffa et al., 2018), nor does it fully explain enrichment patterns (Wurl et al., 2011a; Mustaffa et al., 2018). Wurl et al. (2011a) highlighted that the enrichment of surfactants responds to the trophic state and is the smallest in eutrophic regimes. A relative depletion of the SML in DOM is favoured by higher ULW DOM concentrations (Van Pinxteren et al., 2017), and the enrichment pattern can be controlled by changes occurring only in the ULW (Mustaffa et al., 2018). This suggests that the area of the air–sea interface is a limiting factor for surfactant enrichment. By approaching a certain saturation level of surfactants at the interface, further surfactants are simply prevented from adsorbing (Bock and Frew, 1993; Frka et al., 2012). Therefore, the low SML enrichment of surfactants, as observed in September, could be explained by an already high surfactant coverage at the air–sea interface. Indeed, surfactant coverage at Boknis Eck (January 2009–May 2010) has been estimated to be high, i.e. only a factor of 2–3 lower than for a reference phospholipid monolayer (Laß and Friedrichs, 2011). Alternatively, Sabbagzadeh et al. (2017) suggested that surfactant enrichment is limited by the total number and therefore available surface area of ascending bubbles at a constant flux. As the available surface area decreases the higher the ULW surfactant concentration is, the transport mechanism by bubble scavenging becomes less efficient. Conclusively, lower surfactant concentrations in June favoured higher EFs in a system in which organic matter was potentially further degraded. In September, on the other hand, elevated surfactant concentrations and reduced enrichment co-occurred with a fresher organic matter profile along with a more active and abundant autotrophic and heterotrophic community, i.e. highlighting that in a more productive regime, surfactant enrichment declines.
4.3 Seasonal similarities in surfactant sources
4.3.1 The ambiguous influence of DOC concentration on surface activity
DOC concentration explained a significant part of the observed variability in surface activity in June (model I), and in model IV, in which the effect of seasons was excluded. In principle, model IV underlines that increasing DOC concentration indicates higher surface activity, also in the coastal Baltic Sea. It has been shown before that DOC (Ćosović and Vojvodić, 1998; Frew et al., 2001) and TOC concentrations (Barthelmeß et al., 2021; Calleja et al., 2009) correlate positively to surface activity and gas-exchange suppression. In oceanic regimes, surfactant production is likely attributed to marine phytoplankton production (autochthonous) (Barthelmeß et al., 2021). In contrast, humic-like substances derived from terrestrial DOC (allochthonous production) may contribute to surface activity in coastal regimes (Frew et al., 2001; Cuscov and Muller, 2015). Allochthonous DOC entering the Danish straits has been photochemically and microbially processed and may have been retained in the Baltic Sea for up to 12 years (Seidel et al., 2017). In relation to a DOC reservoir of approximately 325 µM in the central Baltic Sea, changes caused by autochthonous production throughout a year's cycle are minor and account for only 20–60 µM DOC (Seidel et al., 2017; Bunse et al., 2019). The intra-seasonal variability in DOC concentrations in this study (represented by SDs) matches the range expected for autochthonous production. However, we could not establish any direct and positive relationships between surfactants and fractions of the autochthonous semi-labile DOC pool in June. Interestingly, Frew et al. (2001) showed that the positive correlation between surfactant and DOC concentration varied considerably throughout seasons and attributed this to qualitative shifts in the DOC pool, which were caused by autochthonous and allochthonous sources. We therefore suggest that allochthonous, microbially processed DOC precludes the (minor) influence of dissolved autochthonous sources on surface activity in June and/or maintains a ground stock of surfactants during both seasons. The significantly lower contribution of autochthonous, semi-labile DOC and a preceding post-spring bloom period, which was characterized by low GPP (Fig. 3), suggest that allochthonous DOM explains elevated DOC concentrations in June. This explanation is likewise supported by the considerably lower salinity observed in June, suggesting that freshwater (i.e. of terrestrial origin) could have influenced DOC concentration and composition. In general, terrestrial discharge favours the unusually high amounts of refractory DOC present in the Baltic Sea compared to more oceanic regimes (HELCOM, 2018). In late spring, DOC concentration in the Danish straits is elevated and 75 % of DOC can be attributed to terrestrial discharge in comparison to autumn (in autumn, 69 % DOC of terrestrial origin) (Seidel et al., 2017). In combination, this suggests that the DOC reservoir at Boknis Eck was replenished from allochthonous rather than autochthonous sources in particular in June and that the significant difference in DOC concentration across seasons was possibly unrelated to phytoplankton production. Moreover, it should be considered that the coastal surfactant stock may originate from anthropogenic pollution including, but not restricted to, waste discharge, ship traffic, or industrial combustion (Wurl et al., 2017; Shaharom et al., 2018).
4.3.2 Surface activity responds to the particulate pool of carbohydrates and a specific amino acid
Cells coagulate upon the release of a protein- or carbohydrate-rich extracellular matrix (Passow, 2002; Thornton et al., 2016; Engel et al., 2017b). Therefore, the PAA and PCHO pool includes aggregates, bacteria, and phytoplankton cells, consisting of extra- and intracellular material alike. The SML is characterized as an aggregate-enriched layer (Wurl and Holmes, 2008; Cunliffe and Murrell, 2009). It is further recognized that dense and visible organic surface films form on calm seas but dissipate rapidly when wind speed increases (Cunliffe et al., 2013; Sun et al., 2018; Robinson et al., 2019). The occurrence of a slick at station 12, which formed at low wind speed and was characterized by high EFPAA and EFPCHO, thus aligns well with this expectation. Above wind speeds of 5 m s−1, SML enrichment gradually decreases until particulate organic matter (POM) becomes depleted beyond 8 m s−1 (Wurl et al., 2011b; Galgani and Engel, 2016; Sun et al., 2018). In this study, wind speed did not correlate to EFPCHO and EFPAA. But in general, higher mean wind speed in September (8.6 ± 2.8 m s−1) could explain why POM was on average depleted in the SML in comparison to June. Independent of the regional wind regime, sporadic enrichment events are controlled by locally rising bubble plumes (Mopper et al., 1995; Robinson et al., 2019), dilation and compression by surface waves (Carlson, 1993; Wurl et al., 2011b), and the interplay of ballast integration and bacterial colonization (Mari et al., 2017). SML enrichment of POM does not necessarily imply surface-active properties as the natural buoyancy of aggregates can cause a similar pattern (Jenkinson et al., 2018).
Based on the results of this study, we can confirm that the particulate pool also contributed to surface activity. An increase in surfactant concentration during the summer cruise was reflected in the particulate fraction of Ser and PCHO (model I). In the surfactant models combining the seasonal data sets (statistical models III and IV), particulate Ser and PCHO consistently and significantly explained variability in surface activity. In general, amino acids are enriched preferentially at the air–sea interface due to their natural amphiphilic property (Ćosović and Vojvodić, 1998; Cunliffe et al., 2013), which is caused by the degree of polarity exhibited at their molecule surfaces. Within the range of amino acids represented here, Arg can be considered hyperpolar and is followed by the acidic amino acids GlX and AspX, which also exhibit relatively large topological polar surface areas. Further, Ser, Thr, and Tyr are characterized as polar amino acids. Amino acids, which were found to accumulate in aerosols, foams, or the SML, are prominently represented by Arg, GlX, and Ser (Kuznetsova and Lee, 2002; Van Pinxteren et al., 2012; Engel et al., 2018; Barthelmeß et al., 2021) and exhibit a tendency towards greater polarity. However, amino acids of all polarities may represent the hydrophilic head group of anionic surfactants (Románszki and Telegdi, 2017), although only a few candidates support the stabilization of surface films. The amino acid Ser is equipped with a hydroxyl group, which enables the formation of hydrogen bonds. Interestingly, Ser-based surfactants favour aggregate formation and increase viscosity and packing density at interfaces (Perinelli et al., 2016; Románszki and Telegdi, 2017). Thus, they represent well-suited building blocks of particulate surfactants.
Apart from Ser, variability in PCHO concentration added further explanative power not only to the surfactant model of the first cruise but also to models III and IV. In concert with surfactants in June, PCHO concentration significantly increased from the morning to the afternoon. So far, little is known about diurnal changes in surfactant concentration. However, several scenarios could provoke diel variability in organic matter composition of the SML. Laß et al. (2013) reported that the surface nano-layer in Boknis Eck was most pronounced during early summer. They hypothesized that abiotic photochemical degradation could explain a carbohydrate-rich nano-layer in June. Indeed, the exposure to sunlight induces aggregate formation in unfiltered seawater (Ortega-Retuerta et al., 2009). Equivalently, solar irradiation leads to the photochemical production of surfactants in unfiltered SML samples (Stolle et al., 2020). When exposed to sunlight and UV radiation, extracellular polymeric substances (EPSs) of bacteria aggregate (Song et al., 2015; Shammi et al., 2017; Sun et al., 2017). Diatom-derived EPSs, on the other hand, will aggregate only if bacteria are present (Gärdes et al., 2011; Sun et al., 2017). Moreover, the diel cycle of photosynthetic production and consumption raises the pH in microbial assemblages (as represented by EPS aggregates) during the day and decrease it during the night. The physical stability of microbial EPS matrices is affected by a change in pH as ion bonding between molecules is promoted by a basic pH (Decho and Gutierrez, 2017). On the other hand, Zhang et al. (2003a) reported that SML viscosity was elevated during the daytime and decreased during night, assuming that fresh organic matter released by phytoplankton influenced viscosity and impeded gas exchange. A concurrent release of POM from phytoplankton cells can be promoted during periods of starvation and bloom decay (Engel et al., 2004; Thornton, 2014). During both campaigns, particulate Glc concentration increased towards the afternoon, likely reflecting phytoplankton carbon fixation (Engel et al., 2012; Becker et al., 2020). However, particulate Glc did not correlate to surfactant concentration. In the absence of any positive correlations of surfactant concentration to either organisms in June or particulate Glc in June and September, we suggest that PCHO partly represented extracellular polymeric aggregates. We propose that PCHO accumulated during the day due to abiotic complexation initiated by photo-transformation or pH transformation.
4.4 Seasonal dissimilarities in surfactant sources
Nano-phytoplankton triggers release of semi-labile organic matter and surfactants in September
In the September surfactant model (II), variability in surface activity was best explained by dissolved Glc. The intercorrelation matrix shows that the variability in surface activity, as represented by dissolved Glc (positive) and particulate AspX (negative), covaries with multiple other semi-labile components. Two clusters reflected the strong, positive effect of nano-phytoplankton abundance on organic matter composition and surface activity on one hand and the negative effect of primarily HNA and pico-CBL cell abundance on the other (Fig. S4). Possible release mechanisms for labile to semi-labile organic matter from phytoplankton cells are exudation and leakage, which vary with environmental conditions and taxonomy (Thornton, 2014). Small non-charged molecules such as Glc may easily leak through the cell membrane by gradient-dependent diffusion (Thornton, 2014). Within the phytoplankton cell, however, Glc is usually stored in glucan polymers linked to laminarin (Hama et al., 1988; Grosse et al., 2019; Becker et al., 2020). Cell lysis can be induced by autocatalytic cell death, viral infection, or grazing (Thornton, 2014; Biggs et al., 2021). Cell lysis fosters the release of dissolved labile organic matter including not only dissolved Glc but also essential amino acids such as Iso. Exudation, leakage, or lysis from nano-NCBL cells could therefore directly explain the release of surfactants. Nevertheless, the positive effect on surface activity was opposed by the negative impact of prokaryotic cells (pico-CBL and HNA). This suggests a lively interplay between these groups, i.e. nano-NCBL versus prokaryotic cells. In general, inorganic nutrient limitation stimulates grazing in facultative mixotrophic plankton communities to exploit alternative nutrients sources, such as amino acids. Mixotrophy seems surprisingly common among previously thought obligate autotrophs (Grujcic et al., 2018; Edwards, 2019; Muñoz-Marín et al., 2020) and is the preferential mode in productive coastal habitats (Edwards, 2019). In the Danish straits, mixotrophic organisms reach their highest share of the total biovolume in September (Klais et al., 2017). Therefore, a possible scenario is that nutrient depletion in the upper water column (as seasonal stratification was still stable) favoured mixotrophy. Nano-phytoplankton may have grazed on heterotrophic and autotrophic prokaryotic cells (Apple et al., 2011; Bunse et al., 2019; Connell et al., 2020). Nano-flagellate and ciliate cultures released surfactants upon grazing on bacterial prey (Kujawinski et al., 2002). Temporal dynamics in grazer abundance were further reflected in reciprocal shifts in prey density (Kujawinski et al., 2002). Conclusively, we hypothesize that exudation, leakage, or trophic interactions triggered the release of labile to semi-labile components and surfactants concomitantly. The release of surfactants triggered by nano-phytoplankton in September should be interpreted as a seasonal signature rather than a “taxon”-specific marker for surface activity as in June nano-NCBL (M) cells anticorrelated with surfactant concentration.
4.5 Fresh and microbially processed surfactants imply different turnover times
Possible surfactant sources identified here originated from the particulate and dissolved phase. Glc and its storage molecules contribute the largest fraction of freshly produced POC (e.g. Borchard and Engel, 2015; Becker et al., 2020), which accumulates during the day (Becker et al., 2020). Especially in September, we observed high contributions of particulate Glc (diel average of ∼70 mol %), increasing 2-fold in concentration towards the afternoon. Once released, fresh Glc is preferentially and ubiquitously utilized by heterotrophic bacteria and therefore depleted in the DOM pool (Rich et al., 1996; Amon et al., 2001; Sperling et al., 2017; Bunse et al., 2019). Extracellular enzyme activity and direct uptake of laminarin result in rapid turnover rates of ∼34 nM h−1 (Becker et al., 2020). Aside from energy storage molecules, Glc also contributes to structural molecules (Kharbush et al., 2020), which resist microbial degradation. Elevated mole percent of dissolved Glc indicates advanced microbial diagenesis in the deep ocean (Goldberg et al., 2011; Engel et al., 2012). Therefore, changes in dissolved labile Glc concentration in the surface ocean are only noticeable (I) on timescales of hours and (II) if the background mole percent of dissolved Glc is stable (local sampling). Glucan-type polymers may constitute the dominant fraction of surfactants released by phytoplankton (Frew et al., 1990). Labile Glc has been further identified to serve as a powerful marker not only for ice nucleation activity in the SML (Zeppenfeld et al., 2019) but also for the soluble size fraction of organic matter present in sea spray aerosols (Miyazaki et al., 2018, 2020), which suggests surface-active properties of substances associated with Glc. Glucan-type surfactants and/or concomitantly released labile components likely triggered maximal surface activity in September. The close temporal evolution of nano-phytoplankton, dissolved Glc, and surfactants suggests turnover rates of a day or less. Homopolysaccharides are preferentially degraded over heteropolysaccharides (Amon and Benner, 2003; Sperling et al., 2017). Heteropolysaccharides containing elevated amounts of ManXyl, deoxysugars (Rha and Fuc), Ara, and Gal potentially contribute to surface activity and are often associated with diatom-derived aggregates (Frew et al., 1990; Mopper et al., 1995). These fractions were relatively enriched in PCHO in the post-spring bloom period, which is usually also marked by intensified rates of diatom sedimentation and decay (Wasmund et al., 2008). ManXyl was further identified to resist fast microbial degradation (Engel et al., 2012; Sperling et al., 2017). Its increase in the dissolved phase was anticorrelated to surface activity in models I and III, which may therefore indicate the disintegration of previously surface-active aggregates. Extracellular aggregates are hotspots of bacterial growth (Mari et al., 2017; Sperling et al., 2017). Increased mole percent of Ser was previously associated with intensified sedimentation of aggregates (Ingalls et al., 2006). In sediment samples, Ser covaried with the accumulation of peptidoglycan, a bacterial cell wall component, and elevated ratios of peptidoglycan and Ser directly reflected heterotrophic production (Veuger et al., 2006). In general, a higher mole percent of Ser is associated with advanced microbial decay (Dauwe and Middelburg, 1998; Amon et al., 2001). Therefore, the presence of particle-associated bacteria could be indicated by increased mole percent of particulate Ser in this study. Surfactants produced by bacteria often incorporate polar amino-acids including Ser (Messner, 1997). If the polar amino acid Ser contributed directly to surface activity, it likely resists rapid degradation and maintains a constant surfactant pool. Conclusively, surfactant components identified in June and September exhibit divergent microbial turnover times.
4.6 Implications for air–sea gas exchange
Surfactant dynamics resolved in our study apply to a restricted, local area and thus reveal high temporal changes in the surfactant pool in June and September. While the average seasonal difference was relatively small, short-term variability in SML surfactant concentration was large (June 28 %; September 37 %). In addition, the SML condensed to a visible slick at a station where the wind subsided to a minimum. The averaged effect on air–sea gas exchange caused by a change in seasons is presumably smaller than variations within seasons. Surfactant concentrations in the range of 0.08 to 0.38 mg L−1 TX-100 equiv. suppressed CO2 gas exchange by 14 %–51 % in a coastal transect (20 km) of the North Sea in relation to surfactant-free waters (Pereira et al., 2016). During our campaign, surfactant concentrations were in comparison relatively high. Estimated suppression of gas exchange would range from approximately 40 % to 60 %, given that the linear relation between suppression and surfactant concentration holds in this extended range and that it is transferable to the coastal Baltic Sea. However, samples were derived from different seasons (winter and summer) and stations (coastal to open sea) (Pereira et al., 2016), which allows for better comparability. We hypothesize that particulate Ser, PCHO, and their microbially and/or photochemically reworked structure in concert with the DOC pool exhibit a more constant effect on air–sea gas exchange. The effect of freshly produced components, on the other hand, is additive but transient.
Carbohydrates and amino acids along with other DOC components contribute to surface activity during periods of low and moderate primary production in the coastal Baltic Sea. In the post-spring bloom phase (June), the surfactant pool is microbially altered as it is defined by the non-essential amino acid serine and carbohydrate polymers, which include a high fraction of mannose and xylose. Also, presumably allochthonous DOC complements the surfactant pool. Solar radiation may exhibit an additional control on surfactant formation, owing to photo-transformation or pH transformation of polymers and marked by accumulated surfactant concentration in the afternoon. A rather persistent surfactant pool maintains a steady background effect on air–sea gas exchange in boreal summer. At the end of the summer bloom phase (September), on the other hand, the highest surface activity is triggered by the release of fresh and microbially available products, prominently represented by dissolved combined glucose and an essential amino acid, which are associated with the abundance of nano-phytoplankton cells (2–20 µm). Our findings show that labile surfactants may cause major peaks in the suppression of air–sea gas exchange, but their effect is potentially transient. Therefore, we hypothesize that phytoplankton products can contribute substantially to the surfactant stock. However, organic matter release mechanisms and microbial turnover rather than incident primary production control surfactant concentration. To constrain net fluxes of greenhouse gases in coastal seas, future studies should focus on carefully aligning seasonal and diel patterns of greenhouse gases and surface activity. With this work, we contribute novel insights into the temporal resolution of surfactant dynamics and their biogenic composition on a local scale.
Table A1Overview of multifactorial regression models applied to assess surfactant dynamics within and across seasons.
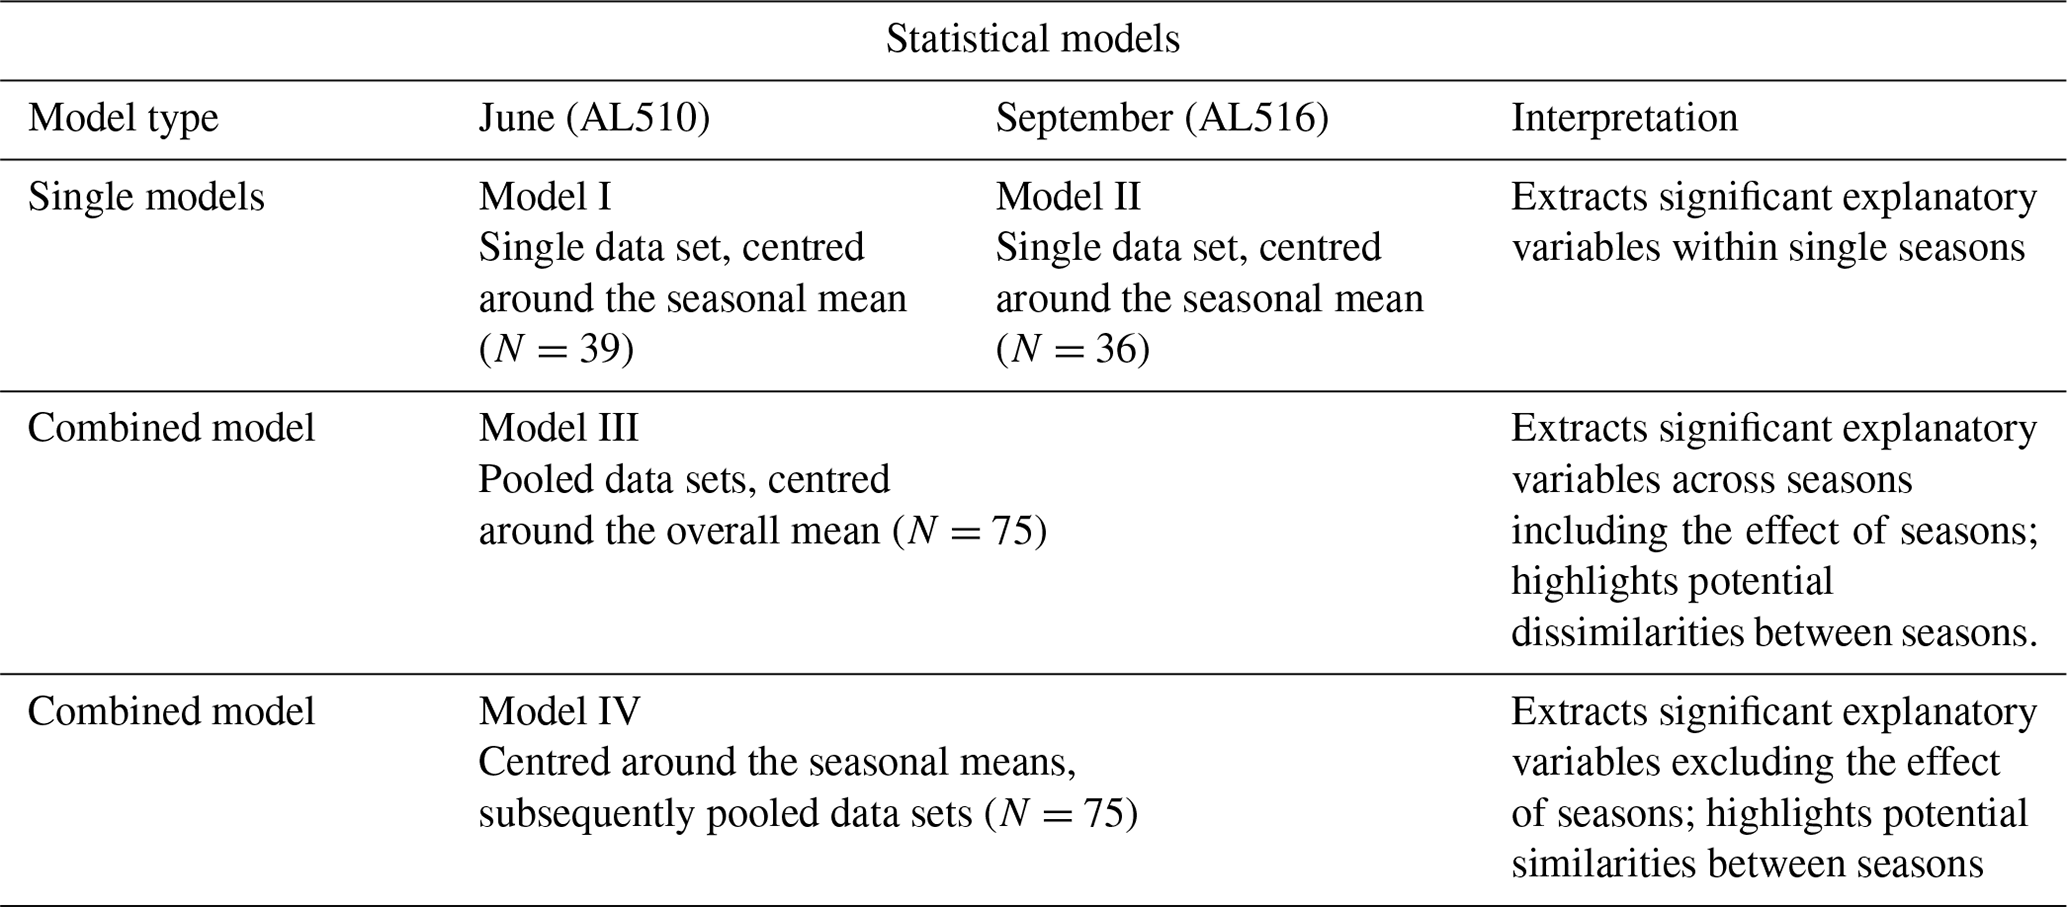
Table A2Concentrations and statistics of differences (Wilcoxon rank test) for the summer (AL510) and autumn (AL516) sample set. Bold numbers indicate significance while the asterisks mark the level of significance (*p value <0.05; value <0.01; value <0.001).
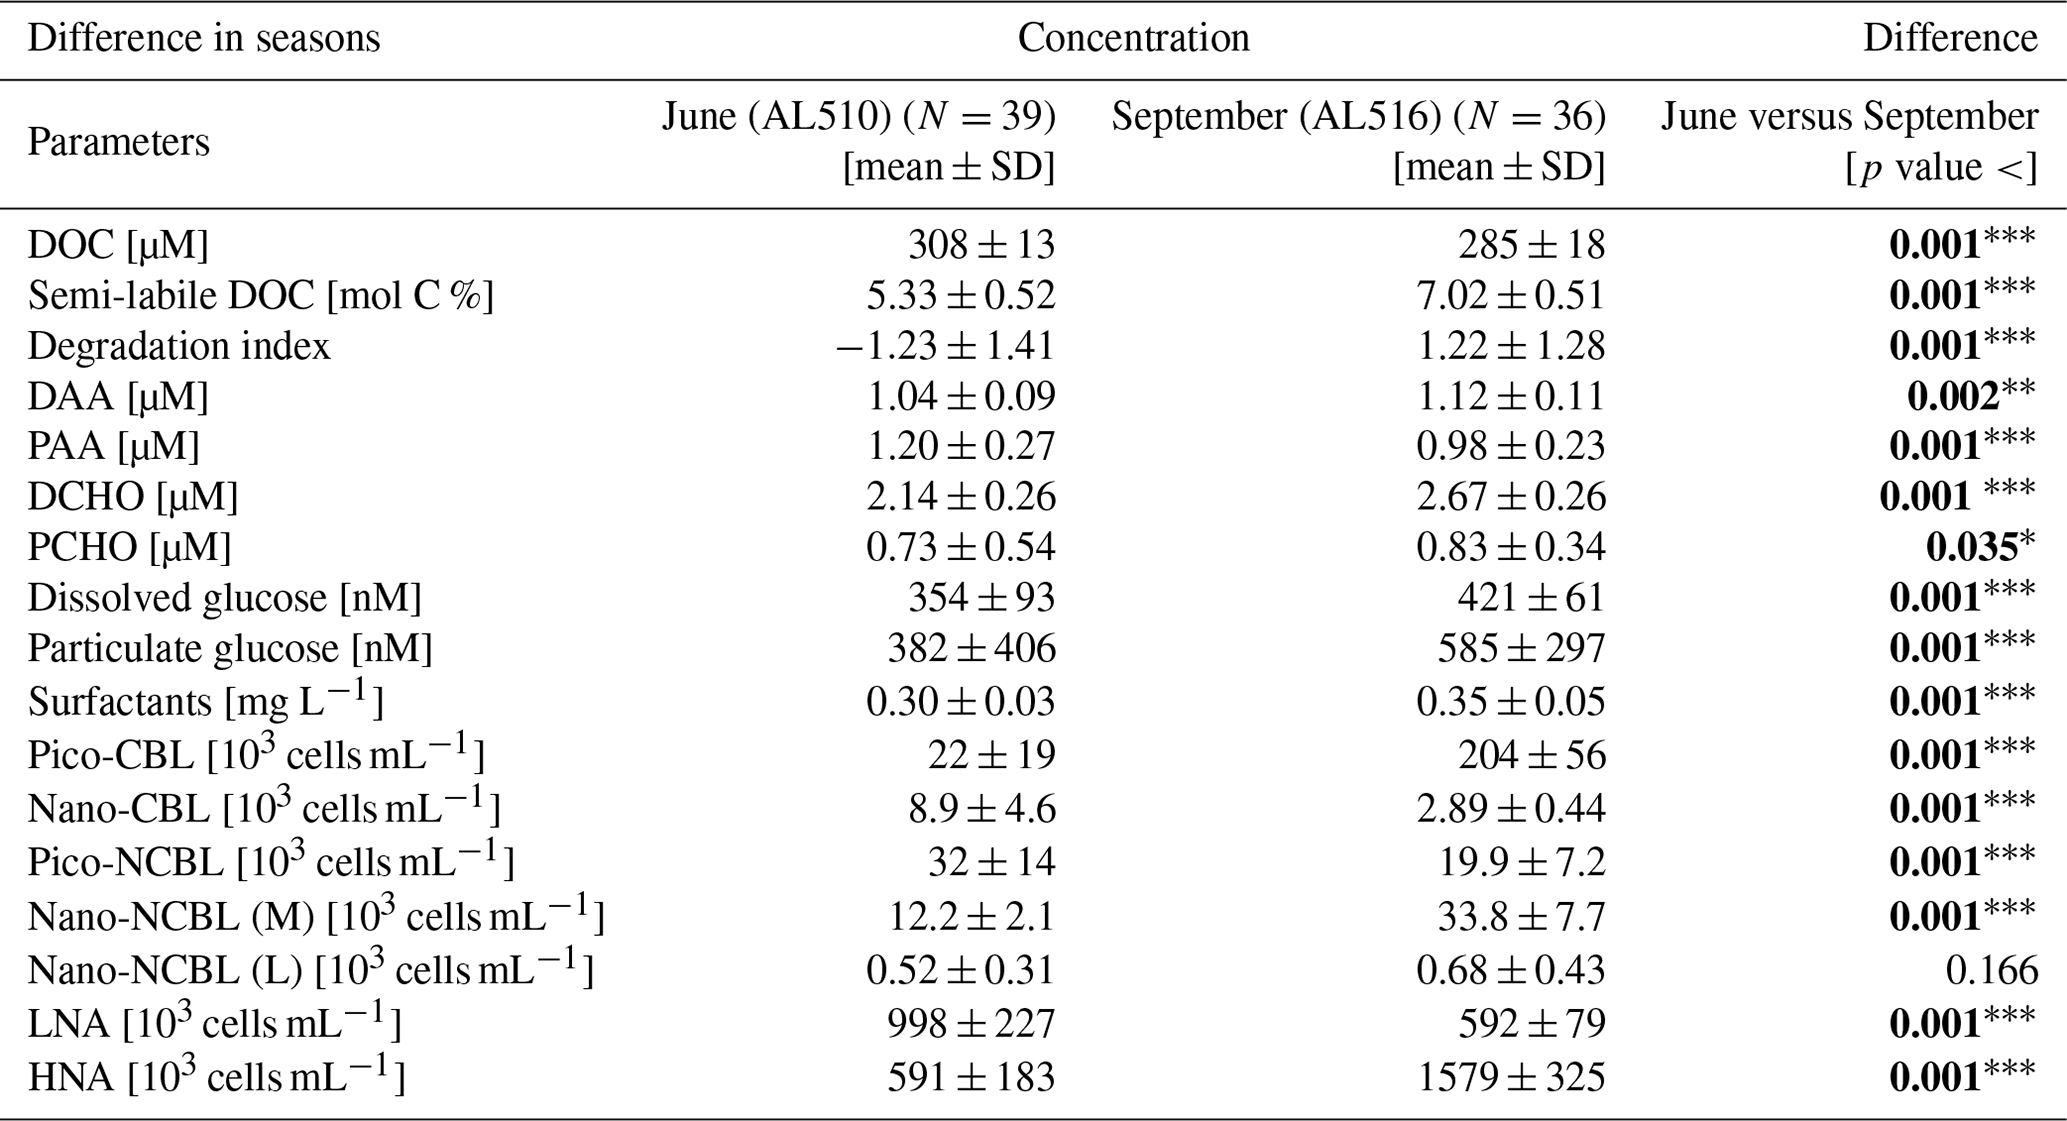
Table A3Concentrations, enrichment factors (EFs), and correlations of the sea surface microlayer (SML) and the underlying water (ULW). Bold numbers indicate significance while the asterisks mark the level of significance (*p value <0.05; value <0.01; value <0.001).
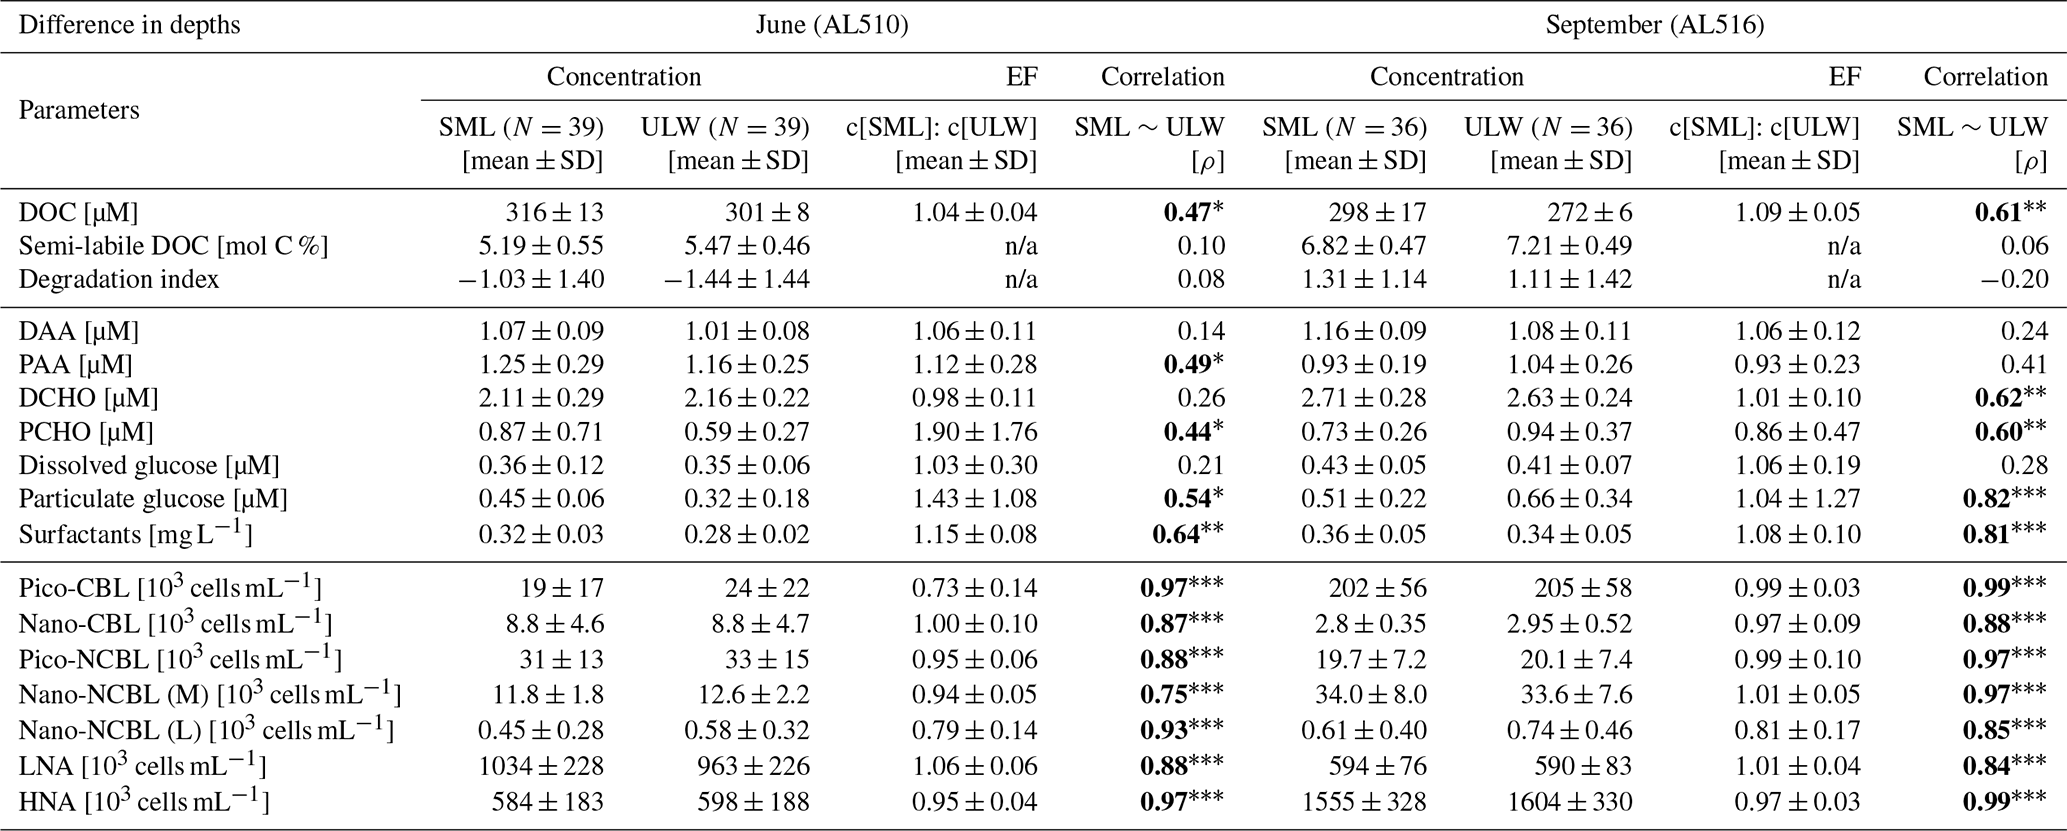
n/a: not applicable.
Table A4Diurnal variation in concentration of seasonal data sets; sea surface microlayer and the underlying water samples are included.
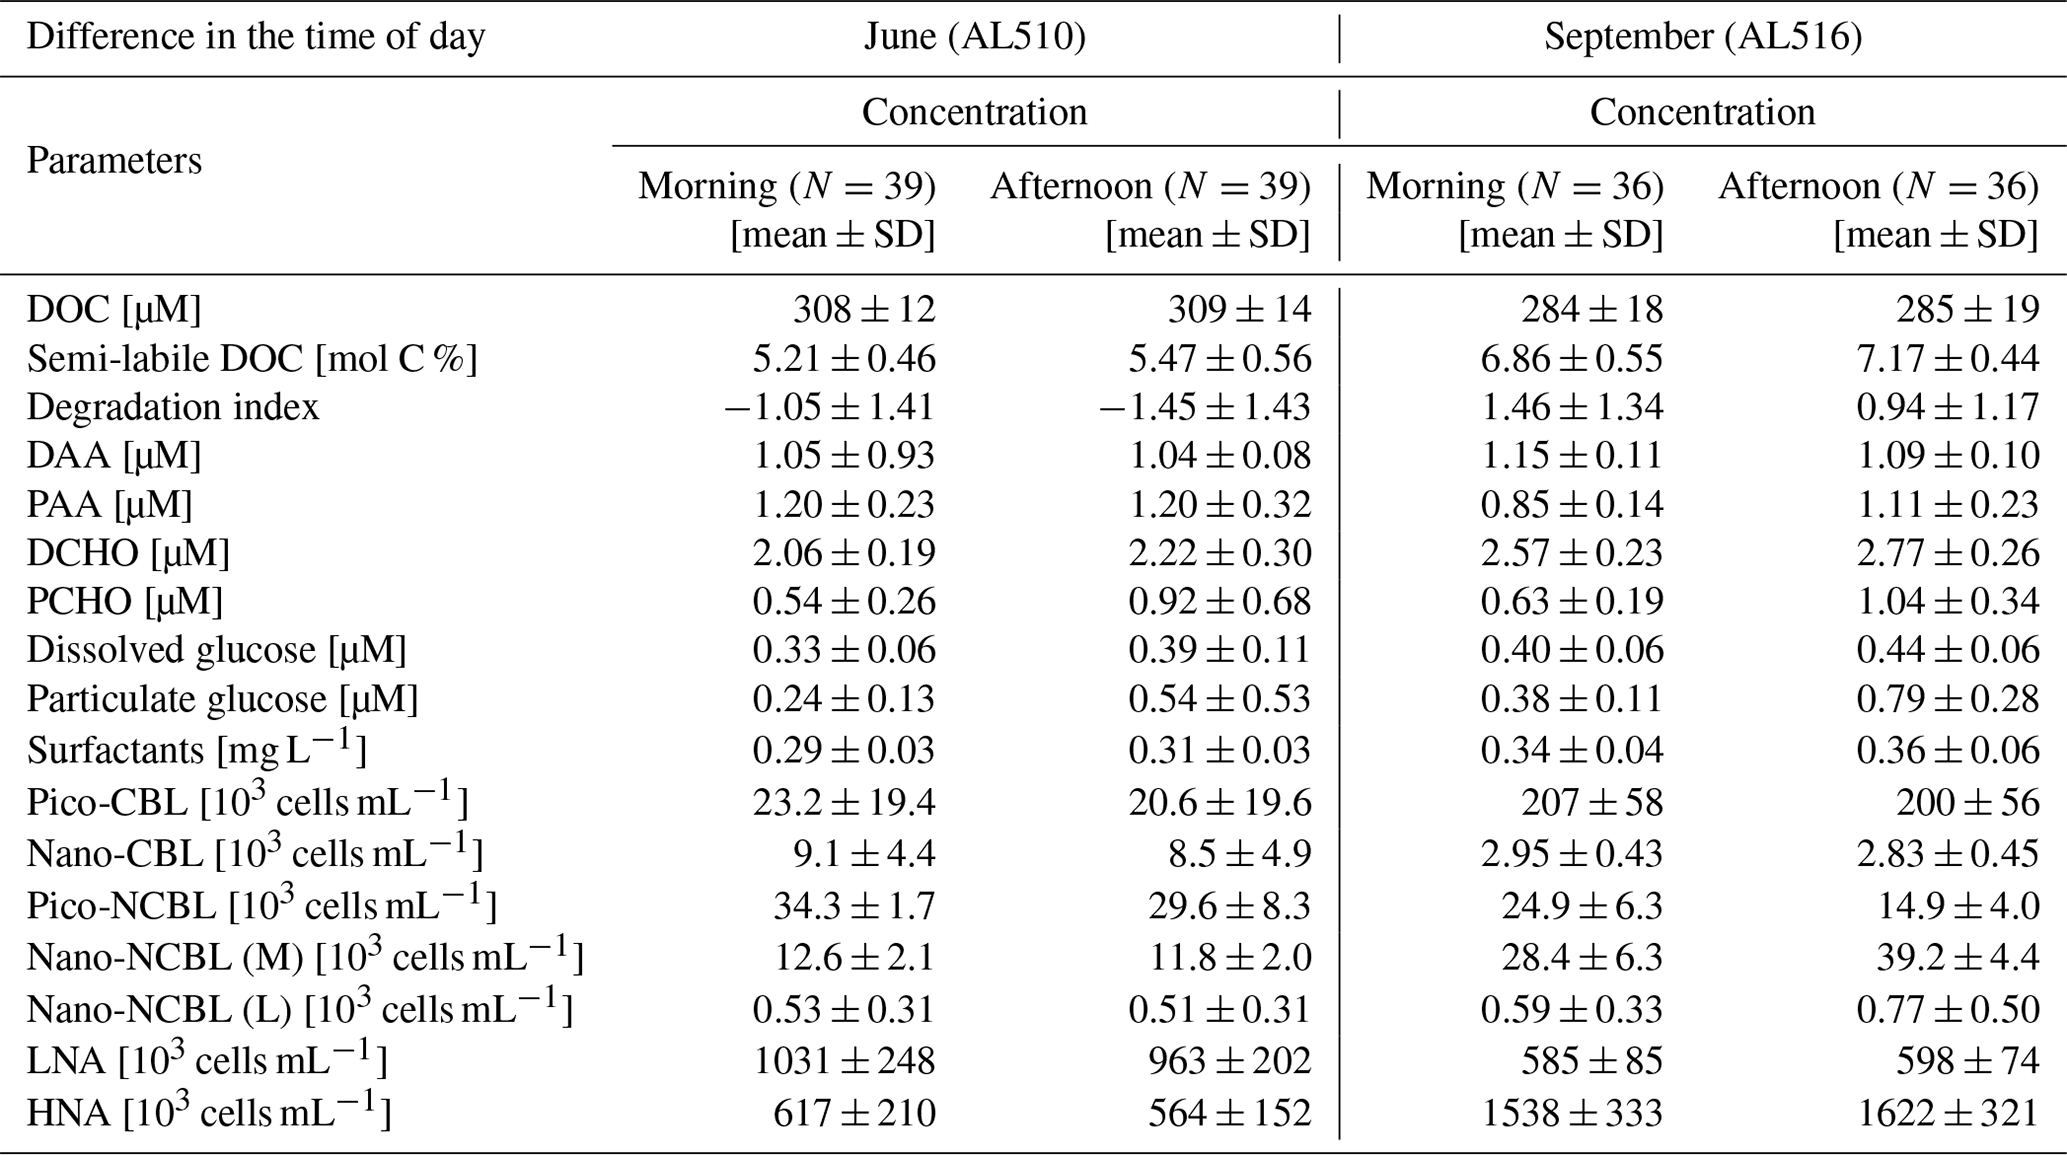
Table A5Statistics of differences in concentrations between the sea surface microlayer and the underlying water and between morning and afternoon stations summarized for each season. This table refers to the concentrations represented for depths in Table A3 and for time in Table A4. Bold numbers indicate significance while the asterisks mark the level of significance (*p value <0.05; value <0.01; value <0.001).
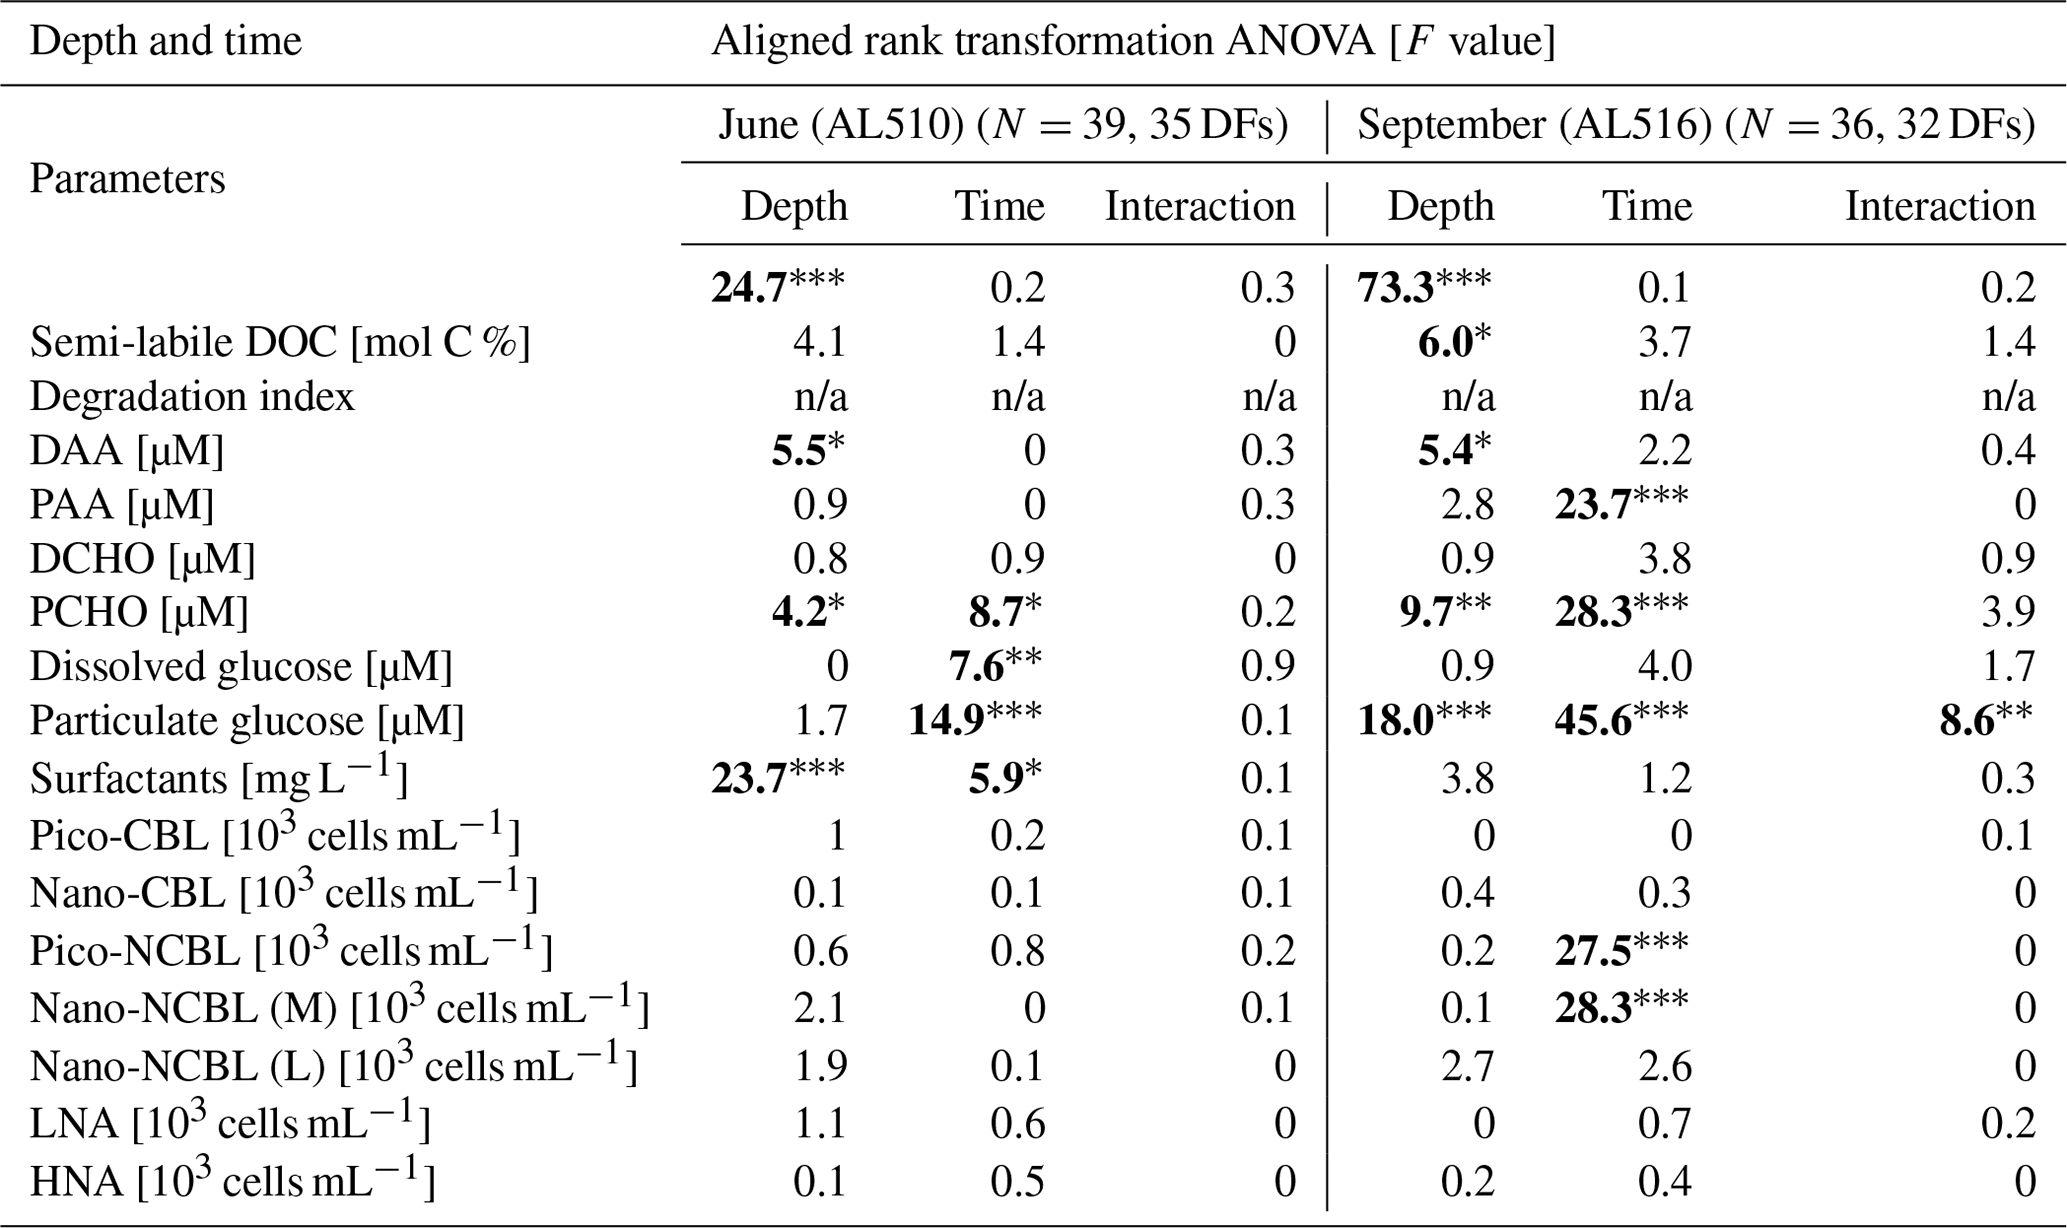
n/a: not applicable.
The data sets presented in this study can be found in an open-access online repository: https://doi.pangaea.de/10.1594/PANGAEA.947802 (Barthelmeß and Engel, 2022).
The supplement related to this article is available online at: https://doi.org/10.5194/bg-19-4965-2022-supplement.
TB was responsible for the sample collection on board, surfactant measurements, and the data analysis. AE supervised and edited the manuscript. Both authors contributed to the article and approved the submitted version.
At least one of the (co-)authors is a member of the editorial board of Biogeosciences. The peer-review process was guided by an independent editor, and the authors also have no other competing interests to declare.
Publisher's note: Copernicus Publications remains neutral with regard to jurisdictional claims in published maps and institutional affiliations.
We are thankful to the chief and senior scientists Dennis Booge, David Ho, and Christa Marandino for their great effort to organize these cruises and help realizing our extensive SML sampling plan. Jon Roa and Sandra Golde contributed substantially to station and lab work on board. Further, we would like to thank the crew of the RV Alkor for their commitment. We would like to thank Tania Klüver, again Jon Roa, and Sandra Golde, who analysed a considerable part of the samples in our home laboratory. We thank Helmke Hepach for proofreading the manuscript. The study contributes to the international SOLAS programme. Measurements of all biogeochemical parameters were executed at the GEOMAR Helmholtz Centre for Ocean Research, Kiel.
The article processing charges for this open-access publication were covered by the GEOMAR Helmholtz Centre for Ocean Research Kiel.
This paper was edited by Tina Treude and reviewed by two anonymous referees.
Alegria Zufia, J., Farnelid, H., and Legrand, C: Seasonality of Coastal Picophytoplankton Growth, Nutrient Limitation, and Biomass Contribution, Front. Microbiol., 12, 1–13, https://doi.org/10.3389/fmicb.2021.786590, 2021.
Amon, R. M. W. and Benner, R.: Combined neutral sugars as indicators of the diagenetic state of dissolved organic matter in the Arctic Ocean, Deep-Sea Res. Pt. I, 50, 151–169, https://doi.org/10.1016/S0967-0637(02)00130-9, 2003.
Amon, R. M. W., Fitznar, H. P., and Benner, R.: Linkages among the bioreactivity, chemical composition, and diagenetic state of marine dissolved organic matter, Limnol. Oceanogr., 46, 287–297, https://doi.org/10.4319/lo.2001.46.2.0287, 2001.
Apple, J. K., Strom, S. L., Palenik, B., and Brahamsha, B.: Variability in protist grazing and growth on different marine Synechococcus isolates, Appl. Environ. Microbiol., 77, 3074–3084, https://doi.org/10.1128/AEM.02241-10, 2011.
Bange, H. W.: Nitrous oxide and methane in European coastal waters, Estuar. Coast. Shelf Sci., 70, 361–374, https://doi.org/10.1016/j.ecss.2006.05.042, 2006.
Barthelmeß, T. and Engel, A.: Biopolymer composition and surface activity in the surface waters in Eckernförde bay in summer 2018, PANGAEA [data set], https://doi.pangaea.de/10.1594/PANGAEA.947802, 2022.
Barthelmeß, T., Schütte, F., and Engel, A.: Variability of the Sea Surface Microlayer Across a Filament's Edge and Potential Influences on Gas Exchange, Front. Mar. Sci., 8, 718384, https://doi.org/10.3389/fmars.2021.718384, 2021.
Becker, S., Tebben, J., Coffinet, S., Wiltshire, K., Iversen, M. H., Harder, T., Hinrichs, K. U., and Hehemann, J. H.: Laminarin is a major molecule in the marine carbon cycle, P. Natl. Acad. Sci. USA, 117, 6599–6607, https://doi.org/10.1073/pnas.1917001117, 2020.
Benner, R. and Amon, R. M. W.: The Size-Reactivity Continuum of Major Bioelements in the Ocean, Ann. Rev. Mar. Sci., 7, 185–205, https://doi.org/10.1146/annurev-marine-010213-135126, 2015.
Biggs, T. E. G., Huisman, J., and Brussaard, C. P. D.: Viral lysis modifies seasonal phytoplankton dynamics and carbon flow in the Southern Ocean, ISME J., 15, 3615–3622, https://doi.org/10.1038/s41396-021-01033-6, 2021.
Blanchet, F. G., Legendre, P., and Borcard, D.: Modelling directional spatial processes in ecological data, Ecol. Model., 215, 325–336, https://doi.org/10.1016/j.ecolmodel.2008.04.001, 2008.
Bock, E. J. and Frew, N. M.: Static and dynamic response of natural multicomponent oceanic surface films to compression and dilation. Laboratory and field observations, J. Geophys. Res., 98, 14599–14617, https://doi.org/10.1029/93jc00428, 1993.
Borchard, C. and Engel, A.: Size-fractionated dissolved primary production and carbohydrate composition of the coccolithophore Emiliania huxleyi, Biogeosciences, 12, 1271–1284, https://doi.org/10.5194/bg-12-1271-2015, 2015.
Bordes, R. and Holmberg, K.: Amino acid-based surfactants – Do they deserve more attention? Adv. Colloid Interface Sci., 222, 79–91, https://doi.org/10.1016/j.cis.2014.10.013, 2015.
Bunse, C., Israelsson, S., Baltar, F., Bertos-Fortis, M., Fridolfsson, E., Legrand, C., Lindehoff, E., Lindh, M. V., Martínez-García, S., and Pinhassi, J.: High frequency multi-year variability in baltic sea microbial plankton stocks and activities, Front. Microbiol., 10, 1–18, https://doi.org/10.3389/fmicb.2018.03296, 2019.
Calleja, M. Ll., Duarte, C. M., Prairie, Y. T., Agustí, S., and Herndl, G. J.: Evidence for surface organic matter modulation of air-sea CO2 gas exchange, Biogeosciences, 6, 1105–1114, https://doi.org/10.5194/bg-6-1105-2009, 2009.
Carlson, D. J.: The Early Diagenesis of Organic Matter: Reaction at the Air-Sea Interface, in: Organic Geochemistry, edited by: Engel, M. H. and Macko, S. A., Springer, Boston, MA, Topics in Geobiology, Vol. 11, https://doi.org/10.1007/978-1-4615-2890-6_12, 1993.
Carpenter, L. J. and Nightingale, P. D.: Chemistry and Release of Gases from the Surface Ocean, Chem. Rev., 115, 4015–4034, https://doi.org/10.1021/cr5007123, 2015.
Connell, P. E., Ribalet, F., Armbrust, E. V., White, A., and Caron, D. A.: Diel oscillations in the feeding activity of heterotrophic and mixotrophic nanoplankton in the North Pacific Subtropical Gyre, Aquat. Microb. Ecol., 85, 167–181, https://doi.org/10.3354/AME01950, 2020.
Ćosović, B. and Vojvodić, V.: The application of ac polarography to the determination of surface-active substances in seawater, Limn. Oceanogr., 27, 361–369, https://doi.org/10.4319/lo.1982.27.2.0361, 1982.
Ćosović, B. and Vojvodić, V.: Voltammetric Analysis of Surface Active Substances in Natural Seawater, Electroanalysis, 10, 429–434, https://doi.org/10.1002/(SICI)1521-4109(199805)10:6<429::AID-ELAN429>3.0.CO;2-7, 1998.
Cowie, G. L., Hedges, J. I., and Calvert, S. E.: Sources and relative reactivities of amino acids, neutral sugars, and lignin in an intermittently anoxic marine environment, Geochim. Cosmochim. Ac., 56, 1963–1978, https://doi.org/10.1016/0016-7037(92)90323-B, 1992.
Croot, P. L., Passow, U., Assmy, P., Jansen, S., and Strass, V. H.: Surface active substances in the upper water column during a Southern Ocean Iron Fertilization Experiment (EIFEX), Geophys. Res. Lett., 34, 1–5, https://doi.org/10.1029/2006GL028080, 2007.
Cunliffe, M. and Murrell, J. C.: The sea-surface microlayer is a gelatinous biofilm, ISME J., 3, 1001–1003, https://doi.org/10.1038/ismej.2009.69, 2009.
Cunliffe, M. and Wurl, O.: Guide to Best Practices to Study the Ocean's Surface, Occasional Publication of the Marine Biological Association of the United Kingdom, https://doi.org/10.25607/OBP-1512, 2014.
Cunliffe, M. and Murrell, J.: The sea-surface microlayer is a gelatinous biofilm, ISME J., 3, 1001–1003, https://doi.org/10.1038/ismej.2009.69, 2009.
Cunliffe, M., Engel, A., Frka, S., Gašparoviæ, B. Ž., Guitart, C., Murrell, J. C., Salter, M., Stolle, C., Upstill-Goddard, R., and Wurl, O.: Sea surface microlayers: A unified physicochemical and biological perspective of the air-ocean interface, Prog. Oceanogr., 109, 104–116, https://doi.org/10.1016/j.pocean.2012.08.004, 2013.
Cuscov, M. and Muller, F. L. L.: Differentiating humic and algal surface active substances in coastal waters by their pH-dependent adsorption behaviour, Mar. Chem. 174, 35–45, https://doi.org/10.1016/j.marchem.2015.05.002, 2015.
Dauwe, B. and Middelburg, J. J.: Amino acids and hexosamines as indicators of organic matter degradation state in North Sea sediments, Limnol. Oceanogr., 43, 782–798, https://doi.org/10.4319/lo.1998.43.5.0782, 1998.
Dauwe, B., Middelburg, J. J., Herman, P. M. J., and Heip, C. H. R.: Linking diagenetic alteration of amino acids and bulk organic matter reactivity, Limnol. Oceanogr., 44, 1809–1814, https://doi.org/10.4319/lo.1999.44.7.1809, 1999.
Davis, J. and Benner, R.: Quantitative estimates of labile and semi-labile dissolved organic carbon in the western Arctic Ocean: A molecular approach, Limnol. Oceanogr., 52, 2434–2444, https://doi.org/10.4319/lo.2007.52.6.2434, 2007.
Davis, J., Kaiser, K., and Benner, R.: Amino acid and amino sugar yields and compositions as indicators of dissolved organic matter diagenesis, Org. Geochem., 40, 343–352, https://doi.org/10.1016/j.orggeochem.2008.12.003, 2009.
Decho, A. W. and Gutierrez, T.: Microbial extracellular polymeric substances (EPSs) in ocean systems, Front. Microbiol., 8, 1–28, https://doi.org/10.3389/fmicb.2017.00922, 2017.
Dittmar, T., Paeng, J., and Ludwichowski, K.-U.: The Analysis of Amino Acids in Seawater, in: Practical Guidelines for the Analysis of Seawater, edited by: Wurl, O., CRC Press, 67–77, https://doi.org/10.1201/9781420073072.ch4, 2009.
Dreshchinskii, A. and Engel, A.: Seasonal variations of the sea surface microlayer at the Boknis Eck Times Series Station (Baltic Sea), J. Plankton Res., 39, 943–961, https://doi.org/10.1093/plankt/fbx055, 2017.
Edwards, K. F.: Mixotrophy in nanoflagellates across environmental gradients in the ocean, P. Natl. Acad. Sci. USA, 116, 6211–6220, https://doi.org/10.1073/pnas.1814860116, 2019.
Engel, A. and Galgani, L.: The organic sea-surface microlayer in the upwelling region off the coast of Peru and potential implications for air–sea exchange processes, Biogeosciences, 13, 989–1007, https://doi.org/10.5194/bg-13-989-2016, 2016.
Engel, A. and Händel, N.: A novel protocol for determining the concentration and composition of sugars in particulate and in high molecular weight dissolved organic matter (HMW-DOM) in seawater, Mar. Chem., 127, 180–191, https://doi.org/10.1016/j.marchem.2011.09.004, 2011.
Engel, A., Delille, B., Jacquet, S., Riebesell, U., Rochelle-Newall, E., Terbrüggen, A., and Zondervan, I.: Transparent exopolymer particles and dissolved organic carbon production by Emiliania huxleyi exposed to different CO2 concentrations: A mesocosm experiment, Aquat. Microb. Ecol., 34, 93–104, https://doi.org/10.3354/ame034093, 2004.
Engel, A., Harlay, J., Piontek, J., and Chou, L.: Contribution of combined carbohydrates to dissolved and particulate organic carbon after the spring bloom in the northern Bay of Biscay (North-Eastern Atlantic Ocean), Cont. Shelf Res., 45, 42–53, https://doi.org/10.1016/j.csr.2012.05.016, 2012.
Engel, A., Bange, H. W., Cunliffe, M., Burrows, S. M., Friedrichs, G., Galgani, L., Herrmann, H., Hertkorn, N., Johnson, M., Liss, P. S., Quinn, P. K., Schartau, M., Soloviev, A., Stolle, C., Upstill-Goddard, R. C., van Pinxteren, M., and Zäncker, B.: The ocean's vital skin: Toward an integrated understanding of the sea surface microlayer, Front. Mar. Sci., 4, 1–14, https://doi.org/10.3389/fmars.2017.00165, 2017a.
Engel, A., Piontek, J., Metfies, K., Endres, S., Sprong, P., Peeken, I., Gäbler-Schwarz, S., and Nöthig, E. M.: Inter-annual variability of transparent exopolymer particles in the Arctic Ocean reveals high sensitivity to ecosystem changes, Sci. Rep., 7, 1–9, https://doi.org/10.1038/s41598-017-04106-9, 2017b.
Engel, A., Sperling, M., Sun, C., Grosse, J., and Friedrichs, G.: Organic matter in the surface microlayer: Insights from a wind wave channel experiment, Front. Mar. Sci., 5, 182, https://doi.org/10.3389/fmars.2018.00182, 2018.
Frew, N. M., Goldman, J. C., Dennett, M. R., and Johnson, A. S.: Impact of phytoplankton-generated surfactants on air-sea gas exchange, J. Geophys. Res., 95, 3337, https://doi.org/10.1029/jc095ic03p03337, 1990.
Frew, N. M., Nelson, R. K., McGillis, W. R., Edson, J. B., Bock, E. J., and Hara, T.: Spatial variations in surface microlayer surfactants and their role in modulating air-sea exchange, Geophys. Monogr. Ser., 127, 153–159, https://doi.org/10.1029/GM127p0153, 2001.
Frka, S., Pogorzelski, S., Kozarac, Z., and Ćosović, B.: Physicochemical signatures of natural sea films from middle adriatic stations, J. Phys. Chem. A, 116, 6552–6559, https://doi.org/10.1021/jp212430a, 2012.
Galgani, L. and Engel, A.: Changes in optical characteristics of surface microlayers hint to photochemically and microbially mediated DOM turnover in the upwelling region off the coast of Peru, Biogeosciences, 13, 2453–2473, https://doi.org/10.5194/bg-13-2453-2016, 2016.
Gärdes, A., Iversen, M. H., Grossart, H. P., Passow, U., and Ullrich, M. S.: Diatom-associated bacteria are required for aggregation of Thalassiosira weissflogii, ISME J., 5, 436–445, https://doi.org/10.1038/ismej.2010.145, 2011.
Garrett, W. D.: Collection of slick-forming materials from the sea surface microlayer, Limnol. Oceanogr., 10, 602–605, https://doi.org/10.4319/lo.1965.10.4.0602, 1965.
Gasol, J. M. and Del Giorgio, P. A.: Using flow cytometry for counting natural planktonic bacteria and understanding the structure of planktonic bacterial communities, Sci. Mar., 64, 197–224, https://doi.org/10.3989/scimar.2000.64n2197, 2000.
Gašparoviæ, B. and Ćosović, B.: Surface-active properties of organic matter in the North Adriatic Sea, Estuar. Coast. Shelf Sci., 58, 555–566, https://doi.org/10.1016/S0272-7714(03)00133-1, 2003.
Goldberg, S. J., Carlson, C. A., Brzezinski, M., Nelson, N. B., and Siegel, D. A.: Systematic removal of neutral sugars within dissolved organic matter across ocean basins, Geophys. Res. Lett., 38, L17606, https://doi.org/10.1029/2011GL048620, 2011.
Grosse, J., van Breugel, P., Brussaard, C. P. D., and Boschker, H. T. S.: A biosynthesis view on nutrient stress in coastal phytoplankton, Limnol. Oceanogr., 62, 490–506, https://doi.org/10.1002/lno.10439, 2017.
Grosse, J., Brussaard, C. P. D., and Boschker, H. T. S.: Nutrient limitation driven dynamics of amino acids and fatty acids in coastal phytoplankton, Limnol. Oceanogr., 64, 302–316, https://doi.org/10.1002/lno.11040, 2019.
Grujcic, V., Nuy, J. K., Salcher, M. M., Shabarova, T., Kasalicky, V., Boenigk, J., Jensen, M., and Simek, K.: Cryptophyta as major bacterivores in freshwater summer plankton, ISME J., 12, 1668–1681, https://doi.org/10.1038/s41396-018-0057-5, 2018.
Gutiérrez-Loza, L., Wallin, M. B., Sahlée, E., Nilsson, E., Bange, H. W., Kock, A., and Rutgersson, A.: Measurement of air-sea methane fluxes in the baltic sea using the eddy covariance method, Front. Earth Sci. 7, 1–13, https://doi.org/10.3389/feart.2019.00093, 2019.
Hama, T., Matsunaga, K., Handa, N., and Takahashi, M.: Day-night changes in production of carbohydrate and protein by natural phytoplankton population from Lake Biwa, Japan, J. Plankton Res., 10, 941–955, https://doi.org/10.1093/plankt/10.5.941, 1988.
Hansell, D. A., Carlson, C. A., Repeta, D. J., and Schlitzer, R.: Dissolved organic matter in the ocean: A controversy stimulates new insights, Oceanography, 22, 202–211, https://doi.org/10.5670/oceanog.2009.109, 2009.
Harvey, G. W. and Burzell, L. A.: A simple microlayer method for small samples, Limnol. Oceanogr., 11, 156–157, https://doi.org/10.4319/lo.1972.17.1.0156, 1972.
HELCOM.: State of the Baltic Sea – Second HELCOM holistic assessment, 2011–2016, Baltic Sea Environment Proceedings, 155, 4–57, ISSN 0357-2994, http://stateofthebalticsea.helcom.fi/pressures-and-their-status/hazardous-substances/ (last access: October 2021), 2018.
Ho, D. T., Wanninkhof, R., Schlosser, P., Ullman, D. S., Hebert, D., and Sullivan, K. F.: Toward a universal relationship between wind speed and gas exchange: Gas transfer velocities measured with during the Southern Ocean Gas Exchange Experiment, J. Geophys. Res.-Oceans, 116, C00F04, https://doi.org/10.1029/2010JC006854, 2011.
Hoppe, H.-G., Giesenhagen, H. C., Koppe, R., Hansen, H.-P., and Gocke, K.: Impact of change in climate and policy from 1988 to 2007 on environmental and microbial variables at the time series station Boknis Eck, Baltic Sea, Biogeosciences, 10, 4529–4546, https://doi.org/10.5194/bg-10-4529-2013, 2013.
Humborg, C., Geibel, M. C., Sun, X., McCrackin, M., Mörth, C. M., Stranne, C., Jakobsson, M., Gustafsson, B., Sokolov, A., Norkko, A., and Norkko, J.: High emissions of carbon dioxide and methane from the coastal Baltic Sea at the end of a summer heat wave, Front. Mar. Sci., 6, 1–14, https://doi.org/10.3389/fmars.2019.00493, 2019.
Ingalls, A. E., Liu, Z., and Lee, C.: Seasonal trends in the pigment and amino acid compositions of sinking particles in biogenic CaCO3 and SiO2 dominated regions of the Pacific sector of the Southern Ocean along 170∘ W, Deep-Sea Res. Pt. I, 53, 836–859, https://doi.org/10.1016/j.dsr.2006.01.004, 2006.
Jenkinson, I. R., Seuront, L., Ding, H., and Elias, F.: Biological modification of mechanical properties of the sea surface microlayer, influencing waves, ripples, foam and air-sea fluxes, Elementa Sci. Anthrop., 6, 26, https://doi.org/10.1525/elementa.283, 2018.
Kharbush, J. J., Close, H. G., Van Mooy, B. A. S., Arnosti, C., Smittenberg, R. H., Le Moigne, F. A. C., Mollenhauer, G., Scholz-Böttcher, B., Obreht, I., Koch, B. P., Becker, K. W., Iversen, M. H., and Mohr, W.: Particulate Organic Carbon Deconstructed: Molecular and Chemical Composition of Particulate Organic Carbon in the Ocean, Front. Mar. Sci., 7, 1–10, https://doi.org/10.3389/fmars.2020.00518, 2020.
Klais, R., Norros, V., Lehtinen, S., Tamminen, T., and Olli, K.: Community assembly and drivers of phytoplankton functional structure, Funct. Ecol., 31, 760–767, https://doi.org/10.1111/1365-2435.12784, 2017.
Kujawinski, E. B., Farrington, J. W., and Moffett, J. W.: Evidence for grazing-mediated production of dissolved surface-active material by marine protists, Mar. Chem., 77, 133–142, https://doi.org/10.1016/S0304-4203(01)00082-2, 2002.
Kurata, N., Vella, K., Hamilton, B., Shivji, M., Soloviev, A., Matt, S., Tartar, A., and Perrie, W.: Surfactant-associated bacteria in the near-surface layer of the ocean, Sci. Rep., 6, 19123, https://doi.org/10.1038/srep19123, 2016.
Kuznetsova, M. and Lee, C.: Dissolved free and combined amino acids in nearshore seawater, sea surface microlayers and foams: Influence of extracellular hydrolysis, Aquat. Sci., 64, 252–268, https://doi.org/10.1007/s00027-002-8070-0, 2002.
Laß, K. and Friedrichs, G.: Revealing structural properties of the marine nanolayer from vibrational sum frequency generation spectra, J. Geophys. Res.-Oceans, 116, 1–15, https://doi.org/10.1029/2010JC006609, 2011.
Laß, K., Bange, H. W., and Friedrichs, G.: Seasonal signatures in SFG vibrational spectra of the sea surface nanolayer at Boknis Eck Time Series Station (SW Baltic Sea), Biogeosciences, 10, 5325–5334, https://doi.org/10.5194/bg-10-5325-2013, 2013.
Legendre, P., and Legendre, L.: Chapter 11 – Canonical analysis, in: Numerical Ecology, edited by: Legendre, P. and Legendre, L., Elsevier, vol. 24, 625–710, https://doi.org/10.1016/B978-0-444-53868-0.50011-3, 2012.
Lennartz, S. T., Lehmann, A., Herrford, J., Malien, F., Hansen, H.-P., Biester, H., and Bange, H. W.: Long-term trends at the Boknis Eck time series station (Baltic Sea), 1957–2013: does climate change counteract the decline in eutrophication?, Biogeosciences, 11, 6323–6339, https://doi.org/10.5194/bg-11-6323-2014, 2014.
Lindroth, P. and Mopper, K.: High Performance Liquid Chromatographic Determination of Subpicomole Amounts of Amino Acids by Precolumn Fluorescence Derivatization with o-Phthaldialdehyde, Anal. Chem., 51, 1667–1674, https://doi.org/10.1021/ac50047a019, 1979.
Lohrberg, A., Schmale, O., Ostrovsky, I., Niemann, H., Held, P., and Schneider von Deimling, J.: Discovery and quantification of a widespread methane ebullition event in a coastal inlet (Baltic Sea) using a novel sonar strategy, Sci. Rep., 10, 1–13, https://doi.org/10.1038/s41598-020-60283-0, 2020.
Macreadie, P. I., Anton, A., Raven, J. A., Beaumont, N., Connolly, R. M., Friess, D. A., Kelleway, J. J., Kennedy, H., Kuwae, T., Lavery, P. S., Lovelock, C. E., Smale, D. A., Apostolaki, E. T., Atwood, T. B., Baldock, J., Bianchi, T. S., Chmura, G. L., Eyre, B. D., Fourqurean, J. W., Hall-Spencer, J. M., Huxham, M., Hendriks, I. E., Krause-Jensen, D., Laffoley, D., Luisetti, T., Marbà, N., Masque, P., McGlathery, K. J., Megonigal, J. P., Murdiyarso, D., Russell, B. D., Santos, R., Serrano, O., Silliman, B. R., Watanabe, K., and Duarte, C. M.: The future of Blue Carbon science, Nat. Commun., 10, 1–13, https://doi.org/10.1038/s41467-019-11693-w, 2019.
Marie, D., Partensky, F., Jacquet, S., and Vaulot, D.: Enumeration and cell cycle analysis of natural populations of marine picoplankton by flow cytometry using the nucleic acid stain SYBR Green I, Appl. Environ. Microbiol., 63, 186–193, https://doi.org/10.1128/aem.63.1.186-193.1997, 1997.
Marie, D., Shi, X. L., Rigaut-Jalabert, F., and Vaulot, D.: Use of flow cytometric sorting to better assess the diversity of small photosynthetic eukaryotes in the English Channel, FEMS Microbiol. Ecol., 72, 165–178, https://doi.org/10.1111/j.1574-6941.2010.00842.x, 2010.
Mari, X., Passow, U., Migon, C., Burd, A. B., and Legendre, L.: Transparent exopolymer particles: Effects on carbon cycling in the ocean, Prog. Oceanogr., 151, 13–37, https://doi.org/10.1016/j.pocean.2016.11.002, 2017.
Messner, P.: Bacterial glycoproteins, Glycoconj. J., 14, 3–11, https://doi.org/10.1023/A:1018551228663, 1997.
Miyazaki, Y., Yamashita, Y., Kawana, K., Tachibana, E., Kagami, S., Mochida, M., Suzuki, K., and Nishioka, J.: Chemical transfer of dissolved organic matter from surface seawater to sea spray water-soluble organic aerosol in the marine atmosphere, Sci. Rep., 8, 1–10, https://doi.org/10.1038/s41598-018-32864-7, 2018.
Miyazaki, Y., Suzuki, K., Tachibana, E., Yamashita, Y., Müller, A., Kawana, K., and Nishioka, J.: New index of organic mass enrichment in sea spray aerosols linked with senescent status in marine phytoplankton, Sci. Rep., 10, 1–9, https://doi.org/10.1038/s41598-020-73718-5, 2020.
Mopper, K., Zhou, J., Sri Ramana, K., Passow, U., Dam, H. G., and Drapeau, D. T.: The role of surface-active carbohydrates in the flocculation of a diatom bloom in a mesocosm, Deep-Sea Res. Pt. II, 42, 47–73, https://doi.org/10.1016/0967-0645(95)00004-A, 1995.
Muñoz-Marín, M. C., Gómez-Baena, G., López-Lozano, A., Moreno-Cabezuelo, J. A., Díez, J., and García-Fernández, J. M.: Mixotrophy in marine picocyanobacteria: use of organic compounds by Prochlorococcus and Synechococcus, ISME J., 14, 1065–1073, https://doi.org/10.1038/s41396-020-0603-9, 2020.
Mustaffa, N. I. H., Badewien, T. H., Ribas-Ribas, M., and Wurl, O.: High-resolution observations on enrichment processes in the sea-surface microlayer, Sci. Rep., 8, 1–12, https://doi.org/10.1038/s41598-018-31465-8, 2018.
Mustaffa, N. I. H., Ribas-Ribas, M., Banko-Kubis, H. M., and Wurl, O.: Global reduction of in situ CO2 transfer velocity by natural surfactants in the sea-surface microlayer, Proc. Math. Phys. Eng. Sci., 476, 20190763, https://doi.org/10.1098/rspa.2019.0763, 2020.
O'Dowd, C., Ceburnis, D., Ovadnevaite, J., Bialek, J., Stengel, D. B., Zacharias, M., Nitschke, U., Connan, S., Rinaldi, M., Fuzzi, S., Decesari, S., Cristina Facchini, M., Marullo, S., Santoleri, R., Dell'anno, A., Corinaldesi, C., Tangherlini, M., and Danovaro, R.: Connecting marine productivity to sea-spray via nanoscale biological processes: Phytoplankton Dance or Death Disco?, Sci. Rep., 5, 1–11, https://doi.org/10.1038/srep14883, 2015.
Ohlendieck, U., Stuhr, A., and Siegmund, H.: Nitrogen fixation by diazotrophic cyanobacteria in the Baltic Sea and transfer of the newly fixed nitrogen to picoplankton organisms, J. Marine Syst., 25, 213–219, https://doi.org/10.1016/S0924-7963(00)00016-6, 2000.
Ortega-Retuerta, E., Passow, U., Duarte, C. M., and Reche, I.: Effects of ultraviolet B radiation on (not so) transparent exopolymer particles, Biogeosciences, 6, 3071–3080, https://doi.org/10.5194/bg-6-3071-2009, 2009.
Passow, U.: Transparent exopolymer particles (TEP) in aquatic environments, Prog. Oceanogr., 55, 287–333, https://doi.org/10.1016/S0079-6611(02)00138-6, 2002.
Pereira, R., Schneider-Zapp, K., and Upstill-Goddard, R. C.: Surfactant control of gas transfer velocity along an offshore coastal transect: results from a laboratory gas exchange tank, Biogeosciences, 13, 3981–3989, https://doi.org/10.5194/bg-13-3981-2016, 2016.
Pereira, R., Ashton, I., Sabbaghzadeh, B., Shutler, J. D., and Upstill-Goddard, R. C.: Reduced air-sea CO2 exchange in the Atlantic Ocean due to biological surfactants, Nat. Geosci., 11, 492–496, https://doi.org/10.1038/s41561-018-0136-2, 2018.
Perinelli, D. R., Cespi, M., Casettari, L., Vllasaliu, D., Cangiotti, M., Ottaviani, M. F., Giorgioni, G., Bonacucina, G., and Palmieri, G. F.: Correlation among chemical structure, surface properties and cytotoxicity of N-acyl alanine and serine surfactants, Eur. J. Pharm. Biopharm., 109, 93–102, https://doi.org/10.1016/j.ejpb.2016.09.015, 2016.
Pogorzelski, S. J., Kogut, A. D., and Mazurek, A. Z.: Surface rheology parameters of source-specific surfactant films as indicators of organic matter dynamics, Hydrobiologia, 554, 67–81, https://doi.org/10.1007/s10750-005-1007-6, 2006.
Reinthaler, T., Sintes, E., and Herndl, G. J.: Dissolved organic matter and bacterial production and respiration in the sea-surface microlayer of the open Atlantic and the western Mediterranean Sea, Limnol. Oceanogr., 53, 122–136, https://doi.org/10.4319/lo.2008.53.1.0122, 2008.
Rich, J. H., Ducklow, H. W., and Kirchman, D. L.: Concentrations and uptake of neutral monosaccharides along 140∘ W in the equatorial Pacific: Contribution of glucose to heterotrophic bacterial activity and the DOM flux, Limnol. Oceanogr., 41, 595–604, https://doi.org/10.4319/lo.1996.41.4.0595, 1996.
Robinson, T. B., Stolle, C., and Wurl, O.: Depth is relative: The importance of depth for transparent exopolymer particles in the near-surface environment, Ocean Sci., 15, 1653–1666, https://doi.org/10.5194/os-15-1653-2019, 2019.
Románszki, L. and Telegdi, J.: Systematic study of Langmuir films of different amino acid derivatives on several subphases, MATEC Web Conf., 98, 8–11, https://doi.org/10.1051/matecconf/20179801004, 2017.
Sabbaghzadeh, B., Upstill-Goddard, R. C., Beale, R., Pereira, R., and Nightingale, P. D.: The Atlantic Ocean surface microlayer from 50∘ N to 50∘ S is ubiquitously enriched in surfactants at wind speeds up to 13 m s−1, Geophys. Res. Lett., 44, 2852–2858, https://doi.org/10.1002/2017GL072988, 2017.
Salter, M. E., Upstill-Goddard, R. C., Nightingale, P. D., Archer, S. D., Blomquist, B., Ho, D. T., Huebert, B., Schlosser, P., and Yang, M.: Impact of an artificial surfactant release on air-sea gas fluxes during Deep Ocean Gas Exchange Experiment II, J. Geophys. Res.-Oceans, 116, 1–9, https://doi.org/10.1029/2011JC007023, 2011.
Satpute, S. K., Banat, I. M., Dhakephalkar, P. K., Banpurkar, A. G., and Chopade, B. A.: Biosurfactants, bioemulsifiers and exopolysaccharides from marine microorganisms, Biotechnol. Adv., 28, 436–450, https://doi.org/10.1016/j.biotechadv.2010.02.006, 2010.
Schmidt, R. and Schneider, B.: The effect of surface films on the air-sea gas exchange in the Baltic Sea, Mar. Chem., 126, 56–62, https://doi.org/10.1016/j.marchem.2011.03.007, 2011.
Scholz, F.: Voltammetric techniques of analysis: the essentials, ChemTexts, 1, 1–24, https://doi.org/10.1007/s40828-015-0016-y, 2015.
Seidel, M., Manecki, M., Herlemann, D. P. R., Deutsch, B., Schulz-Bull, D., Jürgens, K., and Dittmar, T.: Composition and transformation of dissolved organic matter in the Baltic sea, Front. Earth Sci., 5, 1–20, https://doi.org/10.3389/feart.2017.00031, 2017.
Sekelsky, A. M. and Shreve, G. S.: Kinetic model of biosurfactant-enhanced hexadecane biodegradation by Pseudomonas aeruginosa, Biotechnol. Bioeng., 63, 401–409, https://doi.org/10.1002/(SICI)1097-0290(19990520)63:4<401::AID-BIT3>3.0.CO;2-S, 1999.
Servais, P., Casamayor, E. O., Courties, C., Catala, P., Parthuisot, N., and Lebaron, P.: Activity and diversity of bacterial cells with high and low nucleic acid content, Aquat. Microb. Ecol., 33, 41–51, https://doi.org/10.3354/ame033041, 2003.
Shaharom, S., Latif, M. T., Khan, M. F., Yusof, S. N. M., Sulong, N. A., Wahid, N. B. A., Uning, R., and Suratman, S.: Surfactants in the sea surface microlayer, subsurface water and fine marine aerosols in different background coastal areas, Environ. Sci. Pollut. Res., 25, 27074–27089, https://doi.org/10.1007/s11356-018-2745-0, 2018.
Shammi, M., Pan, X., Mostofa, K. M. G., Zhang, D., and Liu, C. Q.: Photo-flocculation of microbial mat extracellular polymeric substances and their transformation into transparent exopolymer particles: Chemical and spectroscopic evidences, Sci. Rep., 7, 1–12, https://doi.org/10.1038/s41598-017-09066-8, 2017.
Song, W., Zhao, C., Mu, S., Pan, X., Zhang, D., Al-Misned, F. A., and Mortuza, M. G.: Effects of irradiation and pH on fluorescence properties and flocculation of extracellular polymeric substances from the cyanobacterium Chroococcus minutus, Colloid. Surface. B, 128, 115–118, https://doi.org/10.1016/j.colsurfb.2015.02.017, 2015.
Sperling, M., Piontek, J., Engel, A., Wiltshire, K. H., Niggemann, J., Gerdts, G., and Wichels, A.: Combined carbohydrates support rich communities of particle-associated marine bacterioplankton, Front. Microbiol., 8, 1–14, https://doi.org/10.3389/fmicb.2017.00065, 2017.
Stefan, R. L. and Szeri, A. J.: Surfactant scavenging and surface deposition by rising bubbles, J. Colloid Interface Sci., 212, 1–13, https://doi.org/10.1006/jcis.1998.6037, 1999.
Stolle, C., Nagel, K., Labrenz, M., and Jürgens, K.: Succession of the sea-surface microlayer in the coastal Baltic Sea under natural and experimentally induced low-wind conditions, Biogeosciences, 7, 2975–2988, https://doi.org/10.5194/bg-7-2975-2010, 2010.
Stolle, C., Ribas-Ribas, M., Badewien, T. H., Barnes, J., Carpenter, L. J., Chance, R., Damgaard, L. R., Durán Quesada, A. M., Engel, A., Frka, S., Galgani, L., Gašparović, B., Gerriets, M., Hamizah Mustaffa, N. I., Herrmann, H., Kallajoki, L., Pereira, R., Radach, F., Revsbech, N. P., Rickard, P., Saint, A., Salter, M., Striebel, M., Triesch, N., Uher, G., Upstill-Goddard, R. C., van Pinxteren, M., Zäncker, B., Zieger, P., and Wurl, O.: The MILAN Campaign: Studying Diel Light Effects on the Air–Sea Interface, B. Am. Meteor. Soc., 101, E146–E166, https://doi.org/10.1175/BAMS-D-17-0329.1, 2020.
Sugimura, Y. and Suzuki, Y.: A high-temperature catalytic oxidation method for the determination of non-volatile dissolved organic carbon in seawater by direct injection of a liquid sample, Mar. Chem., 24, 105–131, https://doi.org/10.1016/0304-4203(88)90043-6, 1988.
Sun, C.-C., Sperling, M., and Engel, A.: Effect of wind speed on the size distribution of gel particles in the sea surface microlayer: insights from a wind–wave channel experiment, Biogeosciences, 15, 3577–3589, https://doi.org/10.5194/bg-15-3577-2018, 2018.
Sun, L., Xu, C., Zhang, S., Lin, P., Schwehr, K. A., Quigg, A., Chiu, M. H., Chin, W. C., and Santschi, P. H.: Light-induced aggregation of microbial exopolymeric substances, Chemosphere, 181, 675–681, https://doi.org/10.1016/j.chemosphere.2017.04.099, 2017.
Thornton, D. C. O.: Dissolved organic matter (DOM) release by phytoplankton in the contemporary and future ocean, Eur. J. Phycol., 49, 20–46, https://doi.org/10.1080/09670262.2013.875596, 2014.
Thornton, D. C. O., Brooks, S. D., and Chen, J.: Protein and carbohydrate exopolymer particles in the sea surface microlayer (SML), Front. Mar.Sci., 3, 1–14, https://doi.org/10.3389/fmars.2016.00135, 2016.
van Pinxteren, M., Müller, C., Iinuma, Y., Stolle, C., and Herrmann, H.: Chemical characterization of dissolved organic compounds from coastal sea surface microlayers (Baltic Sea, Germany), Environ. Sci. Technol., 46, 10455–10462, https://doi.org/10.1021/es204492b, 2012.
van Pinxteren, M., Barthel, S., Fomba, K. W., Müller, K., Von Tümpling, W., and Herrmann, H.: The influence of environmental drivers on the enrichment of organic carbon in the sea surface microlayer and in submicron aerosol particles – measurements from the Atlantic Ocean, Elementa, 5, 35, https://doi.org/10.1525/elementa.225, 2017.
van Pinxteren, M., Fomba, K. W., Triesch, N., Stolle, C., Wurl, O., Bahlmann, E., Gong, X., Voigtländer, J., Wex, H., Robinson, T.-B., Barthel, S., Zeppenfeld, S., Hoffmann, E. H., Roveretto, M., Li, C., Grosselin, B., Daële, V., Senf, F., van Pinxteren, D., Manzi, M., Zabalegui, N., Frka, S., Gašparović, B., Pereira, R., Li, T., Wen, L., Li, J., Zhu, C., Chen, H., Chen, J., Fiedler, B., von Tümpling, W., Read, K. A., Punjabi, S., Lewis, A. C., Hopkins, J. R., Carpenter, L. J., Peeken, I., Rixen, T., Schulz-Bull, D., Monge, M. E., Mellouki, A., George, C., Stratmann, F., and Herrmann, H.: Marine organic matter in the remote environment of the Cape Verde islands – an introduction and overview to the MarParCloud campaign, Atmos. Chem. Phys., 20, 6921–6951, https://doi.org/10.5194/acp-20-6921-2020, 2020.
Veuger, B., Van Oevelen, D., Boschker, H. T. S., and Middelburg, J. J.: Fate of peptidoglycan in an intertidal sediment: An in situ 13C-labeling study, Limnol. Oceanogr., 51, 1572–1580, https://doi.org/10.4319/lo.2006.51.4.1572, 2006.
Wasmund, N.:. Occurrence of cyanobacterial blooms in the baltic sea in relation to environmental conditions, Internat. Rev. Hydrobiol., 82, 169–184, https://doi.org/10.1002/iroh.19970820205, 1997.
Wasmund, N., Göbel, J., and Bodungen, B. v.: 100-years-changes in the phytoplankton community of Kiel Bight (Baltic Sea), J. Marine Syst., 73, 300–322, https://doi.org/10.1016/j.jmarsys.2006.09.009, 2008.
Woolf, D. K., Shutler, J. D., Goddijn-Murphy, L., Watson, A. J., Chapron, B., Nightingale, P. D., Donlon, C. J., Piskozub, J., Yelland, M. J., Ashton, I., Holding, T., Schuster, U., Girard-Ardhuin, F., Grouazel, A., Piolle, J. F., Warren, M., Wrobel-Niedzwiecka, I., Land, P. E., Torres, R., Prytherch, J., Moat, B., Hanafin, J., Ardhuin, F., and Paul, F.: Key Uncertainties in the Recent Air-Sea Flux of CO2, Global Biogeochem. Cy., 33, 1548–1563, https://doi.org/10.1029/2018GB006041, 2019.
Woźniak, B., Bradtke, K., Darecki, M., Dera, J., Dudziñska-Nowak, J., Dzierzbicka-Głowacka, L., Ficek, D., Furmañczyk, K., Kowalewski, M., Krezel, A., Majchrowski, R., Ostrowska, M., Paszkuta, M., Stoñ-Egiert, J., Stramska, M., and Zapadka, T.: SatBałtyk – a Baltic environmental satellite remote sensing system – an ongoing project in Poland. Part 1: Assumptions, scope and operating range, Oceanologia, 53, 897–924, https://doi.org/10.5697/oc.53-4.897, 2011.
Wurl, O. and Holmes, M.: The gelatinous nature of the sea-surface microlayer, Mar. Chem., 110, 89–97, https://doi.org/10.1016/j.marchem.2008.02.009, 2008.
Wurl, O., Wurl, E., Miller, L., Johnson, K., and Vagle, S.: Formation and global distribution of sea-surface microlayers, Biogeosciences, 8, 121–135, https://doi.org/10.5194/bg-8-121-2011, 2011a.
Wurl, O., Miller, L., and Vagle, S.: Production and fate of transparent exopolymer particles in the ocean, J. Geophys. Res.-Oceans, 116, 1–16, https://doi.org/10.1029/2011JC007342, 2011b.
Wurl, O., Ekau, W., Landing, W. M., and Zappa, C. J.: Sea surface microlayer in a changing ocean – A perspective, Elementa, 5, 31, https://doi.org/10.1525/elementa.228, 2017.
Yang, M., Bell, T. G., Brown, I. J., Fishwick, J. R., Kitidis, V., Nightingale, P. D., Rees, A. P., and Smyth, T. J.: Insights from year-long measurements of air–water CH4 and CO2 exchange in a coastal environment, Biogeosciences, 16, 961–978, https://doi.org/10.5194/bg-16-961-2019, 2019.
Yang, M., Smyth, T. J., Kitidis, V., Brown, I. J., Wohl, C., Yelland, M. J., and Bell, T. G.: Natural variability in air–sea gas transfer efficiency of CO2, Sci. Rep., 11, 1–9, https://doi.org/10.1038/s41598-021-92947-w, 2021.
Zäncker, B., Bracher, A., Röttgers, R., and Engel, A.: Variations of the Organic Matter Composition in the Sea Surface Microlayer: A Comparison between Open Ocean, Coastal, and Upwelling Sites Off the Peruvian Coast, Front. Microbiol., 8, 1–17, https://doi.org/10.3389/fmicb.2017.02369, 2017.
Zeppenfeld, S., Van Pinxteren, M., Hartmann, M., Bracher, A., Stratmann, F., and Herrmann, H.: Glucose as a Potential Chemical Marker for Ice Nucleating Activity in Arctic Seawater and Melt Pond Samples, Environ. Sci. Technol., 53, 8747–8756, https://doi.org/10.1021/acs.est.9b01469, 2019.
Zhang, Z., Liansheng, L., Zhijian, W., Jun, L., and Haibing, D.: Physicochemical studies of the sea surface microlayer I. Thickness of the sea surface microlayer and its experimental determination, J. Colloid Interf. Sci., 204, 294–299, https://doi.org/10.1006/jcis.1998.5538, 1998.
Zhang, Z., Anhui, Z., Liansheng, L., Chunying, L., Chunyan, R., and Lei, X.: Viscosity of sea surface microlayer in Jiaozhou Bay and adjacent sea area, Chin. J. Oceanol. Limnol., 21, 351–357, https://doi.org/10.1007/bf02860431, 2003a.
Zhang, Z., Liu, L., Liu, C., and Cai, W.: Studies on the sea surface microlayer: II. The layer of sudden change of physical and chemical properties, J. Colloid Interf. Sci., 264, 148–159, https://doi.org/10.1016/S0021-9797(03)00390-4, 2003b.
Ziegler, S. E. and Fogel, M. L.: Seasonal and diel relationships between the isotopic compositions of dissolved and particulate organic matter in freshwater ecosystems, Biogeochemistry, 64, 25–52, https://doi.org/10.1023/A:1024989915550, 2003.
Ẑutić, V., Ćosović, B., Marčenko, E., Bihari, N., and Kršinić, F.: Surfactant production by marine phytoplankton, Mar.Chem., 10, 505–520, https://doi.org/10.1016/0304-4203(81)90004-9, 1981.