the Creative Commons Attribution 4.0 License.
the Creative Commons Attribution 4.0 License.
 | 27 Oct 2022
Variation in calcification of Reticulofenestra coccoliths over the Oligocene–Early Miocene
Miguel Ángel Fuertes
José-Abel Flores
Iván Hernández-Almeida
Coccolithophores are calcifying marine phytoplankton whose intracellularly produced calcite plates, coccoliths, have been the dominant source of calcium carbonate in open-ocean settings since the Cretaceous. An open question is whether their calcification has been affected by changing environmental conditions over geological timescales such as variations in the ocean carbon system. Previous methods using circular polarized light microscopy allowed for only the thickness of small coccoliths thinner than 1.5 µm to be quantified, but prior to the Pliocene, a significant fraction of the coccoliths exceeded this thickness and have not been quantifiable. Here, we implement a new approach for calibration of circular polarized light microscopy enabling us to quantify coccoliths which feature calcite up to 3 µm thick. We apply this technique to evaluate the evolution of calcification in the Reticulofenestra from the early Oligocene to Early Miocene in exceptionally well-preserved sediments from the Newfoundland margin. Through this time interval, coccolith thickness and the scale-invariant shape factor kse vary by about 20 % around the mean thickness of 0.37 µm and mean kse of 0.16. Lower shape factors characterize samples with a higher relative abundance of dissolution-resistant nannoliths, suggesting that dissolution may contribute to thinning of placoliths. We therefore define temporal trends in calcification only in samples in which the assemblage suggests minimal dissolution. The lowest kse characterizes the middle Oligocene, and the highest kse around 18 Ma is in the Early Miocene. High ocean dissolved inorganic carbon (DIC) concentrations have been proposed for this period of the Miocene and may be one factor contributing to high coccolith kse.
- Article
(5055 KB) - Full-text XML
-
Supplement
(306 KB) - BibTeX
- EndNote


Coccolithophore algae possess small calcareous plates called coccoliths, produced continuously intracellularly to maintain a full interlocking covering over the cell. Calcification by coccolithophorid algae represents the major source of CaCO3 production in the open oceans (Siesser, 1993). The abundance, growth rate, and degree of calcification of coccolithophores in the ocean have implications for the global carbon cycle. Calcification is important because it affects the surface ocean alkalinity and may affect the sinking velocity of coccolithophores and ballasting efficiency of organic carbon export (Rost and Riebesell, 2004).
Calcification rates of coccolithophores are the product of the cellular growth rate and the degree of cellular calcification.
In laboratory culture studies, the cellular calcification is generally measured by the geochemical assay of calcite (either as Ca or inorganic C) in a culture volume, paired with estimation of the cell density. Multiple laboratory studies of extant coccolithophores strains show plasticity in calcification rates and cellular calcification in response to environmental conditions, especially changing carbon chemistry, as reviewed by Bach et al. (2015). However, it remains uncertain if this plasticity observed in a short-term culture is representative of the longer-term response in the geological past. Variations in cellular calcification by past coccolithophore communities can usually be assessed only from the individual disaggregated coccoliths present in deep-sea sediments. Fortunately, culture studies show that the degree of cellular calcification is to first order controlled by the thickness of coccoliths, a parameter which can be determined on fossil material (Bolton et al., 2016). Hence, there is significant interest in first improving techniques for quantification of the amount of calcite forming the fossil coccoliths and, secondly, evaluating the obtained variations in cellular calcification over time to test potential responses to past ocean system conditions.
In this contribution, we seek to evaluate changes in cellular calcification in coccoliths from the middle Oligocene through Early Miocene in a deep-sea sediment series of exceptional preservation quality from coring in IODP (Integrated Ocean Discovery Program) Site 1406 on the Newfoundland margin. This time period has been inferred to feature a significant decline in pCO2 (Zhang et al., 2013). Significant changes in the mean size of coccolithophores during the Oligocene have also been proposed as an adaptation to declining CO2 (Henderiks and Pagani, 2008; Guitián et al., 2020). The Noelaerhabdaceae lineage, which includes the recent genera Emiliania, Gephyrocapsa, Pseudoemiliania, and Reticulofenestra, has dominated the coccolithophore communities over the Cenozoic. For this reason, we focus on the record of changing cellular calcification within the Noelaerhabdaceae family, commonly known as “reticulofenestrids”, through the Oligocene–Miocene (Young, 1998), counting coccoliths from all Reticulofenestra genus groups: R. pseudoumbilicus; R. lockeri; R. umbilicus; R. bisecta; and the dominant carbonate contributor at the site, Cyclicargolithus floridanus. Because Oligocene–Miocene sediments include many large coccoliths from the Reticulofenestra genus (Guitián et al., 2020), they feature portions of coccoliths thicker than the limit of published techniques for estimating coccolith thickness by polarized light microscopy (1.55 µm, Bollmann, 2014; Fuertes et al., 2014; 1.7 µm, Beaufort et al., 2021; 1.34 µm, Johnsen and Bollmann, 2020). Consequently, we implement here a new system to quantify populations of thicker coccoliths by automating the calibration approach of González Lemos et al. (2018).
Estimations of coccolith mass were first derived from volumes of rotation using idealized 3D cross sections of type specimens produced from scanning electron microscope images (Young and Ziveri, 2000). This approach generated a single “shape factor” (ks; see Eq. 1) for a given species or morphotype, and the volume was calculated as the product of the shape factor and measured length. However, the technique was not suited for quantifying variation in thicknesses of individual coccoliths of a given length. Polarized light microscopy was subsequently proposed to directly estimate the thickness of individual coccoliths because thicker coccoliths generated greater birefringence. The first technique used linear polarized light with images captured over multiple rotations of the stage to estimate the full calcite volume (Beaufort, 2005). Later, circular polarized light was used to eliminate extinction patterns by making the birefringence independent of the angle of the stage, so estimations of coccolith volume could be made from a single image and therefore with greater precision (Fuertes et al., 2014; Bollmann, 2014). Such methods have shown that cellular calcification, derived from coccolith thickness, of small coccoliths has been decreasing since the Late Miocene (Bolton et al., 2016).
In all methods with polarized light, the calibration of the color or grey level of each individual pixel in the image to absolute thickness is a challenge. To date, calibration challenges have limited quantification of coccolith thickness to the smallest coccoliths with thin calcite units; typical thickness limits are 1.7 µm (Beaufort et al., 2021) and 1.34 µm (Johnsen and Bollmann, 2020). A recent calibration approach proposed the use of a calcite wedge in which the thickness is independently determined at various points using a tilting compensator that provides known retardation of light rays (González Lemos et al., 2018). The main advantages of the calibration with a calcite wedge is that it is independent of the type of microscope and its light configuration, and color–thickness calibration is in theory possible up to 4.5 µm. As coccoliths with a thickness greater than 1.55 µm appear with colors ranging from orange to blue, this calibration can be applied to all the coccoliths beyond the previous grey-level limit.
For this study, the Oligocene–Miocene sediments include many large coccoliths from the Reticulofenestra genus, which feature portions of coccoliths thicker than 1.55 µm; we therefore devise a system for automating the calibration approach of González Lemos et al. (2018) within the range of thickness from 0 to 3 µm. We use a new calibrated calcite wedge and code the C-Calcita program (Fuertes et al., 2014) to employ this calibration and subsequently to calculate thickness in each pixel of coccoliths – reaching 3 µm in many studied coccoliths – and thereby compute the mass and average thickness of the individual coccoliths. This calibration can be directly applied to estimate the absolute thickness of coccoliths within the Noelaerhabdaceae lineage. Noelaerhabdaceae are formed of calcite units with a radially oriented c axis (r units) forming proximal and distal shields as well as an inner and outer tube, without appreciable elements with a vertically oriented c axis (v units) (Young et al., 1992, 2004). R-type units are strongly birefringent and therefore fully visible when circular polarized light is used, giving an intensity and color of the light that represents the total accumulated thickness of the calcite across the incident ray.
Since v units are not fully visible in circular polarized light, relative but not absolute calibration of thickness is possible for taxa which contain significant r and v calcite units (e.g., Fuertes et al., 2014). Nonetheless, relative variations in thickness of other taxa may be still relevant to studies of coccolith preservation and diagenetic overgrowth (Dedert et al., 2014). Consequently, we also report the estimation of differences in the thickness of other taxa.
3.1 Microscope setup for image acquisition
All the images were obtained at ETH Zurich using a Zeiss Axioscope HAL 100 POL microscope with circularly polarized light, equipped with a Zeiss Plan-Apochromat 100 oil objective, a universal condenser with numerical aperture set at 0.1–0.2. Circular polarization is obtained by placing two retardation plates, one between the lower linear polarizer and the condenser and the other below the upper linear polarizer, both at an angle of 45∘ relative to the linear polarizers. The system is equipped with a Zeiss Axiocam 506 color camera. Light intensity and camera exposure are defined by checking calcite and coccolith fields of view briefly before each calibration session starts to avoid overexposure of RGB colors, and the gamma correction factor is set to 1. The camera resolution was 0.045 µm per pixel, with final images of 2560×1920 pixels.
3.2 Calibration of absolute thickness within C-Calcita
A calcite wedge with a constant slope over this thickness range has been produced at ETH Zurich. The calcite thickness was measured in 11 points along a linear profile, using a tilting compensator, as described in González Lemos et al. (2018) (Fig. 1). We refer to this “reference image” as Cal. 1, and the coordinates of the points whose thickness has been measured are labeled Coord 1.
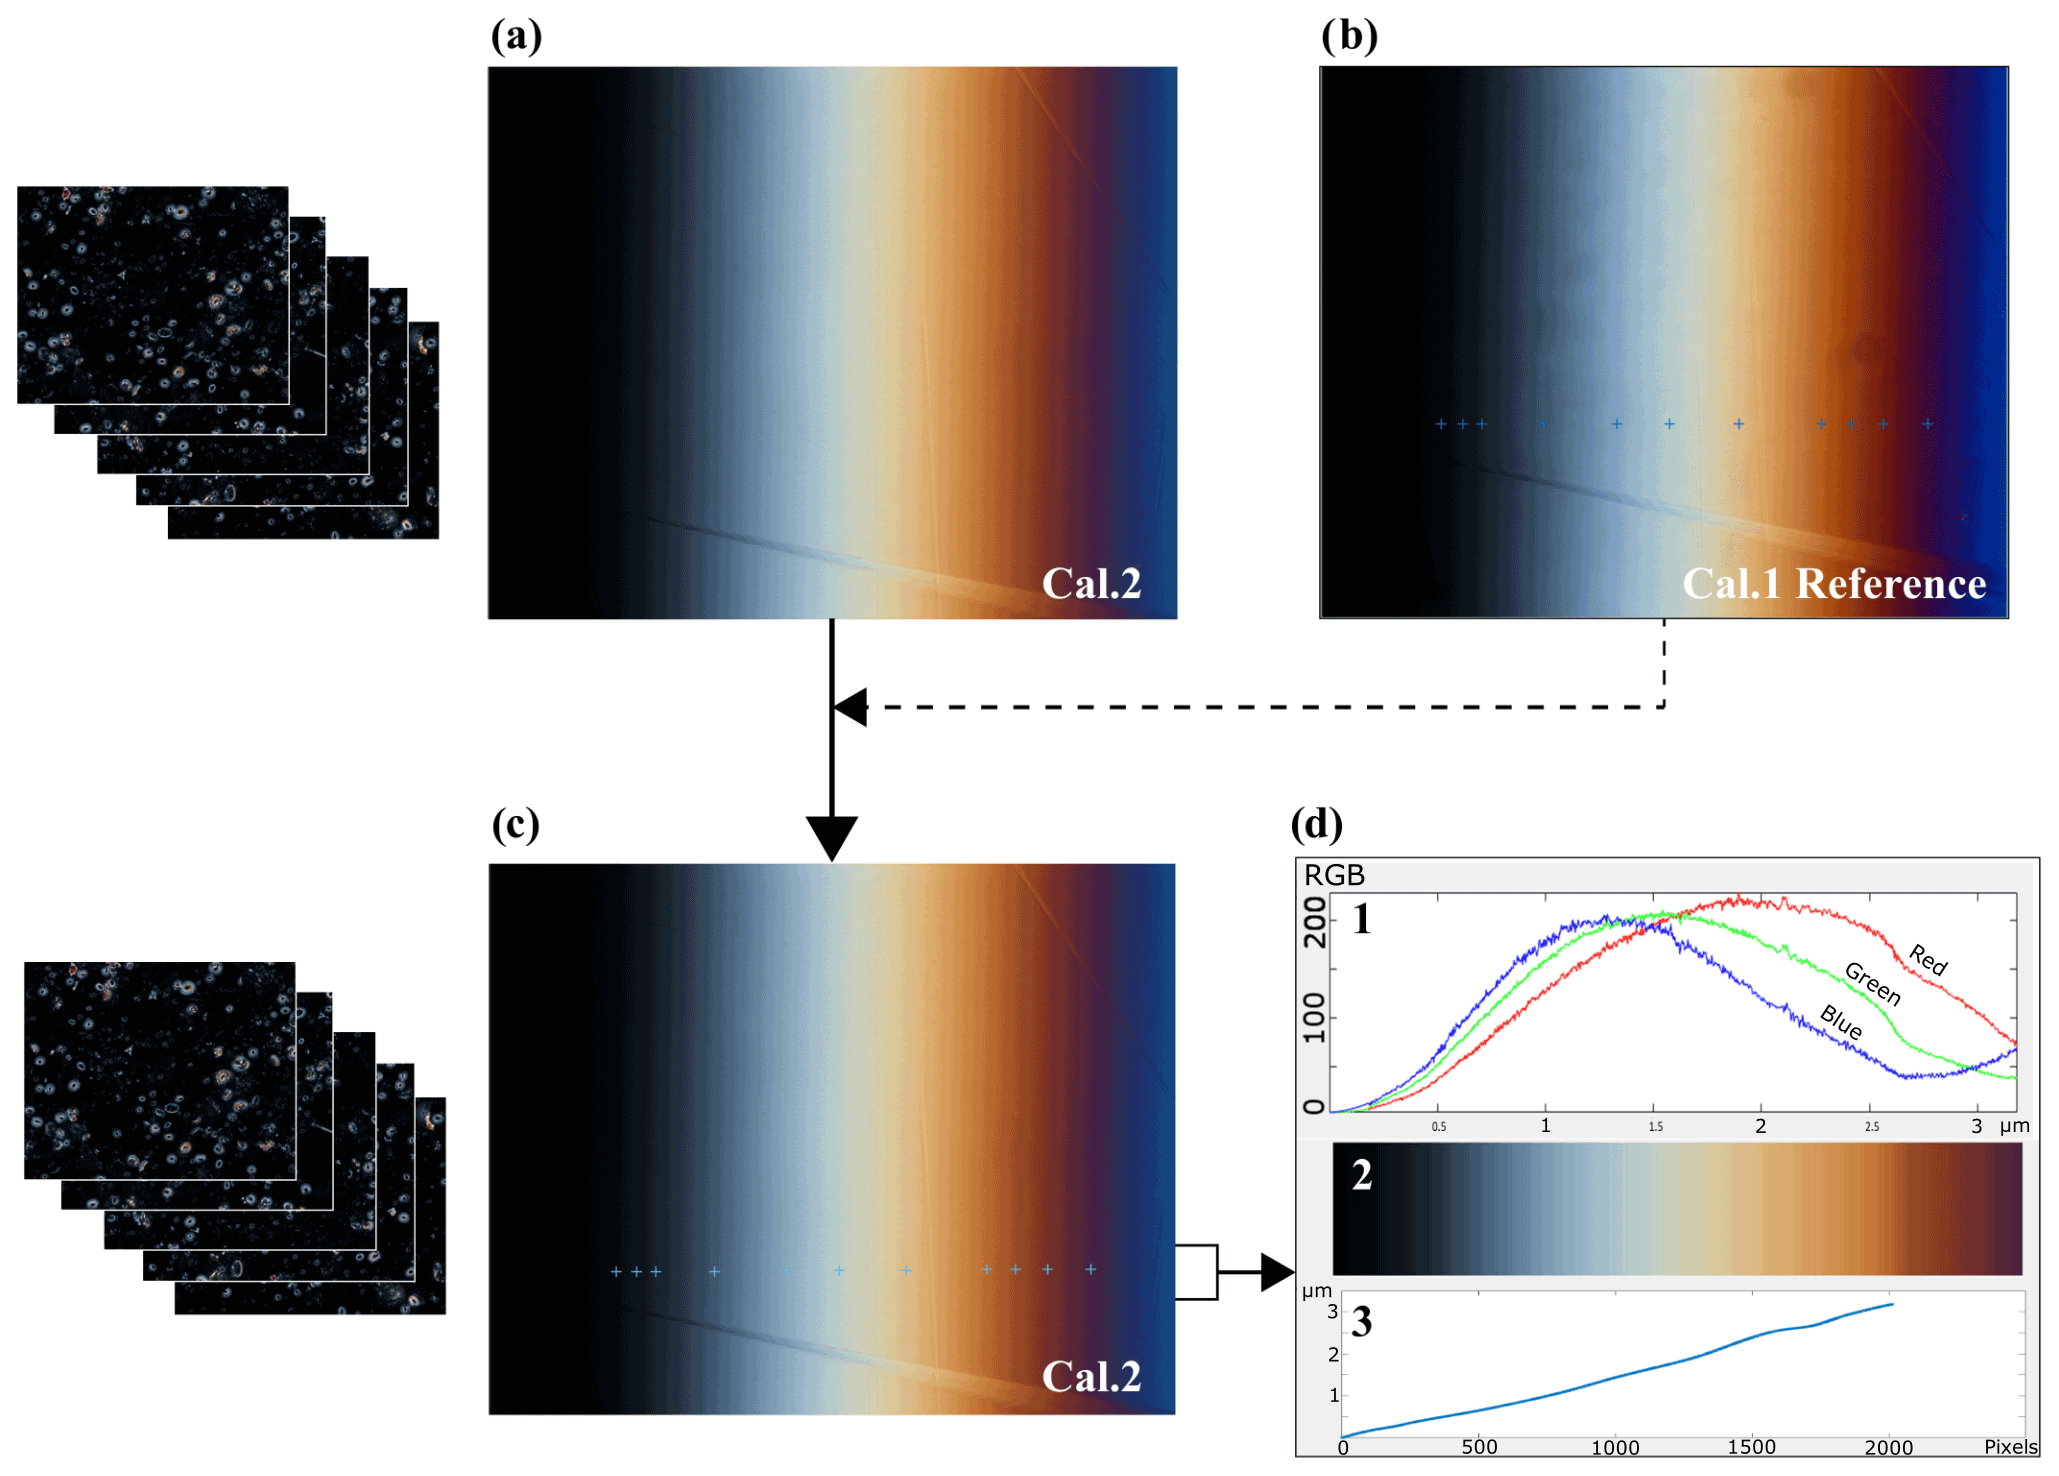
Figure 1(a) Session image of reference calcite wedge (Cal. 2) taken with the same microscope settings as the coccolith images that are going to be taken later. (b) Reference image of the calcite wedge (Cal. 1) and the points where the thickness has been measured using a tilting compensator (Coord 1). Notice that although they are similar, neither the frame nor the light are exactly the same as the image of Cal. 2. (c) Session image of Cal. 2 with the automated calculated equivalent points of known thickness. (d) 1 Color band spectrum along the line profile. 2 RGB color rectangle showing in lines each point line color. 3 Thickness profile along the wedge line.
To account for differences in microscope configuration or light situation during each microscope session in which coccolith images are taken, we take a new “session image” of the calcite wedge, seeking to capture as similar a field view as possible to the reference wedge image and using microscope settings identical to those used for capturing coccolith images.
With MATLAB®, the original C-Calcita script (Fuertes et al., 2014) was modified to an updated version, C-Calcita v.2, where we establish a routine to locate the calibrated thickness points from the reference wedge image into each session photo (e.g., Cal. 2) (Fig. 1). The relationship between both the reference and session images of the wedge is searched, and the equivalent points are located. This routine employs the KAZE detection and description, which was designed to find point correspondences between two images of the same scene (Alcantarilla et al., 2012). This routine occurs in three steps: first, “interest points” are selected at distinctive locations in the image, such as corners, blobs, and T junctions. Then, a feature vector, called a descriptor, represents the neighborhood of every interest point to finally match descriptor vectors between the different images, in order to obtain the rotated angle, and the translation is done. Subsequently, the position of the known coordinates of the reference image Cal. 1 can be located on the session image Cal. 2 (Fig. 1c). Because the wedge can feature cleavage breaks at the edge, we calculate the theoretical point in the image that would correspond with zero thickness using a polynomial fit from the measured points and then calculate the roots for that polynomial.
Once the known thickness calibration points have been identified on the session image, the C-Calcita routine generates a matrix containing the RGB values of all the pixels of the image Cal. 2 along the profile given by the points whose thickness has been measured, up to the calculated point that would correspond to zero thickness. As illustrated in Fig. 1, this process has interpolated between the 11 known points to generate a calibration set in which more than 2000 points between 0 and 3.2 µm have a defined thickness value and set of RGB values for the microscope and setting employed (first panel of Fig. 1d). We describe this matrix as an RGB–thickness calibration matrix, which provides the complete color calibration of C-Calcita for a particular microscope session (third panel of Fig. 1d).
3.3 Calculation of thickness of coccoliths
Slides of coccoliths are prepared using the decanting method described by Flores and Sierro (1997) which allows for random settling of coccoliths. Mounted slides are then inspected on the microscope, and sample images are taken using settings described in Sect. 3.1.
Once the calibration is completed, the coccolith images that have been captured with the same configuration as the image Cal. 2 for reference are loaded into the program. In order to measure the coccolith thickness that corresponds to each pixel in the coccolith images, an exhaustive search is created based on the Euclidean distance: for each individual pixel of the coccolith image, the most similar RGB vector of the calibrated matrix is matched. The thickness value assigned to that single coccolith pixel is that of the most similar RGB matrix vector.
In some cases, the internal reflections of the light into the coccolith or the presence of aberrations may lead to inference of a higher-than-realistic thickness in some points (e.g., Fig. 2). To minimize this issue, a Gaussian filter is applied to the coccolith image, obtaining a smoothed thickness image. In those pixels where the obtained thickness increases abruptly, compared with the smoothed thickness image, the thickness value for that pixel is substituted by the Gaussian value of its surroundings (Fig. 2).
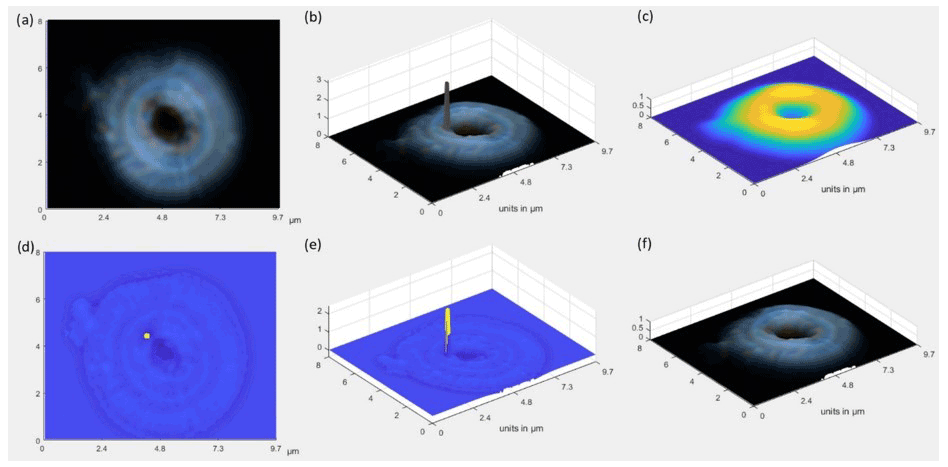
Figure 2(a) Original image. (b) 3D coccolith with total thickness accumulated through the crystal (i.e., proximal and distal shield and tube calcite from coccolith r units), presenting in some points values higher than expected. (c) Gaussian smoothing. (d, e) Identification of points to be smoothed (yellow). (f) Final 3D image where the identified points have been smoothed.
Finally, from the smoothed map of thickness per pixel, the total area-integrated thickness is used to compute the volume and mass of calcite in each coccolith, as in previous versions of C-Calcita (Fuertes et al., 2014).
3.4 Indices of variations in thickness and calcification of Oligocene–Early Miocene coccoliths
A total of 11 samples from IODP Site 1406, which cover the interval between the Oligocene to Early Miocene (27.9 to 17.8 Ma), were analyzed for coccolith thickness. The age model applied for that interval was the one previously published by Guitián et al. (2019). Between 241 and 660 coccoliths per sample were isolated from microscope images, with the major and minor axis being calculated, and the total calcite was mass computed. In one additional sample, only 86 coccolith images were obtained and processed. Total coccoliths/nannoliths in all sites included 55 Discoaster; 83 Helicosphaera; 96 Sphenolithus; 154 Coccolithus; and 3018 Reticulofenestra (Young, 1998), including the Cyclicargolithus group.
As described previously (Fuertes et al., 2014), the C-Calcita estimates for each identified coccolith, the major and minor axis, the coccolith area, and the coccolith volume. From the major and minor axes, the program estimates circularity, as well as thickness (calcified volume/calcified area), and converts coccolith volume into coccolith mass using the density of calcite. Hereafter, we refer to the major axis as length (l) and the minor axis as width (w).
We calculate several additional parameters including an ellipsoid defined by the coccolith length and width, the thickness (volume area), and two shape factor indices. For a given coccolith geometry, a change in the coccolith length and width will result in a thickness which covaries with mass. Therefore, thickness could be expected to correlate with coccolith length. In contrast, the shape factor indices are independent of variations in coccolith size.
The shape factor ks has been defined (Young and Ziveri, 2000) as an estimator of the fraction of a cube of length l, which is filled with the volume v of the coccolith:
where for a sphere ks is 0.52. Many coccoliths are often elliptical, but the length has been used in the standard definition of ks (Young and Ziveri, 2000).
We also calculate a shape factor referenced not to a cubic volume but rather the volume of an ellipsoid defined by the coccolith l and w (kse), which allow for calculation of a shape factor independent of variations in circularity:
4.1 Thickness of Oligocene nannofossils
In the thickest part of the coccolith of the largest Reticulofenestra, thicknesses reached 3 µm, spanning the full range of the implemented color calibration (Fig. 3). As observed in Fig. 3, the thickness maps suggest minor imperfections in preservation and breakage. We examine these in the statistics of data from large populations, which minimizes the influence of these breakages on the estimation of coccolith thickness from sediments of a given age.
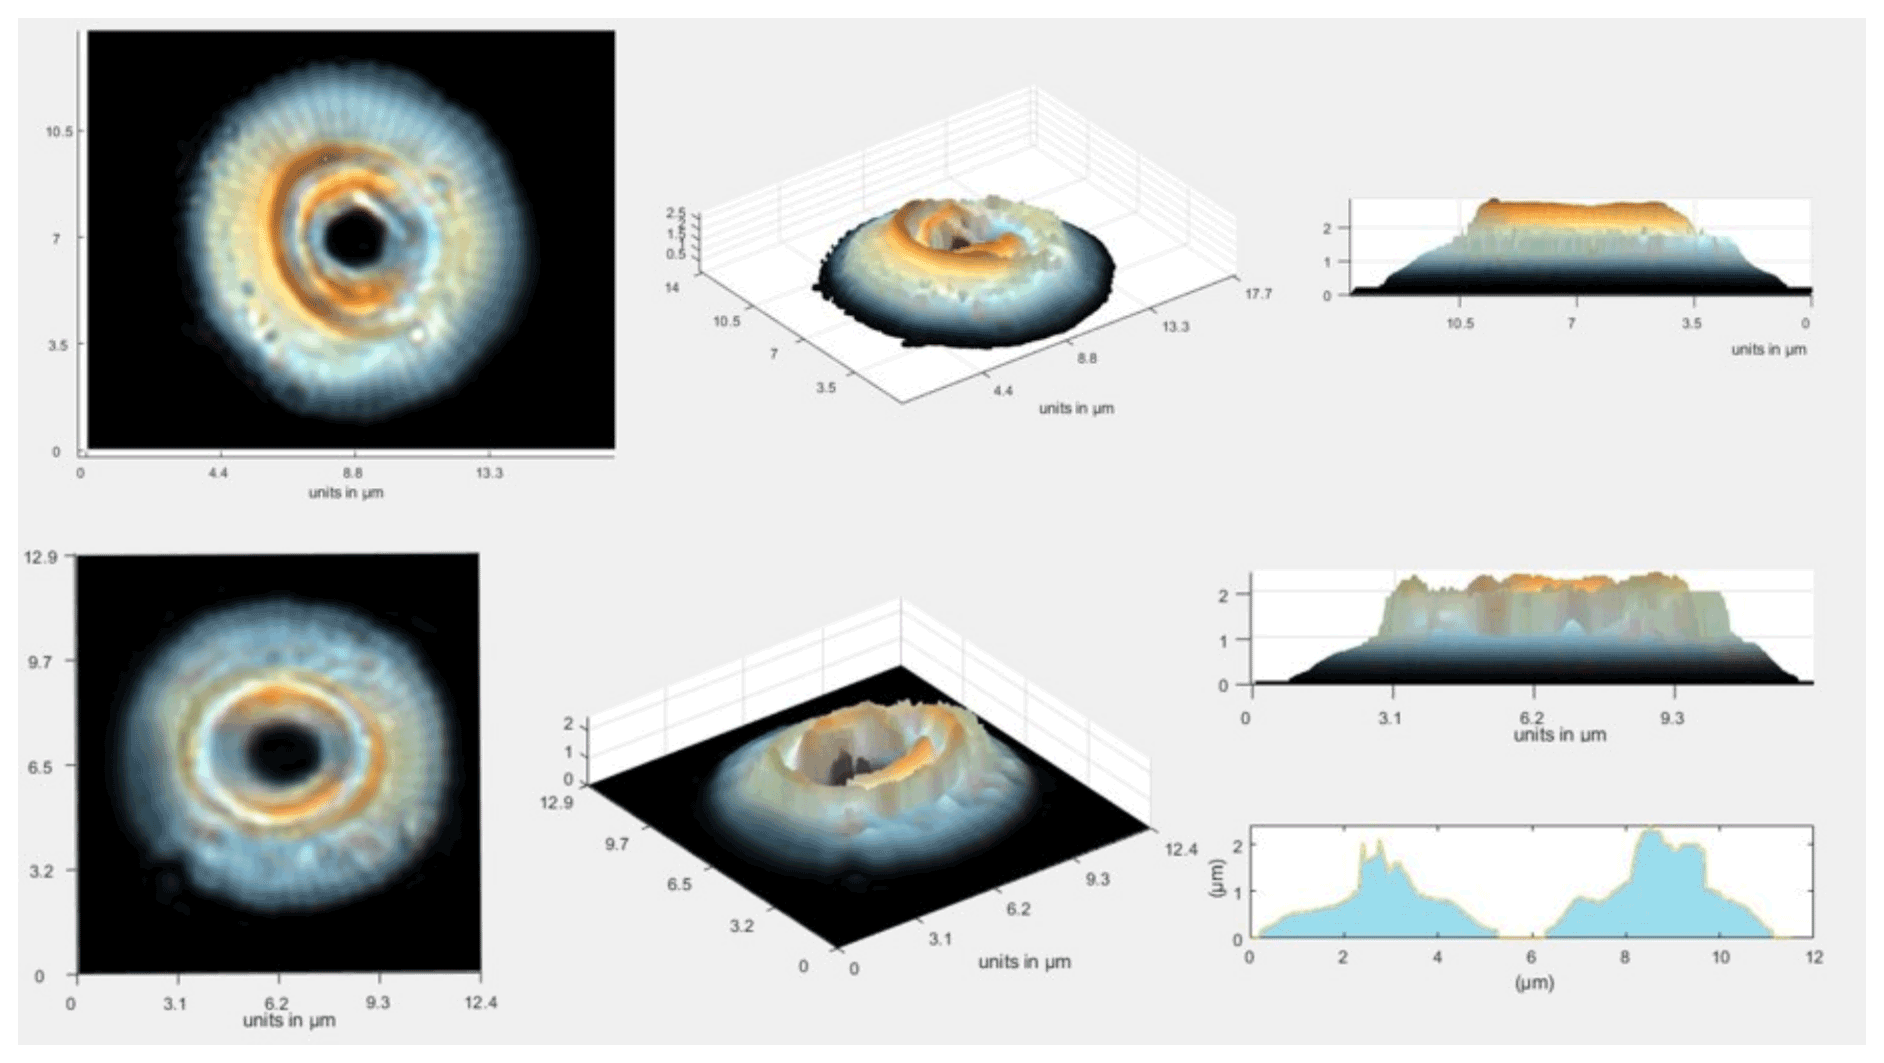
Figure 3Schemes of large Reticulofenestra, which represent the original image of the coccoliths and example reconstructions of total calcite thickness accumulated across the coccolith.
Averaged over the entire calcified area of the coccolith, 95 % of Reticulofenestra coccoliths had thicknesses in the range of 0.26 to 0.72 µm (Fig. 4). Among these “reticulofenestrids”, 95 % of the coccoliths had a length between 3 and 8.6 µm, as expected from a previous study (Guitián et al., 2020). Modern Reticulofenestra are generally smaller than those we measured from the Oligocene–Early Miocene. A survey of 3600 Gephyrocapsa spp. in core top sediments range from 0.9 to 6.2 µm, with the mean lengths at a given site ranging from 1.3 to 4.2 µm, with lengths over 3.5 µm restricted to warmer waters >22 ∘C (Bollmann, 1997).
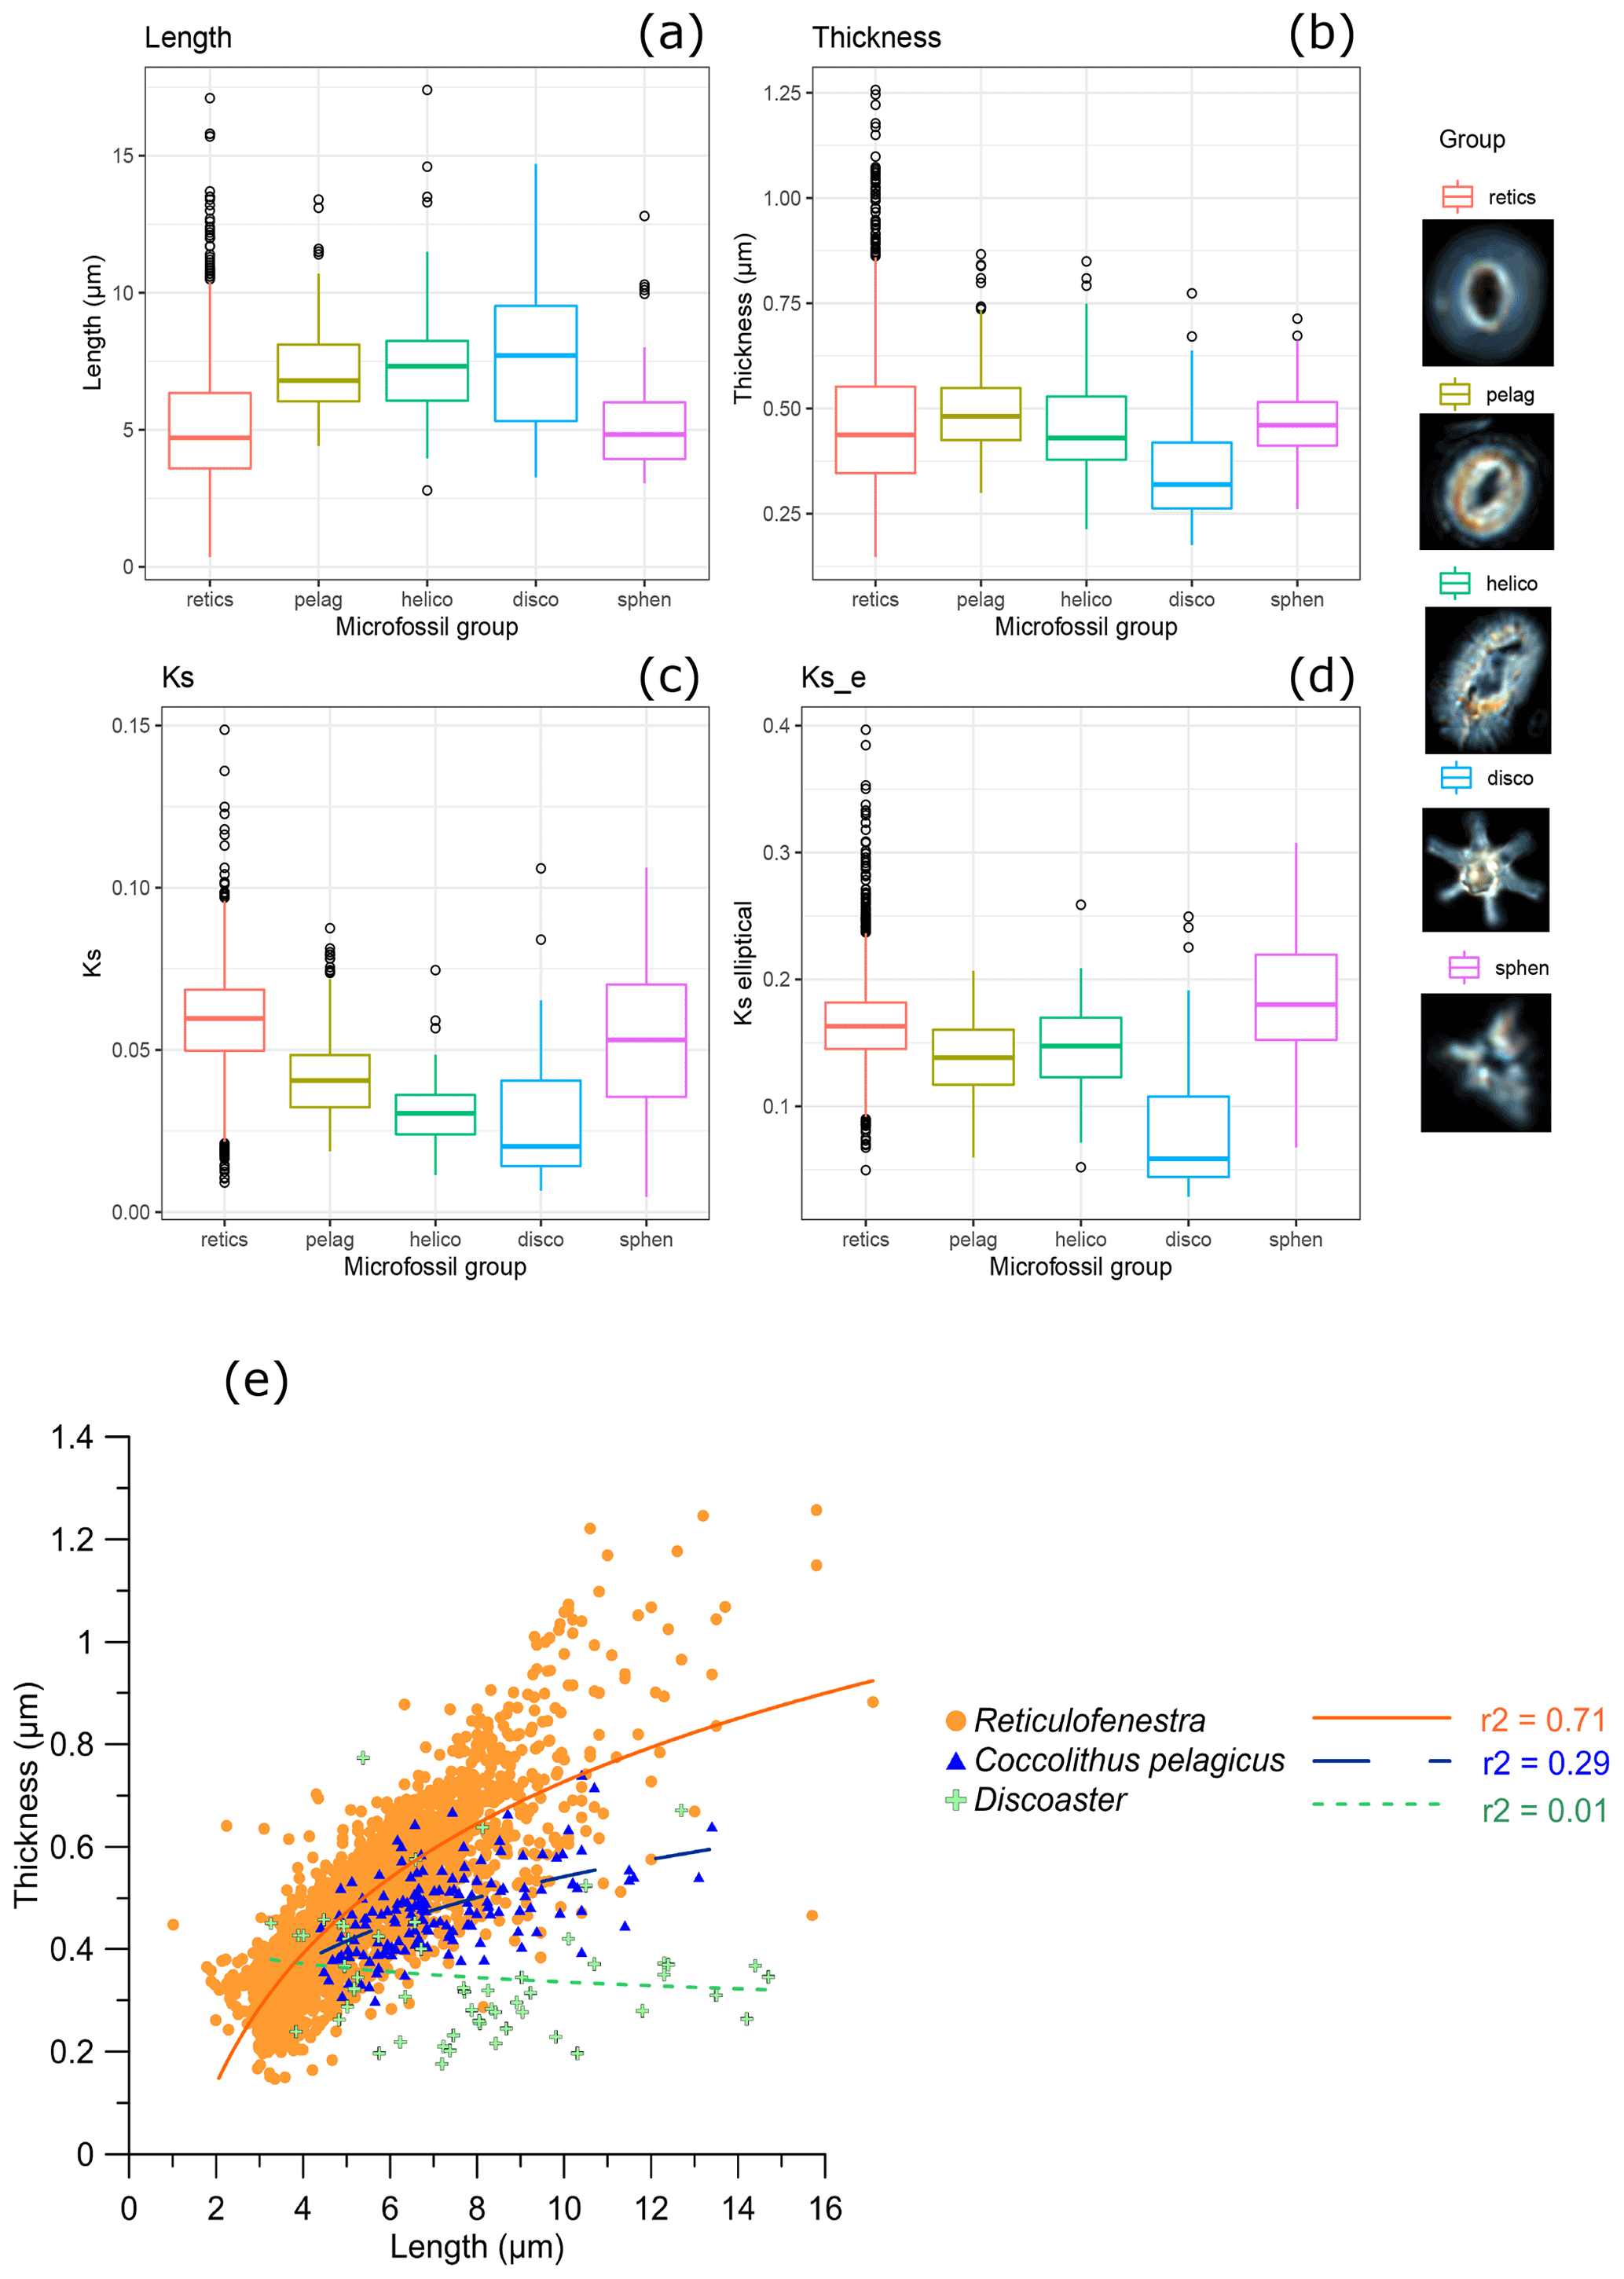
Figure 4Box-and-whisker plot showing (a) length, (b) thickness, (c) ks, and (d) kse for taxa in all samples and thumbnail examples of Reticulofenestra (retics), Coccolithus pelagicus (pelag), Helicosphaera (helico), Discoaster (disco), and Sphenolithus (sphen). (e) Plot of thickness vs. length for all Reticulofenestra, Coccolithus, and Discoaster.
The calculated ks values are lower for the placoliths with mixed r and v units (Helicosphaera and C. pelagicus; 0.03 and 0.04, respectively) compared to the Reticulofenestra group with r units comprising the full coccolith (0.06) (Fig. 4c, d). Similarly, the slope of the curve of thickness vs. length is also lower for Helicosphaera spp. and C. pelagicus compared to Reticulofenestra (Fig. 4e). We suggest that these results are an expected consequence of the crystallographic orientation. Previous estimations of ks made not from polarized light but from volumes of rotation of scanning electron microscope (SEM) cross sections, which are independent of crystallographic orientation, indicate ks values for recent C. pelagicus and Helicosphaera spp. (0.06 and 0.05, respectively), comparable to or larger than those of modern Reticulofenestra (0.02 to 0.05) (Young and Ziveri, 2000). We conclude that the higher ks in Oligocene–Early Miocene Reticulofenestra than in other placoliths reflects the expected underestimation of absolute thickness by polarized light for coccolith genera featuring significant v units. Nannoliths (Discoaster, Sphenolithus) measured here have no modern or recent counterpart with which to compare the estimated ks but likely also have an underestimation of thickness. For all these non-Reticulofenestra taxa, we suggest that time series in future studies be interpreted merely as relative changes in thickness and ks instead of total accumulated thickness. Alternatively, the thickness of the radial central tube may be quantified (Cubillos et al., 2012). In this study, due to the low average number of counted nannoliths and non-Reticulofenestra placoliths per sample, we do not interpret time series trends.
4.2 Relationships between calcification and cell size within measured Reticulofenestra populations
Within each of the 11 Oligocene–Early Miocene populations of Reticulofenestra of a given age, there is a large range in length from ∼ 3 to 10 µm. The coccolith thickness increases linearly with the coccolith length in all samples, and the slope of this increase is statistically indistinguishable. In each sample, across the range in population length, kse remains stable with size or features a slight increase in kse with decreasing length (Fig. 5). Our findings contrast with reported data from cultures of modern Reticulofenestra where the generally larger modern G. oceanica coccoliths (4 µm) have higher ks than the on average smaller (3 µm) E. huxleyi (Bolton et al., 2016). On the other hand, among six different extant genera including Reticulofenestra and non-Reticulofenestra taxa, ks calculated from rotational volume in a limited number of cross sections shows more diverse relationships with length. ks and length were generally positively correlated across extant placolith genera over the 3.5–7 µm length range with a 2- to 4-fold increase in ks, whereas the taxa spanning lengths of 7–10 µm feature an inverse relationship between ks and length over a 2-fold range in ks (Young and Ziveri, 2000). On extant Noelaerhabdaceae from marine sediments, no previous studies exist with ks determinations on large populations because mass, rather than thickness or shape, is commonly reported (Beaufort et al., 2011). Yet, whatever pressure favors an upwards adjustment of ks with increasing size across modern placolith taxa <7 µm, this factor was apparently not favoring such an adjustment of ks within the Reticulofenestra across a comparably large range of cell sizes in the Oligocene.
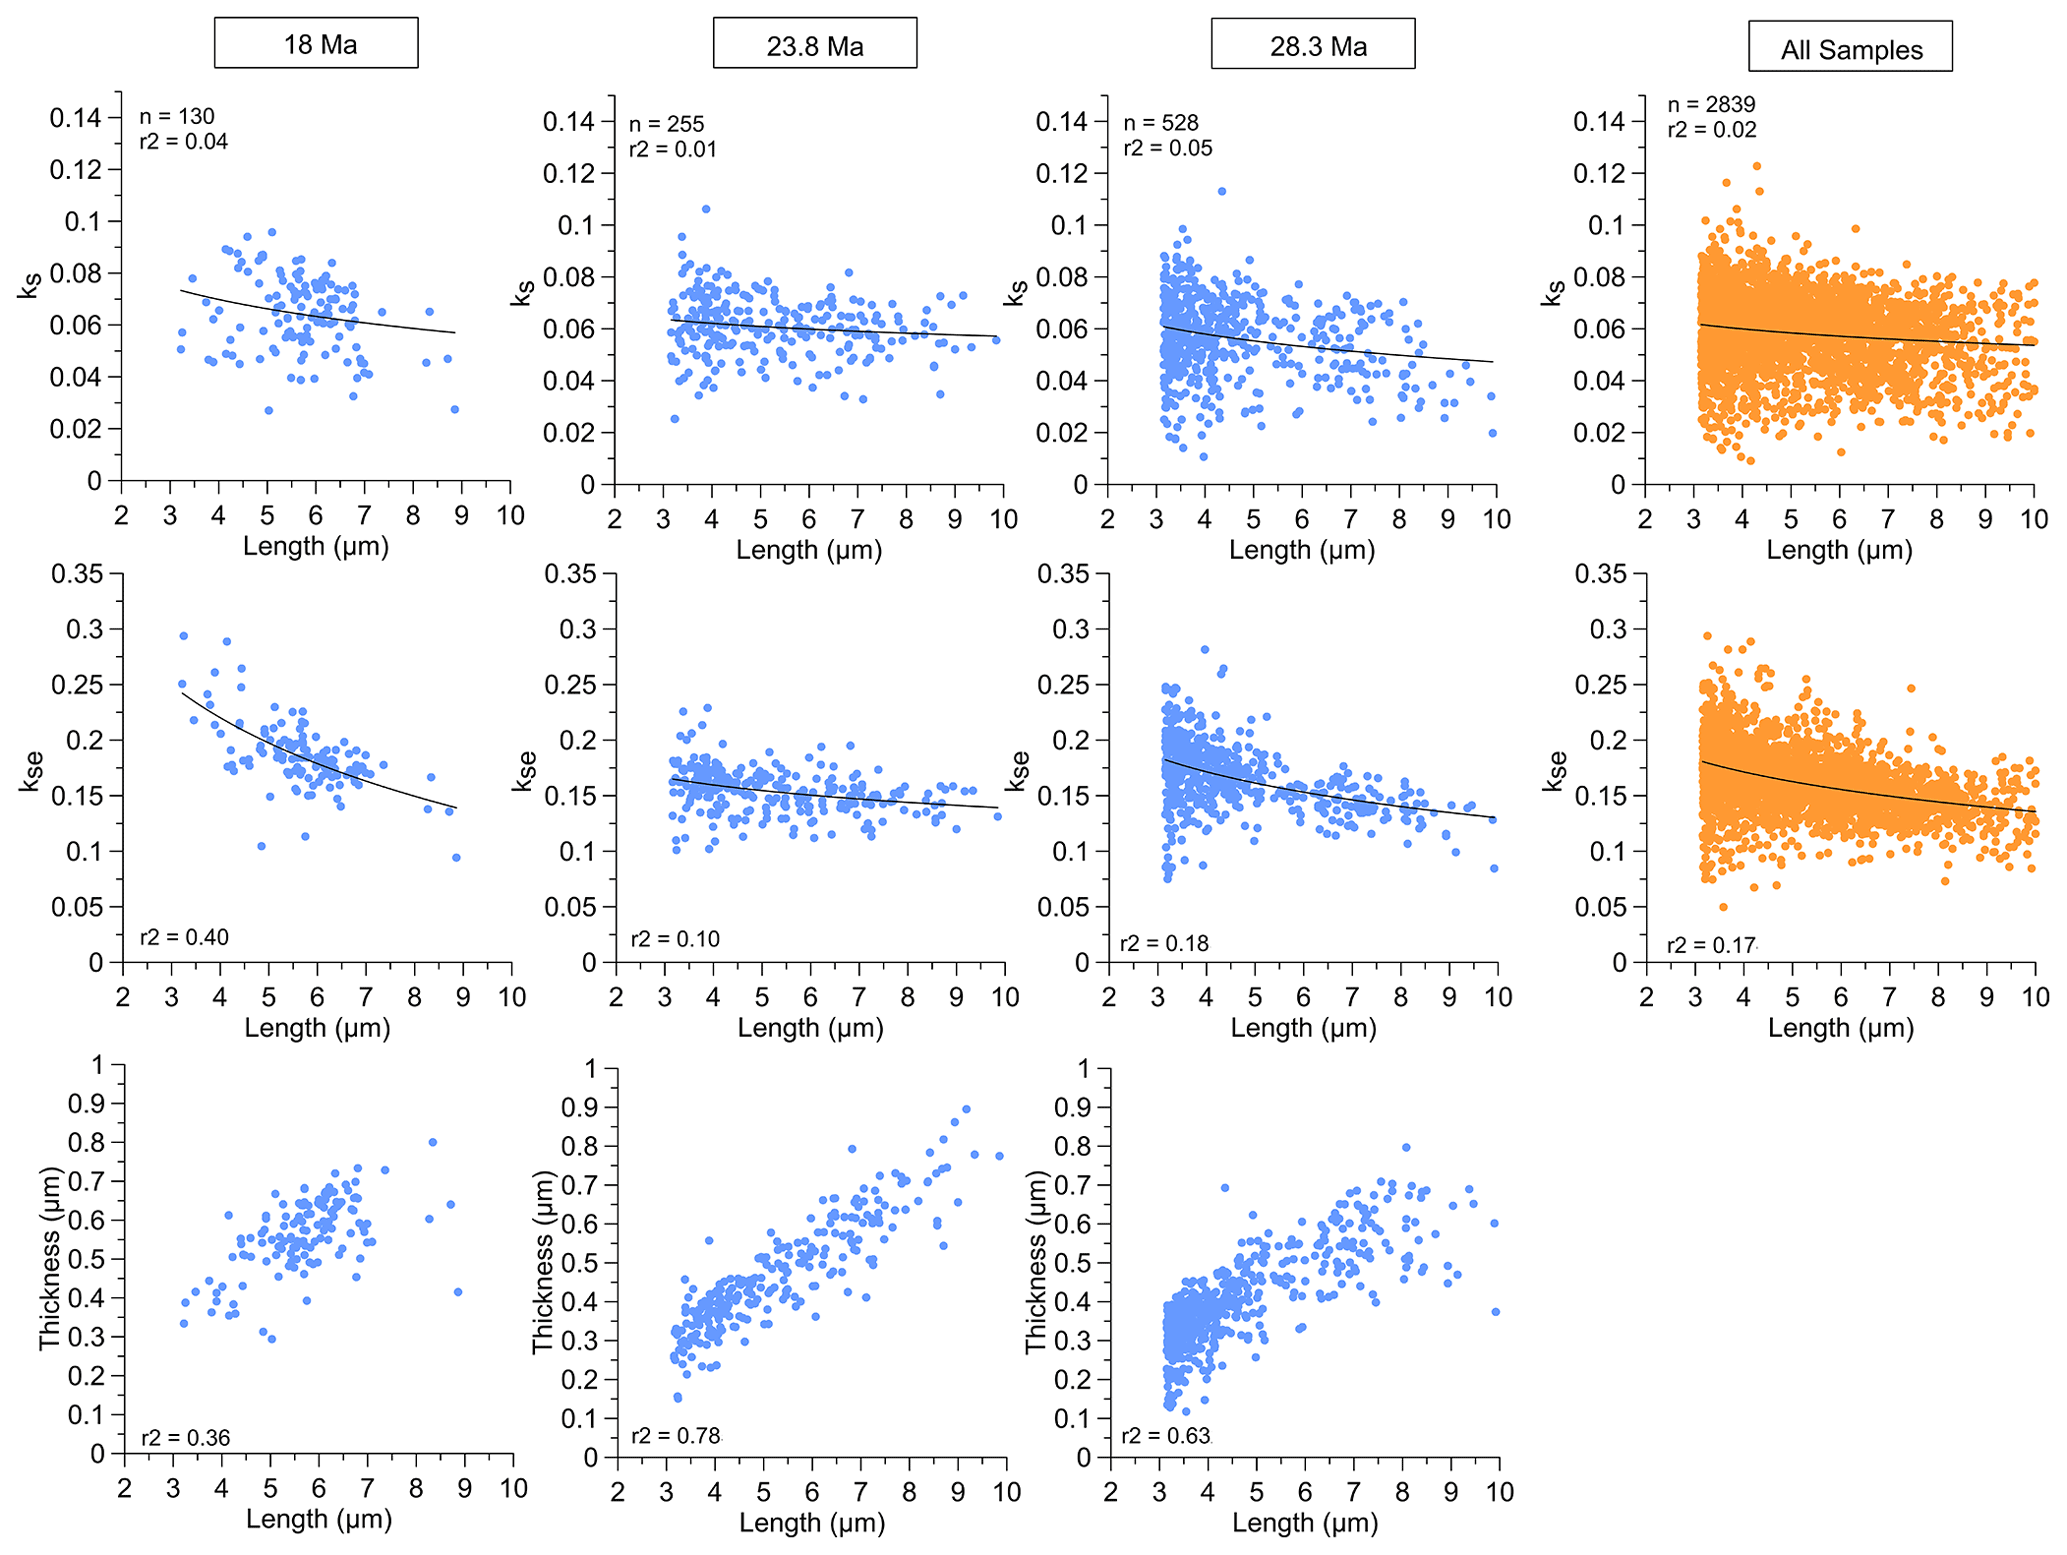
Figure 5Relationship among ks, kse, and thickness with length (shown from 3 to 10 µm to illustrate a comparable length range for all sites) for “reticulofenestrid” populations from samples of three representative ages and the total over all samples (note that the relationship between thickness and length for all samples is shown in Fig. 4).
4.3 Indicators of coccolith calcification and relationship to preservation
To evaluate temporal trends through the Oligocene–Early Miocene, we assess the median morphometric parameters of each of the 11 analyzed samples (Table S1). We examine the median as an index which is very insensitive to outliers. The median differs little from the mean, and the large (>200) populations examined yield relatively narrow confidence intervals around the mean.
The median shape factor calculated relative to a cube (ks) and the shape factor calculated relative to an ellipsoid (kse) are highly but imperfectly correlated (Fig. 6; r=0.72), suggesting that ks is influenced by changes in the degree of circularity of the coccoliths over the sample set. Consequently, hereafter we rely predominantly on the kse metric.
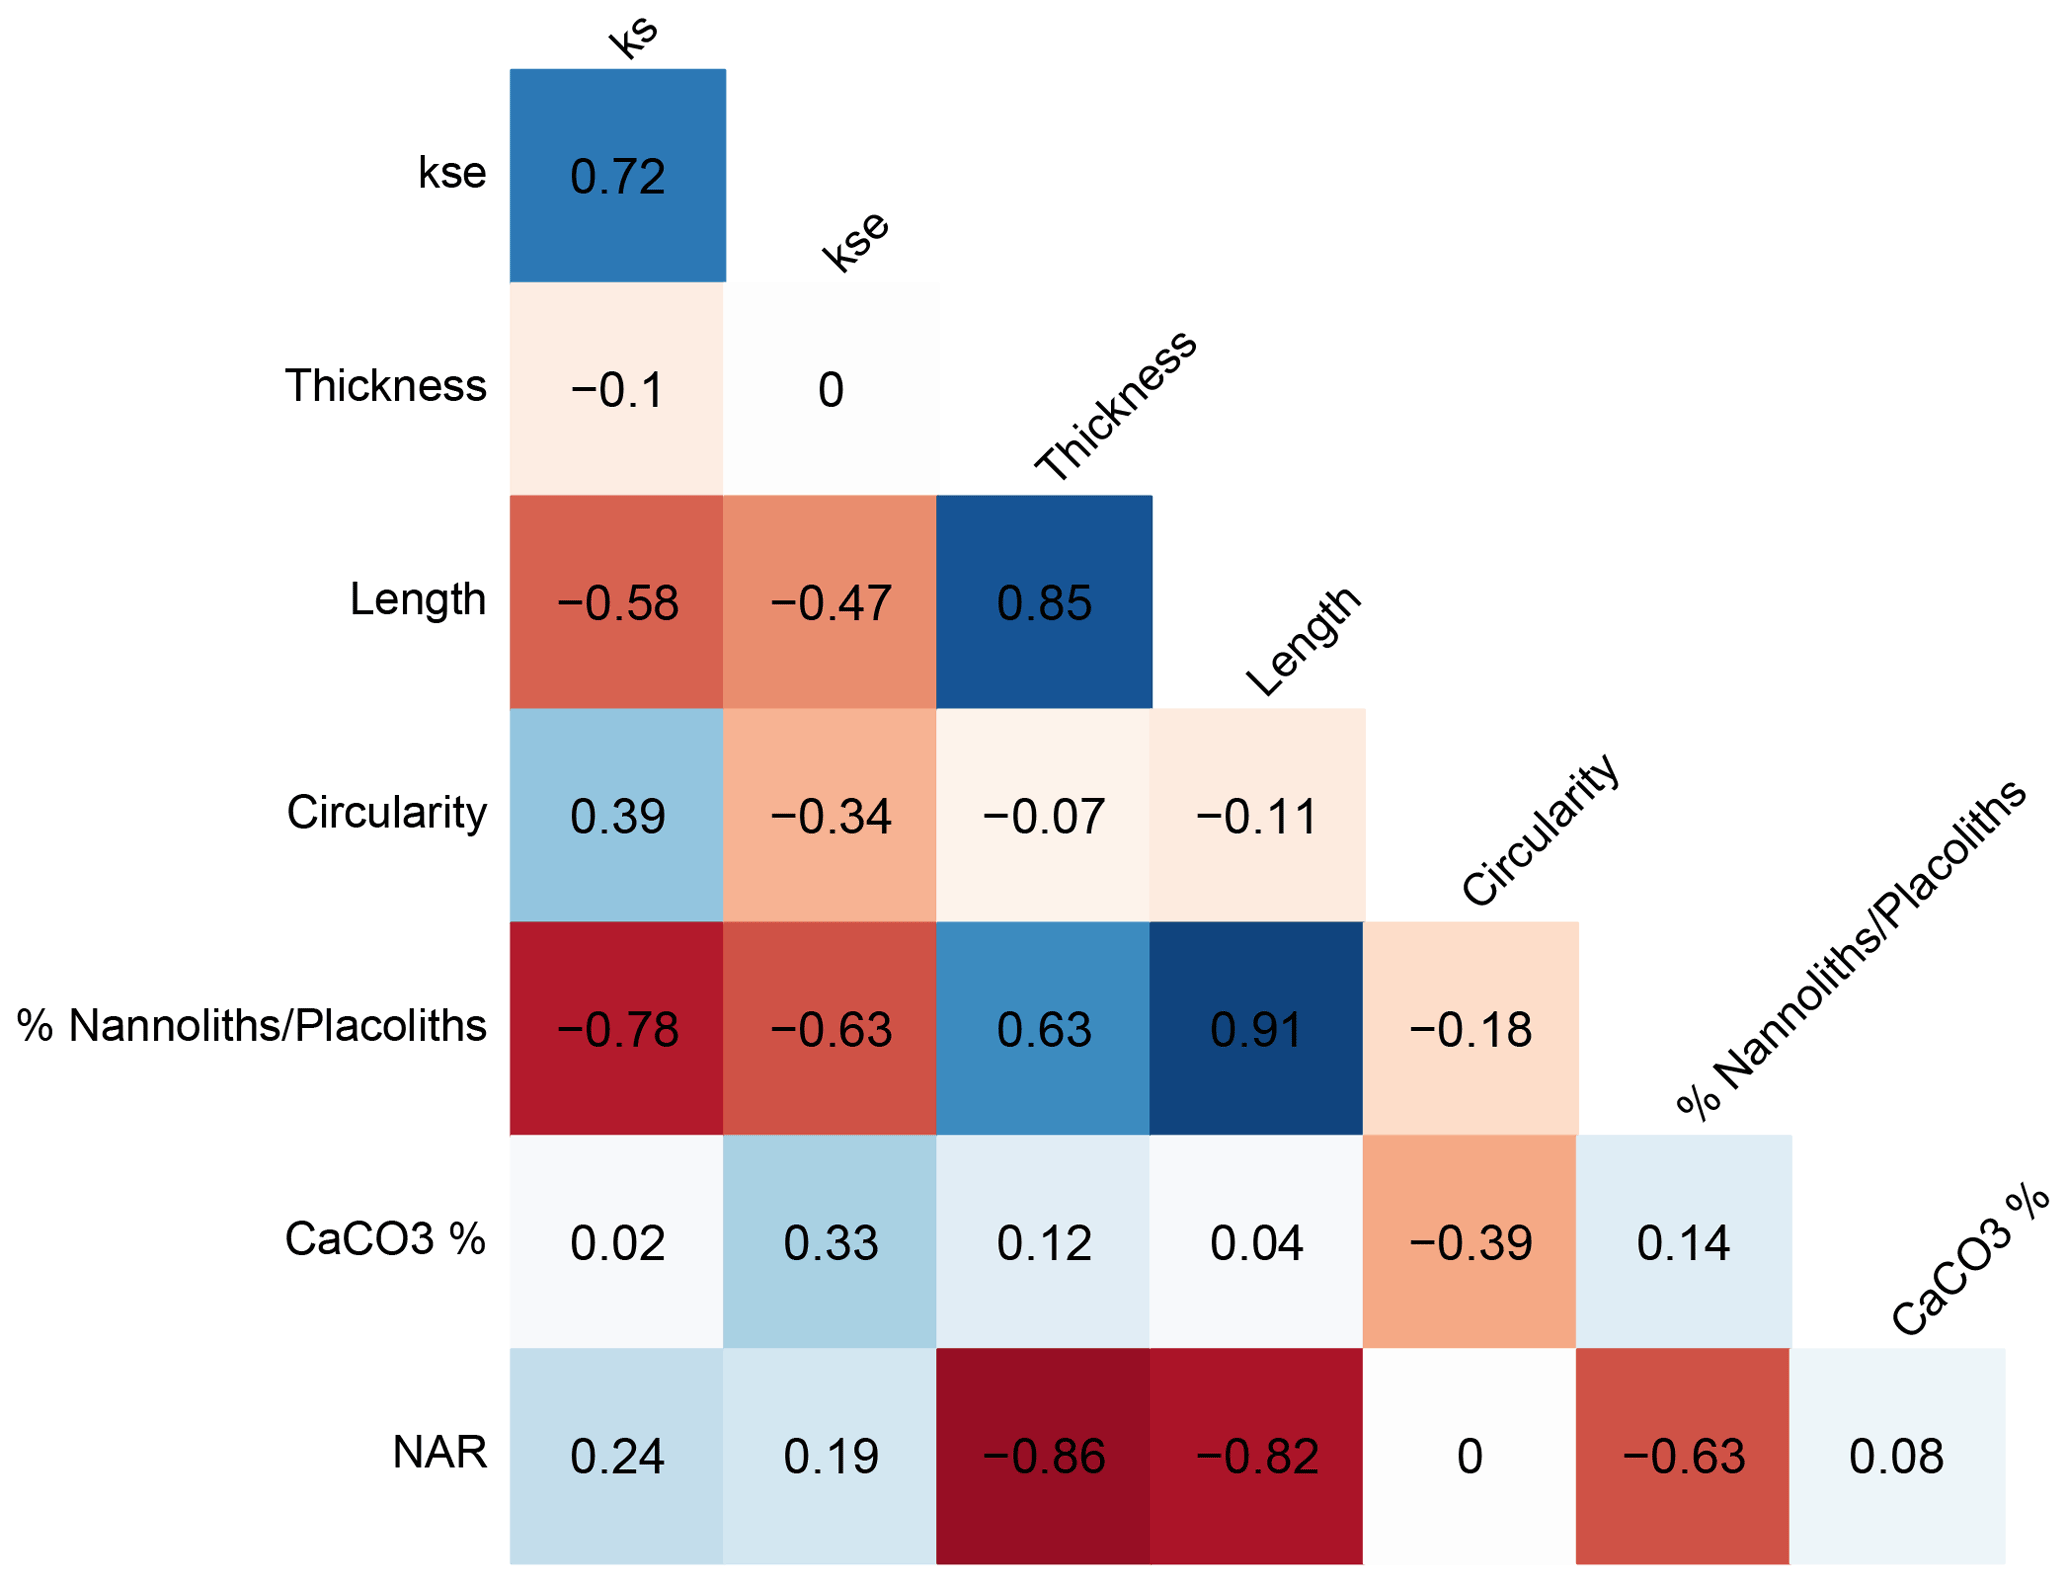
Figure 6Cross correlation of temporal changes in median geometrical indicators for the 11 studied intervals.
Because of significant temporal trends in the size of “reticulofenestrids” (Guitián et al., 2020), temporal variations in the thickness of coccoliths may reflect changes in population mean size. The temporal variations in thickness are uncorrelated with the shape factors ks or kse (r<0.1 and p>0.1), suggesting different controls on the two indices. Trends in thickness of the whole size population are dominantly an expression of changing coccolith length; the temporal changes in thickness are highly correlated (r=0.85) with variation in the coccolith length. Even when considering only the population of coccoliths with lengths between 3.5 and 4.5 µm, the temporal trend in thickness still shows significant modest correlation (Table S2, r=0.63) with the length. For this subset the common effect of shape on thickness is evident: across the samples from 11 age intervals, the median thickness of coccoliths is significantly correlated with the median kse (Table S2, r=0.78) and strongly correlated (r=0.81) with kse of the full population of coccoliths.
Several factors may contribute to temporal changes in kse: (a) the primary coccolith biomineralization, (b) secondary dissolution that might reduce the coccolith thickness or preferentially dissolve small coccoliths, and (c) secondary overgrowth which might increase coccolith thickness. Because the carbonate content is low at IODP Site 1406 due to the high detrital clay and silt components, preservation of nannofossils is generally excellent (Norris et al., 2014), with no significant overgrowth described. In pelagic settings, low CaCO3 percentage can be an indicator of dissolution, and a positive correlation between kse and the CaCO3 content of sediment might be expected if dissolution were a significant control on both parameters or if higher CaCO3 content in sediment conditions greater diagenetic overgrowth. We find no significant correlation between kse and the CaCO3 content (Fig. 6). However, the CaCO3 ranges only between 35 % and 46 % in our examined samples, and these minor variations may be controlled not by dissolution but rather by dilution with detrital minerals, from either lateral transport or rivers draining to the shelf. Nannofossil accumulation rate (NAR) is inversely correlated with thickness but not kse. NAR is also inversely correlated with length, suggesting a lower accumulation rate when large cells dominate the population. We suggest that for IODP Site 1406 sediments, the nannofossil assemblage may be the most robust dissolution indicator because nannoliths such as Discoaster and Sphenolithus are more dissolution resistant than placoliths like Reticulofenestra and Coccolithus (Gibbs et al., 2004). The following nannolith / placolith ratio was calculated:
This ratio is inversely correlated with kse (Fig. 6; ), indicating a high relative abundance of nannoliths coinciding with reduced calcification volume, potentially consistent with increased dissolution thinning coccoliths. The highest nannolith placolith ratio, as well as the most intense dissolution, is inferred from the Early Miocene (here 18.4 to 18.8 Ma on the timescale of Guitián et al., 2019). This interval has been recognized as a significant hiatus in carbonate-rich pelagic sections globally, inferred to reflect a global dissolution event (Sibert and Rubin, 2021). We therefore cautiously consider most robust the temporal variations in coccolith thickness which occurs in samples with a low relative abundance of nannoliths (e.g., <2 %; for which the correlation between nannolith percent and kse becomes insignificant).
4.4 Temporal trends in Reticulofenestra calcification and relationship to environmental factors
kse decreases during the oldest three samples from the early to middle Oligocene. From there, excluding from consideration the samples suspected as affected significantly by dissolution, values appear to progressively increase to attain 30 % greater kse in the Early Miocene 18 Ma sample (Fig. 7). The Oligocene–Miocene transition (OMT, 23 Ma) exhibits a local maximum in kse. The middle Oligocene minimum kse coincides with the lowest sea surface temperature (SST) (Guitián et al., 2019), but overall there is not a strong correlation between kse and SST (r=0.46); for example similar low SST in the Early Miocene around 20 Ma coincides with a higher kse value. These changes in kse reflect changes in the CaCO3 content of coccoliths, which is not dependent on size scaling of the lith (coccolith) or cell.
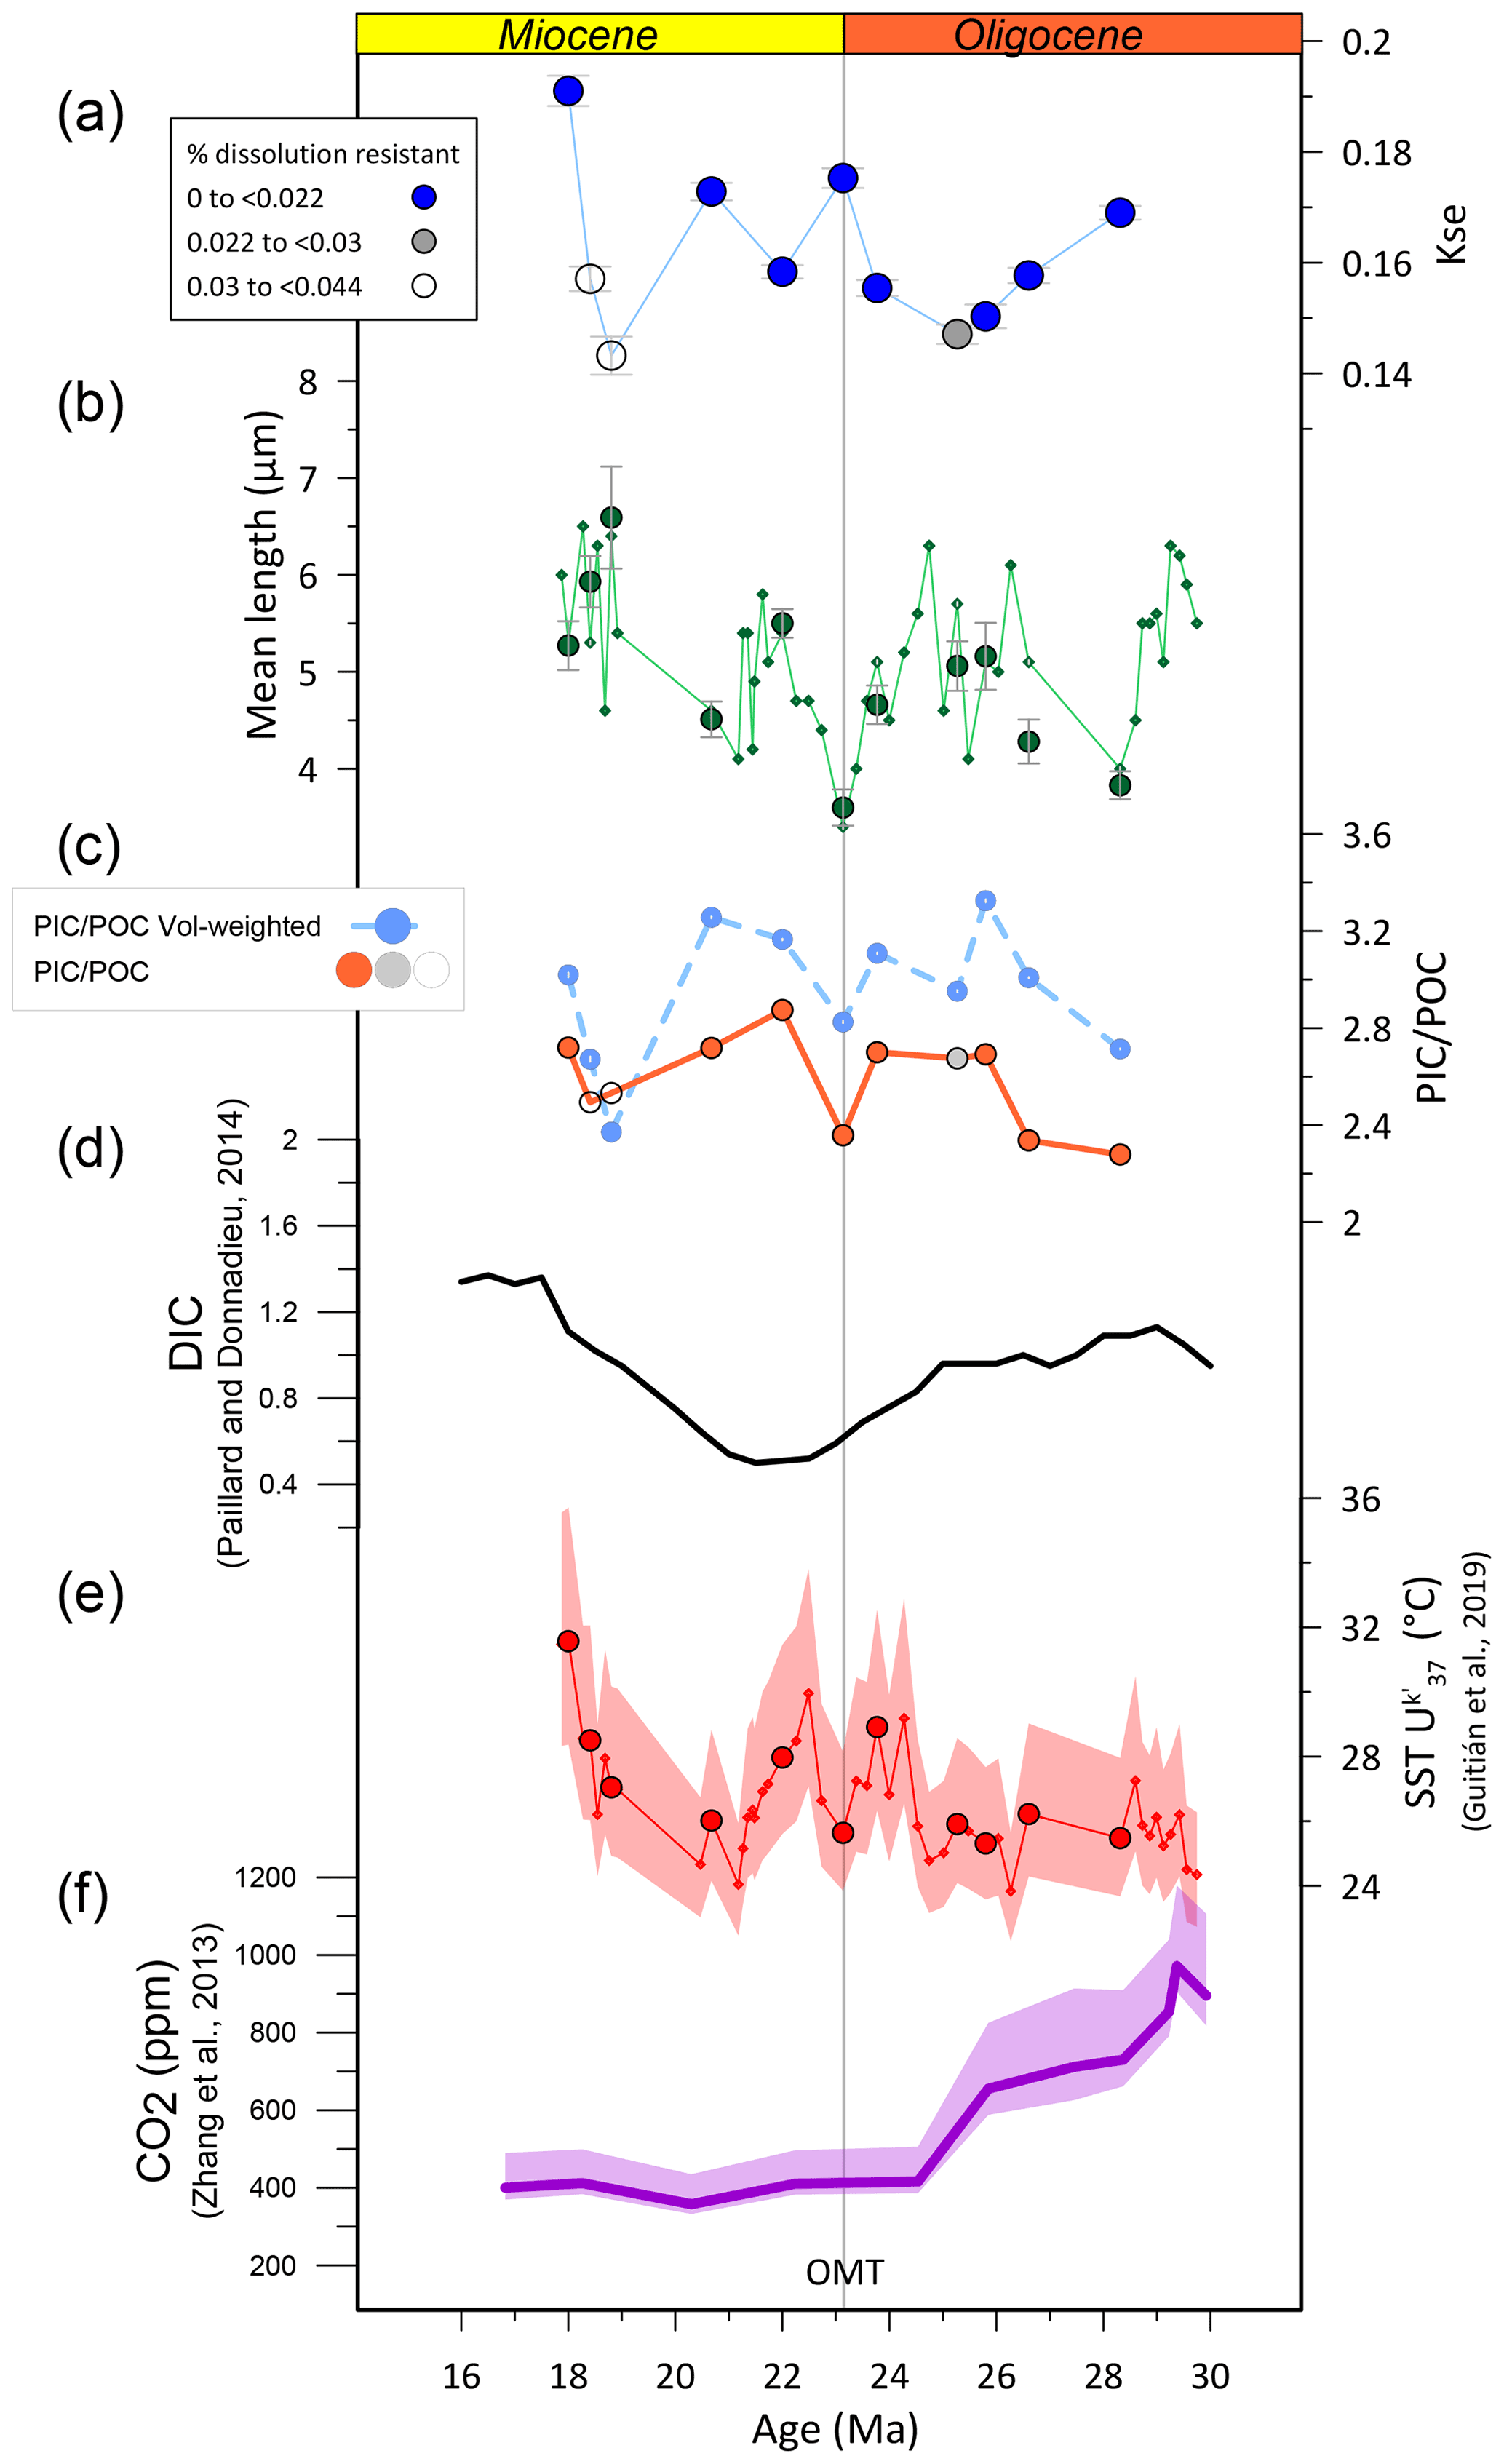
Figure 7Temporal trend in Reticulofenestra median coccolith kse vs. other morphological and environmental parameters. (a) Median Reticulofenestra kse. Symbols are coded to indicate the relative abundance of dissolution-resistant nannofossils, with filled blue symbols denoting the populations which may be least affected by dissolution. (b) Length of samples examined in this study (median, large green symbol) and mean size in a higher resolution previously published (Guitián et al., 2020) in small symbols. (c) Estimated PIC POC ratio (particulate inorganic carbon to particulate organic carbon) for the assumptions described in the text. The darker symbol indicates the calculation for the median thickness and length, with filled orange symbols for the higher relative abundance of dissolution-resistant nannofossils. The light-blue symbol and line denote the estimated population PIC POC ratio, which is weighted by the size distribution as discussed in Guitián et al. (2020). (d) Estimated ocean dissolved inorganic carbon (DIC) concentration from Paillard and Donnadieu (2014). (e) Sea surface temperature (SST) estimated from the alkenone unsaturation index, from Guitián et al. (2019). (f) Estimated atmospheric CO2 from Zhang et al. (2013).
The factors driving changes in kse remain under investigation from a variety of approaches that bear on different aspects of calcification, considering both the organism level factors promoting calcification to the ecosystem-scale costs and benefits of calcification. At the organism level, from an experimental manipulation approach, culture experiments examine the response of clonal strains to a range of potential variables, which may be individually manipulated. Meta-analysis of a wide array of E. huxleyi culture experiments suggests that high pH and high HCO concentration both stimulate higher calcification rates (Bach et al., 2015); the calcification rate is dependent on the cell division rate as well as the degree of cellular calcification. Consistent with this evidence, the degree of calcification, expressed as calcite per cell surface area, at constant CO2[aq], increased with both increasing pH and increased alkalinity in culture experiments of E. huxleyi (Bach et al., 2015; see Fig. S9 in Bolton et al., 2016). One potential caveat is that the morphology of different coccolith strains differs, and if the morphology of coccoliths is genetically controlled, such experiments may exhibit more limited plasticity compared to that observed in diverse populations in which selection also influences calcification. From isotopic tracers and observation of long-term decline in cellular calcification and CO2 over the last 14 million years, it has been proposed that when CO2[aq] is limiting, calcification may be reduced because there may be a competitive reallocation of HCO from calcification to carbon concentrating mechanisms supporting photosynthesis (Bolton et al., 2016). However, the potential role for changing dissolved inorganic carbon (DIC) or HCO concentrations was not independently constrained in this study. Collectively, these previous culture and Miocene–present observations generally suggest that higher kse values may be favored by higher seawater pH and/or higher DIC or HCO and/or higher CO2[aq]. Alkenone-based pCO2 records have suggested a pCO2 decline from the early Oligocene to the Early Miocene (Zhang et al., 2013), so the general increase in kse is not consistent with direct forcing by increased pCO2 according to published pCO2 proxies (Fig. 7). Estimates of seawater pH from boron isotopes do not span this Oligocene interval (Rae et al., 2021) and so cannot be used to test if an increase in seawater pH coincides with increased kse. Estimations of DIC from the amplitude of deep-ocean carbon isotopes are low resolution and suggest minimum DIC in the latest Oligocene and an increase into the Early Miocene, only partially matching the trends in thickness data (Paillard and Donnadieu, 2014).
At the ecosystem scale, the advantages and costs of calcification may also exert selective pressure on kse. High calcification is a potential cost for large coccolithophores sinking out of the euphotic zone in weakly mixed environments (Monteiro et al., 2016). The large (7–9 µm in length) Oligocene Reticulofenestra have ks in the range of 0.06, similar to modern ks (0.06 to 0.08) calculated for large Coccolithus pelagicus or Calcidiscus leptoporus (Young and Ziveri, 2000). This suggests a similar range of sinking velocities. It is possible that temporal changes in stratification and mixing intensity in the surface waters at the IODP Site 1406 location in the Oligocene to Early Miocene could have contributed to temporal changes in kse. However, at this time we do not have independent proxy for water column stratification changes over time to test this hypothesis.
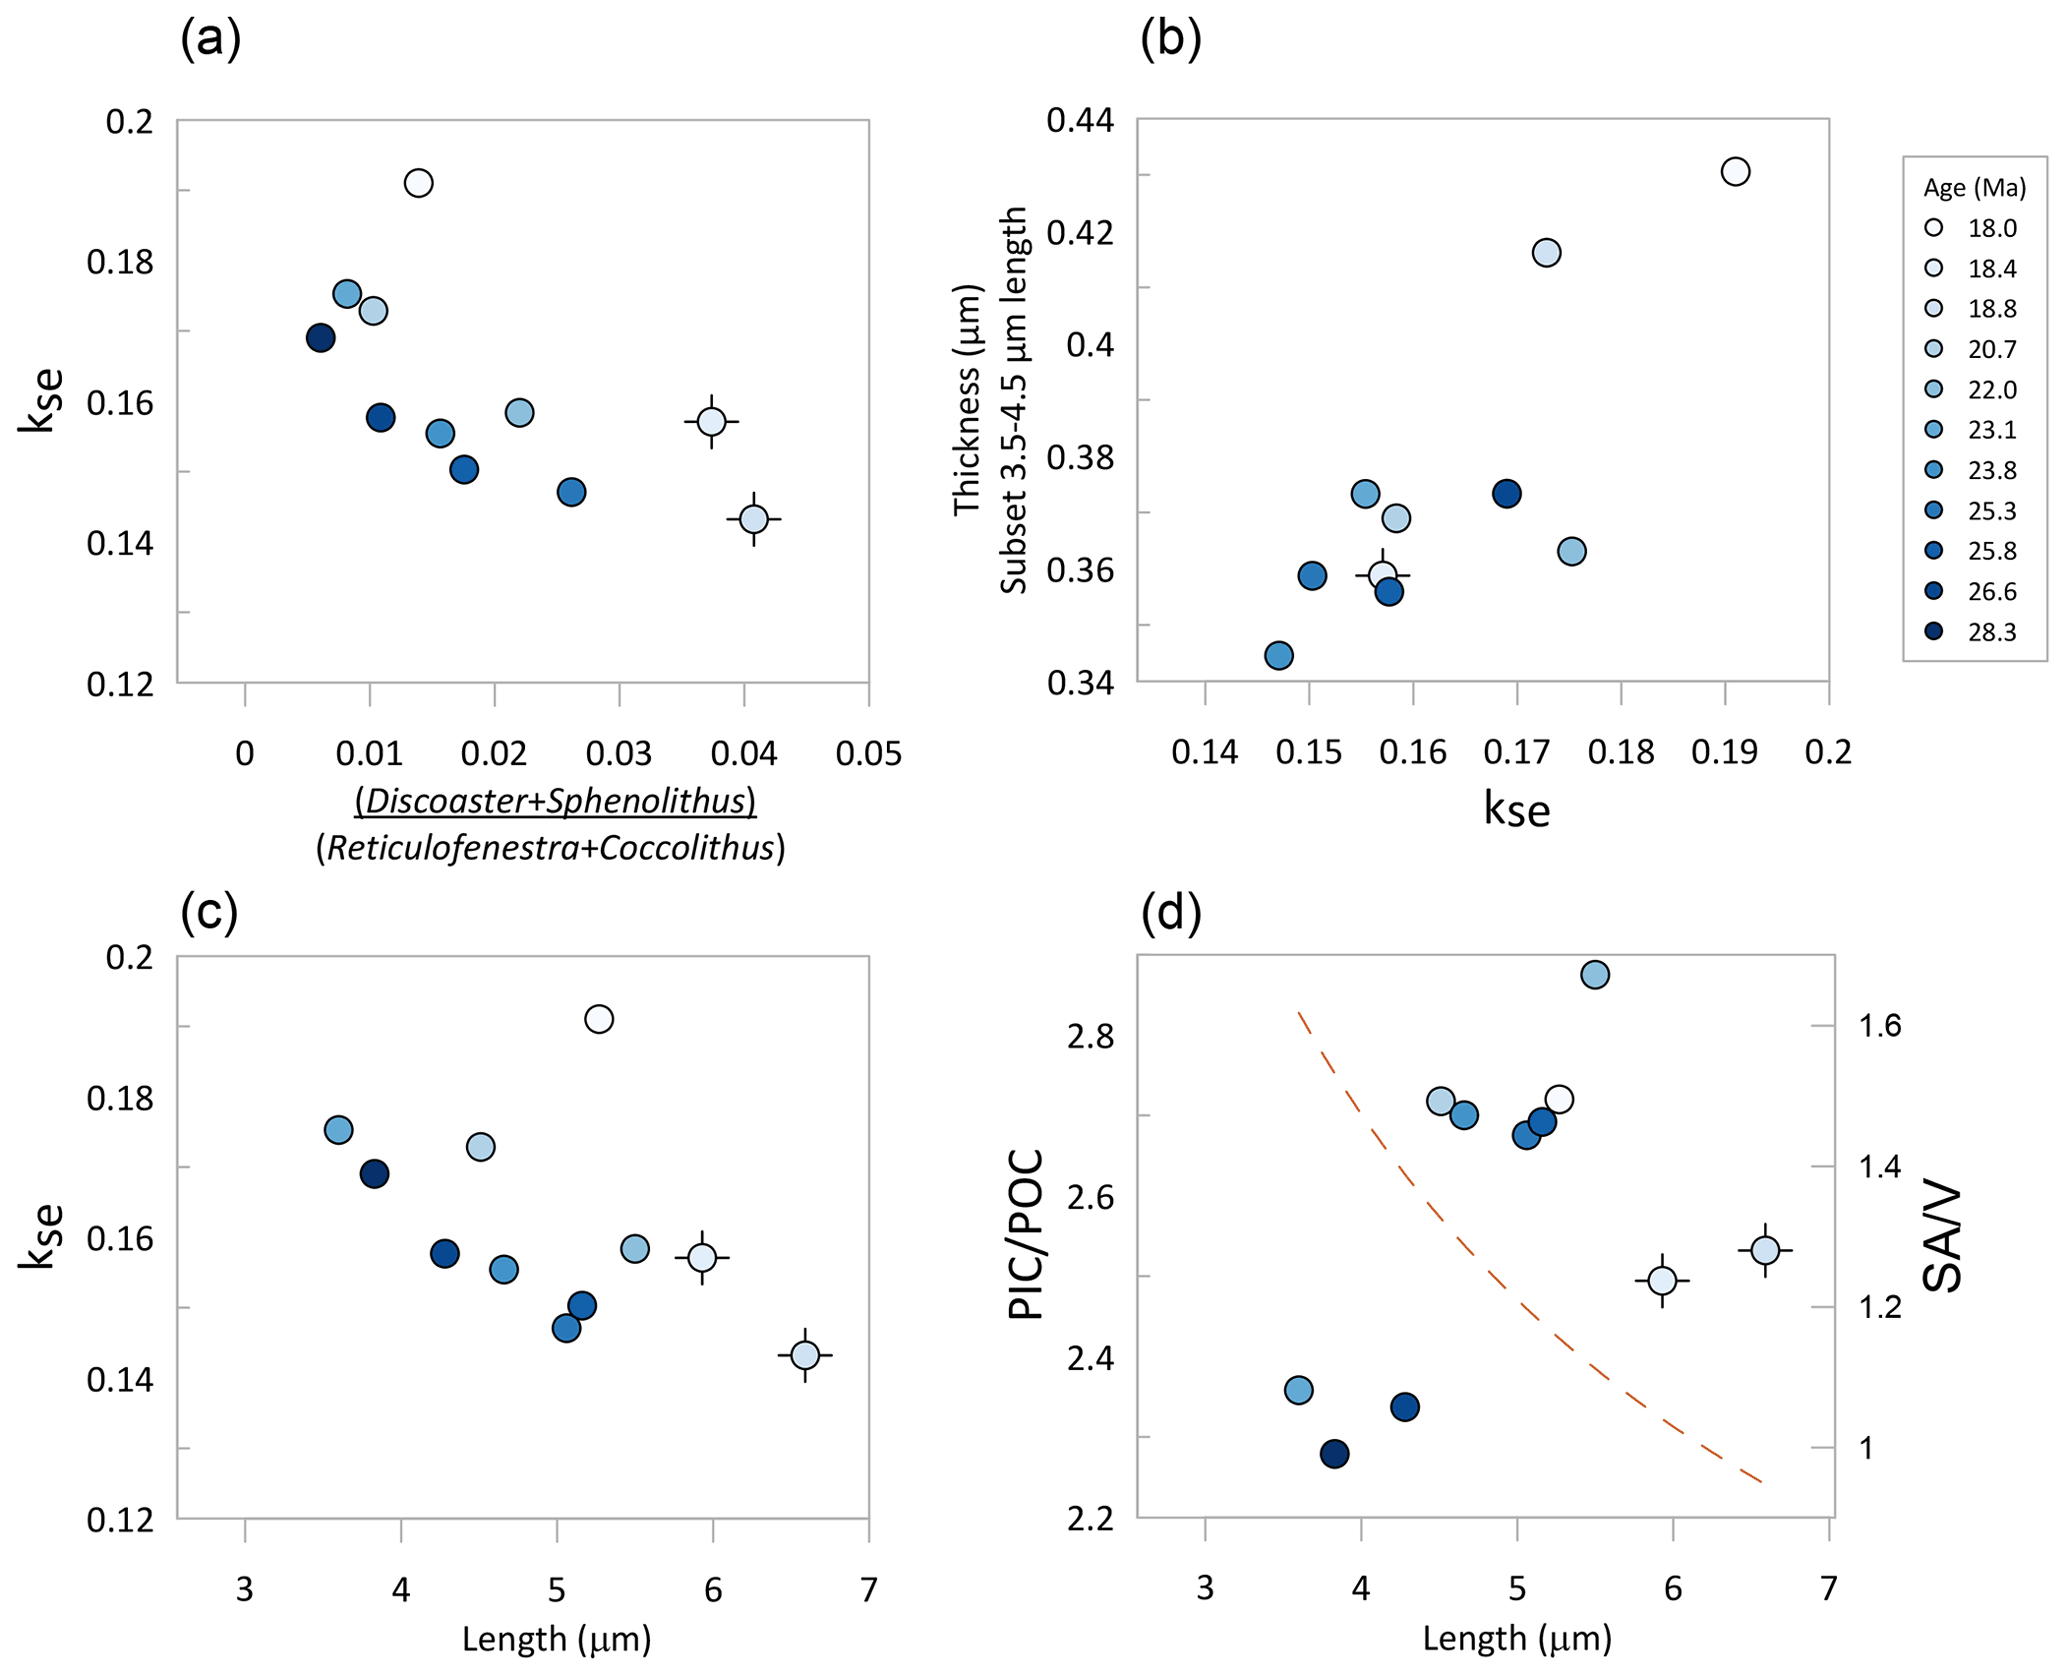
Figure 8Relationship among median “reticulofenestrids” morphological parameters of the 11 populations examined. (a) Relative abundance of dissolution-resistant taxa vs. Reticulofenestra kse. (b) Median thickness of all Reticulofenestra with length between 3.5 and 4.5 µm and kse. (c) Median kse vs. median length. (d) Estimated PIC POC ratio for the assumptions described in the text vs. length. The dashed brown line indicates the decrease in the ratio of surface area to volume (SA V) of a spherical cell corresponding to the diameter estimated from the median lith length. In all panels, the symbol color indicates the age of examined sediment. The black cross beneath the symbol indicates samples with dissolution-resistant taxa exceeding 3 %.
Finally, we examine the temporal variation in kse in the context of inferred variation in lith and cell size (Fig. 8). A null hypothesis is that size does not affect shape; i.e., the coccolith of a given shape has an identical ks or kse regardless of length. However, adaptation of cells to the biological advantages and disadvantages of larger or smaller sizes and concomitant changes in surface area to volume ratios may entail adaptation of the degree of calcification, which may be manifest as a trend in kse with size. Comparing the median kse and length of each of the 11 samples, we observe a general decrease in kse with an increase in mean length (Fig. 8c), with the 18 Ma sample as a clear exception. This relationship suggests that populations with larger cells have decreased the degree of calcification. Previously, coccolith length in this site was hypothesized to respond directly to the CO2 selective pressure, with larger coccoliths and cell sizes facilitated by higher CO2 concentrations (Guitián et al., 2020). If this interpretation is correct, it might imply decreased calcification under periods of higher CO2, but a more rigorous evaluation would require a direct pCO2 indicator.
4.5 Implication of a variable PIC POC ratio of dominant coccolithophores
We evaluate whether data on the coccolith thickness and shape factor can be used to estimate temporal trends in the ratio of particulate inorganic (calcite) carbon to organic carbon (PIC POC) of coccolithophores. The PIC POC ratio is surmised to be important factor determining the role of coccolith export fluxes in the ocean's carbon cycle (Barker et al., 2003). Additionally, it has been proposed to be an important factor in the interpretation of coccolithophore-derived geochemical proxies (McClelland et al., 2017). It is difficult to estimate the PIC POC ratio from fossil assemblages in which coccoliths are almost universally detached from the coccosphere, but we examine possible constraints.
Because coccolithophores are not characterized by large vacuoles, the organic carbon quota can be estimated from the cell volume, in turn estimated from coccolith length. Here, we apply the formula to estimate cell diameter from coccolith length (Henderiks, 2008):
We employ the regression for organic carbon from
Generally, as cell size increases in a given genera, it is the size of the coccoliths, rather than the number of liths per cell, which increases (Henderiks, 2008). Consequently, if the number of coccoliths per cell were relatively constant on fossil Reticulofenestra, then the PIC per cell would be the product of the mass of each individual coccolith and the number of coccoliths per cell. This is consistent with the correlation of coccolith thickness and PIC per cell in cultures of extant coccolithophores (Bolton et al., 2016). Our absolute values of PIC per cell are derived from assuming 12 coccoliths per cell, within the range of extant Gephyrocapsa, but use of a different number would not change the trends. In this way, we estimate the trend of variation in median PIC POC ratios resulting from the variation in inferred cell size and coccolith mass (Fig. 7). Additionally, to account for the disproportionate impact of larger cells on the population, we also calculate a cell-volume-weighted median PIC POC ratio as was previously done for coccolith mean length (Guitián et al., 2020).
According to this estimation, the variations in the Reticulofenestra PIC POC ratio were modest, ranging from 2.28 to 2.87, indicating a 26 % higher PIC POC ratio in the Early Miocene than in the middle Oligocene. The lowest PIC POC ratio is inferred for the cold periods of the Middle Oligocene Glacial Interval and the OMT (Figs. 7 and 8). Among the populations featuring limited dissolution (percentage of nannolith placolith ≤2.2 %), the mean estimated PIC POC ratio correlates positively with major axis length. If covered by a uniform thickness of calcite, larger cells would have a lower PIC POC ratio, owing to the 30 % decrease in cell surface area to volume ratios over this cell diameter range, a response observed in some clonal culture experiments in which coccolith morphology varies little (Bolton et al., 2016). These results highlight that coccolith thickness estimates, in addition to cell diameter, are required to predict PIC POC ratios of fossil communities.
We implement a precise and reproducible calibration routine in the C-Calcita software to enable robust estimations of coccolith thickness over the range 0 to 3.1 µm, the largest calibration range of any technique yet reported. This approach can be applied to any microscope configuration with circular polarization when a suitable range of calibration points is defined on a calcite wedge.
Application of this method provides the first evaluation of the thickness and shape factor of coccoliths from the Oligocene to Early Miocene. In this age interval, we find that median thickness is highly correlated with coccolith length, and we adopt the elliptical shape factor (kse) as a metric which more accurately describes the differences in the degree of calcification of a coccolith of a given length. kse is inversely correlated with the relative abundance of dissolution-resistant nannoliths, suggesting that greater dissolution may lead to partial dissolution of coccoliths and lower shape factors. Therefore, we suggest that future evaluations of coccolith thickness and kse should include an assessment of variation in dissolution intensity. By comparing kse among samples which likely experienced similar dissolution intensity, this study highlights for the first time a significant evolution in the degree of calcification of coccolithophores of given sizes. We identify that the middle Oligocene was characterized by the lowest kse and the late Early Miocene was characterized by the highest kse. While the Miocene peak is coincident with the maximum in inferred ocean DIC concentration, the long-term trend appears to correlate with size decrease and is not in agreement with the existing DIC or CO2[aq] variation; this is thus a relationship worthy of further exploration.
Data generated for this study are presented in Table S1 and stored in a Zenodo public repository (https://doi.org/10.5281/zenodo.6341696, Guitián et al., 2022).
The supplement related to this article is available online at: https://doi.org/10.5194/bg-19-5007-2022-supplement.
MAF developed the algorithms, implemented them in C-Calcita, and applied them to classified coccoliths. JG prepared and calibrated the calcite wedge, prepared slides, took images, and classified coccoliths for processing. IHA oversaw the processing of some additional samples and assisted with statistics and the elaboration of figures. HS conceived of the calcite wedge calibration and interpreted the morphometric data resulting from the application of the algorithm. HS and JG wrote the paper with input from MAF and feedback from all authors.
The contact author has declared that none of the authors has any competing interests.
Publisher’s note: Copernicus Publications remains neutral with regard to jurisdictional claims in published maps and institutional affiliations.
Sediment samples were provided by the Integrated Ocean Drilling Program (IODP). Authors thank Remy Lüchinger from ETH Zurich for calcite wedge manufacturing.
This study was supported by the Swiss National Science Foundation (award no. 200021_182070 to Heather Stoll).
This paper was edited by Tina Treude and reviewed by three anonymous referees.
Alcantarilla, P. F., Bartoli, A., and Davison, A. KAZE Features, in: Computer Vision – ECCV 2012, edited by: Fitzgibbon, A., Lazebnik, S., Perona, P., Sato, Y., and Schmid, C., ECCV 2012, Lecture Notes in Computer Science, vol 7577, Springer, Berlin, Heidelberg, https://doi.org/10.1007/978-3-642-33783-3_16, 2012.
Bach, L. T., Riebesell, U., Gutowska, M. A., Federwisch, L., and Schulz, K. G.: A unifying concept of coccolithophore sensitivity to changing carbonate chemistry embedded in an ecological framework, Prog. Oceanogr., 135, 125–138, 2015.
Barker, S., Higgins, J. A., and Elderfield, H.: The future of the carbon cycle: review, calcification response, ballast and feedback on atmospheric CO2, Philos. T. Roy. Soc. London A, 361, 1977–1999, 2003.
Beaufort, L.: Weight estimates of coccoliths using the optical properties (birefringence) of calcite, Micropaleontology, 51, 289–297, 2005.
Beaufort, L., Probert, I., de Garidel-Thoron, T., Bendif, E. M., Ruiz-Pino, D., Metzl, N., Goyet, C., Buchet, N., Coupel, P., and Grelaud, M.: Sensitivity of coccolithophores to carbonate chemistry and ocean acidification, Nature, 476, 80–83, 2011.
Beaufort, L., Gally, Y., Suchéras-Marx, B., Ferrand, P., and Duboisset, J.: Technical note: A universal method for measuring the thickness of microscopic calcite crystals, based on bidirectional circular polarization, Biogeosciences, 18, 775–785, https://doi.org/10.5194/bg-18-775-2021, 2021.
Bollmann, J.: Morphology and biogeography of Gephyrocapsa coccoliths in Holocene sediments, Mar. Micropaleontol., 29, 319–350, 1997.
Bollmann, J.: Technical Note: Weight approximation of coccoliths using a circular polarizer and interference colour derived retardation estimates – (The CPR Method), Biogeosciences, 11, 1899–1910, https://doi.org/10.5194/bg-11-1899-2014, 2014.
Bolton, C. T., Hernandez-Sanchez, M. T., Fuertes, M. A., Gonzalez-Lemos, S., Abrevaya, L., Mendez-Vicente, A., Flores, J. A., Probert, I., Giosan, L., Johnson, J., and Stoll, H. M.: Decrease in coccolithophore calcification and CO2 since the middle Miocene, Nat. Commun., 7, 10284, https://doi.org/10.1038/ncomms10284, 2016.
Cubillos, J. C., Henderiks, J., Beaufort, L., Howard, W. R., and Hallegraeff, G. M.: Reconstructing calcification in ancient coccolithophores: Individual coccolith weight and morphology of Coccolithus pelagicus (sensu lato), Mar. Micropaleontol., 92, 29–39, 2012.
Dedert, M., Stoll, H., Kars, S., Young, J. R., Shimizu, N., Kroon, D., Lourens, L., and Ziveri, P.: Temporally variable diagenetic overgrowth on deep-sea nannofossil carbonates across Palaeogene hyperthermals and implications for isotopic analyses, Mar. Micropaleontol., 107, 18–31, 2014.
Flores, J. and Sierro, F.: Revised technique for calculation of calcareous nannofossil accumulation rates, Micropaleontology, 43, 321–324, 1997.
Fuertes, M.-Á., Flores, J.-A., and Sierro, F. J.: The use of circularly polarized light for biometry, identification and estimation of mass of coccoliths, Mar. Micropaleontol., 113, 44–55, 2014.
Gibbs, S. J., Shackleton, N. J., and Young, J. R.: Identification of dissolution patterns in nannofossil assemblages: A high-resolution comparison of synchronous records from Ceara Rise, ODP Leg 154, Paleoceanography, 19, PA1029, https://doi.org/10.1029/2003PA000958, 2004.
González-Lemos, S., Guitián, J., Fuertes, M.-Á., Flores, J.-A., and Stoll, H. M.: Technical note: An empirical method for absolute calibration of coccolith thickness, Biogeosciences, 15, 1079–1091, https://doi.org/10.5194/bg-15-1079-2018, 2018.
Guitián, J., Phelps, S., Polissar, P. J., Ausín, B., Eglinton, T. I., and Stoll, H. M.: Midlatitude Temperature Variations in the Oligocene to Early Miocene, Paleoceanogr. Paleoclimatol., 34, 1328–1343, 2019.
Guitián, J., Dunkley Jones, T., Hernández-Almeida, I., Löffel, T., and Stoll, H. M.: Adaptations of coccolithophore size to selective pressures during the Oligocene – Early Miocene high CO2 world, Paleoceanogr. Paleoclimatol., 35, e2020PA003918, https://doi.org/10.1029/2020PA003918, 2020.
Guitián, J., Ángel Fuertes, M., Flores, J.-A., Hernández-Almeida, I., and Stoll, H.: Variation in the degree of calcification of coccolithophores from IODP 1406, Zenodo [data set], https://doi.org/10.5281/zenodo.6341696, 2022.
Henderiks, J.: Coccolithophore size rules – reconstructing ancient cell geometry and cellular calcite quota from fossil coccoliths, Mar. Micropaleontol., 67, 143–154, 2008.
Henderiks, J. and Pagani, M.: Coccolithophore cell size and the Paleogene decline in atmospheric CO2, Earth Planet. Sci. Lett., 269, 576–584, 2008.
Johnsen, S. L. and Bollmann, J.: Segmentation, retardation and mass approximation of birefringent particles on a standard light microscope, J, Microscopy, 280, 30–50, 2020.
McClelland, H., Bruggeman, J., Hermoso, M., and Rickaby, R.: The origin of carbon isotope vital effects in coccolith calcite, Nat. Commun., 8, 1–16, 2017.
Monteiro, F. M., Bach, L. T., Brownlee, C., Bown, P., Rickaby, R. E., Poulton, A. J., Tyrrell, T., Beaufort, L., Dutkiewicz, S., and Gibbs, S.: Why marine phytoplankton calcify, Sci. Adv., 2, e1501822, https://doi.org/10.1126/sciadv.1501822, 2016.
Norris, R., Wilson, P., and Blum, P.: Proceedings of the Integrated Ocean Drilling Program Exp. 342, College Station, TX: Integrated Ocean Drilling Program, https://doi.org/10.2204/iodp.proc.342.107.2014, 2014.
Paillard, D. and Donnadieu, Y.: A 100 Myr history of the carbon cycle based on the 400 kyr cycle in marine δ13C benthic records, Paleoceanography, 29, 1249–1255, 2014.
Rae, J. W., Zhang, Y. G., Liu, X., Foster, G. L., Stoll, H. M., and Whiteford, R. D.: Atmospheric CO2 over the Past 66 Million Years from Marine Archives, Annu. Rev. Earth Planet. Sci., 49, 599–631, https://doi.org/10.1146/annurev-earth-082420-063026, 2021.
Rost, B. and Riebesell, U.: Coccolithophores and the biological pump: responses to environmental changes, in: Coccolithophores, Springer, 99–125, 2004.
Sibert, E. C. and Rubin, L. D.: An early Miocene extinction in pelagic sharks, Science, 372, 1105–1107, 2021.
Siesser, W.: Calcareous nannoplankton, Fossil Prokaryotes and Protists, edited by: Bown, P. R., Blackwell Scientific Publications Oxford, 321 pp., 169–202, 1993.
Young, J. R.: Neogene nannofossils, in: Calcareous Nannofossil Biostratigraphy, edited by: Bown, P. R., British Micropalaeontological Society Publications Series, Chapman and Hall, London, pp. 225–265 ISBN 9780412789700, 0412789701, 1998.
Young, J. R. and Ziveri, P.: Calculation of coccolith volume and it use in calibration of carbonate flux estimates, Deep Sea Res. Pt. II, 47, 1679–1700, 2000.
Young, J. R., Didymus, J. M., Brown, P. R., Prins, B., and Mann, S.: Crystal assembly and phylogenetic evolution in heterococcoliths, Nature, 356, 516–518, 1992.
Young, J. R., Henriksen, K., and Probert, I.: Structure and morphogenesis of the coccoliths of the CODENET species, in: Coccolithophores, edited by: Thierstein, H. R. and Young, J. R., Springer, Berlin, Heidelberg, https://doi.org/10.1007/978-3-662-06278-4_8, 2004.
Zhang, Y. G., Pagani, M., Liu, Z., Bohaty, S. M., and Deconto, R.: A 40-million-year history of atmospheric CO2, Philos. Trans. A Math. Phys. Eng. Sci., 371, 20130096, https://doi.org/10.1098/rsta.2013.0096, 2013.