the Creative Commons Attribution 4.0 License.
the Creative Commons Attribution 4.0 License.
 | 17 Nov 2022
Effects of water table level and nitrogen deposition on methane and nitrous oxide emissions in an alpine peatland
Wantong Zhang
Zhengyi Hu
Joachim Audet
Thomas A. Davidson
Enze Kang
Xiaoming Kang
Yong Li
Xiaodong Zhang
Jinzhi Wang
Alpine peatlands are recognized as a major natural contributor to the budgets of atmospheric methane (CH4) but as a weak nitrous oxide (N2O) source. Anthropogenic activities and climate change have put these fragile nitrogen (N)-limited peatlands under pressure by altering water table (WT) levels and enhancing N deposition. The response of greenhouse gas (GHG) emissions from these peatlands to these changes is uncertain. To address this knowledge gap, we conducted a mesocosm experiment in 2018 and 2019 investigating individual and interactive effects of three WT levels (WT−30, 30 cm below soil surface; WT0, 0 cm at the soil surface; WT10, 10 cm above soil surface) and multiple levels of N deposition (0, 20, 40, 80 and 160 ) on growing season CH4 and N2O emissions in the Zoige alpine peatland, Qinghai–Tibetan Plateau. We found that the elevated WT levels increased CH4 emissions, while N deposition had nonlinear effects (with stimulation at moderate levels but inhibition at higher levels). In contrast no clear pattern of the effect of WT levels on the cumulative N2O emissions was evident, while N deposition led to a consistent and linear increase (emission factor: 2.3 %–2.8 %), and this was dependent on the WT levels. Given the current N deposition in the Zoige alpine peatland (1.08–17.81 kg N ha−1), our results suggested that the CH4 and N2O emissions from the alpine peatlands could greatly increase in response to the possible doubling N deposition in the future. We believe that our results provide insights into how interactions between climate change and human disturbance will alter CH4 and N2O emissions from this globally important habitat.
- Article
(1019 KB) - Full-text XML
-
Supplement
(699 KB) - BibTeX
- EndNote


Peatlands only cover ca. 3 % of the land surface of the Earth but store one-third of the global carbon pool (Yu et al., 2010). In pristine peatlands, the shallow water table (WT) and waterlogged conditions allow for the accumulation of organic matter and favor anaerobic production of methane (CH4) and nitrous oxide (N2O). Traditionally, this nitrogen-limited ecosystem is recognized as a major CH4 source and a weak N2O source (Frolking et al., 2011). Nevertheless, these conditions could be markedly changed by anthropogenic disturbance and climate change, and growing evidence shows that peatlands are experiencing drainage and increasing nitrogen deposition (Chen et al., 2013; Evans et al., 2021). Consequently, the magnitude of CH4 and N2O emissions from peatlands may be severely altered, particularly the high-altitude or alpine peatlands that are especially vulnerable and highly sensitive to climate change and anthropogenic activities (Squeo et al., 2006).
Large-scale artificial drainage of peatlands was initiated hundreds of years ago and escalated in the 20th century (Evans et al., 2021). As a result, about 10 %–20 % of the global peatlands were primarily drained for the purposes of agriculture, peat extraction and forestry (Frolking et al., 2011). The resulting lower WT altered the anaerobic conditions of the peat soil and led to oxidative loss of peat (Laine et al., 2019; Wilson et al., 2016). Generally, the drainage decreased the CH4 efflux and increased CO2 and N2O emissions (Cao et al., 2017). The increase in N2O emissions from drained peatlands is often small but may potentially reach a high level at sufficient nutrient input, especially when the soil is fertilized (Laine et al., 2019). Ecological restoration has been proposed as a measure to conserve the drained or degraded peatlands, particularly to meet the demand for mitigation of greenhouse gas (GHG) emissions outlined in the Paris Agreement (Evans et al., 2021). Numerous studies have reported a remarkably decreased CO2 efflux in rewetted or restored peatlands, but the rising WT levels have also augmented the emissions of CH4 and N2O (Audet et al., 2013; Järveoja et al., 2016).
Atmospheric N deposition, primarily caused by anthropogenic activities (i.e. fossil fuels combustion, fertilizer application), has increased consistently during the past decades (Gomez-Casanovas et al., 2016; IPCC, 2013), and it is predicted to increase 2- or 3-fold in terrestrial ecosystems by the end of the century (Lamarque, 2005). The increasing N deposition could alleviate the N stress on peatlands, but the N effects on CH4 and N2O emissions are unclear (Deng et al., 2019). Thus, positive (Juutinen et al., 2018), negative (Gao et al., 2014) or neutral (Wang et al., 2017) effects of N deposition on CH4 emissions in peatlands have been observed. We speculate that the contrasting results probably are a result of the prevailing environmental conditions and the N addition rate. Besides CH4 emissions, N deposition generally stimulates N2O emissions from peatlands due to the increasing supply of N substrate (Wang et al., 2017). However, previous studies have also shown that a higher N input leads to a transition of the grassland into a state of declining N saturation, as well as a reduction in the sensitivity of the GHG exchange to the continuously increasing N deposition (Gomez-Casanovas et al., 2016). To eliminate the possible gap resulting from the N addition rate, multiple levels of N deposition are required to study the possible linear or nonlinear effects of deposition on GHG emissions.
Numerous studies have reported on the individual effects of WT and N deposition on GHG emissions in peatlands (Evans et al., 2021; Saiz et al., 2021). To our knowledge, only a few studies (Gao et al., 2014; Wang et al., 2017) exist that focus on their interactive effects on peatland GHG emissions. Gao et al. (2014) found that N addition in peatlands decreased CH4 emissions but increased N2O emissions without any significant interaction with WT levels. Wang et al. (2017) observed no interactive effects of a lower WT and increasing N deposition on GHG emissions in an alpine wetland. The above-mentioned studies were, however, limited to a single level of N addition and associated water addition. The response of GHG emissions in peatlands to the gradients of N deposition and WT levels remains to be elucidated, in particular at the N saturation stage, even though it may be a key factor in shaping GHG emissions. The large uncertainties regarding the interactive effects of N deposition and WT levels on GHG emissions severely hamper obtaining a reliable estimation of the response of peatlands to climate change and anthropogenic activities.
To address this knowledge gap we conducted a mesocosm investigation to study the influence of three WT levels (from drained to inundated) and multi-level N deposition (from non-addition to 160 ) on the soil CH4 and N2O emissions in the Zoige alpine peatland, located on the eastern edge of the Qinghai–Tibetan Plateau. Being the largest and highest swamp wetland area in China, its sensitivity to global climate change and human activities is high (Chen et al., 2013). Exposure to a potential influence of drainage, restoration or increasing N deposition (Yang et al., 2017; Zhang et al., 2011) may increase the risk of high GHG emissions from this area. In this study, we aim to address the following two questions: (i) do increasing rates of N deposition consistently stimulate CH4 and N2O emissions, and (ii) if there is interaction between N deposition and WT level, how do they combine to influence CH4 and N2O emissions in the alpine peatland?
2.1 Study site
This study was conducted in the Zoige alpine wetland, situated on the eastern edge of the Qinghai–Tibetan Plateau, southeast China, during the 2018 and 2019 growing seasons. This alpine wetland covers an area of 6180 km2, which is 31.5 % of the whole Zoige plateau. The mean annual temperature is 1.4 ∘C, with a maximum of 9.1 to 11.4 ∘C in July and a minimum of −8.2 to −10.6 ∘C in January, while the average annual precipitation is approximately 650 mm (Chen et al., 2013; Yang et al., 2014). Over the past 4 decades, the mean annual air temperature has increased by 0.4 ∘C per decade, while the total annual precipitation has decreased by 22 mm per decade (Chen et al., 2013; Yang et al., 2014). Data on precipitation and air temperature in this study were obtained from the closest meteorological station belonging to the Chinese National Meteorological Information Center (http://www.cma.gov.cn/en2014/, last access: 6 May 2021) and are shown in Fig. S1 in the Supplement. The depth of peat in the vertical profile is around 1.2 m, soil pH is 6.8–7.2, and soil bulk density is around 0.78 g m−3 (Zhang et al., 2020). The plant growing season ranges from June to September, and the dominant plants are Carex muliensis, Lancea tibetica, Potentilla anserina L. and Trollius farreri Stapf.
2.2 Experimental design
Our experiment was carried out at the Sichuan Zoige Wetland Ecosystem Research Station, Tibetan Autonomous Prefecture of Aba ( N, E; 3500 m a.s.l.). A homogeneous swamp wetland was selected for collection of soil and plants to be used in the mesocosm. Forty-five tanks (0.6 m length × 0.6 m width × 0.6 m height) were kept aboveground and filled with intact soil cores and vegetation (Fig. S2 in the Supplement). The bottom of the tanks was welded, and the outside of the tanks was wrapped with polystyrene foam to avoid heat exchange with the surroundings.
The experimental treatments consisted of five levels of added N and three water table levels and were applied in a factorial design (five N addition × three water table). The treatments were replicated three times, giving a total of 45 experimental plots. Based on previous studies indicating water level effects on GHG emissions in the Zoige peatland (Cui et al., 2017; Yang et al., 2017), three water table levels (WT−30, 30 cm below the soil surface; WT0, 0 cm at the soil surface; and WT10, 10 cm above the soil surface) were selected. To maintain the water table at the selected three levels, we developed a water table control system composed of three water table detectors, a manostat, a relay and micropumps. Three water table detectors were placed in the PVC pipe (diameter 3 cm) of each tank at the exact water table level and at +2 and −2 cm water table. When the water table was below the −2 cm detector, the pump switched on, supplying the tanks with local tap water until the water table reached the +2 cm detector. To prevent the water table from becoming too high due to pump water or precipitation, four small holes (diameter 1 cm and two holes for two sides) were drilled at the precise position of the water table in each tank to allow water overflow.
The current N deposition in the Zoige area is 1.08–17.81 , and being the main component, and N deposition is expected to increase further in the future (Han et al., 2019). NH4NO3 was adopted as the N source to simulate the different stages of the response of alpine peatlands to multi-level N deposition, and five N addition levels were established for each water table level, namely 0 (N0), 20 (N20), 40 (N40), 80 (N80) and 160 (N160). The three lowest levels (N0, N20 and N40) cover the gradient of current and near-future deposition levels, while the two highest levels (N80 and N160) represent levels of N enrichment resulting from extreme deposition levels possibly combined with N input from fertilization or livestock excreta. The annual added N doses were further divided into four portions and applied at the beginning of every month from June to September in 2018 and 2019. A total of 25 % of the added N was dissolved into 1 L of water and sprayed evenly upon the surface of each plot, while the control plot only received 1 L of water (Wang et al., 2017).
2.3 GHG sampling and measurements
We measured the CH4 and N2O fluxes with the sampling events of one to three times per month during the growing seasons in 2018 and 2019 in our study. In total, 16 sampling occasions of individual fluxes were recorded for CH4 and N2O. In each tank, CH4 and N2O fluxes were measured using static opaque chambers and gas chromatography (GC) (Zhang et al., 2017). The cubic chamber was made of stainless steel (0.5 m length × 0.5 m width × 0.5 m height; without bottom). At the top surface of the chamber, there were two ports: one for headspace gas sampling and one for enclosed air temperature measurements. A dry battery-powered fan was placed in the chamber to avoid stratification of the gases during sampling. Meanwhile, 45 square collars (0.5 m length × 0.5 m width × 0.2 m height) were produced and buried into the middle part of the soil core in each tank at about 0.2 m depth. Before placing the chambers on top of the collars to collect gas samples, the collars were sealed with water to ensure minimum gas exchange between chamber and atmosphere.
Gas samples (20 mL) were collected from each chamber using a rubber tube connected to the valve of the chamber and a syringe at 10 min intervals over a 20 min period (0, 10 and 20 min). The samples were then injected into a pre-evacuated 10 mL vacuum vial (Aladdin, Shanghai, China). The samples were kept cold and dark until the CH4 and N2O fluxes were determined via GC (Agilent 7890A, Agilent Co., Santa Clara, CA, USA) within 72 h. The GC was equipped with a flame ionization detector (FID) to analyze the CH4 concentration and an electron capture detector (ECD) to analyze the N2O concentration. The carrier gas was N2, and the operation temperature for the FID was set at 250 ∘C and ECD at 300 ∘C. The CH4 and N2O fluxes were calculated as follows:
where is the slope of the linear regression for the gas concentration gradient through time, M is the molecular mass of CH4 or N2O, P is the atmospheric pressure at the sampling site, T is the absolute temperature during sampling, V0, P0 and T0 are the gas mole volume, atmospheric pressure and absolute temperature under standard conditions, respectively, and H is the chamber height.
Each linear regression was assessed individually, and the estimates of the data quality of the fluxes were uniformly dependent on the coefficient of determination (R2) values. However, R2 values of the linear regression for CH4 and N2O were sometimes low (<0.4), particularly when the fluxes were low. We did not want to create bias against these low fluxes and therefore kept them if the CO2 concentration (data not shown) showed a good linear trend with time (Laine et al., 2019). Apart from these fluxes, values were generally accepted only if the R2 values of the linear regressions were equal to or greater than 0.8 and 0.7 for CH4 and N2O (Lafuente et al., 2020; Laine et al., 2019), respectively. The CH4 flux had 5.29 % discarded values, while the N2O flux had 3.70 % discarded values.
2.4 Analysis of soil properties
To determine soil properties, soil samples were collected in late September, considered to be the end of the growing seasons in 2018 and 2019. Three subsamples of soil were collected from each tank at the top 5 cm depth and then bulked into a composite sample representing a reliable replicate. The collected soil samples were stored under cold and dark conditions and then forwarded to the laboratory within 3 d. The soil samples were passed through a 2 mm sieve and air dried for the determination of soil pH, soil organic carbon (SOC) and total nitrogen (TN). Soil pH was measured at a soil : water ratio of 1 : 2.5 with a pH electrode (PHS-29, China). SOC and TN were determined via dry combustion using an Elementar vario Max CN analyzer (Hanau, Germany). Soil water content (SWC) was determined by using a TDR300 moisture meter (Spectrum Technologies Inc., Plainfield, Illinois, USA).
2.5 Statistical analysis
Generalized least square (GLS) ANOVA was used to assess the effect of WT and N (fixed factor) on the soil properties and cumulative CH4 and N2O emissions in 2018 and in 2019, respectively, via the R package nlme (Pekár et al., 2016; Tiemeyer et al., 2016). We also used the GLS method to compare the effects of N deposition on CH4 and N2O emissions at each WT level in each year, followed by a Tukey HSD test. The GLS model included an autoregressive structure, accommodated for the unequal time of sampling, and a variance function allowing for unequal variance in the fixed factors (Wanyama et al., 2019).
A generalized additive model (GAM) was used to fit the relationship between the cumulative CH4 emissions and N deposition dosages at different water table levels. Via the R package “mgcv” (Wood, 2017), we used the method “gam” to perform the GAM analysis and the method “predict.gam” to see the response value of GHG emissions along the N deposition gradient from 0 to 160 . Compared to the linear models, GAM directly and smoothly fitted the nonlinear relationship between the response variable and the multiple explanatory variables, regardless of the data distribution (Chen et al., 2021).
The cumulative GHG emissions in the growing seasons of each year were calculated by linear interpolation between sampling events using the trapezoidal rule (Goldberg et al., 2010). In addition to the cumulative GHG emissions between the first and the last sampling event, the GHG emissions from 1 June to the first sampling and from the last sampling to 30 September were taken into consideration.
Statistical analysis was carried out using R (version 3.4.3) (R Core Team, 2017), and graphs were drawn using OriginPro 9.8.0.200. Final p values were Bonferroni adjusted to mitigate the risk of type I error. A significance level of α=0.05 was used for all statistical tests.
3.1 Soil properties
During the 2 years of the growing season mesocosm experiment, the SWC varied from 63.5 % to 81.1 % and was only significantly affected by the water table levels (Tables 1 and 2). The higher WT levels significantly increased the SWC in both years. The soil pH varied within the range 7.3 to 7.8 and was only significantly affected by N deposition. Large variability in SOC was observed within the range 215.9 to 296.1 g kg−1, and both the WT and N treatments showed significant effects on SOC, without any interactive effects. Compared with the control treatment without N deposition, N deposition increased SOC by 1.4 % to 31.1 % (except WT0 N160 in 2019). Soil TN varied between 12.9 and 19.1 g kg−1 and was elevated by N deposition, whereas no significant response to the WT treatments was observed. N deposition enhanced soil TN by 1.3 % to 110.5 % compared to the N0 treatment at each WT level.
Table 1Soil properties in the different water table (WT) treatments and nitrogen deposition (N) levels in 2018 and 2019.
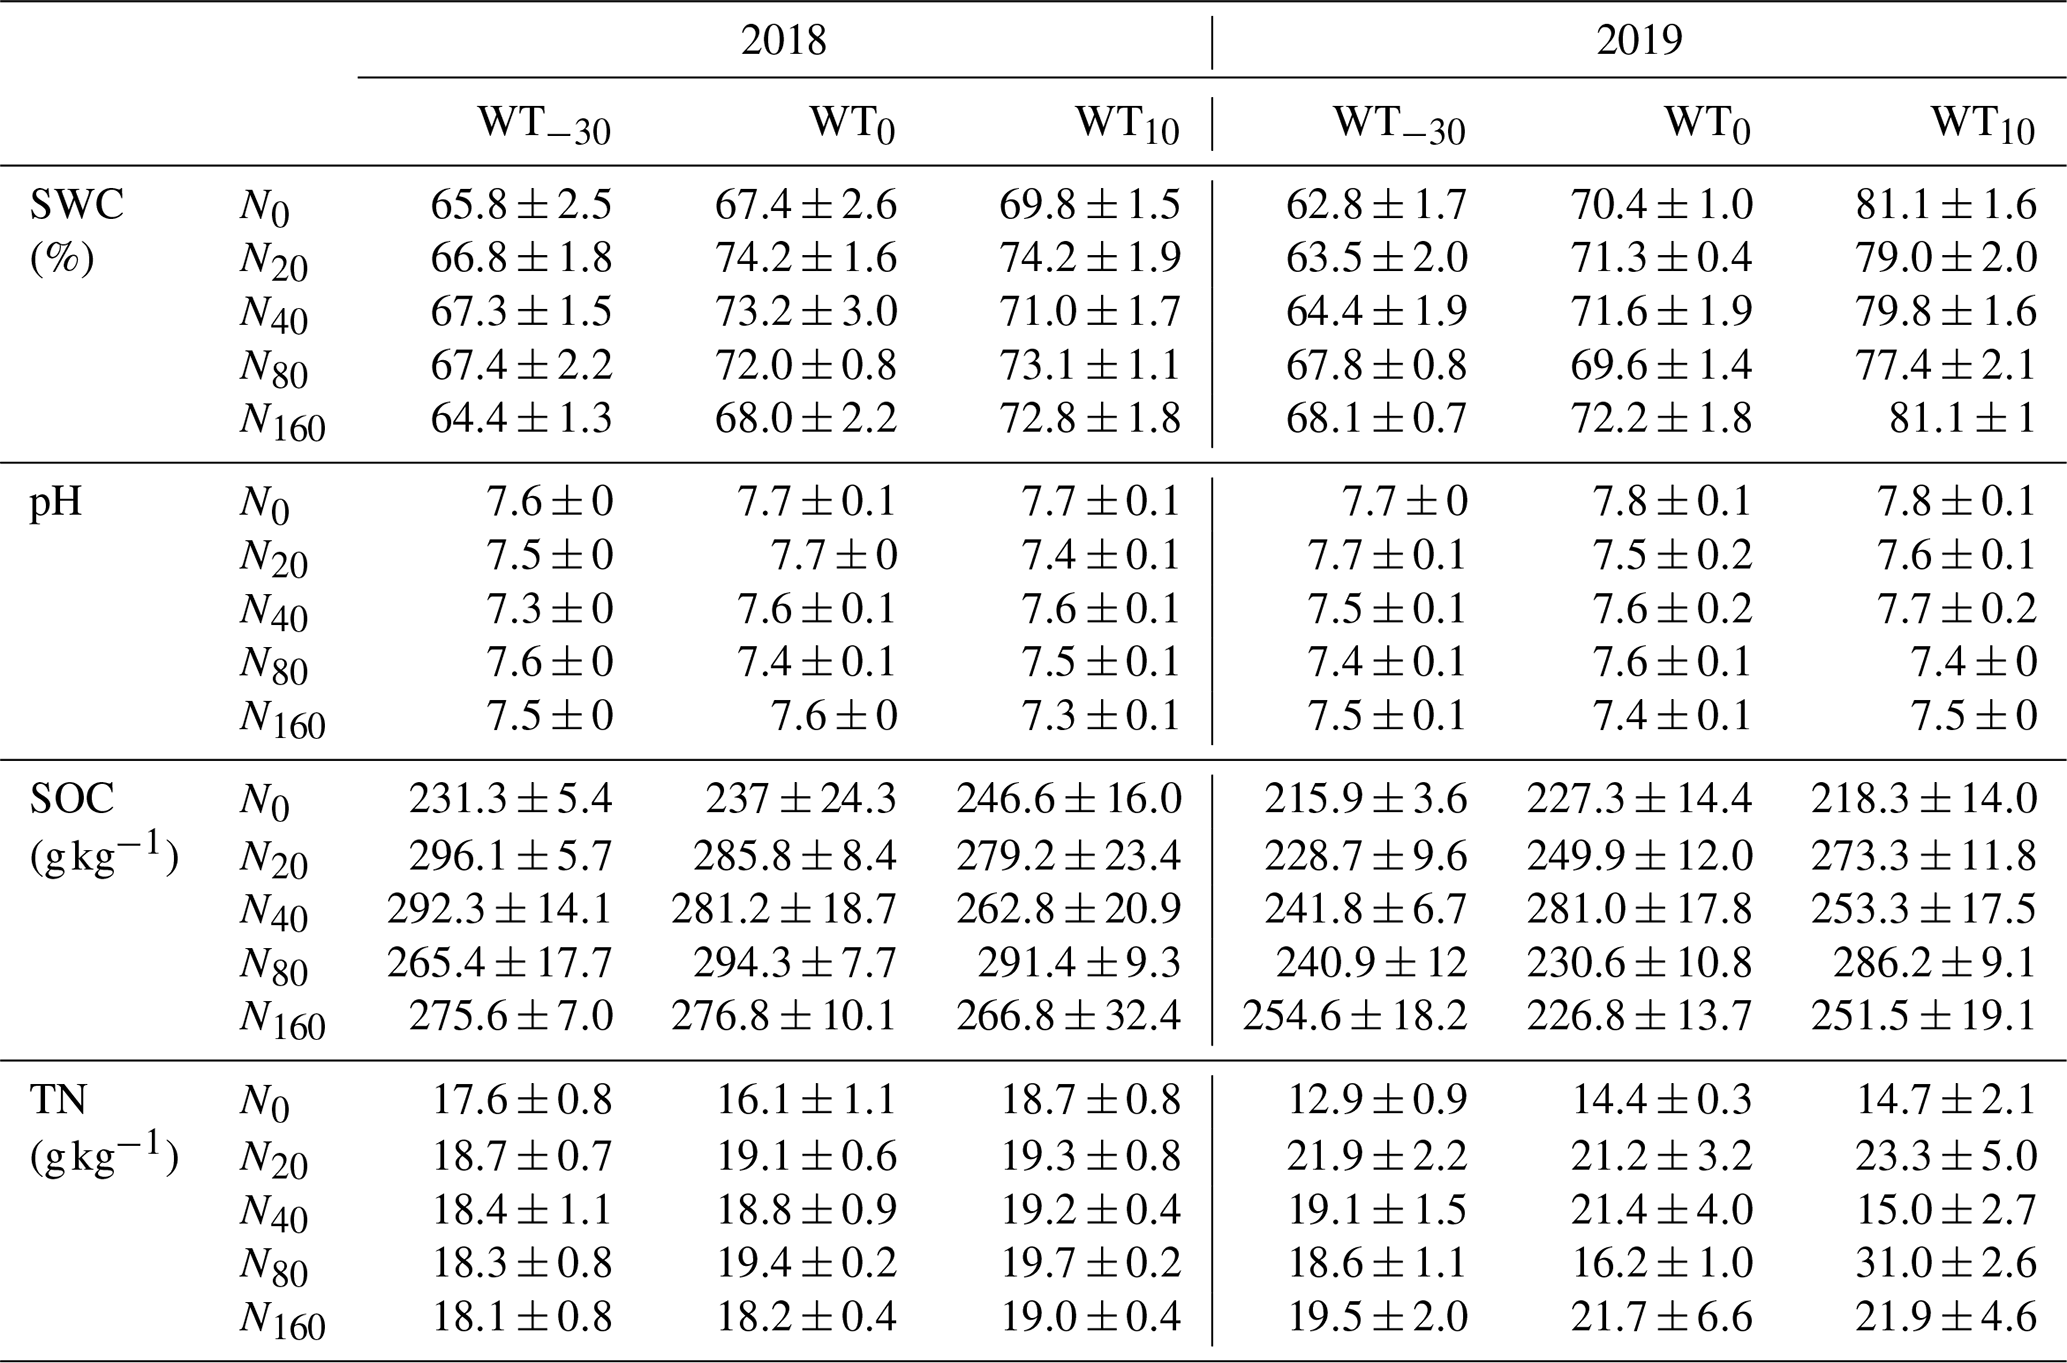
Each value represents mean ± SE (n=3). SWC: soil water content; SOC: soil organic carbon; TN: total nitrogen.
Table 2Effects of water table (WT) and nitrogen (N) deposition levels and their interactions on soil properties using generalized least square (GLS) models.
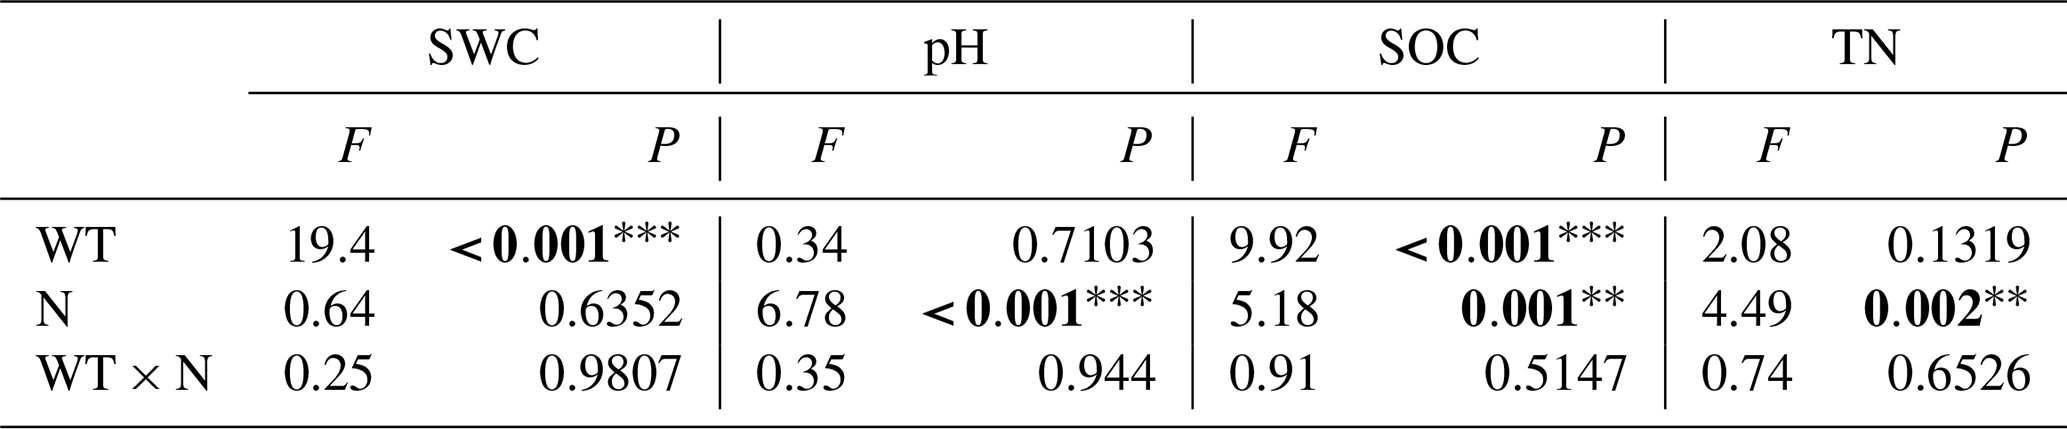
Bold font denotes significant values. The statistical significance levels used were as follows: ∗ – ; – ; – P<0.001. SWC: soil water content; SOC: soil organic carbon; TN: total nitrogen.
3.2 Methane
The Zoige alpine peatland acted as a net source of CH4 in the WT0 and WT10 treatments throughout the two growing seasons, although the CH4 flux was almost 0 in the WT−30 treatment. Temporal variability in the CH4 flux was observed (Fig. 1). The cumulative CH4 emissions of the growing season ranged from −0.26 to 29.26 g CH4-C m−2 in 2018 and from −0.35 to 16.36 g CH4-C m−2 in 2019 (Fig. 2). During the 2 years, the WT treatments and their interaction with the N treatments had significant effects on the cumulative CH4 emissions, while N deposition only had significant effects in 2019 (Table 3). Along the WT level gradient from WT−30 to WT10, the cumulative CH4 emissions increased markedly. The response of the cumulative CH4 emissions to N deposition was nonlinear under WT0 and WT10 conditions (Fig. 3), with the highest value observed in the N20 treatment. Compared to the N0 treatment, the N80 and N160 treatments remarkably decreased the cumulative CH4 emissions by 36.5 % to 97.4 %, while N40 was on the same order of magnitude as in the N0 treatment. The GAM results showed that the cumulative CH4 emissions could be explained by N deposition for 55.9 % under WT0 conditions and for 45.4 % under WT10 conditions. The modeling results also indicated that the critical thresholds for the highest cumulative CH4 emissions were 14.41 g C m−2 with 20.9 N deposition under WT0 conditions and 21.60 g C m−2 with 16.2 N deposition under WT10 conditions.

Figure 1Temporal variation in growing-season CH4 and N2O fluxes under five levels of nitrogen deposition (0, 20, 40, 80 and 160 ) and three water table levels in 2018 and 2019. Error bars represent the SE (n=3).

Figure 2Effects of nitrogen deposition levels on cumulative CH4 and N2O emissions at three water table levels during the growing seasons in 2018 and 2019. Error bars represent the SE (n=3). Different letters above the bars indicate statistically significant differences (P<0.05).
Table 3The individual and interactive effects of water table (WT) and nitrogen (N) deposition levels on cumulative CH4 and N2O emissions in 2018 and 2019 using generalized least square (GLS) models.
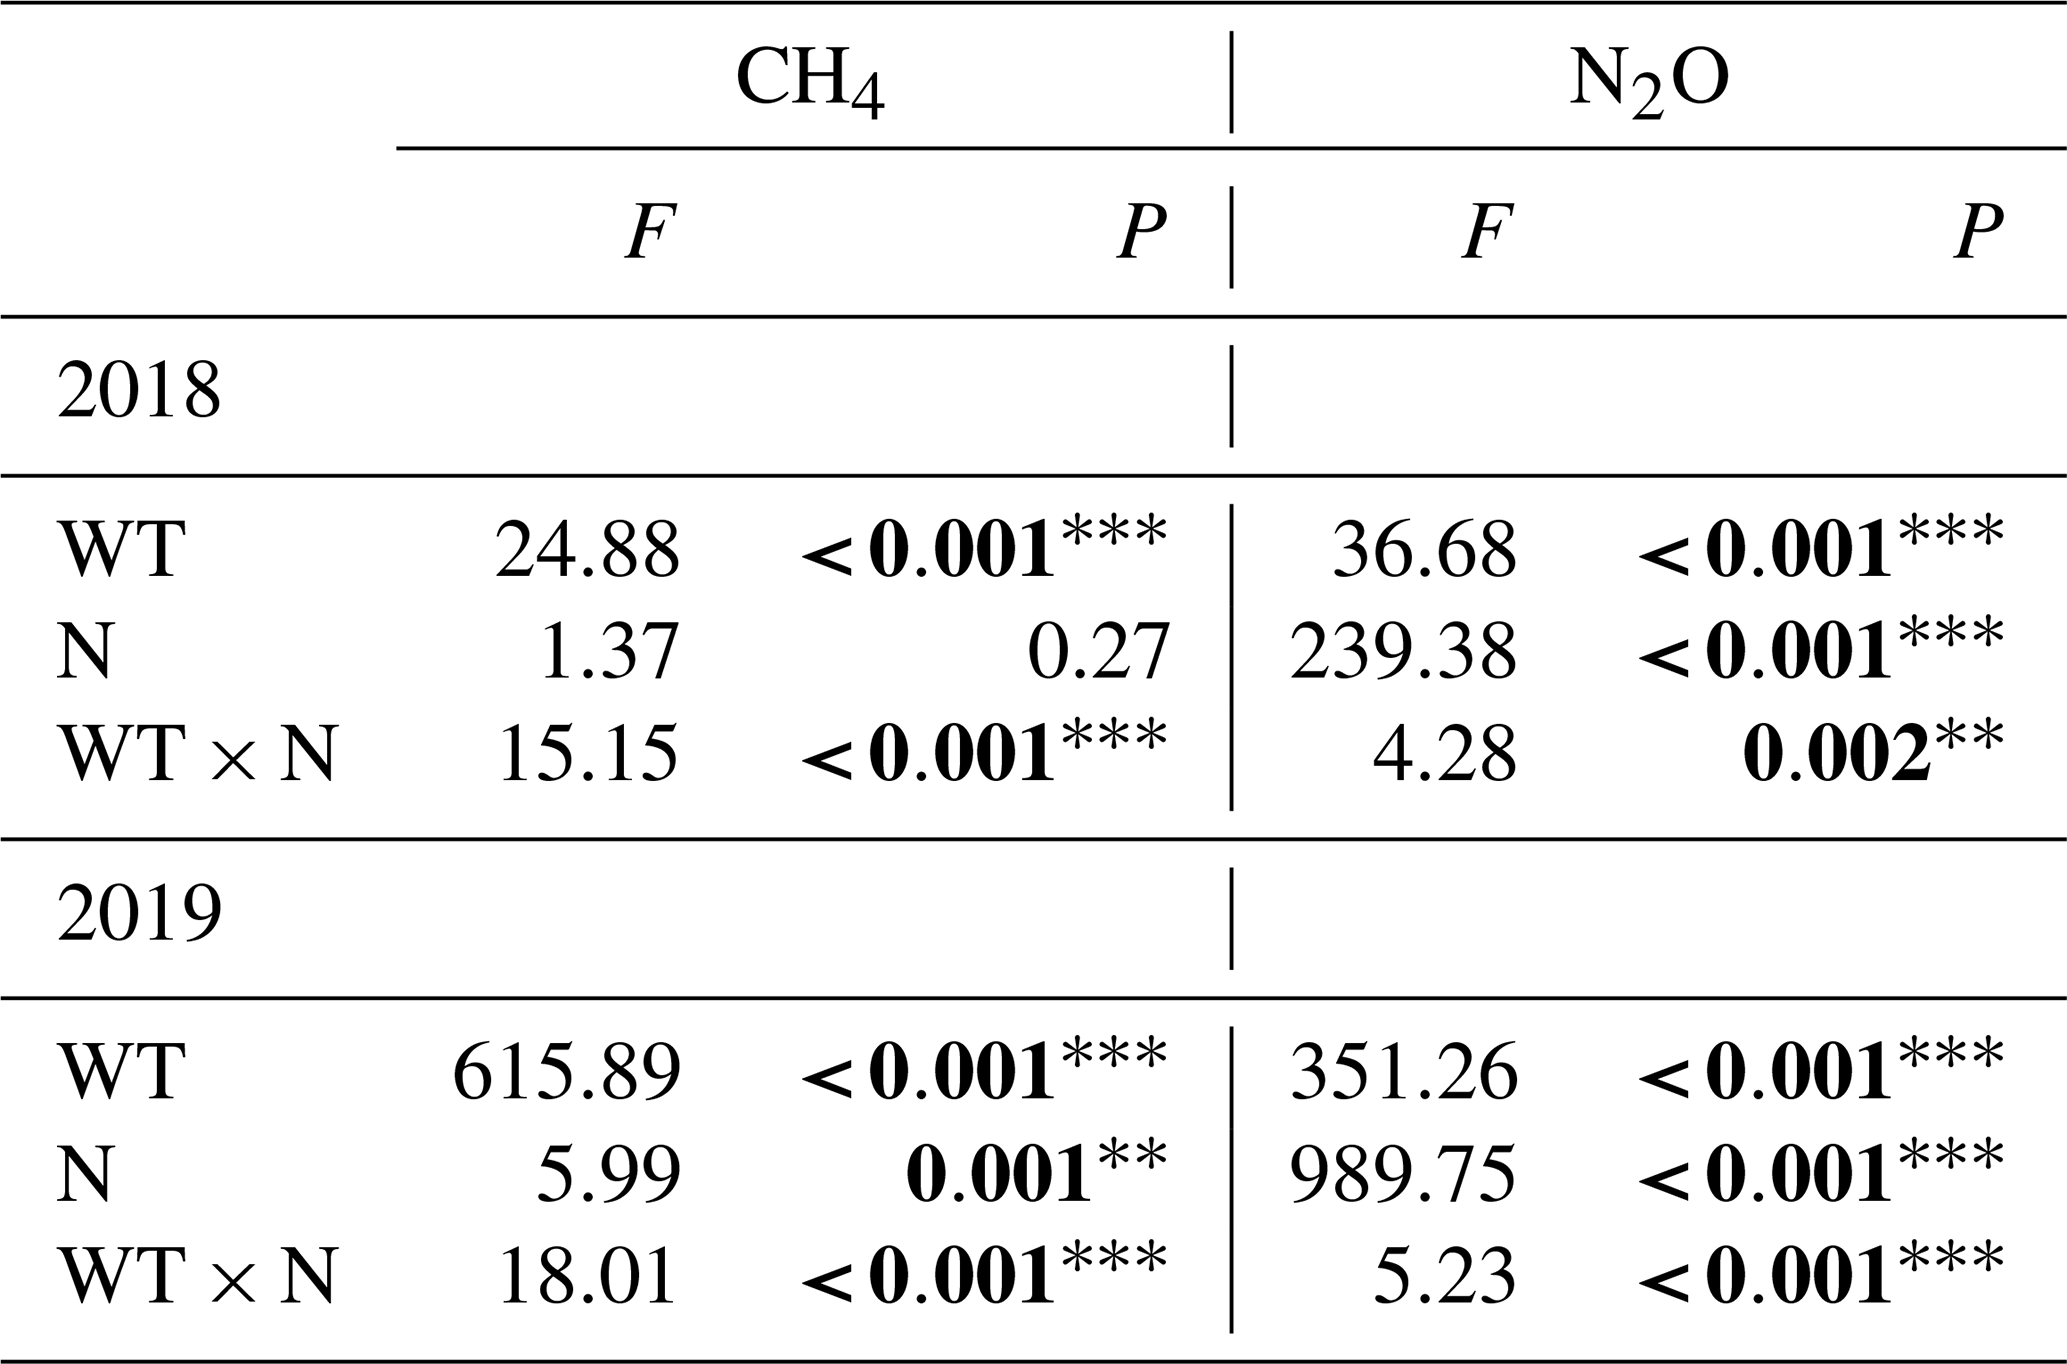
Bold font denotes significant values. The statistical significance levels used were as follows: ∗ – ; – ; – P<0.001.
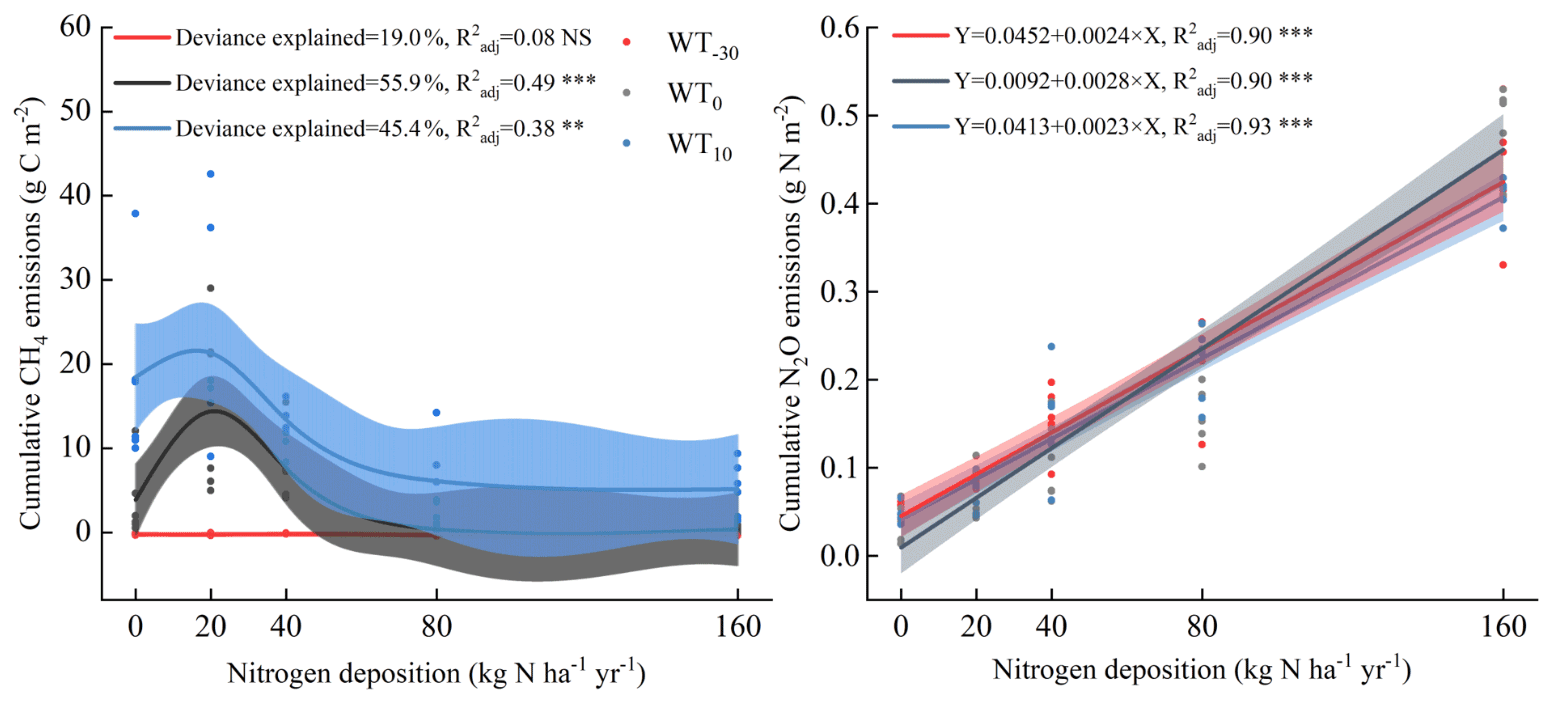
Figure 3The relationship between cumulative greenhouse gas (CH4 and N2O) emissions and nitrogen deposition levels at three water table levels. A linear model was used to estimate cumulative N2O emissions at five nitrogen deposition levels, while a generalized additive model (GAM) was used to assess the response of cumulative CH4 emissions to nitrogen deposition levels. The statistical significance levels used were as follows: ∗ – P<0.05 and >0.01; – P<0.01 and >0.001; – P<0.001; N – not significant (P>0.05). The shaded areas indicate 95 % confidence intervals.
3.3 Nitrous oxide
The Zoige alpine peatland acted as a net N2O source during the growing seasons, the N2O fluxes showing clear temporal variability in 2018 and 2019. The N2O flux tended to be highest in early September 2018 and in mid-August 2019, while the lowest flux was observed at the start or the end of the growing seasons (Fig. 1). The cumulative N2O emissions ranged from 0.02 to 0.49 g N2O-N m−2 in 2018 and from 0.05 to 0.50 g N2O-N m−2 in 2019. The cumulative N2O emissions were significantly affected by the WT levels, N deposition and their interaction (Table 3). N deposition significantly increased the cumulative N2O emissions by 28.9 % to 1974.6 %, most significantly in the N160 treatment. However, there was no clear effect of WT levels on N2O emissions. We observed a significantly positive and linear relationship between the cumulative N2O emissions and N application doses, and the slope and intercept of the linear correlation depended on the WT levels (Fig. 3). The linear results also showed that the 1 kg N ha−1 addition increased the cumulative N2O emissions by 0.0024, 0.0028 and 0.0023 g N2O-N m−2 under WT−30, WT0 and WT10 conditions, respectively.
4.1 Effects of WT and N deposition on CH4 emissions
The cumulative CH4 emissions from the Zoige alpine peatland in our study ranged from −0.35 to 29.26 g CH4-C m−2 across the 2 years, which is on the same order of magnitude as the cumulative CH4 emissions (25.4–29.6 g CH4-C m−2) from an alpine wetland of the Qinghai–Tibetan Plateau in a previous study (Wang et al., 2017). As expected, WT levels had a significant positive effect on CH4 emissions, with higher WT levels increasing CH4 emissions. This corresponds with the results of previous studies due to the manipulative effects of WT levels on the soil redox conditions (Hoyos-Santillan et al., 2019; Wang et al., 2017). With higher WT levels, SWC increased and likely formed more anaerobic conditions conducive to CH4 production, leading to elevated CH4 emissions (Evans et al., 2021; Hoyos-Santillan et al., 2019; Zhang et al., 2020).
In the current study, a moderate level of N deposition positively stimulated the CH4 emissions, but subsequently the positive effect declined with further N addition. However, this nonlinear effect of N deposition was only observed at high WT levels, and the close to zero emissions of CH4 at low WT levels were not affected by N deposition. To our knowledge, the nonlinear effects of N deposition on CH4 fluxes in the upland ecosystems have been reported in numerous studies (Lafuente et al., 2020; Qu et al., 2021); however, there have been very few attempts in peatlands. Song et al. (2013) found a similar pattern of nonlinear effects of N addition (0–240 ) on CH4 fluxes in a wetland with the highest CH4 flux observed at 60 N addition, but unfortunately, this N effect was not significant. Wu et al. (2022) conducted a global meta-analysis and found the N addition (0–300 ) could consistently increase the CH4 emissions in the global wetlands, but the highest value occurred at 50–100 N addition. The results of the aforementioned studies were not in agreement with the present study due to the differences between the threshold values and the inhibitory or promotive effects of further N addition on CH4 emissions. However, in accordance with the previous studies, the relatively low level of N addition probably alleviated N constraints on microbial metabolism in soils and increased CH4 production (Currey et al., 2009; Deng et al., 2019). With the further N addition, large amounts of available might have led to negative and inhibitory effects on the methanogenic activity due to the competition of -reducing bacteria with methanogens (Liu et al., 2020).
The interactive effects of WT levels and N deposition on the cumulative CH4 emissions were distinct in our study (Table 3 and Fig. 3). We found that the WT levels were more likely to determine the direction and magnitude of CH4 emissions from alpine peatlands than N deposition. This is in line with a previous study (Evans et al., 2021), which indicated that WT was the overriding factor to control GHG emissions from the peatlands at a global scale. The N deposition nonlinearly affected the CH4 emissions, and the scenario for maximum CH4 emissions was roughly ca. 20 , which could be slightly changed by the WT levels. To the best of our knowledge, this is the first mesocosm experiment in an alpine peatland comparing the interactive effects of multi-level N deposition and WT levels on CH4 emissions, which makes it challenging to put in context the scope of these results, and we have not found any theory in the previous studies which could best explain the underlying mechanism. We speculate that the N-deposition-supplied N substrate and WT levels were associated with N utilization by microorganisms. Precisely, the higher WT levels promoted diffusion of the added N in the water-filled soil pore, and N thus became readily accessible in the microbial process to support CH4 production (Wang et al., 2017).
4.2 Effects of WT and N deposition on N2O emissions
The mesocosms in the Zoige alpine peatland were consistently acting as N2O sources, and the cumulative N2O emissions (0.02–0.49 g m−2 in 2018 and 0.05–0.50 g m−2 in 2019) did not show significant differences between the 2 years. The cumulative N2O emissions from the Zoige peatland in our study were relatively higher than those in a previous report (0.08–0.2 g m−2), which focused on the drainage or lower water table level (Cao et al., 2018). Unlike the CH4 emissions, we did not observe a clear pattern for the effects of WT levels on N2O emissions in our study. This is different from the numerous previous studies, which all confirmed the positive effects of WT on N2O emissions in peatlands due to the positive effects on anaerobic denitrification and N2O production (Gao et al., 2014; Regina et al., 1999, 1996). However, Wang et al. (2017) reported that elevated WT levels from drained to inundated conditions had no effects on N2O fluxes in an alpine wetland of the Qinghai–Tibetan Plateau, which is in line with our study. The possible reason for this could be due to the large differences of habitat types, soil properties or precipitation among the regional heterogeneous peatlands.
N deposition stimulated N2O emissions across the 2 years in our study, and the same results were also found in the previous reports (Gao et al., 2014; Deng et al., 2019). The N deposition increased soil TN (F=4.49, P=0.002) in our study and is likely to supply more N substrate ( and ) in soil (Zhu et al., 2020). The consequently increased N substrate could potentially activate the microbial process of N2O production and increase N2O emissions (Yue et al., 2021). Additionally, contrary to the CH4 emissions, the N deposition showed consistently linear effects on N2O emissions in the peatland, regardless of the WT levels. This is not in line with a previous study (Song et al., 2013), which indicated that N addition ranging from 0–120 did not show significant effects on N2O emissions in peatlands, while high level (240 ) largely increased the N2O emissions. However, a global meta-analysis showed that N2O emissions from wetlands demonstrated a significant positive response to N enrichment (Deng et al., 2019), which agreed with our study. The possible explanation could be that the current level of N deposition in the Zoige peatland did not meet the N-saturation stage, after which the sensitivity of N2O emissions from the ecosystem to further N addition would decline (Gomez-Casanovas et al., 2016).
The N2O emissions from the alpine peatland were likely primarily determined by N deposition rather than by WT levels. We confirmed the occurrence of an interactive effect of WT and N deposition on N2O emissions, but it was neither synergistic nor antagonistic. N deposition had linear positive effects on N2O emissions, and the WT level did not alter this linear relationship but slightly changed the slope and intercept. The N2O emissions could be generated from both the aerobic nitrification and anaerobic denitrification processes. This is confirmed by the previous study (Bateman and Baggs, 2005), which indicates that the denitrification was the major contributor to N2O emissions at water-filled pore space (WFPS) >60 %, while nitrification was the major one at WFPS<60 %. The overall production of N2O could not be uniquely manipulated by the WT levels, though the WT levels could influence the redox conditions and the microbial processes. Additionally, the Zoige peatland being a N-limited ecosystem (Squeo et al., 2006), we observed the overwhelming effects of N deposition on N2O emissions in the peatland rather than WT levels.
The growing-season N2O emissions in the current study increased by 0.0023–0.0028 g N2O-N m−2 in response to the additional 1 deposition. This is slightly lower than the levels from previous studies (Gong et al., 2019), which showed that a 1 kg annual N ha−1 addition led to an increase of ca. 0.0076 g N2O-N m−2 during the growing season in a boreal peatland. This could be attributed to the relatively low air temperature at this particular alpine peatland, which hampered the microbial N2O production. Furthermore, IPCC (2013) suggested that the default emission factor (the fraction of nitrogen added that is released as N2O) is 1 %, indicating that a 1 kg annual N ha−1 addition may increase N2O emissions by 0.01 kg N2O-N ha−1 (or 0.001 g N2O-N m−2). The relatively higher emission factor for N2O-N in our study was probably due to the high dose of N addition.
4.3 Implications and limitations
To what extent the magnitude of non-CO2 emissions from alpine peatlands could be upscaled in response to the increasing N deposition and how this effect interacts with the WT levels are still high uncertain. Our study demonstrated that the CH4 and N2O emissions from the alpine peatland system could reach a new state if the projected increases in N deposition continued; in particular the CH4 emissions could be disproportionally increased. In the Zoige peatland, the current level of N deposition was 1.08–17.81 (Han et al., 2019), and the N deposition was predicted to be a possible doubling or tripling by the end of the century (Lamarque, 2005). Given the highest CH4 emissions occurred at the level of ca. 20 deposition, as well as the consistent linear correlation between N2O emissions and N deposition levels in our study, we infer that the CH4 and N2O emissions had not yet peaked, and the increasing N deposition could still result in the alpine peatland becoming a potential hotspot of GHG emissions in the future. Moreover, the fluctuation in WT levels resulting from anthropogenic drainage or rewetting could affect the GHG emissions but not suppress the N-deposition-induced trend. However, our study is limited to a specific habitat, and thus the upscaling of this conclusion contains large uncertainty. To the best of our knowledge, very few advances heretofore have been achieved to elaborate this general conclusion. We believe that our results are useful for predicting the GHG emissions from alpine peatlands in response to climate change and anthropogenic activities in the future.
It should be noted that some levels of N deposition (80 or 160 ) in our study were much higher than the local N deposition (1.08–17.81 ). This should not affect our general conclusion because the nonlinear and linear effects of N deposition on CH4 and N2O emissions, respectively, were primarily dependent on the low levels of N deposition (0–40 ), and the higher levels did not alter the relationship pattern. Meanwhile, it should be noted that we did not measure the net ecosystem CO2 exchange and wintertime GHG fluxes, which might hamper estimating the annual carbon budget from GHG emissions and SOC change. However, our study focused on the growing-season non-CO2 emissions from the peatland at different WT levels under the future scenarios of increasing N deposition, and also the non-growing-season GHG emissions made only a minor contribution to the yearly budget due to the low temperature and microbial activities (Peng et al., 2019). In addition, the low frequency of GHG sampling in 2018 could cause uncertainties in the temporal variation and cumulative emissions of CH4 and N2O, and this might result in bias in the present result. The monthly measurements of GHG fluxes from peatlands have already been found in the previous study (Cao et al., 2018), and we also increased the sampling frequency in 2019 to better support the current conclusion. However, further monitoring of GHG fluxes from the peatland would still be required to eliminate the uncertainties.
This study explored the response of non-CO2 GHG emissions in the alpine peatland to the increasing N deposition at different WT levels. We found that CH4 emissions were determined by N deposition, WT levels and their interactive effects. A modest input of N deposition and high WT levels both stimulated CH4 emissions. N2O emissions were remarkably sensitive to N deposition, which consistently and linearly increased the N2O emissions, irrespective of WT levels. The projected increasing N deposition suggested an inevitable risk for higher CH4 and N2O emissions from the alpine peatland in the future.
All data are available from the corresponding author upon request.
The supplement related to this article is available online at: https://doi.org/10.5194/bg-19-5187-2022-supplement.
WZ, ZH and JW designed the study. WZ, EK, XK, YL, XZ and JW conducted the field work. XK, XZ and JW financially supported the project with respect to the field and laboratory work. WZ, JA and TAD were responsible for the figures, tables and data analysis. WZ wrote and revised the manuscript with contributions from ZH, JW, JA and TAD. All the co-authors contributed to discussions on the scientific content of the paper.
The contact author has declared that none of the authors has any competing interests.
Publisher's note: Copernicus Publications remains neutral with regard to jurisdictional claims in published maps and institutional affiliations.
This article is part of the special issue “Global change effects on terrestrial biogeochemistry at the plant–soil interface”. It is not associated with a conference.
This research has been supported by the National Natural Science Foundation of China (grant nos. 41877421 and 31770511).
This paper was edited by Alberto Canarini and reviewed by two anonymous referees.
Audet, J., Elsgaard, L., Kjaergaard, C., Larsen, S. E., and Hoffmann, C. C.: Greenhouse gas emissions from a Danish riparian wetland before and after restoration, Ecol. Eng., 57, 170–182, https://doi.org/10.1016/j.ecoleng.2013.04.021, 2013.
Bateman, E. J. and Baggs, E. M.: Contributions of nitrification and denitrification to N2O emissions from soils at different water-filled pore space, Biol. Fert. Soils, 41, 379–388, https://doi.org/10.1007/s00374-005-0858-3, 2005.
Cao, R., Xi, X., Yang, Y., Wei, X., Wu, X., and Sun, S.: The effect of water table decline on soil CO2 emission of Zoige peatland on eastern Tibetan Plateau: A four-year in situ experimental drainage, Appl. Soil Ecol., 120, 55–61, https://doi.org/10.1016/j.apsoil.2017.07.036, 2017.
Cao, R., Chen, Y., Wu, X., Zhou, Q., and Sun, S.: The effect of drainage on CO2, CH4 and N2O emissions in the Zoige peatland: a 40 month in situ study, Mires Peat, 21, 1–15, https://doi.org/10.19189/MaP.2017.OMB.292, 2018.
Chen, H., Zhu, Q., Peng, C., Wu, N., Wang, Y., Fang, X., Gao, Y., Zhu, D., Yang, G., Tian, J., Kang, X., Piao, S., Ouyang, H., Xiang, W., Luo, Z., Jiang, H., Song, X., Zhang, Y., Yu, G., Zhao, X., Gong, P., Yao, T., and Wu, J.: The impacts of climate change and human activities on biogeochemical cycles on the Qinghai-Tibetan Plateau, Global Change Biol., 19, 2940–2955, https://doi.org/10.1111/gcb.12277, 2013.
Chen, Q., Wang, S., Ni, Z., Guo, Y., Liu, X., Wang, G., and Li, H.: No-linear dynamics of lake ecosystem in responding to changes of nutrient regimes and climate factors: Case study on Dianchi and Erhai lakes, China, Sci. Total Environ., 781, 146761, https://doi.org/10.1016/j.scitotenv.2021.146761, 2021.
Cui, L., Kang, X., Li, W., Hao, Y., Zhang, Y., Wang, J., Yan, L., Zhang, X., Zhang, M., Zhou, J., and Kardol, P.: Rewetting decreases carbon emissions from the Zoige alpine peatland on the Tibetan plateau, Sustainability, 9, 948, https://doi.org/10.3390/su9060948, 2017.
Currey, P. M., Johnson, D., Sheppard, L. J., Leith, I. D., Toberman, H., Van Der Wal, R., Dawson, L. A., and Artz, R. R. E.: Turnover of labile and recalcitrant soil carbon differ in response to nitrate and ammonium deposition in an ombrotrophic peatland, Global Change Biol., 16, 2307–2321, https://doi.org/10.1111/j.1365-2486.2009.02082.x, 2009.
Deng, L., Huang, C., Kim, D. G., Shangguan, Z., Wang, K., Song, X., and Peng, C.: Soil GHG fluxes are altered by N deposition: New data indicate lower N stimulation of the N2O flux and greater stimulation of the calculated C pools, Global Change Biol., 26, 2613–2629, https://doi.org/10.1111/gcb.14970, 2019.
Evans, C. D., Peacock, M., Baird, A. J., Artz, R. R. E., Burden, A., Callaghan, N., Chapman, P. J., Cooper, H. M., Coyle, M., Craig, E., Cumming, A., Dixon, S., Gauci, V., Grayson, R. P., Helfter, C., Heppell, C. M., Holden, J., Jones, D. L., Kaduk, J., Levy, P., Matthews, R., McNamara, N. P., Misselbrook, T., Oakley, S., Page, S., Rayment, M., Ridley, L. M., Stanley, K. M., Williamson, J. L., Worrall, F., and Morrison, R.: Overriding water table control on managed peatland greenhouse gas emissions, Nature, 593, 548–552, https://doi.org/10.1038/s41586-021-03523-1, 2021.
Frolking, S., Talbot, J., Jones, M. C., Treat, C. C., Kauffman, J. B., Tuittila, E.-S., and Roulet, N.: Peatlands in the Earth's 21st century climate system, Environ. Rev., 19, 371–396, https://doi.org/10.1139/a11-014, 2011.
Gao, Y., Chen, H., and Zeng, X.: Effects of nitrogen and sulfur deposition on CH4 and N2O fluxes in high-altitude peatland soil under different water tables in the Tibetan Plateau, Soil Sci. Plant Nutr., 60, 404–410, https://doi.org/10.1080/00380768.2014.893812, 2014.
Goldberg, S. D., Knorr, K.-H., Blodau, C., Lischeid, G., and Gebauer, G.: Impact of altering the water table height of an acidic fen on N2O and NO fluxes and soil concentrations, Global Change Biol., 16, 220–233, https://doi.org/10.1111/j.1365-2486.2009.02015.x, 2010.
Gomez-Casanovas, N., Hudiburg, T. W., Bernacchi, C. J., Parton, W. J., and Delucia, E. H.: Nitrogen deposition and greenhouse gas emissions from grasslands: uncertainties and future directions, Global Change Biol., 22, 1348–1360, https://doi.org/10.1111/gcb.13187, 2016.
Gong, Y., Wu, J., Vogt, J., and Le, T. B.: Warming reduces the increase in N2O emission under nitrogen fertilization in a boreal peatland, Sci. Total Environ., 664, 72–78, https://doi.org/10.1016/j.scitotenv.2019.02.012, 2019.
Han, Y., Dong, S., Zhao, Z., Sha, W., Li, S., Shen, H., Xiao, J., Zhang, J., Wu, X., Jiang, X., Zhao, J., Liu, S., Dong, Q., Zhou, H., and Yeomans, J. C.: Response of soil nutrients and stoichiometry to elevated nitrogen deposition in alpine grassland on the Qinghai-Tibetan Plateau, Geoderma, 343, 263–268, https://doi.org/10.1016/j.geoderma.2018.12.050, 2019.
Hoyos-Santillan, J., Lomax, B. H., Large, D., Turner, B. L., Lopez, O. R., Boom, A., Sepulveda-Jauregui, A., and Sjögersten, S.: Evaluation of vegetation communities, water table, and peat composition as drivers of greenhouse gas emissions in lowland tropical peatlands, Sci. Total Environ., 688, 1193–1204, https://doi.org/10.1016/j.scitotenv.2019.06.366, 2019.
IPCC: Climate Change: The Physical Science Basis. Contribution of Working Group I to the Fifth Assessment Report of the Intergovernmental Panel on Climate Change, Cambridge University Press, Cambridge, UK and New York, NY, USA, ISBN 978-1-107-05799-1, 2013.
Järveoja, J., Peichl, M., Maddison, M., Soosaar, K., Vellak, K., Karofeld, E., Teemusk, A., and Mander, Ü.: Impact of water table level on annual carbon and greenhouse gas balances of a restored peat extraction area, Biogeosciences, 13, 2637–2651, https://doi.org/10.5194/bg-13-2637-2016, 2016.
Juutinen, S., Moore, T. R., Bubier, J. L., Arnkil, S., Humphreys, E., Marincak, B., Roy, C., and Larmola, T.: Long-term nutrient addition increased CH4 emission from a bog through direct and indirect effects, Sci. Rep.-UK, 8, 3838, https://doi.org/10.1038/s41598-018-22210-2, 2018.
Lafuente, A., Recio, J., Ochoa-Hueso, R., Gallardo, A., Perez-Corona, M. E., Manrique, E., and Duran, J.: Simulated nitrogen deposition influences soil greenhouse gas fluxes in a Mediterranean dryland, Sci. Total Environ., 737, 139610, https://doi.org/10.1016/j.scitotenv.2020.139610, 2020.
Laine, A. M., Mehtatalo, L., Tolvanen, A., Frolking, S., and Tuittila, E. S.: Impacts of drainage, restoration and warming on boreal wetland greenhouse gas fluxes, Sci. Total Environ., 647, 169–181, https://doi.org/10.1016/j.scitotenv.2018.07.390, 2019.
Lamarque, J. F.: Assessing future nitrogen deposition and carbon cycle feedback using a multimodel approach: Analysis of nitrogen deposition, J. Geophys. Res., 110, D19, https://doi.org/10.1029/2005jd005825, 2005.
Liu, Z., Li, D., Zhang, J., Saleem, M., Zhang, Y., Ma, R., He, Y., Yang, J., Xiang, H., and Wei, H.: Effect of simulated acid rain on soil CO2, CH4 and N2O emissions and microbial communities in an agricultural soil, Geoderma, 366, 114222, https://doi.org/10.1016/j.geoderma.2020.114222, 2020.
Pekár, S., Brabec, M., and Bshary, R.: Marginal models via gls: A convenient yet neglected tool for the analysis of correlated data in the behavioural sciences, Ethology, 122, 621–631, https://doi.org/10.1111/eth.12514, 2016.
Peng, H., Guo, Q., Ding, H., Hong, B., Zhu, Y., Hong, Y., Cai, C., Wang, Y., and Yuan, L.: Multi-scale temporal variation in methane emission from an alpine peatland on the Eastern Qinghai-Tibetan Plateau and associated environmental controls, Agr. Forest Meteorol., 276–277, 107616, https://doi.org/10.1016/j.agrformet.2019.107616, 2019.
Qu, S., Xu, R., Yu, J., Li, F., Wei, D., and Borjigidai, A.: Nitrogen deposition accelerates greenhouse gas emissions at an alpine steppe site on the Tibetan Plateau, Sci. Total Environ., 765, 144277, https://doi.org/10.1016/j.scitotenv.2020.144277, 2021.
R Core Team: R: A language and environment for statistical computing, R Foundation for Statistical Computing, Vienna, Austria, https://www.R-project.org/ (last access: 18 February 2021), 2017.
Regina, K., Nykanen, H., Silvola, J., and Martikainen, P. J.: Fluxes of nitrous oxide from boreal peatlands as affected by peatland type, water table level and nitrification capacity, Biogeochemistry, 35, 401–418, https://doi.org/10.1007/bf02183033, 1996.
Regina, K., Silvola, J., and Martikainen, P. J.: Short-term effects of changing water table on N2O fluxes from peat monoliths from natural and drained boreal peatlands, Global Change Biol., 5, 183–189, https://doi.org/10.1046/j.1365-2486.1999.00217.x, 1999.
Saiz, E., Sgouridis, F., Drijfhout, F. P., Peichl, M., Nilsson, M. B., and Ullah, S.: Chronic atmospheric reactive nitrogen deposition suppresses biological nitrogen fixation in peatlands, Environ. Sci. Technol., 55, 1310–1318, https://doi.org/10.1021/acs.est.0c04882, 2021.
Song, C., Wang, L., Tian, H., Liu, D., Lu, C., Xu, X., Zhang, L., Yang, G., and Wan, Z.: Effect of continued nitrogen enrichment on greenhouse gas emissions from a wetland ecosystem in the Sanjiang Plain, Northeast China: A 5 year nitrogen addition experiment, J. Geophys. Res.-Biogeo., 118, 741–751, https://doi.org/10.1002/jgrg.20063, 2013.
Squeo, F. A., Warner, B. G., Aravena, R., and Espinoza, D.: Bofedales: high altitude peatlands of the central Andes, Rev. Chil. Hist. Nat., 79, 245–255, https://doi.org/10.4067/S0716-078X2006000200010, 2006.
Tiemeyer, B., Albiac Borraz, E., Augustin, J., Bechtold, M., Beetz, S., Beyer, C., Drosler, M., Ebli, M., Eickenscheidt, T., Fiedler, S., Forster, C., Freibauer, A., Giebels, M., Glatzel, S., Heinichen, J., Hoffmann, M., Hoper, H., Jurasinski, G., Leiber-Sauheitl, K., Peichl-Brak, M., Rosskopf, N., Sommer, M., and Zeitz, J.: High emissions of greenhouse gases from grasslands on peat and other organic soils, Global Change Biol., 22, 4134–4149, https://doi.org/10.1111/gcb.13303, 2016.
Wang, H., Yu, L., Zhang, Z., Liu, W., Chen, L., Cao, G., Yue, H., Zhou, J., Yang, Y., Tang, Y., and He, J. S.: Molecular mechanisms of water table lowering and nitrogen deposition in affecting greenhouse gas emissions from a Tibetan alpine wetland, Global Change Biol., 23, 815–829, https://doi.org/10.1111/gcb.13467, 2017.
Wanyama, L., Pelster, D. E., Butterbach-Bahl, K., Verchot, L. V., Martius, C., and Rufino, M. C.: Soil carbon dioxide and methane fluxes from forests and other land use types in an African tropical montane region, Biogeochemistry, 143, 171–190, https://doi.org/10.1007/s10533-019-00555-8, 2019.
Wilson, D., Farrell, C. A., Fallon, D., Moser, G., Muller, C., and Renou-Wilson, F.: Multiyear greenhouse gas balances at a rewetted temperate peatland, Global Change Biol., 22, 4080–4095, https://doi.org/10.1111/gcb.13325, 2016.
Wood, S. N.: Generalized Additive Models: An Introduction with R, 2nd edn., Chapman and Hall/CRC, https://doi.org/10.1201/9781315370279, 2017.
Wu, J., Cheng, X., Xing, W., and Liu, G.: Soil-atmosphere exchange of CH4 in response to nitrogen addition in diverse upland and wetland ecosystems: A meta-analysis, Soil Biol. Biochem., 164, 108467, https://doi.org/10.1016/j.soilbio.2021.108467, 2022.
Yang, G., Chen, H., Wu, N., Tian, J., Peng, C., Zhu, Q., Zhu, D., He, Y., Zheng, Q., and Zhang, C.: Effects of soil warming, rainfall reduction and water table level on CH4 emissions from the Zoige peatland in China, Soil Biol. Biochem., 78, 83–89, https://doi.org/10.1016/j.soilbio.2014.07.013, 2014.
Yang, G., Wang, M., Chen, H., Liu, L. F., Wu, N., Zhu, D., Tian, J. Q., Peng, C. H., Zhu, Q. A., and He, Y. X.: Responses of CO2 emission and pore water DOC concentration to soil warming and water table drawdown in Zoige Peatlands, Atmos. Environ., 152, 323–329, https://doi.org/10.1016/j.atmosenv.2016.12.051, 2017.
Yu, Z., Loisel, J., Brosseau, D. P., Beilman, D. W., and Hunt, S. J.: Global peatland dynamics since the Last Glacial Maximum, Geophys. Res. Lett., 37, L13402, https://doi.org/10.1029/2010gl043584, 2010.
Yue, P., Zuo, X., Li, K., Cui, X., Wang, S., Misselbrook, T., and Liu, X.: The driving effect of nitrogen-related functional microorganisms under water and nitrogen addition on N2O emission in a temperate desert, Sci. Total Environ., 772, 145470, https://doi.org/10.1016/j.scitotenv.2021.145470, 2021.
Zhang, L., Hou, L., Guo, D., Li, L., and Xu, X.: Interactive impacts of nitrogen input and water amendment on growing season fluxes of CO2, CH4, and N2O in a semiarid grassland, Northern China, Sci. Total Environ., 578, 523–534, https://doi.org/10.1016/j.scitotenv.2016.10.219, 2017.
Zhang, W., Wang, J., Hu, Z., Li, Y., Yan, Z., Zhang, X., Wu, H., Yan, L., Zhang, K., and Kang, X.: The Primary Drivers of Greenhouse Gas Emissions Along the Water Table Gradient in the Zoige Alpine Peatland, Water Air Soil Poll., 231, 224, https://doi.org/10.1007/s11270-020-04605-y, 2020.
Zhang, Y., Wang, G., and Wang, Y.: Changes in alpine wetland ecosystems of the Qinghai-Tibetan plateau from 1967 to 2004, Environ. Monit. Assess., 180, 189–199, https://doi.org/10.1007/s10661-010-1781-0, 2011.
Zhu, J., Chen, Z., Wang, Q., Xu, L., He, N., Jia, Y., Zhang, Q., and Yu, G.: Potential transition in the effects of atmospheric nitrogen deposition in China, Environ. Pollut., 258, 113739, https://doi.org/10.1016/j.envpol.2019.113739, 2020.