the Creative Commons Attribution 4.0 License.
the Creative Commons Attribution 4.0 License.
 | 19 Dec 2022
Spatial and temporal dynamics of suspended sediment concentrations in coastal waters of the South China Sea, off Sarawak, Borneo: ocean colour remote sensing observations and analysis
Jenny Choo
Nagur Cherukuru
Eric Lehmann
Matt Paget
Aazani Mujahid
Patrick Martin
Moritz Müller
High-quality ocean colour observations are increasingly accessible to support various monitoring and research activities for water quality measurements. In this paper, we present a newly developed regional total suspended solids (TSSs) empirical model using MODIS Aqua's Rrs(530) and Rrs(666) reflectance bands to investigate the spatial and temporal variation in TSS dynamics along the southwest coast of Sarawak, Borneo, with the application of the Open Data Cube (ODC) platform. The performance of this TSS retrieval model was evaluated using error metrics (bias = 1.0, MAE = 1.47, and RMSE = 0.22, in milligrams per litre) with a log10 transformation prior to calculation as well as using a k-fold cross-validation technique. The temporally averaged map of the TSS distribution, using daily MODIS Aqua satellite datasets from 2003 until 2019, revealed that large TSS plumes were detected – particularly in the Lupar and Rajang coastal areas – on a yearly basis. The average TSS concentration in these coastal waters was in the range of 15–20 mg L−1. Moreover, the spatial map of the TSS coefficient of variation (CV) indicated strong TSS variability (approximately 90 %) in the Samunsam–Sematan coastal areas, which could potentially impact nearby coral reef habitats in this region. Study of the temporal TSS variation provides further evidence that monsoonal patterns drive the TSS release in these tropical water systems, with distinct and widespread TSS plume variations observed between the northeast and southwest monsoon periods. A map of relative TSS distribution anomalies revealed strong spatial TSS variations in the Samunsam–Sematan coastal areas, while 2010 recorded a major increase (approximately 100 %) and widespread TSS distribution with respect to the long-term mean. Furthermore, study of the contribution of river discharge to the TSS distribution showed a weak correlation across time at both the Lupar and Rajang river mouth points. The variability in the TSS distribution across coastal river points was studied by investigating the variation in the TSS pixels at three transect points, stretching from the river mouth into territorial and open-water zones, for eight main rivers. The results showed a progressively decreasing pattern of nearly 50 % in relation to the distance from shore, with exceptions in the northeast regions of the study area. Essentially, our findings demonstrate that the TSS levels on the southwest coast of Sarawak are within local water quality standards, promoting various marine and socio-economic activities. This study presents the first observation of TSS distributions in Sarawak coastal systems with the application of remote sensing technologies and aims at enhancing coastal sediment management strategies for the sustainable use of coastal waters and their resources.
- Article
(9027 KB) - Full-text XML
-
Supplement
(1030 KB) - BibTeX
- EndNote


Total suspended solids (TSSs) play an important role in the aquatic ecosystem as one of the primary water quality indicators of coastal and riverine systems (Alcântara et al., 2016; Cao et al., 2018; Chen et al., 2015a; González Vilas et al., 2011; Mao et al., 2012). For example, elevated concentrations of TSSs in water have an adverse impact on fisheries and biodiversity of the aquatic ecosystem (Bilotta and Brazier, 2008; Chapman et al., 2017; Henley et al., 2000; Wilber and Clarke, 2001). Understanding the impacts of varying water quality in relation to the TSS status has been one of the primary concerns with respect to a country's growing “blue economy” status and the sustainable management of aquatic resources (K. H. Lee et al., 2020; Sandifer et al., 2021; World Bank and United Nations Department of Economic and Social Affairs (UNDESA), 2017). With about 40 % of the world's population living within 100 km of coastal areas (United Nations, 2017) and more than 80 % of the population in Malaysia living within 50 km of the coast (Praveena et al., 2012), water quality monitoring and management efforts are important at both the regional and global scale.
Studying the TSS distribution can provide insights into the connections between land and ocean ecosystems (Howarth, 2008; Lemley et al., 2019; Lu et al., 2018). For instance, TSS dynamics allow us to understand the impacts of sediment transport and sediment plumes, particularly in areas experiencing large-scale deforestation, land conversion, and damming of rivers (Chen et al., 2007; Espinoza Villar et al., 2013). Sarawak (Malaysian Borneo) has experienced significant land use and land cover change activities over the past 4 decades, with widespread land conversion and deforestation for development and large-scale plantation activities (Gaveau et al., 2016), as well as the building of major road infrastructures, such as the Pan-Borneo Highway, and hydroelectric dams (Alamgir et al., 2020). As a result, river and coastal systems may potentially drive large TSS loads into downstream systems and into the marine and open-ocean waters.
Situated in the southern part of the South China Sea, the region of Sarawak, Malaysian Borneo, has a coastline of about 1035 km, along which mangrove forests are dominant (Long, 2014). The coastal regions of Sarawak are rich in marine coastal biodiversity and coral reefs, which can be found in the northeastern and southwestern parts of Sarawak (Praveena et al., 2012). While the coasts of Sarawak provide important socio-economic value for the local communities (W. C. Lee et al., 2020), these coastal areas are potentially facing water quality degradation due to TSS riverine outputs in response to land use and land cover change activities.
TSS water samples collected in the field are commonly measured using conventional laboratory-based methods to quantify TSS concentrations (Ling et al., 2016; Mohammad Razi et al., 2021; Soo et al., 2017; Soum et al., 2021; Tromboni et al., 2021; Zhang et al., 2013). Currently, real-time high-frequency TSS observations using modern optical and bio-sensor systems are also possible (Bhardwaj et al., 2015; Horsburgh et al., 2010). These sensors can be generally found onboard ship and buoy-based observation platforms. However, it remains a challenge to quantify TSS concentrations with a large spatial coverage and high temporal frequency using these approaches.
Ocean colour remote sensing technologies represent an increasingly accessible and powerful tool to provide a synoptic view for short- or long-term water quality studies at high temporal and spatial resolutions (Cherukuru et al., 2016a; Slonecker et al., 2016; Swain and Sahoo, 2017; Wang et al., 2017; Werdell et al., 2018). Remote sensing can help overcome several constraints of conventional intensive field campaigns such as the following: (i) costly field campaigns from boat rentals or cruises; (ii) time-consuming and inadequate labour; and, most importantly for this study, (iii) limited spatial and temporal field coverage. NASA's Moderate Resolution Imaging Spectroradiometer (MODIS) aboard the Aqua satellite (https://modis.gsfc.nasa.gov/about/, last access: 1 November 2021) has a distinctive advantage due to its daily revisit time, spatial resolution of 250–1000 m, and large collection of ocean colour data beginning in 2002. Other sensors offering ocean colour measurement capabilities include Landsat-8, which, in comparison with MODIS Aqua, has a 16 d revisit time and a high spatial resolution of 30 m. Additionally, the Sentinel-2 Multispectral Instrument (MSI) (10–60 m) and Sentinel-3 Ocean and Land Colour Instrument (OLCI) (300 m) missions provide global coverage of high-resolution ocean and land observations, with a revisit time of 10 and 2 d respectively (European Space Agency, 2022a, b). Despite the powerful ability of Landsat 8 and Sentinel-2 to capture higher-resolution images, their longer revisit intervals may not be suitable for characterizing and studying a large swath of coastal waterbodies due to the high dynamics of various water constituents. While Sentinel-3 OLCI offers a shorter revisit time, this mission has a relatively smaller collection of ocean data stored (the mission was launched in 2016) in comparison with the MODIS Aqua data collection.
Several MODIS-derived models have been developed for TSS retrievals (Chen et al., 2015b; Espinoza Villar et al., 2013; Jiang and Liu, 2011; Kim et al., 2017; Y. Zhang et al., 2010), including empirical, semi-analytical, and machine-learning approaches (Balasubramanian et al., 2020; Jiang et al., 2021). However, the performance of these models has proven to be unsatisfactory, with recorded low r2 and high bias and mean absolute error (MAE) values when tested with in situ TSS datasets (Table S1 in the Supplement). Generally, optical water types are categorized based on the water reflectance signatures, which are influenced by varying optical water constituents, such as the coloured dissolved organic matter, suspended sediment, and phytoplankton presence in the water column (Aurin and Dierssen, 2012; Balasubramanian et al., 2020; Moore et al., 2009). While these global TSS remote sensing models address the need to improve TSS retrievals and to monitor global TSS trends in various water class types, they tend to underperform in more localized and regional studies (Mao et al., 2012; Ondrusek et al., 2012). The coastal waters of Borneo are well mixed throughout the year and are enriched with suspended material and dissolved organic matter (Müller et al., 2016). Various water quality studies of the river systems have been actively carried out to assess the dynamics of numerous water quality constituents in response to human activities, with TSS concentrations being one of the primary environmental concerns in this region (Ling et al., 2016; Müller-Dum et al., 2019; Tawan et al., 2020). Although studies on the water quality of coastal systems in Borneo have gradually gained much attention (Cherukuru et al., 2021; Tang and Lee, 2010; Martin et al., 2018; Soo et al., 2017), there is still much knowledge to gain on the understanding of how coastal waters in the region have been impacted by TSS loadings and transport over large spatial and temporal scales.
Here, in this paper, we present a new regional empirical TSS remote sensing model. While various remote sensing models have their own unique computational strengths, this study demonstrates the reliability of a band ratio TSS model when applied in optically complex waters. With the ongoing efforts to address and minimize water quality degradation in coastal systems, as outlined in the United Nations' Sustainability Development Goals no. 14, our study aims to apply the new empirical regional TSS remote sensing model to (a) investigate the spatial and temporal variability in TSSs; (b) identify hotspots of TSS distribution in the coastal waters of Sarawak, Malaysian Borneo, using a long time series of MODIS Aqua data from year 2003 until 2019; and (c) study the varying monsoonal and river discharge patterns in relation to TSS distribution at the river mouths located within the study case area. With the growing accessibility of freely available satellite datasets, the application of an Open Data Cube (ODC) platform provides an advanced tool to access scalable spatial imageries datasets and process time series of satellite data for Earth observation studies (Open Data Cube, 2021). As such, this study implements the application of an ODC platform, which is further demonstrated in this work.

Figure 1Flowchart summarizing the processes of developing a regional TSS remote sensing model and applying it to analyse the spatial and temporal variation in TSSs over the study region, using MODIS Aqua data from year 2003 until 2019. Long-term MODIS Aqua datasets were analysed and mapped on an Open Data Cube (ODC) platform with implementation of robust Python libraries and packages.
Figure 1 summarizes the processes carried out in this study. The spatial and temporal variation in the TSS distribution was mapped using an atmospherically corrected MODIS Aqua Level 2 product.
2.1 Area of study
Our study focuses on the southwestern coast of Sarawak (between 1.9∘ N, 109.65∘ E and 2.8∘ N, 111.5∘ E) in Malaysia, which is located in the northwestern part of the island of Borneo. Generally, Borneo (between 3.01∘ S, 112.18∘ E and 6.45∘ N, 117.04∘ E) contains rich tropical rainforests and biodiversity on the lands of Sarawak and Sabah (Malaysia), Brunei, and Indonesia. Typically, Sarawak is a tropical climate region, recording an average ambient temperature of 27.8 ∘C (variation of 1.8 ∘C) throughout the year. It records high precipitation with an average of 4116.7 mm yr−1 in Kuching (1.5535∘ N, 110.3593∘ E), the capital city of Sarawak. Yearly, it experiences both a dry and wet season, which is influenced by (i) the southwestern monsoon (May to September) and (ii) the northeastern monsoon (November to March). Rivers in Sarawak are connected to the South China Sea and flow through various plantation types, such as palm oil, rubber, and sago (Davies et al., 2010).
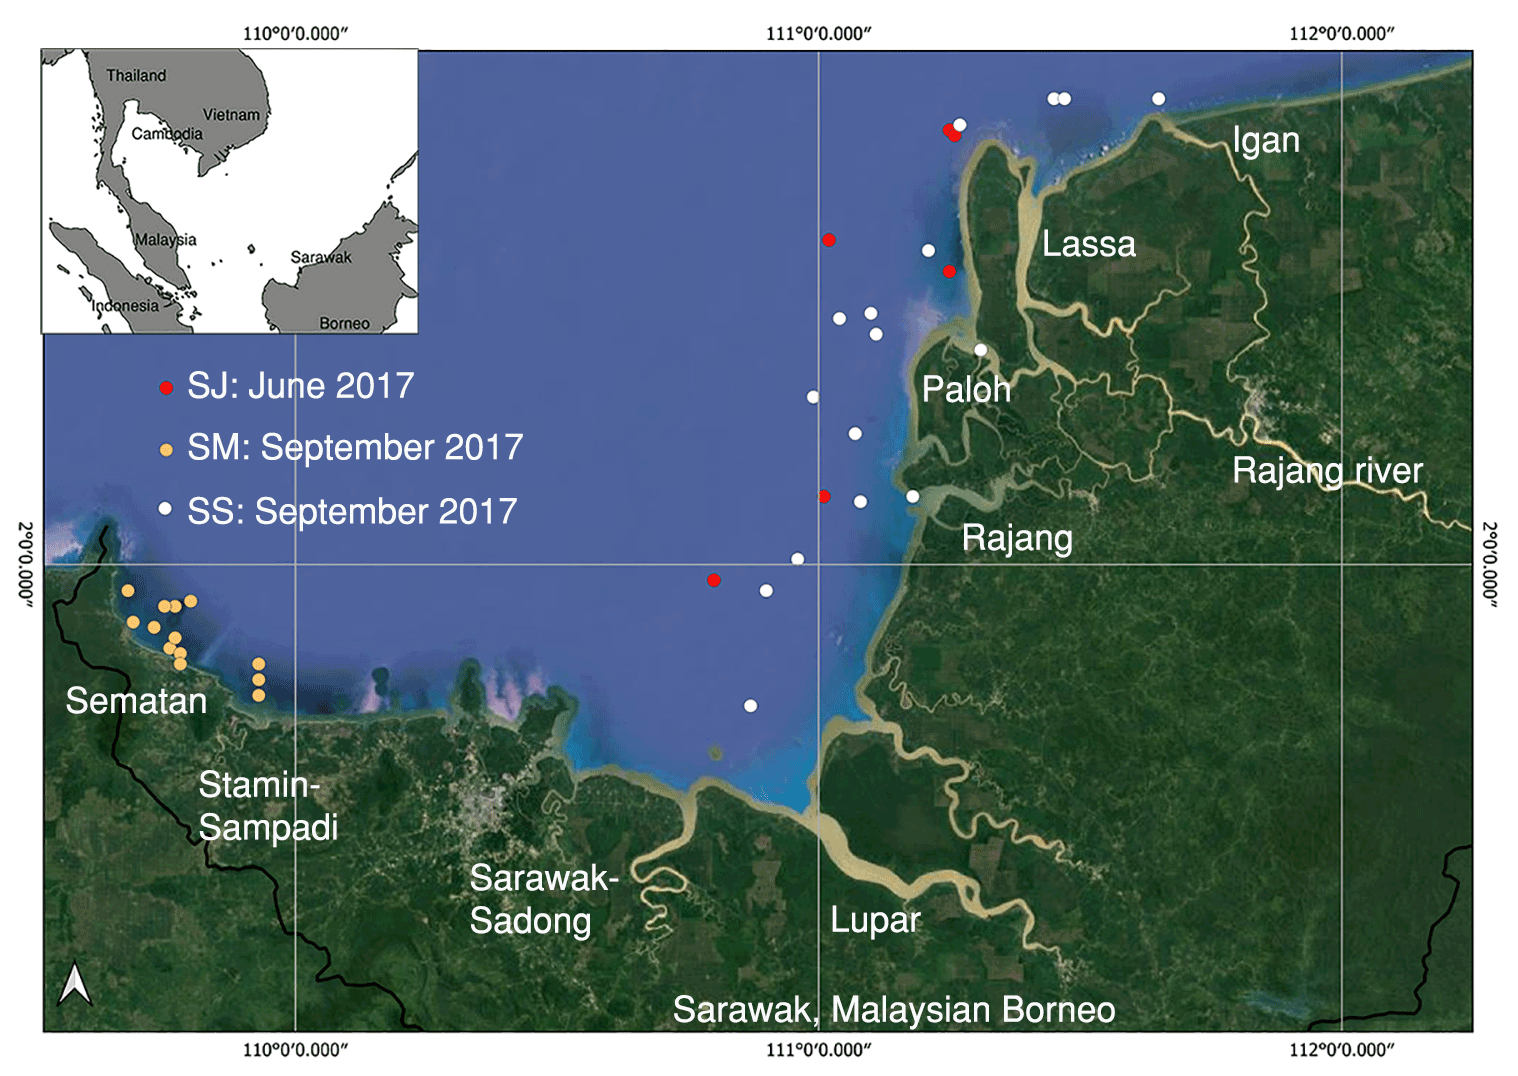
Figure 2Map of the study area (©Google Maps), located in the southwestern part of Sarawak, Malaysia (inset). Indicators show the location of sampling sites used during field expeditions carried out in June and September 2017.
In this study, the southwestern part of Sarawak's coastal regions (between 1.9∘ N, 109.65∘ E and 2.8∘ N, 111.5∘ E; Fig. 2) was studied, which comprises several major rivers (e.g. the Lupar, Sebuyau, and Sematan), as well as the Rajang River, the longest river in Malaysia. The Rajang River basin consists of a tidal river channel which splits into the northwestern (Igan, Lassa, and Paloh) and southwestern (Rajang an Belawai) Rajang River delta (Staub et al., 2000). The Rajang River basin drains a dominant area (> 50 000 km2) of sedimentary rocks (Milliman and Farnsworth, 2013; Staub et al., 2000) extending from Belaga to Sibu, with major peatland areas that have been converted into palm oil plantations (Gaveau et al., 2016) as its river flows into the South China Sea (Milliman and Farnsworth, 2013). Major settlements along the Rajang River comprise the Kapit and Kanowit town areas as well as Sibu city, which has a total population size of about 388 000 inhabitants (Department of Statistics, 2020). The Lupar and Saribas rivers comprise a catchment area size of approximately 6500 and 1900 km2 respectively (Lehner et al., 2006). Situated on the southwestern side of the Rajang catchment, the Lupar and Saribas rivers surround the Maludam National Park, which is Sarawak's remaining biggest single patch of peat swamp forest (Sarawak Forestry Corporation, 2022). Adjacent to the Lupar River mouth is the Sadong River, with an approximate catchment area size of 3500 km2 (Kuok et al., 2018). Sadong River is about 150 km long and flows through palm oil plantations (Staub and Esterle, 1993). These river systems are associated with increasing land use activities and land cover changes in this region, which essentially transport and connect various biogeochemical water components to the coastal systems of Sarawak.
2.2 In situ TSS measurements
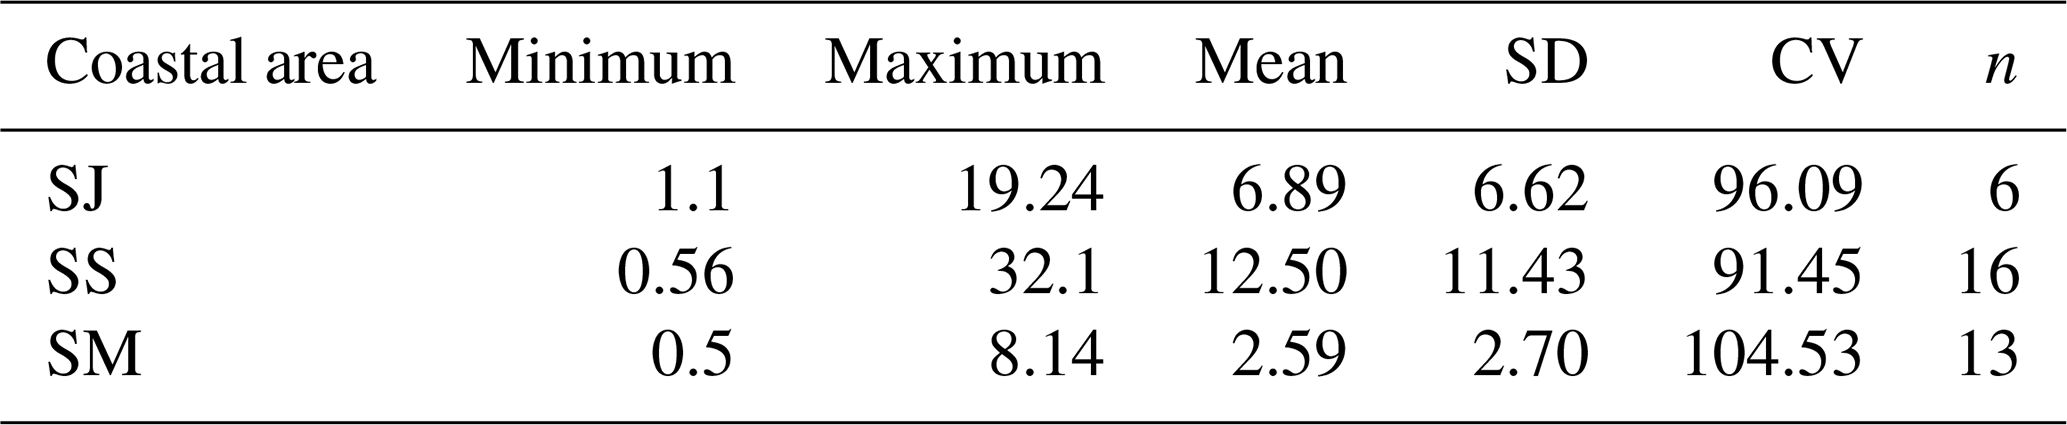
TSS measurements were taken from Martin et al. (2018). A total of 35 coastal sites were studied and are denoted as SJ, SS, and SM (see Table 1 and Fig. 2). These water samples were collected in the month of June (SJ region) and September (SS and SM regions) in 2017. Water samples were filtered, and filters were dried and ashed prior to the weighing process. Full details of the water sampling and TSS analysis are available in Martin et al. (2018).
2.3 Development, calibration, and validation of the TSS model
In situ remote sensing reflectance spectral data, Rrs(λ), and 35 measured TSS values were used to develop a new remote sensing TSS empirical model for MODIS Aqua for this case study. Field measurements of the SM, SJ, and SS datasets, as shown in Table 1, were used to calibrate the MODIS Aqua TSS remote sensing model.
Table 1Summary statistics of TSS values collected at the SJ, SS, and SM areas located within coastal regions in this study, with a total of 35 datasets recorded.
For the in situ remote sensing reflectance, Rrs(λ) readings, a TriOS RAMSES spectral imaging radiometer was used to measure downwelling irradiance, Ed(λ), and upwelling radiance, Lu(λ), with measurement protocols from Mueller et al. (2002). These measurements were recorded under stable sky and sea conditions during the day (10:00 to 16:00 UTC+8) with high solar elevation angles.
Measurements of reflectance, Rrs(λ), were recorded concurrently with the collection of water samples (as described in Sect. 2.2) at wavelengths ranging from 280 to 950 nm, covering the spectrum of the ultraviolet, visible, and near-infrared bands. These measurements were recorded on a float to capture Lu(0−, λ) and Ed(0+, λ), where 0− and 0+ refer to below and above the surface respectively.
Remote sensing reflectance, Rrs(λ), was computed as follows with reference to Mueller et al. (2002):
where p = 0.021 refers to the Fresnel reflectance, and n=1.34 is the refractive index of water. Full details of this methodology can be found in Cherukuru et al. (2021).
2.3.1 Calibration of the empirical model and application to MODIS Aqua
With the intention of applying a regional TSS remote sensing model to MODIS Aqua data, a total of 35 in situ spectral data of different TSS datasets, which were collected under coastal conditions (salinity > 15 PSU), were convolved with MODIS Aqua spectral response function values (Pahlevan et al., 2017) at each centre wavelength of individual band channels (NASA Official, 2022b). MODIS Aqua offers visible bands of violet/blue (412, 443, 469, and 488 nm), green (531, 547, and 555 nm), red (645, 667, and 678 nm), and near-infrared wavelengths (748, 859, and 869 nm) for remote sensing of coastal waters (NASA Official, 2022a). The in situ spectra data were resampled to MODIS Aqua's central spectral bands based on the aforementioned information. Measurements of in situ spectral data enhance the understanding of bio-optical water characteristics of a localized region, and they increase the sensitivity of radiometric measurements without atmospheric interferences while being subject to the radiometer's calibration condition (Brezonik et al., 2015; Cui et al., 2010; Dorji and Fearns, 2017; Slonecker et al., 2016).
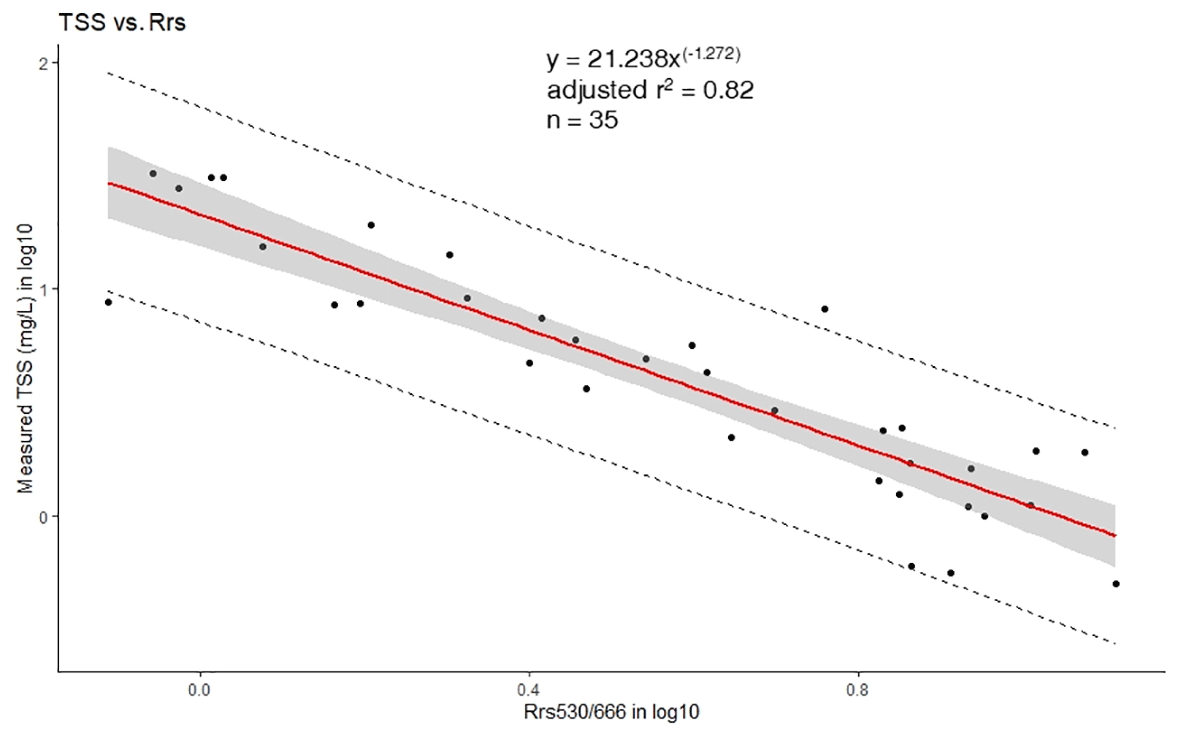
Figure 3Empirical relationship of TSS retrieval between the in situ band ratio and the measured TSS concentration (mg L−1), as established via a power law function. The upper and lower dashed lines indicate the 95 % prediction interval of the regression.
In this study, retrieval of water constituents was established using spectral band ratio combinations, which have proven to be a straightforward yet reliable method for estimating water constituents in optically turbid waters (Ahn and Shanmugam, 2007; Cao et al., 2018; Lavigne et al., 2021; Morel and Gentili, 2009; Neil et al., 2019; Siswanto et al., 2011). Band ratio models help to offset signal noise, such as the effects of the atmosphere and irradiance of spectral reflectance, to a certain degree (Cherukuru et al., 2016b; Ha et al., 2017; Hu et al., 2012; Liu et al., 2019).
A variety of models using single bands as well as a combination of MODIS Aqua's blue, green, and red bands (412, 440, 488, 532, 555, and 660 nm) were calibrated using field measurements as the dependent variable. The calibration process was tested out using various model functions, including linear, power, exponential, and logarithmic functions. The best empirical TSS retrieval model was fitted by means of a regression between the in situ TSS data and in situ radiometer values, and it can be expressed as follows:
This power function model resulted in a coefficient of determination (r2) of 0.82 (Fig. 3).
2.3.2 Performance assessment and validation of MODIS Aqua empirical model
An assessment of the performance error of the newly developed TSS model was carried out as per the recommendation of Seegers et al. (2018) for interpreting ocean colour models (Table 2). The performance metrics used here include the bias, mean absolute error (MAE), root-mean-squared error (RMSE), coefficient of variation (CV), and coefficient of determination (r2), which are based on the following calculations:
Here, M represents the modelled TSS values, n is the number of samples, O represents the observed TSS measurements, σ refers to standard deviation, and μ represents the mean value.
Equations (3)–(5) use a log10 transform of the data, as the range of TSS values can span several orders of magnitude. As such, an application of the log transformation prior to error metric calculation allows us to account for uncertainties that are proportional to the concentration values (Balasubramanian et al., 2020; Seegers et al., 2018).
Table 2Calibration and accuracy assessment of the newly derived MODIS Aqua models in this study for TSS estimations tested using various model functions. Calculation for bias, MAE, and RMSE use a log transformation of the data prior to calculation of error metric measurements, as adapted from Seegers et al. (2018) and Balasubramanian et al. (2020). The band ratio is established as function x. The power function model is selected based on low performance metric values.
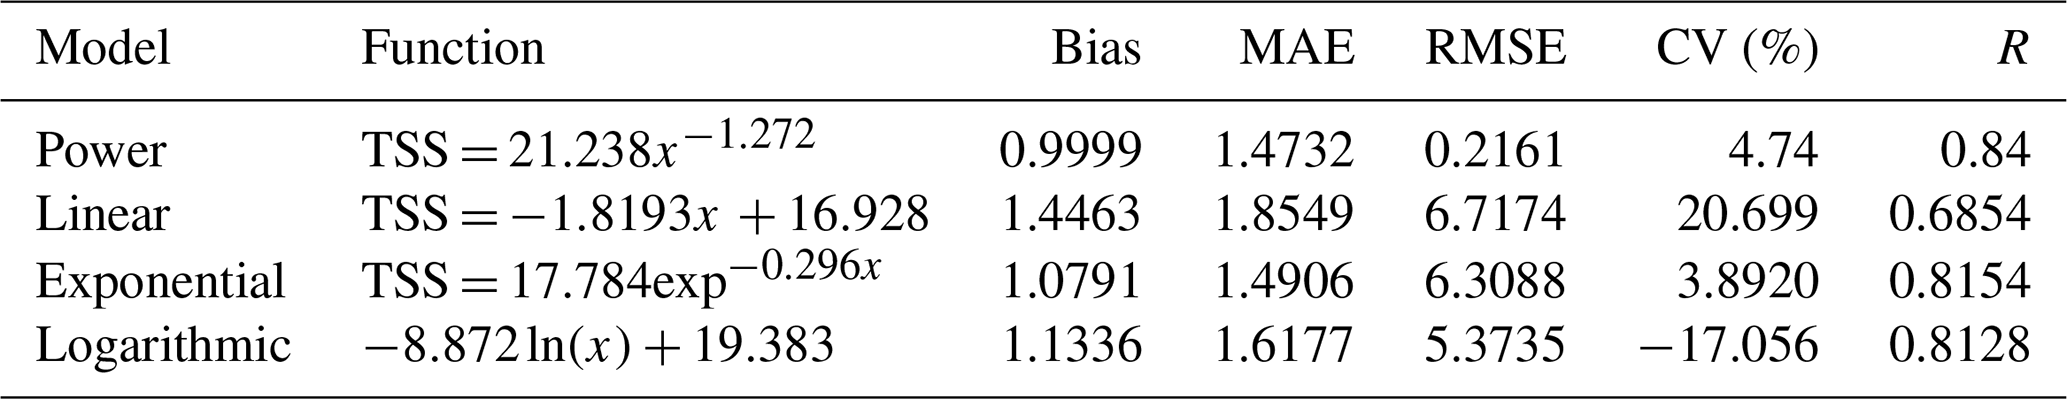
Table 3Assessment of fitting error for the proposed TSS model, using k-fold cross validation.
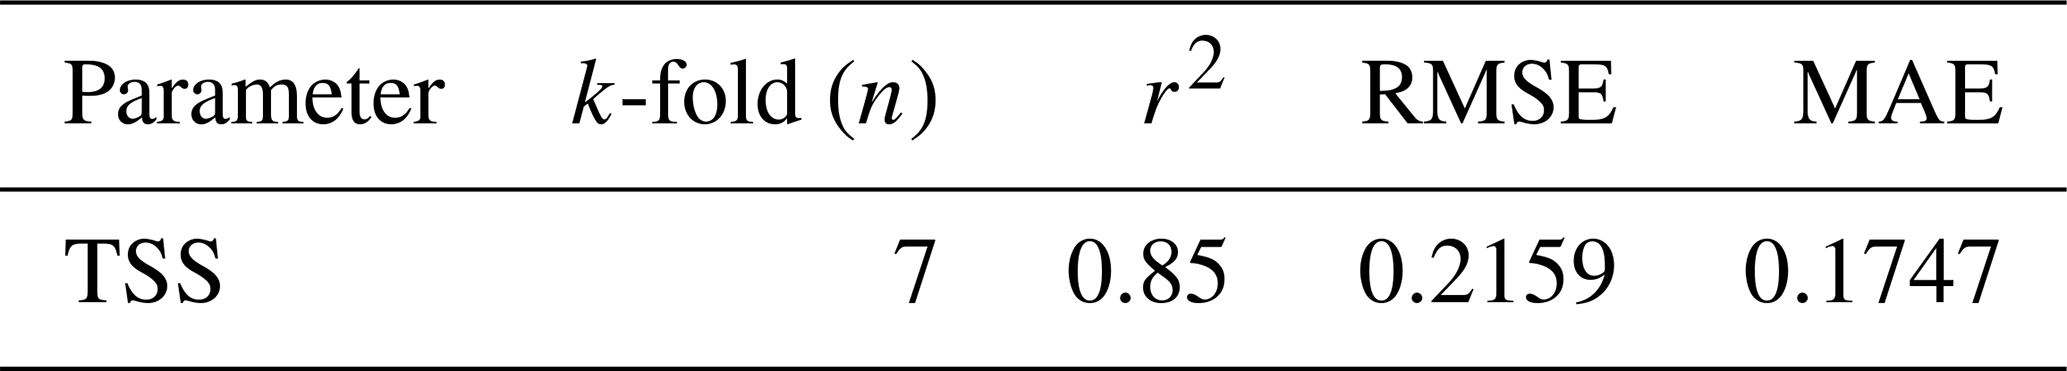
An evaluation of the model was performed using a k-fold cross-validation technique (Refaeilzadeh et al., 2009) given the small size of the TSS dataset used in this study (Table 3). A selection of k = 7 was assigned to split the datasets into k groups with an equal number of data points.
While these results point to low error levels achieved by the proposed regional TSS retrieval model (Table 2), caution should be used when applying it to various water types. Water type classification has been thoroughly described by Balasubramanian et al. (2020), who classed waters into Type I (blue–green waters), Type II (green waters), and Type III (brown waters). Essentially, the green-to-red band ratio is optimized with these datasets corresponding to sediment-dominated and yellow-substance-loaded water conditions. As highlighted by Morel and Belanger (2006), waters of this type do not have the same spectral characteristics as phytoplankton-rich waters (also known as Case 1 waters). In addition to the impact on water clarity, sediment particles (often red–brownish coloured) also tend to enhance the backscattering and absorption properties, especially at shorter wavelengths (Babin et al., 2003), while the additional presence of coloured dissolved matter (yellow substance) leads to strong absorption properties at short wavelengths. As the TSS retrieval model was developed from samples taken in waters that are bio-optically rich in suspended solids and dissolved organic matter, an application of this TSS model needs to be done cautiously when applying it to other water types, particularly those with a large concentration of phytoplankton.
2.4 Application of the TSS retrieval model
Daily MODIS Aqua satellite data from the year 2003 to 2019 (total of 6192 individual time slices) were studied with a 2∘ × 2∘ spatial resolution (latitude: 1.22, 3.35; longitude: 109.38, 112.0) which covers the southwestern coastal region of Sarawak and southern part of the South China Sea. Atmospherically corrected MODIS Aqua Level 2 reflectance data (Bailey et al., 2010; NASA Official, 2022a) were retrieved for the application of the TSS model proposed in this study. Negative remote sensing reflectance values, possibly due to the failure of atmospheric correction, were filtered out before applying the retrieval model, as expressed in Eq. (2), to map the spatial and temporal distribution of TSS estimates. In addition, averaging of spatial and temporal TSS variation maps in this study was carried out by filtering TSS values with fewer than 10 valid data points over the whole time series, along with the application of a sigma-clipping operation (see https://docs.astropy.org/en/stable/api/astropy.stats.sigma_clip.html, last access: 1 June 2021).
2.4.1 Open Data Cube
In this study, the analysis of remote sensing data over large spatial extents and at high temporal resolution was carried out using robust Python libraries and packages run on an Open Data Cube (ODC) platform. Open Data Cube is an open-source advancement in computing technologies and data architectures that addresses the growing volume of freely available Earth observation (EO) satellite products (Giuliani et al., 2020; Killough, 2019). ODC provides a collection of software packages that index, manage, and process large EO datasets, such as satellite products from the MODIS, Landsat, and Sentinel missions (Gomes et al., 2021). These satellite datasets are structured in a multidimensional array format and provide layers of information across latitude and longitude (Open Data Cube, 2021). Leveraging the growing availability of analysis-ready data (ARD), and with support from the Committee on Earth Observation Satellites (CEOS) (Killough, 2019), the ODC concept has been deployed in many countries across the world. These existing deployments include Digital Earth Africa (https://www.digitalearthafrica.org/, last access: 27 October 2021), Digital Earth Australia (DEA) (https://www.dea.ga.gov.au/, last access: 27 October 2021), Vietnam Open Data Cube (Vietnam National Space Centre, 2018), and Brazil Data Cube (https://github.com/brazil-data-cube, last access: 27 October 2021), which provide various time series datasets of the changing landscape and water content in these specific regions (Giuliani et al., 2020; Gomes et al., 2021; Killough, 2019; Lewis et al., 2017). The ecosystem and architecture of ODC is well explained at opendatacube.org. The codes and tools used in this application drew upon the information provided in various DEA notebooks (Krause et al. (2021), which can be found at https://github.com/GeoscienceAustralia/dea-notebooks/, last access: 27 October 2021.
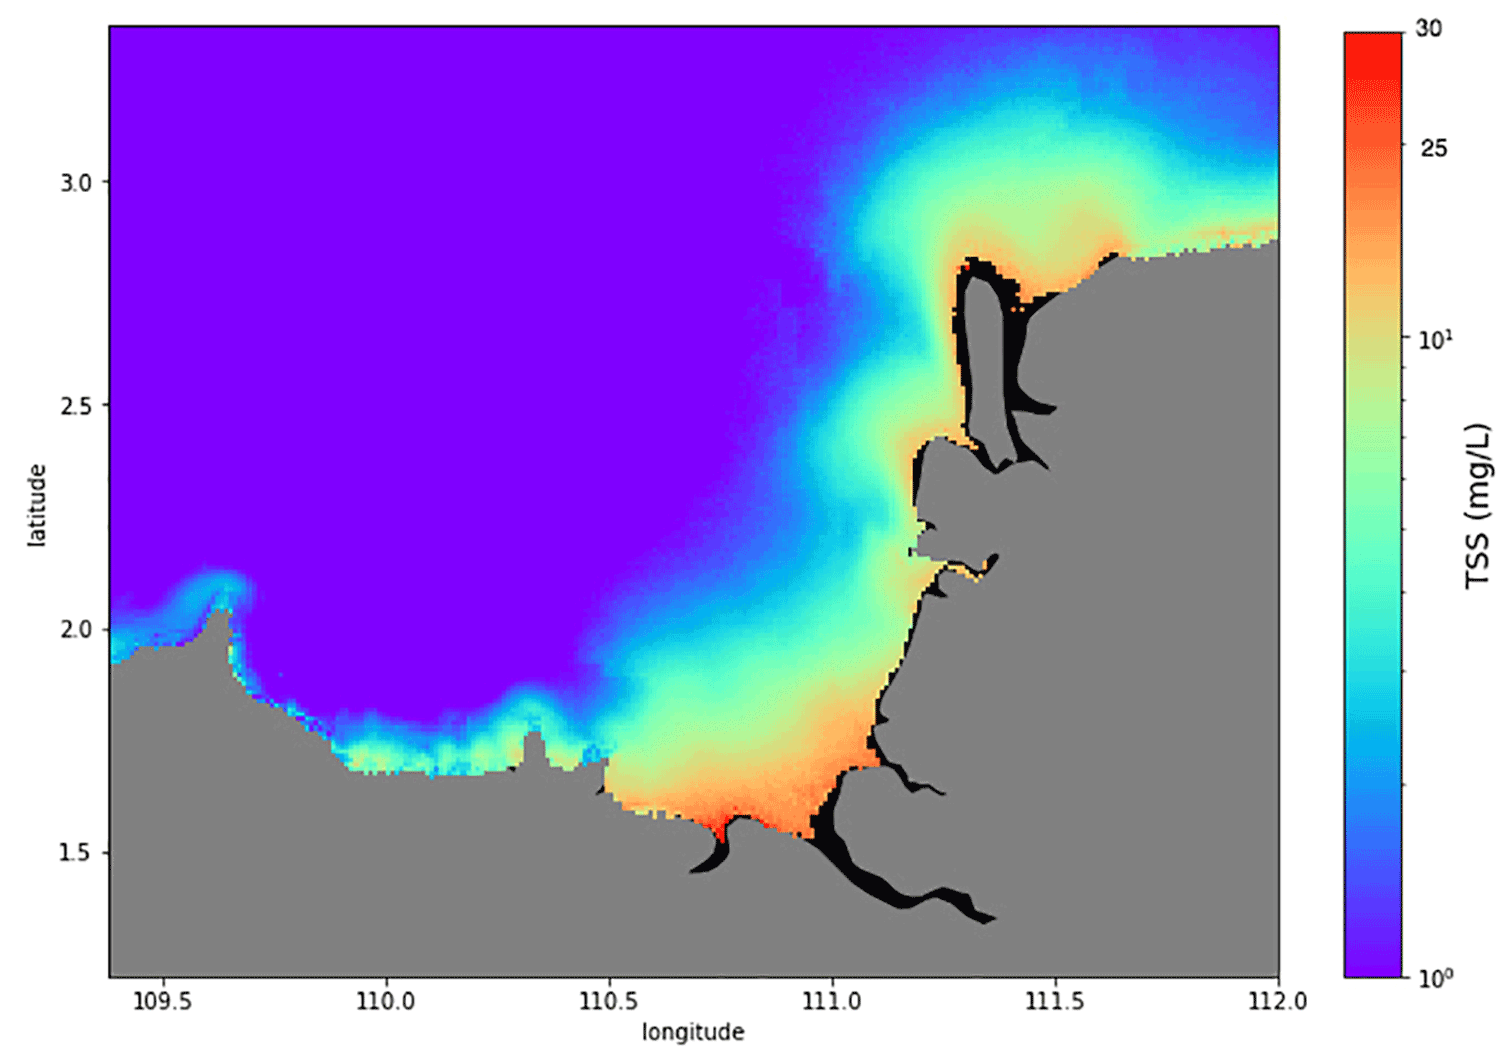
Figure 4Temporally averaged 2∘ × 2∘ map of TSS distribution (on a log scale) across the time dimension for each pixel.
2.5 Precipitation data and computation of river discharge
Monthly precipitation values (mm) over the Lupar and Rajang basins were extracted from the Global Precipitation Measurement (GPM) Level 3 Integrated Multi-satellitE Retrievals for GPM (IMERG) satellite datasets (https://gpm.nasa.gov/data/imerg, last access: 1 July 2021) in order to assess the influence of precipitation in each river basin in relation to the TSS concentration at the corresponding river mouth (Figs. S4–S7 in the Supplement).
Derivation of river discharge (m3 s−1) was computed using total precipitation estimates (mm) over each river basin and was multiplied by a surface discharge runoff factor for the studied region (Sim et al., 2020). The surface runoff was estimated to be 60 % of total precipitation (Staub et al., 2000; Swaine, 1985). In this study, the Rajang River basin as well as the combined basins of the Lupar, Sadong, and Saribas rivers (hereafter referred to as the Lupar Basin) were studied for their river discharge rates in relation to the TSS release.
3.1 Spatial variation in the TSS distribution
Changes in TSS distribution occur across space and time. The regional TSS remote sensing model calibrated in this study was applied to the time series of MODIS Aqua data to study the variability in the spatial TSS distribution and identify potential hotspot areas susceptible to TSS water quality degradation. The map of average TSSs for the Sarawak region was generated (Eq. 2) by averaging all the daily MODIS Aqua TSS images (2003 to 2019), and it is presented in Fig. 4. The results show that the waters in the northeastern region of the study area, stretching from the Sadong River to the Rajang/Igan River, have seen sustained levels of TSSs over the 17 years considered in this study.
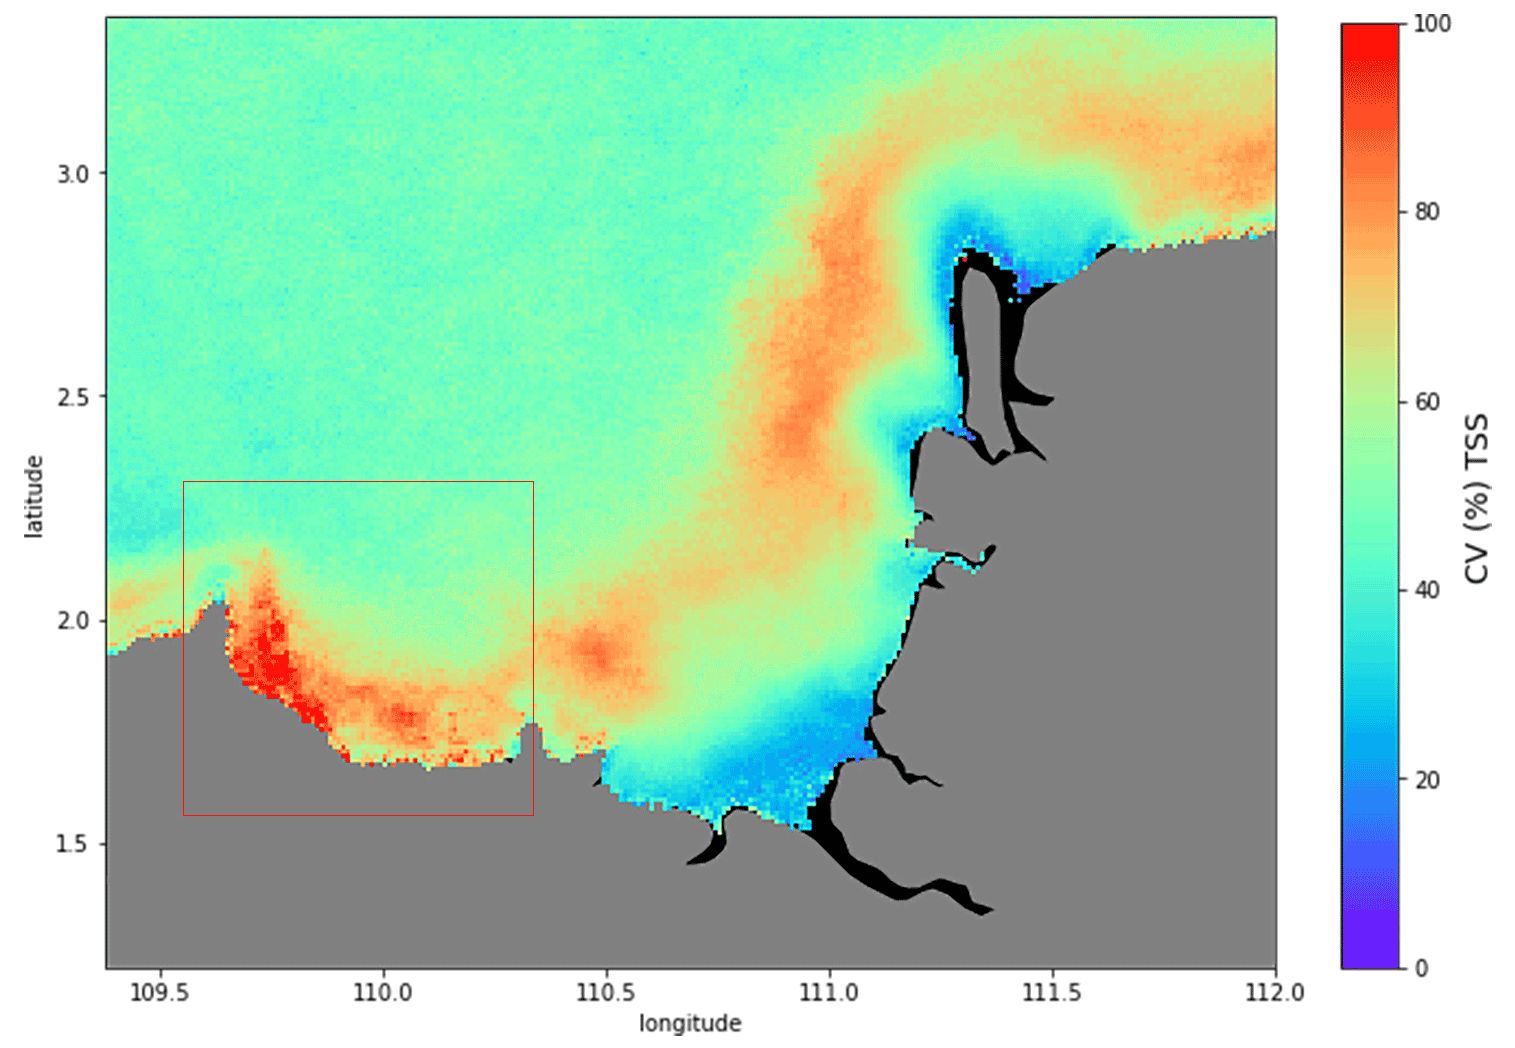
Figure 5Map of the CV (%) calculated from the daily time series of MODIS Aqua satellite images from 2003 until 2019.
The temporally averaged spatial distribution map (Fig. 4) shows TSS concentrations in the range of 15–20 mg L−1 near the river mouth areas, with widespread TSS plumes extending into the South China Sea (Fig. 5). Based on the Malaysian Marine Water Quality Criteria and Standard (Table S2 in the Supplement) (Department of Environment, 2019), these coastal waters fall under Class 1 in relation to their TSS (mg L−1) status. This classification indicates that these coastal waters support and preserve marine life in this local region. However, several studies have expressed concerns regarding high TSS loadings in riverine waters owing to the impacts of various land use and land cover (LULC) changes (Ling et al., 2016; Tawan et al., 2020). Among these, the Rajang River has been highlighted as being heavily impacted by various LULC activities, such as large-scale deforestation and the construction of hydropower dams (Alamgir et al., 2020). In situ water quality studies by Ling et al. (2016) reported high TSS estimates in one of the upstream tributaries of Rajang River, the Baleh River, with TSS readings up to approximately 100 mg L−1. Another study by Tawan et al. (2020) reported a significant TSS release reaching to 940 000 mg d−1 during wet seasons, with maximum TSS concentrations of 1700 mg L−1 in the upstream tributaries of the Rajang River, particularly in the Baleh and Pelagus rivers. The majority of the upstream tributary rivers were categorized as Class II (during the dry season) and Class III (during the wet season) waters according to the National Water Quality Index (Table S3 in the Supplement) (Department of Environment, 2014), due to increased soil erosion from surrounding LULC activities (Tawan et al., 2020). These local in situ findings provide valuable insights into point source TSS estimates in these LULC change regions. Coupled with our spatial map of average TSSs captured by remote sensing technologies, our findings seem to suggest that a large portion of TSS loadings from inland and upstream rivers would have settled and deposited in these river channels and were not completely discharged outwards into the coastal areas, which would have caused major water quality degradation in the corresponding coastal systems.
Historical patterns in the TSS concentrations were assessed by comparing annual maps of the average TSS distribution (Fig. S1 in the Supplement) as well as time series of TSS estimates at the Lupar and Rajang river mouths (Fig. S2 in the Supplement). From our findings, the annual TSS maps further support the observation that TSS release was evident at the Lupar and Rajang/Igan river mouths from 2003 until 2019, which points to Class I local water quality standards in relation to the TSS (mg L−1) status. This was found to consistently occur every year. Furthermore, the TSS trend study showed that both the Lupar and Rajang river mouth points present a gradual increase in the TSS concentration over the 17 years (see Fig. S2 in the Supplement). This increasing trend was, however, not statistically significant (p = 0.43 for Lupar and p = 0.15 for Rajang).
Moreover, a map of the TSS coefficient of variation (CV) was computed to identify areas with a high degree of relative TSS variation over time (Fig. 5). Here, again, the map of the CV (%) was produced by aggregation of the daily MODIS Aqua images (6192 time steps) from 2003 until 2019. Figure 5 shows that the Samunsam–Sematan coastal region (as highlighted by the red box) exhibits an increased level of TSS distribution variability, with a recorded CV of more than 90 %.
The Samunsam–Sematan coastal region contains near-pristine mangrove forests which are sheltered from major LULC activities, compared with other studied sites. Samunsam–Sematan is also locally well-known as a recreational hotspot due to the presence of coral reefs and various national parks (Sarawak Tourism Board, 2021). Data from the Center for International Forestry Research (CIFOR) “Forest carbon database” (CIFOR, 2021) revealed that there was more than double the amount of total forest loss (approx. 5000 Ha) recorded in Lundu, a nearby township in the Sematan area, in 2011 compared with the previous years. Deforestation activities, regardless of their scale, can inevitably promote sediment loss and soil leaching into the nearby river systems (Yang et al., 2002). Important information regarding the variability in water quality (as shown in Fig. 5) can provide support to local authorities and relevant agencies in order to identify vulnerable areas that need to be monitored closely, such as the Lundu–Sematan region in this case. Thus, the CV map offers interesting insights into how the TSS distribution can vary across large spatial areas, which can ultimately impact local socio-economic activities in this region (W. C. Lee et al., 2020).
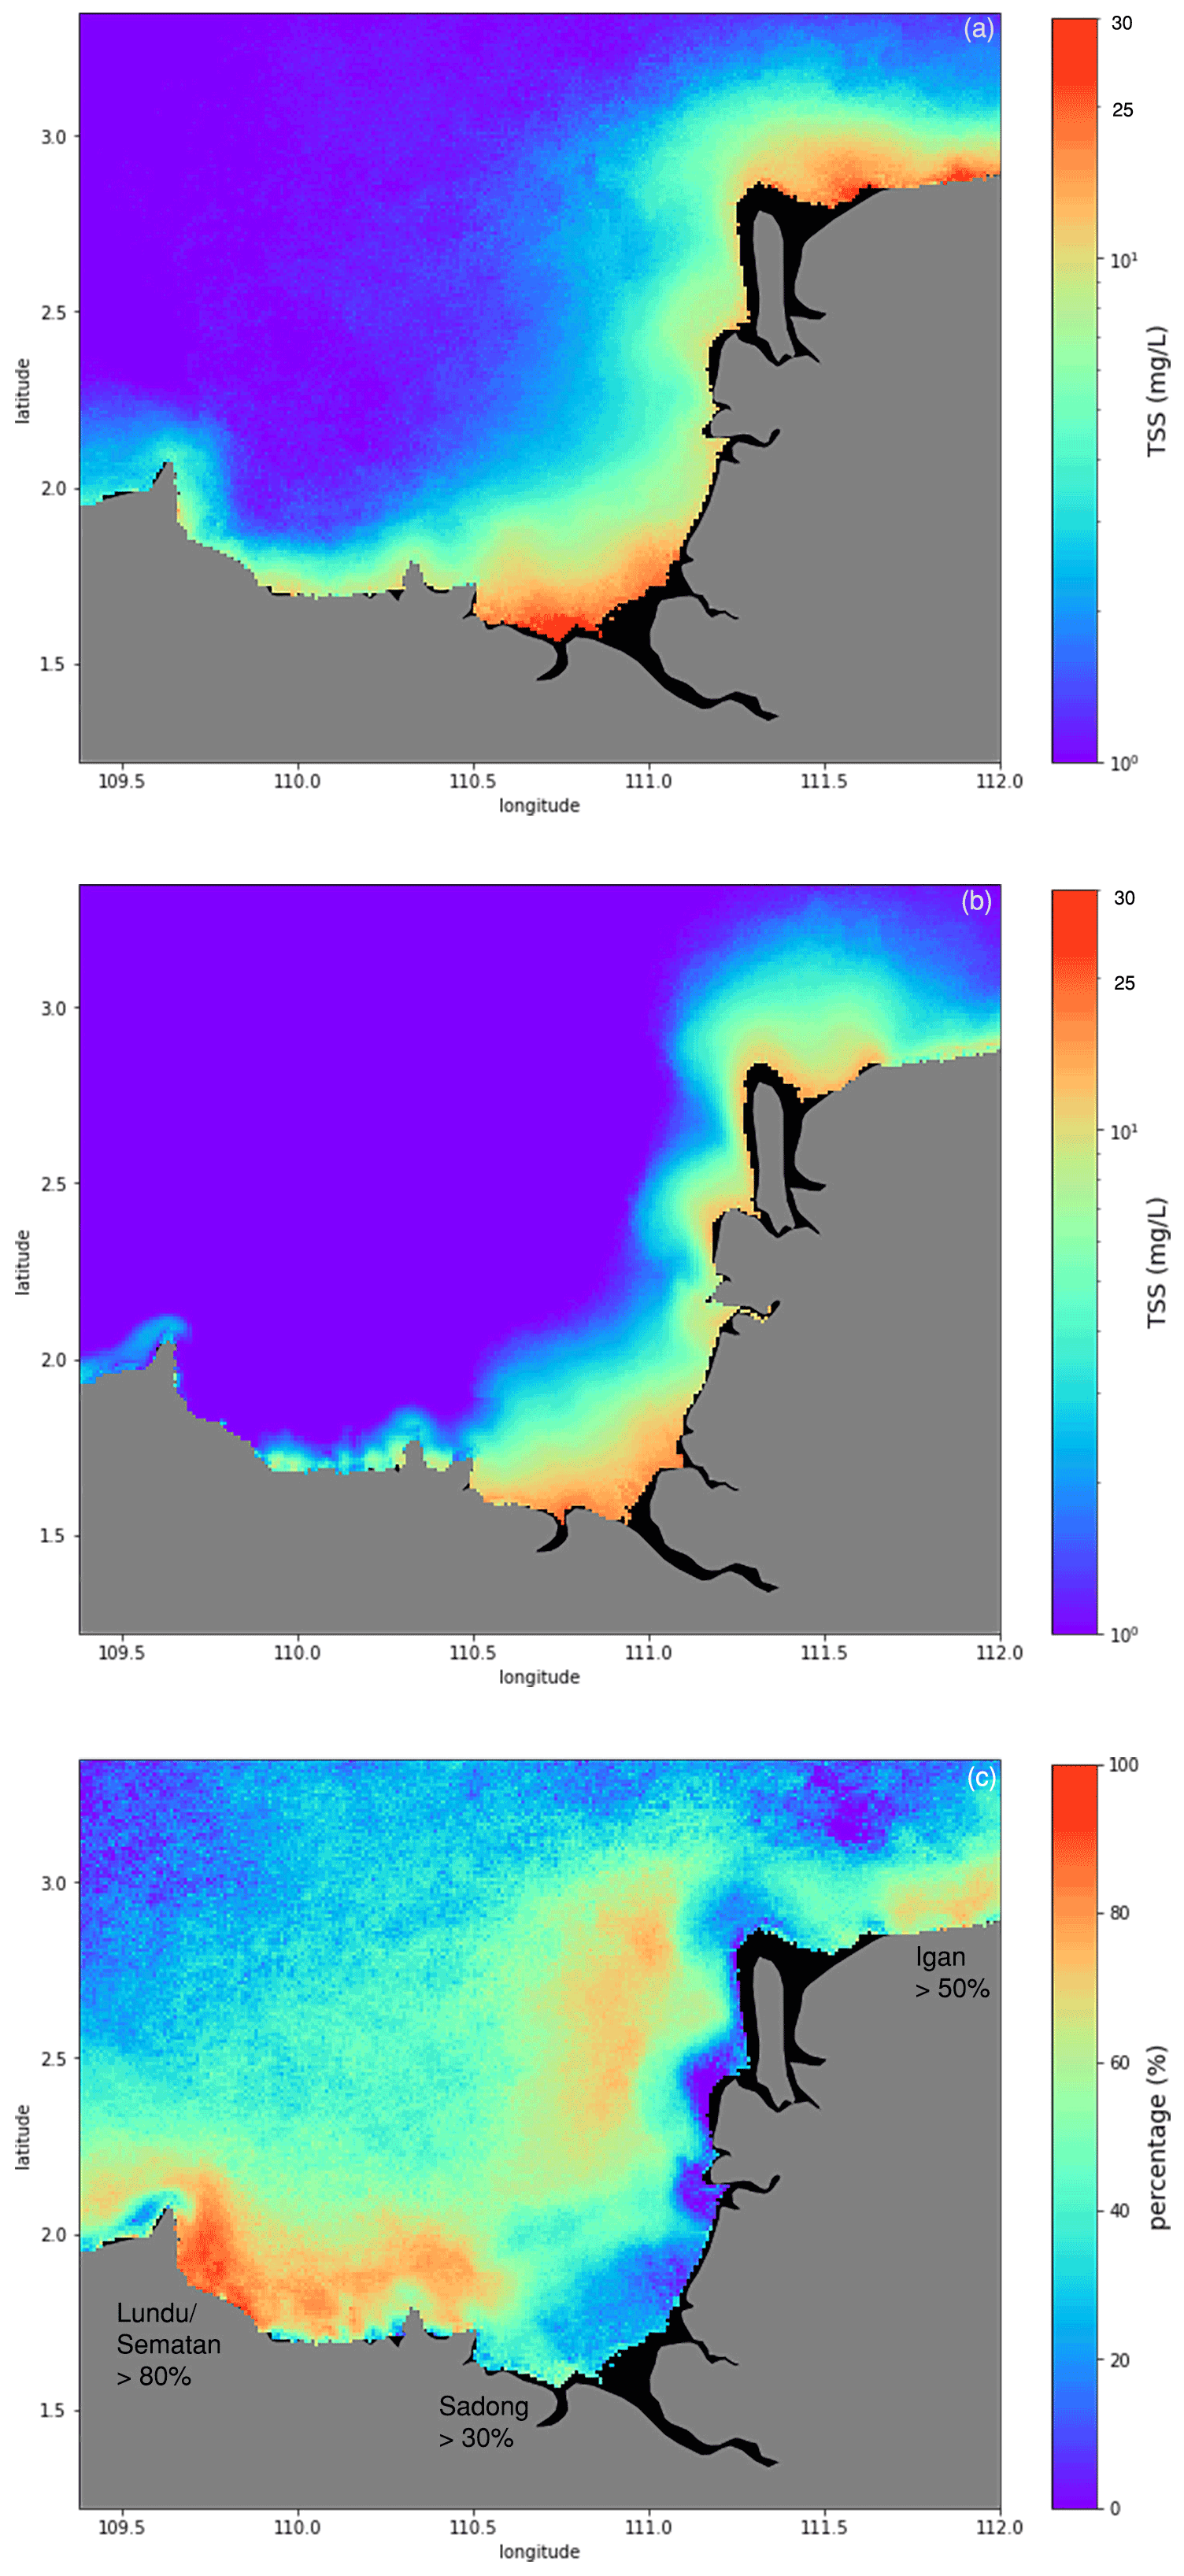
Figure 6Long-term average of TSS estimates (mg L−1) during the northeast monsoon (a), and the southwest monsoon (b). A map of the TSS difference between the northeast and southwest monsoon periods, computed as a relative percentage (%), is shown in panel (c).
3.2 Temporal variation in the TSS distribution
On a temporal scale, the northeast (NE) monsoon period shows a distinct difference in the widespread intensity of the TSS distribution compared with the southwest (SW) monsoon period, along the Sarawak coastline over the 17 years of the considered time series (Fig. 6). Mapping of temporal variations between monsoons using MODIS Aqua dataset time series can provide an improved understanding of the intensity of monsoonal patterns in driving the TSS distribution in this region. As shown in Fig. 6, TSS release can be seen to extend further into the open-ocean South China Sea region during the NE monsoon periods (Fig. 6a) in comparison with the SW monsoon periods (Fig. 6b).
In addition, the differences in TSS release between the NE and SW monsoons ((NE − SW) NE × 100) were mapped, as shown in Fig. 6c. Widespread TSS plumes are detected in the Lundu–Sematan region (> 80 % relative difference in TSS concentration) on the southwestern side of the study area, while substantial TSS plumes are observed in front of the Igan River channel, with more than a 50 % relative difference in the TSS concentration in comparison with the SW monsoon periods. The Sadong coastal area is observed to receive considerable TSS loadings (> 30 %) during NE monsoon periods.
Thus, these coastal areas would be more likely to be impacted by the TSS release during the NE monsoon periods. These findings further strengthen the evidence that tropical rivers are majorly impacted by climatic variability, such as monsoonal patterns, as highlighted in a study of the Baleh River in Sarawak (Chong et al., 2021). This suggests that monsoon rains, which typically last for several months, play an integral role in driving the discharge of TSSs in tropical rivers.
Several climatic studies in the Borneo region have highlighted 2009 as a year with extreme rainfall events that caused major floods in Sarawak (Dindang et al., 2011; Sa'adi et al., 2017), whereas drought events were reported in 2014 (Bong and Richard, 2020). Hence, in this study, TSS dynamics for the Lupar and Rajang rivers were studied by assessing the variation in TSS values at selected pixels in relation to monsoonal rainfall patterns in 2009 and 2014 (Fig. S3 in the Supplement).
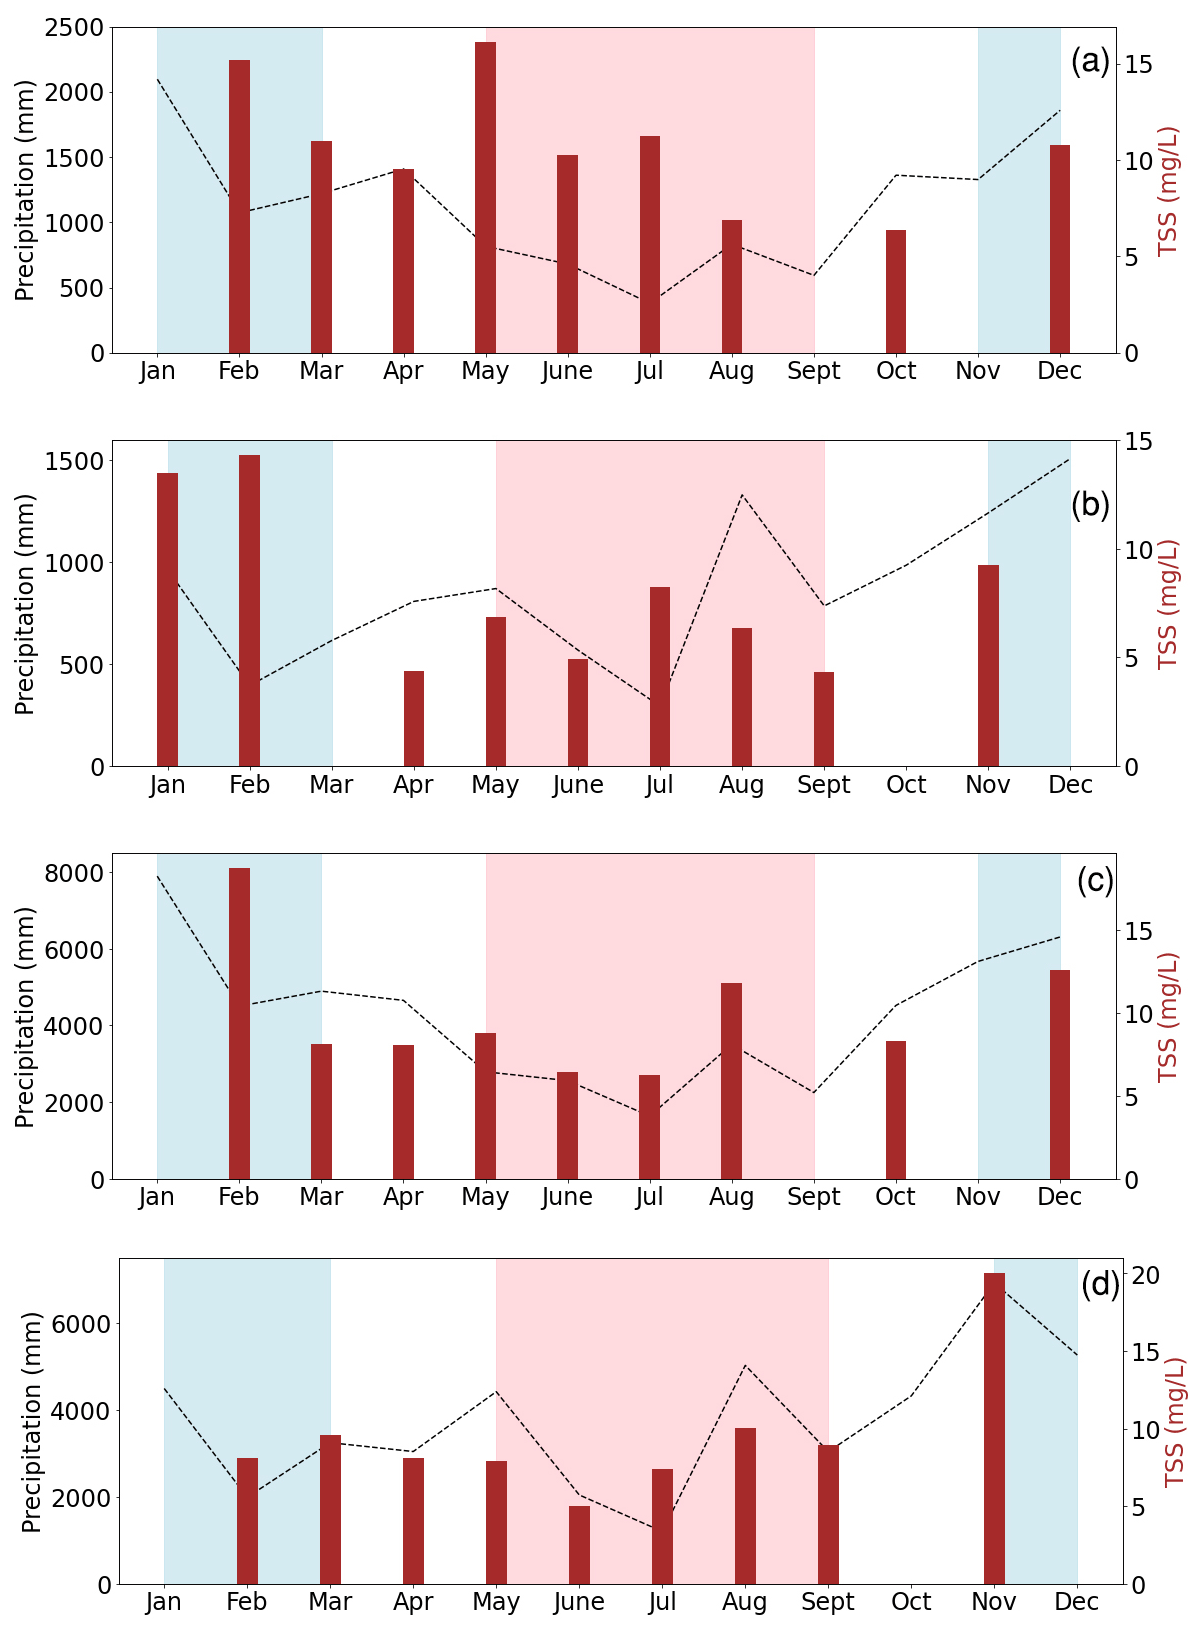
Figure 7Temporal analysis of precipitation (mm) from the Lupar and Rajang river basins in relation to TSS concentrations (mg L−1) during the NE and SW monsoon periods at the Lupar (a, 2009; c, 2014) and Rajang (b, 2009; d, 2014) coastal river point. The NE monsoon months are highlighted using a blue background, the SW monsoon are highlighted using a pink background, and intermonsoon periods are highlighted using a white background.
Generally, the results show fluctuations in the TSS concentrations across the NE and SW monsoon periods in relation to precipitation values (Fig. 7a, b, c, d). Based on Fig. 7a, monthly precipitation values recorded for the Lupar River basin in 2009 show a clear decreasing trend from the NE monsoon period (wet season) to the SW monsoon period (dry season), whereas they gradually increase toward the end-of-year NE monsoonal period. A similar precipitation pattern is observed for the Rajang River basin during the same year (Fig. 7c).
However, these results also show that the TSS distribution (mg L−1) at the Lupar River mouth seems to show no distinct trend of decreasing TSS concentration estimates during the SW monsoon period in the year 2009 (Fig. 7a) in relation to its precipitation values. Additionally, a sharp rise in TSS release can be seen in the month of May (the beginning of SW monsoon period), with a near-equivalent intensity of TSS release during the NE monsoon period. This observation may potentially be caused by the lag between the time of rainfall events occurring during NE monsoon periods and TSS release entering the coastal river regions. A similar observation was described by Sun et al. (2017a), suggesting that riverine outputs could take several days or even up to 1 month to reach the coastal river points. Considering the occurrence of extreme rainfall events in 2009, our findings are in agreement with these processes, as TSS concentrations generally exhibit a similar intensity throughout the NE and SW monsoonal periods for the Lupar River (Fig. 7a). This result could suggest that the occurrence of extreme rainfall events, as reported for the year 2009, can exert a much larger impact on TSS transportation and release in monsoon-driven tropical rivers.
Drought events in 2014 can be seen to impact the precipitation values at both the Lupar (Fig. 7b) and Rajang river basins (Fig. 7d). There are no apparent patterns of decreasing precipitation values during the shift from the NE to SW monsoonal periods compared with the year 2009 for either river basin. However, precipitation values were found to increase sharply during the end-of-year NE monsoon period for both river basins. The TSS concentrations at the Lupar coastal river points were found to be the highest during the NE monsoon period earlier in January and February of 2014 (Fig. 7b). This may be due to the temporal lag in the transition of TSS discharge into the coastal systems arising from the prior months (November and December) in the previous year, when higher rainfall events were typically observed in this region (Gomyo and Koichiro, 2009; Tangang et al., 2012). The TSS distribution at both Lupar and Rajang coastal river points showed no distinct trend in relation to the precipitation values throughout a period of 10 months until November 2014. These findings suggest that coastal areas in the Borneo region may not be experiencing critical water quality degradation during dry seasons.
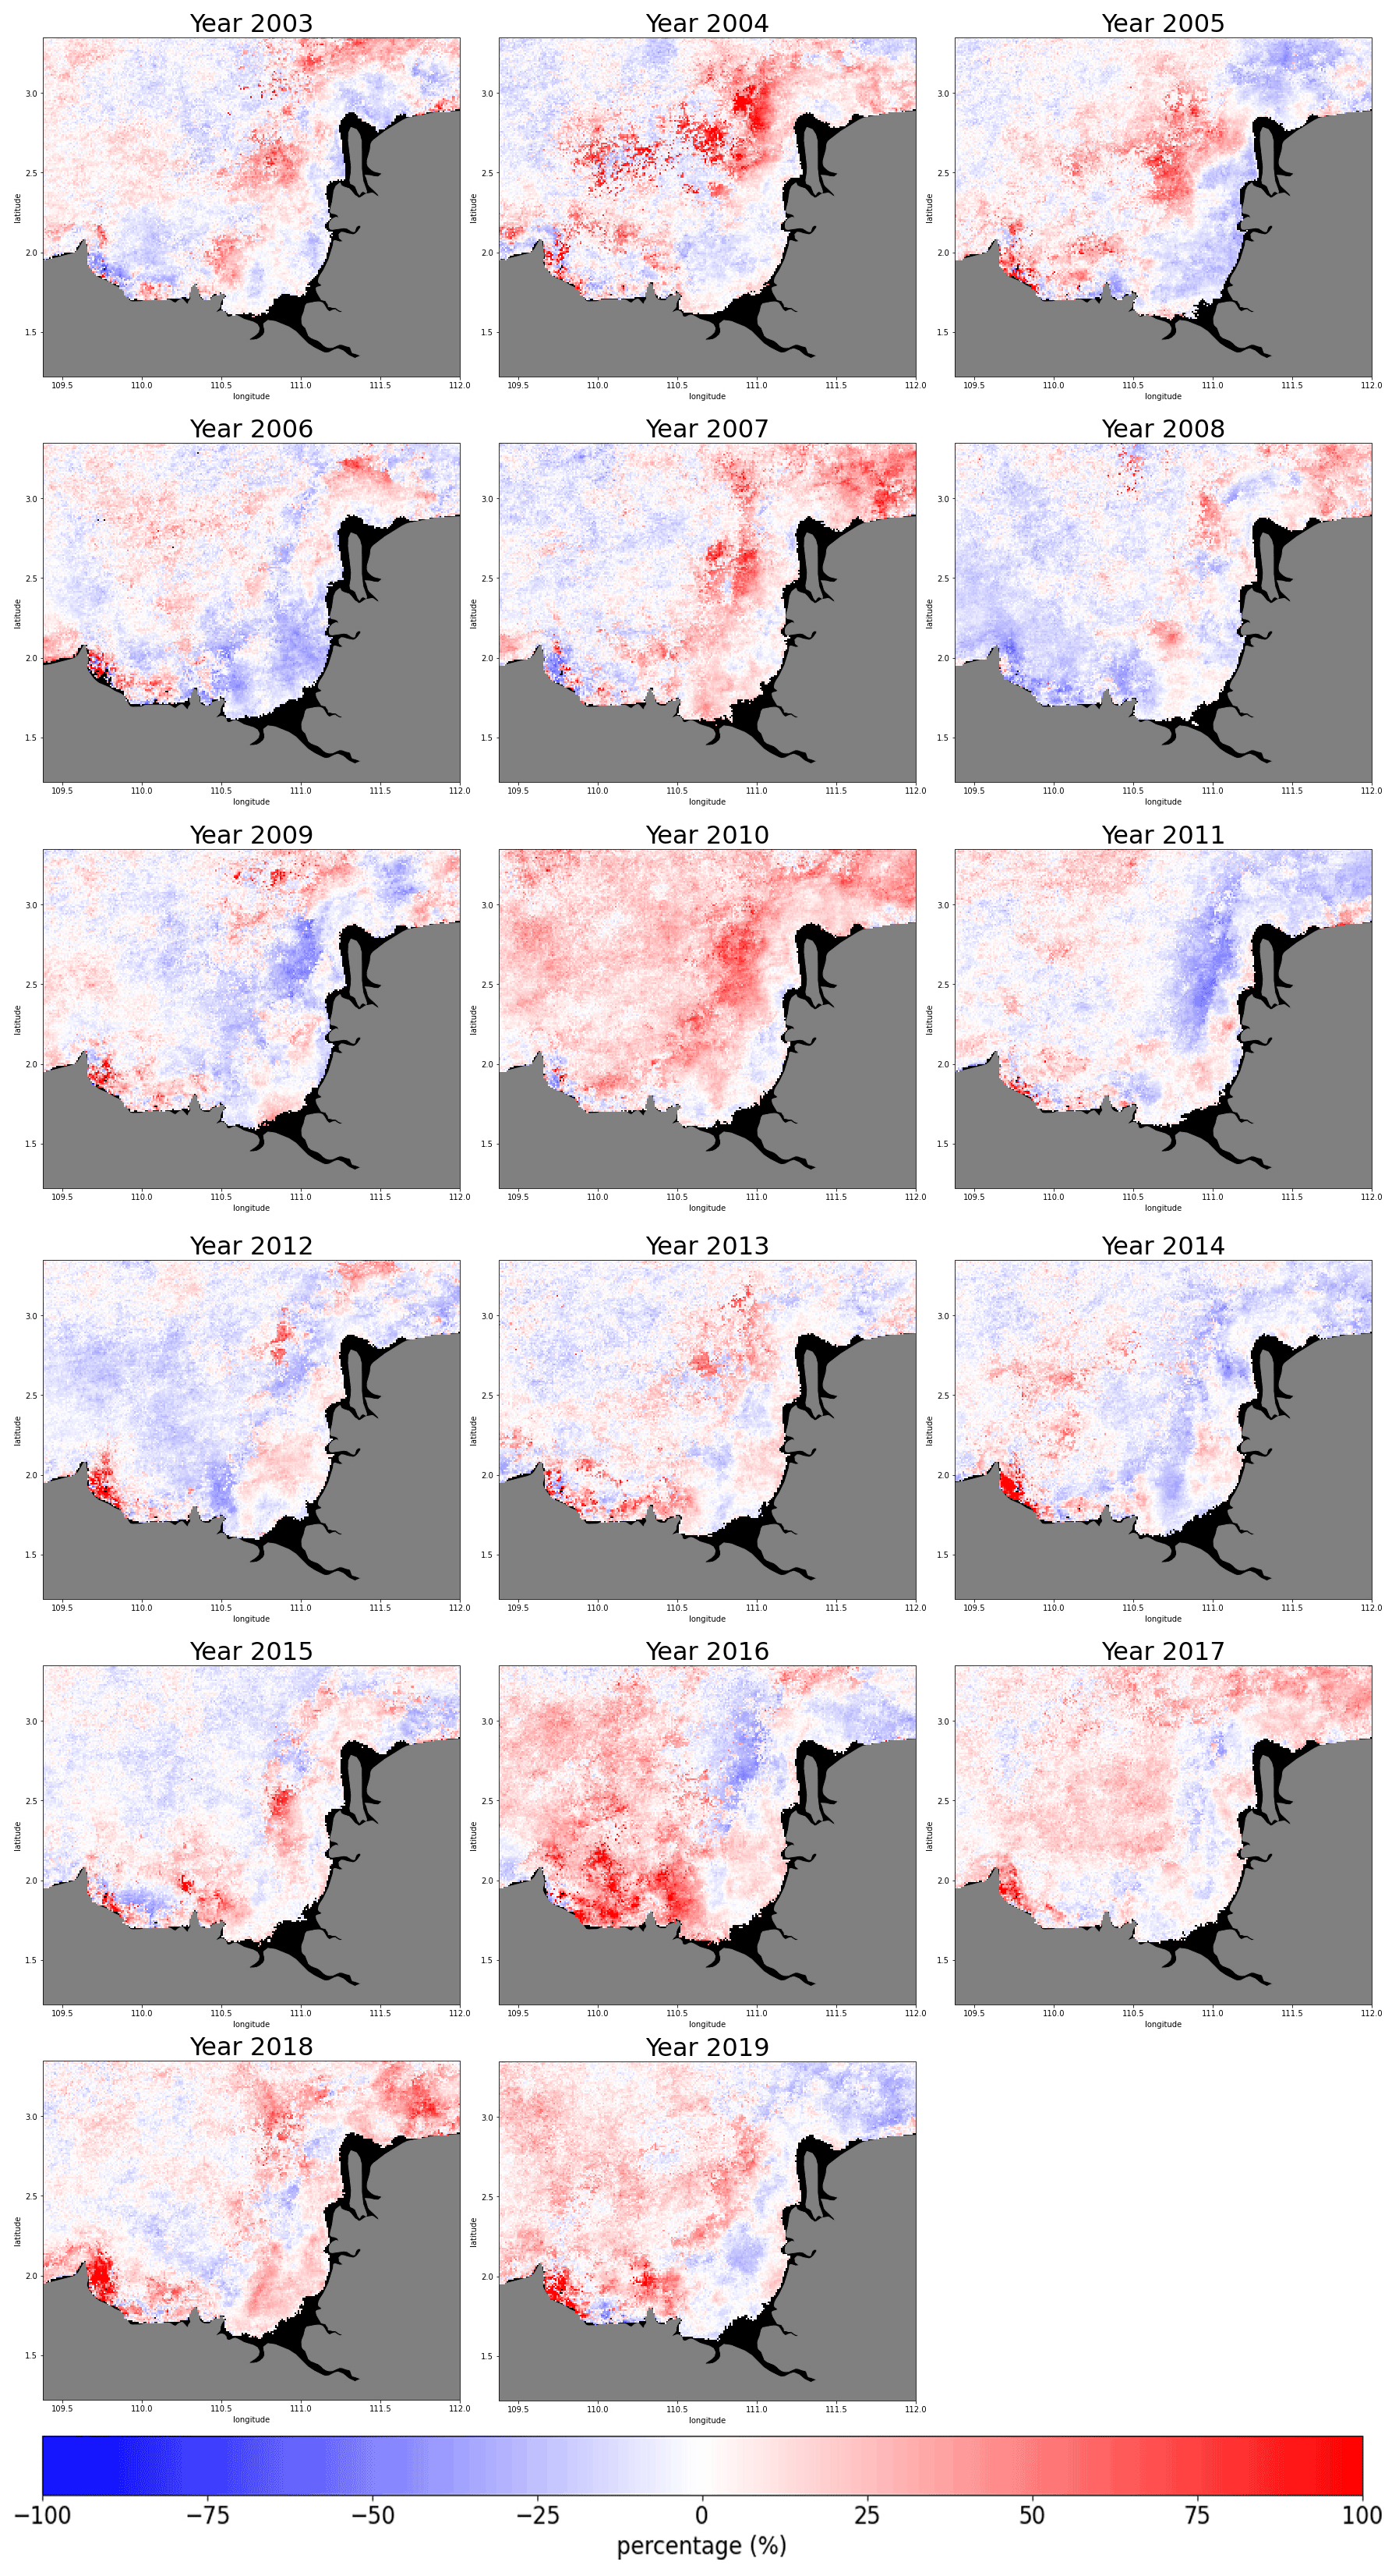
Figure 8Map of relative TSS distribution anomalies with respect to the long-term mean, represented as a percentage (%), from the year 2003 until 2019.
Temporal TSS anomalies
Considering the temporal variation recorded across monsoons, maps of relative TSS anomalies were calculated for each year as the difference with respect to the long-term TSS mean (Fig. 4), in order to detect changes in the TSS distribution occurring annually (Fig. 8). As shown in Fig. 8, the year 2010 experienced a distinct increase in the TSS distribution (approximately 100 %), with a widespread pattern extending into open-ocean waters, in comparison with the long-term TSS mean. This finding provides an interesting insight into the effects of extreme rainfall events as recorded in the year 2009, which could potentially intensify TSS release into coastal and open-ocean waters. The effects of TSS release can still be seen a year after the extreme rainfall events in this region. This observation could provide further evidence that the impacts of TSS release from the land into rivers and coastal systems may only take effect after a substantial period, as previously observed by Sun et al. (2017a).
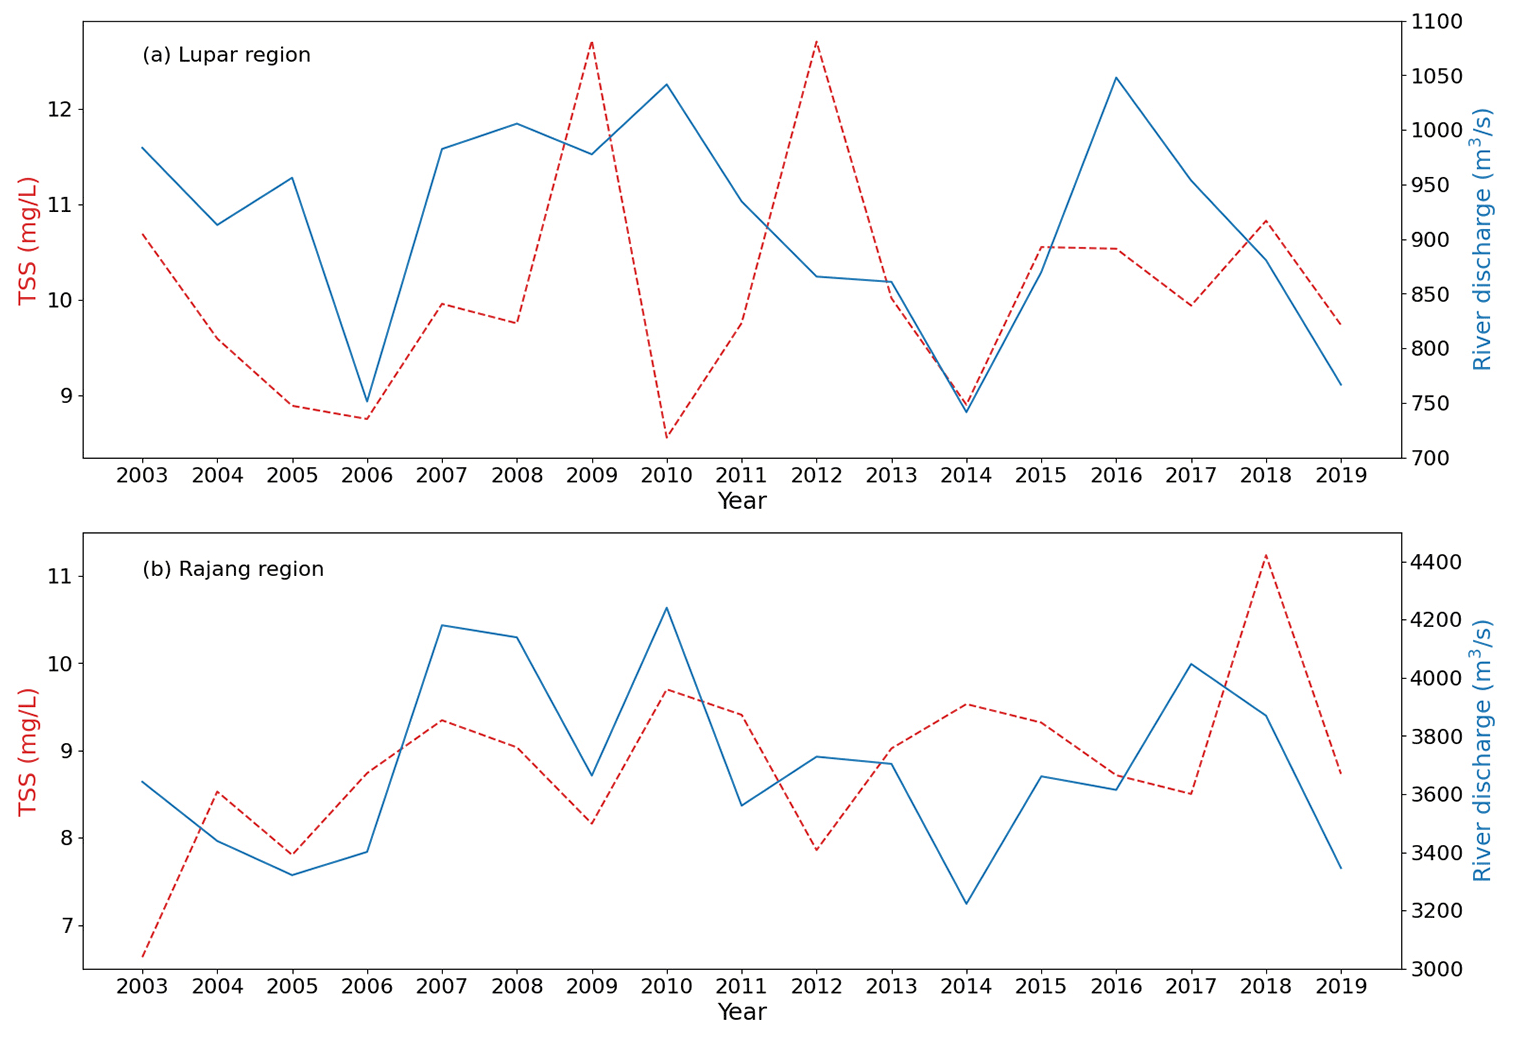
Figure 9Time series analysis of river discharge (m3 s−1) in relation to TSS concentrations (mg L−1) for the Lupar (a) and Rajang (b) basins from the year 2003 to 2019. Note the differing scaling on the ordinate axes in each plot.
Figure 8 further reveals an interesting pattern of TSS increase in the Samunsam–Sematan region from the year 2004 until 2019, with exceptions during the years 2007 and 2008. As previously highlighted in Sect. 3.1, the Samunsam–Sematan region has been observed to be a vulnerable coastal area with respect to TSS water quality degradation. From the annual map of TSS anomalies (Fig. 8), we can see that the TSS distribution has the tendency to accumulate in the Samunsam–Sematan region, as opposed to being distributed into open-ocean waters. This may be due to the geographical and hydrological characteristics of these coastal regions (Martin et al., 2018), as the TSS release may be sheltered from open-ocean waters and, hence, induce a higher TSS accumulation in these coastal regions.
3.3 Hydrological factors driving TSS discharge
Apart from the influence of monsoonal patterns, hydrological factors such as river discharge are among the dominant drivers in transporting various water constituents in riverine and coastal systems (Loisel et al., 2014; Petus et al., 2014; Sun, 2017b; Verschelling et al., 2017). In this study, river discharge from the Lupar and Rajang basins was estimated and investigated.
Yearly river discharge estimates from 2003 until 2019 were investigated to assess the effect of this discharge on the TSS distribution (Fig. 9) represented by changes in TSS values for pixels located at each of the Lupar and Rajang coastal river points (Fig. S3). Figure 9a shows that river discharge values in the Lupar Basin (750 to 1050 m3 s−1) are approximately 2 times lower than the Rajang River discharge (Fig. 9b), which recorded a range of 3200–4000 m3 s−1.
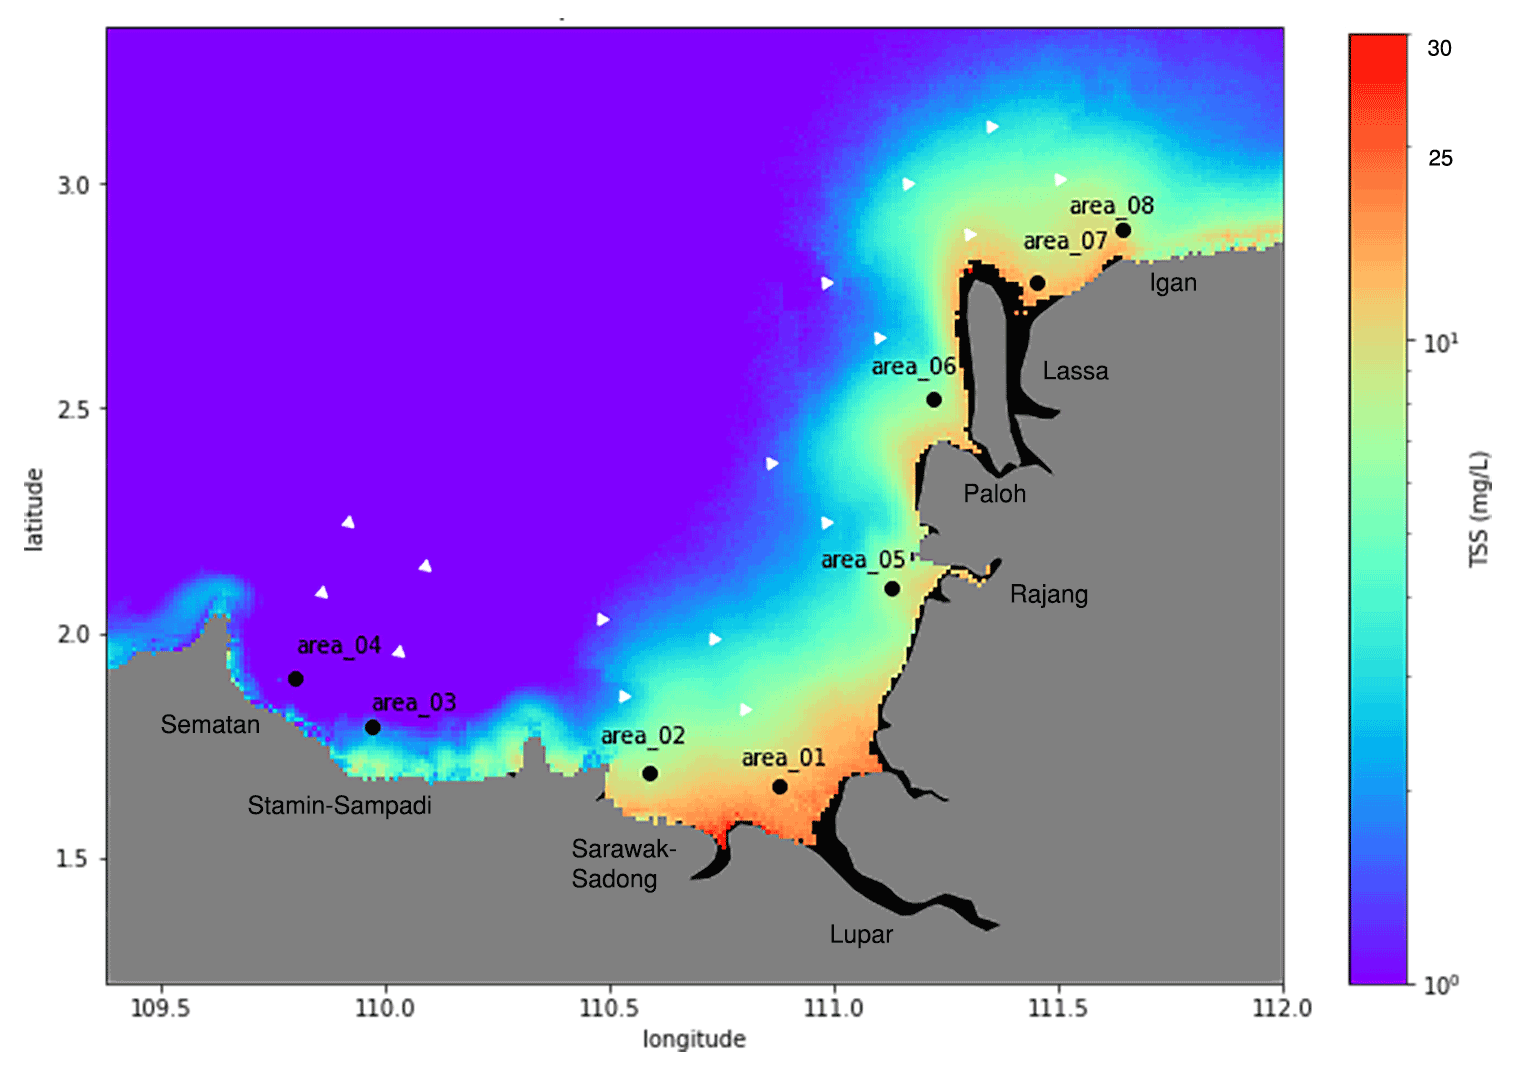
Figure 10Map of average TSS estimates (mg L−1) with indicators at eight main river mouths and their transect, extending from coastal waters into territorial and open-ocean systems. Indicators of each river mouth are as follows: area_01 – Lupar River; area_02 – Sarawak–Sadong River; area_03 – Stamin–Sampadi River; area_04 – Sematan River; area_05 – Rajang River; area_06 – Paloh River; area_07 – Lassa River; and area_08 – Igan River.
Discrepancies between TSS estimates and river discharge were identified in both the Lupar and Rajang coastal regions in these annual time series, where river discharge was inversely correlated with TSS estimates. These discrepancies are not uncommon, as previously highlighted in a study by Zhan et al. (2019). Especially in 2010 for the Lupar River, Fig. 9a shows a drop in TSS release in relation to the steady increase in river discharge from the river basin. In 2011 and 2012, a negative correlation can be seen between river discharge and TSS estimates, while there is a clear positive correlation in the subsequent years from 2013 until 2015. The TSS output from the Lupar Basin recorded a correlation coefficient of r = 0.15, while river discharge from the Rajang Basin did not substantially influence the TSS release either, with a correlation coefficient of r = 0.27 throughout the seasons (Fig. S8a and b in the Supplement). Although there is no obvious environmental factor that would explain these discrepancies and poor correlations between river discharge and TSS estimates in this study, these findings may imply a complex interaction process between human interventions, such as damming and deforestation activities, which are largely occurring within the Rajang River basin (Alamgir et al., 2020), as well as varying hydrological and atmospheric conditions (wind and tidal mixing) in regulating the TSS dynamics in a localized region (Espinoza Villar et al., 2013; Fabricius et al., 2016; Ramaswamy et al., 2004; de Matos Valerio et al., 2018; Wu et al., 2012; Zhan et al., 2019; Zhou et al., 2020).
3.4 Variability in TSSs across coastal waters
As previously observed in Fig. 4, varying river plumes of TSSs were evidently detected within the coastal regions of the study area. Notably, coastal river plumes represent important factors driving the transport of water constituents and nutrients from coastlines to the open oceanic systems (Petus et al., 2014). To assess this and evaluate the water quality status in coastal zones, the spatial extent of TSS release was investigated along transects covering the territorial (12 nmi) and open-water areas (24 nmi) of the Sarawak region (Fig. 10).
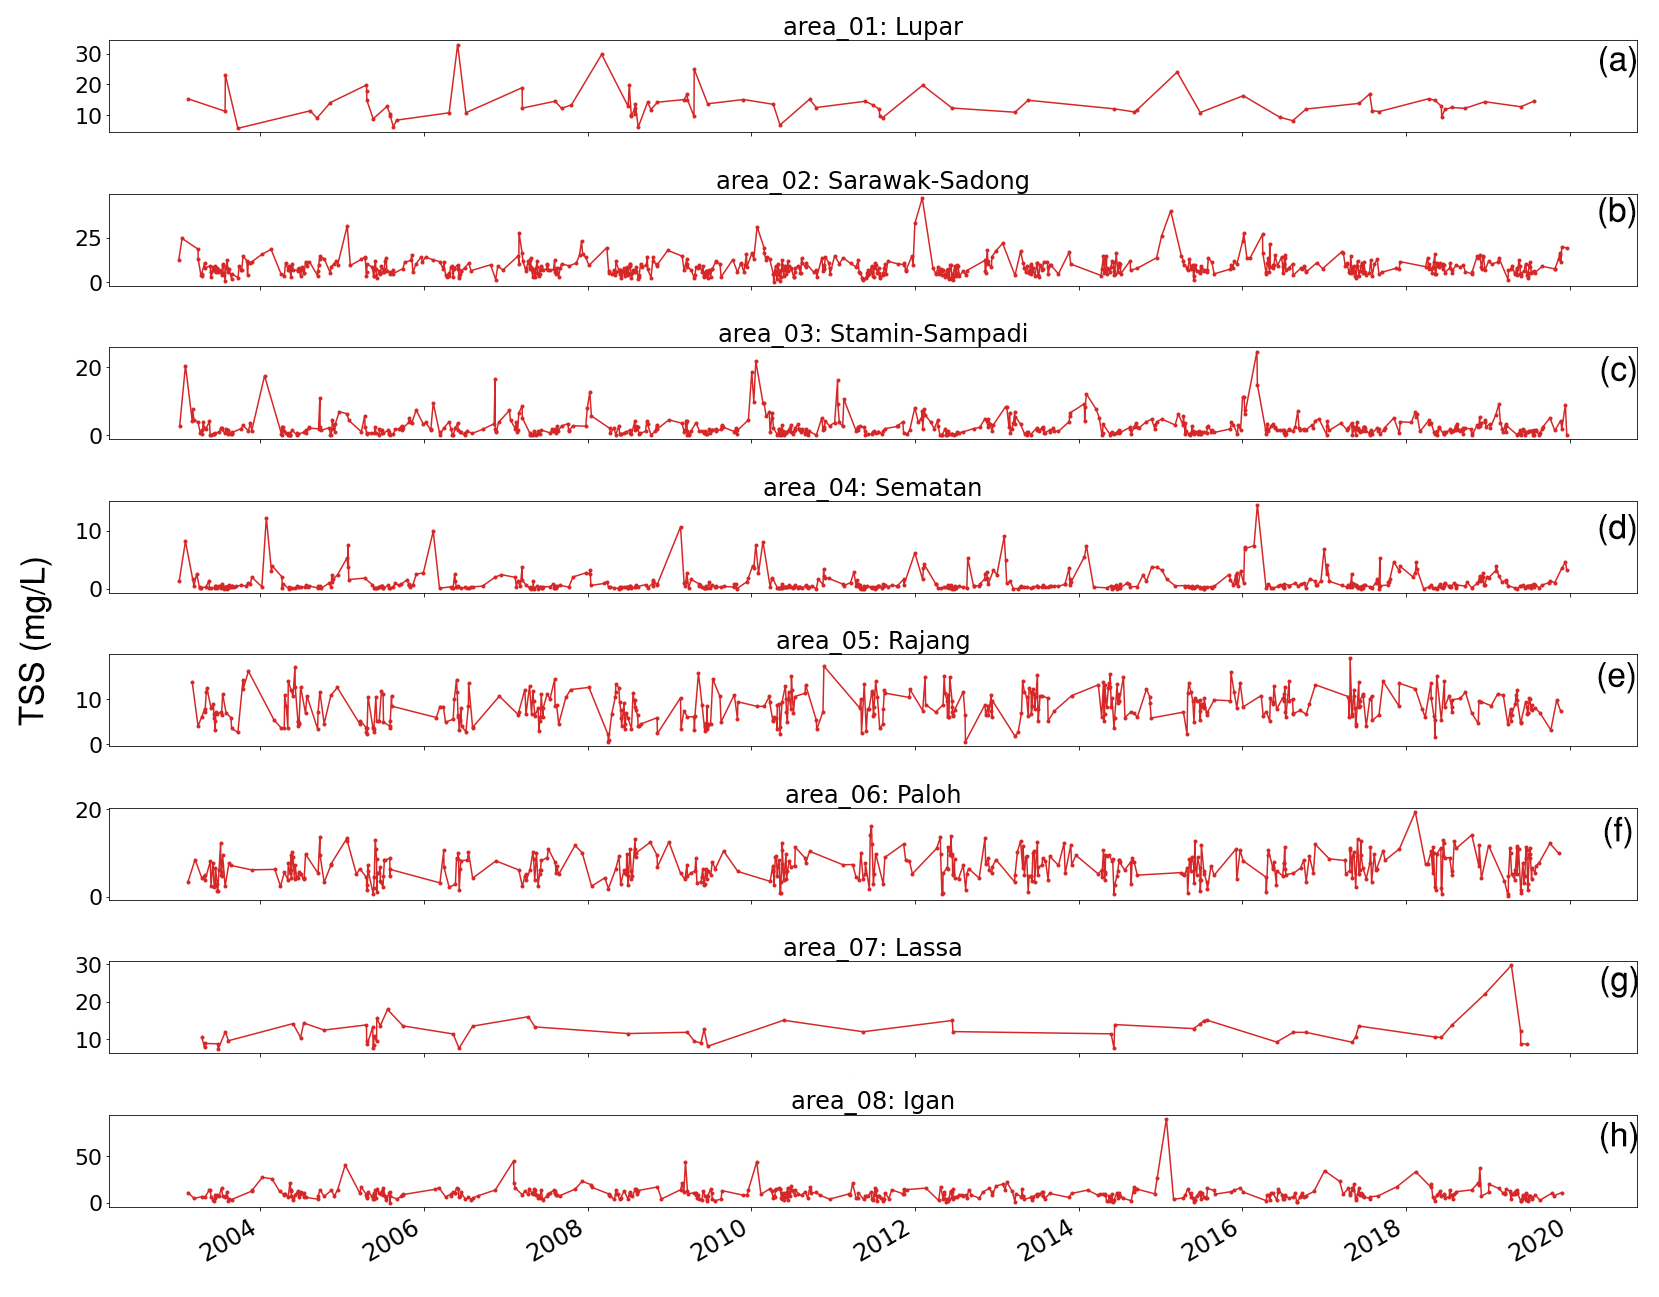
Figure 11Graphs of daily TSS estimates (mg L−1) recorded at eight river mouth points from 2003 to 2019. The presentation of each river mouth is as follows: (a) area_01, (b) area_02, (c) area_03, (d) area_04, (e) area_05, (f) area_06, (g) area_07, and (h) area_08. Note the different TSS scales in each plot.
A total of eight coastal points were selected based on the main river mouths located in the southwestern region of Sarawak. Transect points are positioned in a line starting at the coastal river points to examine the variations in the TSS distribution across different water zones. Daily changes in the TSS concentration for each pixel located in front of the river mouths were plotted from 2003 until 2019 (Fig. 11).
From the high-temporal-resolution graphs in Fig. 11, no general trend in the TSS concentration can be identified over the years at each coastal point. It is worth highlighting that the daily temporal resolution was particularly affected at coastal points located in front of the Lupar (area_01) and Lassa (area_07) river mouths due to various pixel data quality issues in these areas. Nonetheless, more than 80 satellite images with minimum cloud coverage at these two locations were processed, while the remaining coastal points had a total of more than 400 satellite images to assess the temporal trend.
Despite the fact that no distinct upward or downward trend was observed, our findings indicate that several river mouths are actively discharging and accumulating substantial TSS amounts over the period of years, while the resuspension of bottom sediments induced by the wind and tidal cycle is another factor contributing to the variation in TSS values (Park, 2007; Song et al., 2020).
The coastal region of the Sarawak–Sadong River (area_02) shows relatively high TSS distribution patterns with some periods recording an estimated TSS concentration of over 30 mg L−1. This is in agreement with the localized characteristics of the Sarawak River basin which essentially drains through the populated Kuching area with high industrial and development activities in the capital city of Sarawak (DID, 2021b). In comparison with other river mouth points, a steady TSS concentration below 20 mg L−1 was recorded across the Stamin–Sampadi (area_03), Sematan (area_04), Rajang (area_05), and Paloh (area_06) river mouths. Consistently high TSS values in the daily plots were recorded at the Lupar (area_01) and Bruit Island–Lassa (area_07) river mouths, with estimates of up to 30 mg L−1 on a near-daily basis. Similar high TSS amounts from the Igan (area_08) river mouth, situated on the northeastern side of the Bruit Island–Lassa region, were observed in Cherukuru et al. (2021) and Staub et al. (2000).
Although the daily TSS estimates at each river point are in line with various reported studies (Chen et al., 2011, 2015b; Kim et al., 2017; Mengen et al., 2020; M. Zhang et al., 2010), these estimates can be expected to be much higher for sampling points much closer to the river mouths. The selection of coastal river points in this study was made to minimize the gaps with respect to various pixel data quality issues in the MODIS Aqua datasets; hence, the use of coastal river points closer to shore would have been impractical.
These findings further suggest that higher TSS loadings within the coastal river areas would have been diluted or deposited while travelling to the open oceanic systems, as they are weakly impacted by river discharge in relation to offshore distance (Espinoza Villar et al., 2013). This understanding can be observed in Fig. 12, which shows progressively decreasing TSS estimates at each transect in relation to the distance from the shore. Generally, TSS estimates in coastal zones (first transect point) show considerably higher TSS concentrations. When moving outwards to territorial waters (second transect point), TSS concentration estimates decrease by nearly 50 % before travelling to open-ocean systems (third transect point), except for the northeastern regions (area_07 and area_08) which seem to show a large extension of TSS plumes to the open-ocean waters, as also highlighted by Cherukuru et al. (2021). A reversed trend can be seen in the plot corresponding to the Sematan coastal river systems, although the absolute increase in TSS estimates across water zones (0.2 mg L−1 in total) here is only marginal (Fig. 12d). Such a slight trend in the TSS retrievals recorded (Fig. 12) generally offers a synoptic understanding of the trend conditions, considering that such small variabilities in TSS retrieval were captured by the power function TSS retrieval model given its extent of uncertainties (Table 2).
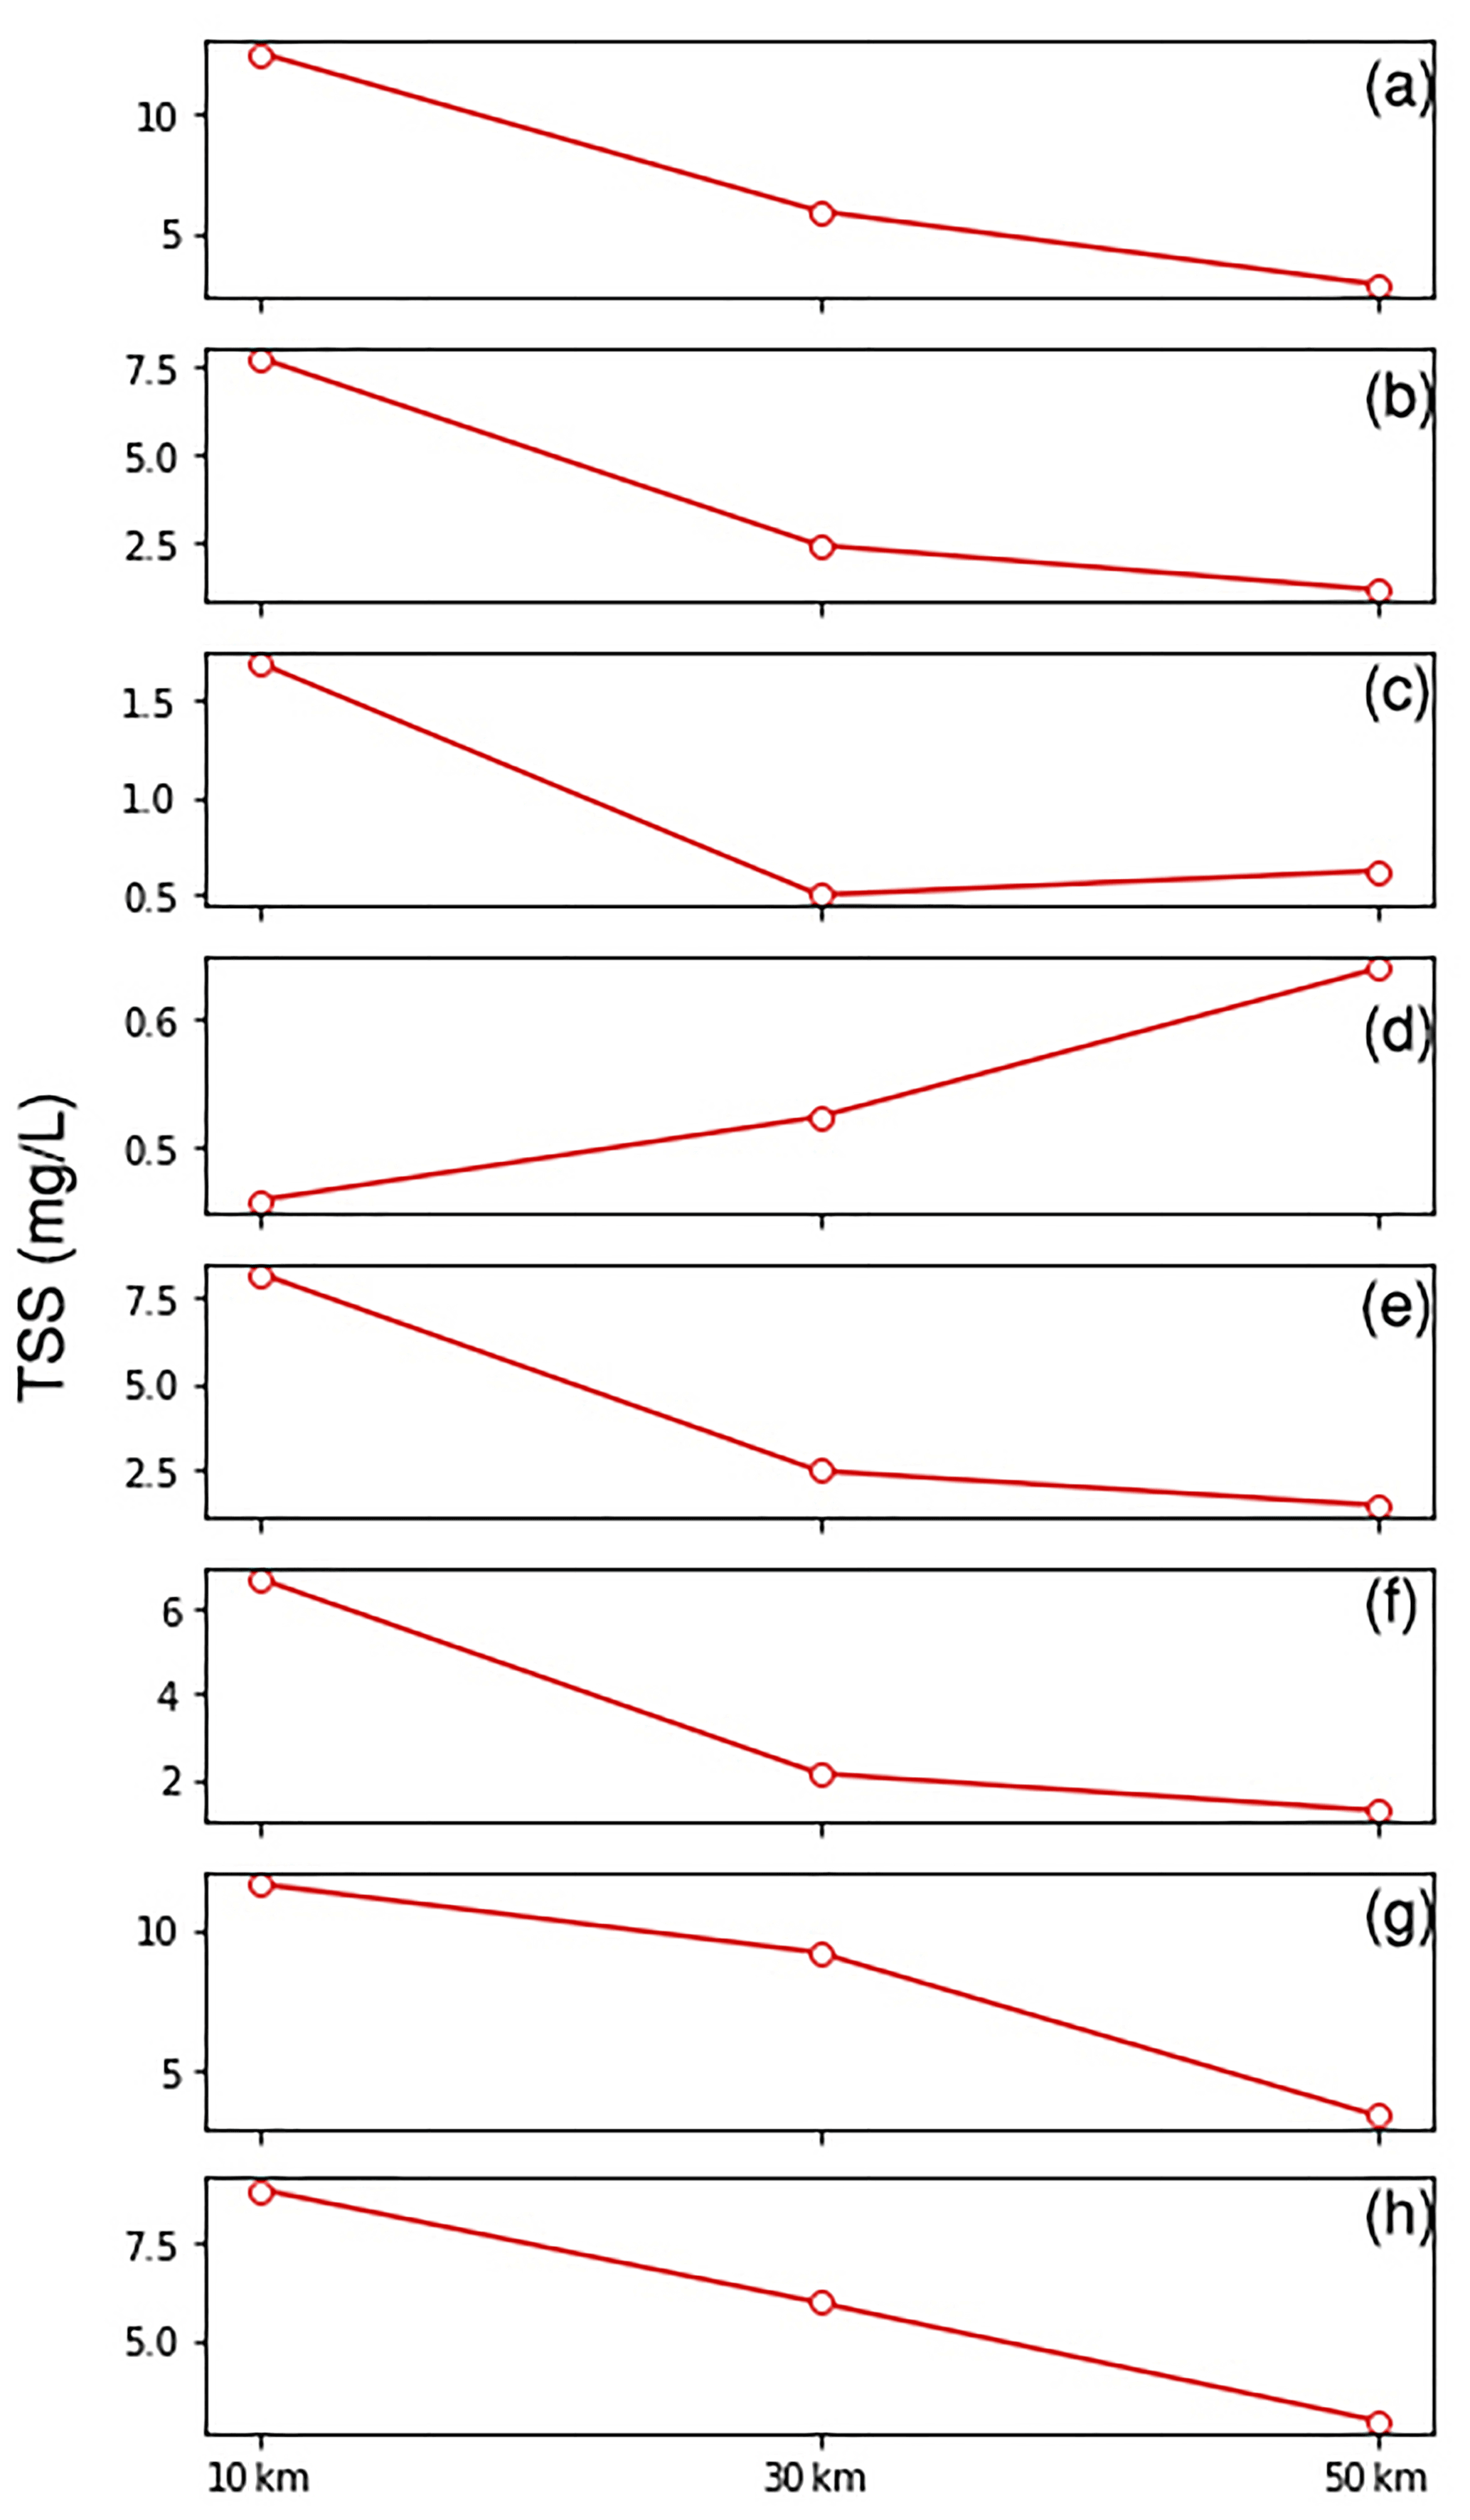
Figure 12Average TSS estimates (mg L−1) computed from 2003 to 2019 for each of the eight rivers (area_01, a; area_02, b; area_03, c; area_04, d; area_05, e; area_06, f; area_07, g; and area_08, h) and their relevant transect points with a distance of 10 km (coastal waters), 30 km (territorial waters), and 50 km (open-ocean waters) from the shoreline. Note the varying TSS scales on the ordinate axes in each plot.
3.5 Discussion of TSS implications for coastal waters
The high discharge of TSSs into coastal environments can lead to adverse environmental and ecological implications. The presence of TSSs affects water transparency and light availability within the surface waters (Dogliotti et al., 2015; Nazirova et al., 2021; Wang et al., 2021). Among others, TSSs affect the photosynthesis activities of algae and macrophytes. TSSs in water create a reduction in light penetration, impacting the primary production of aquatic organisms and, hence, the support system of marine life (Bilotta and Brazier, 2008; Loisel et al., 2014).
Additionally, TSSs exert an influence on zooplankton communities: a reduction in water clarity induces changes in the zooplankton's biomass volume and composition, and TSSs may also carry a level of toxicity that affects zooplankton through ingestion (Chapman et al., 2017; Donohue and Garcia Molinos, 2009). Apart from that, the accumulation and deposition of sediments decrease the level of dissolved oxygen (DO) at the bottom of the water column and subsequently impact the benthic invertebrate groups (Chapman et al., 2017). Moreover, substantial TSS deposition tends to cause harmful physical effects to these benthic groups, such as abrasion, and even clogging by sediment particles (Chapman et al., 2017; Langer, 1980).
As a result of these TSS effects on lower trophic levels, fish communities are critically impacted, with a reduction in diversity and abundance (Kemp et al., 2011). While fish communities learn to adapt to a range of TSS loads (Macklin et al., 2010), increases in TSS concentrations often deplete DO concentrations in the water system and cause stress for these aquatic communities (Henley et al., 2000). Consequently, fish populations tend to decrease, as feeding and growth rates are negatively impacted (Shaw and Richardson, 2001; Sutherland and Meyer, 2007).
Threats to coral reefs have been linked to sediment-induced stress, which often leads to a reduction in corals' growth and metabolic rate as well as impending mortality (Erftemeijer et al., 2012; Gilmour et al., 2006; Risk and Edinger, 2011). Factors of coral stress are driven by nutrient-rich sediments and microbes which are being carried by TSSs, with impacts on the health of coral tissues (Hodgson, 1990; Risk and Edinger, 2011; Weber et al., 2006). A reduction in light availability impedes the development of corals (Anthony and Hoegh-Guldberg, 2003; Rogers, 1979; Telesnicki and Goldberg, 1995). A combined increase in TSSs and nutrient loadings contributes to the decrease in coral species diversity and composition (Fabricius, 2005).
Essentially, the presence of TSSs in water systems has impacts on various aquatic biota. With severe implications such as a decreased fish population, this could lead to a disruption of fishery activities by local communities, especially considering that more than 80 % of the Sarawak population lives in coastal areas (DID, 2021a). Coral reefs are important coastal biodiversity assets in the Sarawak region, especially around the Talang Talang and Satang islands on the southwestern coast of Sarawak (Long, 2014). Employing remote sensing technologies to monitor the Sarawak coastal water quality, the approach presented in this paper provides digital-based solutions to assist the relevant authorities and local agencies to better manage the Sarawak coastal waters and their resources.
In this study, a regional empirical TSS retrieval model was developed to analyse TSS dynamics along the southwestern coast of Sarawak. The empirical relationship between in situ reflectance values, Rrs(λ), and in situ TSS concentrations was established using a green-to-red band ratio employing the MODIS Aqua Rrs(530) and Rrs(666) reflectance bands. An evaluation of the TSS retrieval model was carried out with error metric assessment, which yielded results of bias = 1.0, MAE = 1.47, and RMSE = 0.22 (in mg L−1) computed in log10-transformed space prior to calculation. A statistical analysis using a k-fold cross-validation technique (k = 7) reported low error metrics (RMSE = 0.2159 and MAE = 0.1747).
The spatial TSS distribution map shows the detection of widespread TSS plumes – particularly in the Lupar and Rajang coastal areas – with an average TSS range of 15–20 mg L−1 estimated in these regions. Based on the spatial map of the TSS coefficient of variation, large TSS variability was identified in the Samunsam–Sematan coastal areas (CV > 90 %). The map of temporal variation in the TSS distribution points to a strong monsoonal influence in driving TSS release, with large differences identified between the northeast and southwest monsoon periods in this region. From the annual TSS anomalies maps, the Samunsam–Sematan coastal areas demonstrated strong TSS variation spatially, while a widespread TSS distribution with an almost 100 % TSS increase in comparison with the long-term mean was observed in 2010. Furthermore, our study on river discharge in relation to TSS release demonstrated a weak relationship at both the Lupar and Rajang coastal river points. Study on the TSS variability across coastal river mouths implied that higher TSS loadings in the coastal areas are potentially being deposited or diluted in the process of being transported to open-ocean waters, with a varying magnitude at several coastal river points.
Overall, these coastal areas of Sarawak are dominantly categorized as Class I quality; thus, they remain within local quality standards to support various marine and socio-economic activities in this region. Our findings in the southwestern coastal areas (Sematan and Stamin–Sampadi) show that the coral reefs there can be well maintained with negligible impacts from TSS loadings. However, it is important to highlight the various human activities that are widely ongoing in this region, which include deforestation and logging activities (Alamgir et al., 2020; Hon and Shibata, 2013; Vijith et al., 2018). Impacts from these activities in Sarawak can potentially aggravate current soil erosion issues and ultimately induce more soil leaching and runoff from land to water systems, especially during heavy-rainfall events (Ling et al., 2016; Vijith et al., 2018). As a result, human activities may have a greater influence on driving riverine sediments than climatological factors, as reported by Song et al. (2016). As such, this work presents the first observation of TSS distributions at large spatial and temporal scales in Sarawak's coastal systems as well as of the potential associated impacts on the South China Sea.
While the findings derived from this work can be used to support local authorities in assessing the TSS water quality status in the coastal areas of concern, the developed TSS retrieval model presents some limitations. Given the consideration that the model was developed from sediment- and organic-matter-rich waters, it is not transferable to other optical water types. This model is most applicable to waters with similar optical characteristics, such as the southwestern coastal waters of Sarawak region. There is a need to further optimize the model with larger datasets covering more coastal water points as well as data points from varied seasonal patterns in order to improve its performance on a larger spatial and temporal scale. As these data points were collected within the southwestern region of Sarawak's coastal waters, further testing and validation of the model in other regions of Sarawak's coastal waters are essential to develop a more robust TSS retrieval model and to allow application to a broader regional scale.
Ultimately, with the demand to enhance coastal management and conservation strategies in Sarawak's coastal waters, the application of remote sensing technologies, as demonstrated in this study, is a great benefit in the development of sustainable sediment management in the Sarawak coastal region.
The dataset related to this study is available as a Supplement to this paper.
The supplement related to this article is available online at: https://doi.org/10.5194/bg-19-5837-2022-supplement.
JC, NC, EL, and MM conceptualized the study. JC, NC, and EL carried out the formal analysis. MM, NC, and AM acquired funding. JC, NC, EL, MP, PM, AM, and MM undertook the investigation. JC, NC, EL, and MM developed the methodology. JC, NC, EL, MP, and MM acquired resources. JC, NC, EL, and MM were responsible for validating the findings. JC wrote the manuscript, and JC, NC, EL, PM, and MM were responsible for reviewing and editing it. MM, NC, and AM supervised the study. MM, AM, and NC were responsible for project administration.
The contact author has declared that none of the authors has any competing interests.
Publisher's note: Copernicus Publications remains neutral with regard to jurisdictional claims in published maps and institutional affiliations.
The authors wish to thank the Sarawak Forestry Department and Sarawak Biodiversity Centre for permission to conduct collaborative research in Sarawak (permit nos. NPW.907.4.4(Jld.14)-161, SBC-RA-0097-MM, and WL83/2017). We would also like to extend our gratitude to the boat crews involved in the field expeditions. Special thanks go to Pak Mat and Minhad, for their help during the western region sampling, and to Captain Juble and Lukas Chin, for their help during the eastern region cruises. We are appreciative to members of AQUES MY for their kind participation and involvement, especially to Ashleen Tan, Jack Sim, Florina Richard, Faith Chaya, Edwin Sia, Faddrine Jang, Gonzalo Carrasco, Akhmetzada Kargazhanov, Noor Iskandar Noor Azhar, and Fakharuddin Muhamad. This study has been supported by the Australian Academy of Sciences, within the framework of the Regional Collaborations Programme; the Sarawak Multimedia Authority (Sarawak Digital Centre of Excellence); and the Swinburne University of Technology (Swinburne research studentship).
This research has been supported by the CSIRO Oceans and Atmosphere and the Regional Collaborations Programme (Australian Academy of Sciences), the Sarawak Multimedia Authority (Sarawak Digital Centre of Excellence), and the Swinburne University of Technology (Swinburne research studentship).
This paper was edited by Peter Landschützer and reviewed by three anonymous referees.
Ahn, Y. and Shanmugam, P.: Derivation and analysis of the fluorescence algorithms to estimate phytoplankton pigment concentrations in optically complex coastal waters, J. Opt. A Pure Appl. Opt., 9, 352, https://doi.org/10.1088/1464-4258/9/4/008, 2007.
Alamgir, M., Campbell, M. J., Sloan, S., Engert, J., Word, J., and Laurance, W. F.: Emerging challenges for sustainable development and forest conservation in Sarawak, Borneo, PLOS ONE, 15, 1–20, https://doi.org/10.1371/journal.pone.0229614, 2020.
Alcântara, E., Bernardo, N., Watanabe, F., Rodrigues, T., Rotta, L., Carmo, A., Shimabukuro, M., Gonçalves, S., and Imai, N.: Estimating the CDOM absorption coefficient in tropical inland waters using OLI/Landsat-8 images, Remote Sens. Lett., 7, 661–670, https://doi.org/10.1080/2150704X.2016.1177242, 2016.
Anthony, K. R. N. and Hoegh-Guldberg, O.: Kinetics of photoacclimation in corals, Oecologia, 134, 23–31, https://doi.org/10.1007/s00442-002-1095-1, 2003.
Aurin, D. A. and Dierssen, H. M.: Advantages and limitations of ocean color remote sensing in CDOM-dominated, mineral-rich coastal and estuarine waters, Remote Sens. Environ., 125, 181–197, https://doi.org/10.1016/j.rse.2012.07.001, 2012.
Babin, M., Stramski, D., Ferrari, G. M., Claustre, H., Bricaud, A., Obolensky, G., and Hoepffner, N.: Variations in the light absorption coefficients of phytoplankton, nonalgal particles, and dissolved organic matter in coastal waters around Europe, J. Geophys. Res.-Ocean., 108, https://doi.org/10.1029/2001JC000882, 2003.
Bailey, S. W., Franz, B. A., and Werdell, P. J.: Estimation of near-infrared water-leaving reflectance for satellite ocean color data processing, Opt. Express, 18, 7521, https://doi.org/10.1364/oe.18.007521, 2010.
Balasubramanian, S. V., Pahlevan, N., Smith, B., Binding, C., Schalles, J., Loisel, H., Gurlin, D., Greb, S., Alikas, K., Randla, M., Bunkei, M., Moses, W., Nguy![]() n, H., Lehmann, M. K., O'Donnell, D., Ondrusek, M., Han, T. H., Fichot, C. G., Moore, T., and Boss, E.:
Robust algorithm for estimating total suspended solids (TSS) in inland and nearshore coastal waters, Remote Sens. Environ., 246, 111768, https://doi.org/10.1016/j.rse.2020.111768, 2020.
n, H., Lehmann, M. K., O'Donnell, D., Ondrusek, M., Han, T. H., Fichot, C. G., Moore, T., and Boss, E.:
Robust algorithm for estimating total suspended solids (TSS) in inland and nearshore coastal waters, Remote Sens. Environ., 246, 111768, https://doi.org/10.1016/j.rse.2020.111768, 2020.
Bhardwaj, J., Gupta, K. K., and Gupta, R.: A review of emerging trends on water quality measurement sensors, in 2015 International Conference on Technologies for Sustainable Development (ICTSD), 1–6, https://doi.org/10.1109/ICTSD.2015.7095919, 2015.
Bilotta, G. S. and Brazier, R. E.: Understanding the influence of suspended solids on water quality and aquatic biota, Water Res., 42, 2849–2861, https://doi.org/10.1016/j.watres.2008.03.018, 2008.
Bong, C. H. J. and Richard, J.: Drought and climate change assessment using standardized precipitation index (Spi) for sarawak river basin, J. Water Clim. Change, 11, 956–965, https://doi.org/10.2166/wcc.2019.036, 2020.
Brezonik, P. L., Olmanson, L. G., Finlay, J. C., and Bauer, M. E.: Factors affecting the measurement of CDOM by remote sensing of optically complex inland waters, Remote Sens. Environ., 157, 199–215, https://doi.org/10.1016/j.rse.2014.04.033, 2015.
Cao, F., Tzortziou, M., Hu, C., Mannino, A., Fichot, C. G., Del Vecchio, R., Najjar, R. G., and Novak, M.: Remote sensing retrievals of colored dissolved organic matter and dissolved organic carbon dynamics in North American estuaries and their margins, Remote Sens. Environ., 205, 151–165, https://doi.org/10.1016/j.rse.2017.11.014, 2018.
Chapman, P. M., Hayward, A., and Faithful, J.: Total Suspended Solids Effects on Freshwater Lake Biota Other than Fish, B. Environ. Contam. Tox., 99, 423–427, https://doi.org/10.1007/s00128-017-2154-y, 2017.
Chen, S., Huang, W., Chen, W., and Chen, X.: An enhanced MODIS remote sensing model for detecting rainfall effects on sediment plume in the coastal waters of Apalachicola Bay, Mar. Environ. Res., 72, 265–272, https://doi.org/10.1016/j.marenvres.2011.09.014, 2011.
Chen, S., Han, L., Chen, X., Li, D., Sun, L., and Li, Y.: Estimating wide range Total Suspended Solids concentrations from MODIS 250-m imageries: An improved method, ISPRS J. Photogramm., 99, 58–69, https://doi.org/10.1016/j.isprsjprs.2014.10.006, 2015a.
Chen, S., Han, L., Chen, X., Li, D., Sun, L., and Li, Y.: Estimating wide range Total Suspended Solids concentrations from MODIS 250-m imageries: An improved method, ISPRS J. Photogramm., 99, 58–69, https://doi.org/10.1016/j.isprsjprs.2014.10.006, 2015b.
Chen, Z., Hu, C., and Muller-Karger, F.: Monitoring turbidity in Tampa Bay using MODIS/Aqua 250-m imagery, Remote Sens. Environ., 109, 207–220, https://doi.org/10.1016/j.rse.2006.12.019, 2007.
Cherukuru, N., Ford, P. W., Matear, R. J., Oubelkheir, K., Clementson, L. A., Suber, K., and Steven, A. D. L.: Estimating dissolved organic carbon concentration in turbid coastal waters using optical remote sensing observations, Int. J. Appl. Earth Obs., 52, 149–154, https://doi.org/10.1016/j.jag.2016.06.010, 2016a.
Cherukuru, N., Ford, P. W., Matear, R. J., Oubelkheir, K., Clementson, L. A., Suber, K., and Steven, A. D. L.: Estimating dissolved organic carbon concentration in turbid coastal waters using optical remote sensing observations, Int. J. Appl. Earth Obs., 52, 149–154, https://doi.org/10.1016/j.jag.2016.06.010, 2016b.
Cherukuru, N., Martin, P., Sanwlani, N., Mujahid, A., and Müller, M.: A semi-analytical optical remote sensing model to estimate suspended sediment and dissolved organic carbon in tropical coastal waters influenced by peatland-draining river discharges off sarawak, borneo, Remote Sens.-Basel, 13, 1–31, https://doi.org/10.3390/rs13010099, 2021.
Chong, X. Y., Gibbins, C. N., Vericat, D., Batalla, R. J., Teo, F. Y., and Lee, K. S. P.: A framework for Hydrological characterisation to support Functional Flows (HyFFlow): Application to a tropical river, J. Hydrol. Reg. Stud., 36, 100838, https://doi.org/10.1016/j.ejrh.2021.100838, 2021.
CIFOR: Forest Carbon Database, https://carbonstock.cifor.org/, last access: 3 August 2021.
Cui, T., Zhang, J., Groom, S., Sun, L., Smyth, T., and Sathyendranath, S.: Remote Sensing of Environment Validation of MERIS ocean-color products in the Bohai Sea: A case study for turbid coastal waters, Remote Sens. Environ., 114, 2326–2336, https://doi.org/10.1016/j.rse.2010.05.009, 2010.
Davies, J., Mathhew, U., Aikanathan, S., Nyon, Y. C., and Chong, G.: A Quick Scan of Peatlands, Wetl. Int. Malaysia, 1, 1–80, 2010.
de Matos Valerio, A., Kampel, M., Vantrepotte, V., Ward, N. D., Sawakuchi, H. O., Less, D. F. D. S., Neu, V., Cunha, A., and Richey, J.: Using CDOM optical properties for estimating DOC concentrations and pCO2 in the Lower Amazon River, Opt. Express, 26, A657, https://doi.org/10.1364/oe.26.00a657, 2018.
Department of Environment: Malaysia Marine Water Quality Standards and Index, 16, https://www.doe.gov.my/portalv1/wp-content/uploads/2019/04/BOOKLET-BI.pdf (last access: 12 September 2021), 2019.
Department of Environment: National Water Quality Standards for Malaysia, https://www.doe.gov.my/wp-content/uploads/2021/11/Standard-Kualiti-Air-Kebangsaan.pdf (last access: 7 December 2022), 2021.
Department of Statistics Malaysia: Sarawak Population, Popul. by Adm. Dist. Ethn. group, Sarawak, https://sarawak.gov.my/web/home/article_view/240/175 (last access: 1 May 2021), 2020.
DID, Department of Irrigation & Drainage Sarawak: Introduction to Integrated Coastal Zone Management, https://did.sarawak.gov.my/page-0-123-476-INTEGRATED-COASTAL-ZONE-MANAGEMENT.html (last access: 21 October 2021a), 2021.
DID, Department Of Irrigation & Drainage Sarawak: Hydrology Stations at Sg Sarawak Basin, https://did.sarawak.gov.my/modules/web/pages.php?mod=webpage&sub=page&id=317 (last access: 1 October 2021) 2021b.
Dindang, A., Chung, C. N., and Seth, S.: Heavy Rainfall Episodes over Sarawak during January–February 2011 Northeast Monsoon, JMM Res. Publ., (11), 41, 2011.
Dogliotti, A. I., Ruddick, K. G., Nechad, B., Doxaran, D., and Knaeps, E.: A single algorithm to retrieve turbidity from remotely-sensed data in all coastal and estuarine waters, Remote Sens. Environ., 156, 157–168, https://doi.org/10.1016/j.rse.2014.09.020, 2015.
Donohue, I. and Garcia Molinos, J.: Impacts of increased sediment loads on the ecology of lakes, Biol. Rev., 84, 517–531, https://doi.org/10.1111/j.1469-185X.2009.00081.x, 2009.
Dorji, P. and Fearns, P.: Impact of the spatial resolution of satellite remote sensing sensors in the quantification of total suspended sediment concentration: A case study in turbid waters of Northern Western Australia, PLOS ONE, 12, 1–24, https://doi.org/10.1371/journal.pone.0175042, 2017.
Erftemeijer, P. L. A., Riegl, B., Hoeksema, B. W., and Todd, P. A.: Environmental impacts of dredging and other sediment disturbances on corals: A review, Mar. Pollut. Bull., 64, 1737–1765, https://doi.org/10.1016/j.marpolbul.2012.05.008, 2012.
Espinoza Villar, R., Martinez, J. M., Le Texier, M., Guyot, J. L., Fraizy, P., Meneses, P. R., and de Oliveira, E.: A study of sediment transport in the Madeira River, Brazil, using MODIS remote-sensing images, J. South Am. Earth Sci., 44, 45–54, https://doi.org/10.1016/j.jsames.2012.11.006, 2013.
European Space Agency: Sentinel-2, https://sentinels.copernicus.eu/web/sentinel/user-guides/sentinel-2-msi/ (last access: 29 October 2022), 2022a.
European Space Agency: Sentinel-3, https://sentinel.esa.int/web/sentinel/missions/sentinel-3 (last access: 29 October 2022), 2022b.
Fabricius, K. E.: Effects of terrestrial runoff on the ecology of corals and coral reefs: Review and synthesis, Mar. Pollut. Bull., 50, 125–146, https://doi.org/10.1016/j.marpolbul.2004.11.028, 2005.
Fabricius, K. E., Logan, M., Weeks, S. J., Lewis, S. E., and Brodie, J.: Changes in water clarity in response to river discharges on the Great Barrier Reef continental shelf: 2002-2013, Estuar. Coast. Shelf S., 173, A1–A15, https://doi.org/10.1016/j.ecss.2016.03.001, 2016.
Gaveau, D. L. A., Sheil, D., Salim, M. A., Arjasakusuma, S., Ancrenaz, M., Pacheco, P., and Meijaard, E.: Rapid conversions and avoided deforestation: examining four decades of industrial plantation expansion in Borneo, Sci. Rep., 6, 32017, https://doi.org/10.1038/srep32017, 2016.
Gilmour, J. P., Cooper, T. F., Fabricius, K. E., and Smith, L. D.: Early warning indicators of change in the condition of corals and coral communities in response to key anthropogenic stressors in the Pilbara, Western Australia, Aust. Inst. Mar. Sci. Rep. to Environ. Prot. Authority, https://www.researchgate.net/profile/ (last access: 8 December 2022), 101 pp., 2006.
Giuliani, G., Chatenoux, B., Piller, T., Moser, F., and Lacroix, P.: Data Cube on Demand (DCoD): Generating an earth observation Data Cube anywhere in the world, Int. J. Appl. Earth Obs., 87, 102035, https://doi.org/10.1016/j.jag.2019.102035, 2020.
Gomes, V. C. F., Carlos, F. M., Queiroz, G. R., Ferreira, K. R., and Santos, R.: Accessing and Processing Brazilian Earth Observation Data Cubes With the Open Data Cube Platform, ISPRS Ann. Photogramm. Remote Sens. Spat. Inf. Sci., V-4–2021, 153–159, https://doi.org/10.5194/isprs-annals-v-4-2021-153-2021, 2021.
Gomyo, M. and Koichiro, K.: Spatial and temporal variations in rainfall and the ENSO-rainfall relationship over Sarawak, Malaysian Borneo, Sci. Online Lett. Atmos., 5, 41–44, https://doi.org/10.2151/sola.2009-011, 2009.
González Vilas, L., Spyrakos, E., and Torres Palenzuela, J. M.: Neural network estimation of chlorophyll a from MERIS full resolution data for the coastal waters of Galician rias (NW Spain), Remote Sens. Environ., 115, 524–535, https://doi.org/10.1016/j.rse.2010.09.021, 2011.
Ha, N. T. T., Thao, N. T. P., Koike, K., and Nhuan, M. T.: Selecting the best band ratio to estimate chlorophyll-a concentration in a tropical freshwater lake using Sentinel 2A images from a case study of Lake Ba Be (Northern Vietnam), ISPRS Int. J. Geo-Inf., 6, , https://doi.org/10.3390/ijgi6090290, 2017.
Henley, W. F., Patterson, M. A., Neves, R. J., and Dennis Lemly, A.: Effects of Sedimentation and Turbidity on Lotic Food Webs: A Concise Review for Natural Resource Managers, Rev. Fish. Sci., 8, 125–139, https://doi.org/10.1080/10641260091129198, 2000.
Hodgson, G.: Tetracycline reduces sedimentation damage to corals, Mar. Biol., 104, 493–496, 1990.
Hon, J. and Shibata, S.: A Review on Land Use in the Malaysian State of Sarawak, Borneo and Recommendations for Wildlife Conservation Inside Production Forest Environment, Borneo J. Resour. Sci. Technol., 3, 22–35, https://doi.org/10.33736/bjrst.244.2013, 2013.
Horsburgh, J. S., Spackman, A., Stevens, D. K., Tarboton, D. G., and Mesner, N. O.: A sensor network for high frequency estimation of water quality constituent fluxes using surrogates, Environ. Modell. Softw., 25, 1031–1044, https://doi.org/10.1016/j.envsoft.2009.10.012, 2010.
Howarth, R. W.: Coastal nitrogen pollution: A review of sources and trends globally and regionally, Harmful Algae, 8, 14–20, https://doi.org/10.1016/j.hal.2008.08.015, 2008.
Hu, C., Lee, Z. and Franz, B.: Chlorophyll a algorithms for oligotrophic oceans: A novel approach based on three-band reflectance difference, J. Geophys. Res.-Oceans, 117, 1–25, https://doi.org/10.1029/2011JC007395, 2012.
Jiang, D., Matsushita, B., Pahlevan, N., Gurlin, D., Lehmann, M. K., Fichot, C. G., Schalles, J., Loisel, H., Binding, C., Zhang, Y., Alikas, K., Kangro, K., Uusõue, M., Ondrusek, M., Greb, S., Moses, W. J., Lohrenz, S., and O'Donnell, D.: Remotely estimating total suspended solids concentration in clear to extremely turbid waters using a novel semi-analytical method, Remote Sens. Environ., 258, 112386, https://doi.org/10.1016/j.rse.2021.112386, 2021.
Jiang, H. and Liu, Y.: Monitoring of TSS concentration in Poyang Lake based on MODIS data, Yangtze River, 42, 87–90, 2011.
Kemp, P., Sear, D., Collins, A., Naden, P., and Jones, I.: The impacts of fine sediment on riverine fish, Hydrol. Process., 25, 1800–1821, https://doi.org/10.1002/hyp.7940, 2011.
Killough, B.: The Impact of Analysis Ready Data in the Africa Regional Data Cube, Int. Geosci. Remote Sens. Symp., July 2019, 5646–5649, https://doi.org/10.1109/IGARSS.2019.8898321, 2019.
Kim, H. C., Son, S., Kim, Y. H., Khim, J. S., Nam, J., Chang, W. K., Lee, J. H., Lee, C. H., and Ryu, J.: Remote sensing and water quality indicators in the Korean West coast: Spatio-temporal structures of MODIS-derived chlorophyll-a and total suspended solids, Mar. Pollut. Bull., 121, 425–434, https://doi.org/10.1016/j.marpolbul.2017.05.026, 2017.
Krause, C., Dunn, B., Bishop-Taylor, R., Adams, C., Burton, C., Alger, M., Chua, S., Phillips, C., Newey, V., Kouzoubov, K., Leith, A., Ayers, D., Hicks, A., and DEA Notebooks contributors 2021: Digital Earth Australia notebooks and tools repository, Geoscience Australia, Canberra, https://doi.org/10.26186/145234, 2021.
Kuok, K. K., Chiu, P., Yap, A., and Law, K.: Determination of the Best Tank Model for the Southern Region of Sarawak Determination Number of Tanks for Tank Model at Southern Region of Sarawak, IUP J. Soil Water Sci., 4, https://www.researchgate.net/profile/ (last access: 8 December 2022), 2018.
Langer, O. E.: Effects of sedimentation on salmonid stream life. Environment Canada, Unpubl. report. Environ. Prot. Serv. North Vancouver, BC, Canada, 1980.
Lavigne, H., Van der Zande, D., Ruddick, K., Cardoso Dos Santos, J. F., Gohin, F., Brotas, V., and Kratzer, S.: Quality-control tests for OC4, OC5 and NIR-red satellite chlorophyll-a algorithms applied to coastal waters, Remote Sens. Environ., 255, 112237, https://doi.org/10.1016/j.rse.2020.112237, 2021.
Lee, K. H., Noh, J., and Khim, J. S.: The Blue Economy and the United Nations' sustainable development goals: Challenges and opportunities, Environ. Int., 137, 105528, https://doi.org/10.1016/j.envint.2020.105528, 2020.
Lee, W. C., Viswanathan, K. K., Kamri, T., and King, S.: Status of Sarawak Fisheries: Challenges and Way Forward, Int. J. Serv. Manag. Sustain., 5, 187–200, https://doi.org/10.24191/ijsms.v5i2.11719, 2020.
Lehner, B., Verdin, K., and Jarvis, A.: HydroSHEDS technical documentation, World Wildl. Fund US, Washington, DC, 1–27, 2006.
Lemley, D. A., Adams, J. B., Bornman, T. G., Campbell, E. E., and Deyzel, S. H. P.: Land-derived inorganic nutrient loading to coastal waters and potential implications for nearshore plankton dynamics, Cont. Shelf Res., 174, 1–11, https://doi.org/10.1016/j.csr.2019.01.003, 2019.
Lewis, A., Oliver, S., Lymburner, L., Evans, B., Wyborn, L., Mueller, N., Raevksi, G., Hooke, J., Woodcock, R., Sixsmith, J., Wu, W., Tan, P., Li, F., Killough, B., Minchin, S., Roberts, D., Ayers, D., Bala, B., Dwyer, J., Dekker, A., Dhu, T., Hicks, A., Ip, A., Purss, M., Richards, C., Sagar, S., Trenham, C., Wang, P., and Wang, L. W.: The Australian Geoscience Data Cube — Foundations and lessons learned, Remote Sens. Environ., 202, 276–292, https://doi.org/10.1016/j.rse.2017.03.015, 2017.
Ling, T. Y., Soo, C. L., Sivalingam, J. R., Nyanti, L., Sim, S. F., and Grinang, J.: Assessment of the Water and Sediment Quality of Tropical Forest Streams in Upper Reaches of the Baleh River, Sarawak, Malaysia, Subjected to Logging Activities, edited by: Ávila-Pérez, P., J. Chem., 2016, 8503931, https://doi.org/10.1155/2016/8503931, 2016.
Liu, B., D'Sa, E. J., and Joshi, I.: Multi-decadal trends and influences on dissolved organic carbon distribution in the Barataria Basin, Louisiana from in-situ and Landsat/MODIS observations, Remote Sens. Environ., 228, 183–202, https://doi.org/10.1016/j.rse.2019.04.023, 2019.
Loisel, H., Mangin, A., Vantrepotte, V., Dessailly, D., Ngoc Dinh, D., Garnesson, P., Ouillon, S., Lefebvre, J. P., Mériaux, X., and Minh Phan, T.: Variability of suspended particulate matter concentration in coastal waters under the Mekong's influence from ocean color (MERIS) remote sensing over the last decade, Remote Sens. Environ., 150, 218–230, https://doi.org/10.1016/j.rse.2014.05.006, 2014.
Long, S. M.: Sarawak Coastal Biodiversity: A Current Status, Kuroshio Sci., 8, 71–84, https://www.researchgate.net/publication/265793245 (last access: 21 October 2021), 2014.
Lu, Y., Yuan, J., Lu, X., Su, C., Zhang, Y., Wang, C., Cao, X., Li, Q., Su, J., Ittekkot, V., Garbutt, R. A., Bush, S., Fletcher, S., Wagey, T., Kachur, A., and Sweijd, N.: Major threats of pollution and climate change to global coastal ecosystems and enhanced management for sustainability, Environ. Pollut., 239, 670–680, https://doi.org/10.1016/j.envpol.2018.04.016, 2018.
Macklin, M. G., Jones, A. F., and Lewin, J.: River response to rapid Holocene environmental change: evidence and explanation in British catchments, Quaternary Sci. Rev., 29, 1555–1576, https://doi.org/10.1016/j.quascirev.2009.06.010, 2010.
Mao, Z., Chen, J., Pan, D., Tao, B., and Zhu, Q.: A regional remote sensing algorithm for total suspended matter in the East China Sea, Remote Sens. Environ., 124, 819–831, https://doi.org/10.1016/j.rse.2012.06.014, 2012.
Martin, P., Cherukuru, N., Tan, A. S. Y., Sanwlani, N., Mujahid, A., and Müller, M.: Distribution and cycling of terrigenous dissolved organic carbon in peatland-draining rivers and coastal waters of Sarawak, Borneo, Biogeosciences, 15, 6847–6865, https://doi.org/10.5194/bg-15-6847-2018, 2018.
Mengen, D., Ottinger, M., Leinenkugel, P., and Ribbe, L.: Modeling river discharge using automated river width measurements derived from sentinel-1 time series, Remote Sens.-Basel, 12, 1–24, https://doi.org/10.3390/rs12193236, 2020.
Milliman, J. D. and Farnsworth, K. L.: River discharge to the coastal ocean: a global synthesis, Cambridge University Press, USA, 2013.
Mohammad Razi, M. A., Mokhtar, A., Mahamud, M., Rahmat, S. N., and Al-Gheethi, A.: Monitoring of river and marine water quality at Sarawak baseline, Environ. Forensics, 22, 219–240, https://doi.org/10.1080/15275922.2020.1836076, 2021.
Moore, T. S., Campbell, J. W., and Dowell, M. D.: A class-based approach to characterizing and mapping the uncertainty of the MODIS ocean chlorophyll product, Remote Sens. Environ., 113, 2424–2430, https://doi.org/10.1016/j.rse.2009.07.016, 2009.
Morel, A. and Bélanger, S.: Improved detection of turbid waters from ocean color sensors information, Remote Sens. Environ., 102, 237–249, https://doi.org/10.1016/j.rse.2006.01.022, 2006.
Morel, A. and Gentili, B.: A simple band ratio technique to quantify the colored dissolved and detrital organic material from ocean color remotely sensed data, Remote Sens. Environ., 113, 998–1011, https://doi.org/10.1016/j.rse.2009.01.008, 2009.
Mueller, J., MuelIer, J., Pietras, C., Hooker, S., Clark, D., Frouin, A., Mitchell, B., Bidigare, R., Trees, C., and Werdell, J.: Ocean Optics Protocols for Satellite Ocean Color Sensor Validation, Revision 3, Vol. 2, NASA Center for AeroSpace Information, 2002.
Müller, D., Warneke, T., Rixen, T., Müller, M., Mujahid, A., Bange, H. W., and Notholt, J.: Fate of terrestrial organic carbon and associated CO2 and CO emissions from two Southeast Asian estuaries, Biogeosciences, 13, 691–705, https://doi.org/10.5194/bg-13-691-2016, 2016.
Müller-Dum, D., Warneke, T., Rixen, T., Müller, M., Baum, A., Christodoulou, A., Oakes, J., Eyre, B. D., and Notholt, J.: Impact of peatlands on carbon dioxide (CO2) emissions from the Rajang River and Estuary, Malaysia, Biogeosciences, 16, 17–32, https://doi.org/10.5194/bg-16-17-2019, 2019.
NASA Official: Ocean Level-2 Data Format Specification, NASA's Earth Obs. Syst. Data Inf. Syst., https://oceancolor.gsfc.nasa.gov/docs/format/l2nc/, last access: 29 October 2022a.
NASA Official: Spectral Characterization Data by Sensor, NASA's Earth Obs. Syst. Data Inf. Syst., https://oceancolor.gsfc.nasa.gov/docs/rsr/rsr_tables/#MODIS-AQUA, last access: 29 October 2022b.
Nazirova, K., Alferyeva, Y., Lavrova, O., Shur, Y., Soloviev, D., Bocharova, T., and Strochkov, A.: Comparison of in situ and remote-sensing methods to determine turbidity and concentration of suspended matter in the estuary zone of the mzymta river, black sea, Remote Sens.-Basel, 13, 1–29, https://doi.org/10.3390/rs13010143, 2021.
Neil, C., Spyrakos, E., Hunter, P. D., and Tyler, A. N.: A global approach for chlorophyll-a retrieval across optically complex inland waters based on optical water types, Remote Sens. Environ., 229, 159–178, https://doi.org/10.1016/j.rse.2019.04.027, 2019.
Ondrusek, M., Stengel, E., Kinkade, C. S., Vogel, R. L., Keegstra, P., Hunter, C., and Kim, C.: The development of a new optical total suspended matter algorithm for the Chesapeake Bay, Remote Sens. Environ., 119, 243–254, https://doi.org/10.1016/j.rse.2011.12.018, 2012.
Open Data Cube: Open Data Cube, https://opendatacube.readthedocs.io/en/latest/user/intro.html, last access: 8 December 2022.
Pahlevan, N., Smith, B., Binding, C., and O'Donnell, D. M.: Spectral band adjustments for remote sensing reflectance spectra in coastal/inland waters, Opt. Express, 25, 28650–28667, 2017.
Park, G. S.: The role and distribution of total suspended solids in the macrotidal coastal waters of Korea, Environ. Monit. Assess., 135, 153–162, https://doi.org/10.1007/s10661-007-9640-3, 2007.
Petus, C., Marieu, V., Novoa, S., Chust, G., Bruneau, N., and Froidefond, J. M.: Monitoring spatio-temporal variability of the Adour River turbid plume (Bay of Biscay, France) with MODIS 250-m imagery, Cont. Shelf Res., 74, 35–49, https://doi.org/10.1016/j.csr.2013.11.011, 2014.
Praveena, S. M., Siraj, S. S., and Aris, A. Z.: Coral reefs studies and threats in Malaysia: A mini review, Rev. Environ. Sci. Bio., 11, 27–39, https://doi.org/10.1007/s11157-011-9261-8, 2012.
Ramaswamy, V., Rao, P. S., Rao, K. H., Thwin, S., Rao, N. S., and Raiker, V.: Tidal influence on suspended sediment distribution and dispersal in the northern Andaman Sea and Gulf of Martaban, Mar. Geol., 208, 33–42, https://doi.org/10.1016/j.margeo.2004.04.019, 2004.
Refaeilzadeh, P., Tang, L., and Liu, H.: Cross-validation, Encycl. database Syst., 5, 532–538, 2009.
Risk, M. J. and Edinger, E.: Impacts of sediment on coral reefs, Encycl. Mod. coral reefs, Springer, the Netherlands, 575–586, https://doi.org/10.1007/978-90-481-2639-2, 2011.
Rogers, C. S.: The effect of shading on coral reef structure and function, J. Exp. Mar. Bio. Ecol., 41, 269–288, https://doi.org/10.1016/0022-0981(79)90136-9, 1979.
Sa'adi, Z., Shahid, S., Chung, E. S., and bin Ismail, T.: Projection of spatial and temporal changes of rainfall in Sarawak of Borneo Island using statistical downscaling of CMIP5 models, Atmos. Res., 197, 446–460, https://doi.org/10.1016/j.atmosres.2017.08.002, 2017.
Sandifer, P. A., Keener, P., Scott, G. I., and Porter, D. E.: Chap. 12 – Oceans and Human Health and the New Blue Economy, edited by: Hotaling, L. and R. W. B. T.-P. a W. for the N. B. E. Spinrad, 213–236, Elsevier, 2021.
Sarawak Forestry Corporation: Maludam National Park, Sarawak For. Corp., https://sarawakforestry.com/parks-and-reserves/maludam-national-park/, last access: 1 October 2022.
Sarawak Tourism Board: Talang Satang National Park, https://www.sarawaktourism.com/PlaceDetail.aspx?pid=428&plat=1.784278236410390&plng=110.164262072589000 (last access: 7 December 2022), 2022.
Seegers, B. N., Stumpf, R. P., Schaeffer, B. A., Loftin, K. A., and Werdell, P. J.: Performance metrics for the assessment of satellite data products: an ocean color case study, Opt. Express, 26, 7404, https://doi.org/10.1364/oe.26.007404, 2018.
Shaw, E. Al and Richardson, J. S.: Direct and indirect effects of sediment pulse duration on stream invertebrate assemblages and rainbow trout (Oncorhynchus mykiss) growth and survival, Can. J. Fish. Aquat. Sci., 58, 2213–2221, https://doi.org/10.1139/f01-160, 2001.
Sim, C., Cherukuru, N., Mujahid, A., Martin, P., Sanwlani, N., Warneke, T., Rixen, T., Notholt, J., and Müller, M.: A new remote sensing method to estimate river to ocean DOC flux in peatland dominated Sarawak coastal regions, Borneo, Remote Sens.-Basel, 12, 1–13, https://doi.org/10.3390/rs12203380, 2020.
Siswanto, E., Tang, J., and Yamaguchi, H.: Empirical ocean-color algorithms to retrieve chlorophyll-a, total suspended matter, and colored dissolved organic matter absorption coefficient in the Yellow and East China Seas, J. Oceanogr., 67, 627–650, https://doi.org/10.1007/s10872-011-0062-z, 2011.
Slonecker, E. T., Jones, D. K., and Pellerin, B. A.: The new Landsat 8 potential for remote sensing of colored dissolved organic matter (CDOM), Mar. Pollut. Bull., 107, 518–527, https://doi.org/10.1016/j.marpolbul.2016.02.076, 2016.
Song, C., Wang, G., Sun, X., Chang, R., and Mao, T.: Control factors and scale analysis of annual river water, sediments and carbon transport in China, Sci. Rep.-UK, 6, 1–14, https://doi.org/10.1038/srep25963, 2016.
Song, Z., Shi, W., Zhang, J., Hu, H., Zhang, F., and Xu, X.: Transport mechanism of suspended sediments and migration trends of sediments in the central hangzhou bay, Water (Switzerland), 12, https://doi.org/10.3390/W12082189, 2020.
Soo, C. L., Chen, C. A., and Mohd-Long, S.: Assessment of Near-Bottom Water Quality of Southwestern Coast of Sarawak, Borneo, Malaysia: A Multivariate Statistical Approach, J. Chem., 2017, 1590329, https://doi.org/10.1155/2017/1590329, 2017.
Soum, S., Ngor, P. B., Dilts, T. E., Lohani, S., Kelson, S., Null, S. E., Tromboni, F., Hogan, Z. S., Chan, B., and Chandra, S.: Spatial and long-term temporal changes in water quality dynamics of the tonle sap ecosystem, Water (Switzerland), 13, https://doi.org/10.3390/w13152059, 2021.
Staub, J. R. and Esterle, J. S.: Provenance and sediment dispersal in the Rajang River delta/coastal plain system, Sarawak, East Malaysia, Sediment. Geol., 85, 191–201, https://doi.org/10.1016/0037-0738(93)90083-H, 1993.
Staub, J. R., Among, H. L., and Gastaldo, R. A.: Seasonal sediment transport and deposition in the Rajang River delta, Sarawak, East Malaysia, Sediment. Geol., 133, 249–264, https://doi.org/10.1016/S0037-0738(00)00042-7, 2000.
Sun, C.: Riverine influence on ocean color in the equatorial South China Sea, Cont. Shelf Res., 143, 151–158, https://doi.org/10.1016/j.csr.2016.10.008, 2017a.
Sun, C.: Riverine influence on ocean color in the equatorial South China Sea, Cont. Shelf Res., 143, 151–158, https://doi.org/10.1016/j.csr.2016.10.008, 2017b.
Sutherland, A. B. and Meyer, J. L.: Effects of increased suspended sediment on growth rate and gill condition of two southern Appalachian minnows, Environ. Biol. Fish., 80, 389–403, https://doi.org/10.1007/s10641-006-9139-8, 2007.
Swaine, M. D.: T. C. Whitmore 1984, Tropical rain forests of the Far East, 2nd Edn., Oxford University Press, Oxford, 352 xvi pages, ISBN 0-19-854136-8, J. Trop. Ecol., 1, 64–64, https://doi.org/10.1017/S0266467400000080, 1985.
Swain, R. and Sahoo, B.: Mapping of heavy metal pollution in river water at daily time-scale using spatio-temporal fusion of MODIS-aqua and Landsat satellite imageries, J. Environ. Manage., 192, 1–14, https://doi.org/10.1016/j.jenvman.2017.01.034, 2017.
Tang, F. E. and Lee, V. Z.: Study of Coastal Areas in Miri, in World Engineering Congress 2010, 2–5 August 2010, Kuching, Sarawak, Malaysia, Conference on Natural Resources and Green Technology, 56–65, Kuching, 2010.
Tangang, F. T., Juneng, L., Salimun, E., Sei, K. M., Le, L. J., and Muhamad, H.: Climate change and variability over Malaysia: Gaps in science and research information, Sains Malaysiana, 41, 1355–1366, 2012.
Tawan, A. S., Ling, T. Y., Nyanti, L., Sim, S. F., Grinang, J., Soo, C. L., Lee, K. S. P., and Ganyai, T.: Assessment of water quality and pollutant loading of the Rajang River and its tributaries at Pelagus area subjected to seasonal variation and river regulation, Environ. Dev. Sustain., 22, 4101–4124, https://doi.org/10.1007/s10668-019-00374-9, 2020.
Telesnicki, G. J. and Goldberg, W. M.: CORAL REEF PAPER, Effects of turbidity on the photosynthesis and respiration of two south florida reef coral species, Bull. Mar. Sci., 57, 527–539, 1995.
Tromboni, F., Dilts, T. E., Null, S. E., Lohani, S., Ngor, P. B., Soum, S., Hogan, Z., and Chandra, S.: Changing land use and population density are degrading water quality in the lower mekong basin, Water (Switzerland), 13, 1–16, https://doi.org/10.3390/w13141948, 2021.
United Nations: Factsheet: People and Oceans, Ocean Conf., 53, 130, https://www.un.org/sustainabledevelopment/wp-content/uploads/2017/05/Ocean-fact-sheet-package.pdf (last access: 8 December 2022), 2017.
Verschelling, E., van der Deijl, E., van der Perk, M., Sloff, K., and Middelkoop, H.: Effects of discharge, wind, and tide on sedimentation in a recently restored tidal freshwater wetland, Hydrol. Process., 31, 2827–2841, https://doi.org/10.1002/hyp.11217, 2017.
Vietnam National Space Centre: Introduction of satellite data sharing system Vietnam Data Cube, https://vnsc.org.vn/en/news-events/news/introduction-of-satellite-data-sharing-system-vietnam-data-cube/#:~:text=Vietnam Data Cube was developed,changes%2C forest and land utilization (last acccess: 7 December 2022), 2018.
Vijith, H., Hurmain, A., and Dodge-Wan, D.: Impacts of land use changes and land cover alteration on soil erosion rates and vulnerability of tropical mountain ranges in Borneo, Remote Sens. Appl. Soc. Environ., 12, 57–69, https://doi.org/10.1016/j.rsase.2018.09.003, 2018.
Wang, C., Chen, S., Li, D., Wang, D., Liu, W., and Yang, J.: A Landsat-based model for retrieving total suspended solids concentration of estuaries and coasts in China, Geosci. Model Dev., 10, 4347–4365, https://doi.org/10.5194/gmd-10-4347-2017, 2017.
Wang, J., Tong, Y., Feng, L., Zhao, D., Zheng, C., and Tang, J.: Satellite-Observed Decreases in Water Turbidity in the Pearl River Estuary: Potential Linkage With Sea-Level Rise, J. Geophys. Res.-Oceans, 126, 1–17, https://doi.org/10.1029/2020JC016842, 2021.
Weber, M., Lott, C., and Fabricius, K. E.: Sedimentation stress in a scleractinian coral exposed to terrestrial and marine sediments with contrasting physical, organic and geochemical properties, J. Exp. Mar. Bio. Ecol., 336, 18–32, https://doi.org/10.1016/j.jembe.2006.04.007, 2006.
Werdell, P. J., McKinna, L. I. W., Boss, E., Ackleson, S. G., Craig, S. E., Gregg, W. W., Lee, Z., Maritorena, S., Roesler, C. S., Rousseaux, C. S., Stramski, D., Sullivan, J. M., Twardowski, M. S., Tzortziou, M., and Zhang, X.: An overview of approaches and challenges for retrieving marine inherent optical properties from ocean color remote sensing, Prog. Oceanogr., 160, 186–212, https://doi.org/10.1016/j.pocean.2018.01.001, 2018.
Wilber, D. H. and Clarke, D. G.: Biological Effects of Suspended Sediments: A Review of Suspended Sediment Impacts on Fish and Shellfish with Relation to Dredging Activities in Estuaries, N. Am. J. Fish. Manage., 21, 855–875, https://doi.org/10.1577/1548-8675(2001)021<0855:beossa>2.0.co;2, 2001.
World Bank and United Nations Department of Economic and Social Affairs (UNDESA): The Potential of the Blue Economy: Increasing Long-term Benefits of the Sustainable Use of Marine Resources for Small Island Developing States and Coastal Least Developed Countries, World Bank, Washington DC, 2017.
Wu, C. S., Yang, S. L., and Lei, Y.: Quantifying the anthropogenic and climatic impacts on water discharge and sediment load in the Pearl River (Zhujiang), China (1954–2009), J. Hydrol., 452/453, 190–204, https://doi.org/10.1016/j.jhydrol.2012.05.064, 2012.
Yang, S. L., Zhao, Q. Y., and Belkin, I. M.: Temporal variation in the sediment load of the Yangtze river and the influences of human activities, J. Hydrol., 263, 56–71, https://doi.org/10.1016/S0022-1694(02)00028-8, 2002.
Zhan, W., Wu, J., Wei, X., Tang, S., and Zhan, H.: Spatio-temporal variation of the suspended sediment concentration in the Pearl River Estuary observed by MODIS during 2003–2015, Cont. Shelf Res., 172, 22–32, https://doi.org/10.1016/j.csr.2018.11.007, 2019.
Zhang, L. J., Wang, L., Cai, W.-J., Liu, D. M., and Yu, Z. G.: Impact of human activities on organic carbon transport in the Yellow River, Biogeosciences, 10, 2513–2524, https://doi.org/10.5194/bg-10-2513-2013, 2013.
Zhang, M., Tang, J., Dong, Q., Song, Q. T., and Ding, J.: Retrieval of total suspended matter concentration in the Yellow and East China Seas from MODIS imagery, Remote Sens. Environ., 114, 392–403, https://doi.org/10.1016/j.rse.2009.09.016, 2010.
Zhang, Y., Lin, S., Liu, J., Qian, X., and Ge, Y.: Time-series MODIS image-based retrieval and distribution analysis of total suspended matter concentrations in Lake Taihu (China), Int. J. Environ. Res. Public Health, 7, 3545–3560, https://doi.org/10.3390/ijerph7093545, 2010.
Zhou, Y., Xuan, J., and Huang, D.: Tidal variation of total suspended solids over the Yangtze Bank based on the geostationary ocean color imager, Sci. China Earth Sci., 63, 1381–1389, https://doi.org/10.1007/s11430-019-9618-7, 2020.