the Creative Commons Attribution 4.0 License.
the Creative Commons Attribution 4.0 License.
 | 15 Feb 2022
Nutrient transport and transformation in macrotidal estuaries of the French Atlantic coast: a modeling approach using the Carbon-Generic Estuarine Model
Xi Wei
Josette Garnier
Vincent Thieu
Paul Passy
Romain Le Gendre
Gilles Billen
Maia Akopian
Goulven Gildas Laruelle
Estuaries are key reactive ecosystems along the land–ocean aquatic continuum, with significant ecological and economic value. However, they have been facing strong morphological management changes and increased nutrient and contaminant inputs, possibly leading to ecological problems such as coastal eutrophication. Therefore, it is necessary to quantify the import and export fluxes of the estuaries, their retention capacity, and estuarine eutrophication potential. The 1-D Carbon-Generic Estuary Model (C-GEM) was used to simulate the transient hydrodynamics, transport, and biogeochemistry for estuaries with different sizes and morphologies along the French Atlantic coast during the period 2014–2016 using readily available geometric, hydraulic, and biogeochemical data. These simulations allowed us to evaluate the budgets of the main nutrients (phosphorus – P; nitrogen – N; silica – Si) and total organic carbon (TOC), and their imbalance, providing insights into their eutrophication potential. Cumulated average annual fluxes to the Atlantic coast from the seven estuaries studied were 9.6 kt P yr−1, 259 kt N yr−1, 304 kt Si yr−1, and 145 kt C yr−1. Retention rates varied depending on the estuarine residence times, ranging from 0 %–27 % and 0 %–34 % to 2 %–39 % and 8 %–96 % for total phosphorus (TP), total nitrogen (TN), dissolved silica (DSi), and TOC, respectively. Large-scale estuaries had higher retention rates than medium and small estuaries, which we interpreted in terms of estuarine residence times. As shown by the indicator of eutrophication potential (ICEP), there might be a risk of coastal eutrophication, i.e., the development of non-siliceous algae that is potentially harmful to the systems studied due to the excess TN over DSi. This study also demonstrates the ability of our model to be applied with a similar setup to several estuarine systems characterized by different sizes, geometries, and riverine loads.
- Article
(2867 KB) - Full-text XML
-
Supplement
(1417 KB) - BibTeX
- EndNote


Nutrient transport and transformation along the land–ocean aquatic continuum are receiving increasing attention due to their role in the global nutrient cycle and budget (Howarth et al., 2011, 1991). The estuary is a partly enclosed body of water, characterized by the mixing of salty ocean water with fresh river water (Pritchard, 1967; Vilas et al., 2021), and is an important reactive ecosystem along the land–ocean continuum (Crossland et al., 2005; Regnier et al., 2013). Morphologically, an estuary is an important component connecting land to ocean (Dürr et al., 2011). Freshwater, suspended particulate matter (SPM), nutrients, and contaminations from watersheds are transferred to the sea and transformed through these interface ecosystems. Ecologically, estuaries are among the most productive ecosystems in the world due to dynamic biogeochemical processes, and they ensure many ecological functions that need to be preserved (Barbier et al., 2011; Liquete et al., 2013; Pozdnyakov et al., 2017). They contribute to vegetation growth (phytoplankton, aquatic angiosperms, salt marshes, mangroves, etc.) and animal production (e.g., invertebrates, fish breeding and nursing, bird reproduction and feeding, as well as resting areas). Economically, aquaculture develops around the estuary; agriculture, tourism (port cities), industry, and import/export logistics are also active within estuarine basins. Estuarine and coastal ecosystems throughout the world are some of the most heavily used and threatened natural systems (Barbier et al., 2011) despite the efforts to improve natural water quality since the implementation of the Water Framework Directive (WFD) in the early 2000s (EU Water Framework Directive, 2000). Although some improvements have been observed in the recent decades regarding some specific perturbations, for instance, a general decrease in riverine phosphorus loads across Europe, estuaries are still facing significant anthropogenic pressures given that they are the receptacle of all the contaminants and nutrients from the upper river watershed, from both point sources (urban and industrial wastewater) and diffuse sources (agriculture; Garnier et al., 2021). Additionally, harbors, channelization, and flood protection structures have changed not only the geomorphology of the estuaries but also their hydrological and biogeochemical behaviors (Romero et al., 2016). These impacts may well be at the heart of critical environmental issues such as estuary and coastal eutrophication. Eutrophication, i.e., the perturbation of aquatic ecosystems by nutrient enrichment, has been recognized as a serious environmental threat for both continental (lakes and rivers; Edmondson, 1970) and marine waters (Billen and Garnier, 1997). The amount of nutrients (N, P, and Si) delivered to the coastal zone by river systems are often the major determinants of coastal marine eutrophication problems, but previous studies have indicated that eutrophication is not only a result of high inputs of anthropogenic nutrients (N and/or P) but also of their imbalance when anthropogenic N and P are introduced in excess over Si, with the latter resulting from natural rock weathering (Billen and Garnier, 1997; Garnier et al., 2021). The manifestations of eutrophication may take various forms, including harmful algal blooms (Glibert, 2020), which can cause damage to coastal fisheries (Husson et al., 2016). Moreover, overproduction of these algal blooms, which are not suitable for consumption by zooplankton and benthic invertebrates, possibly leads to hypoxia of the bottom water layers (Garnier et al., 2021). Due to the importance of these different aspects of estuaries, their environmental situations and problems are receiving increasing attention from both researchers and stakeholders.
In order to estimate and possibly control the potential eutrophication or/and hypoxia, the biogeochemical processes (nutrient transport and transformation) in the estuarine systems should be understood. Therefore, accurate quantification of estuarine nutrient fluxes (imports and exports) is necessary for evaluating the retention of the system, i.e., the amount of nutrients either sequestered within the estuary and its sediment or eliminated from the system to the atmosphere. In other words, estuarine retention rates reflect the internal biogeochemical processes and reactions along the estuary, such as uptake, losses, transformation, changes in storage, mineralization, and degradation. Nutrient retention rates can be mainly influenced by estuarine geomorphology, the surrounding wetlands (most particularly intertidal areas), river discharge, the turbidity maximum zone, estuarine residence time, and other physical forcings (Arndt et al., 2009; Perez et al., 2011). Thus, gaining insight into the retention capacities of estuaries can help understand the biogeochemical process intensities within the estuary and also manage the nutrient imports from the upstream river basins and, hence, nutrient exports to the seas.
Although the estuarine surface areas are much smaller than those of river networks and coastal marine systems, studying the estuarine ecological function is also complex due to the influences from both the riverine and marine aspects, such as the tide, salinity gradient, estuarine turbidity maximum zone, and hydromorphology (Regnier et al., 1998; Garnier et al., 2008, 2010b; Burchard et al., 2018). To study the estuarine biogeochemical processes, common approaches include in situ sampling (Coynel et al., 2016; Kaiser et al., 2013; Michel et al., 2000; Modéran et al., 2012; Nguyen et al., 2019; Perez et al., 2011; Savoye et al., 2012) and/or numerical modeling (Arndt et al., 2009; Garnier et al., 2007; Hu and Li, 2009; Laruelle et al., 2019; Ménesguen et al., 2019; Nguyen et al., 2021; Romero et al., 2019). However, direct observations do not allow us to quantify nutrient fluxes in macrotidal estuaries because the oscillatory tidal flux is several orders of magnitude larger than the ecologically and biogeochemically relevant retention flux (Regnier et al., 1998), despite mixing curves being useful for interpreting in situ observations and nutrient dynamics. Moreover, the retention flux generally falls within the range of measurement uncertainties (Arndt et al., 2009; Jay et al., 1997; Regnier et al., 1998). Also, mixing curves are meaningful when water quality data are numerous within the salinity gradient, which is not the case for many estuaries. Numerical models combined with limited observed data can fill the gap in understanding nutrient dynamics and offer insight into past and future scenarios in response to environmental and human changes (such as land use changes and agricultural practices; Billen and Garnier, 2007; Garnier et al., 2021) and climate change (Billen and Garnier, 1997; Garnier et al., 2021). In addition, simulations can be carried out at large spatial and temporal scales. In particular, they can realistically represent the spatial variability within estuaries and provide a global view of the whole basin (land–ocean continuum) by chaining estuarine with river basin models (Laruelle et al., 2019) and with coastal zone models (Garnier et al., 2019; Ménesguen et al., 2018b; Romero et al., 2019).
In recent decades, many estuarine numerical models have been applied to disentangle the complex physical and biogeochemical processes, such as 3-D models (Lajaunie-Salla et al., 2017; Romero et al., 2019; Wild-Allen et al., 2013), 2-D models (Arndt et al., 2011; Vanderborght et al., 2007), 1-D models (Hofmann et al., 2008; Volta et al., 2014), and box models (Garnier et al., 2008, 2010b; Verri et al., 2021). However, 3-D models require massive data for calibration and high computing performance to resolve the complex processes occurring in estuaries on relevant spatial and temporal scales. On the opposite side of the complexity spectrum, box models might neglect the transient behavior of the flow and scalar fields and, by nature, cannot reproduce the complex hydrology of estuarine environments, consequently causing large errors in flux estimations (Arndt et al., 2009). The Carbon-Generic Estuary Model (C-GEM; Volta et al., 2014) used in this study is a depth-averaged 1-D model that has been developed to handle the main obstacles to the application of estuarine models on a regional or global scale (Laruelle et al., 2017). The generic implementation of the C-GEM model relies on a limited amount of basic information to describe estuarine geometry, hydrodynamic information, and the inputs to estuaries, and then produces annual to multidecadal simulations. C-GEM has already been applied to one tropical estuary (Nguyen et al., 2021) and several temperate estuaries and has provided satisfactory simulations of nutrient transport and biogeochemical processes despite the simplification of the estuarine geometry (Laruelle et al., 2017, 2019; Volta et al., 2014, 2016a). An extensive description of C-GEM is presented in Volta et al. (2014, 2016a).
The French estuaries along the northeastern Atlantic coast studied herein have been subjected to nutrient enrichment for many years (Garnier et al., 2019; Ménesguen et al., 2019; Ratmaya et al., 2019). Therefore, the objectives of this paper are to (i) evaluate the nutrient delivery of estuaries from the French Atlantic coast to the sea using the C-GEM modeling approach, (ii) quantify the retention rates of these estuaries, and (iii) analyze the coastal eutrophication potential. The first part of the paper presents longitudinal results averaged over a tidal cycle, including salinity and SPM, nutrients and phytoplankton biomass, under different hydrological years (2014–2016) for seven selected estuaries of different sizes and anthropization levels. Then the annual input–output budgets of nutrients is provided in order to quantify the retention rates of these estuaries according to their specific characteristics (size, degree of hydromorphological management, anthropogenic pressures, etc.).
2.1 Study area
This study focused on seven estuaries (from north to south – the Somme, Seine, Vilaine, Loire, Charente, Gironde, and Adour estuaries) along the French Atlantic coast (Fig. 1). These estuaries embody a wide range of morphological and hydrological settings representative of the region in terms of length, width, residence time, convergence length, tidal amplitude, and length of saline intrusion. Considering these features, they were divided into three large estuaries (the Seine, Loire, and Gironde), two medium-sized estuaries (Charente and Adour), and two small ones (the Somme and Vilaine). Their geometric properties are presented in Table 1. They are characterized as semidiurnal and macrotidal estuaries, with an average tidal range from 3.3 to 5.1 m, and are rather well mixed over the water column (Table 1).
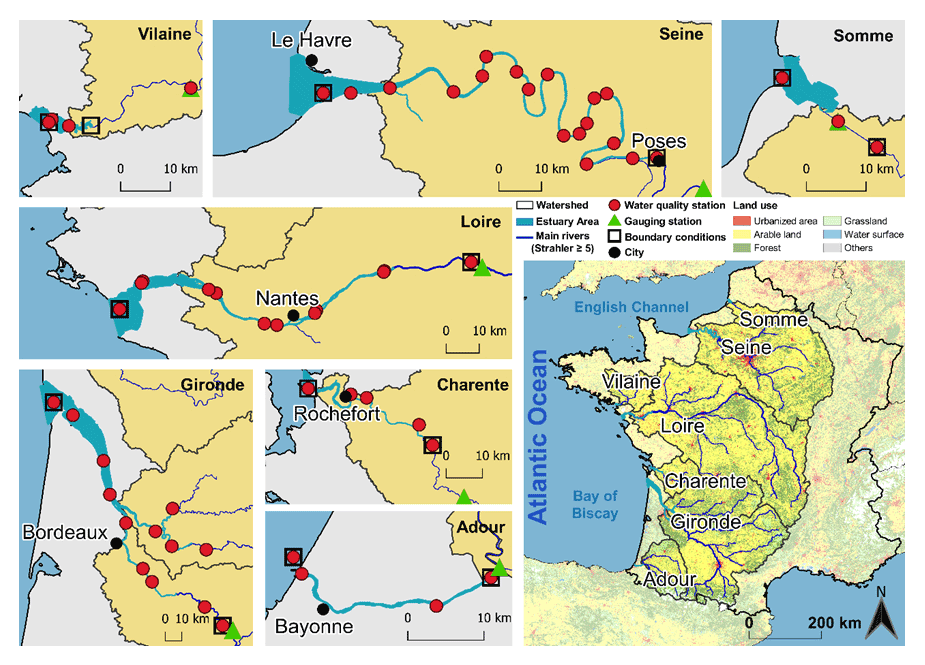
Figure 1Map of estuaries studied along the French Atlantic coast. Panels for each estuary indicate the locations of the gauging stations and the water quality stations used in this study.
Table 1Geometric properties of the estuaries studied.

Note: (1) The geometry information (length, surface area, and width) was derived from remote sensing images through the Esri Ocean layer in Geographic Information System (GIS). Depths were obtained from Defontaine et al. (2019), Goubert et al. (2019), Laruelle et al. (2019), McLean et al. (2019), Normandin et al. (2019), and Toublanc et al. (2015). * (2) River basin areas include the basin area of the rivers flowing directly into the estuary.
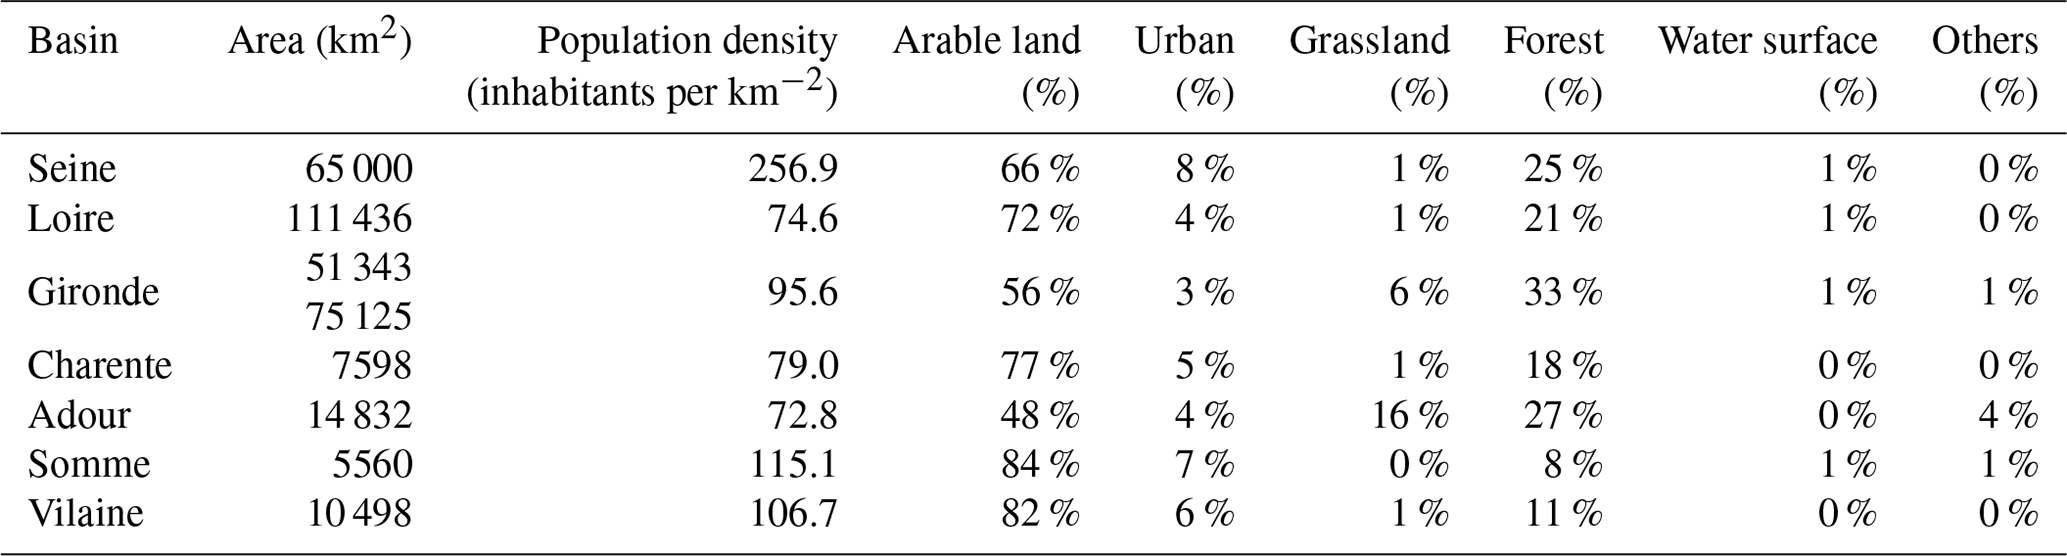
These estuaries receive nutrient deliveries from the upper river basins with different land uses and population densities (Table 2); for example, the Seine, Vilaine, Loire, and Charente river basins are dominated by agricultural activities, sustaining a large proportion of the national crop and/or livestock production (Billen and Garnier, 2007; Ménesguen et al., 2018a; Ratmaya et al., 2019). The percentages of different land use types for each basin are presented in Table 2. The intensive agriculture and urbanization within the estuarine basins studied induced eutrophication, especially for those of the northern half of the French Atlantic coast, which are regarded as nutrient enriched (Garnier et al., 2019; Ménesguen et al., 2019; Ratmaya et al., 2019).
Table 2Population density (INSEE, 2014) and land-use-type percentage (CORINE Land Cover, 2018) of the river basin of the systems studied.
2.2 Data collection
The measured data used in this study to calibrate and validate the model, as well as to determine the upstream limit conditions, include river discharge (Q), salinity (Sal), suspended particulate matter (SPM), and water quality variables, i.e., phosphate (PO4), ammonium (NH4), nitrate (NO3), dissolved silica (DSi), dissolved oxygen (DO), total (particulate and dissolved) organic carbon (TOC), and chlorophyll a (Chl a), as indicators of phytoplankton biomass.
Daily river discharge data were obtained from the national Banque Hydro database (http://www.hydro.eaufrance.fr/, last access: 21 August 2020). Water quality variables were collected from the following national databases: (1) the French Water Agencies through the NAIADES portal (http://naiades.eaufrance.fr/, last access: 17 March 2020), for the physicochemical parameters of surface waters, (2) the REPHY (REPHY, 2021) database (https://www.seanoe.org/data/00361/47248/, last access: 20 April 2020), specifically for the monitoring of phytoplankton for the estuarine and marine parts, and (3) the SOMLIT database (https://www.somlit.fr/, last access: 23 June 2020), for coastal and estuarine water quality parameters. The temporal resolution of the water quality data acquired is generally monthly or bimonthly. Chl a concentrations were usually available only from March to September (main phytoplankton growth period). The gauging stations and water quality stations are located in Fig. 1b.
The data for the marine boundaries were extracted from outputs of simulations performed by a coastal marine model ECO-MARS3D (Cugier et al., 2005b; Lazure and Dumas, 2008; Ménesguen et al., 2019), providing water elevation, temperature, salinity, SPM, PO4, NH4, NO3, DSi, DO, TOC, and phytoplankton (Phy) at 4 km spatial and hourly temporal resolutions.
The use of the above database is detailed in Sect. 2.3.3.
2.3 Modeling approach and setting
2.3.1 C-GEM
In this study, the C-GEM (Carbon-Generic Estuarine Model) was used for modeling nutrient transport and transformation for the selected estuaries. The C-GEM is a depth-averaged, 1-D, process-based model designed to simulate estuarine hydrodynamics, transport, and the biogeochemistry of tidal alluvial estuaries with relatively little data and computation demand (Volta et al., 2014, 2016b). A 1-D model can be considered as being well adapted to these shallow macrotidal estuaries that mix at each tide cycle, as shown by Brion et al. (2000), on the Seine river, and Middelburg and Herman (2007), for other estuaries of the Atlantic coast of Europe, which was also supported by Savenije (2012). The extensive description of the model and its underlying assumptions are available in Volta et al. (2014). Thus, the following sections only briefly describe the state variables and processes included in the biogeochemical module and the modifications introduced for the simulations discussed in this paper. Furthermore, all the equations governing the production and consumption reactions of all state variables, as well as their parameterization, are provided in the Supplement (Table S1).
2.3.2 Model description and setup
C-GEM is based on the premise that geometry and hydrodynamics exert first-order control on the estuarine transport and biogeochemical processes (Volta et al., 2014). It uses idealized geometry (defined by the estuarine width at the mouth, convergence length, and channel depth profile; see Volta et al., 2014, for details) and hydrodynamics (such as river discharge and tidal amplitude) that can be gained from remote sensing images using Geographic Information Software (GIS) and readily available data sets (Table 1).
The biogeochemical reaction network includes SPM settling and erosion, the air–water gas exchange for oxygen (O2) and carbon dioxide (CO2), nitrification, denitrification, primary production, phytoplankton mortality, and the aerobic degradation of organic matter (see the Supplement for detailed descriptions and mathematical formulations, according to Volta et al., 2014, 2016a). Essential state variables are used in the simulations, as are those gathered above (as mentioned in Sect. 2.2 – DO, NH4, NO3, PO4, DSi, TOC, and diatom (Dia) and non-diatom (nDia)). Pools are, therefore, considered in this study and schematized in Fig. 2. Note that, in this study, the inorganic carbon module of C-GEM (which includes the explicit calculation of dissolved inorganic carbon, alkalinity, pCO2, and pH), as described in Volta et al. (2014), was not activated. The SPM dynamics are controlled by the transport of suspended material (i.e., advection and dispersion) and local deposition and resuspension/erosion processes, but the model does not distinguish between the pools of marine and riverine suspended material. P adsorption and desorption to particulate material to form an iron-bound complex, for example, is not accounted for. Thus, the only control exerted by SPM concentrations in the water column on the other biogeochemical variables occurs through the influence of SPM on the light extinction coefficient, which partly controls primary production. While C-GEM does not yet include an explicit benthic compartment, a net burial term was applied to the particulate state variables of the model, namely Dia, nDia, and TOC. This term provides a first-order representation of the permanent removal of particulate material through sediment accumulation. It is applied to phytoplankton and TOC, proportionally to their concentration and inversely proportionally to the depth of the water column, using a constant settling rate of 1 m d−1 for phytoplankton and 0.4 m d−1 for TOC. Note that the concentrations of the organic state variables (Dia, nDia, and TOC) are expressed in micromoles of carbon per liter, but the model uses the Redfield ratios to account for the associated amounts of N, P and, in the case of diatoms, Si. Thus, the variable TOC actually includes all detritus and is sustained by the death of phytoplankton and its aerobic degradation fuels the stocks of dissolved inorganic nutrients.

Figure 2(a) The C-GEM concept. (b) Conceptual scheme of the biogeochemical module used in C-GEM in this study. A circle represents the state variables, while a rectangle represents the processes, and Dia corresponds to diatoms.
2.3.3 Forcings and boundary conditions
C-GEM is constrained by a set of riverine and marine boundary conditions. The riverine boundary conditions include river discharge (Q), SPM, and the state variables of water quality concentrations, which were linearly interpolated to obtain the daily values between the adjacent available measurements (Table 3). The marine boundary conditions include water elevation, water temperature, salinity, and the same water quality variables extracted from ECO-MARS3D at an hourly temporal resolution that allows the capturing of the tidal cycle. SPMs for the marine boundary conditions were collected from REPHY (REPHY, 2021) and linearly interpolated to obtain the data at the required timescale (Table 3). The annual means of boundary conditions are summarized in Table 4.
Table 3State variables in C-GEM and the boundary conditions.
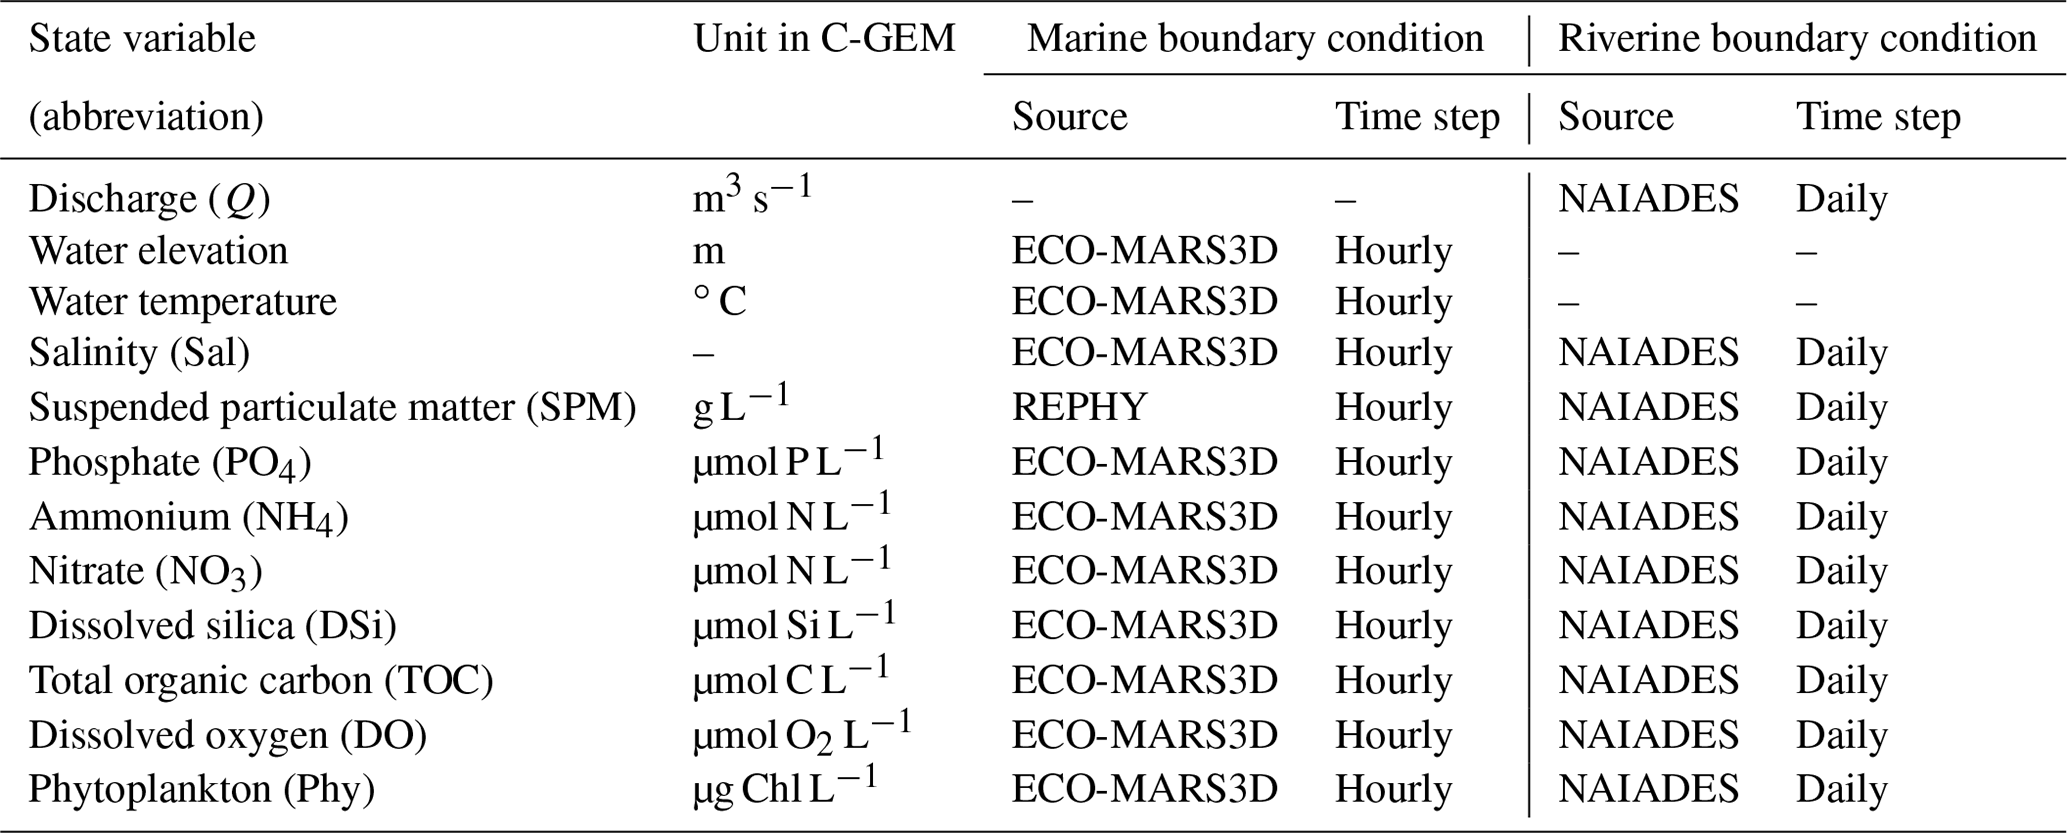
Note: calculations by C-GEM are in micromoles (hereafter µmol) for C, N, P, Si, and O2, but the output values of the model are provided in the mass of these elements by multiplying the micromoles per liter (hereafter µmol L−1) by, respectively, 12, 14, 31, 28, and 32 for a unit in micrograms (C, N, P, Si, O2) per liter.
In this study, the Dordogne river, a tributary of the Gironde estuary, which contributes ∼ 40 % discharge to the estuary, was considered as an upstream condition. The closest available sampling station (no. 5026000 from NAIADES) on the Dordogne river is around 32 km upstream from the confluence and in a stretch influenced by the tide. The inputs from the Dordogne tributary include daily Q and the same water quality variables (listed in Table 3) for riverine boundary conditions. Intermittent observed water quality data were also interpolated to daily values.
2.3.4 Point sources
The discharge from wastewater treatment plants (WWTPs) was taken into account as point sources in the model. The WWTPs from the largest estuarine cities (above 50 000 inhabitants) were considered, namely Rouen, Nantes, Rochefort, Bordeaux, and Bayonne on the Seine, Loire, Charente, Gironde, and Adour rivers, respectively. Fluxes from WWTPs to estuaries were calculated based on the loads treated in each WWTP (expressed in inhabitant equivalents), the identification of treatment types, and assuming specific per capita emissions (after the appropriate treatment) of SPM, PO4, NH4, NO3, DSi, TOC, and DO (state variables of the model), with an average water release of 150 L per inhabitant per day (Table 4).
Table 4Annual mean of inputs (riverine boundary conditions) and point source (wastewater treatment plants – WWTPs) for the estuaries studied. The standard deviations provided do not correspond to uncertainties but express the seasonal variability in the concentrations at the boundary conditions. The time series of those concentrations are provided in Table S4.
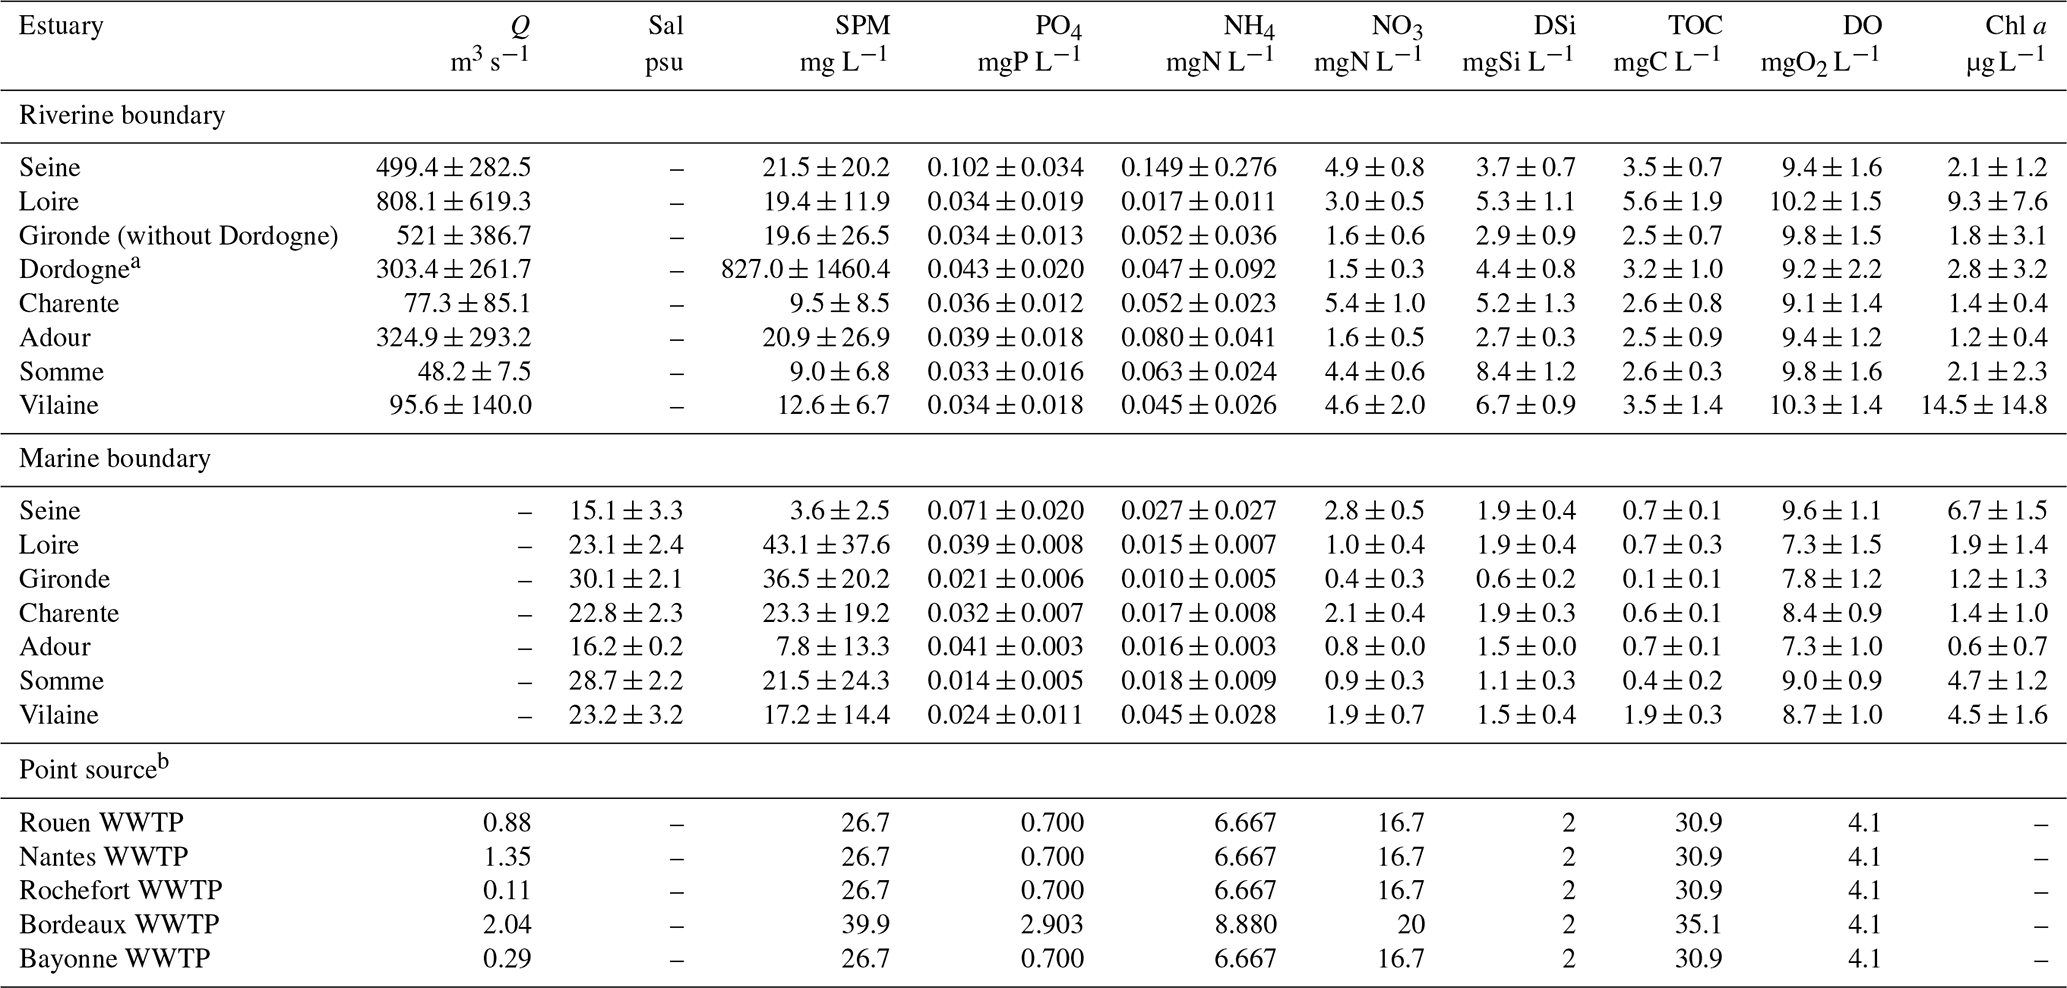
a The Dordogne river, which joins the Gironde estuary, is considered as an input to the estuary, in a way similar to the point sources, but with a daily time step (see Table 3), and is contrary to the point sources b from the WWTP inputs to the estuary for which we considered an annual average.
2.3.5 Simulation setup
C-GEM simulates the transport and transformation in sequence by applying an operator splitting approach (Volta et al., 2014) and a finite difference scheme of a regular grid at 2 km with a time step of 300 s. The simulation starts following a 60 d spinup, during which only the hydrodynamics and transport modules are resolved over a repeating identical tidal cycle, which enables the system to reach a dynamic steady state, providing realistic initial conditions for the biogeochemical module. The relatively short residence time, combined with hourly boundary conditions at the mouth of the estuary, allows an accurate resolution of the tidal cycle in the estuaries, including during transient simulations, as was demonstrated by Laruelle et al. (2019). The time resolution of the model outputs was set at 4 h in order to minimize the size of the export files while capturing most of the tidal and diurnal variability. In the figures thereafter, the envelope around the model results represents the minimum and maximum values over two tidal cycles in order to provide the amplitude of the tidal influence on concentrations at different locations in the estuary. In this study, the model was run over a 3-year period, from 2014 to 2016, for each estuary.
2.4 Model calibration
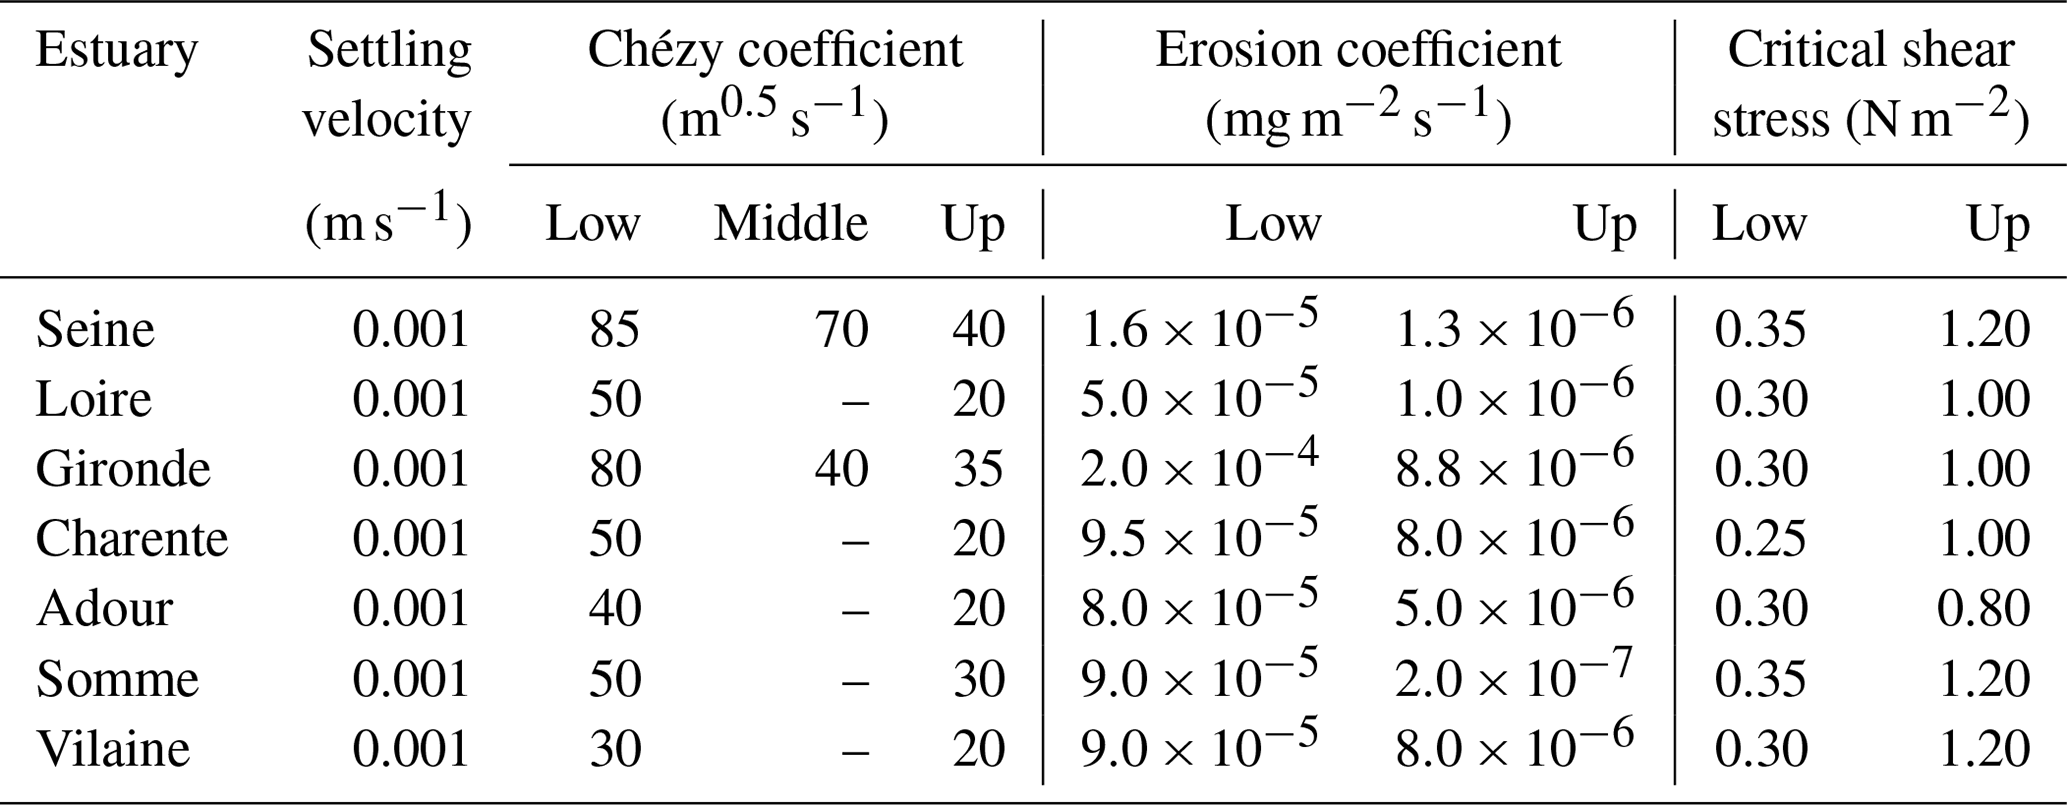
The data used to calibrate and validate the model were obtained from the multiple databases mentioned in Sect. 2.2. The locations of these stations along the estuaries are presented in Fig. 1. Calibration was implemented based on 2015, which is an intermediate annual flow between those of wet and dry years. The performance of the hydrodynamics modules was first evaluated by comparing the simulated salinity with observed salinity along the estuary. Then the mass transport was calibrated using longitudinal SPM profiles as an indicator. Good agreement with in situ data for salinity and SPM was reached by setting a maximum value of 100 m s−2 to the dispersion coefficient generated by the equations described in Volta et al. (2014). This dispersion value is in agreement with the previous study in the Scheldt estuary (Arndt et al., 2009) and the Loire estuary (Thouvenin et al., 1997). The values used for all parameters involved in the hydrodynamics and transport modules are presented in Table 5.
Table 5Parameter settings related to salinity and sediment and their values along the estuaries (low, middle, and upstream parts).
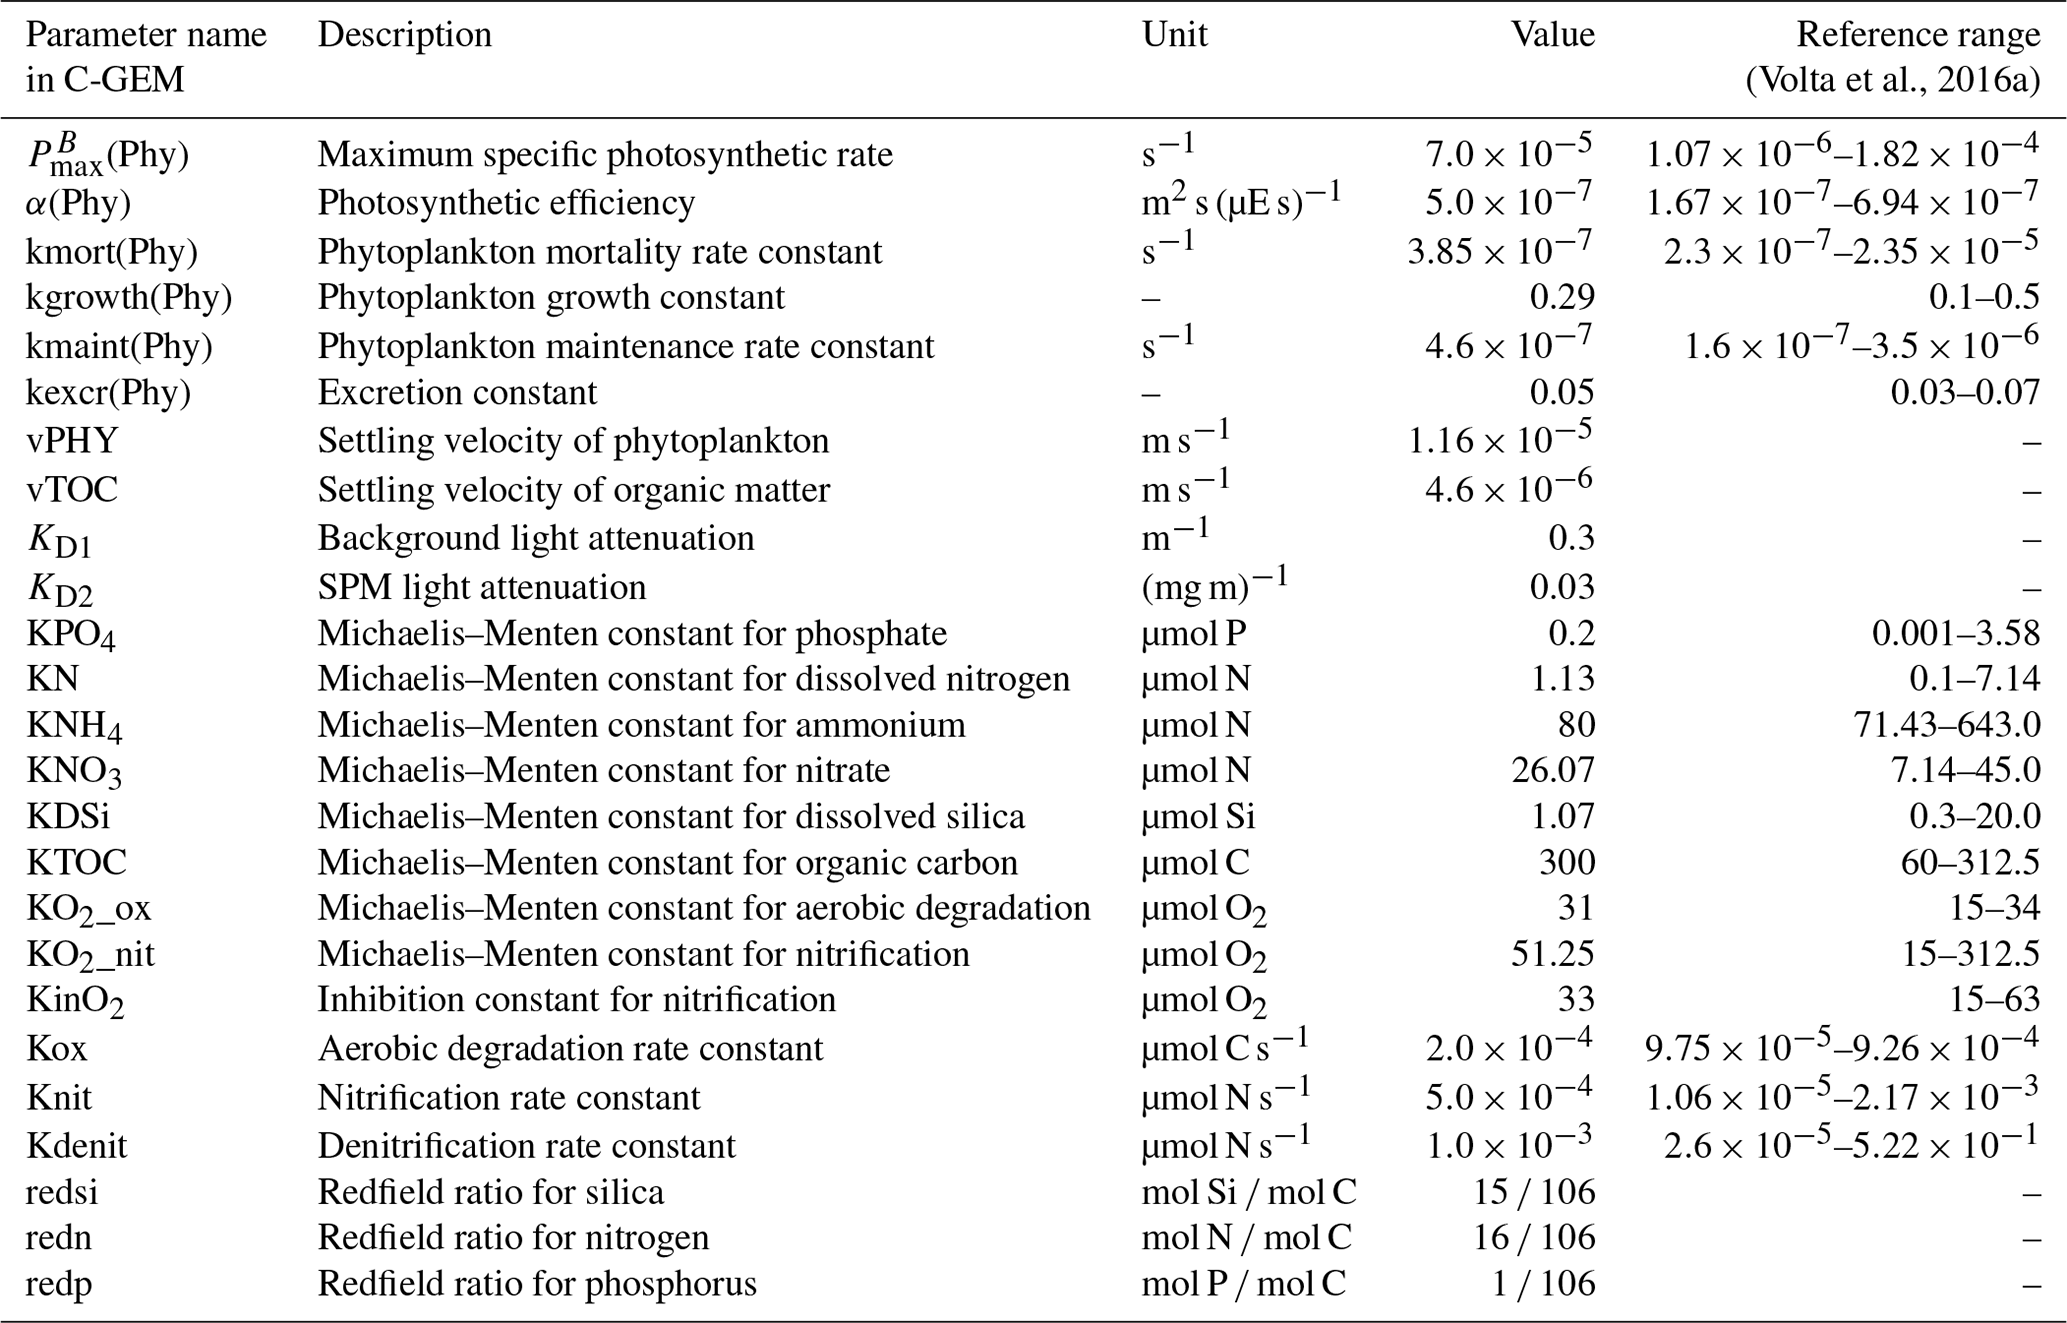
Once the hydrodynamics were satisfactorily calibrated (see Sect. 3.1), the biogeochemical module was calibrated using the observed water quality data (2015), starting from the parameterization described in Laruelle et al. (2019), which was used for an application of C-GEM to the Seine estuary. The same set of values for all biogeochemical parameters was used for all of the selected estuaries (Table 6). On the whole, only slight variations from the parameterization in Laruelle et al. (2019) were required, ensuring that all parameters remained within a range corresponding to values representative of temperate estuaries, following the extensive literature survey carried out by Volta et al. (2016a).
Table 6Biogeochemical parameter values used in C-GEM. See the formulations of the processes in the Supplement.
After calibration of the hydrodynamic and biogeochemical processes for 2015, the model was then also implemented and run for the years 2014 and 2016. The model was validated for 2014 and 2016, using the parameterization constrained by the calibration over 2015. The results were evaluated against field measurements, using widely used statistical indicators, such as the root mean squared error (RMSE) and bias (Moriasi et al., 2007), which were calculated as follows:
where n is the number of samples, obs is the observation, and sim is the simulation. Evaluations are shown in Sect. 3.1.
2.5 Calculation of indicators of estuarine ecological functions
To perform a year-long calculation of fluxes entering and leaving the estuarine system, the quantities transported through the boundaries of the system for each state variable were computed at each time step by the advection and dispersion schemes and integrated over the time period considered. This calculation and the relatively short computation time step of 150 s used by the model ensured accurate representation of the transient processes taking place during the tidal cycle in the estuary.
In this study, dissolved inorganic nitrogen (DIN; considered as the sum of NH4 and NO3), dissolved inorganic phosphorus (DIP; equals PO4), dissolved silica (DSi), Phy (Chl a; using a C Chl a ratio of 40; Jakobsen and Markager, 2016), and TOC were calculated (Table 8). In addition, the Redfield–Brzezinski ratios C : N : P : Si = 106 : 16 : 1 : 15–20 (Brzezinski, 1985; Redfield et al., 1963) were used to take into account the organic fractions and estimate total nitrogen (TN), total phosphorus (TP), and total silica (TSi), whose fluxes were preferentially chosen for calculating overall retention rates.
The retention rate of the estuary represents the intensity of the nutrient retention and/or elimination and/or transformations within the estuary and is calculated as follows:
where Fluximp is the annual sum of all the imports to any of the estuaries for DIP, DIN, DSi, and TOC. Fluxexp are the annual exports at the outlet of the estuaries.
The estuarine residence time was calculated considering the estuarine geomorphology and the river discharge to the estuary and specifically represents the freshwater residence time, as follows:
where V is the estuarine volume (cubic meters; hereafter m3) calculated by the integral from the estuarine length, width, and mean depth. Q (cubic meters per second; hereafter m3 s−1) is the river mean annual discharge entering the estuary.
The indicator for coastal eutrophication potential (ICEP; Billen and Garnier, 2007; Garnier et al., 2010a) allows the quantifying of the estuarine nutrient flux balance or imbalance entering the coastal zone, considering the excess of nitrogen (N) and phosphorus (P) to silica (Si) and taking into account the N : P : Si stoichiometry according to the algae requirement. The ICEP is calculated as follows:
The P-ICEP and N-ICEP are expressed in carbon flux units (kilograms of carbon per kilometer per day; hereafter kg C km−2 d−1), using the C : N and C : P Redfield ratios (Brzezinski, 1985; Redfield et al., 1963). Flux P, Flux N, and Flux Si are the mean specific fluxes of total phosphorus, total nitrogen, and dissolved silica, respectively, delivered at the outlet of the estuary, expressed in kilograms of phosphorous per kilometer per day (kg P km−2 d−1), kilograms of nitrogen per kilometer per day (kg N km−2 d−1), and kilograms of silica per kilometer per day (kg Si km−2 d−1).
3.1 Model performance
3.1.1 Calibration based on 2015
The model was calibrated using the available observations for the year 2015. The results from simulations performed using C-GEM and the corresponding observations were plotted for two dates in 2015 (one in winter – January – and the other in summer – July) along the estuarine length for salinity, SPM, and water quality variables (PO4, NH4, NO3, DSi, TOC, DO, and Chl a; Figs. 3 and S1 in the Supplement). The model was run using the forcings and boundary conditions representative of the sampling dates of the field data.
The hydrodynamics module was calibrated on its ability to reproduce the salinity intrusion into the estuary under different conditions. Simulations followed the same increasing tendency with the measurements. In January, with high river discharges, the salinity intrusion reached 25 km from the sea mouth for large estuaries, such as the Seine and Loire estuaries, and within 50 km for the largest, i.e., the Gironde estuary. For the medium-sized estuaries such as the Charente and Adour, salinity decreased to 1 at ∼ 15 km from the sea mouth. During low discharges in July, salinity penetrated farther into the inner estuary, up to ∼ 40–60 km from the sea mouth for large estuaries, while, for the medium-sized estuary, it reached ∼ 20 km from the sea mouth. Such seasonal and scale-dependent patterns for salinity agree closely with observations.
Regarding SPM calibration, the model better captured the dynamics for the large estuaries than for smaller ones (Figs. 3 and S1). Simulated SPM values were in the range of measured peaks, although some observations may be missing for the medium-sized and small estuaries. The model generally provided an adequate representation of the turbidity maximum zone (TMZ). The Seine showed characteristics similar to the Loire, as they both showed a maximum SPM concentration at ∼ 250 mg L−1, with the TMZ quite close to the sea mouth (∼ 20–30 km) in the high-discharge season, and a maximum SPM concentration at ∼ 500 mg L−1, with a TMZ up to ∼ 40–50 km in the low-discharge season. The SPM of the Gironde ranged from ∼ 1000 to ∼ 2000 mg L−1 for the selected dates in 2015, with a TMZ located more upstream of the river, at ∼ 90–130 km to the sea mouth. Simulated SPM was low for the Charente, from ∼ 70 mg L−1 in July to ∼ 120 mg L−1 in January, and less than 10 mg L−1 for the Adour, for both dates, but observations were very scarce.
Simulations of longitudinal variations in concentration for DIP, NH4, NO3, DSi, and TOC for the two dates selected matched the available observations. All nutrients, organic carbon, and Chl a concentrations decreased mostly at the mouth due to seawater dilution. In winter, high discharge led to increasing transport of elements (more than transformation), and longitudinal variations appeared rather flat. In summer, longitudinal profiles showed more transformation before the dilution at the sea; the development of phytoplankton also occurred within the estuaries, either in the fluvial or saline sections (Fig. 3).
PO4 concentrations mostly varied within 0.1 mg P L−1 (3.2 µmol L−1), except for the Seine, whose maximum concentration can reach 0.2 mg P L−1 (6.5 µmol L−1) in July with low discharge. Most observations were captured by the model, though at some stations the simulations overestimated the observations. NH4 concentrations for the selected dates never exceeded 0.1 mg N L−1 (7.1 µmol L−1), except for the Adour at the first 15 km from the riverine boundary, with values varying from 0.1 to 0.15 mg N L−1 (7.1 to 10.7 µmol L−1). NO3 concentrations of the Seine, Loire, and Charente were higher (4–5 mg N L−1; e.g., 285.7–357.1 µmol L−1) than the ones of the Gironde and Adour (∼ 1.5–2.0 mg N L−1; e.g., ∼ 107.1–142.9 µmol L−1). Simulated NO3 underestimated the observations for the Loire in winter (in January at ∼ 30–70 km from the sea mouth) and slightly overestimated the NO3 values for the Gironde ∼ 40–100 km from the sea mouth downstream of the confluence with the Dordogne tributary. DSi concentrations showed the highest concentrations for the Loire (7.0 mg Si L−1; e.g., 250.0 µmol L−1), the lowest for the Charente and Adour (∼ 2 mg Si L−1; e.g., 71.4 µmol L−1), and intermediate for the Seine and Gironde (∼ 5 mg Si L−1; e.g., 178.6 µmol L−1). Regarding the TOC levels, they were of the order of 5 mg C L−1 (416.7 µmol L−1) for these five estuaries, with slightly lower levels in summer, except for the Seine (Fig. 3).
For each variable, the fit between simulations and observations for the calibration year (2015) was evaluated through the value of bias and RMSE (Table 7). The model was also evaluated for the validation years (2014 and 2016; Table 7).
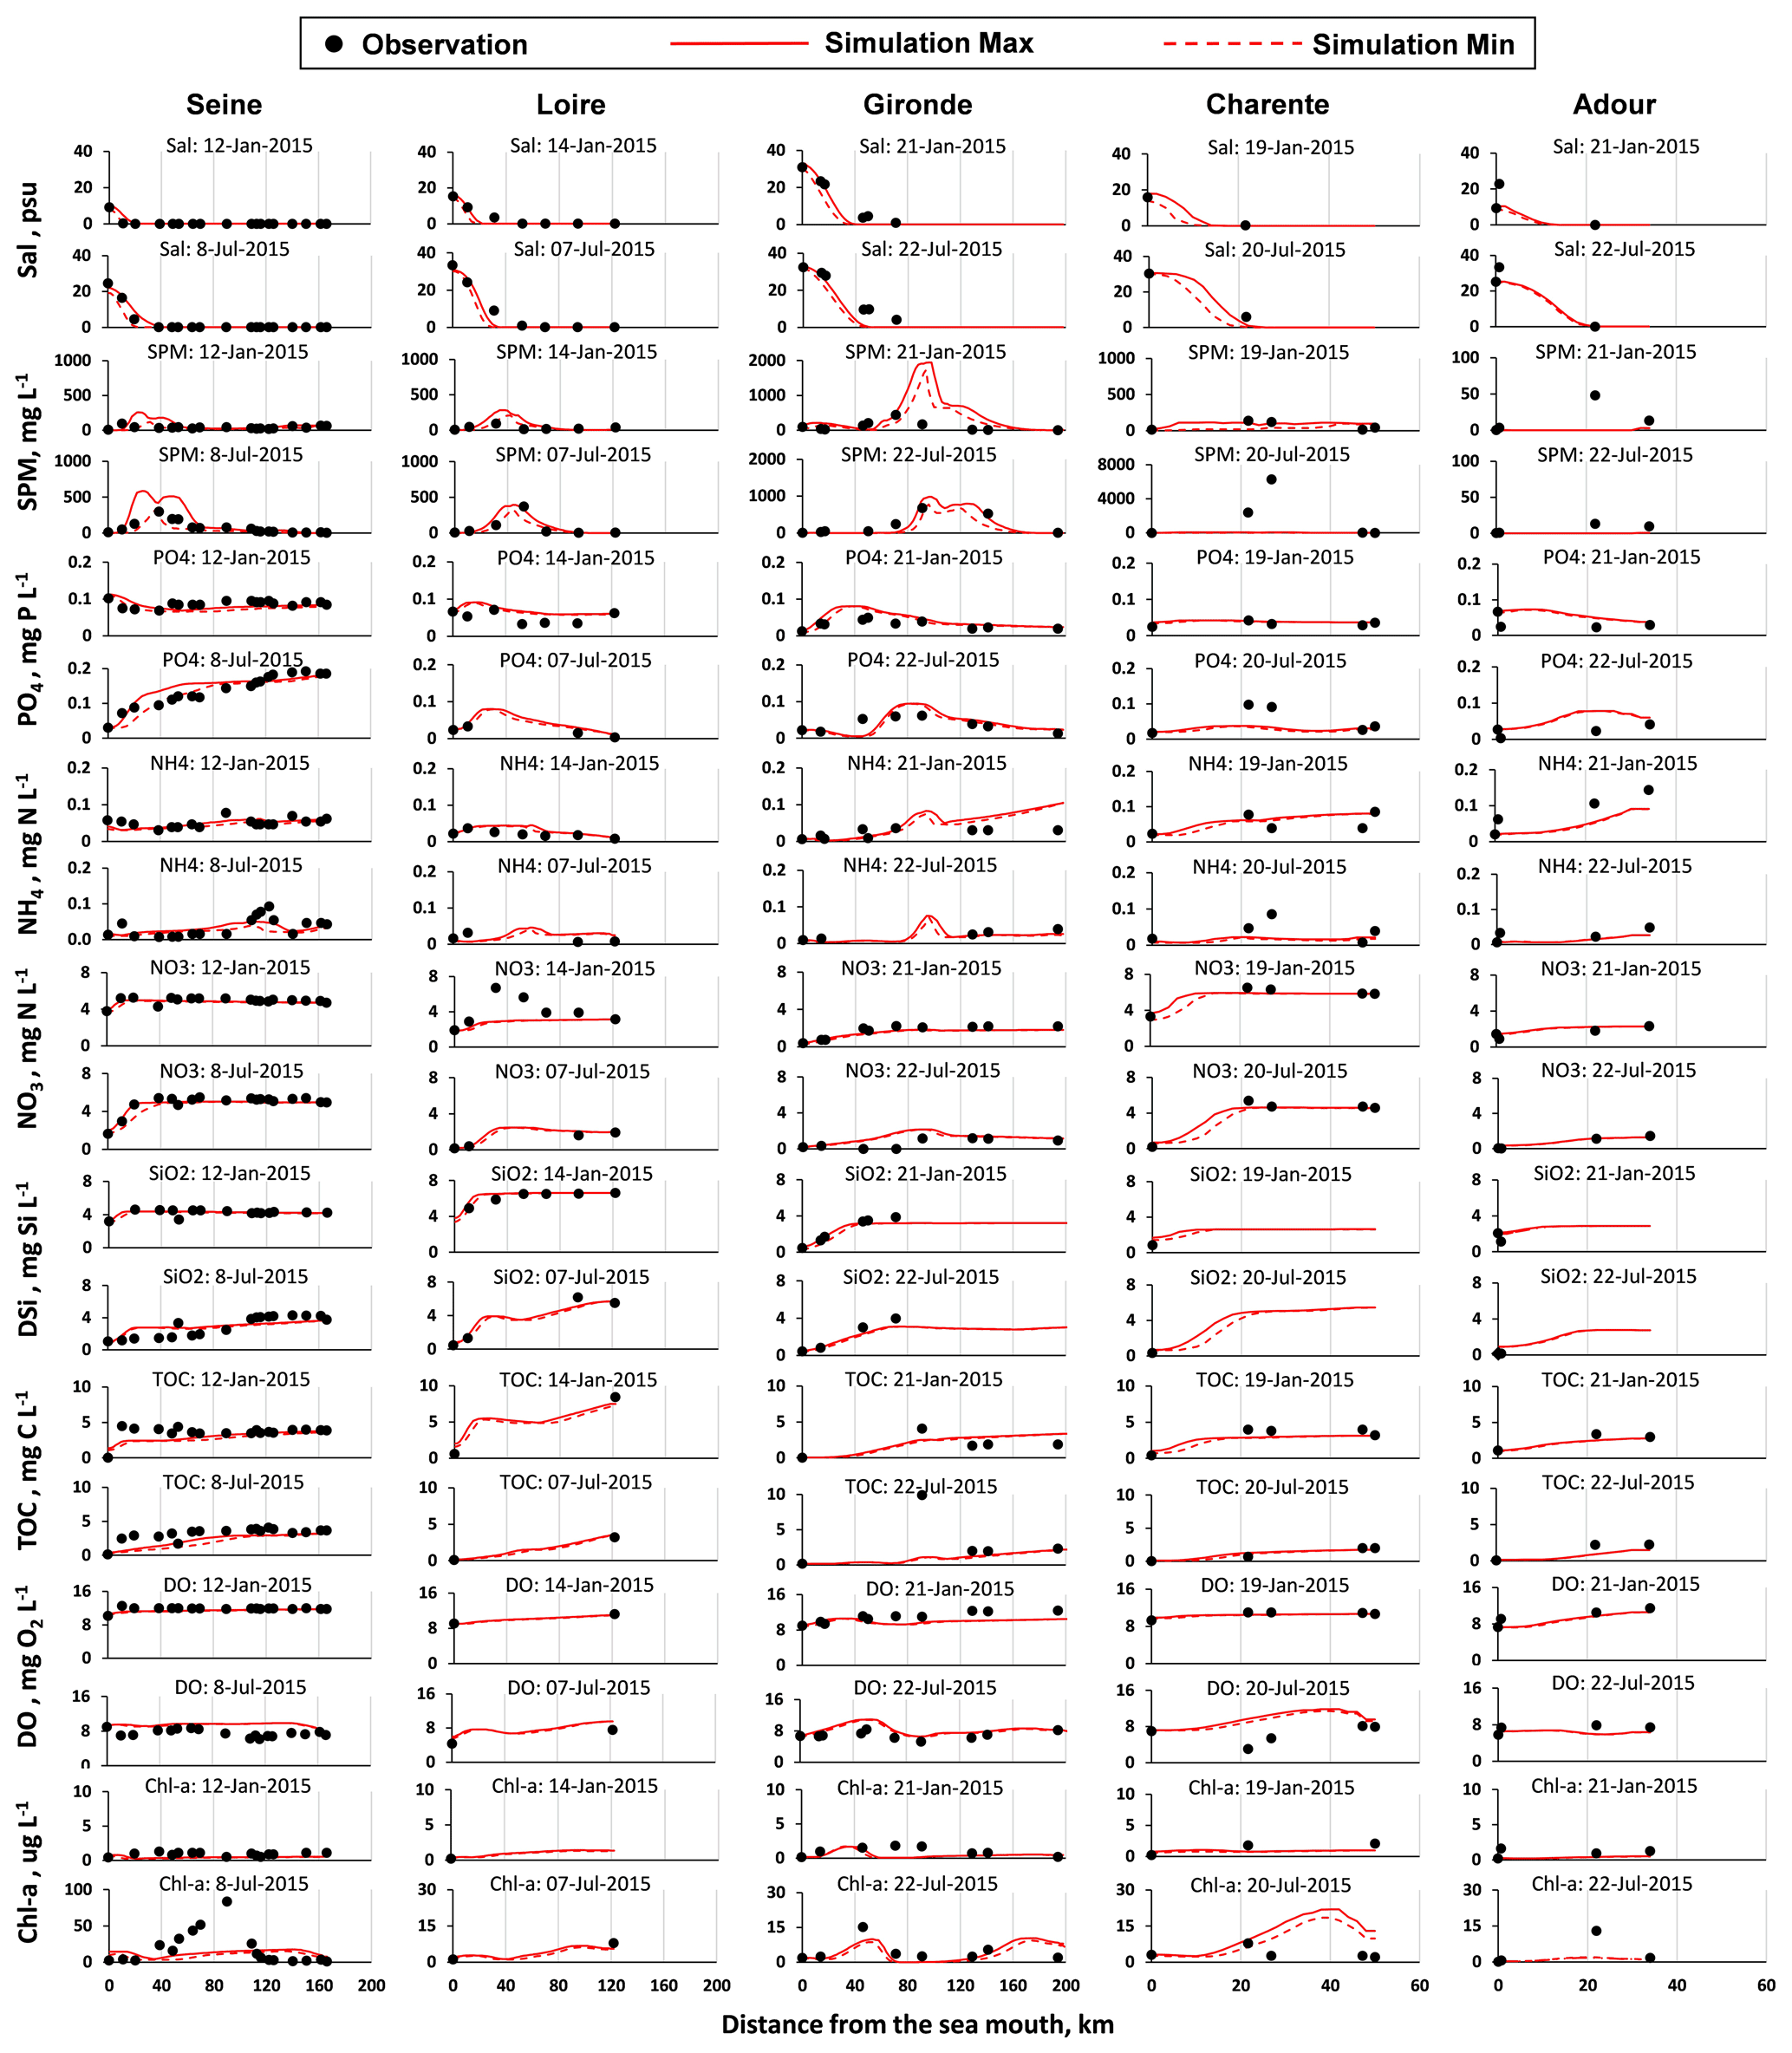
Figure 3Salinity (Sal), suspended particulate matter (SPM), and nutrients (PO4, NH4, NO3, DSi, and TOC), dissolved oxygen (DO), and chlorophyll a (Chl a) concentration variations along the estuaries (the Seine, Loire, Gironde, Charente, and Adour) for two selected dates (one in winter and the other one in summer). Note the different scales for the SPM and Chl a for the estuaries. The results of the Somme and Vilaine estuaries are shown in the Supplement.
The model outputs were compared to available observations and provided statistical indicators (bias and RMSE; Table 7) which reflect overall good performances of the model (−0.7 < bias < 0.7) through the standards provided by Moriasi et al. (2007).
The RMSEs in the calibration period remained within the range of the standard deviation values provided in Table 4 for upstream boundary conditions.
Table 7Bias and root mean square error (RMSE) for salinity (Sal), phosphate (PO4), ammonia (NH4), nitrate (NO3), dissolved silica (DSi), and total organic carbon (TOC) for the Seine, Loire, Gironde, Charente, Adour, Somme, and Vilaine estuaries.
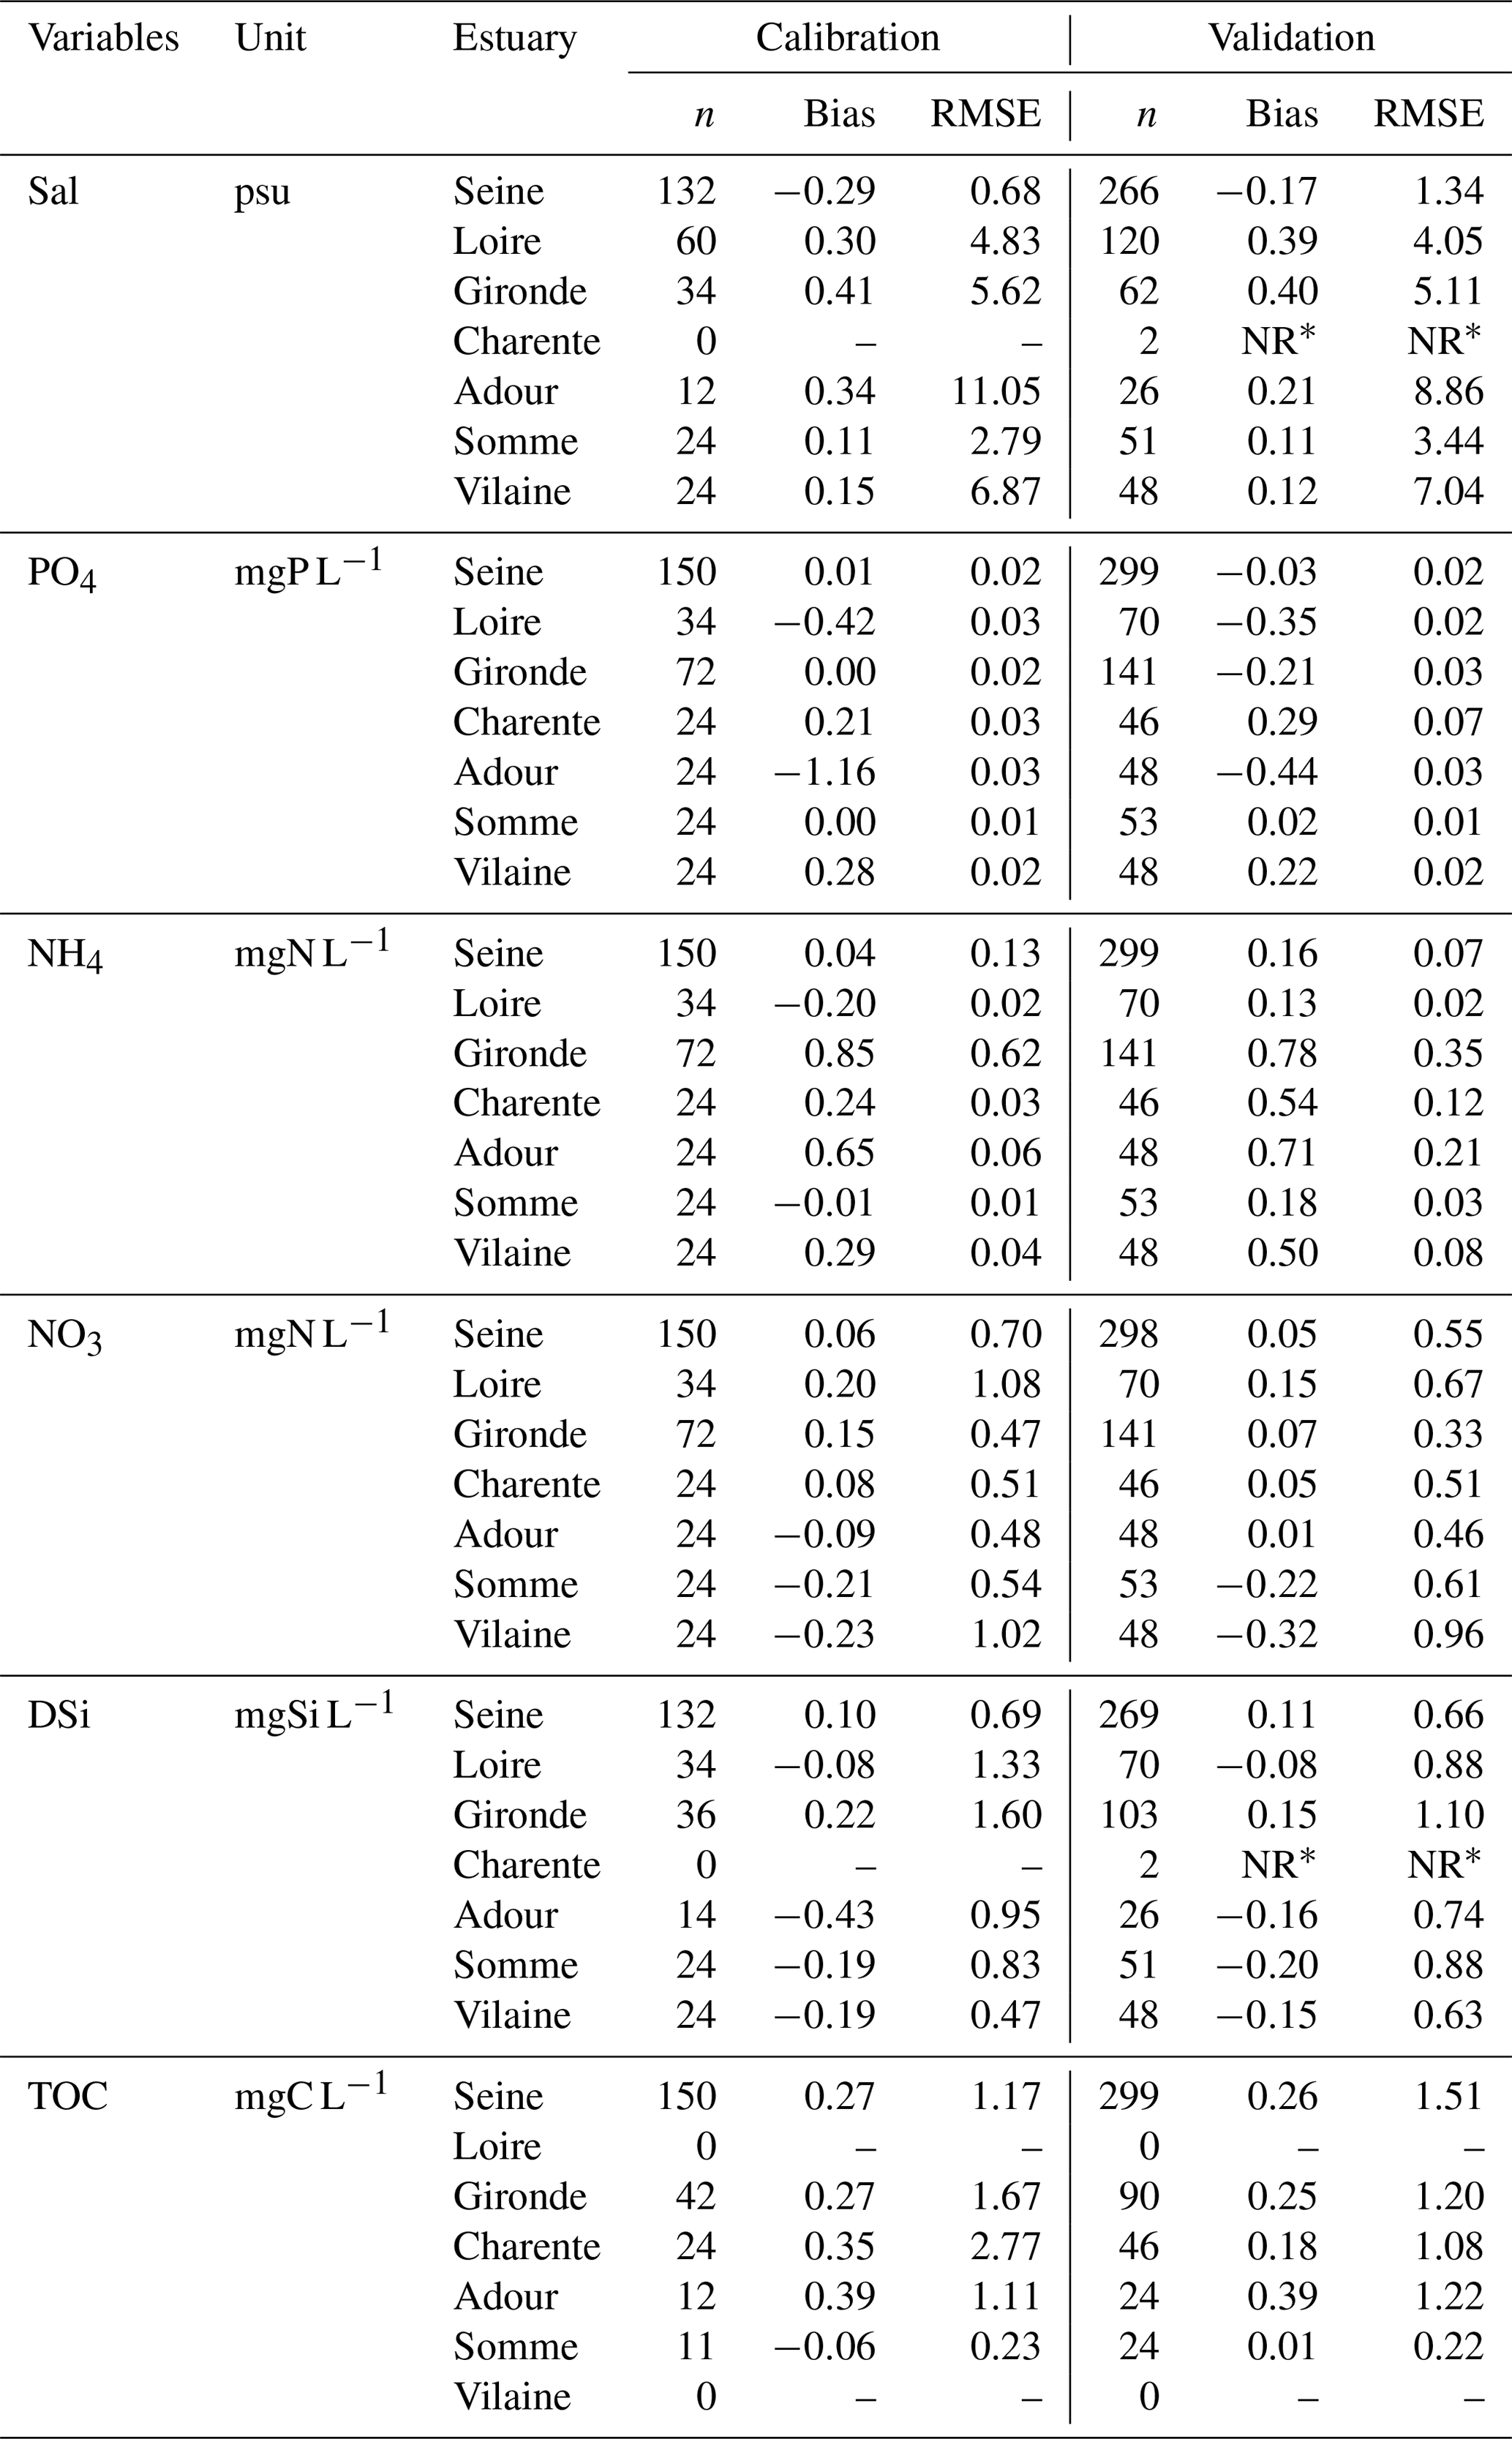
* NR is not relevant in the case of a data set with fewer than 10 samples.
3.1.2 Validation for 2014 and 2016
After the calibration step performed on the year 2015, the model was implemented over the entire 2014–2016 period for validation. Figure 4 shows the performance of the C-GEM model over the entire period studied (from 2014 to 2016, including the calibration and validation periods; note that the validation results of the small-scale estuaries are presented in Fig. S2). The seasonal variations are depicted (see Figs. 4 and S2) at specific monitoring stations located in the lower part of each estuary (but not too close to the marine boundary conditions in order to capture the dynamics of the model and minimize the influence of the marine boundary). Seasonal variations in other stations close to the marine boundary and within the salinity gradient are additionally presented in the Supplement (Fig. S3) to offer more information on the model performance. A rather good evaluation of these water quality time series simulations is confirmed by the bias and RMSE indicators, which take into account all the observations gathered (Table 7).
In agreement with the longitudinal profiles simulated for the calibration period (Fig. 3), the seasonal PO4 levels (simulated and observed) in the downstream Seine estuary (average of 0.11 mg P L−1; e.g., 3.5 µmol L−1) was twice as large as those for the other estuaries (ranging, on average, from 0.04 to 0.07 mg P L−1; e.g., 1.3–2.3 µmol L−1). Similar to PO4, NH4 also showed the highest levels in the Seine estuary, with large variations (0.01–0.35 mg N L−1; e.g., 0.7–25.0 µmol L−1). Similar large magnitudes for NH4 concentrations were also found for the medium-sized and small estuaries (Fig. 4).
The NO3 concentrations of the Seine (4.8 mg N L−1; i.e., 342.9 µmol L−1), the Charente (5.3 mg N L−1; i.e., 378.6 µmol L−1), and the Somme (4.7 mg N L−1; i.e., 335.7 µmol L−1) were ∼ 2–4 times higher than the Loire (2.6 mg N L−1; i.e., 185.7 µmol L−1), Gironde (1.6 mg N L−1; i.e., 114.3 µmol L−1), Adour (1.4 mg N L−1; i.e., 100.0 µmol L−1), and Vilaine (2.3 mg N L−1; i.e., 164.3 µmol L−1). The DSi values of the Somme (9.0 mg Si L−1; i.e., 321.4 µmol L−1), Loire (5.1 mg Si L−1; i.e., 182.1 µmol L−1), and Charente (4.8 mg Si L−1; i.e., 171.4 µmol L−1) were ∼ 1.4–3.3 times larger than in the other systems (2.7–3.5mg Si L−1; i.e., 96.4–125.0 µmol L−1; Fig. 4). The simulations of TOC in the Loire (3.7 mg C L−1; i.e., 308.3 µmol L−1) and Vilaine (2.8 mg C L−1; i.e., 233.3 µmol L−1) appeared larger than in the other systems, but no measured TOC values were available. The TOC simulation levels in the Seine (2.3 mg C L−1; i.e., 191.7 µmol L−1), Charente (1.9 mg C L−1; i.e., 158.3 µmol L−1), Adour (1.5 mg C L−1; i.e., 125.0 µmol L−1), and Somme (2.6 mg C L−1; i.e., 216.7 µmol L−1) were in agreement with the observations. As shown by the highest algal biomass (Chl a peaked to 40–50 µg L−1), the Seine estuary was the most eutrophic system (Fig. 4). All the estuaries studied seemed well oxygenated during the study period (2014–2016). The DO varied around the same range, with mean values from 8.0 to 9.9 mg O2 L−1 (around 70 %–100 % saturation), but for the Charente, the DO dropped to <5.0 mg O2 L−1 during July–September (<50 % saturation), which was not well represented by the model (Fig. 4).
In addition, the seasonal trends generated by the model for nutrients, DO, and Chl a concentrations generally follow the variations reported by field measurements both in timing and amplitude. PO4 values were higher in summer. The NO3 concentrations clearly showed a seasonal decrease from spring to autumn for most of the estuaries studied (Fig. 4). DSi concentrations indicated lower values, mostly in spring and late summer, linked to siliceous diatom uptake, which corresponded to Chl a peaks and are clearly visible in the Seine, Somme, and Vilaine. The simulation underestimated the silica uptake in 2014 for the Gironde. For the other estuaries, seasonal DSi patterns were not clear, and data were often missing. The highest TOC level occurred in winter, with higher discharges and high SPM, although some high summer values can be linked to biological biomass. DO showed a regular trend, with high values in winter and low values in summer, according to its solubility but also to its consumption with high summer mineralization. However, whereas the Charente river showed DO observed values of about 11 mg L−1 in winter (∼ 100 % saturation), much lower DO values, down to 3–4 mg O2 L−1, were found in summer (i.e., ∼ 35 % saturation), illustrating a high summer O2 consumption, but these low DO value were not well simulated by the model (Fig. 4). Indeed, phytoplankton biomass (Chl a) simulations showed a shift compared to the observations for 2014, which led to short-term summer DO peaks of the model and did not fit the observations. Noteworthy is the excessively scarce phytoplankton data which cannot support the modeled pattern at such a timescale.
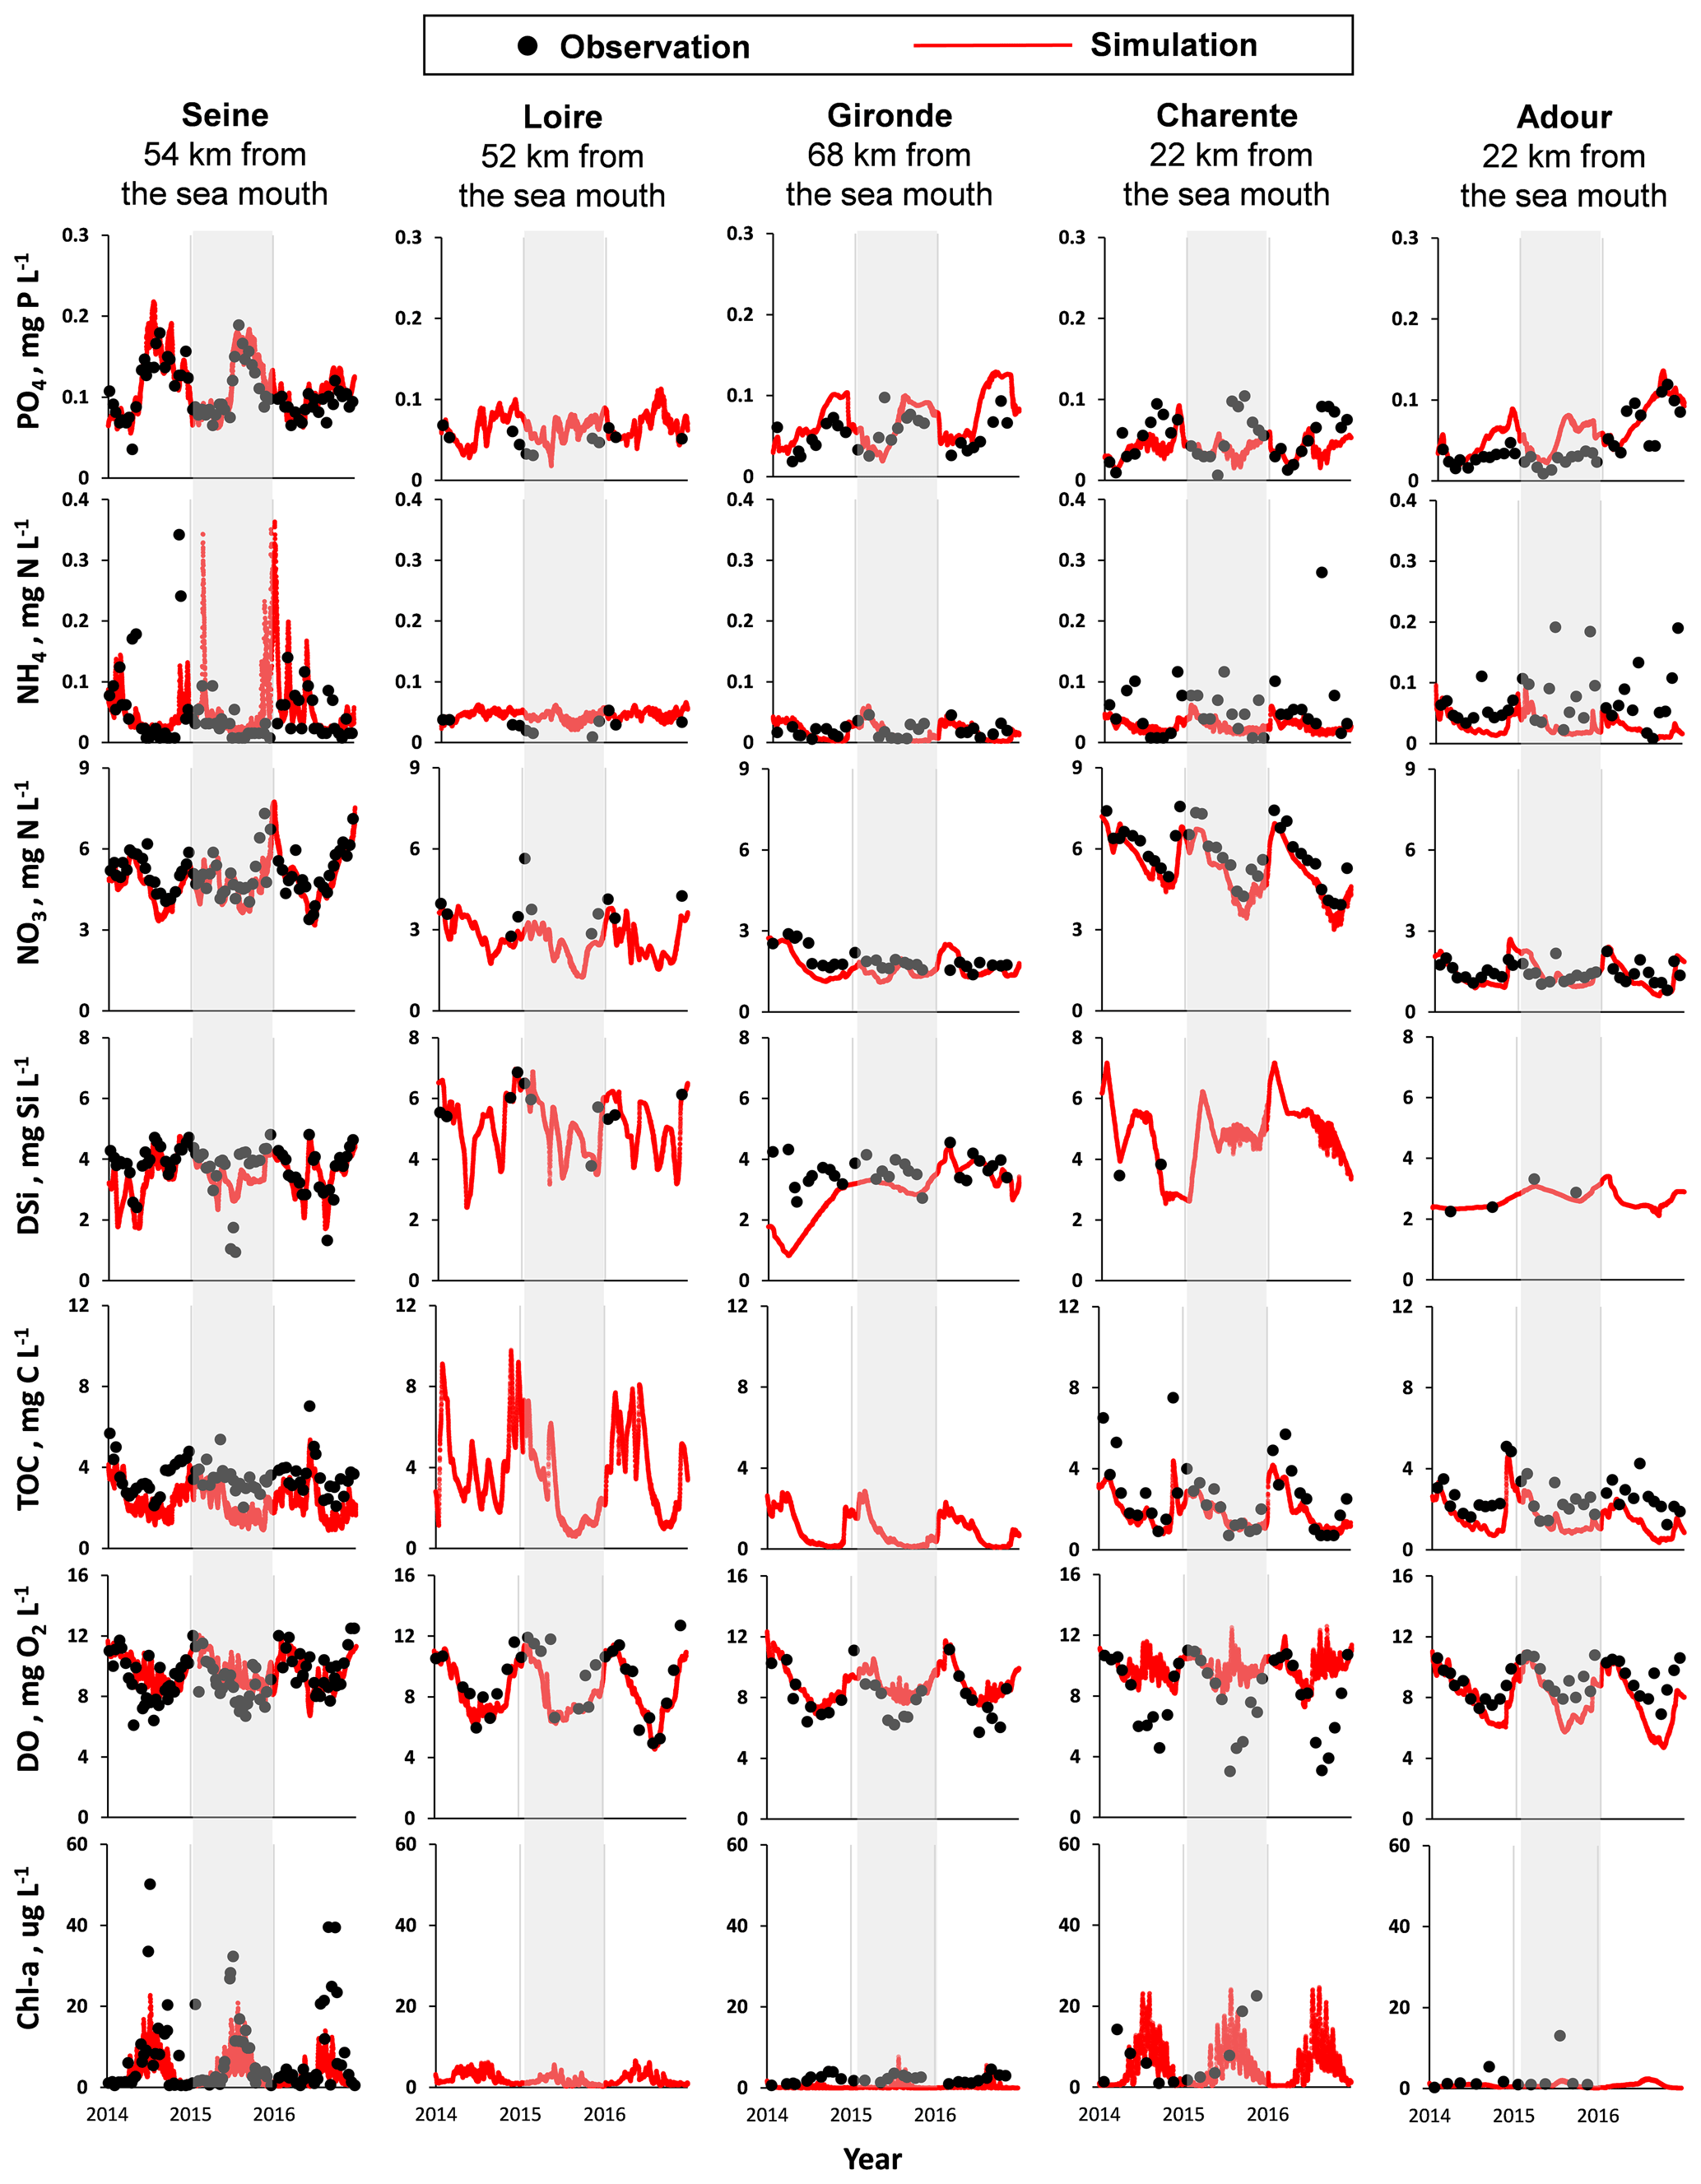
Figure 4Temporal variations for salinity (Sal), phosphate (PO4), ammonium (NH4), nitrate (NO3), dissolved silica (DSi), total organic carbon (TOC), dissolved oxygen (DO), and chlorophyll a (Chl a) concentrations from 2014 to 2016 for the Seine, Loire, Gironde, Charente, and Adour estuaries at the sampling stations located about one-third of the length of the estuary to the sea mouth. Gray columns covered the year of calibration (2015). The results of the Somme and Vilaine are shown in the Supplement.
3.2 Biogeochemical budgets
3.2.1 Import and export fluxes
Considering the suitable agreement between the levels of simulations and observations from the previous section, a reasonable level of confidence can be attributed to the import and export nutrient fluxes calculated by the model at the limits of the estuaries.
The import of TN ranged from 5.5 (Somme) to 104.6 kt N yr−1 (Loire), TP from 0.1 (Somme) to 5.0 kt P yr−1 (Loire), TSi from 9.4 (Somme) to 142.0 kt Si yr−1 (Loire), Phy from 0.1 (Somme) to 3.1 kt C yr−1 (Loire), and TOC from 2.8 (Somme) to 154.9 kt C yr−1 (Loire). Although the river discharge of the Gironde estuary was slightly larger (2 %) than that of the Loire, the Loire estuary received larger nutrient fluxes (1.7 times for TN, 2.6 times for TP, 15.3 times for TSi, 2.4 times for Phy, and 2.0 times for TOC) than the Gironde. Furthermore, the Loire, with 1.6 times the discharge of the Seine estuary, imported only 1.2 times the TN flux to its estuary but 1.8 times the TP flux. The river discharge of the Adour was quite similar to the Seine (86 % of the Seine), but its TN, TP, TSi, Phy, and TOC imports amounted to only 25 %, 34 %, 47 %, 24 %, and 40 %, respectively, of those of the Seine (Table 8).
Based on this study, around 259 kt N yr−1 of TN, 9.6 kt P yr−1 of TP, 304 kt Si yr−1 of TSi, and 145 kt C yr−1 of TOC were exported to the French Atlantic Ocean through these seven estuaries. They accounted for about 80 % of the total water discharge from all the estuaries on the French Atlantic coast (based on long-term analysis of runoff data from French national databases) and 83 % of the total watershed areas on the French Atlantic coast. However, considering that the retention rates seem to decrease with the size of the systems, it is likely that the riverine loads carried by the small estuaries not taken into account in our study are only marginally affected by the estuarine filter function. As a consequence, the cumulated nutrient export to the sea of the seven estuaries investigated in our study might be slightly lower than the 80 % representing the total water fluxes.
Table 8The mean annual (2014–2016) import and export of nutrients, i.e., total nitrate (TN), total phosphorus (TP), total silicate (TSi), phytoplankton (Phy), and total organic carbon (TOC), for the estuaries studied. The export fluxes are calculated by the model, while import ones are observed after interpolation of the water quality variables.

Note: ; (the Redfield–Brzezinski ratio; Brzezinski, 1985; Redfield et al., 1963). DIP=PO4; (the Redfield–Brzezinski ratio; Brzezinski, 1985; Redfield et al., 1963). (the Redfield–Brzezinski ratio; Brzezinski, 1985; Redfield et al., 1963).
Interestingly, considering the specific TP, TN, and TOC fluxes to the estuaries (i.e., total influxes per surface area of river basin) makes it possible to infer the contamination in the watersheds. The Vilaine and the Charente estuaries receive the highest fluxes of TN, while the Vilaine and Adour estuaries were the receptacles for greater TP and TOC fluxes with respect to the size of their upstream watershed (Fig. 5). Although silica is a major nutrient for diatom algae populations, it is of natural origin (rock weathering), different to anthropogenic N and P sources, and reveals the lithology of the watershed, with higher fluxes for the Adour and Somme estuaries (Fig. 5). Overall TSi specific fluxes exceeded 850 kg Si km−2 yr−1, varying within a range of 2.1 times, while TP- and TOC-specific fluxes were more variable, within a factor close to 5–6, and TN-specific fluxes were within a range of 2.5 times (Fig. 5).
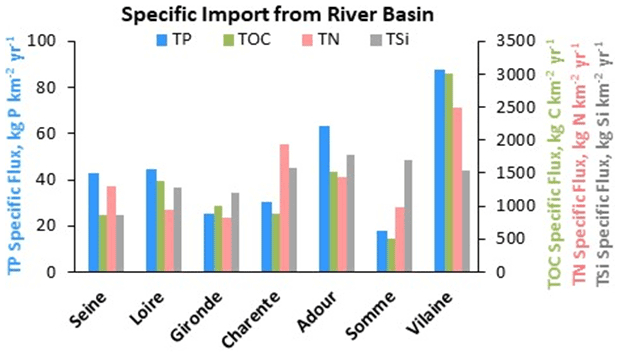
Figure 5Average annual (2014–2016) specific fluxes of total phosphorus (TP), nitrogen (TN), organic carbon (TOC), and silica (TSi) entering the estuaries studied.
3.2.2 Retention rate
To determine the different ecological functions of the estuaries studied, their retention rates for TN, TP, TSi, and TOC were quantified following the equations presented in Sect. 2.4 (Fig. 6).
For the large estuaries (the Seine, Loire, and Gironde), the retention rate for TN ranged from 8 % to 34 %, from 19 % to 27 % for TP, from 6 % to 39 % for TSi, and from 56 % to 96 % for TOC. For the medium-sized estuaries (the Charente and Adour), the retention rate was 7 %–10 % for TN, 1 %–12 % for TP, 2 %–7 % for TSi, and 30 %–32 % for TOC. For the small estuaries (length <20 km; the Somme and Vilaine), the retention rates for TN, TP, TSi, and TOC were 0 %–1 %, 0 %–7 %, 2 %–6 %, and 8 %–12 %, respectively.
The Loire estuary showed the largest retention rate for TN, and the Gironde estuary is the most retentive for TP, TSi, and TOC.
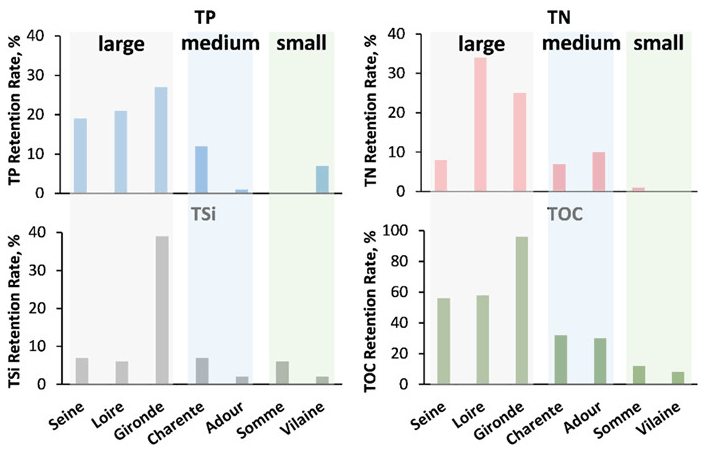
Figure 6Annual mean (2014–2016) retention rates for the seven estuaries studied in terms of total phosphorus (TP), nitrogen (TN), organic carbon (TOC), and silica (TSi).
For the three large estuaries, the annual mean water residence time was around 14–27 d for the Seine and Loire but longer for the Gironde estuary (70–97 d). Longer water residence time indeed causes higher retention rates for the Gironde (Figs. 6 and 7). For the two medium-sized estuaries, the water residence time differed substantially. For the Charente, it ranged from 9 to 18 d, while the water residence time of the Adour was only 2–3 d during the study period. The Adour estuary had a shorter estuarine length and was narrower but with an approximately 6 times greater river discharge compared to the Charente. Thus, the retention rate for the Charente estuary was also higher (Figs. 6 and 7). Small estuaries, such as the Somme and Vilaine, had a water residence time ranging from 5 to 18 d. The Vilaine had a short estuarine length due to the dam located 10 km from the sea mouth. Therefore, the water residence time of the Vilaine estuary depends on the dam's regulation and the residence time of the dam/reservoir at the interface of the river outlet and the estuary (Figs. 6 and 7).
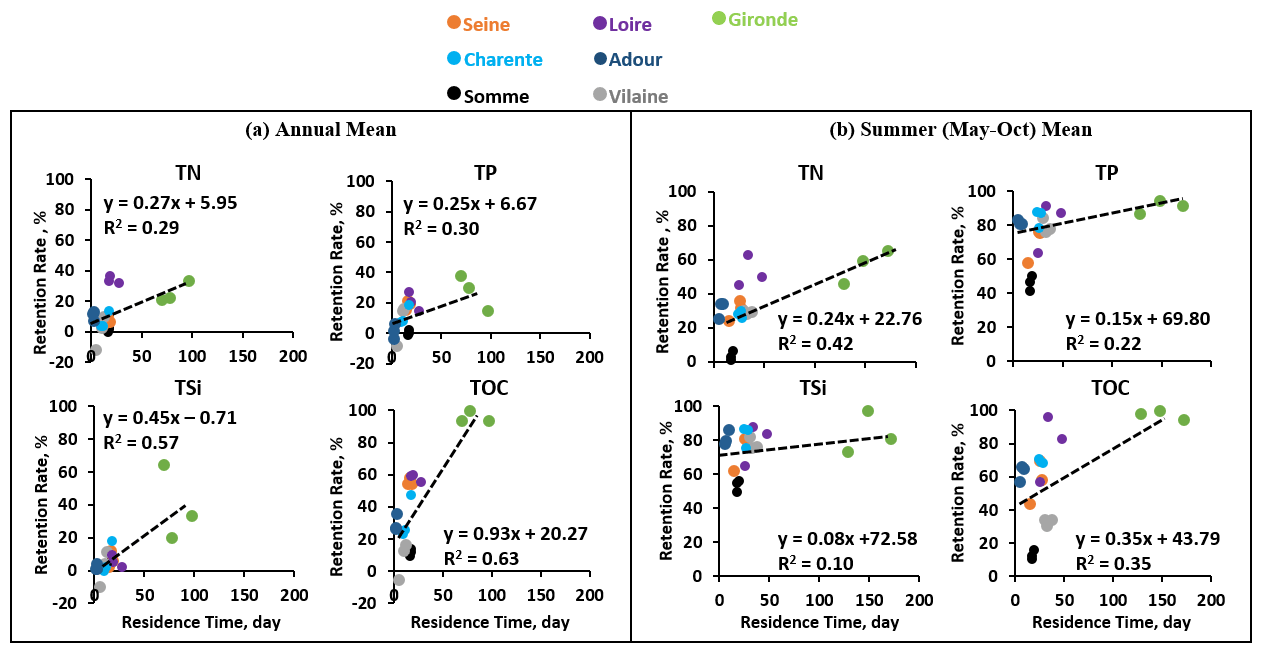
Figure 7The relations between the annual retention rate for nutrients, including total nitrogen (TN), total phosphorus (TP), total silica (TSi), and total organic carbon (TOC), and the freshwater residence time for the estuaries studied (the Somme, Seine, Vilaine, Loire, Charente, Gironde, and Adour estuaries) for the 3 years of 2014–2016. (a) Annual mean. (b) Summer (May–October) mean.
We, therefore, plotted the relationship between annual retention rates for water quality variables (TN, TP, TSi, and TOC) and annual mean water residence time for 2014–2016 for each estuary studied (Fig. 7). The retention rates for TSi and TOC showed a significant positive relationship (R2 = ∼ 0.6; p<0.05; Fig. 7) with the annual mean water residence time, while the positive relationship was less clear for TN and TP retention rates. We also calculated retention rates and residence times for summer season (May–October), which further showed that the estuaries had a larger residence time during the dry season, which also led to larger retention rates. The relationships are, however, not strictly linear, as the percent of retention plateaued at high residence times.
The reaction process rates calculated by the model along the estuaries over the 3 years were integrated and provided as an annual average, in tonnes of total organic Carbon, N-NO3, dissolved Si or phosphate per year for organic matter degradation, denitrification, and net primary production either from diatoms or the from all the algal community, respectively (see Table S1). These fluxes are highest in the largest estuaries with the largest carbon and nutrient loads and the highest residence time. Reported in terms of the percentage of the import fluxes, these values allow the comparison of the intensity of the biogeochemical processing simulated by the model between the different estuaries, together with the carbon and nutrient retention rates discussed above. Overall, total organic carbon degradation and NO3 denitrification percentages were the highest in the Gironde (98 % and 26 %, respectively) and the lowest for the Vilaine (10 % and 3 %, respectively). Other systems displayed intermediate values which fall in the 24 %–39 % and 3 %–14 % ranges for TOC degradation and denitrification, respectively (Table S1). This intensity of organic carbon processing is consistent with the global figures, suggested at the global scale by Bauer et al. (2013), and previous modeling studies performed with C-GEM in Europe and along the East Coast of the USA (Volta et al., 2016a; Laruelle et al., 2017, 2019). The integrated denitrification rates are also consistent with the compilation performed by Nixon et al. (1996). Biogeochemical reactivity regarding organic matter degradation and denitrification appeared greater for the most retentive Gironde, which had the longest residence time. This trend was also illustrated by the calculation of mixing curves for the Seine, Loire, and the Gironde (the three systems with the longest salinity gradient) that were computed for the reference simulation and the simulations in which the biogeochemical model of C-GEM was deactivated (Fig. S2). The difference between the reference simulation and the simulation without biogeochemistry provides a visual representation of the intensity of the biogeochemical processing within the system and is significantly more pronounced in the Gironde. Interestingly, silica uptake percentages, which are entirely sustained by the primary production of diatoms, were also the highest in the Gironde, the Seine, and the Somme (16 %, 13 %, and 12 %, respectively), which is in accordance with the ones for phosphates (16 %, 43 %, and 76 %, respectively). These results revealed a large range of autotrophic activity, however. The percentage PO4 uptake flux was particularly high in the Somme because of its proportionally low specific P riverine loads from its upstream boundary. Overall biogeochemical phosphate fluxes were rather well balanced with those of silica, according to the Redfield ratios, indicating, mostly, a development of diatoms (Table S1).
3.3 The indicator of coastal eutrophication potential
The ICEP was calculated on the basis of estuarine TN, TP, and TSi deliveries (Fig. 8). The N-ICEP values at the sea mouth were all positive and ranged from 2.1 (Loire) to 14.5 kg C km−2 d−1 (Charente), while the P-ICEPs at the sea mouth were all negative, ranging from −8.7 (Adour) to −3.8 kg C km−2 d−1 (Seine). The N-ICEPs were positive and the P-ICEPs were negative for all the estuaries studied, indicating that TN was in excess relative to TSi, revealing a risk of coastal eutrophication and the development of potentially harmful non-siliceous algae. Regarding the P-ICEP, the systematic negative values would rule out any risk of eutrophication, although the P-ICEP closest to zero for the Seine and the Gironde would indicate that these systems are fragile, given that increased P in the case of low discharge could become positive and lead to eutrophication.
Referring to the potential of coastal marine eutrophication, we calculated the P- and N-ICEP at the entrance and outlet of the estuary to determine the buffer role of estuaries regarding eutrophication potential (Fig. 8). Whereas the P-ICEP was less negative for export fluxes compared to the import ones, the N-ICEP was generally lower for the export fluxes, meaning that, at the coastal zone, there was a lower deficit in phosphorus compared to silica, and a reduced excess in nitrogen, except for the Vilaine, for which the P- and N-ICEPs were similar for both the export and import fluxes.
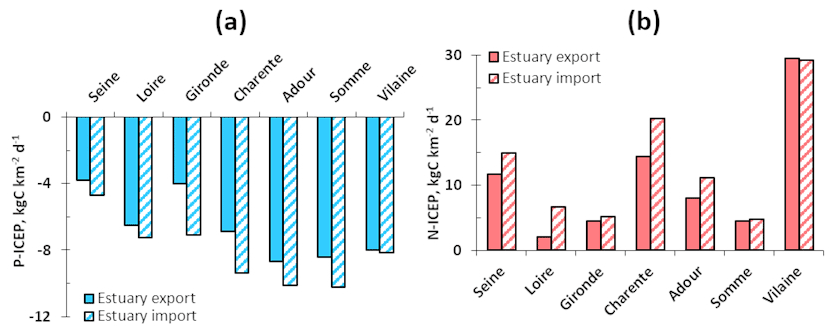
Figure 8Indicator of coastal eutrophication potential (ICEP) for the estuaries studied. Panel (a) shows P-ICEP and panel (b) shows N-ICEP.
4.1 Model applicability and limitations
The 1-D biogeochemical model C-GEM was built to overcome the requirement of large, often unavailable data sets (e.g., geometry at a fine resolution) needed for implementing complex multidimensional models and for improving the computation efficiency and, consequently, enabling regional- and/or global-scale applications using a generic, theoretical framework based on the direct relationship between estuarine geometry and hydrodynamics (Volta et al., 2014, 2016b). As mentioned above, this requires easily obtainable geometrical parameters to frame the idealized morphology of the estuary and uses a set of exponential functions to estimate the width profile of the channel and the cross section variations along the longitudinal axis. The sensitivity of biogeochemical processes to uncertainties in parameter values provided by Volta et al. (2014) revealed that, on large estuaries, the convergence length and water depth had an important influence on the biogeochemical functioning of the estuary due to their strong constraint over the hydrodynamics and transport of solids within the system (Savenije, 2012). We could, thus, expect a less satisfactory performance on small-scale estuaries (Somme and Vilaine; Table 7; Figs. S1 and S2) than on medium- and large-scale estuaries. Indeed, the spatial resolution used in C-GEM is 2 km, which allows the capturing of the dominant features of large estuaries, while it can be too coarse for small estuaries (length <30 km) of this study. Although we aimed to implement a similar version of C-GEM for all the studied estuaries here, for future specific applications on small estuaries, the grid size might need to be adjusted.
In its current setup, the biogeochemical module of C-GEM considers some of the most essential biogeochemical processes and reactions (primary production, organic matter degradation, denitrification, etc.). In spite of the generally good ability of the model to capture the main spatial and temporal biogeochemical dynamics of the different systems studied (i.e., longitudinal, seasonal, and amplitude of the variations in carbon, nutrients, and oxygen fields), several potentially important processes contributing to the N and P cycling in estuarine environments in particular are still ignored or largely simplified. These include benthic–pelagic exchanges, the sorption–desorption of phosphorus, mineral precipitation, or a more complex representation of the biological planktonic/benthic compartments (such as grazing by higher trophic levels or multiple reactive organic carbon pools, for instance). With its current setup, the lack of explicit benthic biogeochemical module obviously limits the depth of mechanistic understanding the model can provide of nutrient cycling, particularly regarding interactions between pelagic and benthic compartments, which can significantly influence the intensity but also the timing of nutrients and organic matter cycling in estuaries (Laruelle et al., 2019). In that context, future developments of the model should include the implementation of several benthic processes. This task comes with a number of hurdles. For instance, while the addition of a full diagenetic module at each grid cell of our model would be possible, it would also increase its calculation time by 1 order of magnitude and likely require a very long spinup to generate initial the conditions for the benthic species. There exist simpler benthic modules of lower complexity, which would limit the computational cost of adding an explicit representation of benthic processes (Billen et al., 2015; Soetaert et al., 2000), but those would nonetheless significantly increase the data demand of the model to be properly calibrated. Indeed, the increase in the complexity of the model will involve the use of field data to constrain and calibrate the newly implemented process. While measurements of estuarine benthic processing of nutrient and carbon do exist, they are still relatively scarce. In the present study, the simple representation of particulate matter burial that was implemented and applied to phytoplankton and TOC to provide a first-order representation of the process, which is necessary to evaluate the retention of carbon and nutrients within the system. We believe this addition, coupled with denitrification, provides a first insight on the main pathways removing nutrients from estuaries and allows calculating carbon and nutrient retention rates that can be compared with previously published estimates.
In addition to the idealized geometry and biogeochemical processes, the boundary conditions and constraints are also critical for the performance of the model because they place the simulated system in an environmental context and drive transient dynamics. In this study, marine boundary conditions were extracted from ECO-MARS3D (Cugier et al., 2005b; Lazure and Dumas, 2008; Ménesguen et al., 2019), and are thus model-derived, but its robustness has been proved for both hydrodynamic and biogeochemical variables in the marine coastal zones. Riverine boundary conditions comprise the observed data, extracted at the station closest to the model's upper boundary, which might still be located several kilometers upstream or downstream of the model's upstream boundary. It is noteworthy that the Dordogne river, which was considered as a source of water and biogeochemical material for the Gironde estuary at the confluence, ignored the tidal cycle effects that rise.
Observed data are usually measured at monthly or bimonthly intervals. Some variables were, however, sampled more frequently, 2 or 3 times per month, while Chl a concentrations were usually only available from March to September. Also, DSi and TOC are usually less available than other variables. Instantaneous SPM and water quality sampling data were linearly interpolated to obtain the daily values between the adjacent measurements. Therefore, simulations are only partly transient and do not resolve events such as storms, floods, and/or extreme droughts.
In this study, only WWTPs from the largest estuarine cities (> 50 000 inhabitants) were considered in the estuarine model. The volume of water released by WWTPs to the estuaries may change over a year, especially in the touristic estuarine cities in summer. However, even if the summer fluxes double and the summer river discharges decrease by half compared to the average values, wastewater discharge would remain below 3 % of the total.
Despite these simplifications and limitations, e.g., morphological and boundary inputs, C-GEM captured the right level of the variables and the main spatial and seasonal trends and also considered the potential inaccuracies from the sampling strategy (surface sampling, ebb or flow, etc.). Its performance is supported by simulation/observation comparisons with longitudinal profiles from specific days (Figs. 3 and S1) and/or simulation/observation comparisons at specific cross sections (Figs. 4 and S2) and/or evaluation analysis (Table 7). Furthermore, solid results were gained elsewhere with C-GEM supporting its genericity, i.e., carbon processing in the six major tidal estuaries (length >80 km) flowing into the North Sea (Volta et al., 2016b), biogeochemical dynamics and CO2 exchange in three tidal estuaries (length >90 km; Volta et al., 2016a), CO2 evasion on 42 tidal estuaries along the USA East Coast (Laruelle et al., 2017) and the Seine (Laruelle et al., 2019), and biogeochemical processes and fluxes on a tropical estuary (Nguyen et al., 2021).
4.2 Fluxes and retention capacity
Quantifying fluxes (Sect. 3.2.1) showed that, even though some estuaries received nearly the same water flow from the upstream basin, their nutrient imports can differ greatly due to the range of the human population and land use in the upstream watersheds. This is illustrated, for example, by the Seine and Loire compared with the Adour. Anthropogenic influences have been recognized as being an important factor affecting water quality and nutrient fluxes, not only in rivers from headwater to downstream estuarine and coastal waters but also in stagnant systems (Baker, 2005; Escolano et al., 2018; Garnier et al., 2019; Nguyen et al., 2021). In this study, the basins are characterized by different land use types. For example, the Somme, Seine, Vilaine, and Charente basins, with the highest nitrate concentrations, are dominated by intensive agriculture, with arable land covering 66 %–84 % of the total basin area (Table 2). Intensive agriculture is indeed well known for the nitrate contamination of ground- and surface waters (Billy et al., 2013; Lockhart et al., 2013). Moreover, the upstream basin of the Seine, Loire, and Gironde estuaries have a population equaling 16.7×10⁶, 8.3×10⁶, and 4.9×10⁶ inhabitants, respectively, with the population of the Seine basin being by far the highest. Although treatments of most of the domestic effluents have been improved since the Urban Wastewater Treatment Directive (1991) and the EU Water Framework Directive (WFD, 2000), high levels of NH4 and PO4 still remain good indicators of domestic pollution. In the Seine, these levels have been considerably reduced (Garnier et al., 2019) but still remain rather high compared to the other rivers.
The positive relationship between retention rates and water residence time confirms that estuarine geomorphology and river fluxes are major physical forcings for biogeochemical retention abilities (Arndt et al., 2009; Perez et al., 2011; Romero et al., 2019). This relationship between estuarine residence time and retention capacity was already theorized empirically on a handful of systems in the pioneering work of Nixon et al. (1996). While deriving a predictive formula for nutrient retention solely based on geometric parameters and nutrient loads remains elusive (Laruelle et al., 2017), this study presents further evidence of the importance of water residence time in the complex interplay of physical and biogeochemical drivers constraining the retention potential of a given estuarine system. The role of residence time on nutrient retention/elimination is not only the fate of estuaries but also of rivers, stagnant systems (lakes, ponds, and reservoirs), and also wetlands. This function can be valued for reducing contaminations, and sometimes even promoted for restoration, although the best way is to limit the amount of fertilizer applied (Bernot and Dodds, 2005). The retention rates for TSi and TOC showed relatively significant positive relationships (Fig. 7) with the annual mean water residence time, while relationships between TN and TP retention rates and the annual mean water residence time were weaker. This can be caused by anthropogenic interferences with the biogeochemical processes within the estuaries. For example, the high retention of TN in the Loire estuary might be due to an elimination process in this system (e.g., denitrification; see Table S2). For the Vilaine basin, 2014 was a wet year with a discharge double that recorded in 2015 and 2016, leading to slightly negative retention rates, meaning that, instead of eliminating nutrients, the Vilaine estuary exported a small amount (Fig. 7). The export of nutrients likely corresponds to a difference in the nutrient stock within the system itself between the beginning and the end of the simulated period and remains limited to a few percent of the riverine loads. Overall, TN and TP retention rates are comparable in the estuaries simulated, but some systems are more efficient at removing P while others are more efficient at removing N. This implies that the TN : TP ratio varies along the estuarine gradient. These variations are controlled by the complex interplay of phytoplankton and organic matter (TOC) burial and denitrification along the estuary. Denitrification, being a net removal of N, obviously increases the TN : TP ratio. However, the effect of phytoplankton and organic matter burial is more subtle. In the model, it is assumed that the material buried (phytoplankton and organic matter) has a fixed Redfield N : P ratio and, thus, removes the same proportion of N and P through burial. However, the ratio of inorganic (DIN or DIP) to organic matter (associated with phytoplankton or TOC) is different for N and P. As a consequence, the net effect of burial also affects the TN : TP ratio of the system.
The retention rates were also compared with other estuaries. A yearly retention rate of 6.8 %–13 % for TN, 27 %–31 % for TP, and 4.3 %–11 % for DSi were found for the Seine estuary (Garnier et al., 2010b; Romero et al., 2019), while we found here, for the 2014–2016 period, values of 6 %–10 % for TN, 15 %–21 % for TP, and 2 %–12 % for TSi, which agree closely with the earlier studies.
For tidal estuaries discharging into the North Sea, a 15 % retention rate for total C was found (Volta et al., 2016b), and the Scheldt estuary showed a 73 % and 78 % reduction in NH4 and TOC, respectively (Vanderborght et al., 2007), and a retention rate of 12 % for DSi and 32 % for TN. Seitzinger (1988) found a 20 %–50 % elimination of N for six estuaries, while, for a tropical system, Luu et al. (2012) mentioned a 43.6 % retention rate for N. Interestingly, the retention rates for individual systems are highly variable (Arndt et al., 2009). Here, TOC retention rates varied greatly among different systems, from 10 % (the Somme estuary in 2014) to 100 % (the Gironde estuary in 2016). With the longest water residence time and the high level of suspended matter and associated TOC, the Gironde is a site for high TOC retention, as already shown by Etcheber et al. (2007). TN filter capacities ranged from 0 % (the Somme estuary in 2014) to 37 % (the Gironde estuary in 2016) and, in the Gironde, was linked to denitrification (26 %; see Table S2). Regarding the lack of retention, in some estuaries this might mean that NO3 production (e.g., by nitrification) would be compensated by losses (e.g., denitrification), as already observed in the Seine (Sebilo et al., 2006). TSi was eliminated only slightly (e.g., 2 % for the Seine estuary in 2016 and the Loire estuary in 2015 and 1 % for the Adour estuary in 2014 and 2015), suggesting that no diatom uptake occurred, or it was compensated by freshwater diatom mortality sensitive to the salinity gradients (Ragueneau et al., 2002; Roubeix et al., 2008). High DSi retention in the Gironde (39 %) may rather be linked to detrital particle removal by burial because turbid estuaries showed low diatom planktonic primary production with high suspended matter and low light penetration (Coynel et al., 2005).
Similarly to retention rates, intensities of the biological processes were clearly higher for larger estuaries with high residence times, especially for TOC and NO3 removal, via the total organic matter degradation and denitrification, with the largest estuaries behaving as receptacle of the upstream inputs and reactors for biogeochemical transformations (Howarth et al., 2011). DSi and phosphate removal intensities via net primary production were more variable between large and small estuaries, as were the retention rates. High biogeochemical reactivity of estuaries in terms of primary production does not necessarily lead to high retention, if accompanied by remineralization.
4.3 Coastal eutrophication potential
Eutrophication has been recognized as a serious environmental threat for both rivers and marine waters. The amount of nutrients (N, P, and Si) delivered to the coastal zone by large river systems are the major determinants of coastal marine eutrophication problems. Previous studies have indicated that eutrophication is not only a result of high inputs of anthropogenic nutrients (N and/or P) but also of the imbalance when anthropogenic N and P are introduced over Si from natural rock weathering (Billen and Garnier, 1997; Garnier et al., 2021). Therefore, the ICEP considers the balance of these nutrients (N, P, and Si) to calculate the coastal eutrophication potential in watershed area units (kg C km−2 d−1) for comparisons between the P- and N-ICEP (C unit) and among systems (per square kilometer).
The P-ICEPs were all negative, while the N-ICEPs were all positive for the estuaries studied herein, indicating a deficit in P and excess of N, respectively, with respect to the Si requirements of diatoms (Billen and Garnier, 2007). The negative values for the P-ICEP for small to medium-sized estuaries are larger than for large-scale estuaries (Fig. 8). Accordingly, there would be no risk for potential coastal eutrophication regarding P; however, the rapid cycling of this element in coastal marine systems generally prevents it from becoming limiting (Kobori and Taga, 1979; Labry et al., 2016). Conversely, positive N-ICEP values might be responsible for the eutrophication problems observed and do not relate to estuary size. While exploring the N-ICEP over the long term (from 1950 to the 2010s), Garnier et al. (2010a) found an increase as a function of population density and rapid urbanization, leading to the development of sewerage systems, without the sufficient treatment of sewage water, and also with rapidly increasing agricultural production.
The manifestations of eutrophication along the coast are diverse. Phaeocystis blooms have been reported in the Somme bight (Lamy et al., 2006; Lefebvre et al., 2011), while Dinophysis (dinoflagellates) and Pseudo-nitzschia (diatoms) are the dominant harmful algae in the Seine bight (Cugier et al., 2005a; Garnier et al., 2019; Ménesguen et al., 2019). Whereas most of the rivers have shown a decrease in phosphorus in the last 2 decades (Romero et al., 2013), leading to a negative P-ICEP, as found here, algal biomass increased (diatoms and dinoflagellates), with a shift in the peak in the Vilaine bight (Ratmaya et al., 2019), mostly due to N fluxes brought by the Loire river, which flows northwards with the currents (Ménesguen et al., 2018a, 2019) and to internal sources from sediments (Ratmaya et al., 2019). No strong eutrophication problems have been reported off the Loire estuary, in the north of the Bay of Biscay, without major changes during the last 2 decades, in contrast to the north of France (Gohin et al., 2019). Indeed, high winter nutrient fluxes are accompanied by high suspended solids, preventing algal growth (Guillaud et al., 2008).
Furthermore, a positive N-ICEP in the south coast of the Bay of Biscay did not lead to eutrophication problems at the coast because the Gironde estuarine water fluxes are driven to the middle of the bay, and those of the Adour spread throughout the Basque Country, especially at higher discharges (Ménesguen et al., 2018a). However, for the Charente estuary, which flows into the close Marennes–Oléron bight, well known for its oyster production, a chronic summer mortality of juveniles was reported in the late 1990s to the early 2000s (Soletchnik et al., 2007). Garnier et al. (2021) demonstrated that the manifestations of eutrophication at the coast of riverine deliveries (and the associated ICEP) not only depend on the nutrient fluxes and their stoichiometry but also on the morphology of the receiving media.
The 1-D biogeochemical model (C-GEM) was applied to seven estuaries with different sizes and morphologies along the French Atlantic coast (the Somme, Seine, Vilaine, Loire, Charente, Gironde, and Adour). Transient simulations were implemented on water quality variables (PO4, NH4, NO3, DSi, TOC, DO, and Chl a) for 3 years (2014–2016). The model was calibrated (2015) and validated (2014 and 2016) by comparing it with in situ sampling data along the estuaries. The results showed that this model presented accurate descriptions of the hydrodynamics, transport, and biogeochemistry in these tidal estuaries, using simplified representations of the estuarine geometry and the same set of biogeochemical parameters for all estuaries.
C-GEM also quantifies the nutrient fluxes imported to and exported by the estuaries, reflecting human activities in the upstream watersheds (population and agriculture). The retention rates for TP, TN, DSi, and TOC for the estuaries studied showed that large estuaries generally had a higher retention rate due to their longer water residence times. Longer residence times provides enough time for biogeochemical reactions, thus reducing the fluxes of nutrients delivered to the sea. However, eutrophication does not only depend on nutrient fluxes but also on their balance or imbalance. Therefore, the indicator for coastal eutrophication (ICEP) was evaluated for these seven estuaries and indicated that, for these estuaries, although no risk appears regarding P, there might be a risk of coastal eutrophication due to the excess TN over DSi and, thus, the development of potentially harmful non-siliceous algae.
The present study, thus, provides a new understanding of the complex biogeochemical behavior of a range of estuaries. C-GEM can be combined with river models to simulate future scenarios with different degrees of anthropogenic impacts on the upstream basins and, in turn, to assess how the estuaries would respond to potential or forthcoming disturbances. However, ongoing work for a better representation of some biogeochemical processes (especially the water–sediment interface) should be implemented, while a systematic study regarding the grid size could be carried out on large and small estuaries.
The measured data used in this study can be accessed through the links in Sect. 2.2. The C-GEM source code is available upon reasonable request to the corresponding authors.
The supplement related to this article is available online at: https://doi.org/10.5194/bg-19-931-2022-supplement.
XW constructed the data set, performed the simulations, analyzed the data, prepared the figures, and wrote the paper. JG and GGL conceptualized and supervised this study, provided the data, and completed, modified, and revised the paper. VT, PP, and RLG provided the data for the data set used for this study and revised the paper. GB and MA revised this paper.
The contact author has declared that neither they nor their co-authors have any competing interests.
Publisher's note: Copernicus Publications remains neutral with regard to jurisdictional claims in published maps and institutional affiliations.
This study (Prest'Eaux project) has been supported by the Office Français de la Biodiversité (OFB), and their support greatly acknowledged for the project follow-up. Xi Wei's post-doctoral research was funded by this project. Josette Garnier, the research director at the CNRS, was the principal investigator (PI) of Prest'Eaux. Goulven G. Laruelle is a research associate of the FRS-FNRS at the Université Libre de Bruxelles and contributed to the development of G-GEM.
The authors thank Jack Middelburg, for editing the paper. Our grateful acknowledgements also go to Pierre Anschutz and two anonymous reviewers, for their constructive comments and suggestions.
This paper was edited by Jack Middelburg and reviewed by Pierre Anschutz and two anonymous referees.
Arndt, S., Regnier, P., and Vanderborght, J. P.: Seasonally-resolved nutrient export fluxes and filtering capacities in a macrotidal estuary, J. Marine Syst., 78, 42–58, https://doi.org/10.1016/j.jmarsys.2009.02.008, 2009.
Arndt, S., Lacroix, G., Gypens, N., Regnier, P., and Lancelot, C.: Nutrient dynamics and phytoplankton development along an estuary–coastal zone continuum: A model study, J. Marine Syst., 84, 49–66, https://doi.org/10.1016/j.jmarsys.2010.08.005, 2011.
Baker, A.: Land Use and Water Quality, in: Encyclopedia of Hydrological Sciences, edited by: Anderson, M. G. and McDonnell, J. J., https://doi.org/10.1002/0470848944.hsa195, 2006.
Barbier, E. B., Hacker, S. D., Kennedy, C., Koch, E. W., Stier, A. C., and Silliman, B. R.: The value of estuarine and coastal ecosystem services, Ecol. Monogr., 81, 169–193, https://doi.org/10.1890/10-1510.1, 2011.
Bauer, J. E., Cai, W. J., Raymond, P. A., Bianchi, T. S., Hopkinson, C. S., and Regnier, P. A.: The changing carbon cycle of the coastal ocean, Nature, 504, 61–70, https://doi.org/10.1038/nature12857, 2013.
Bernot, M. J. and Dodds, W. K.: Nitrogen Retention, Removal, and Saturation in Lotic Ecosystems, Ecosystems, 8, 442–453, https://doi.org/10.1007/s10021-003-0143-y, 2005.
Billen, G. and Garnier, J.: The Phison River plume: Coastal eutrophication in response to changes in land use and water management in the watershed, Aquat. Microb. Ecol., 13, 3–17, https://doi.org/10.3354/ame013003, 1997.
Billen, G. and Garnier, J.: River basin nutrient delivery to the coastal sea: Assessing its potential to sustain new production of non-siliceous algae, Mar. Chem., 106, 148–160, https://doi.org/10.1016/j.marchem.2006.12.017, 2007.
Billen, G., Garnier, J., and Silvestre, M.: A simplified algorithm for calculating benthic nutrient fluxes in river systems, Ann. Limnol., 51, 37–47, https://doi.org/10.1051/limn/2014030, 2015.
Billy, C., Birgand, F., Ansart, P., Peschard, J., Sebilo, M., and Tournebize, J.: Factors controlling nitrate concentrations in surface waters of an artificially drained agricultural watershed, Landscape Ecol., 28, 665–684, https://doi.org/10.1007/s10980-013-9872-2, 2013.
Brion, N., Billen, G., Guezennec, L., and Ficht, A.: Distribution of nitrifying activity in the Seine River “France” from Paris to the estuary, Estuaries, 23, 669–682, https://doi.org/10.2307/1352893, 2000.
Brzezinski, M. A.: THE Si : C : N RATIO OF MARINE DIATOMS: INTERSPECIFIC VARIABILITY AND THE EFFECT OF SOME ENVIRONMENTAL VARIABLES, J. Phycol., 21, 347–357, https://doi.org/10.1111/j.0022-3646.1985.00347.x, 1985.
Burchard, H., Schuttelaars, H. M., and Ralston, D. K.: Sediment trapping in estuaries, Annu. Rev. Mar. Sci., 10, 371–395, https://doi.org/10.1146/annurev-marine-010816-060535, 2018.
CORINE Land Cover: L'occupation des sols en 2018, available at: https://land.copernicus.eu/pan-european/corine-land-cover/clc2018 (last access: 7 February 2022), 2018.
Coynel, A., Seyler, P., Etcheber, H., and Meybeck, M.: Spatial and seasonal dynamics of total suspended sediment and organic carbon species in the Congo River, Global Biogeochem. Cy., 19, 1–17, https://doi.org/10.1029/2004GB002335, 2005.
Coynel, A., Gorse, L., Curti, C., Schafer, J., Grosbois, C., Morelli, G., Ducassou, E., Blanc, G., Maillet, G. M., and Mojtahid, M.: Spatial distribution of trace elements in the surface sediments of a major European estuary (Loire Estuary, France): Source identification and evaluation of anthropogenic contribution, J. Sea Res., 118, 77–91, https://doi.org/10.1016/j.seares.2016.08.005, 2016.
Crossland, C. J., Kremer, H. H., Lindeboom, H. J., Marshal Crosslandl, J. I., and Le Tissier, M. D. A. (Eds.): Coastal Fluxes in the Anthropocene, Springer Berlin Heidelberg, Berlin, Heidelberg, https://doi.org/10.1007/3-540-27851-6, 2005.
Cugier, P., Billen, G., Guillaud, J. F., Garnier, J., and Ménesguen, A.: Modelling the eutrophication of the Seine Bight (France) under historical, present and future riverine nutrient loading, J. Hydrol., 304, 381–396, https://doi.org/10.1016/j.jhydrol.2004.07.049, 2005a.
Cugier, P., Ménesguen, A., and Guillaud, J. F.: Three-dimensional (3D) ecological modelling of the Bay of Seine (English Channel, France), J. Sea Res., 54, 104–124, https://doi.org/10.1016/j.seares.2005.02.009, 2005b.
Defontaine, S., Sous, D., Morichon, D., Verney, R., and Monperrus, M.: Hydrodynamics and SPM transport in an engineered tidal estuary: The Adour river (France), Estuar. Coast. Shelf S., 231, 106445, https://doi.org/10.1016/j.ecss.2019.106445, 2019.
Dürr, H. H., Laruelle, G. G., van Kempen, C. M., Slomp, C. P., Meybeck, M., and Middelkoop, H.: Worldwide Typology of Nearshore Coastal Systems: Defining the Estuarine Filter of River Inputs to the Oceans, Estuar. Coast., 34, 441–458, https://doi.org/10.1007/s12237-011-9381-y, 2011.
Edmondson, W. T.: VOLLENWEIDER, R. A. 1968. Water management research. Scientific fundamentals of the eutrophication of lakes and flowing waters with particular reference to nitrogen and phosphorus as factors in eutrophication. Organization for Economic Co-operation and Development. Directorate for Scientific Affairs. Paris. Mimeographed. 159 p. + 34 Figs. + 2 separately paged annexes: Bibliography, 61 p; Current status of research on eutrophication in Europe, the United States and Canada, 20 p. (French and German versions available.), Limnol. Oceanogr., 15, 169–170, https://doi.org/10.4319/lo.1970.15.1.0169, 1970.
Escolano, J. J., Pedreño, J. N., Lucas, I. G., Almendro Candel, M. B., and Zorpas, A. A.: Decreased Organic Carbon Associated With Land Management in Mediterranean Environments, Report From the Commission to the European Parliament, the Council, Elsevier Inc., 2018.
Etcheber, H., Taillez, A., Abril, G., Garnier, J., Servais, P., Moatar, F., and Commarieu, M. V.: Particulate organic carbon in the estuarine turbidity maxima of the Gironde, Loire and Seine estuaries: Origin and lability, Hydrobiologia, 588, 245–259, https://doi.org/10.1007/s10750-007-0667-9, 2007.
EU Water Framework Directive (WFD): DIRECTIVE 2000/60/EC OF THE EUROPEAN PARLIAMENT AND OF THE COUNCIL, available at: https://ec.europa.eu/environment/water/water-framework/index_en.html (last access: 7 February 2022), 2000.
Garnier, J., Billen, G., and Cébron, A.: Modelling nitrogen transformations in the lower Seine river and estuary (France): impact of wastewater release on oxygenation and N2O emission, Hydrobiologia, 588, 291–302, https://doi.org/10.1007/s10750-007-0670-1, 2007.
Garnier, J., Billen, G., Even, S., Etcheber, H., and Servais, P.: Organic matter dynamics and budgets in the turbidity maximum zone of the Seine Estuary (France), Estuar. Coast. Shelf S., 77, 150–162, https://doi.org/10.1016/j.ecss.2007.09.019, 2008.
Garnier, J., Beusen, A., Thieu, V., Billen, G., and Bouwman, L.: N : P : Si nutrient export ratios and ecological consequences in coastal seas evaluated by the ICEP approach, Global Biogeochem. Cy., 24, GB0A05, https://doi.org/10.1029/2009GB003583, 2010a.
Garnier, J., Billen, G., Némery, J., and Sebilo, M.: Transformations of nutrients (N, P, Si) in the turbidity maximum zone of the Seine estuary and export to the sea, Estuar. Coast. Shelf S., 90, 129–141, https://doi.org/10.1016/j.ecss.2010.07.012, 2010b.
Garnier, J., Riou, P., Le Gendre, R., Ramarson, A., Billen, G., Cugier, P., Schapira, M., Théry, S., Thieu, V., and Ménesguen, A.: Managing the Agri-Food System of Watersheds to Combat Coastal Eutrophication: A Land-to-Sea Modelling Approach to the French Coastal English Channel, Geosciences, 9, 441, https://doi.org/10.3390/geosciences9100441, 2019.
Garnier, J., Billen, G., Lassaletta, L., Vigiak, O., Nikolaidis, N. P., and Grizzetti, B.: Hydromorphology of coastal zone and structure of watershed agro-food system are main determinants of coastal eutrophication, Environ. Res. Lett., 16, 023005, https://doi.org/10.1088/1748-9326/abc777, 2021.
Glibert, P. M.: Harmful algae at the complex nexus of eutrophication and climate change, Harmful Algae, 91, 101583, https://doi.org/10.1016/j.hal.2019.03.001, 2020.
Gohin, F., Van der Zande, D., Tilstone, G., Eleveld, M. A., Lefebvre, A., Andrieux-Loyer, F., Blauw, A. N., Bryère, P., Devreker, D., Garnesson, P., Hernández Fariñas, T., Lamaury, Y., Lampert, L., Lavigne, H., Menet-Nedelec, F., Pardo, S., and Saulquin, B.: Twenty years of satellite and in situ observations of surface chlorophyll-a from the northern Bay of Biscay to the eastern English Channel. Is the water quality improving?, Remote Sens. Environ., 233, 111343, https://doi.org/10.1016/j.rse.2019.111343, 2019.
Goubert, E., Menier, D., Traini, C., Mathew, M. J., and Le Gall, R.:Recent Morphobathymetrical Changes of the Vilaine Estuary (South Brittany, France): Discrimination of Natural and Anthropogenic Forcings and Assessment for Future Trends, Elsevier, Coastal Zone Management, 485–500, ISBN 978-0-12-814350, 2019.
Guillaud, J.-F., Aminot, A., Delmas, D., Gohin, F., Lunven, M., Labry, C., and Herbland, A.: Seasonal variation of riverine nutrient inputs in the northern Bay of Biscay (France), and patterns of marine phytoplankton response, J. Marine Syst., 72, 309–319, https://doi.org/10.1016/j.jmarsys.2007.03.010, 2008.
Hofmann, A. F., Soetaert, K., and Middelburg, J. J.: Present nitrogen and carbon dynamics in the Scheldt estuary using a novel 1-D model, Biogeosciences, 5, 981–1006, https://doi.org/10.5194/bg-5-981-2008, 2008.
Howarth, R., Chan, F., Conley, D. J, Garnier, J., Doney, S. C., Marino, R., and Billen, G.: Coupled Biogeochemical Cycles: Eutrophication and Hypoxia in Temperate Estuaries and Coastal Marine Ecosystems, Front. Ecol. Environ., 9, 18–26, https://doi.org/10.1890/100008, 2011.
Howarth, R. W., Fruci, J. R., and Sherman, D.: Inputs of Sediment and Carbon to an Estuarine Ecosystem: Influence of Land Use, Ecol. Appl., 1, 27–39, https://doi.org/10.2307/1941845, 1991.
Hu, J. and Li, S.: Modeling the mass fluxes and transformations of nutrients in the Pearl River Delta, China, J. Marine Syst., 78, 146–167, https://doi.org/10.1016/j.jmarsys.2009.05.001, 2009.
Husson, B., Hernández-Fariñas, T., Le Gendre, R., Schapira, M., and Chapelle, A.: Two decades of Pseudo-nitzschia spp. blooms and king scallop (Pecten maximus) contamination by domoic acid along the French Atlantic and English Channel coasts: Seasonal dynamics, spatial heterogeneity and interannual variability, Harmful Algae, 51, 26–39, https://doi.org/10.1016/j.hal.2015.10.017, 2016.
INSEE: Populations légales 2014, available at: https://www.insee.fr/fr/statistiques/2525755?sommaire=2525768#consulter-sommaire (last access: 7 February 2022), 2014.
Jakobsen, H. H. and Markager, S.: Carbon-to-chlorophyll ratio for phytoplankton in temperate coastal waters: Seasonal patterns and relationship to nutrients, Limnol. Oceanogr., 61, 1853–1868, https://doi.org/10.1002/lno.10338, 2016.
Jay, D. A., Uncles, R. J., Largier, J., Geyer, W. R., Vallino, J., and Boynton, W. R.: A Review of Recent Developments in Estuarine Scalar Flux Estimation, Estuaries, 20, 262, https://doi.org/10.2307/1352342, 1997.
Kaiser, D., Unger, D., Qiu, G., Zhou, H., and Gan, H.: Natural and human influences on nutrient transport through a small subtropical Chinese estuary, Sci. Total Environ., 450–451, 92–107, https://doi.org/10.1016/j.scitotenv.2013.01.096, 2013.
Kobori, H. and Taga, N.: Phosphatase activity and its rôle in the mineralization of organic phosphorus in coastal sea water, J. Exp. Mar. Bio. Ecol., 36, 23–39, https://doi.org/10.1016/0022-0981(79)90098-4, 1979.
Labry, C., Delmas, D., Youenou, A., Quere, J., Leynaert, A., Fraisse, S., Raimonet, M., and Ragueneau, O.: High alkaline phosphatase activity in phosphate replete waters: The case of two macrotidal estuaries, Limnol. Oceanogr., 61, 1513–1529, https://doi.org/10.1002/lno.10315, 2016.
Lajaunie-Salla, K., Wild-Allen, K., Sottolichio, A., Thouvenin, B., Litrico, X., and Abril, G.: Impact of urban effluents on summer hypoxia in the highly turbid Gironde Estuary, applying a 3D model coupling hydrodynamics, sediment transport and biogeochemical processes, J. Marine Syst., 174, 89–105, https://doi.org/10.1016/j.jmarsys.2017.05.009, 2017.
Lamy, D., Artigas, L. F., Jauzein, C., Lizon, F., and Cornille, V.: Coastal bacterial viability and production in the eastern English Channel: A case study during a Phaeocystis globosa bloom, J. Sea Res., 56, 227–238, https://doi.org/10.1016/j.seares.2006.04.003, 2006.
Laruelle, G. G., Goossens, N., Arndt, S., Cai, W.-J., and Regnier, P.: Air–water CO2 evasion from US East Coast estuaries, Biogeosciences, 14, 2441–2468, https://doi.org/10.5194/bg-14-2441-2017, 2017.
Laruelle, G. G., Marescaux, A., Gendre, R. Le, Garnier, J., Rabouille, C., Thieu, V., and Lehrter, J. C.: Carbon Dynamics Along the Seine River Network: Insight From a Coupled Estuarine/River Modeling Approach, 6, 1–16, https://doi.org/10.3389/fmars.2019.00216, 2019.
Lazure, P. and Dumas, F.: An external–internal mode coupling for a 3D hydrodynamical model for applications at regional scale (MARS), Adv. Water Resour., 31, 233–250, https://doi.org/10.1016/j.advwatres.2007.06.010, 2008.
Lefebvre, A., Guiselin, N., Barbet, F., and Artigas, F. L.: Long-term hydrological and phytoplankton monitoring (1992–2007) of three potentially eutrophic systems in the eastern English Channel and the Southern Bight of the North Sea, ICES J. Mar. Sci., 68, 2029–2043, https://doi.org/10.1093/icesjms/fsr149, 2011.
Liquete, C., Piroddi, C., Drakou, E. G., Gurney, L., Katsanevakis, S., Charef, A., and Egoh, B.: Current Status and Future Prospects for the Assessment of Marine and Coastal Ecosystem Services: A Systematic Review, edited by S. J. Bograd, PLoS One, 8, e67737, https://doi.org/10.1371/journal.pone.0067737, 2013.
Lockhart, K. M., King, A. M., and Harter, T.: Identifying sources of groundwater nitrate contamination in a large alluvial groundwater basin with highly diversified intensive agricultural production, J. Contam. Hydrol., 151, 140–154, https://doi.org/10.1016/j.jconhyd.2013.05.008, 2013.
Luu, T. N. M., Garnier, J., Billen, G., Le, T. P. Q., Nemery, J., Orange, D., and Le, L. A.: N, P, Si budgets for the Red River Delta (northern Vietnam): How the delta affects river nutrient delivery to the sea, Biogeochemistry, 107, 241–259, https://doi.org/10.1007/s10533-010-9549-8, 2012.
McLean, M. J., Mouillot, D., Goascoz, N., Schlaich, I., and Auber, A.: Functional reorganization of marine fish nurseries under climate warming, Glob. Change Biol., 25, 660–674, https://doi.org/10.1111/gcb.14501, 2019.
Ménesguen, A., Dussauze, M., and Dumas, F.: Designing optimal scenarios of nutrient loading reduction in a WFD/MSFD perspective by using passive tracers in a biogeochemical-3D model of the English Channel/Bay of Biscay area, Ocean Coast. Manage., 163, 37–53, https://doi.org/10.1016/j.ocecoaman.2018.06.005, 2018a.
Ménesguen, A., Desmit, X., Dulière, V., Lacroix, G., Thouvenin, B., Thieu, V., and Dussauze, M.: How to avoid eutrophication in coastal seas? A new approach to derive river-specific combined nitrate and phosphate maximum concentrations, Sci. Total Environ., 628–629, 400–414, https://doi.org/10.1016/j.scitotenv.2018.02.025, 2018b.
Ménesguen, A., Dussauze, M., Dumas, F., Thouvenin, B., Garnier, V., Lecornu, F., and Répécaud, M.: Ecological model of the Bay of Biscay and English Channel shelf for environmental status assessment part 1: Nutrients, phytoplankton and oxygen, Ocean Model., 133, 56–78, https://doi.org/10.1016/j.ocemod.2018.11.002, 2019.
Michel, P., Boutier, B., and Chiffoleau, J. F.: Net fluxes of dissolved arsenic, cadmium, copper, zinc, nitrogen and phosphorus from the Gironde Estuary (France): Seasonal variations and trends, Estuar. Coast. Shelf S., 51, 451–462, https://doi.org/10.1006/ecss.2000.0691, 2000.
Middelburg, J. J. and Herman, P. M. J.: Organic matter processing in tidal estuaries, Mar. Chem., 106, 127–147, https://doi.org/10.1016/j.marchem.2006.02.007, 2007.
Modéran, J., David, V., Bouvais, P., Richard, P., and Fichet, D.: Organic matter exploitation in a highly turbid environment: Planktonic food web in the Charente estuary, France, Estuar. Coast. Shelf S., 98, 126–137, https://doi.org/10.1016/j.ecss.2011.12.018, 2012.
Moriasi, D. N., Arnold, J. G., Van Liew, M. W., Bingner, R. L., Harmel, R. D., and Veith, T. L.: Model Evaluation Guidelines for Systematic Quantification of Accuracy in Watershed Simulations, T. ASABE, 50, 885–900, https://doi.org/10.13031/2013.23153, 2007.
Nguyen, A. T., Némery, J., Gratiot, N., Garnier, J., Dao, T. S., Thieu, V., and Laruelle, G. G.: Biogeochemical functioning of an urbanized tropical estuary: Implementing the generic C-GEM (reactive transport) model, Sci. Total Environ., 784, 147261, https://doi.org/10.1016/j.scitotenv.2021.147261, 2021.
Nguyen, T. T. N., Némery, J., Gratiot, N., Garnier, J., Strady, E., Tran, V. Q., Nguyen, A. T., Nguyen, T. N. T., Golliet, C., and Aimé, J.: Phosphorus adsorption/desorption processes in the tropical Saigon River estuary (Southern Vietnam) impacted by a megacity, Estuar. Coast. Shelf S., 227, 106321, https://doi.org/10.1016/j.ecss.2019.106321, 2019.
Nixon, S. W., Ammerman, J. W., Atkinson, L. P., Berounsky, V. M., Billen, G., Boicourt, W. C., Boynton, W. R., Church, T. M., Ditoro, D. M., Elmgren, R., Garber, J. H., Giblin, A. E., Jahnke, R. A., Owens, N. J. P., Pilson, M. E. Q., and Seitzinger, S. P.: The fate of nitrogen and phosphorus at the land-sea margin of the North Atlantic Ocean, Biogeochemistry, 35, 141–180, https://doi.org/10.1007/BF02179826, 1996.
Normandin, C., Lubac, B., Sottolichio, A., Frappart, F., Ygorra, B., and Marieu, V.: Analysis of Suspended Sediment Variability in a Large Highly Turbid Estuary Using a 5-Year-Long Remotely Sensed Data Archive at High Resolution, J. Geophys. Res.-Ocean, 124, 7661–7682, https://doi.org/10.1029/2019JC015417, 2019.
Perez, B. C., Day, J. W., Justic, D., Lane, R. R., and Twilley, R. R.: Nutrient stoichiometry, freshwater residence time, and nutrient retention in a river-dominated estuary in the Mississippi delta, Hydrobiologia, 658, 41–54, https://doi.org/10.1007/s10750-010-0472-8, 2011.
Pozdnyakov, D. V, Pettersson, L. H., and Korosov, A. A.: Exploring the Marine Ecology from Space, Springer International Publishing, Cham., ISBN 978-3-3193-007-57, 2017.
Pritchard, D. W.: What is an estuary: physical viewpoint, in: Estuaries, AAAS, Washington DC, 3–5, Pub. 83, 1967.
Ragueneau, O., Chauvaud, L., Leynaert, A., Thouzeau, G., Paulet, Y.-M., Bonnet, S., Lorrain, A., Grall, J., Corvaisier, R., Le Hir, M., Jean, F., and Clavier, J.: Direct evidence of a biologically active coastal silicate pump: ecological implications, Limnol. Oceanogr., 47, 1849–1854, 2002.
Ratmaya, W., Soudant, D., Salmon-Monviola, J., Plus, M., Cochennec-Laureau, N., Goubert, E., Andrieux-Loyer, F., Barillé, L., and Souchu, P.: Reduced phosphorus loads from the Loire and Vilaine rivers were accompanied by increasing eutrophication in the Vilaine Bay (south Brittany, France), Biogeosciences, 16, 1361–1380, https://doi.org/10.5194/bg-16-1361-2019, 2019.
Redfield, A. C., Ketchum, B. H., and Richards, F. A.: The Influence of Organisms on the Composition of the Sea Water, in: The Sea, edited by: Hill, M. N., Vol. 2, Interscience Publishers, New York, 26–77, 1963.
Regnier, P., Mouchet, A., Wollast, R., and Ronday, F.: A discussion of methods for estimating residual fluxes in strong tidal estuaries, Cont. Shelf Res., 18, 1543–1571, https://doi.org/10.1016/S0278-4343(98)00071-5, 1998.
Regnier, P., Arndt, S., Goossens, N., Volta, C., Laruelle, G. G., Lauerwald, R., and Hartmann, J.: Modelling Estuarine Biogeochemical Dynamics: From the Local to the Global Scale, Aquat. Geochem., 19, 591–626, https://doi.org/10.1007/s10498-013-9218-3, 2013.
REPHY: French Observation and Monitoring program for Phytoplankton and Hydrology in coastal waters. Metropolitan data, SEANOE [data set], https://doi.org/10.17882/47248, 2021.
Roubeix, V., Rousseau, V., and Lancelot, C.: Diatom succession and silicon removal from freshwater in estuarine mixing zones: From experiment to modelling, Estuar. Coast. Shelf S., 78, 14–26, https://doi.org/10.1016/j.ecss.2007.11.007, 2008.
Romero, E., Garnier, J., Lassaletta, L., Billen, G., Le Gendre, R., Riou, P., and Cugier, P.: Large-scale patterns of river inputs in southwestern Europe: Seasonal and interannual variations and potential eutrophication effects at the coastal zone, Biogeochemistry, 113, 481–505, https://doi.org/10.1007/s10533-012-9778-0, 2013.
Romero, E., Le Gendre, R., Garnier, J., Billen, G., Fisson, C., Silvestre, M., and Riou, P.: Long-term water quality in the lower Seine: Lessons learned over 4 decades of monitoring, Environ. Sci. Policy, 58, 141–154, https://doi.org/10.1016/j.envsci.2016.01.016, 2016.
Romero, E., Garnier, J., Billen, G., Ramarson, A., Riou, P., and Le Gendre, R.: Modeling the biogeochemical functioning of the Seine estuary and its coastal zone: Export, retention, and transformations, Limnol. Oceanogr., 64, 895–912, https://doi.org/10.1002/lno.11082, 2019.
Savenije, H. H. G.: Salinity and tides in alluvial estuaries, available at: http://hubertsavenije.files.wordpress.com/2014/01/salinityandtides2_21.pdf (last access: 20 September 2020), 2012.
Savoye, N., David, V., Morisseau, F., Etcheber, H., Abril, G., Billy, I., Charlier, K., Oggian, G., Derriennic, H., and Sautour, B.: Origin and composition of particulate organic matter in a macrotidal turbid estuary: The Gironde Estuary, France, Estuar. Coast. Shelf S., 108, 16–28, https://doi.org/10.1016/j.ecss.2011.12.005, 2012.
Sebilo, M., Billen, G., Mayer, B., Billiou, D., Grably, M., Garnier, J., and Mariotti, A.: Assessing nitrification and denitrification in the seine river and estuary using chemical and isotopic techniques, Ecosystems, 9, 564–577, https://doi.org/10.1007/s10021-006-0151-9, 2006.
Seitzinger, S. P.: Denitrification in freshwater and coastal marine ecosystems: Ecological and geochemical significance, Limnol. Oceanogr., 33, 702–724, https://doi.org/10.4319/lo.1988.33.4part2.0702, 1988.
Soetaert, K., Middelburg, J. J., Herman, P. M. J., and Buis, K.: On the coupling of benthic and pelagic biogeochemical models, Earth-Sci. Rev., 51, 173–201, https://doi.org/10.1016/S0012-8252(00)00004-0, 2000.
Soletchnik, P., Ropert, M., Mazurié, J., Gildas Fleury, P., and Le Coz, F.: Relationships between oyster mortality patterns and environmental data from monitoring databases along the coasts of France, Aquaculture, 271, 384–400, https://doi.org/10.1016/j.aquaculture.2007.02.049, 2007.
Thouvenin, B., Gonzalez, J., and Boutier, B.: Modelling of pollutant behaviour in estuaries: Application to cadmium in the Loire estuary, Mar. Chem., 58, 147–161, https://doi.org/10.1016/S0304-4203(97)00031-5, 1997.
Toublanc, F., Brenon, I., Coulombier, T., and Le Moine, O.: Fortnightly tidal asymmetry inversions and perspectives on sediment dynamics in a macrotidal estuary (Charente, France), Cont. Shelf Res., 94, 42–54, https://doi.org/10.1016/j.csr.2014.12.009, 2015.
Urban Wastewater Treatment Directive: UWWTD (Urban wastewater treatment Directive) (1991) 91/271/CEE du Conseil, du 21 mai 1991, relative au traitement des eaux urbaines résiduaires, https://eur-lex.europa.eu/legal-content/EN/TXT/?uri=celex:31991L0271 (last access: 7 February 2022) 1991.
Vanderborght, J. P., Folmer, I. M., Aguilera, D. R., Uhrenholdt, T., and Regnier, P.: Reactive-transport modelling of C, N, and O2 in a river-estuarine-coastal zone system: Application to the Scheldt estuary, Mar. Chem., 106, 92–110, https://doi.org/10.1016/j.marchem.2006.06.006, 2007.
Verri, G., Mahmoudi Kurdistani, S., Coppini, G., and Valentini, A.: Recent Advances of a Box Model to Represent the Estuarine Dynamics: Time-Variable Estuary Length and Eddy Diffusivity, J. Adv. Model. Earth Sy., 13, 1–16, https://doi.org/10.1029/2020MS002276, 2021.
Vilas, F., Rubio, B., Rey, D., and Bernabeu, A. M.: Estuary, in: Encyclopedia of Planetary Landforms, 1–7, Springer, New York, NY, https://doi.org/10.1007/978-1-4614-3134-3, 2021.
Volta, C., Arndt, S., Savenije, H. H. G., Laruelle, G. G., and Regnier, P.: C-GEM (v 1.0): a new, cost-efficient biogeochemical model for estuaries and its application to a funnel-shaped system, Geosci. Model Dev., 7, 1271–1295, https://doi.org/10.5194/gmd-7-1271-2014, 2014.
Volta, C., Laruelle, G. G., Arndt, S., and Regnier, P.: Linking biogeochemistry to hydro-geometrical variability in tidal estuaries: a generic modeling approach, Hydrol. Earth Syst. Sci., 20, 991–1030, https://doi.org/10.5194/hess-20-991-2016, 2016a.
Volta, C., Laruelle, G. G., and Regnier, P.: Regional carbon and CO2 budgets of North Sea tidal estuaries, Estuar. Coast. Shelf S., 176, 76–90, https://doi.org/10.1016/j.ecss.2016.04.007, 2016b.
Wild-Allen, K., Skerratt, J., Whitehead, J., Rizwi, F., and Parslow, J.: Mechanisms driving estuarine water quality: A 3D biogeochemical model forinformed management, Estuar. Coast. Shelf S., 135, 33–45, https://doi.org/10.1016/j.ecss.2013.04.009, 2013.