the Creative Commons Attribution 4.0 License.
the Creative Commons Attribution 4.0 License.
 | 06 Apr 2023
Post-flooding disturbance recovery promotes carbon capture in riparian zones
Yihong Zhu
Ruihua Liu
Huai Zhang
Shaoda Liu
Zhengfeng Zhang
Fei-Hai Yu
Timothy G. Gregoire
Vegetation, water, and carbon dioxide have complex interactions on carbon mitigation in vegetation–water ecosystems. As one of the major global change drivers of carbon sequestration, flooding disturbance is a fundamental but poorly discussed topic to date. The aquatic and associated riparian systems are highly dynamic vegetation–water carbon capture systems driven by fluvial processes such as flooding. However, their global carbon offset potential is largely unknown. This study examines daily CO2 perturbations under flooding disturbance in the river (fluvial area) and associated riparian areas with 2 year in situ observations along the Lijiang. We find that, though the submerged riparian area behaved as a carbon source during the flooding season (CO2 flux: 2.790 ), the riparian area and the fluvial area as a whole transformed from a carbon source in pre-flooding season (1.833 ) to a carbon sink after recovery in post-flooding season (−0.592 ). The fluvial area sequestered carbon (−0.619 ) in post-flooding season instead of releasing carbon as in pre-flooding season (2.485 ). Also, the carbon sequestration capacity of the riparian area was enhanced in post-flooding season (pre-flooding season: −0.156 , post-flooding season: −0.500 ). We suggest that post-disturbance recovery of riparian vegetation played a vital role in this transformation, due to its stronger carbon uptake capacity after recovery from the flooding disturbances. The findings shed light on the quantitative modelling of the riparian carbon cycle under flooding disturbance and underlined the importance of the proper restoration of riparian systems to achieve global carbon offset.
- Article
(4377 KB) - Full-text XML
- BibTeX
- EndNote


Climate change issues stemming from anthropogenic carbon emissions have strengthened dramatically, threatening ecosystem stability and biodiversity (Li et al., 2022; Wang et al., 2020). The increasing atmospheric CO2 originating from fossil fuel combustion and industrial activities can be regulated by plant metabolism (photosynthesis and respiration) and soil microbial activities (Zheng et al., 1998). In general, the net carbon emission strongly depends on the balance between the production and consumption processes in the vulnerable natural ecosystem (Pugh et al., 2019).
Aquatic and riparian systems are highly dynamic systems linked by fluvial processes (e.g. flooding and deposition of alluvial soil) (Naiman and Decamps, 1997; Steiger et al., 2005). Riparian zones are generally defined as complex terrestrial assemblages of plants and other organisms adjacent to an aquatic environment. For instance, the interface between aquatic and terrestrial environments in coniferous forests forms a narrow riparian zone (Gregory et al., 1991). Riparian zones are of great importance in carbon cycling, which is associated with the production and consumption of CO2 and methane (CH4) (Zhang et al., 2016; Allen et al., 2007; Liu et al., 2021).
A riparian zone is often considered as a sink for CO2 through photosynthetic assimilation of CO2 in the atmosphere, but disturbance may turn it from a carbon sink to a carbon source. Seasonal periodic flooding is one of the most common environmental disturbances in riparian zones. Floods can be natural, but human activity such as the construction of dams increasingly causes controlled floods (Darrel Jenerette and Lal, 2005; Dynesius and Nilsson, 1994). Flooding disturbance strongly influences the biotic characteristics of riparian assemblages (Anderson et al., 2020) as well as the carbon cycle. Flooding could increase soil respiration and enzymatic degradation rate (Wilson et al., 2011). It was found that the rate of CO2 emission in riparian wetlands is higher than that in neighbouring hillslope grasslands (Anderson et al., 2020). Liu et al. (2021) demonstrated that high plant and soil respiration in riparian wetlands lead to larger amounts of CO2 emission in wet season (335–2790 ) than in dry season (72–387 ) (Liu et al., 2021). Also, the short-term anaerobic conditions caused by flooding may increase the production of methane because of the strengthened methanogenesis in riparian soils (Hassanzadeh et al., 2019; Hondula et al., 2021; Morse et al., 2012; Le Mer and Roger, 2001; Thorp et al., 2006).
The influence of flooding disturbance would also depend on the flooding characteristics and the properties of riparian soils. Hirota et al. (2007) found that temporal variations of the greenhouse gas fluxes were strongly manipulated by water-level fluctuations in the sandy shore and by soil temperature in the salt marsh. The duration of flooding was also considered an important factor for riparian carbon dynamics and microbial community structure (Wilson et al., 2011). The spatial heterogeneity of soil properties would also affect the composition and diversity of bacterial communities in riparian zones and thus may influence the riparian carbon cycle under flooding disturbance (Wang et al., 2019b; Wilson et al., 2011).
Strong seasonality for different greenhouse gas emissions has been detected in previous studies (Gaughan and Waylen, 2012; Allen et al., 2007). With flooding disturbance, riparian vegetation plays an indispensable role in sequestering carbon (Maraseni and Mitchell, 2016), and the variations in riparian vegetation communities are expected to define the ecological role of riparian zones in the carbon cycle. During flooding season, flooding submergence may impede gas diffusion and decrease light intensity, leading to high mortality and limited growth of plant species (Colmer and Voesenek, 2009). This raises the possibility of elevated carbon (including methane and carbon dioxide) emissions and reduced carbon sequestration from riparian zones, shifting the role of riparian zones from a carbon sink to a carbon source. Conversely, as riparian species adapt to flooding submergence and recover from flooding, riparian zones may gradually return to the initial status or even promote CO2 capture. Previous studies found that riparian vegetation may increase their leaf gas exchange in response to submergence stress so as to cope with oxygen limitation (Huang et al., 2017; Mommer et al., 2006; Liu et al., 2020). Besides, inundation depth increased the reed density, height, leaf area index, and biomass and thus decreased the global warming potential during the growing season (Zhao et al., 2020). Therefore, a riparian zone may oscillate between carbon source and sink depending on flooding. It raises the open question of whether riparian zones quantitatively promote or hinder carbon capture overall.
Riparian zones are believed to have considerable potential to contribute to biodiversity, carbon sequestration, and several other ecosystem services. As a traditional practice, riparian vegetation has been cleared for crop and pasture production in numerous places worldwide, leading to increases in greenhouse gas emissions (Maraseni and Cockfield, 2011). It is noteworthy that proper and efficient restoration of the riparian zones is fundamental for the proper functioning of riparian ecosystem services. Thus, it has been listed as a priority in the Intergovernmental Panel on Climate Change (IPCC) community (Bullock et al., 2011). However, the current research on the riparian carbon sequestration under flooding disturbance is insufficient. There has been some modelling work about the riparian carbon stock but less on the carbon flux. For instance, Dybala et al. (2019) modelled the change in carbon stock as a function of vegetation age, considering the effects of climate and whether or not the riparian forest had been actively planted (Dybala et al., 2019). One limitation for models like the Riparian Ecosystem Management Model (REMM) or other riparian models is that they require a large number of site-specific parameters, many of which are often modelled using other models as inputs (Vidon et al., 2019). In addition to climatic factors, factors such as floodplain width; flow regime; frequency of inundation; and the presence of dams, diversions, and levees also need to be considered when modelling the riparian carbon flux with the disturbance of flooding (Sutfin et al., 2016).
In order to figure out how floods affect the balance between carbon emission and sequestration in riparian areas, we quantified the vertical CO2 fluxes at the soil–air interface (riparian area) and water–air interface (fluvial area) during the flooding season and non-flooding seasons (pre-flooding season and post-flooding season) based on 2 year in situ measurements along the Lijiang. Considering an overall small contribution of CH4 to the carbon balance of riparian zones (Liu et al., 2021; Vidon et al., 2019), only CO2 fluxes were measured in analysis. We establish that a riparian system promotes carbon capture despite enhanced carbon releases during flooding periods, and its capacity is directly related to the resilience and post-disturbance recovery of riparian vegetation. We suggest that promoting the recovery of riparian systems and establishing high flooding-tolerant vegetation coverage is key to promoting carbon capture in the context of increasing flood risks under climate change.
2.1 In situ observation setup
Our study site is downstream of the 164 km long Lijiang in the Pearl River Basin in northwestern Guangxi Zhuang Autonomous Province, Southwest China ( N, E; Fig. A1). The Lijiang has a typical karst landscape, with widely exposed carbonate rocks (Wang et al., 2019b). The river from Guilin to Yangshuo is the most typical karst development area. The river channel is composed of sand and pebbles, and the soil type is red loam with a high sand content (Wang et al., 2019b). This area experiences a monsoon-based, humid subtropical climate, where the mean annual rainfall is 1900 mm and the annual temperature ranges from 7.9 to 28.0 ∘C. In the dry season (normally September to March of the following year), the minimum daily average flow discharge is often below 20 m3 s−1. Therefore, drought stress profoundly influences the early-stage development of riparian species. By contrast, in the flooding season (April–August), discharges of over 1000 m3 s−1 are common during flood events, inner islands are completely submerged, and some riparian species cease to grow or are destroyed. The soils of the Lijiang riparian zone are sand-based, with sand contents ranging from 74.99 % to 88.44 %; silt and clay contents are lower, accounting for approximately 10 % (Wang et al., 2019b; Lu and Wang, 2015). With the decrease of inundation frequency, the sand content is found to decrease, while the clay and silt content increased gradually (Wang et al., 2019b). Soil pH is around 6.99–7.71, and soil total nitrogen is around 0.93–1.40 (g kg−1) (Wang et al., 2019b). Different vegetation zones can further influence the chemical properties of soils (Lu and Wang, 2015).
2.2 Experiment design
2.2.1 Gas collection
Four transects were established on one island downstream of the Lijiang (Fig. A1). The distance between each transect was approximately 3 m. Four subplots spaced 5–8 m apart were deployed in each transect, perpendicular to the waterlines, and extended from the edge of the water body to the upper area. Site selection and chamber placement minimized differences in the microclimate among chamber stations. CO2 in four 50 cm×50 cm subplots along each transect was sampled by static chamber techniques. Four static chambers were used at each site (Fig. A1). Chambers were positioned in the same location for the monitoring phase. On the river, floating static chambers were used (Sun et al., 2012) and were set up on shallow water and deep water. The floating static chamber was a cylindrical chamber (of radius 50 cm and height 65 cm) with a floating ring (about 20 cm) around the bottom of the chamber to keep it floating on the water, and it was thus sealed by the water. On the land during non-flooding seasons, the terrestrial static chambers (length 50 cm, width 50 cm, and height 50 cm) were used and were set up on riparian areas with vegetation and without vegetation. The terrestrial static chamber was put on a stainless-steel underside base (length 50 cm, width 50 cm, and height 15 cm) instead of setting directly on the ground. The underside base increased the chamber's size and prevented damage to the vegetation inside (Sun et al., 2013). There was a groove on the top of the underside base, and the upper portion of chamber was designed to be put into this groove. By adding water to the groove, the whole setting was sealed (Sun et al., 2012, 2013). Both the floating static chamber and the terrestrial static chamber were covered by foam and reflective aluminium, which can easily reflect the heat from sunlight and thus prevent rapid temperature changes or the temperature becoming too high in the chamber (Søvik and Kløve, 2007). Also, the chambers contained two exhaust fans, a thermometer, and a tube inside. A syringe was used to collect gas samples from the tube at intervals of 0, 10, 20, and 30 min. For 24 h monitoring, samples were taken every 4 h (a total of 6 times per day starting at 10:00 LT and finishing at 06:00 LT the next day) on 1 d in April, August, and October (covering pre-flooding season, flooding season, and post-flooding season) in 2014 (both riparian area and river) and 2016 (river). In other words, diel data were taken at the 0, 10, 20, and 30 min mark of hours 10:00, 14:00, 18:00, 22:00, 02:00, and 06:00 LT.
2.2.2 Determination of CO2 flux and hydro-environment conditions
Gas samples were collected by a syringe from the tube of the chamber and were instantly transferred to airtight glass bottles (20 mL, Agilent5190-2286). All samples were analysed within 3 d. The CO2 concentration was measured using gas chromatography (Agilent7890A) equipped with an electron capture detector (ECD) and a flame ionization detector (FID) (Agilent Technologies, 2010). The measurements were conducted by Pony Testing International Group Co. Ltd (300887:CH). Standard CO2 gases (with concentrations of 0 and 10 000 pm, respectively) were used for method calibration. The calculation formula of CO2 flux is
where F represents the gas flux (), M is the molar mass, V0 represents the normal state of molar volume (22.4 L mol−1), P0 and T0 are the pressure and temperature of the standard conditions (1013.25 hPa, 273.15 K) for gases, and is the slope of the regression curve as gas concentration is variable with time. The height of the chamber (H, cm), in situ air pressure (P, hPa), and air temperature (T, K) were recorded during the sampling as well. The all-day CO2 flux was calculated by integrating the diel CO2 flux of different measuring times. The environmental information, including total organic carbon (TOC) and total inorganic carbon (TIC) downstream (Yangshuo Gauge) of the Lijiang, was also recorded. Meanwhile, the water level was recorded hourly during the experiment period.
2.2.3 Vegetation inventory and flooding tolerant experiment
Vegetation inventory was conducted by three 15 m×5 m transects along with this field site. Coverage, number of ramets, and height are measured. After the field inventory, about 300 seeds of C. aciculatus, which was the dominant riparian species after flooding, were sown in planting trays filled with peat (Pindstrup Seeding; Pindstrup Mosebrug A/S, Pindstrup, Denmark). Seeds were bought from Forest Science Co, Ltd. of Beijing Forestry University. Eight grass plants with one single ramet were transplanted in the experimental pots. In total, 178 ramets with similar sizes of each species were selected for the experiment, of which 18 were randomly used to obtain their initial length and dry mass, and the remaining 80 ramets were used for the experiments. The initial ramet length of C. aciculatus was 9.56 ± 0.18 cm, and the dry mass was 38.56 ± 5.36 mg. The experiment lasted 3 months, from 1 August–1 November. The mean temperature and relative humidity were 26.21 ± 0.33 ∘C and 59.02 % ± 1.46 %, respectively. Sufficient tap water was added to each container to maintain the plant submerged in the water. At harvest, new ramets produced by each initial one were interconnected by aboveground stolon, so we could harvest and measure the growth attributes of plants in each treatment separately. We counted the number of ramets and weighed each plant's dry leaf, rhizome, and biomass in each container. All plant parts were oven-dried at 70 ∘C for 72 h before weighing. The collection of materials complied with relevant institutional, national, and international guidelines and legislation.
2.2.4 Annual riparian and river CO2 emission calculation
We are interested in whether or under what conditions the riparian area and the fluvial area as a whole can achieve carbon neutralization (which means the net carbon emission is zero) at the annual level with flooding disturbance. We take flooding disturbance into account by dividing the whole year into pre-flooding season, flooding season, and post-flooding season. We assume that flooding events happen at an annual timescale and consider the time that flooding would happen as flooding season. The occurrence of extreme weather like rainstorms or frost is not considered here. Here, we define the riparian area as the area that would be submerged during the flooding season but exposed during non-flooding seasons. Fluvial area refers to the river in non-flooding seasons and the river plus the flooded riparian area during the flooding season. Field investigation showed that the riparian area makes up 25 % of the whole river width (riparian plus fluvial), and the vegetation coverage is about 60 %. Thus, the annual riparian CO2 emission is calculated as the sum of emissions in pre-flooding season. flooding season and post-flooding season by the following equation:
where Cannual is the annual expected carbon emission (Cannual=0 means the whole region reaches carbon neutralization at the annual level), Ci,j is the annual CO2 emission of the fluvial or riparian area in different seasons ( refer to the fluvial and riparian area, respectively; refer to pre-flooding season, flooding season, and post-flooding season, respectively), Wi,j is the width of the fluvial area or riparian area in different seasons, Dj is the number of days of the corresponding season, and ai,j is the all-day CO2 flux of the fluvial area or riparian area in different seasons. Especially during flooding season, the width of riparian area (W1,2) is 0 m, because all the riparian area is submerged. The all-day CO2 flux of the riparian area in pre- (a2,1) or post-flooding season (a2,3) is calculated by the following equation:
where aveg is the all-day CO2 flux of the vegetation area, asoil is the CO2 flux of the bare soil area, and p is the vegetation coverage.
2.2.5 Data analysis
For riparian areas, a two-way repeated-measurement ANOVA was employed to examine the effects of vegetation (with vegetation vs. without vegetation; between-subject factor) and time (measuring times in 1 d; within-subject factor) on the CO2 flux in two sampling stages (April: pre-flooding, and October: post-flooding). For fluvial areas, a two-way repeated-measurement ANOVA was used to examine the effects of sampling position (with vegetation vs. without vegetation or under water surface; between-subject factor) and time (measuring times in 1 d; within-subject factor) on CO2 flux in the sampling stages (April: pre-flooding, August: during flooding, and October: post-flooding). The P values were calculated with the null hypothesis that the CO2 flux of the riparian area or fluvial area is not influenced by the factors mentioned. Before the analyses, the homogeneity of variance and normality are also examined. All data analyses were performed by the SPSS statistical software package (https://www.ibm.com/products/spss-statistics (last access: 30 March 2023), version 22.0, Chicago, IL, USA). The effects were considered significant if the P value<0.05.
3.1 Vegetation overall promotes carbon capture despite a weak carbon release during the pre-flooding nights
We assume that diel CO2 flux follows similar patterns as measured on the selected days during the pre-flooding and post-flooding season. Based on this assumption, we compared the diel CO2 flux of pre-flooding season and post-flooding season. In order to evaluate the effect of vegetation on riparian CO2 flux, we directly measured the CO2 fluxes in the riparian area with and without vegetation (bare soil) in different seasons.
Significant diel variations in CO2 fluxes were observed in the riparian area in both pre-flooding season (April: low water level before flooding) and post-flooding season (October: resumed low water level after flooding; Table A1). Within a day, the carbon sequestration in the riparian area with vegetation peaked at 10:00 LT in April and at 14:00 LT in October (April: −87.89 ; October: −104.33 ), and the maximum carbon emission occurred at 18:00 LT (April: 61.49 ; October: 34.75 ; Fig. 1). However, the time periods that the riparian area with vegetation functions as a carbon sink differed in pre-flooding and post-flooding season. In April, carbon sequestration in the riparian area with vegetation was observed between 10:00 and 14:00 LT, while in October, the carbon sequestration was observed between 06:00 to 14:00 LT (Fig. 1). Thus, in post-flooding season, the riparian area with vegetation sequestrated carbon for a longer time. Indeed, the vegetation area's all-day CO2 flux was 0.358 in April but was −0.680 in October, transferring from a carbon source to a carbon sink at the daily level.
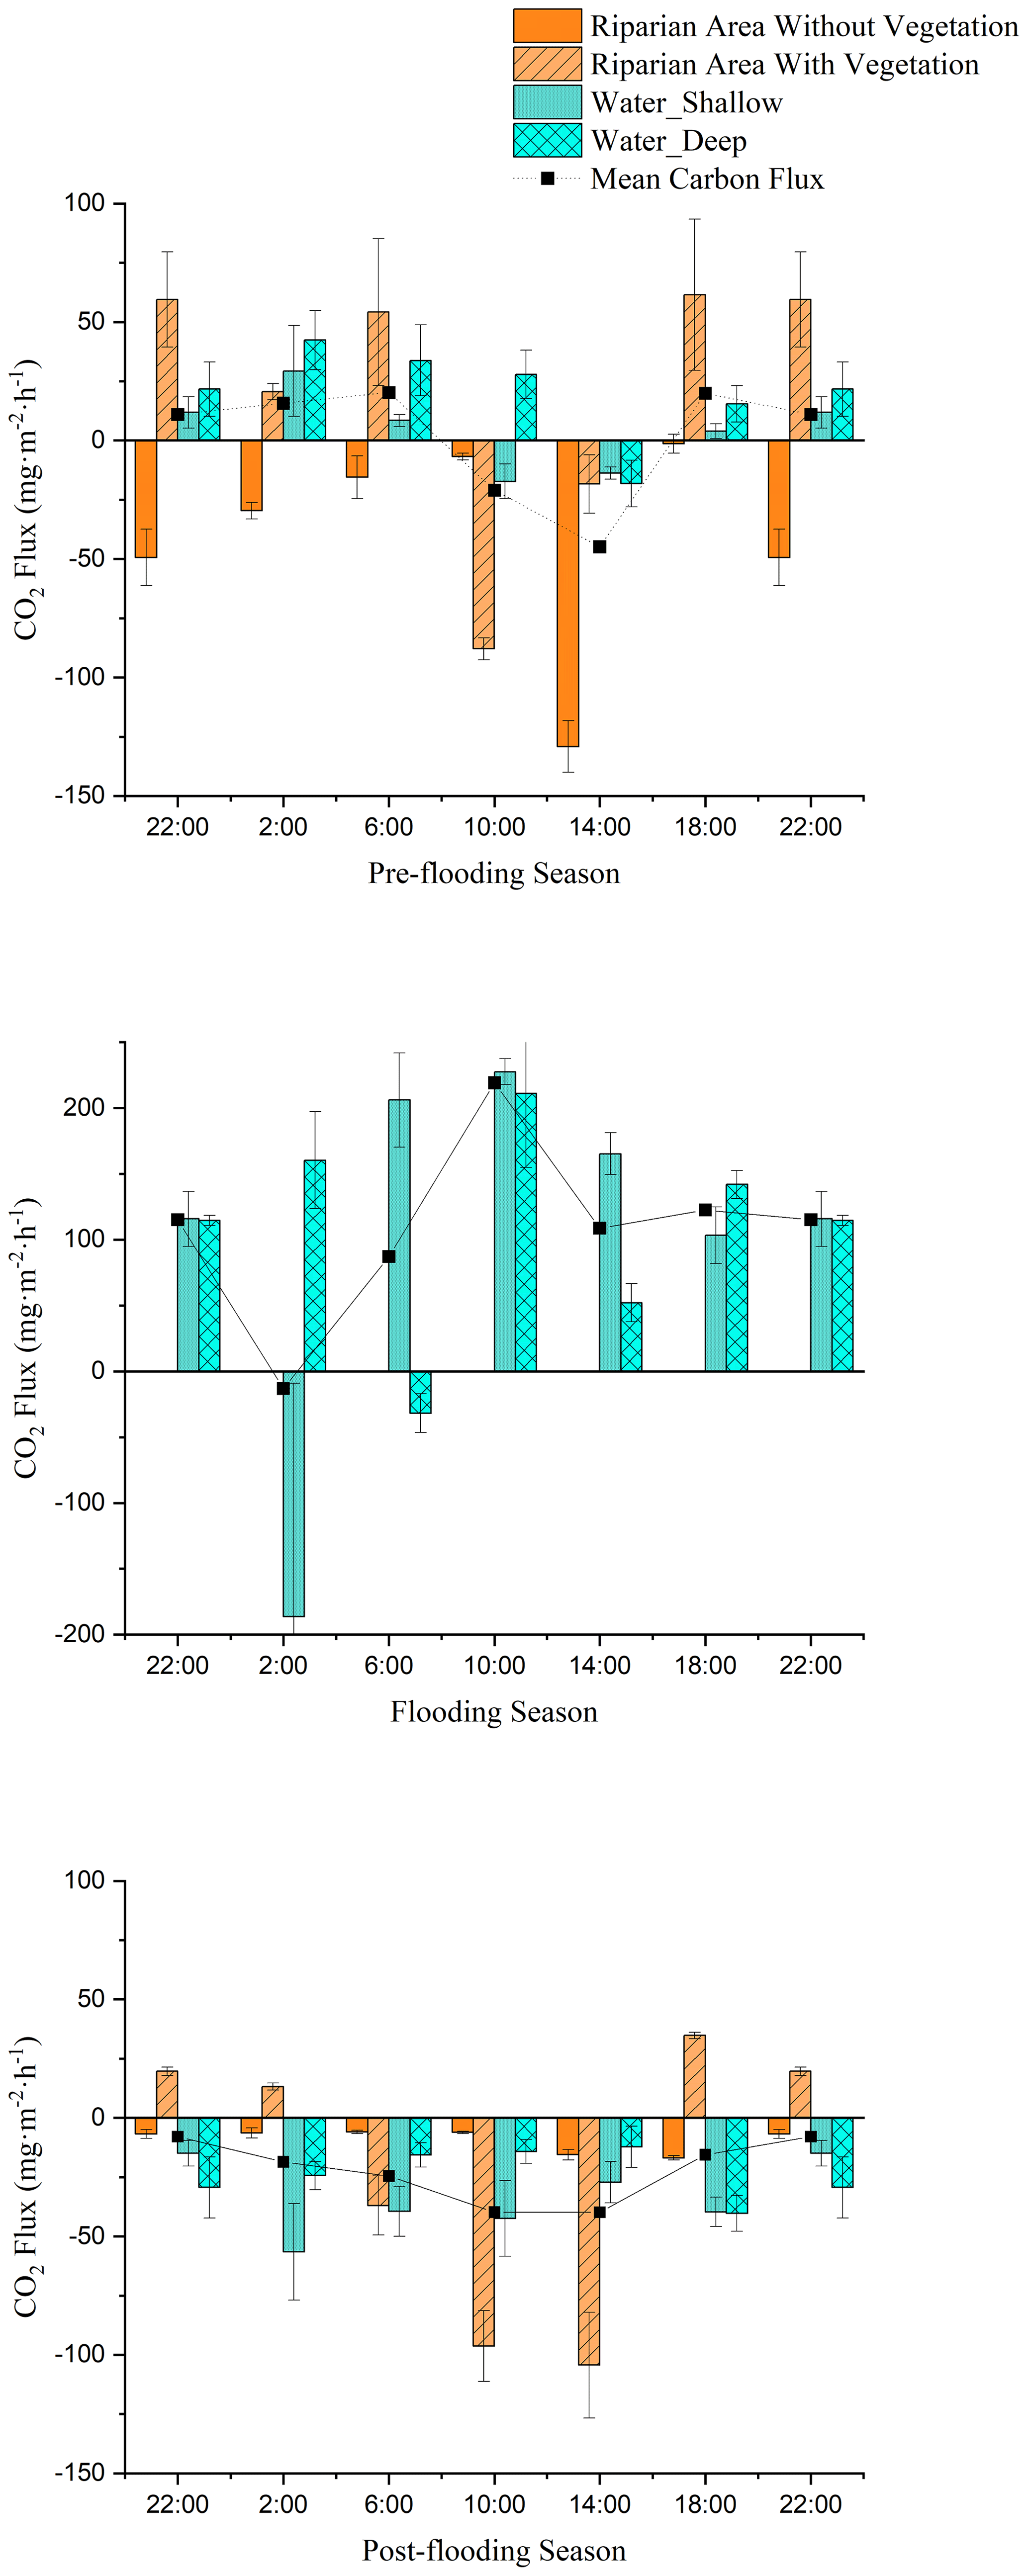
Figure 1CO2 fluxes in the riparian area (with vegetation and without vegetation) and fluvial area (shallow area with vegetation and deep area without vegetation) during pre-flooding season (measured in April), flooding season (August), and post-flooding season (October).
Since the flux of vegetated area included fluxes from both the soil below and the vegetation above, we subtracted the CO2 flux of bare soil from the CO2 flux of vegetated area to measure how the cover of vegetation improves or reduces the carbon sequestration. In April, the difference between the area with and without vegetation was 0.128 , indicating that vegetation cover actually reduced carbon sequestration and contributed to carbon emission. In October, the difference was −0.453 , indicating that the capacity of vegetation to fix carbon improved after submergence.
The riparian area is composed of vegetated area and bare soil area. During the field investigation, we found that the vegetation coverage in the Lijiang riparian area is about 60 %. Using vegetation coverage as the weight, we can get the accumulated CO2 flux of the riparian area (Sect. 2.2.4, Eq. 3). Within a day, the carbon sequestration in the riparian area peaked at 14:00 LT (April: −62.680 ; October: −68.813 ), and the maximum carbon emission occurred at 18:00 LT (April: 36.347 ; October: 14.110 ; Fig. 1). In both April and October, the all-day carbon fluxes in the riparian area were negative, indicating that the riparian area acted as a carbon sink in non-flooding season (April: −0.156 , October: −0.500 ). The carbon uptake in October, which represented post-flooding season, was higher. Overall, we found that in the post-flooding season the riparian vegetation can sequestrate CO2 for a longer time and fix a higher amount of carbon. Thus, even though the all-day CO2 flux of bare soil changed from −0.927 to −0.231 , showing a reduced capacity of carbon sequestration after flooding, the whole riparian area still turned out to be a carbon sink in the post-flooding season.
3.2 Flooding causes transient carbon emission in fluvial area which turns to sequester carbon during post-flooding season
During the flooding, the riparian areas with and without vegetation were submerged, so only the carbon fluxes from the fluvial areas (water–air interfaces) were measured (Fig. 1b). The water–air CO2 flux is calculated as the mean of the CO2 flux in deep water and shallow water, considering their coverage is almost half and half. Significant diel variations in CO2 fluxes were also observed in fluvial area (P<0.01), but the CO2 fluxes from shallow water and deep water did not have significant differences (P>0.05; Table A2). By analysing and calculating the all-day CO2 flux, we found that the fluvial area turned from carbon sources in pre-flooding season and during flooding season to a carbon sink in post-flooding season. In 2014 and 2016, the fluvial area appeared to be carbon sources before and during flooding, with a CO2 flux ranging from 0.291–4.678 (Fig. 2). However, after flooding, the river became a carbon sink (Fig. 2). Thus, after flooding, both the riparian area and the fluvial area turned out to be a carbon sink.

Figure 2All-day CO2 flux with low water level in pre-flooding season, high water level during flooding season, and resumed low water level in post-flooding season in 2014 (blank) and 2016 (dashed). The upward arrow refers to carbon emission, and the downward arrow refers to carbon uptake.
Based on the vegetation coverage and the ratio of riparian area width to river width in flooding season, we can accumulate the CO2 flux of the riparian area and the fluvial area as a whole (Sect. 2.2.4). The CO2 flux of the whole region was 1.833 in pre-flooding season and −0.592 in post-flooding season, which indicated that the whole region turned from a carbon source to a carbon sink after flooding.
3.3 Flooding transiently decreases vegetation diversity and promotes the establishment of new dominant species
Vegetation plays an essential role in the carbon sequestration of a riparian area. We hypothesize that the established riparian vegetation species differed, which leads to different vegetation-related carbon fluxes between the pre- and post-flooding periods. We observed that species richness was severely disturbed after flooding. The species richness index decreased from 2.945 in pre-flooding season to 1.695 in post-flooding season (Tables 1 and A3). The dominant species also changed. In pre-flooding season, Cynodon dactylon (Linn.) Pers. was dominant, having a wide distribution and high coverage in the riparian areas. In post-flooding season, Chrysopogon aciculatus (Retz.) Trin. (C. aciculatus) and Polygonum lapathifolium L. were prevalent in the surviving species (Table 1). In the 90 d submergence-controlled experiment, C. aciculatus also survived, showing good tolerance of flooding submergence, though both individual biomass and the total number of C. aciculatus decreased (Fig. 3).
Table 1The species richness and dominant species change from pre-flooding season to post-flooding season.
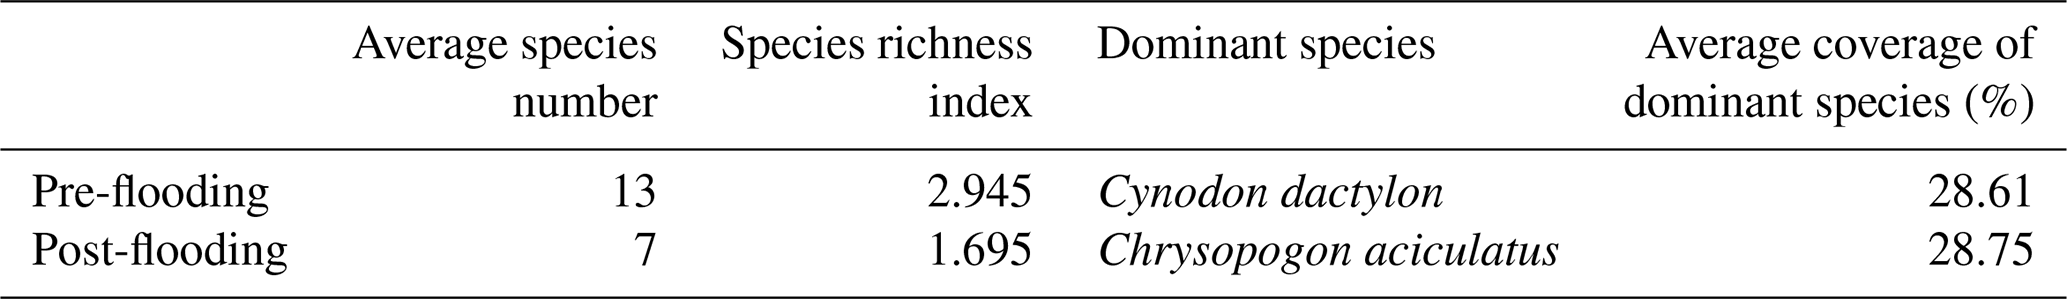
Note: The species number listed here is the average number by plots. The whole list of plant species can be found in Table A3.
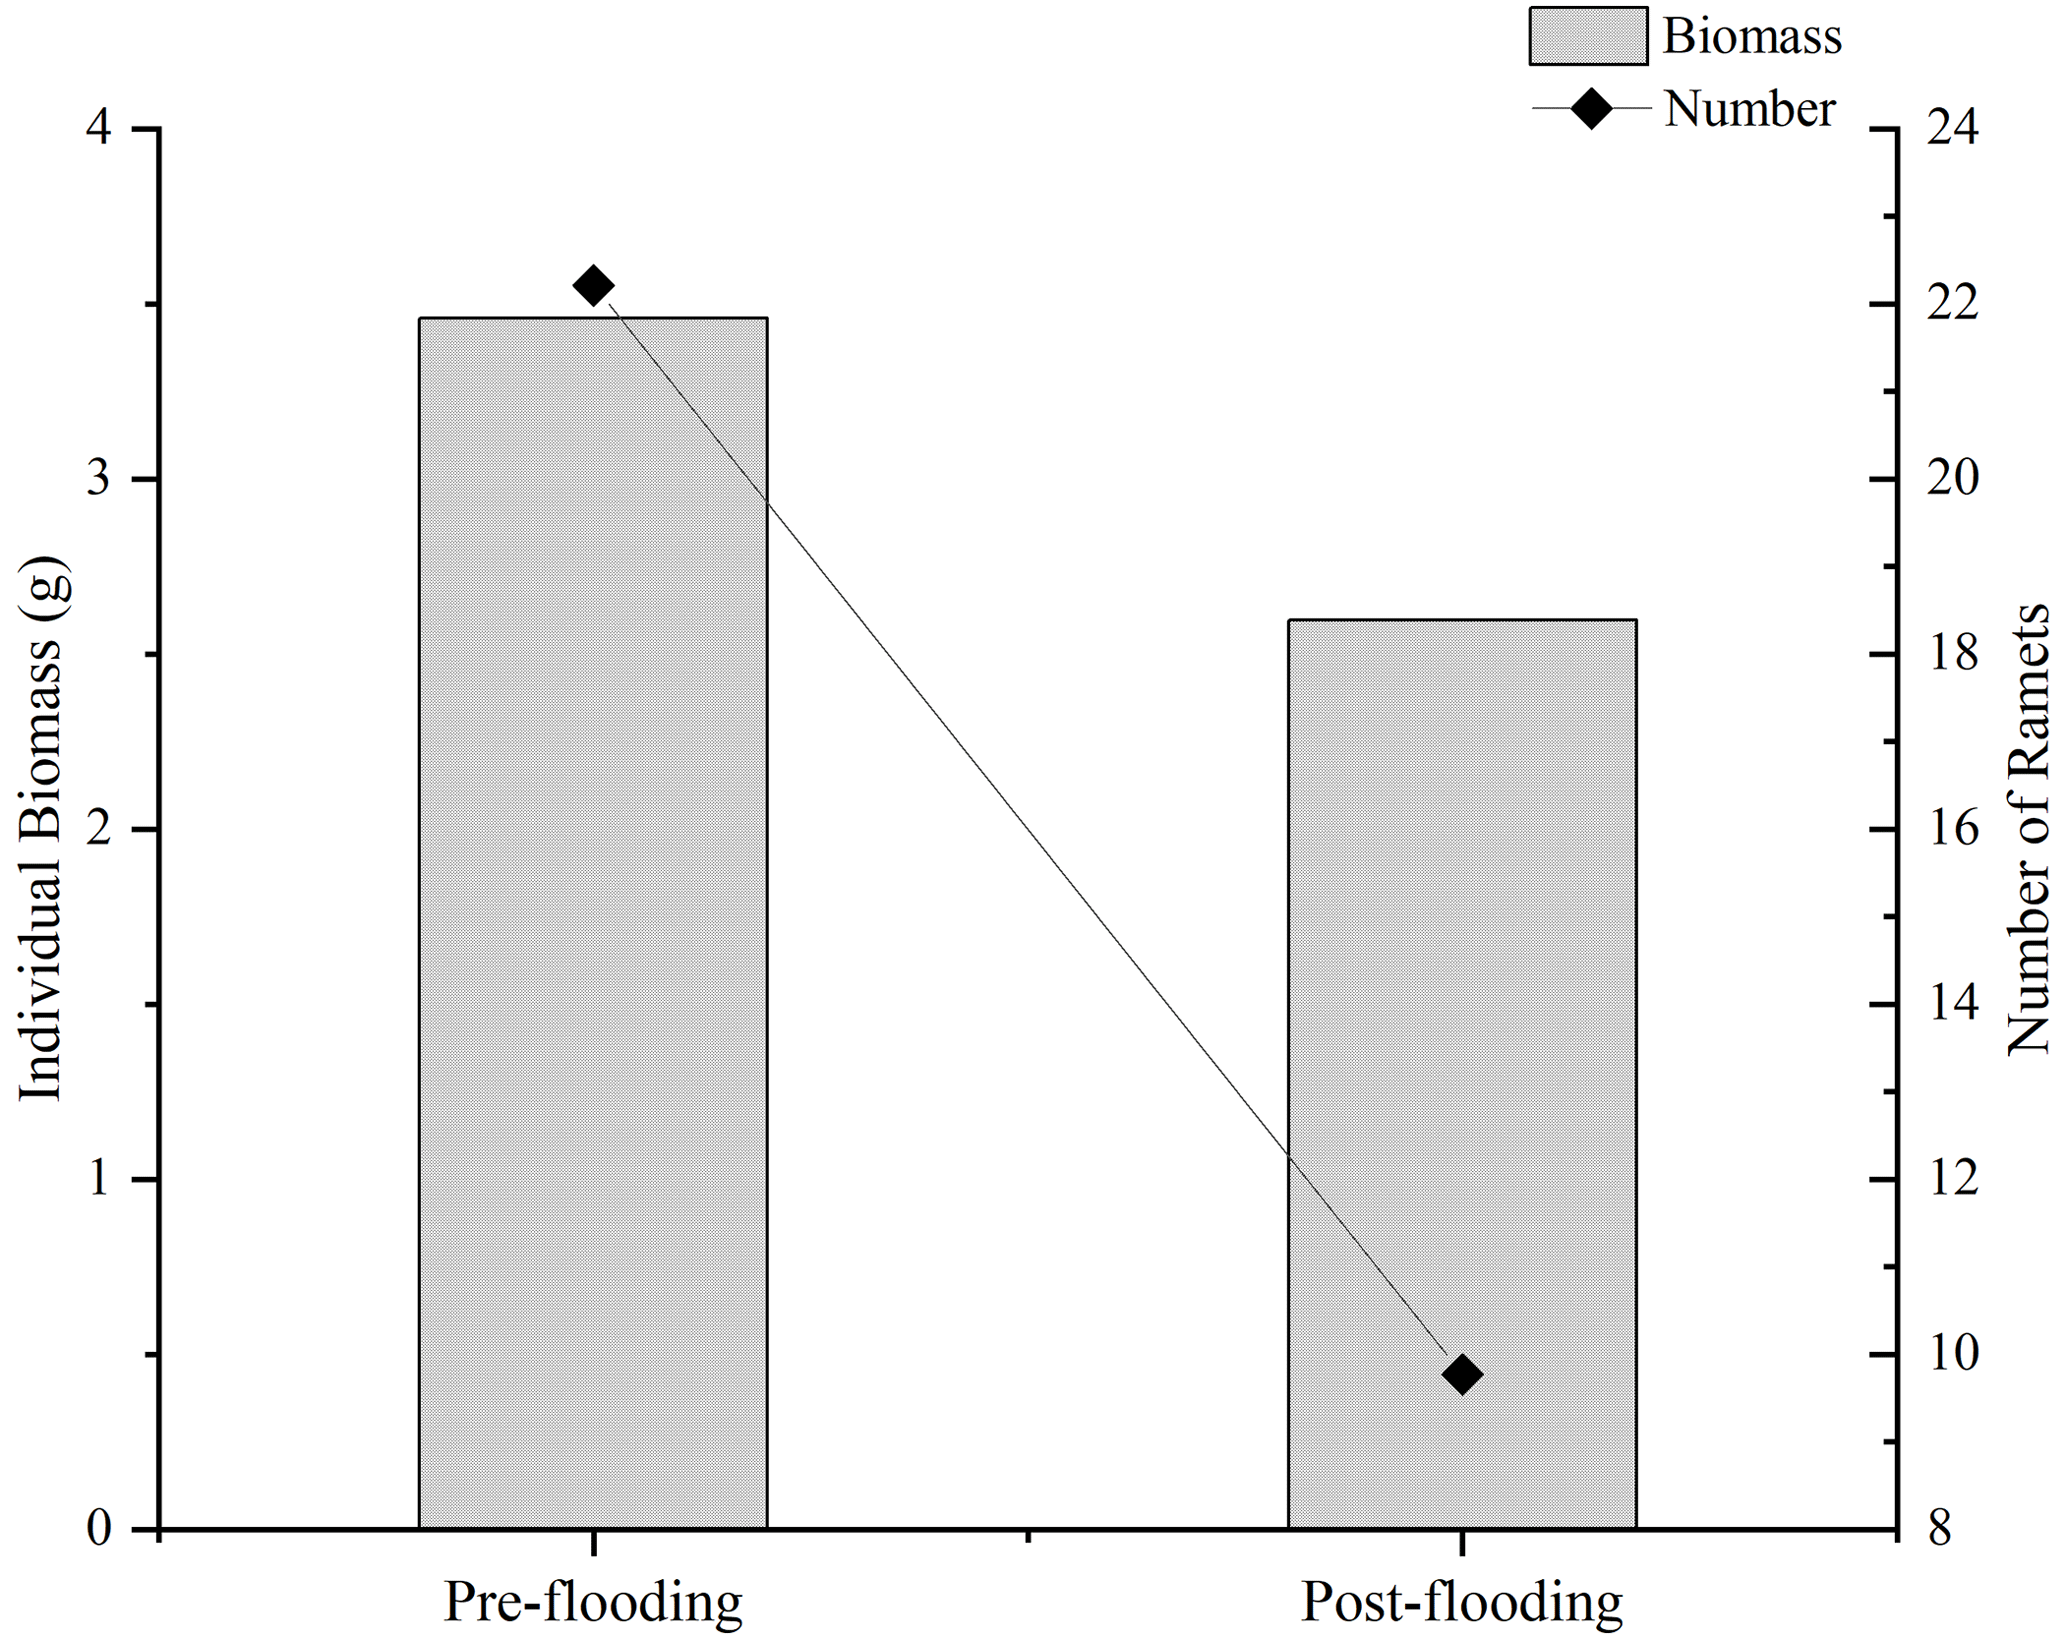
Figure 3Comparison of the individual biomass and the number of Chrysopogon aciculatus before and after flooding in the controlled experiment.
3.4 Vegetation density defines carbon sequestration capacity in riparian habitats
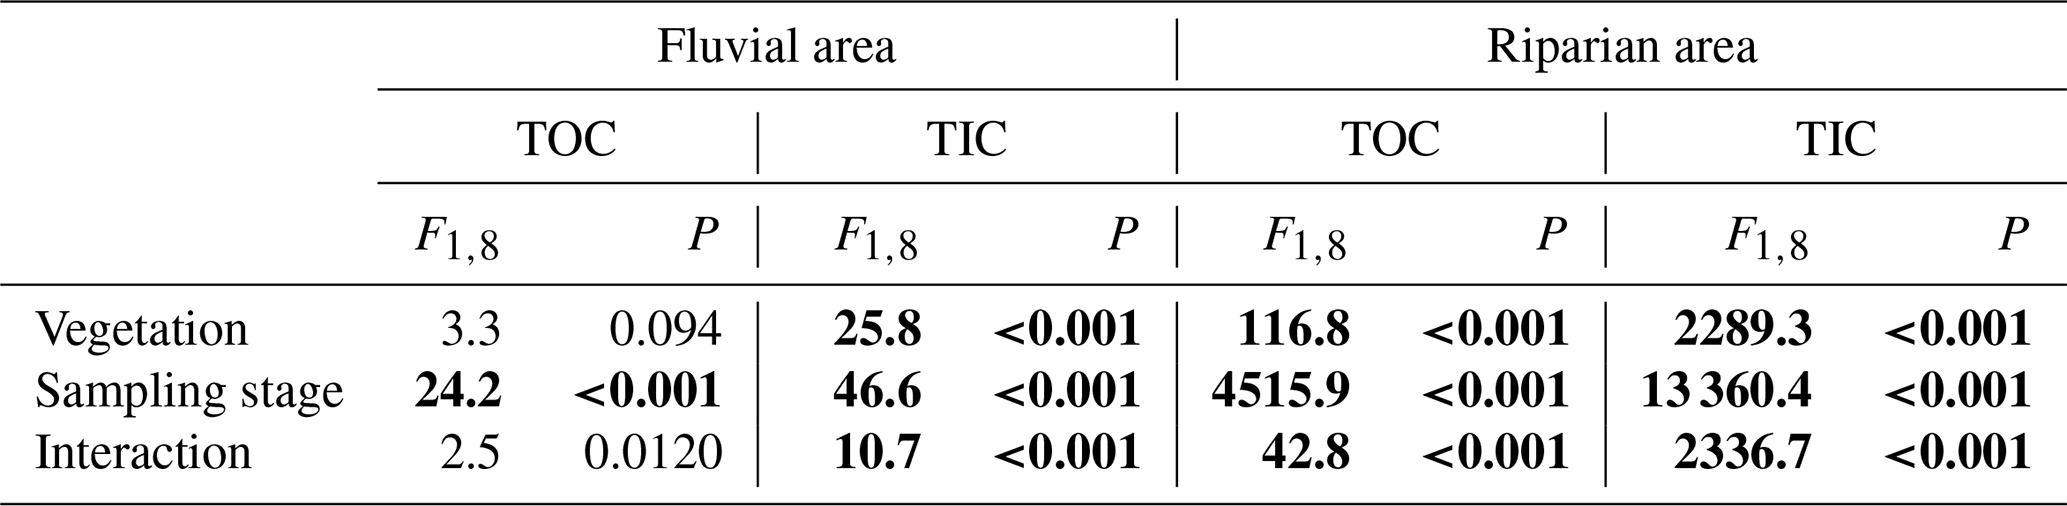
We measured total organic carbon (TOC) and total inorganic carbon (TIC) in riparian soils and the fluvial area during different periods. TOC and TIC displayed different patterns across seasons. TOC in the fluvial area was substantially higher during the flooding period than that during the pre- and post-flooding seasons (Fig. 4a; P<0.001, Table A4), probably due to a higher mobilization of riparian organic carbon to the river during the flooding period. This is consistent with an enrichment effect of organic carbon under high discharge (Raymond and Saiers, 2010). In contrast, TIC in the fluvial area was in a lower concentration during the flooding season than during the pre- and post-flooding seasons (Fig. 4b; P<0.001, Table A4). In addition to a dilution effect for TIC by high discharge during the flooding period, this also suggests a stronger effect of riparian area on fluvial carbon during the non-flooding seasons than during flooding periods. Additionally, we show that both TOC and TIC in riparian soils were substantially higher during the post-flooding season than during the pre-flooding season (Fig. 4c and d; P<0.001 Table A4), suggesting a higher carbon sequestration capacity for riparian vegetation after recovery from flooding disturbances.
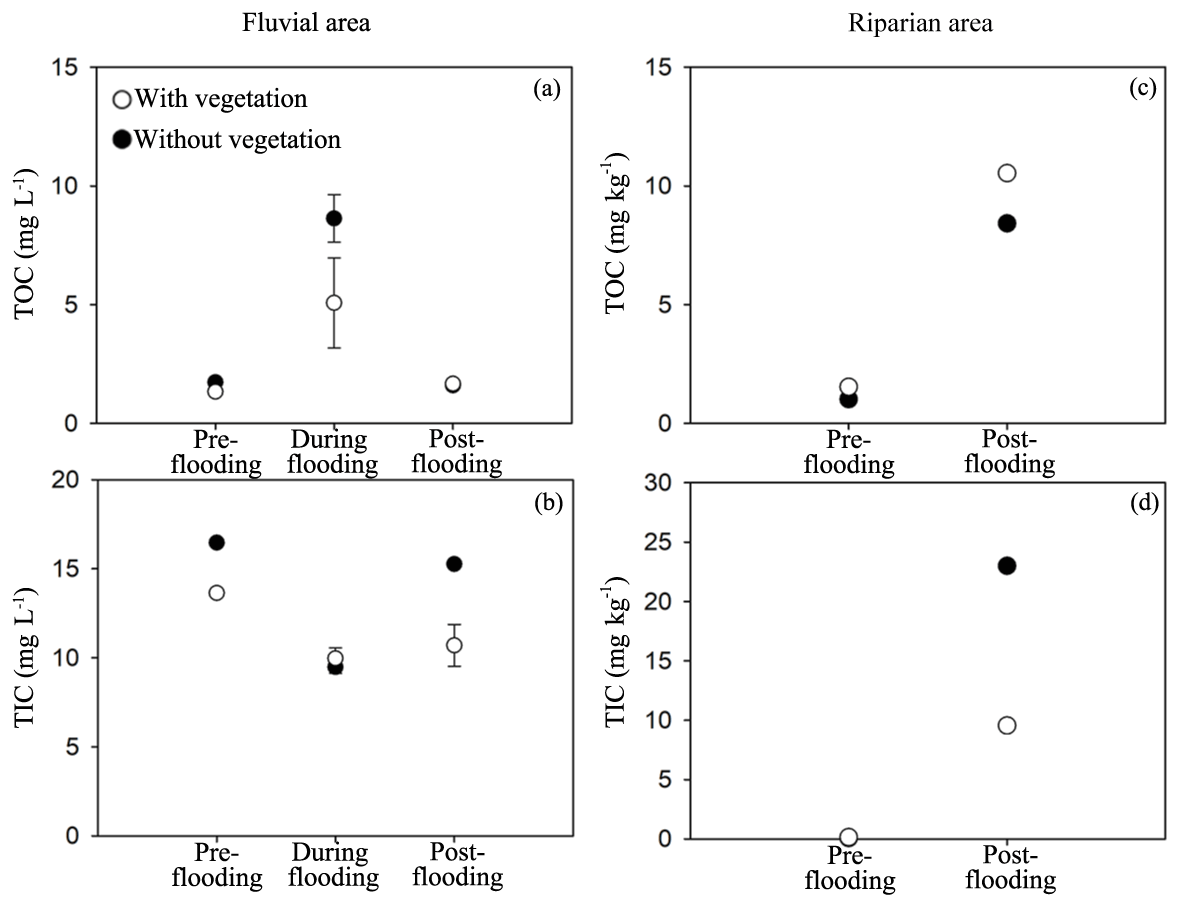
Figure 4Total organic carbon (TOC) and total inorganic carbon (TIC) in the study area. The fluvial area and riparian area include study areas with vegetation and without vegetation. TOC and TIC were also measured in different sampling stages. The ANOVA results for habitats, season, and interaction effects are given, including F and P values in Table A4.
The present work demonstrates significant variations in spatial and temporal carbon fluxes from riparian zones of the Lijiang. In April, the all-day CO2 fluxes in 2014 and 2016 were positive on the daily scale in the fluvial area, indicating a net emission from the fluvial area of the river to the atmosphere. However, opposite results were found for the CO2 flux in October after the flooding disturbance, which was negative and indicated a capacity for carbon sequestration. In the riparian area, the vegetation was found to promote the overall carbon sequestration and keep the riparian area as a carbon sink. It demonstrates that the carbon sequestration capacity of a given system depends strongly on the post-disturbance recovery of riparian vegetation.
4.1 Increased carbon emission during flooding periods of the riparian zone
Hydrological flow has been found to be an essential factor within the carbon cycle of riparian ecosystems (Zarnetske et al., 2018). Our data suggest that flooding not only affects carbon emission from the fluvial channel but also the carbon fluxes of the riparian area. With regard to carbon emission from the fluvial area, our data show that the carbon emission of the water–air interface significantly increased and showed a net emission of CO2 in both the daytime and nighttime (all-day CO2 flux: 0.291 in April, 2.560 in August). This is probably due to the increased lateral carbon flux from terrestrial areas to rivers due to flooding. Research found that when water flows through the ecosystem it would pick up dissolved organic carbon (DOC) from vegetation and soils, transporting the carbon from riparian ecosystem to streams (Raymond and Saiers, 2010). A large amount of carbon could be transported to the river because of enhanced hydrological connectivity between the fluvial channel and its riparian areas during flooding periods (Zarnetske et al., 2018).
When comparing the CO2 flux of shallow-water area (with aquatic vegetation) and deep-water area (without vegetation) (Fig. A2), it is also found that shallow water released less carbon in pre-flooding season and captured more carbon in post-flooding season than the deep-water area. However, during the flooding season, both the shallow-water and deep-water areas perform carbon uptake, probably because of an enhanced input of carbon from riparian vegetation and soils to the fluvial channel.
In addition to increased hydrologic connectivity between the riparian area and fluvial channel of the river, enhanced carbon emission also results from enhanced substrate availability during flooding (Hirota et al., 2007). Previous work also reported that the extensive root system of the riparian species with strong taproots and well-developed fibrous roots could force the species to demand more oxygen and accelerate root respiration and CO2 emissions from the neighbouring rhizosphere (Elias et al., 2015). In submerged areas, the CO2 may be transported to water and then released to the atmosphere as the carbon flux of the water surface. Especially, the recovery of some C4 riparian species after periodic flooding also contributed to the higher gas transportability and abundant substrate for CO2 emission compared to the performance of C3 species (Still et al., 2003). In addition to riparian vegetation, inundation could also increase the decomposition of stored organic matter (Denef et al., 2001; Marín-Muñiz et al., 2015) and soil respiration (Anderson et al., 2020; Ou et al., 2019). A previous study found that after 25 d of soil moisture enhancement, the anaerobiosis stimulates CO2 loss by 1.5 times more than the normal soil moisture environment (Huang and Hall, 2017). Flooding leads to elevated soil moisture for weeks or even months and thus an accelerated CO2 supply to the inundated channel.
4.2 Post-disturbance surviving vegetation as a critical factor for riparian systems to sequester carbon
We observed that the carbon sequestration of riparian area and fluvial area as a whole was greatly enhanced after the flooding period, to the point that the overall carbon flux was negative. Consistent with our analysis, Kathilankal et al. (2008) proposed that tidal inundation caused a mean reduction of 49 % in the marsh-atmosphere carbon (CO2) flux compared to non-flooded conditions (Kathilankal et al., 2008). Our study offers proof that the hydrological flow is a determining factor on whether the riparian ecosystem is a net carbon source or sink.
One possible reason is that the vegetation's recovery after flooding enhances its ability to sequester more CO2 for photosynthesis. The post-flooding succession of vegetation suggests that not all riparian plants can survive submergence and become efficient carbon sinks. Indeed, species richness decreased after flooding, which indicates a decrease of the interspecific competition, giving a chance to species that can quickly recover from submergence. The dominant species changed from C. dactylon to C. aciculatus after flooding disturbance. Although the individual biomass and number of DOC C. aciculatus did not increase, existing literature suggests that the leaf maximum net photosynthesis rate may increase significantly after severe submergence in the riparian zones of the Lijiang (Huang et al., 2017; Jie et al., 2012). For the clonal plants, it is physiological integration that allows them to survive submergence and spread rapidly after de-submergence. Luo et al. (2014), studying Alternanthera philoxeroides (alligator weed) after 30 d of submergence, found that connections between submerged and non-submerged ramets enhance the performance of the submerged ramets, and the de-submerged ramets had high soluble sugar concentrations, suggesting high metabolic activities (Luo et al., 2014). Wei et al. (2018) also found that, after 30 d of submergence, stolon connection significantly increased growth, biomass allocation to roots, and photosynthetic capacities of the submerged ramets and increased growth and photosynthetic capacities of the unsubmerged ramets (Wei et al., 2018). Also, flooding could promote CO2 use efficiency and the ability of the plant to use low light (Wang et al., 2019a). The enhanced photosynthetic capacity is believed to be one of the physiological strategies for species growing in critical zones with flooding disturbance. Moreover, human impacts can no longer be ignored on the riparian ecosystem (Ren et al., 2019), suggesting that vegetation that can recover quickly and densely is essential to allow riparian zones to be efficient carbon sinks.
Our results suggest that, on an annual scale, a riparian area behaves either as a net source or sink of carbon depending on the relative importance between enhanced emission during flooding and the strength of post-disturbance carbon absorbance. Assuming the carbon flux rates of flooding season and the non-flooding seasons were the same as we have measured on the selected days (Sect. 2.2.4, Figs. 1 and 2), we estimated that the riparian area and the fluvial area as a whole can achieve carbon neutralization (Cannual=0) only when flooding days are fewer than 15 d. Therefore, the relative ratios of flooding to non-flooding days are essential factors to determine whether the riparian area is a net source or sink on an annual scale, and future long-term, high-frequency measurements are required to monitor the carbon dynamics of the riparian zone. Also, besides the contribution of recovered vegetation, our data show that bare soil also contributes to the carbon neutralization, but the mechanism for bare soil to capture carbon still needs further analysis.
Nowadays, the risk and the number of global flooding events are expected to rise significantly with climate changes (Hirabayashi et al., 2013). This means that the annual carbon cycle of riparian area and fluvial area as a whole is subject to a more variant and stronger impact from flooding. Previous research found that with a warmer climate there would be a large increase in flood frequency in Southeast Asia, Peninsular India, eastern Africa and the northern half of the Andes (Hirabayashi et al., 2013). Our research highlights that flooding disturbance would not only cause large carbon emissions during the flooding season, but also promote carbon sequestration in the post-flooding season. It is therefore necessary to consider the dynamic effect of flooding on ecosystems' carbon cycles, especially under global climate change.
Under climate change, both the risk and the number of flooding events are rising. Our analysis reinforces the need to consider post-disturbance recovered vegetation in a riparian zone as a climate mitigation strategy. The recovery of surviving riparian vegetation from flooding disturbance can limit overall carbon emission and help neutralize the carbon emissions caused by flooding. Flooding also improves the resource hunting ability of water area, which turns the riparian zone from a carbon source to a carbon sink. This study highlights that carbon-conscious conservation efforts in post-flooding season should promote the establishment of high densities of specific plant species that are both flooding-resistant and efficient at capturing carbon.
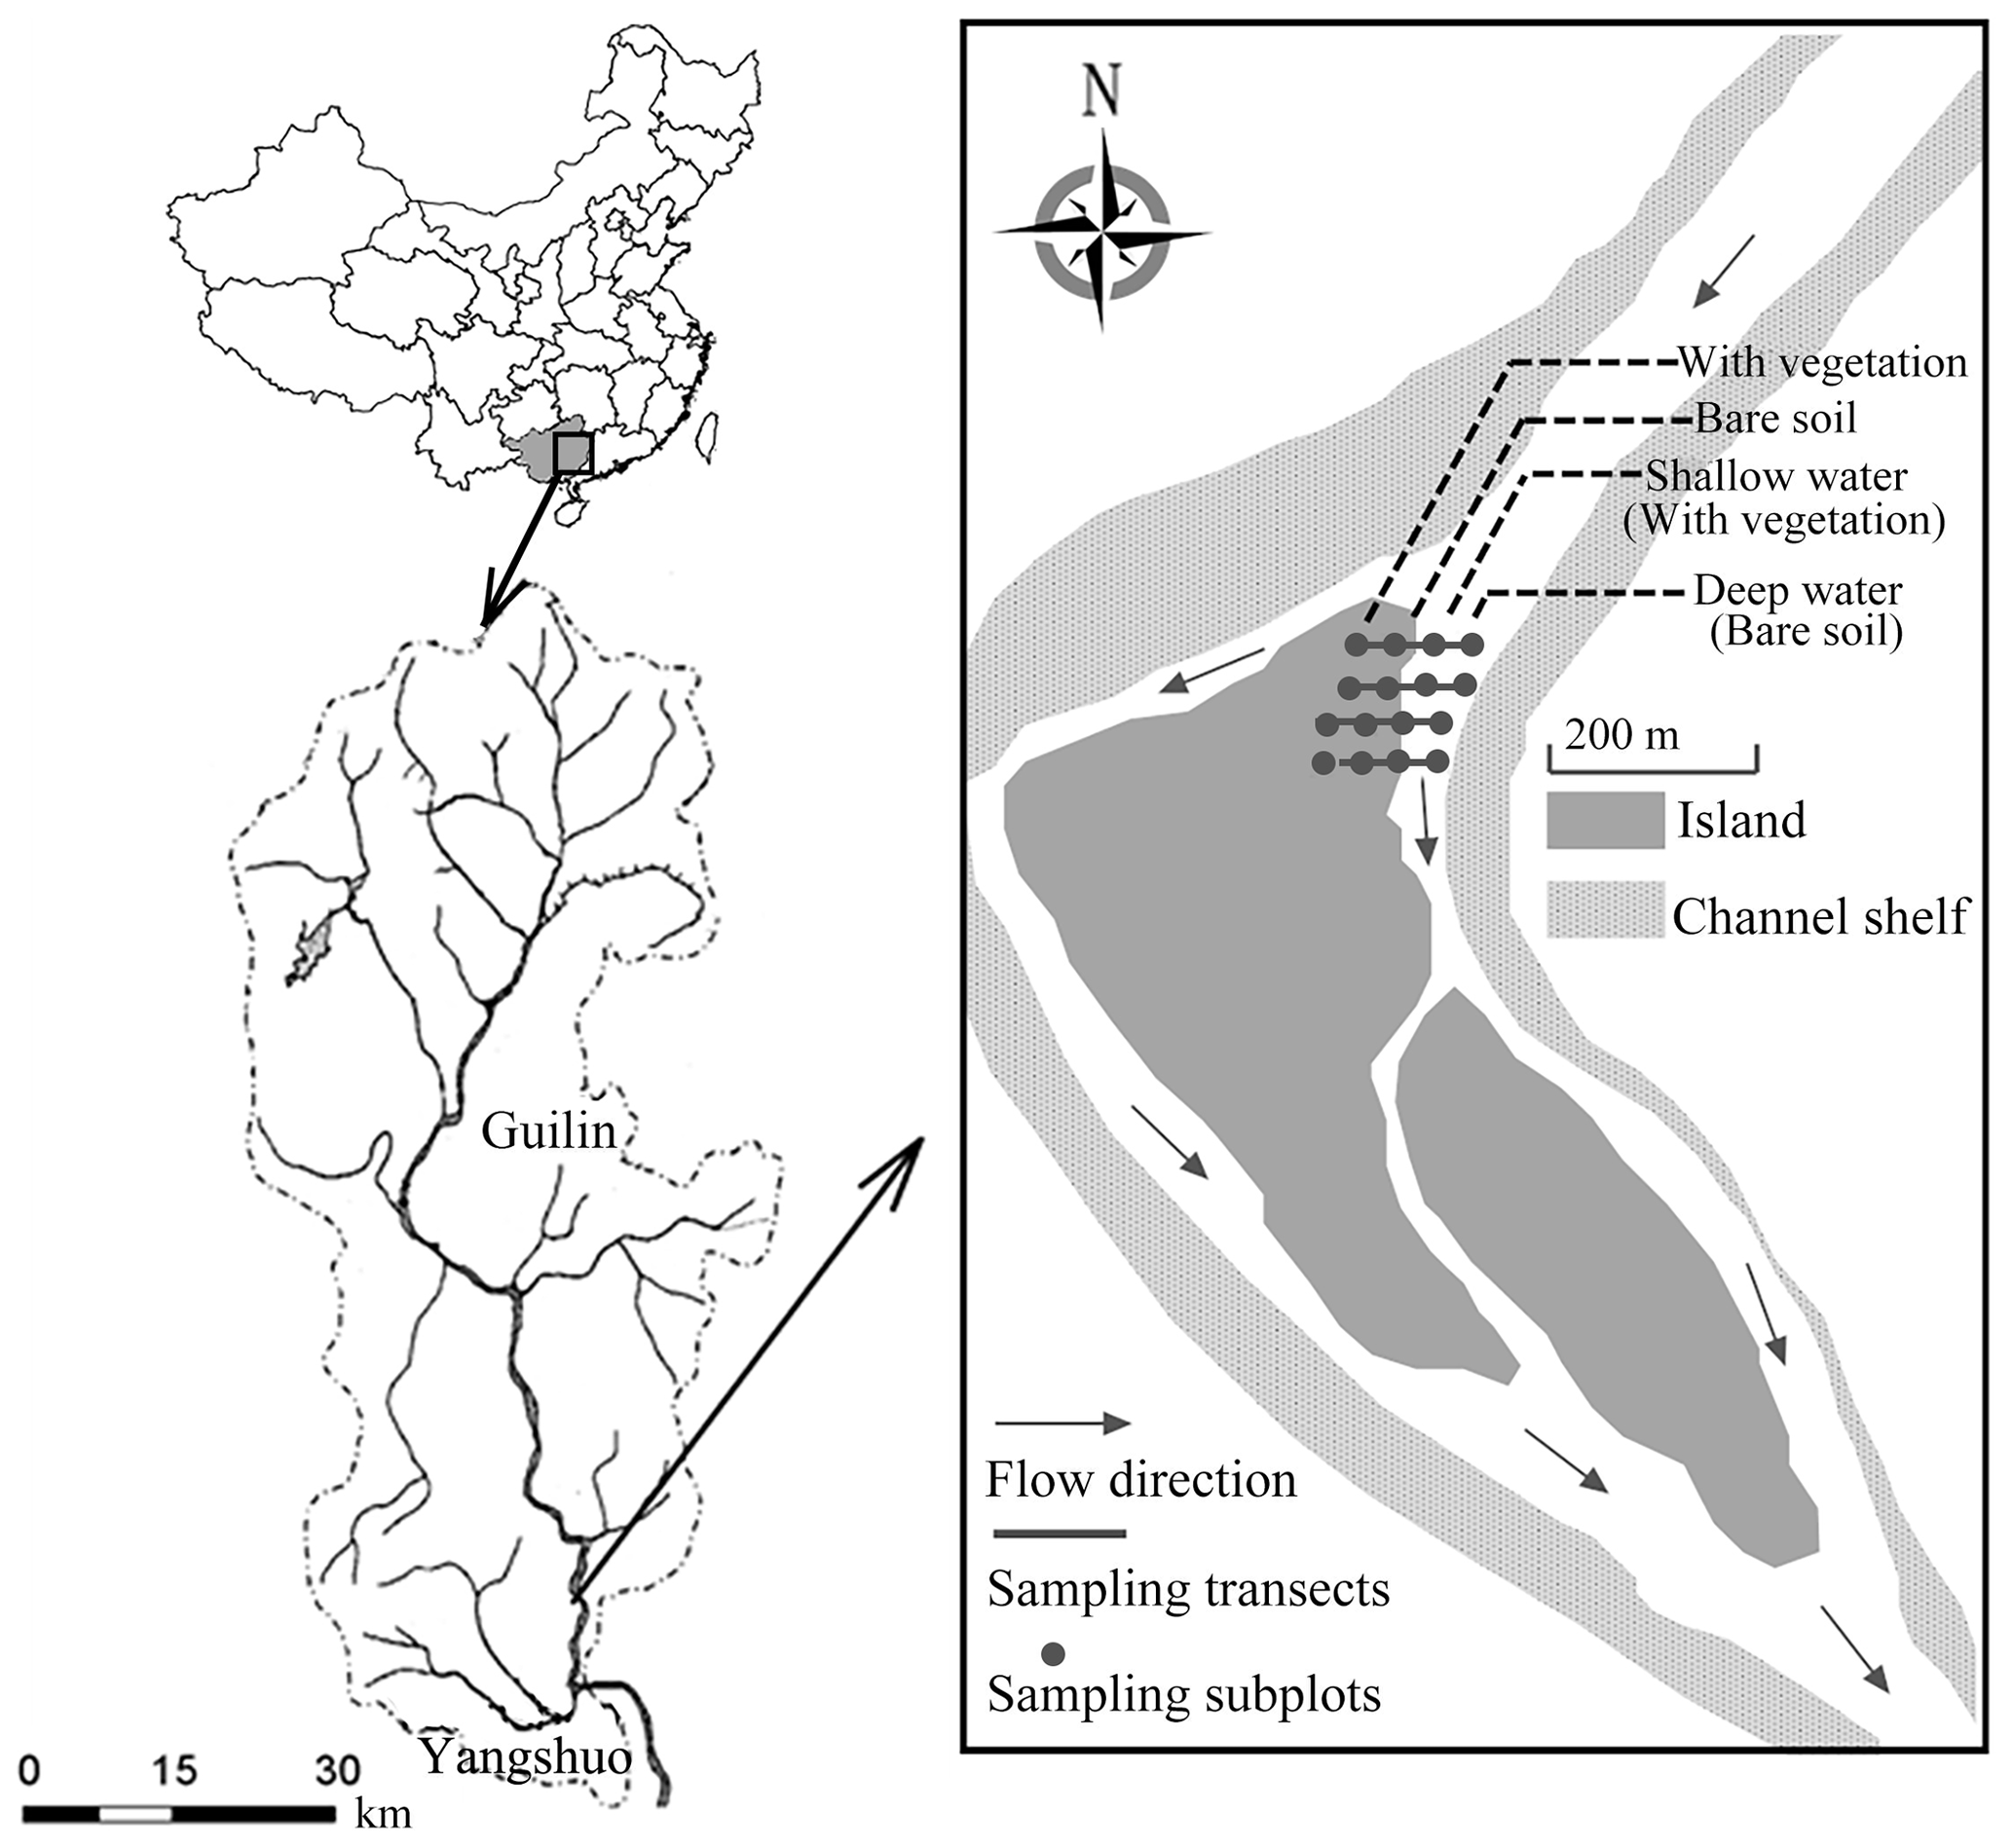
Figure A1The location of the study site in the island downstream of the Lijiang in Guilin city, Southwest China ( N, E). There were four sampling transects (black lines), each spaced 3 m apart, and four subplots (black squares) were arranged in each transect, with a distance of 5–8 m between them.
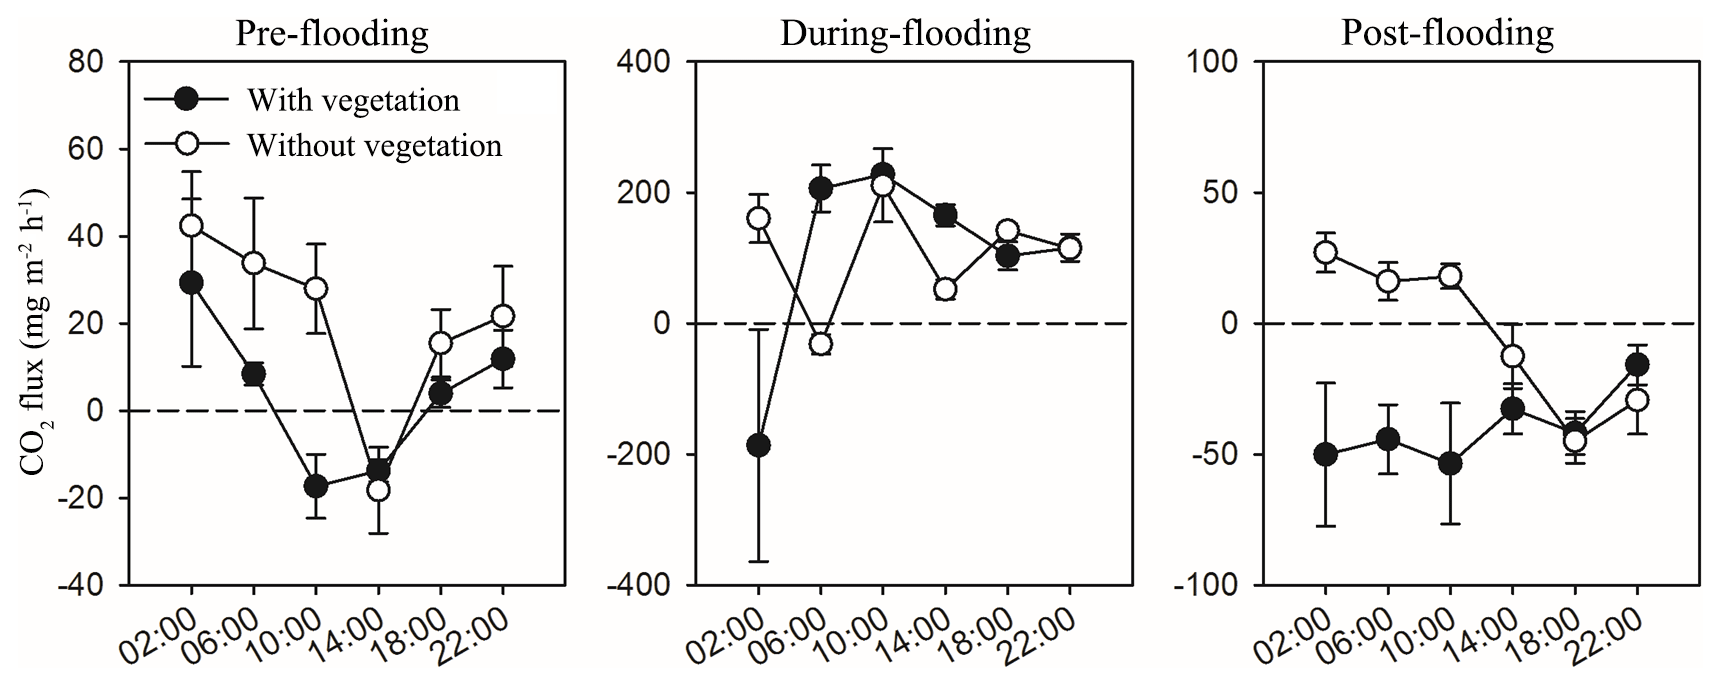
Figure A2Effects of time (measuring times in 1 d) on CO2 flux in the water–air surface of the fluvial area with vegetation (shallow water, filled) and without vegetation (deep water, blank) in the three sampling stages. Mean ± 1 SE is given.
Table A1Repeated ANOVA measurements for the effects of vegetation (riparian areas with vegetation vs. without vegetation; between-subject factor) and time (measuring times in 1 d; within-subject factor) on the CO2 fluxes in two sampling stages (April and October) in riparian areas. Degree of freedom (df) and F and P (significance) values are given.
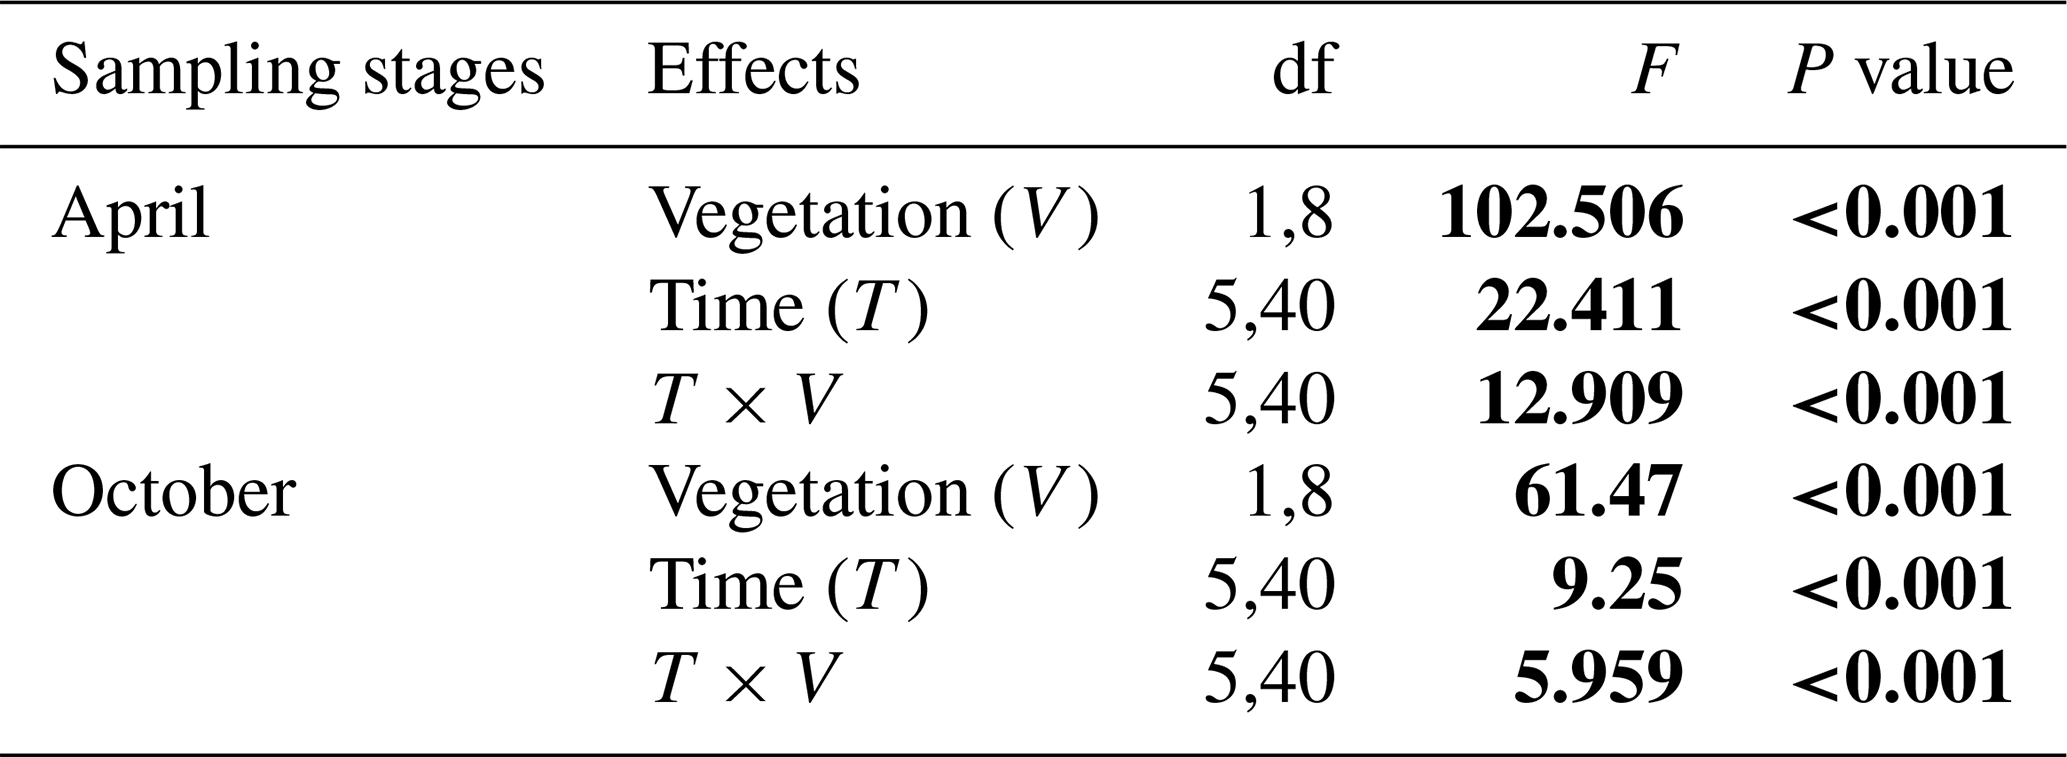
F value: the ratio of two estimates of the variance between or within groups in ANOVAs; P value: the probability of the F value in the F distribution. The P values were calculated under the null hypothesis that CO2 flux is not influenced by the existence of vegetation or measuring times in riparian areas.
Table A2Repeated ANOVA measurements for the effects of vegetation (shallow area with vegetation vs. deep area without vegetation; between-subject factor) and time (measuring times in 1 d; within-subject factor) on CO2 fluxes in three sampling stages (April, August, and October) in fluvial areas. Degree of freedom (df) and F and P (significance) values are given.
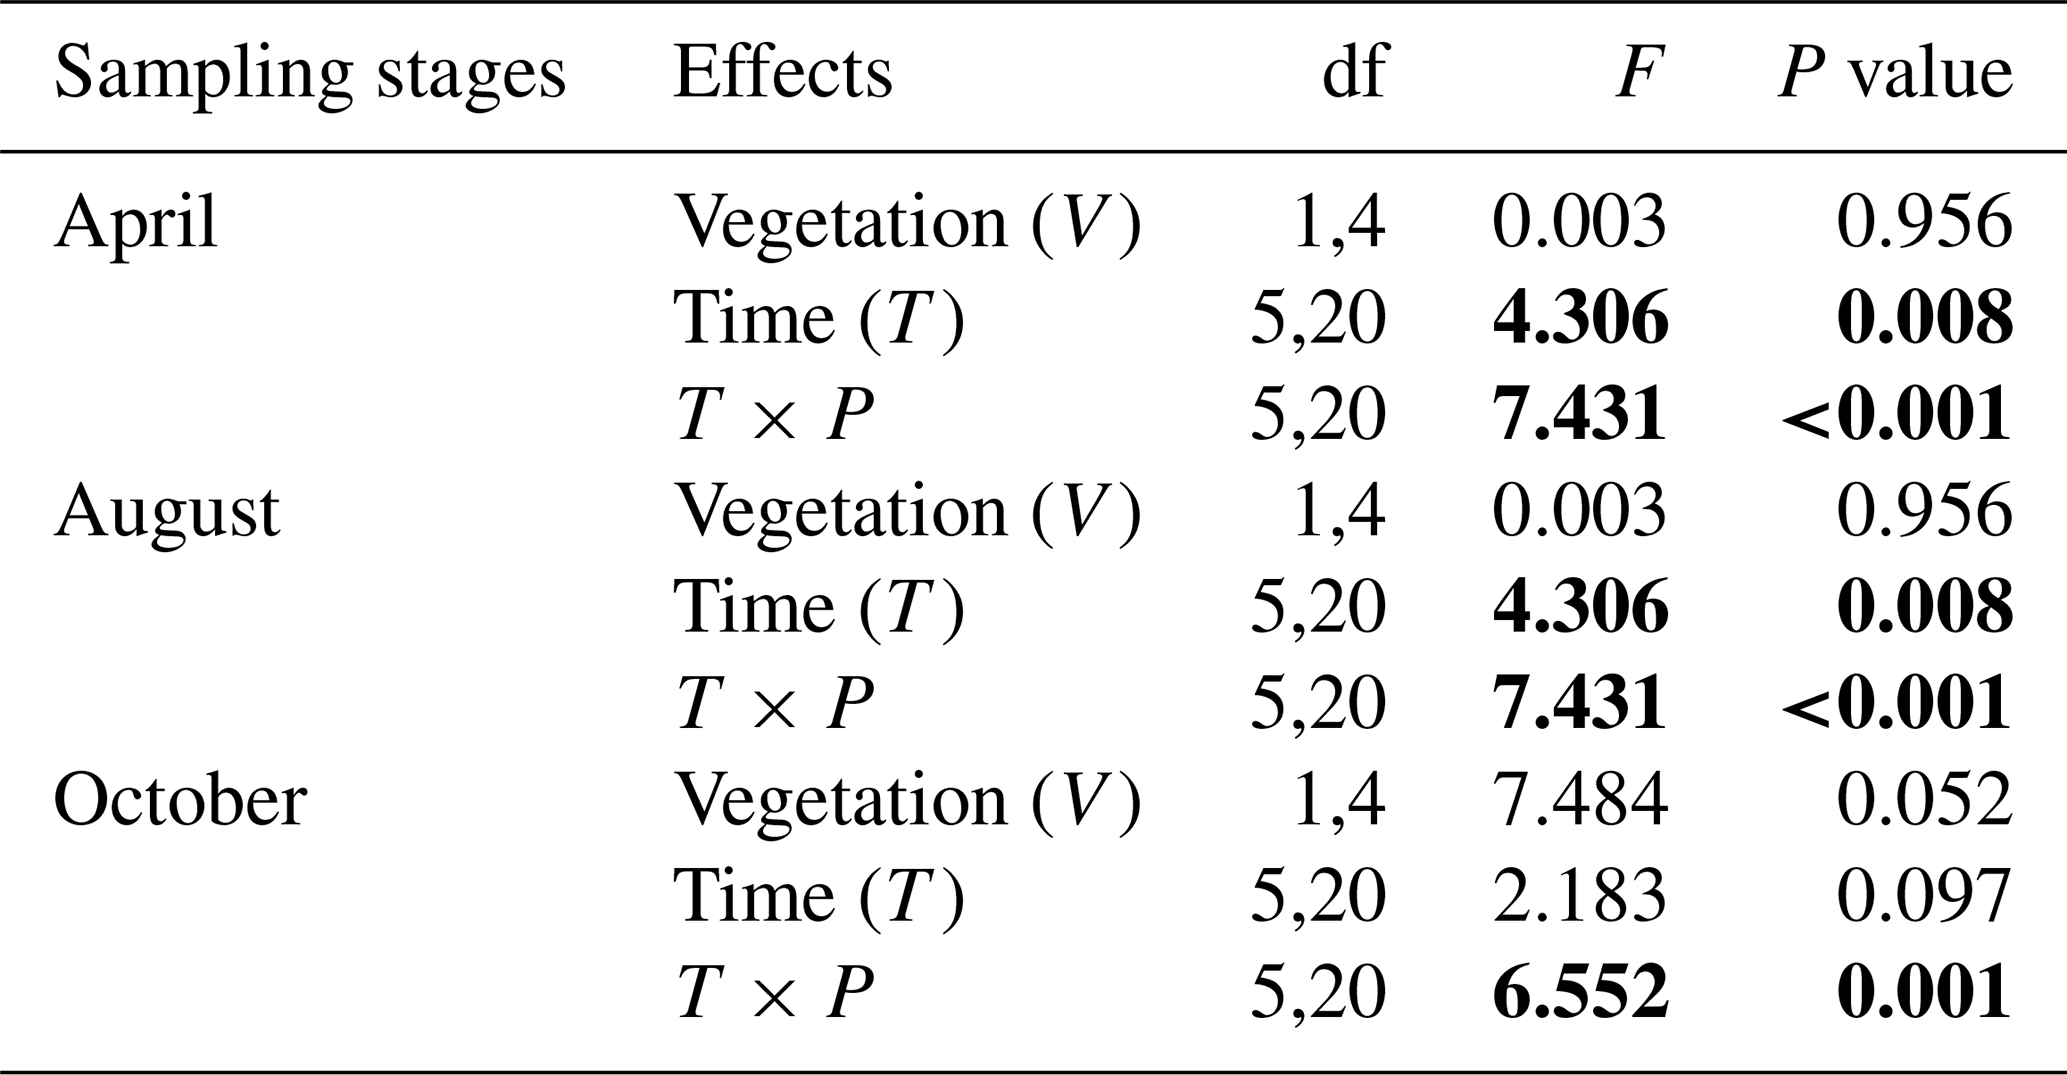
F value: the ratio of two estimates of the variance between or within groups in ANOVAs; P value: the probability of the F value in F distribution. The P values were calculated under the null hypothesis that CO2 flux is not influenced by vegetation or measuring times in fluvial areas.
Table A3The whole plant species in pre-flooding season (surveyed in April) and post-flooding season (surveyed in October).
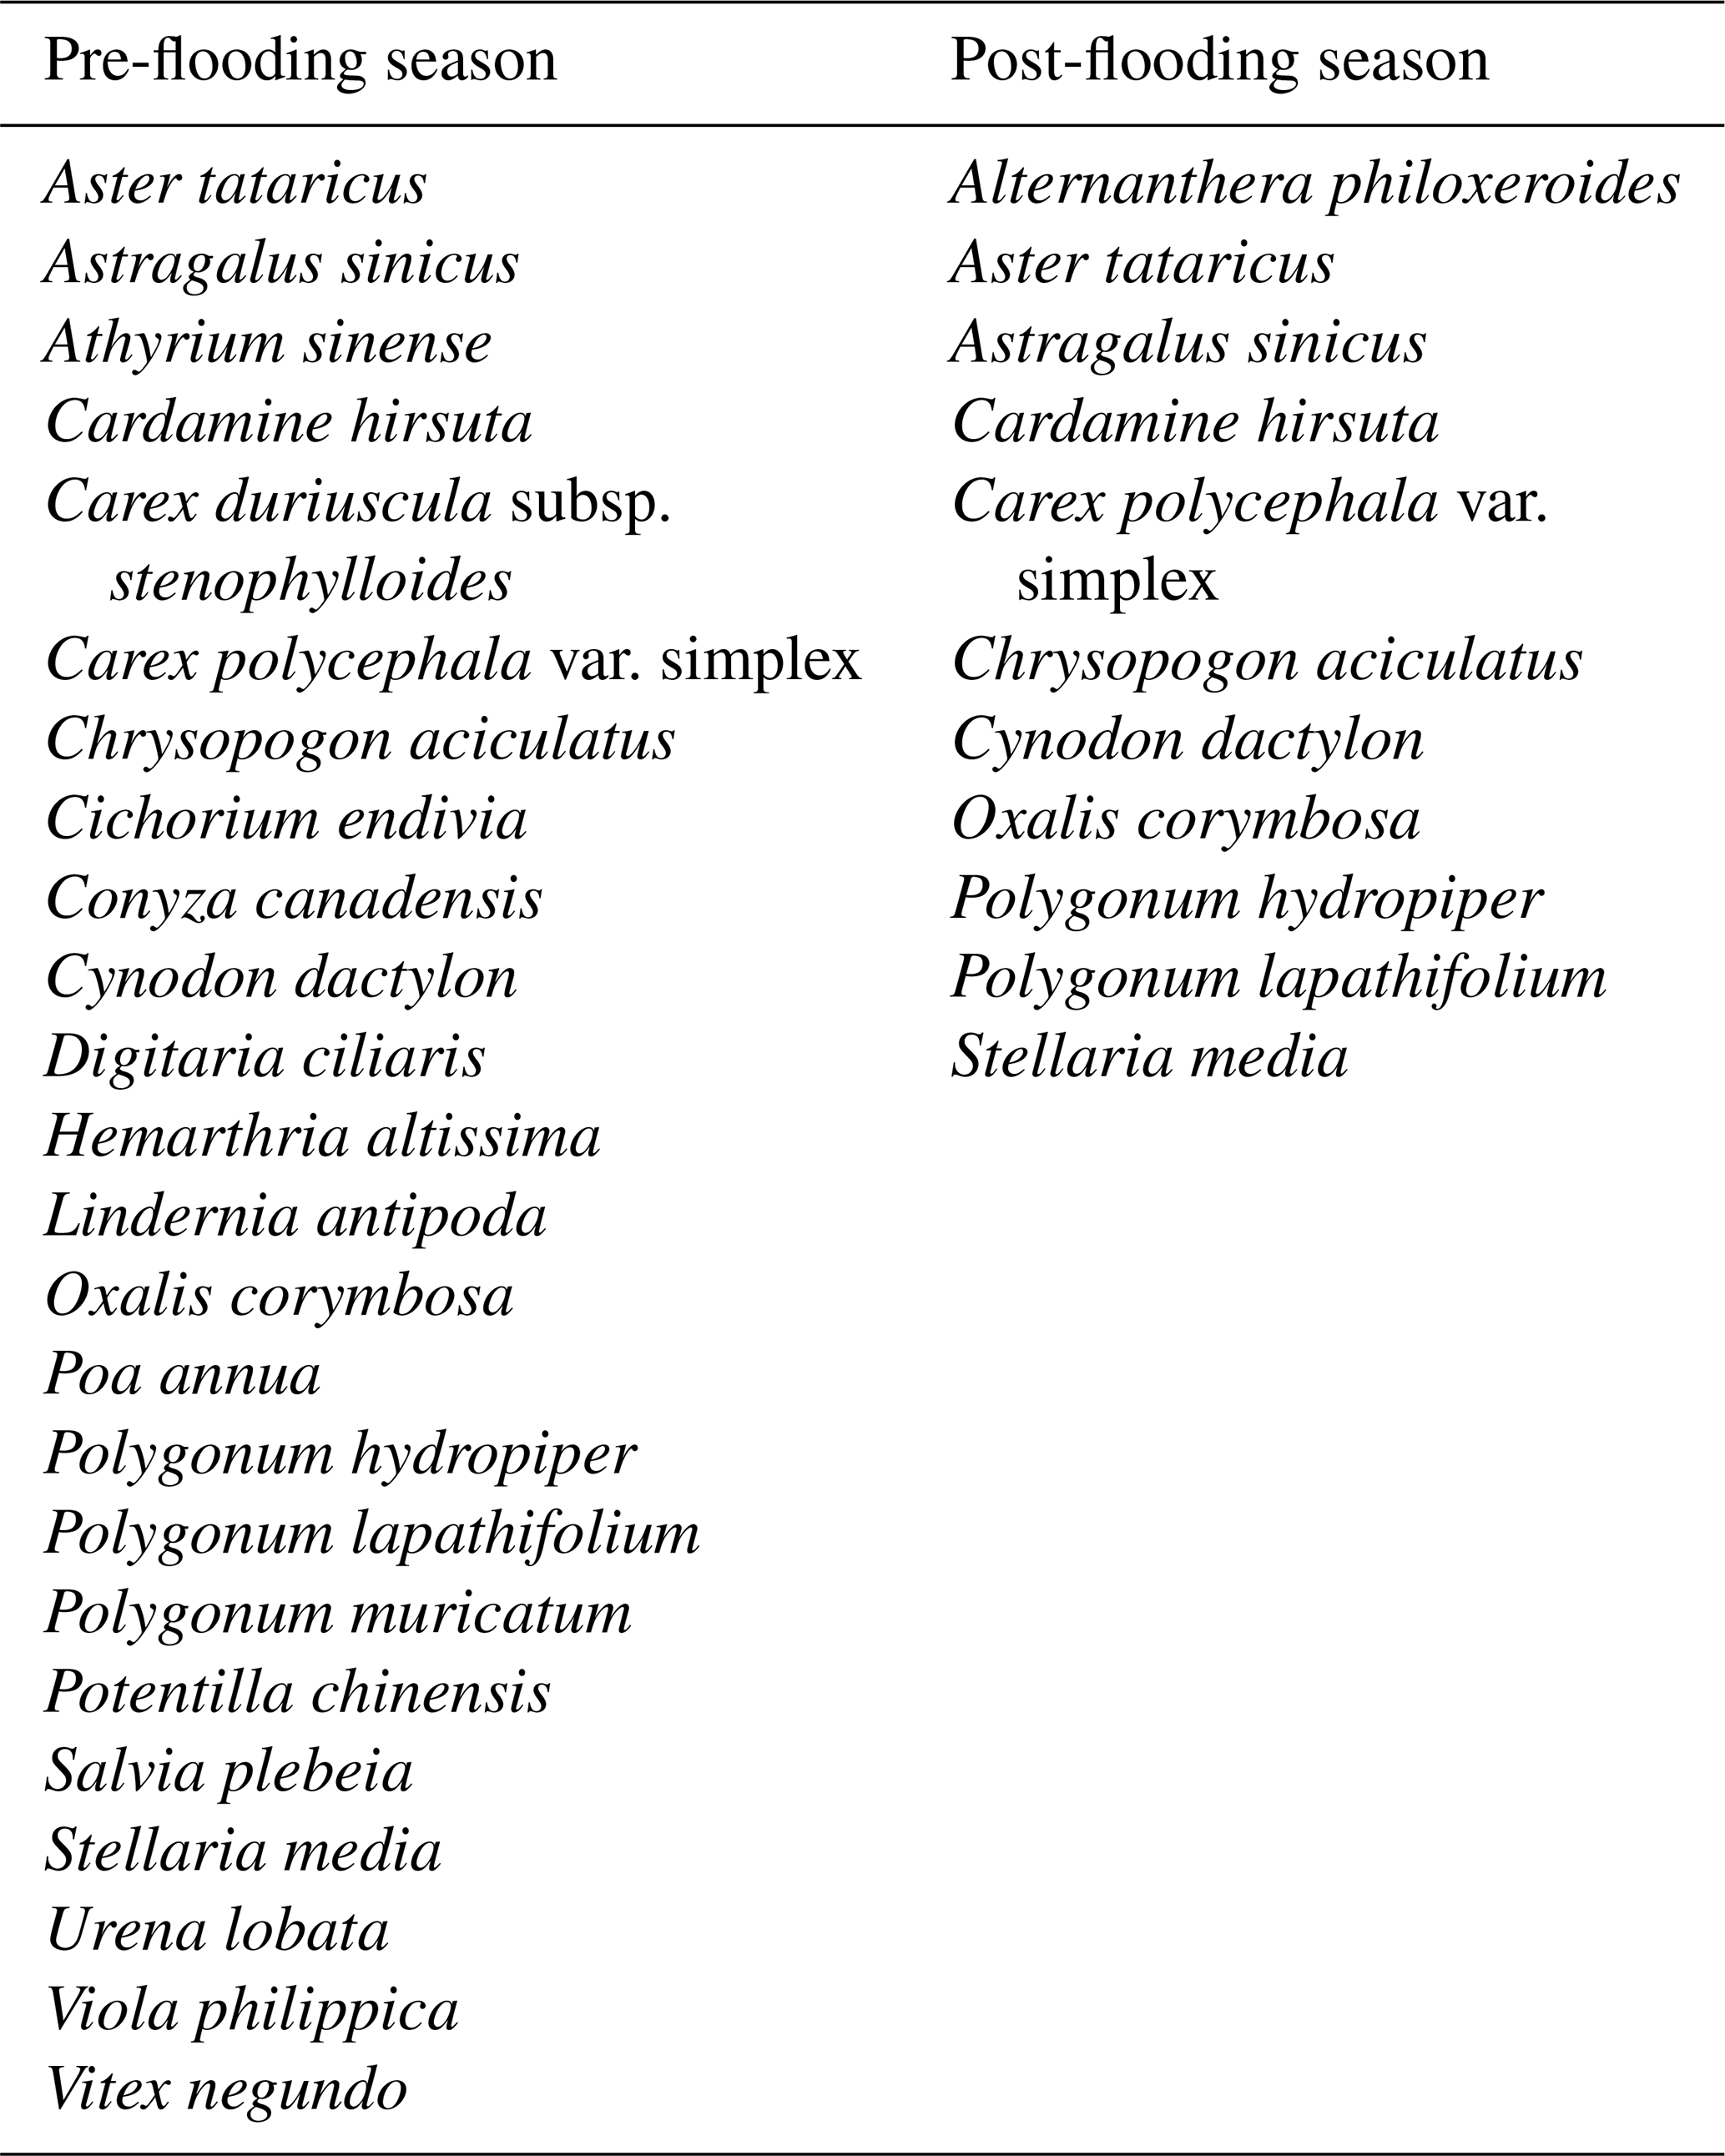
Table A4ANOVA results for the effects of vegetation (with vegetation vs. without vegetation; between-subject factor), sampling seasons (pre-flooding, during flooding, post-flooding), and interaction effects on total organic carbon (TOC) and total inorganic carbon (TIC) in two positions (fluvial area vs. riparian area). F and P (significance) values are given.
Correspondence and requests for data should be addressed to Huai Zhang (hzhang@ucas.ac.cn).
RL conceived and designed the study and collected the data with FY. YZ analysed the data and completed data visualization. YZ and RL wrote the original paper. HZ, SL, and TGG reviewed and edited the paper. HZ acquired funding and resources for this study.
The contact author has declared that none of the authors has any competing interests.
Publisher's note: Copernicus Publications remains neutral with regard to jurisdictional claims in published maps and institutional affiliations.
We are grateful to the fishermen Qiaolian Huang, Yuhua Chen, and Fengzhan Xu along the Lijiang for their assistance in the overnight field sampling. We also thank Songlin Liu and Maolin Gan at the South China Sea Institute of Oceanology, Chinese Academy of Sciences, for supporting the TIC and TOC measurements.
This research has been supported by the National Natural Science Foundation of China (grant no. 41725017). It is also partially supported by the Strategic Priority Research Program (B) of the Chinese Academy of Sciences (grant no. XDB18010202).
This paper was edited by Tyler Cyronak and reviewed by three anonymous referees.
Agilent Technologies: User Manuals Agilent 7890A Gas Chromatograph Operating Guide, Agilent Tchnologies, https://www.agilent.com/cs/library/usermanuals/Public/G3430-90011.pdf (last access: 30 March 2023), 2010.
Allen, D. E., Dalal, R. C., Rennenberg, H., Meyer, R. L., Reeves, S., and Schmidt, S.: Spatial and temporal variation of nitrous oxide and methane flux between subtropical mangrove sediments and the atmosphere, Soil Biol. Biochem., 39, 622–631, https://doi.org/10.1016/j.soilbio.2006.09.013, 2007.
Anderson, N. J., Heathcote, A. J., Engstrom, D. R., and Globocarb data contributors: Anthropogenic alteration of nutrient supply increases the global freshwater carbon sink, Sci. Adv., 6, eaaw2145, https://doi.org/10.1126/sciadv.aaw2145, 2020.
Bullock, J. M., Aronson, J., Newton, A. C., Pywell, R. F., and Rey-Benayas, J. M.: Restoration of ecosystem services and biodiversity: conflicts and opportunities, Trends Ecol. Evol., 26, 541–549, https://doi.org/10.1016/j.tree.2011.06.011, 2011.
Colmer, T. D. and Voesenek, L. A. C. J.: Flooding tolerance: suites of plant traits in variable environments, Funct. Plant Biol., 36, 665–681, https://doi.org/10.1071/FP09144, 2009.
Darrel Jenerette, G. and Lal, R.: Hydrologic sources of carbon cycling uncertainty throughout the terrestrial-aquatic continuum, Global Change Biol., 11, 1873–1882, https://doi.org/10.1111/j.1365-2486.2005.01021.x, 2005.
Denef, K., Six, J., Bossuyt, H., Frey, S. D., Elliott, E. T., Merckx, R., and Paustian, K.: Influence of dry–wet cycles on the interrelationship between aggregate, particulate organic matter, and microbial community dynamics, Soil Biol. Biochem., 33, 1599–1611, https://doi.org/10.1016/S0038-0717(01)00076-1, 2001.
Dybala, K. E., Matzek, V., Gardali, T., and Seavy, N. E.: Carbon sequestration in riparian forests: A global synthesis and meta-analysis, Global Change Biol., 25, 57–67, https://doi.org/10.1111/gcb.14475, 2019.
Dynesius, M. and Nilsson, C.: Fragmentation and Flow Regulation of River Systems in the Northern Third of the World, Science, 266, 753–762, https://doi.org/10.1126/science.266.5186.753, 1994.
Elias, E., Steele, C., Havstad, K., Steenwerth, K., Chambers, J., Deswood, H., Kerr, A., Albert, R., Schwartz, M., Stine, P., and Steele, R.: Southwest Regional Climate Hub and California Subsidiary Hub assessment of climate change vulnerability and adaptation and mitigation strategies, U.S. Department of Agriculture, Washington, DC, 76 pp., https://www.fs.usda.gov/research/treesearch/49341 (last access: 30 March 2023), 2015.
Gaughan, A. E. and Waylen, P. R.: Spatial and temporal precipitation variability in the Okavango–Kwando–Zambezi catchment, southern Africa, J. Arid Environ., 82, 19–30, https://doi.org/10.1016/j.jaridenv.2012.02.007, 2012.
Gregory, S. V., Swanson, F. J., McKee, W. A., and Cummins, K. W.: An Ecosystem Perspective of Riparian Zones, BioScience, 41, 540–551, https://doi.org/10.2307/1311607, 1991.
Hassanzadeh, Y. T., Vidon, P. G., Gold, A. J., Pradhanang, S. M., and Addy Lowder, K.: RZ-TRADEOFF: A New Model to Estimate Riparian Water and Air Quality Functions, Water, 11, 769, https://doi.org/10.3390/w11040769, 2019.
Hirabayashi, Y., Mahendran, R., Koirala, S., Konoshima, L., Yamazaki, D., Watanabe, S., Kim, H., and Kanae, S.: Global flood risk under climate change, Nat. Clim. Change, 3, 816–821, https://doi.org/10.1038/nclimate1911, 2013.
Hirota, M., Senga, Y., Seike, Y., Nohara, S., and Kunii, H.: Fluxes of carbon dioxide, methane and nitrous oxide in two contrastive fringing zones of coastal lagoon, Lake Nakaumi, Japan, Chemosphere, 68, 597–603, https://doi.org/10.1016/j.chemosphere.2007.01.002, 2007.
Hondula, K. L., Jones, C. N., and Palmer, M. A.: Effects of seasonal inundation on methane fluxes from forested freshwater wetlands, Environ. Res. Lett., 16, 084016, https://doi.org/10.1088/1748-9326/ac1193, 2021.
Huang, W. and Hall, S. J.: Elevated moisture stimulates carbon loss from mineral soils by releasing protected organic matter, Nat. Commun., 8, 1774, https://doi.org/10.1038/s41467-017-01998-z, 2017.
Huang, D., Wang, D., Ren, Y., Qin, Y., and Wu, L.: Responses of leaf traits to submergence stress and analysis of the economic spectrum of plant species in an aquatic-terrestrial ecotone, the Li River, Acta Ecol. Sin., 37, 750–759, https://doi.org/10.5846/stxb201508281789, 2017.
Jie, S., Fan, D., Xie, Z., Zhang, X., and Xiong, G.: Features of leaf photosynthesis and leaf nutrient traits in reservoir riparian region of Three Gorges Reservoir, China, Acta Ecol. Sin., 32, 1723–1733, https://doi.org/10.5846/stxb201102270229, 2012.
Kathilankal, J. C., Mozdzer, T. J., Fuentes, J. D., D’Odorico, P., McGlathery, K. J., and Zieman, J. C.: Tidal influences on carbon assimilation by a salt marsh, Environ. Res. Lett., 3, 044010, https://doi.org/10.1088/1748-9326/3/4/044010, 2008.
Le Mer, J. and Roger, P.: Production, oxidation, emission and consumption of methane by soils: A review, Eur. J. Soil Biol., 37, 25–50, https://doi.org/10.1016/S1164-5563(01)01067-6, 2001.
Li, X., Shi, F., Ma, Y., Zhao, S., and Wei, J.: Significant winter CO2 uptake by saline lakes on the Qinghai-Tibet Plateau, Global Change Biol., 28, 2041–2052, https://doi.org/10.1111/gcb.16054, 2022.
Liu, R., Liang, S., Long, W., and Jiang, Y.: Variations in Leaf Functional Traits Across Ecological Scales in Riparian Plant Communities of the Lijiang River, Guilin, Southwest China, Trop. Conserv. Sci., 11, 1–12, https://doi.org/10.1177/1940082918804680, 2020.
Liu, X., Lu, X., Yu, R., Sun, H., Xue, H., Qi, Z., Cao, Z., Zhang, Z., and Liu, T.: Greenhouse gases emissions from riparian wetlands: an example from the Inner Mongolia grassland region in China, Biogeosciences, 18, 4855–4872, https://doi.org/10.5194/bg-18-4855-2021, 2021.
Lu, Y. and Wang, D.: Diversity of plants on the Alluvial islands of Lijiang River basin and the physicochemical properties of their soil, Nature Environment and Pollution Technology, 14, 533–540, 2015.
Luo, F.-L., Chen, Y., Huang, L., Wang, A., Zhang, M.-X., and Yu, F.-H.: Shifting effects of physiological integration on performance of a clonal plant during submergence and de-submergence, Ann. Bot.-London, 113, 1265–1274, https://doi.org/10.1093/aob/mcu057, 2014.
Maraseni, T. N. and Cockfield, G.: Crops, cows or timber? Including carbon values in land use choices, Agr. Ecosyst. Environ., 140, 280–288, https://doi.org/10.1016/j.agee.2010.12.015, 2011.
Maraseni, T. N. and Mitchell, C.: An assessment of carbon sequestration potential of riparian zone of Condamine Catchment, Queensland, Australia, Land Use Policy, 54, 139–146, https://doi.org/10.1016/j.landusepol.2016.02.013, 2016.
Marín-Muñiz, J. L., Hernández, M. E., and Moreno-Casasola, P.: Greenhouse gas emissions from coastal freshwater wetlands in Veracruz Mexico: Effect of plant community and seasonal dynamics, Atmos. Environ., 107, 107–117, https://doi.org/10.1016/j.atmosenv.2015.02.036, 2015.
Mommer, L., Lenssen, J. P. M., Huber, H., Visser, E. J. W., and de Kroon, H.: Ecophysiological Determinants of Plant Performance under Flooding: A Comparative Study of Seven Plant Families, J. Ecol., 94, 1117–1129, 2006.
Morse, J. L., Ardón, M., and Bernhardt, E. S.: Greenhouse gas fluxes in southeastern U. S. coastal plain wetlands under contrasting land uses, Ecol. Appl., 22, 264–280, https://doi.org/10.1890/11-0527.1, 2012.
Naiman, R. J. and Decamps, H.: The Ecology of Interfaces: Riparian Zones, Annu. Rev. Ecol. Syst., 28, 621–658, 1997.
Ou, Y., Rousseau, A. N., Wang, L., Yan, B., Gumiere, T., and Zhu, H.: Identification of the alteration of riparian wetland on soil properties, enzyme activities and microbial communities following extreme flooding, Geoderma, 337, 825–833, https://doi.org/10.1016/j.geoderma.2018.10.032, 2019.
Pugh, T. A. M., Arneth, A., Kautz, M., Poulter, B., and Smith, B.: Important role of forest disturbances in the global biomass turnover and carbon sinks, Nat. Geosci., 12, 730–735, https://doi.org/10.1038/s41561-019-0427-2, 2019.
Raymond, P. A. and Saiers, J. E.: Event controlled DOC export from forested watersheds, Biogeochemistry, 100, 197–209, https://doi.org/10.1007/s10533-010-9416-7, 2010.
Ren, Y., Wang, D., and Li, X.: Impacts of Human Disturbances on Riparian Herbaceous Communities in a Chinese Karst River, Nature Environment and Pollution Technology, 18, 1107–1118, 2019.
Søvik, A. K. and Kløve, B.: Emission of N2O and CH4 from a constructed wetland in southeastern Norway, Sci. Total Environ., 380, 28–37, https://doi.org/10.1016/j.scitotenv.2006.10.007, 2007.
Steiger, J., Tabacchi, E., Dufour, S., Corenblit, D., and Peiry, J.-L.: Hydrogeomorphic processes affecting riparian habitat within alluvial channel-floodplain river systems: a review for the temperate zone, River Res. Appl., 21, 719–737, https://doi.org/10.1002/rra.879, 2005.
Still, C. J., Berry, J. A., Collatz, G. J., and DeFries, R. S.: Global distribution of C3 and C4 vegetation: Carbon cycle implications: C4 Plants and Carbon Cycle, Global Biogeochem. Cy., 17, 6-1–6-14, https://doi.org/10.1029/2001GB001807, 2003.
Sun, Q., Shi, K., Damerell, P., Whitham, C., Yu, G., and Zou, C.: Carbon dioxide and methane fluxes: Seasonal dynamics from inland riparian ecosystems, northeast China, Sci. Total Environ., 465, 48–55, https://doi.org/10.1016/j.scitotenv.2013.01.036, 2013.
Sun, Q.-Q., Whitham, C., Shi, K., Yu, G.-H., and Sun, X.-W.: Nitrous oxide emissions from a waterbody in the Nenjiang basin, China, Hydrol. Res., 43, 862–869, https://doi.org/10.2166/nh.2012.060, 2012.
Sutfin, N. A., Wohl, E. E., and Dwire, K. A.: Banking carbon: a review of organic carbon storage and physical factors influencing retention in floodplains and riparian ecosystems: Banking Carbon, Earth Surf. Proc. Land., 41, 38–60, https://doi.org/10.1002/esp.3857, 2016.
Thorp, J. H., Thoms, M. C., and Delong, M. D.: The riverine ecosystem synthesis: biocomplexity in river networks across space and time, River Res. Appl., 22, 123–147, https://doi.org/10.1002/rra.901, 2006.
Vidon, P. G., Welsh, M. K., and Hassanzadeh, Y. T.: Twenty Years of Riparian Zone Research (1997–2017): Where to Next?, J. Environ. Qual., 48, 248–260, https://doi.org/10.2134/jeq2018.01.0009, 2019.
Wang, J., Wang, D., Ren, Y., and Wang, B.: Coupling relationships between soil microbes and soil nutrients under different hydrologic conditions in the riparian zone of the Lijiang River, Acta Ecol. Sin., 39, 2687–2695, https://doi.org/10.5846/stxb201803260595, 2019a.
Wang, J., Wang, D., and Wang, B.: Soil Bacterial Diversity and its Determinants in the Riparian Zone of the Lijiang River, China, Curr. Sci. India, 117, 1324, https://doi.org/10.18520/cs/v117/i8/1324-1332, 2019b.
Wang, J., Feng, L., Palmer, P. I., Liu, Y., Fang, S., Bösch, H., O'Dell, C. W., Tang, X., Yang, D., Liu, L., and Xia, C.: Large Chinese land carbon sink estimated from atmospheric carbon dioxide data, Nature, 586, 720–723, https://doi.org/10.1038/s41586-020-2849-9, 2020.
Wei, G.-W., Shu, Q., Luo, F.-L., Chen, Y.-H., Dong, B.-C., Mo, L.-C., Huang, W.-J., and Yu, F.-H.: Separating effects of clonal integration on plant growth during submergence and de-submergence, Flora, 246–247, 118–125, https://doi.org/10.1016/j.flora.2018.08.004, 2018.
Wilson, J. S., Baldwin, D. S., Rees, G. N., and Wilson, B. P.: The effects of short-term inundation on carbon dynamics, microbial community structure and microbial activity in floodplain soil, River Res. Appl., 27, 213–225, https://doi.org/10.1002/rra.1352, 2011.
Zarnetske, J. P., Bouda, M., Abbott, B. W., Saiers, J., and Raymond, P. A.: Generality of Hydrologic Transport Limitation of Watershed Organic Carbon Flux Across Ecoregions of the United States, Geophys. Res. Lett., 45, 702–711, https://doi.org/10.1029/2018GL080005, 2018.
Zhang, T., Huang, X., Yang, Y., Li, Y., and Dahlgren, R. A.: Spatial and temporal variability in nitrous oxide and methane emissions in urban riparian zones of the Pearl River Delta, Environ. Sci. Pollut. R., 23, 1552–1564, https://doi.org/10.1007/s11356-015-5401-y, 2016.
Zhao, M., Han, G., Wu, H., Song, W., Chu, X., Li, J., Qu, W., Li, X., Wei, S., Eller, F., and Jiang, C.: Inundation depth affects ecosystem CO2 and CH4 exchange by changing plant productivity in a freshwater wetland in the Yellow River Estuary, Plant Soil, 454, 87–102, https://doi.org/10.1007/s11104-020-04612-2, 2020.
Zheng, X., Wang, M., Wang, Y., Shen, R., Li, J., Jurgen, H., Martin, K., Li, L., and Jin, J.: Comparison of manual and automatic methods for measurement of methane emission from rice paddy fields, Adv. Atmos. Sci., 15, 569–579, https://doi.org/10.1007/s00376-998-0033-5, 1998.