the Creative Commons Attribution 4.0 License.
the Creative Commons Attribution 4.0 License.
 | 29 Jun 2023
Downpour dynamics: outsized impacts of storm events on unprocessed atmospheric nitrate export in an urban watershed
David M. Nelson
Keith N. Eshleman
Water quality impacts of stream water nitrate (NO) on downstream ecosystems are largely determined by the load of NO from the watershed to surface waters. The largest NO loads often occur during storm events, but it is unclear how loads of different NO sources change during storm events relative to baseflow or how watershed attributes might affect source export. To assess the role of storm flow and baseflow in NO source export and how these roles are modulated by hydrologic effects of land-use practices, we measured nitrogen (δ15N) and oxygen (Δ17O) isotopes of NO and oxygen isotopes (δ18O) of water in rainfall and stream water samples from before, during, and after eight storm events across 14 months in two Chesapeake Bay watersheds of contrasting land use. Storms had a disproportionately large influence on the export of unprocessed atmospheric NO (NO and a disproportionately small influence on the export of terrestrial NO (NO relative to baseflow in the developed urban watershed. In contrast, baseflow and storm flow had similar influences on NO and NO export in the mixed agricultural–forested watershed. An equivalent relationship between NO deposition on impervious surfaces and event NO stream water export in the urban watershed suggests that impervious surfaces that hydrologically connect runoff to channels likely facilitate the export of NO during rainfall events. Additionally, larger rainfall events were more effective at exporting NO in the urban watershed, with increased rainfall depth resulting in a greater fraction of event NO deposition exported. Considering both projected increases in precipitation amounts and intensity and urban/suburban sprawl in many regions of the world, best management practices that reduce the hydrologic connectivity of impervious surfaces will likely help to mitigate the impact of storm events on NO export from developed watersheds.
- Article
(2142 KB) - Full-text XML
-
Supplement
(1355 KB) - BibTeX
- EndNote


Increasing stream water nitrate (NO) export over the past century has negatively impacted many downstream ecosystems globally (Kemp et al., 2005; Camargo and Alonso, 2006; Steffen et al., 2015; Stevens, 2019). The severity of impacts on receiving waters is partially determined by the magnitude of NO loads (i.e., the product of concentration and discharge; National Research Council, 2000). As such, riverine NO loads are greatest during periods of high discharge, which often follow large precipitation events, and can therefore have an outsized impact on annual stream water NO loads (Vaughan et al., 2017; Kincaid et al., 2020). Sources of NO comprising storm event loads can be variable and associated with changing hydrologic flow paths during precipitation events (Buda and DeWalle, 2009). Exported loads of individual NO sources (e.g., atmospheric NO) are less often quantified during storm events than routine baseflow samples, however (Divers et al., 2014; Sabo et al., 2016). Thus, it is not clear whether storm events have a disproportionate impact relative to non-storm (i.e., baseflow) conditions on different NO sources. The impact of storm events relative to baseflow on sources of stream water NO is particularly relevant given the increases in precipitation amount and intensity projected to be associated with future climate change (Walsh et al., 2014). Precipitation can affect the amount and source of NO exported in surface waters via the surface-to-stream flow path. During storms, NO can be transported to streams by either overland or subsurface pathways. Overland flow is associated with NO sources deposited or present on the land surface, such as unprocessed atmospheric NO (NO; Rose et al., 2015a). Subsurface flow is associated with NO sources abundant in soils and groundwater, such as fertilizer, microbial, and/or sewage (Cook and Herczeg, 2012). Both hydrologic flow paths (and the respective NO sources) can be affected by human land-use activities (Paul and Meyer, 2001; Barnes and Raymond, 2010; Jarvis, 2020). For example, previous studies report that developed watersheds export relatively more NO than less developed watersheds, presumably due to hydrologic changes created by impervious surfaces (Buda and DeWalle, 2009; Burns et al., 2009; Kaushal et al., 2011; Bostic et al., 2021). However, evidence is lacking for (1) the mechanism generating increased NO export in developed watersheds and (2) quantitative impacts of storm event loads relative to baseflow, both of which could be useful for mitigating the effects of storms on stream water NO export.
The stable isotope compositions of NO and water (H2O) are powerful tools for distinguishing NO sources and hydrologic flow paths, respectively. For example, the oxygen isotope values (Δ17O) of NO allow for the quantification of atmospheric and terrestrial sources of NO in stream water (Michalski et al., 2003), and δ15N and δ18O values of NO permit inferences into the relative contributions of terrestrially sourced NO (NO), such as fertilizer or sewage N (Kendall et al., 2007). Additionally, δ18O values of H2O can be used to assess the importance of overland versus subsurface flow through the partitioning of streamflow into pre-event and event contributions (Sklash et al., 1976; McGuire and McDonnell, 2007). Few studies have coupled these isotopic tracers (Buda and DeWalle, 2009), however, despite their suitability for assessing the effect of storm events on both hydrologic flow paths and the export of different NO sources. Such information could provide mechanistic evidence for the commonly reported relationship between developed watersheds and NO export.
Here we address the following research questions: how do storm events affect the total amount and sources of NO exported in streams relative to baseflow? More specifically, what is the relationship between hydrologic and biogeochemical effects of land use and the export of unprocessed atmospheric NO (NO and terrestrial NO (NO during storm events and baseflow? These questions were addressed in two Chesapeake Bay watersheds of contrasting land use. A two-watershed study is inherently comparative, potentially limiting the inferences that can be made regarding land-use effects. However, given the contrasting land uses (i.e., predominantly developed compared to mixed forest/agriculture) in these watersheds, we believe that this study can adequately address our research questions while presenting a “proof of concept” for future studies. To address these research questions, we collected moderate-frequency (45 min–12 h) stream water samples before, during, and after eight rainfall events, bulk rainfall samples corresponding to these events, and monthly baseflow samples in two catchments within the broader Chesapeake Bay watershed. We then used δ15N, δ18O, and Δ17O of NO and δ18O of H2O to determine NO sources and hydrologic flow paths, respectively. The Chesapeake Bay region is ideal for our study: it is one of the most ecologically and economically important estuaries in the world (NOAA, 1990) that has experienced recent improvements in ecosystem health associated with declining N loads (Chanat et al., 2016; Lefcheck et al., 2018; Zhang et al., 2018), but uncertainty surrounds continued water quality improvements, in part due to the effects of projected increases in precipitation intensity across its diverse land-use watershed (Najjar et al., 2010).
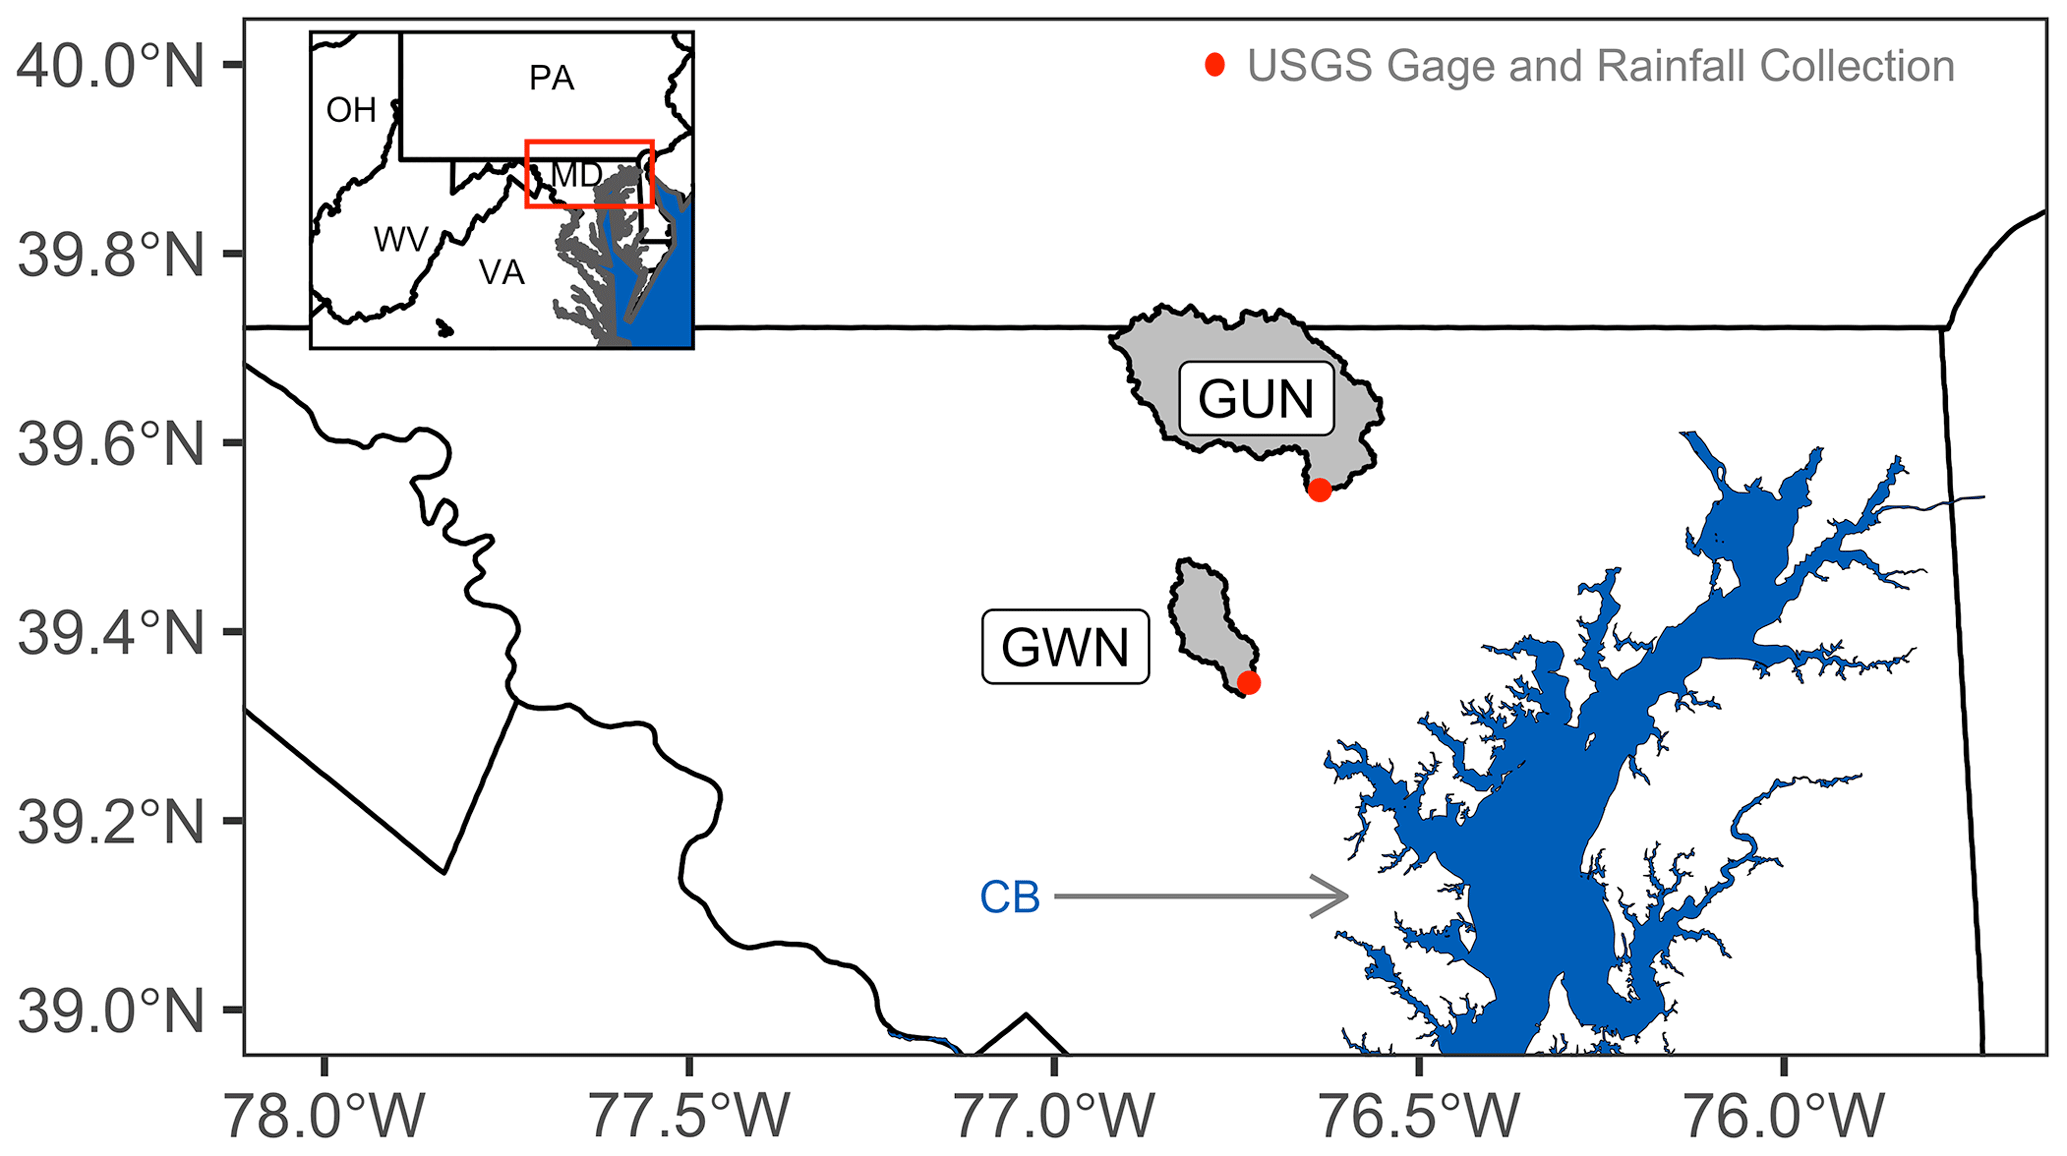
Figure 1Site map showing watershed boundaries (GWN: Gwynns Falls; GUN: Gunpowder Falls), United States Geological Survey (USGS) gauging stations and rainfall collection sites, and the Chesapeake Bay (CB) location. The inset map shows the relative positions of watersheds in Maryland (MD) relative to neighboring states (PA: Pennsylvania; OH: Ohio; WV: West Virginia; VA: Virginia).
Table 1Watershed attributes.
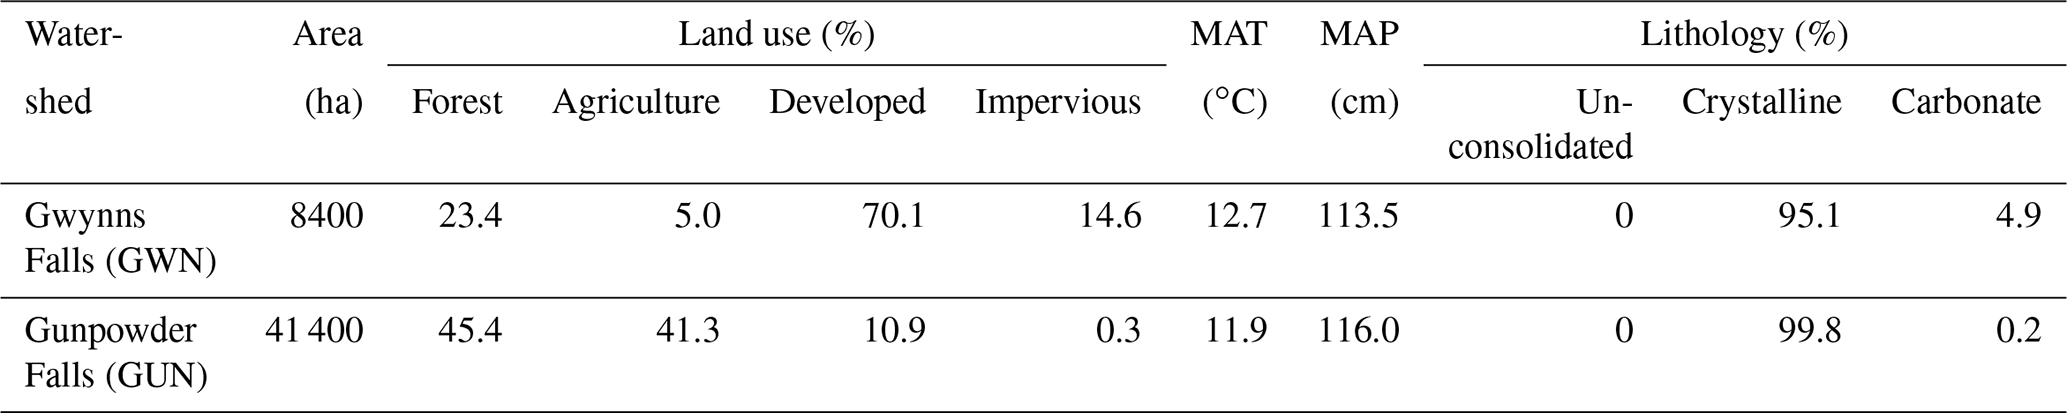
Land-use percentages were calculated from the 2016 National Land Cover Database. Impervious is the sum of medium- and high-intensity developed land-use classes. Agricultural land represents the sum of both the cultivated crop and pasture/hay land classes (Homer et al., 2020). Land-use percentages do not sum to 100 %, as not all land-use classes are listed (e.g., open water, wetlands). MAT: mean annual temperature; MAP: mean annual precipitation. Note that MAT and MAP cover the time period from 1981 to 2010 (PRISM, 2014). Lithology data were obtained from Zhang et al. (2019).
2.1 Study watersheds and field methods
To assess NO export dynamics during storm events, stream water and rainfall samples were collected synchronously during eight events from two watersheds with outlets in Maryland, USA – Gwynns Falls at Villa Nova (GWN) and Gunpowder Falls at Glencoe (GUN) (Fig. 1) – from September 2018 to October 2019. These watersheds have similar geology (Piedmont physiographic province; Fenneman, 1946) and climate (humid subtropical; Kottek et al., 2006) but differing land use (one predominantly developed and the other mixed forest and agriculture), impervious surface coverage (Fig. S1 in the Supplement), and area (Table 1). Events were targeted based on forecast precipitation amounts of at least 2.5 cm, and the same events were sampled at each site. Automated samplers (Teledyne ISCO 3700 Portable Sampler, Lincoln, NE) were used to collect stream water samples into pre-cleaned 1 L bottles across each storm hydrograph, including pre-storm baseflow, rising limbs, and falling limbs for most events at intervals ranging from 45 min to 12 h (Fig. S2). A pre-event baseflow sample was not collected for the first storm; thus, any figures or analyses that compare pre-event baseflow to event mean concentrations or event-water fractions have seven data points. Storm sample collection ceased when discharge fell to approximately 200 % of pre-event baseflow. Bulk rainfall samples corresponding to each event were collected using 7.5 cm diameter funnels approximately 1 m a.g.l. connected to pre-cleaned 1 L Nalgene bottles, with pre-cleaned table-tennis balls used to limit evaporation. Stream water and rainfall samples were placed on ice for 12–36 h after collection and then processed in the laboratory within 24–48 h. Both study watersheds are gauged by the United States Geological Survey; 15 min and mean daily discharge data were obtained using the dataRetrieval R package (DeCicco, 2018). Mean event rainfall depth for each watershed was obtained from the PRISM Climate Group (PRISM, 2014) using the prism R package (Hart and Bell, 2015).
2.2 Laboratory methods
Stream water and rainfall samples for NO concentration and isotope analyses were filtered (0.45 µm) and frozen within 48 h of collection. Aliquots for water isotope measurements were stored in completely filled (i.e., no headspace) 20 mL bottles at room temperature prior to analysis. NO and nitrite (NO concentrations were measured using flow-injection colorimetric analysis (Lachat Quikchem 8000 FIA+).
The Δ17O, δ18O, and δ15N values of stream and rainfall NO were measured using a Thermo Delta V+ isotope ratio mass spectrometer (Bremen, Germany) via the denitrifier method (Sigman et al., 2001; Casciotti et al., 2002) with thermal decomposition (at 800 ∘C) of N2O to N2 and O2 (Kaiser et al., 2007) at the Central Appalachians Stable Isotope Facility. NO is denitrified using this method as well, but NO concentrations in stream and rainfall samples were low relative to NO mean = 0.006, range = 0.00–0.027). Measured isotope ratios were normalized using international reference standards USGS 34 (δ17O = −14.8 ‰; δ18O = −27.9 ‰) and USGS 35 (δ17O = 51.5 ‰; δ18O = 57.5 ‰) for O isotopes (Böhlke et al., 2003) and USGS 32 (δ15N = 180 ‰) and USGS 34 (δ15N = −1.8 ‰) for N isotopes (IAEA, 1995). Reference standards were measured throughout sample analysis in equal concentrations to samples (ranging from 100 to 200 nmol depending on the sample NO concentration). The analytical precision of Δ17O (Δ17O ≈δ17O-0.52×δ18O) was estimated as 0.5 ‰, δ18O as 1.4 ‰ and δ15N as 1.8 ‰ (1σ), based on repeated measurements (n≅200) of reference standards USGS 32 and USGS 35 and a laboratory reference standard “Chile NO” (Duda Energy 1sn 1 lb. Sodium Nitrate Fertilizer 99+% Pure Chile Saltpeter). Accuracies of Δ17O, δ18O, and δ15N were tracked using repeated measurements of IAEA-N3 (n=19; mean Δ17O = -0.1 ‰; δ18O = 24.3 ‰; δ15N = 4.5 ‰) and closely agreed with published values (IAEA, 1995; Michalski et al., 2002; Böhlke et al., 2003). Each stream water and rainfall sample was measured three to six times to reduce analytical uncertainty, and the mean of each sample was used in all analyses. The standard error of the mean ranged from 0.1 ‰–0.6 ‰, 0.1 ‰–1.6 ‰, and 0.1 ‰–1.6 ‰ for replicate measurements of Δ17O, δ18O, and δ15N, respectively.
Oxygen (δ18O-H2O) isotopes of rainfall and stream water were measured using Picarro L2130-i via cavity ring-down spectroscopy at the University of Wyoming's Stable Isotope Facility. Measured isotope ratios were normalized to Vienna Standard Mean Ocean Water using internal laboratory standards that were calibrated to international standards. The precision based on repeated measurements of internal standards was 0.2 ‰.
2.3 Quantification of atmospheric NO deposition
Event NO deposition was quantified using the measured rainfall NO concentration and mean rainfall depth (Lovett et al., 2000; Nelson et al., 2018; Huang et al., 2020):
where rainfall volume is the product of rainfall depth and watershed area and 1 is a conversion factor. Event NO deposition onto impervious surfaces was then calculated by multiplying NO deposition by the percent of impervious surfaces.
2.4 Quantification of unprocessed atmospheric and terrestrial NO in streams
Concentrations of NO were quantified using Δ17O values of terrestrial and rainfall end-members and total NO concentrations:
where Δ17OStream is the Δ17O of stream water samples during either baseflow or storm events, Δ17OPrecip is the Δ17O of rainfall for a given event, Δ17OTerr is the Δ17O of terrestrially sourced NO which is ≅0 ‰, NO is terrestrial NO, and NO are measured stream water NO concentrations. Uncertainty in NO was estimated by propagating analytical uncertainty from repeated measures of Δ17OStream and Δ17OPrecip.
2.5 Quantification of event loads and mean concentrations and monthly loads
Event loads of NO and NO were calculated as
where L is the load of either NO, NO, or NO (grams per event), Ci is the concentration of either NO or NO (mg N L−1) for sample i, Vi is the volume of water exported corresponding to sample i (L), and is a conversion factor (mg to g). Event yields (g N ha−1 per event) of NO, NO, and NO were calculated by normalizing loads by watershed area. To assess potential bias in NO load quantification between our method (i.e., multiple samples collected during a storm event; Eq. 5) and methods in which a single sample is collected, we multiplied the mean daily discharge by NO concentrations of each individual grab sample collected during a particular event. We compared these estimated loads with the “true” load (calculated using Eq. 5) and calculated bias as the difference between the true load and loads estimated using a single sample and daily average discharge. Because traditional methods commonly use mean daily discharge, we only investigated bias for two events that included samples collected over 1 full day. We also calculated the event fraction of unprocessed atmospheric NO (fAtm) using Δ17O (Eq. 2) and δ18O (substituting δ18O for Δ17O in Eq. (2) and assuming that baseflow samples for a corresponding storm represent the terrestrial NO end-member δ18O value).
Event mean concentrations (EMCs) of NO and NO and event mean values (EMVs) of Δ17O, δ18O, and δ15N were calculated as
where EMC is the event mean concentration (mg N L−1, NO and NO, EMV is the event mean value (‰, Δ17O, δ18O, and δ15N), Ci is either the concentration of NO or NO (mg N L−1) or the value of Δ17O, δ18O, or δ15N (‰) corresponding to sample i, and Vi is the volume of water exported corresponding to sample i (L).
Monthly loads of NO were estimated using Weighted Regressions on Time, Discharge, and Season Kalman Filter (WRTDS-K; Zhang and Hirsch, 2019). Regressions were calibrated using the entire period of record for NO (excluding our storm samples) to generate coefficients representing a greater range of hydroclimatological conditions than was realized in 13 months. NO concentration data for the entire period of record were obtained from the Chesapeake Bay Program water quality database (Chesapeake Bay Program, 2021). Our storm samples were excluded to generate similar estimates of monthly and annual loads used by monitoring agencies (e.g., Maryland Department of Natural Resources, US Environmental Protection Agency) in these watersheds. Monthly yields (g N ha−1) were calculated by dividing monthly loads by watershed area, and monthly flow-weighted concentrations (mg N L−1) were calculated by dividing monthly loads by monthly discharge. The uncertainty of NO was estimated using block bootstrapping methods for WRTDS-K (Zhang and Hirsch, 2019) and was propagated through all analyses using NO loads and/or yields.
The fraction of rainfall NO exported on an event basis was calculated as
where event NO deposition was calculated using Eq. (1) and event NO yield was calculated using Eq. (5).
2.6 Terrestrial δ18O and δ15N calculation
Stream water storm samples of δ18O and δ15N were corrected to remove the influence of NO (Dejwakh et al., 2012), which has higher δ18O values and can have lower δ15N values than terrestrial NO (Elliott et al., 2007; Kendall et al., 2007). This was done to more carefully infer how terrestrial sources of NO might change during storm events, and it uses the following equations:
where is measured δ15N or δ18O of stream water storm samples, is rainfall δ15N or δ18O for a given event, fAtm is the fraction of NO as calculated using Eq. (2), and fTerr = 1−fAtm.
2.7 Hydrograph separation
Water isotopes were used to quantify the proportion of event and pre-event water during storm events at or near peak discharge. The direct routing, or translation of rainfall to stream water during the same event, was quantified as the event-water fraction (i.e., rainfall), whereas water present in the catchment prior to the storm event was classified as the pre-event-water fraction (i.e., baseflow) using the following equations (Sklash et al., 1976):
where δ18OPeak Q=δ18O at or near peak discharge during storm events, δ18OBaseflow=δ18O of stream water just prior to storm event and hydrograph rise, and δ18ORainfall=δ18O of bulk rainfall samples during a given storm event. Event and pre-event-water runoff can be quantified using these equations by multiplying runoff during peak storm flow by fractions of event and pre-event water. Uncertainty was estimated using published methods to account for analytical uncertainty and separation, or lack thereof, of end-members (Genereux, 1998). It has been shown that some of the assumptions of isotope-based hydrograph separation may be violated in mesoscale catchments (e.g., spatiotemporally constant end-member values; Klaus and McDonnell, 2013), and thus we estimate event-water fractions and runoff for peak discharge only and apply these data cautiously.
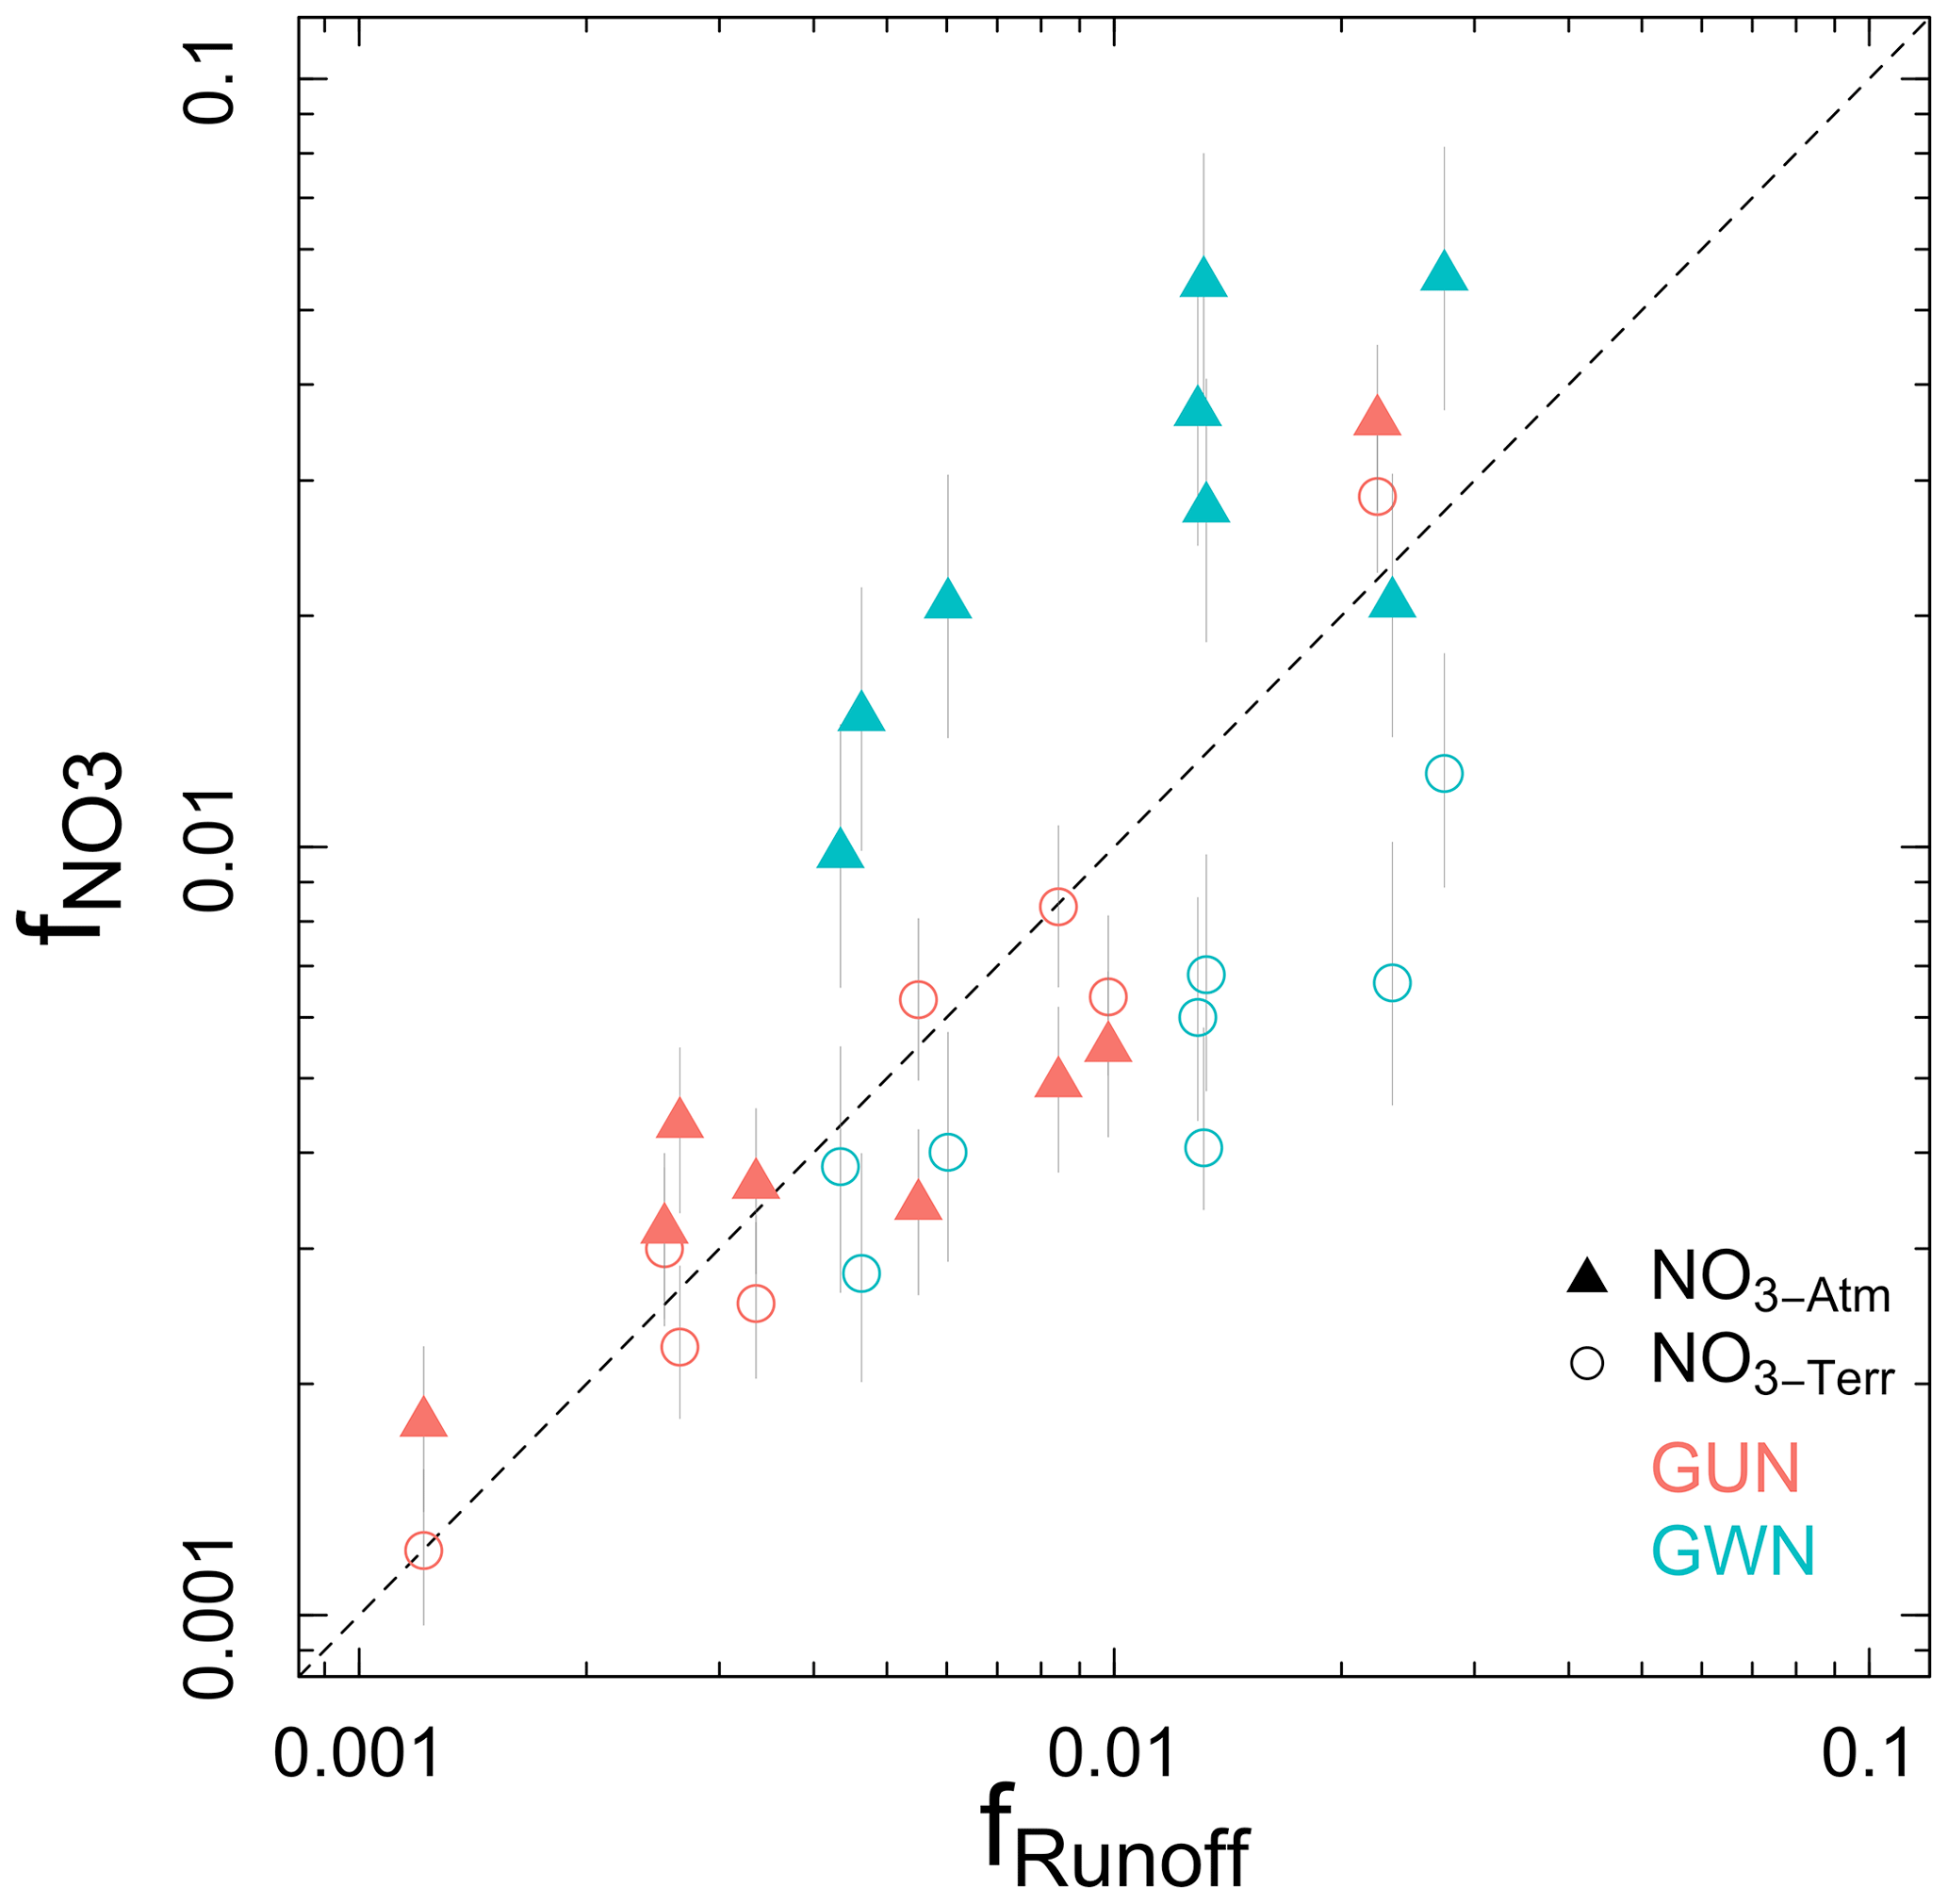
Figure 2Fraction of NO loads (fNO3, separated by NO3 Terr, circles, and NO3 Atm, triangles) and discharge (fRunoff) during the study duration (14 months) represented by sampled storm events (n=8). Points falling above the dashed line (1:1 line) indicate that storm events have an outsized impact on NO loads, and points falling below the line indicate that baseflow has an outsized impact on NO loads. Points on or near the 1:1 line indicate a chemostatic response in which neither storms nor baseflow have an outsized impact on NO loads.
2.8 Framework for interpreting baseflow and storm flow contributions
The importance of storm events relative to baseflow in stream water NO export can be evaluated using a fractional export plot (Fig. 2). In this plot the y axis shows the fraction of annual nitrate loads exported during a single event (, and the x axis shows the fraction of annual discharge exported during a single event (fRunoff). For example, if NO concentrations remain constant with changing discharge during a storm, the data would fall on the 1:1 line because their load is perfectly explained by discharge and both storm events and baseflow have an equal impact on loads (Fig. 2). If NO concentrations decrease with increasing discharge during a storm, the data would plot below the 1:1 line. Watersheds with events consistently plotting below the 1:1 line indicate that baseflow, relative to storm events, has an outsized impact on riverine NO loads. If NO concentrations increase with increasing discharge, the data would plot above the 1:1 line. Watersheds with events consistently plotting above the 1:1 line indicate that storm events have an outsized impact on riverine NO loads. This framework can be expanded further by quantifying the (potential) disproportionate effect of storm events on stream water constituent loads relative to water yields. Dividing by fRunoff provides a single value to quantify the level of disproportionality:
DF can be interpreted using Fig. 2: a value falling on the 1:1 line would have DF = 1, a value below the 1:1 line would have DF<1, and a value above the 1:1 line would have DF>1. For example, an event with DF=4 indicates that a given storm exported 4 times more NO than water, whereas an event with DF=0.5 indicates that a storm exported 2 times less NO than water after both have been normalized to annual amounts.
2.9 Statistical analyses
All statistical tests were performed in R (R Development Core Team, 2019). A Wilcoxon ranked-sum test was used to compare the EMC and EMV of paired stream water storm and baseflow samples. Due to the presence of outliers, Theil–Sen slopes (calculated using the senth function in R) were used to assess relationships between most continuous variables (Helsel et al., 2020). Least-squares linear regression was used when outliers were absent. Confidence intervals (95 %) and p values of Theil–Sen slopes were computed using bootstrapping (10 000 replicates) to incorporate uncertainty into DF and event-water fractions.
Rainfall depth and chemistry (NO concentrations and isotopes, H2O isotopes) were similar between watersheds for sampled events (p>0.1, Table S1 in the Supplement). Rainfall depths ranged from 1.90 to 8.10 cm, which corresponds to a range of 24 h precipitation depth return intervals of <1 year (1-year return interval ≈6.75 cm) up to 2 years (2-year return interval ≈8.3 cm) in this region (Bonnin et al., 2004). Rainfall NO concentrations ranged from 0.05 to 0.26 mg N L−1, δ15N-NO from −8.7 ‰ to −1.4 ‰, δ18O-NO from 48.0 ‰ to 69.6 ‰, and Δ17O-NO from 13.6 ‰ to 24.9 ‰. Streamflow was slightly more variable in GWN during storm events (Table S2): event mean runoff and event maximum runoff were higher in GWN (p<0.05 and p<0.01, respectively), but event median runoff was not different between the watersheds (p=0.11). Across all flow conditions, NO concentrations were lower at GWN (median = 0.78 mg N L−1) than GUN (median = 2.60 mg N L−1). Baseflow NO concentrations were higher than storm flow NO EMCs in both watersheds, but differences were more pronounced at GWN (baseflow median = 1.79 mg N L−1, storm median = 0.66 mg N L−1, p<0.05) than GUN (baseflow median = 3.06 mg N L−1, storm median = 2.55 mg N L−1, p<0.05, Fig. 3 and Table S3).
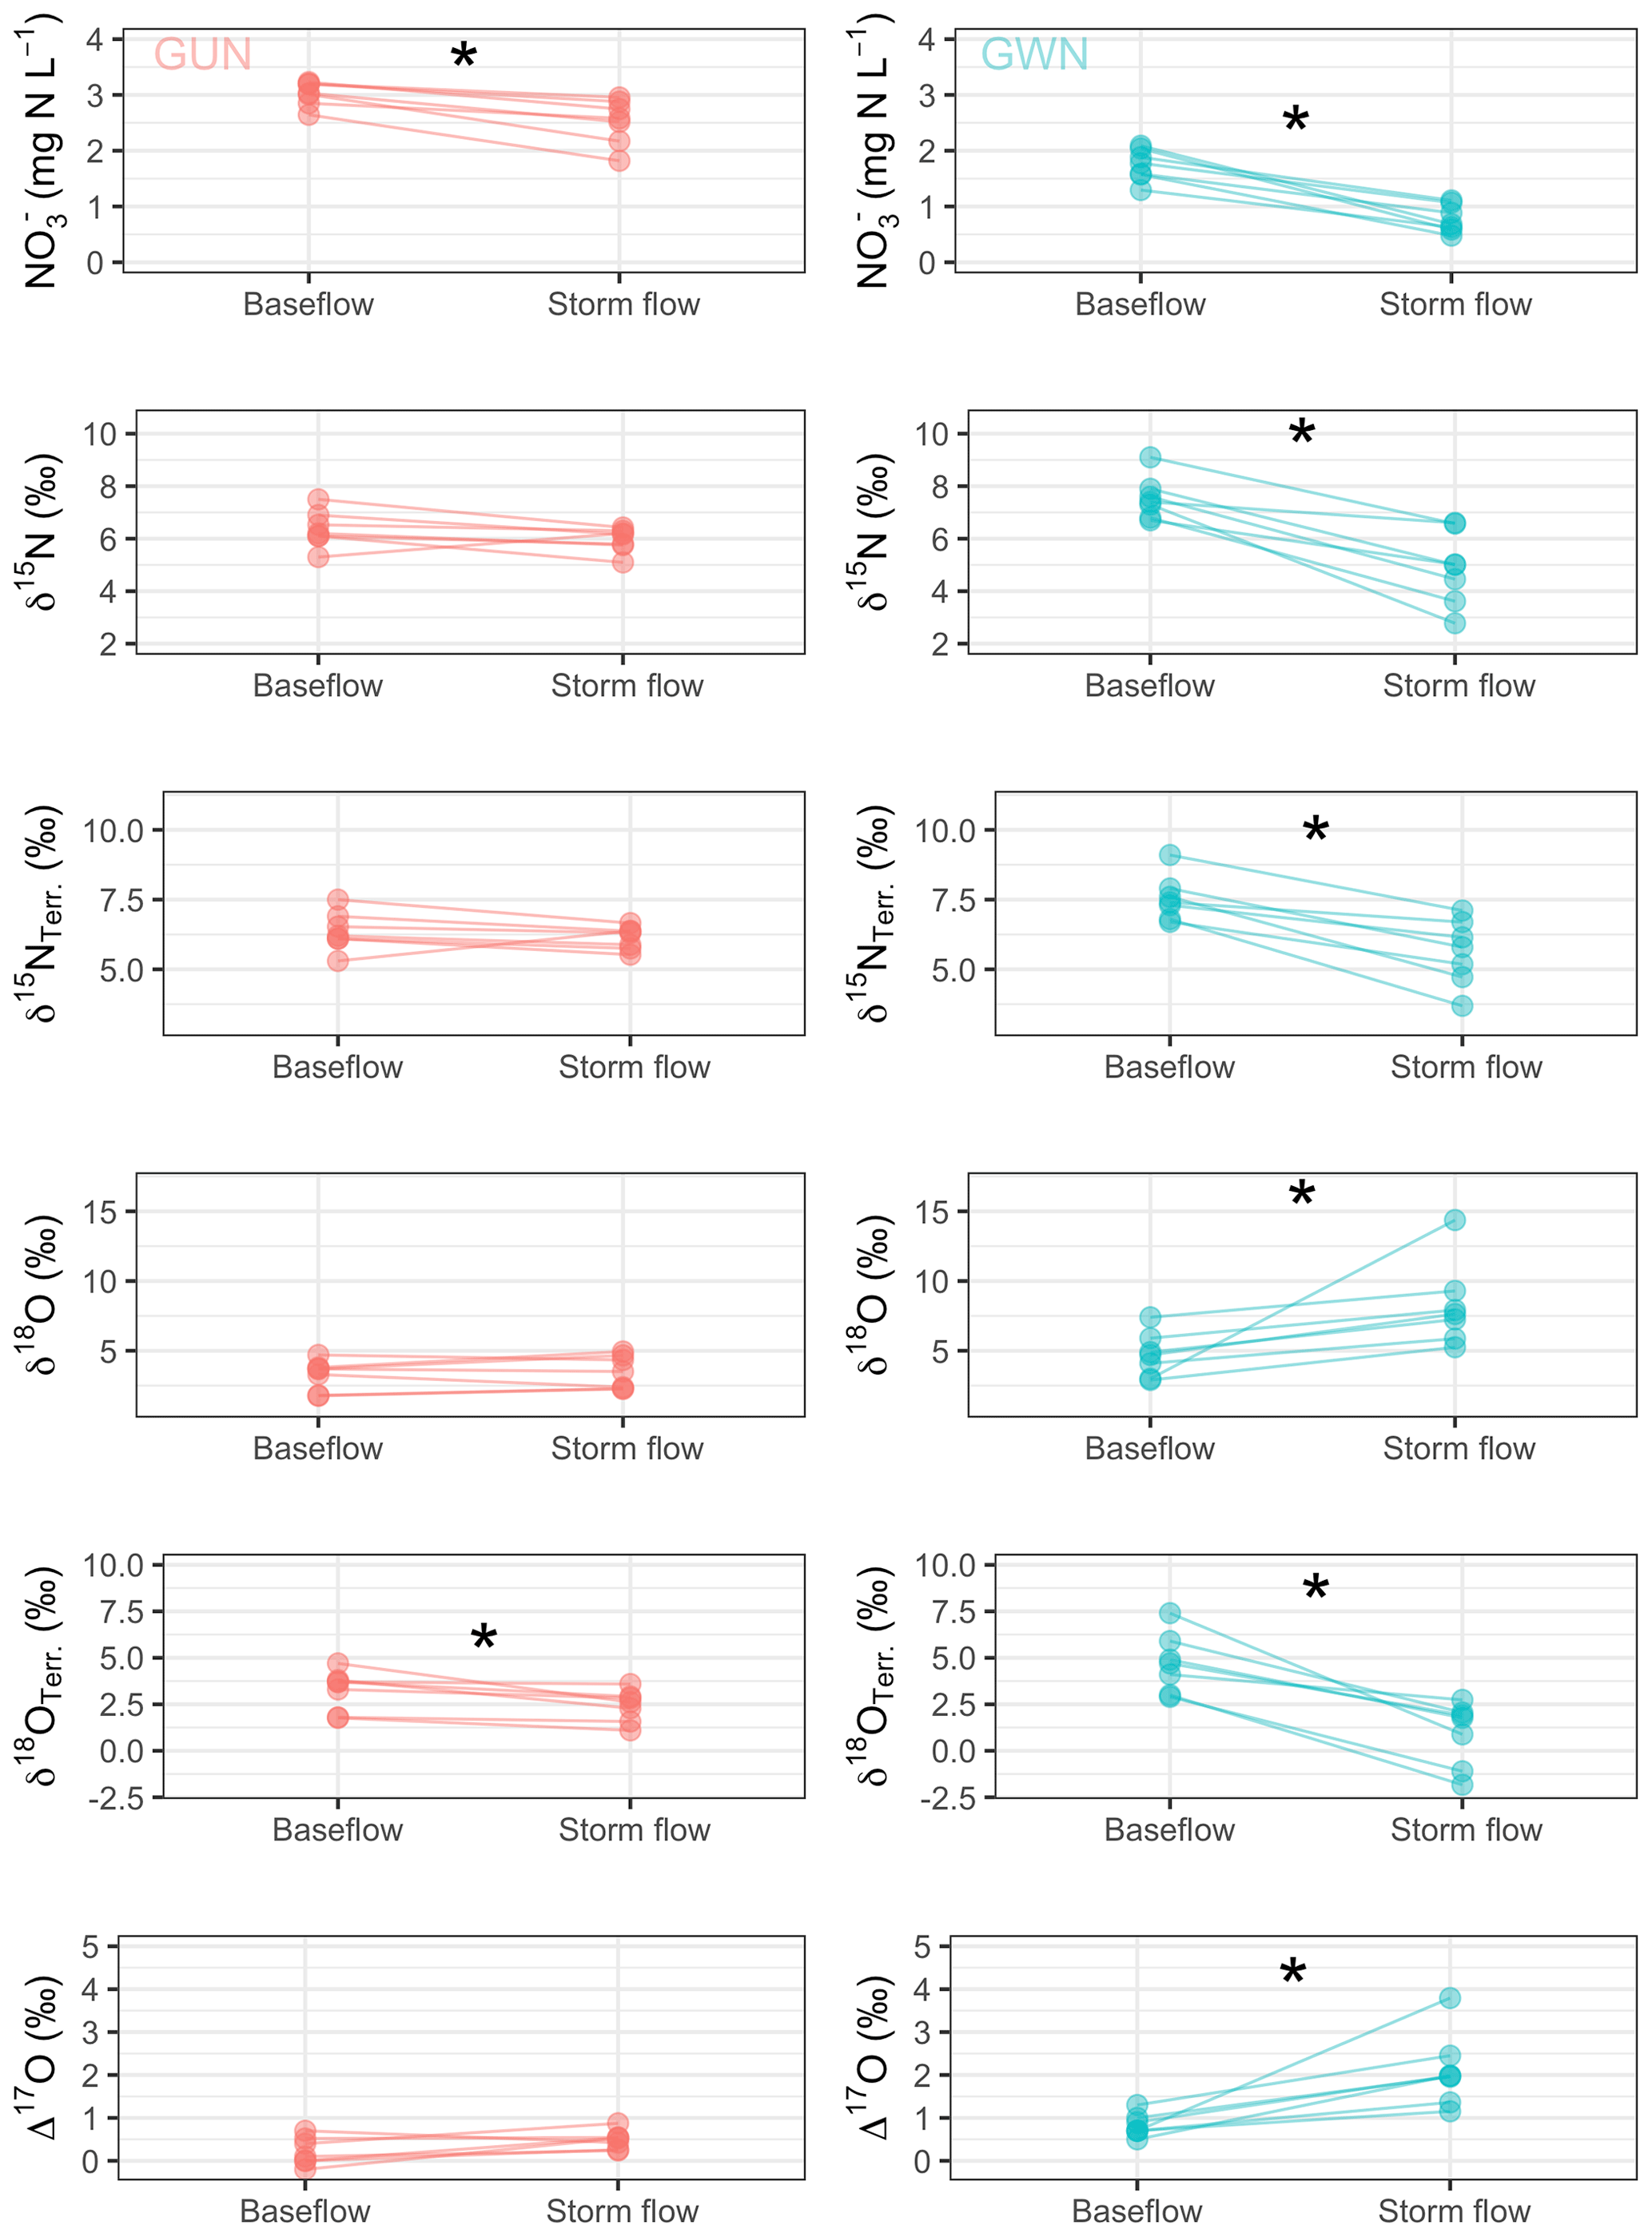
Figure 3Event mean NO concentrations and δ15N, δ15NTerr, δ18O, δ18OTerr, and Δ17O values of NO for samples collected during storm events paired with the corresponding baseflow sample preceding the event. An asterisk (*) indicates a significant difference at p<0.05 as determined using a Wilcoxon ranked-sum test.
At GWN, values of δ15N were higher in baseflow (median δ15N = 7.6 ‰) than storm flow (EMV median δ15N = 5.0 ‰, respectively, p<0.05), whereas values of δ18O-NO were lower in baseflow (median δ18O = 3.9 ‰) than storm flow (EMV median δ18O = 7.4 ‰, p<0.05). In contrast, values of δ15N- and δ18O-NO did not differ between baseflow and storm flow at GUN (baseflow median δ15N = 6.2 ‰; δ18O = 3.3 ‰; storm flow EMV median δ15N = 6.1 ‰, δ18O = 3.0 ‰; Fig. 3 and Table S3). Values of δ18O-NO3 Terr were higher during baseflow at both sites (p<0.05, Fig. 3), whereas δ15N-NO3 Terr was higher during baseflow at GWN only (p<0.05, Fig. 3). Similarly, Δ17O of NO was not significantly different between baseflow (median = 0.4 ‰) and storm flow (EMV median = 0.5 ‰) at GUN but was lower during baseflow (median = 0.7 ‰) than storm flow (EMV median = 2.0 ‰; p<0.05; Fig. 3 and Table S3) at GWN.
Concentrations of NO were more temporally variable than NO. Concentrations of NO showed similar patterns to NO at both watersheds: higher during baseflow than storm events (GWN baseflow median = 1.72 mg N L−1, storm flow median = 0.59 mg N L−1; p<0.001, GUN baseflow median = 3.03 mg N L−1, storm flow median = 2.50 mg N L−1; p<0.005, Fig. S3). Both GWN and GUN had similar NO concentrations between baseflow and storm events (GWN baseflow median = 0.05 mg N L−1, storm flow median = 0.06 mg N L−1; p>0.05, GUN baseflow median = 0.04 mg N L−1, storm flow median = 0.06 mg N L−1; p>0.05, Fig. S3).
Similar to NO concentrations and isotopes, δ18O-H2O values exhibited greater variability between baseflow and peak streamflow in GWN than in GUN. From baseflow to approximately peak streamflow, δ18O-H2O shifted by an absolute average of 2.1 ‰ at GWN but only 0.6 ‰ at GUN (Table S2). These shifts correspond to average event-water fractions at peak storm discharge of 0.75 ± 0.13 at GWN and 0.27 ± 0.23 at GUN (Table S2). Event-water fraction uncertainty was relatively large for several events due to small separation between δ18O-H2O end-members. For example, rainfall and pre-event baseflow end-members were separated by only 0.5 ‰ during the 22 July 2019 event at GUN, resulting in uncertainty of event-water fractions exceeding 1 (Tables S1 and S2).
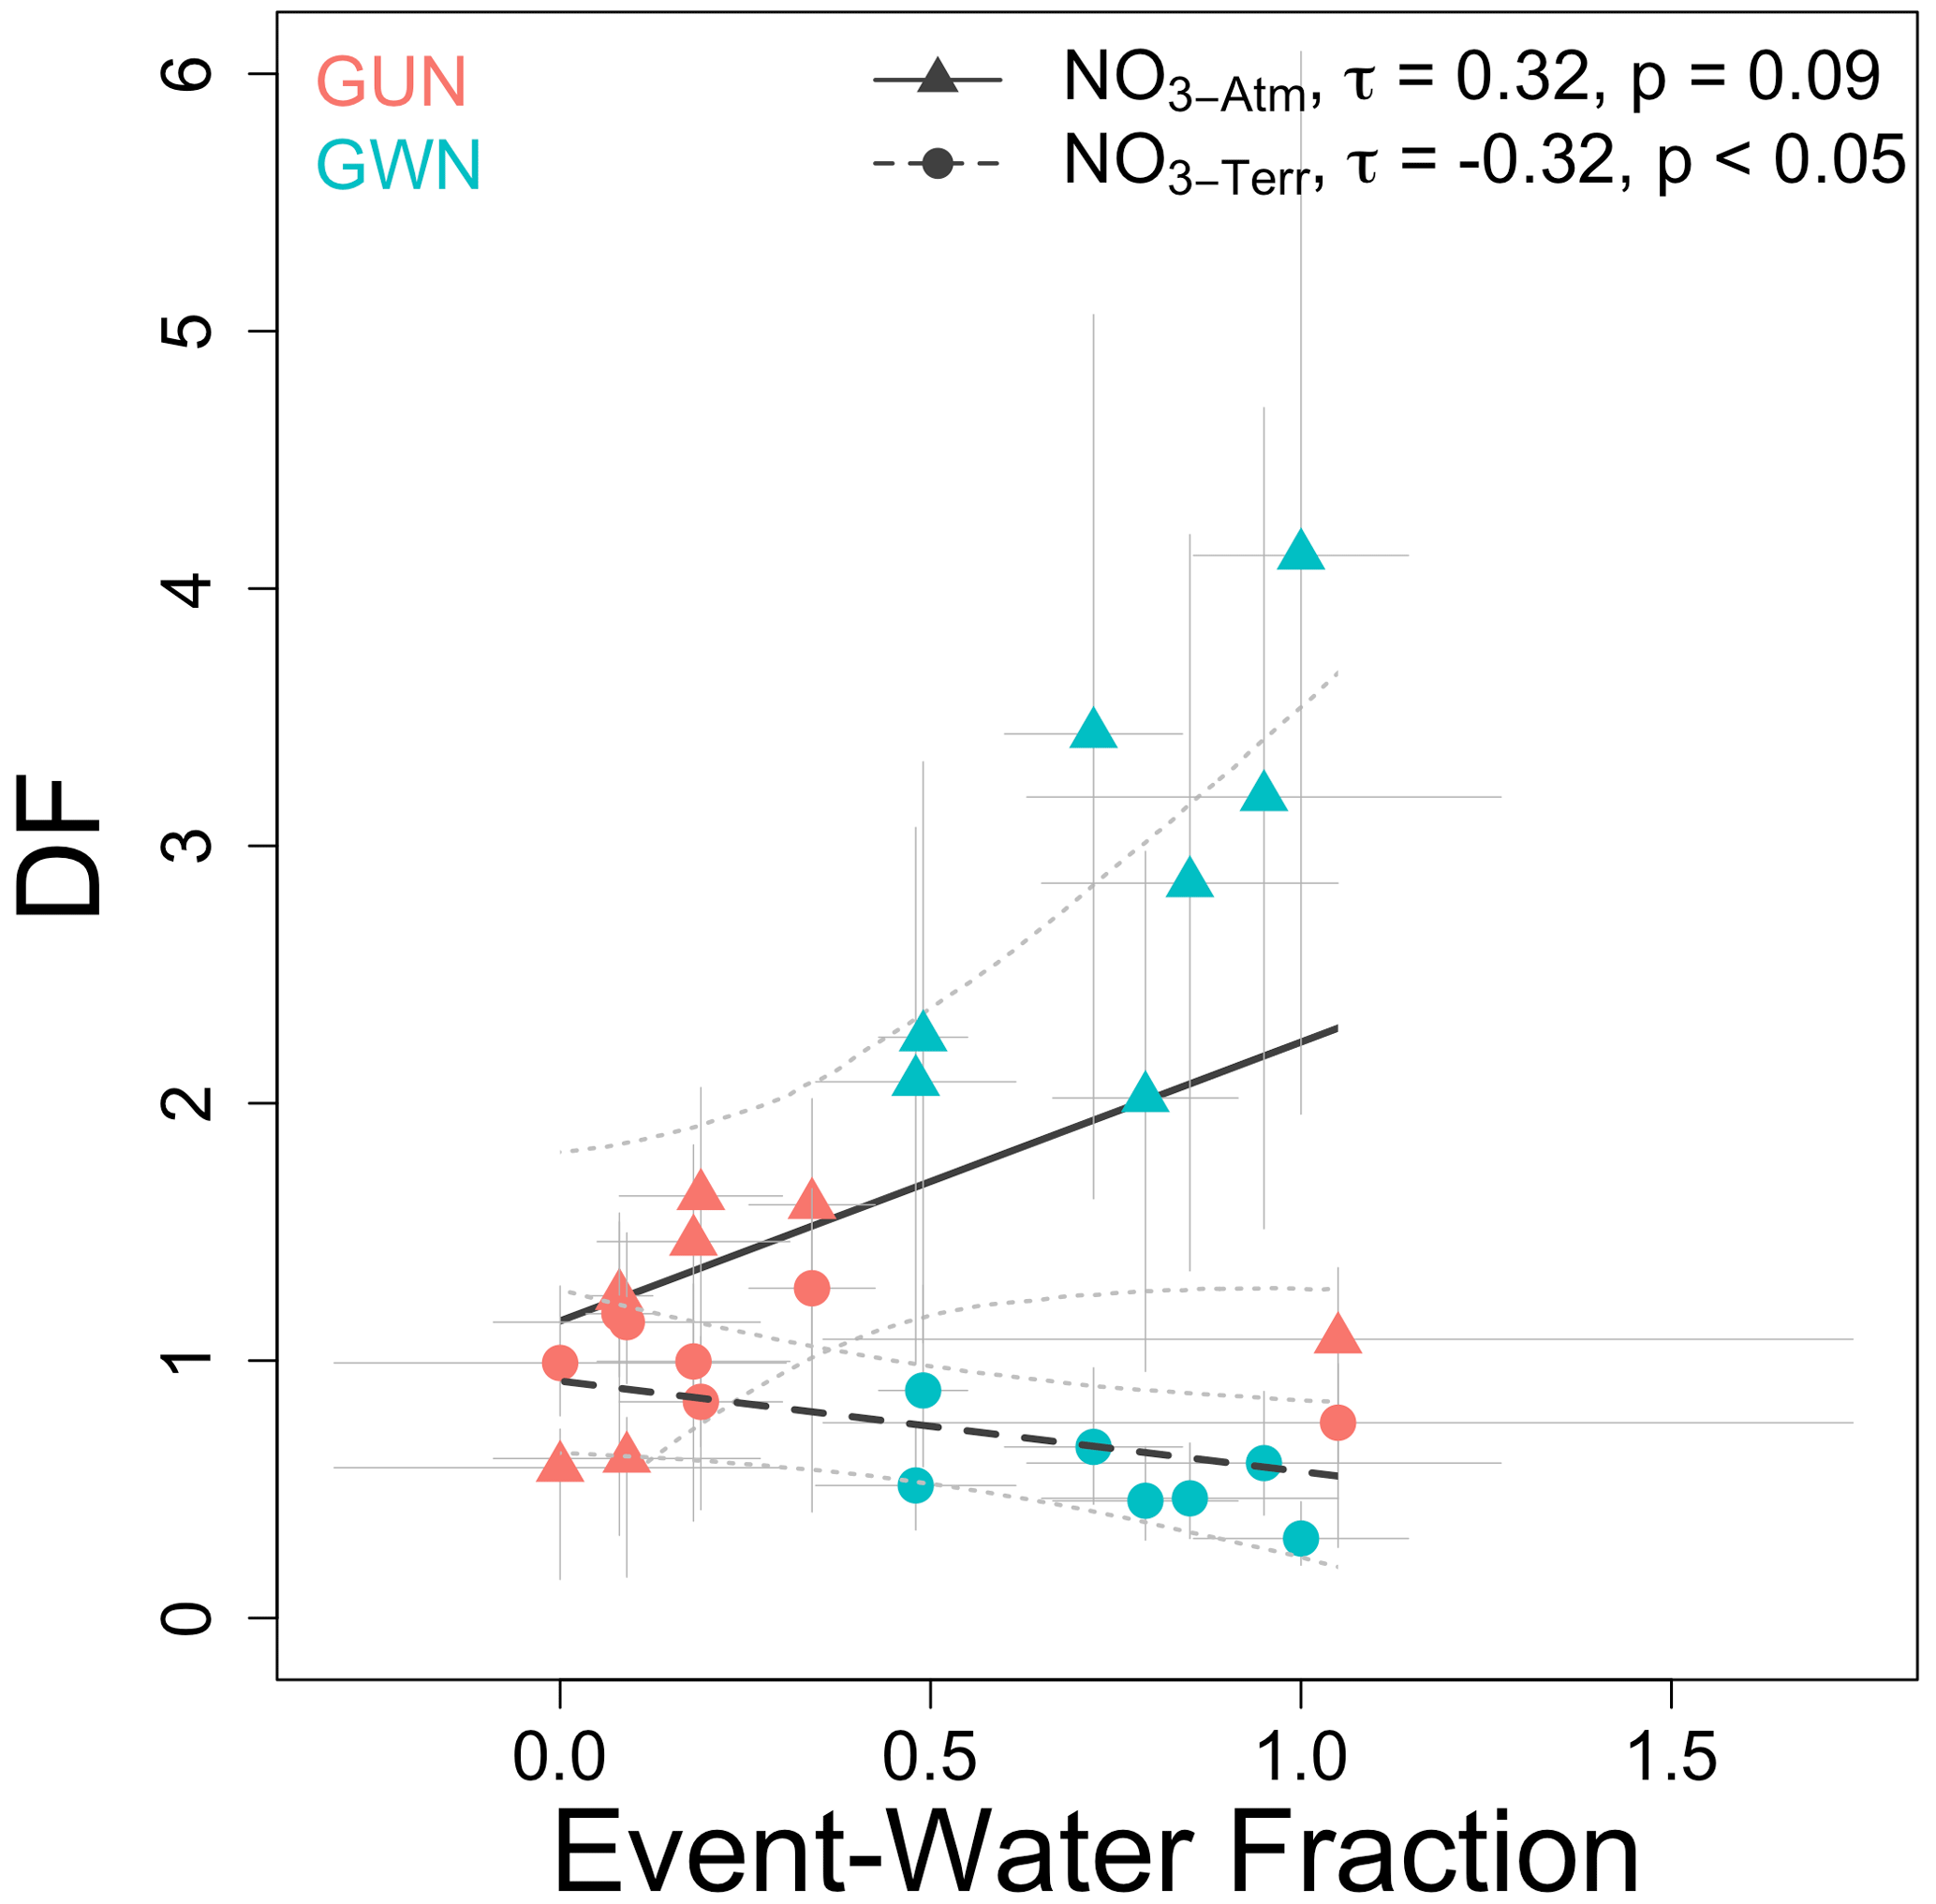
Figure 4Disproportionality factor (DF) and event-water fraction for NO (triangles) and NO (circles). Event-water fraction and DF are positively but not significantly correlated for NO (τ=0.32, p=0.09), while event-water fraction and DF are significantly negatively correlated for NO (, p<0.05) across both watersheds. The thin dotted line shows bootstrapped 95 % confidence intervals.
Storm events have an outsized impact, relative to baseflow, on NO export at GWN, as indicated by DF>1 for seven of eight sampled events (mean = 2.6 ± 0.4; Fig. 2). The opposite relationship was observed for NO at GWN (DF≤1 for all sampled events, mean = 0.5 ± 0.1), indicating that baseflow has an outsized impact on NO loads relative to storm events. Conversely, DF values at GUN were approximately 1 for both NO (mean = 1.1 ± 0.2) and NO (mean = 1.0 ± 0.1), indicating that neither baseflow nor storm flow disproportionately impacted stream NO loads (Fig. 2). Event-water fractions were positively, though not significantly, related to the DF of NO (τ=0.32, p=0.09) and negatively related to the DF of NO across both watersheds (Fig. 4; , p<0.05). In GWN, the total rainfall depth for a given event was positively correlated with the fraction of deposited NO that was exported in stream water during the same event (τ=0.74, p<0.05), but there was no relationship for GUN (Fig. 5). Additionally, there was a 1:1 relationship between the event NO deposition on impervious surfaces and the event NO stream water export at GWN (r2=0.55, p<0.05), but not at GUN (Fig. 6). NO load estimates using traditional methods (concentration from a single grab sample multiplied by mean daily discharge) were biased (range = −197 %–123 %, median absolute value = 36 %) relative to NO load estimates using the multiple samples we collected across the storm hydrograph for the two events that encompassed a full day.
Hydrologic effects of impervious surfaces likely drive the disproportionate impact of storm events on NO and of baseflow on NO in the more developed watershed (GWN). Impervious surfaces increase peak storm runoff (Arnold and Gibbons, 1996; Walsh et al., 2005), but differences in peak discharge alone are not the sole explanation for the contrasting results of DF for NO3 Terr and NO between the watersheds. Sampled events with overlapping fRunoff between sites (i.e., similar x-axis values in Fig. 2) indicate that the difference between for NO and NO is much greater at the more developed (GWN) than less developed watershed (GUN, i.e., different y-axis values in Fig. 2). Thus, it is the overland routing of rainfall, and NO dissolved therein, that likely contributes to the outsized impact of storm events on NO in the developed watershed. Although both watersheds show a positive relationship between event-water fractions and DF of NO (p=0.09, Fig. 4), event-water fractions are much greater in the more developed watershed, GWN (green triangles in Fig. 4). Higher event-water fractions promote greater export of NO by reducing the potential for biological processing or retention. Our results provide evidence (i.e., increased event-water fractions, proportional stream water export of impervious NO deposition) for the mechanism (i.e., direct routing of rainfall NO to streams) that generates increased NO export in more developed watersheds, which thus expands on previous research demonstrating that more developed watersheds export relatively more NO (Buda and DeWalle, 2009; Burns et al., 2009; Kaushal et al., 2011; Bostic et al., 2021).
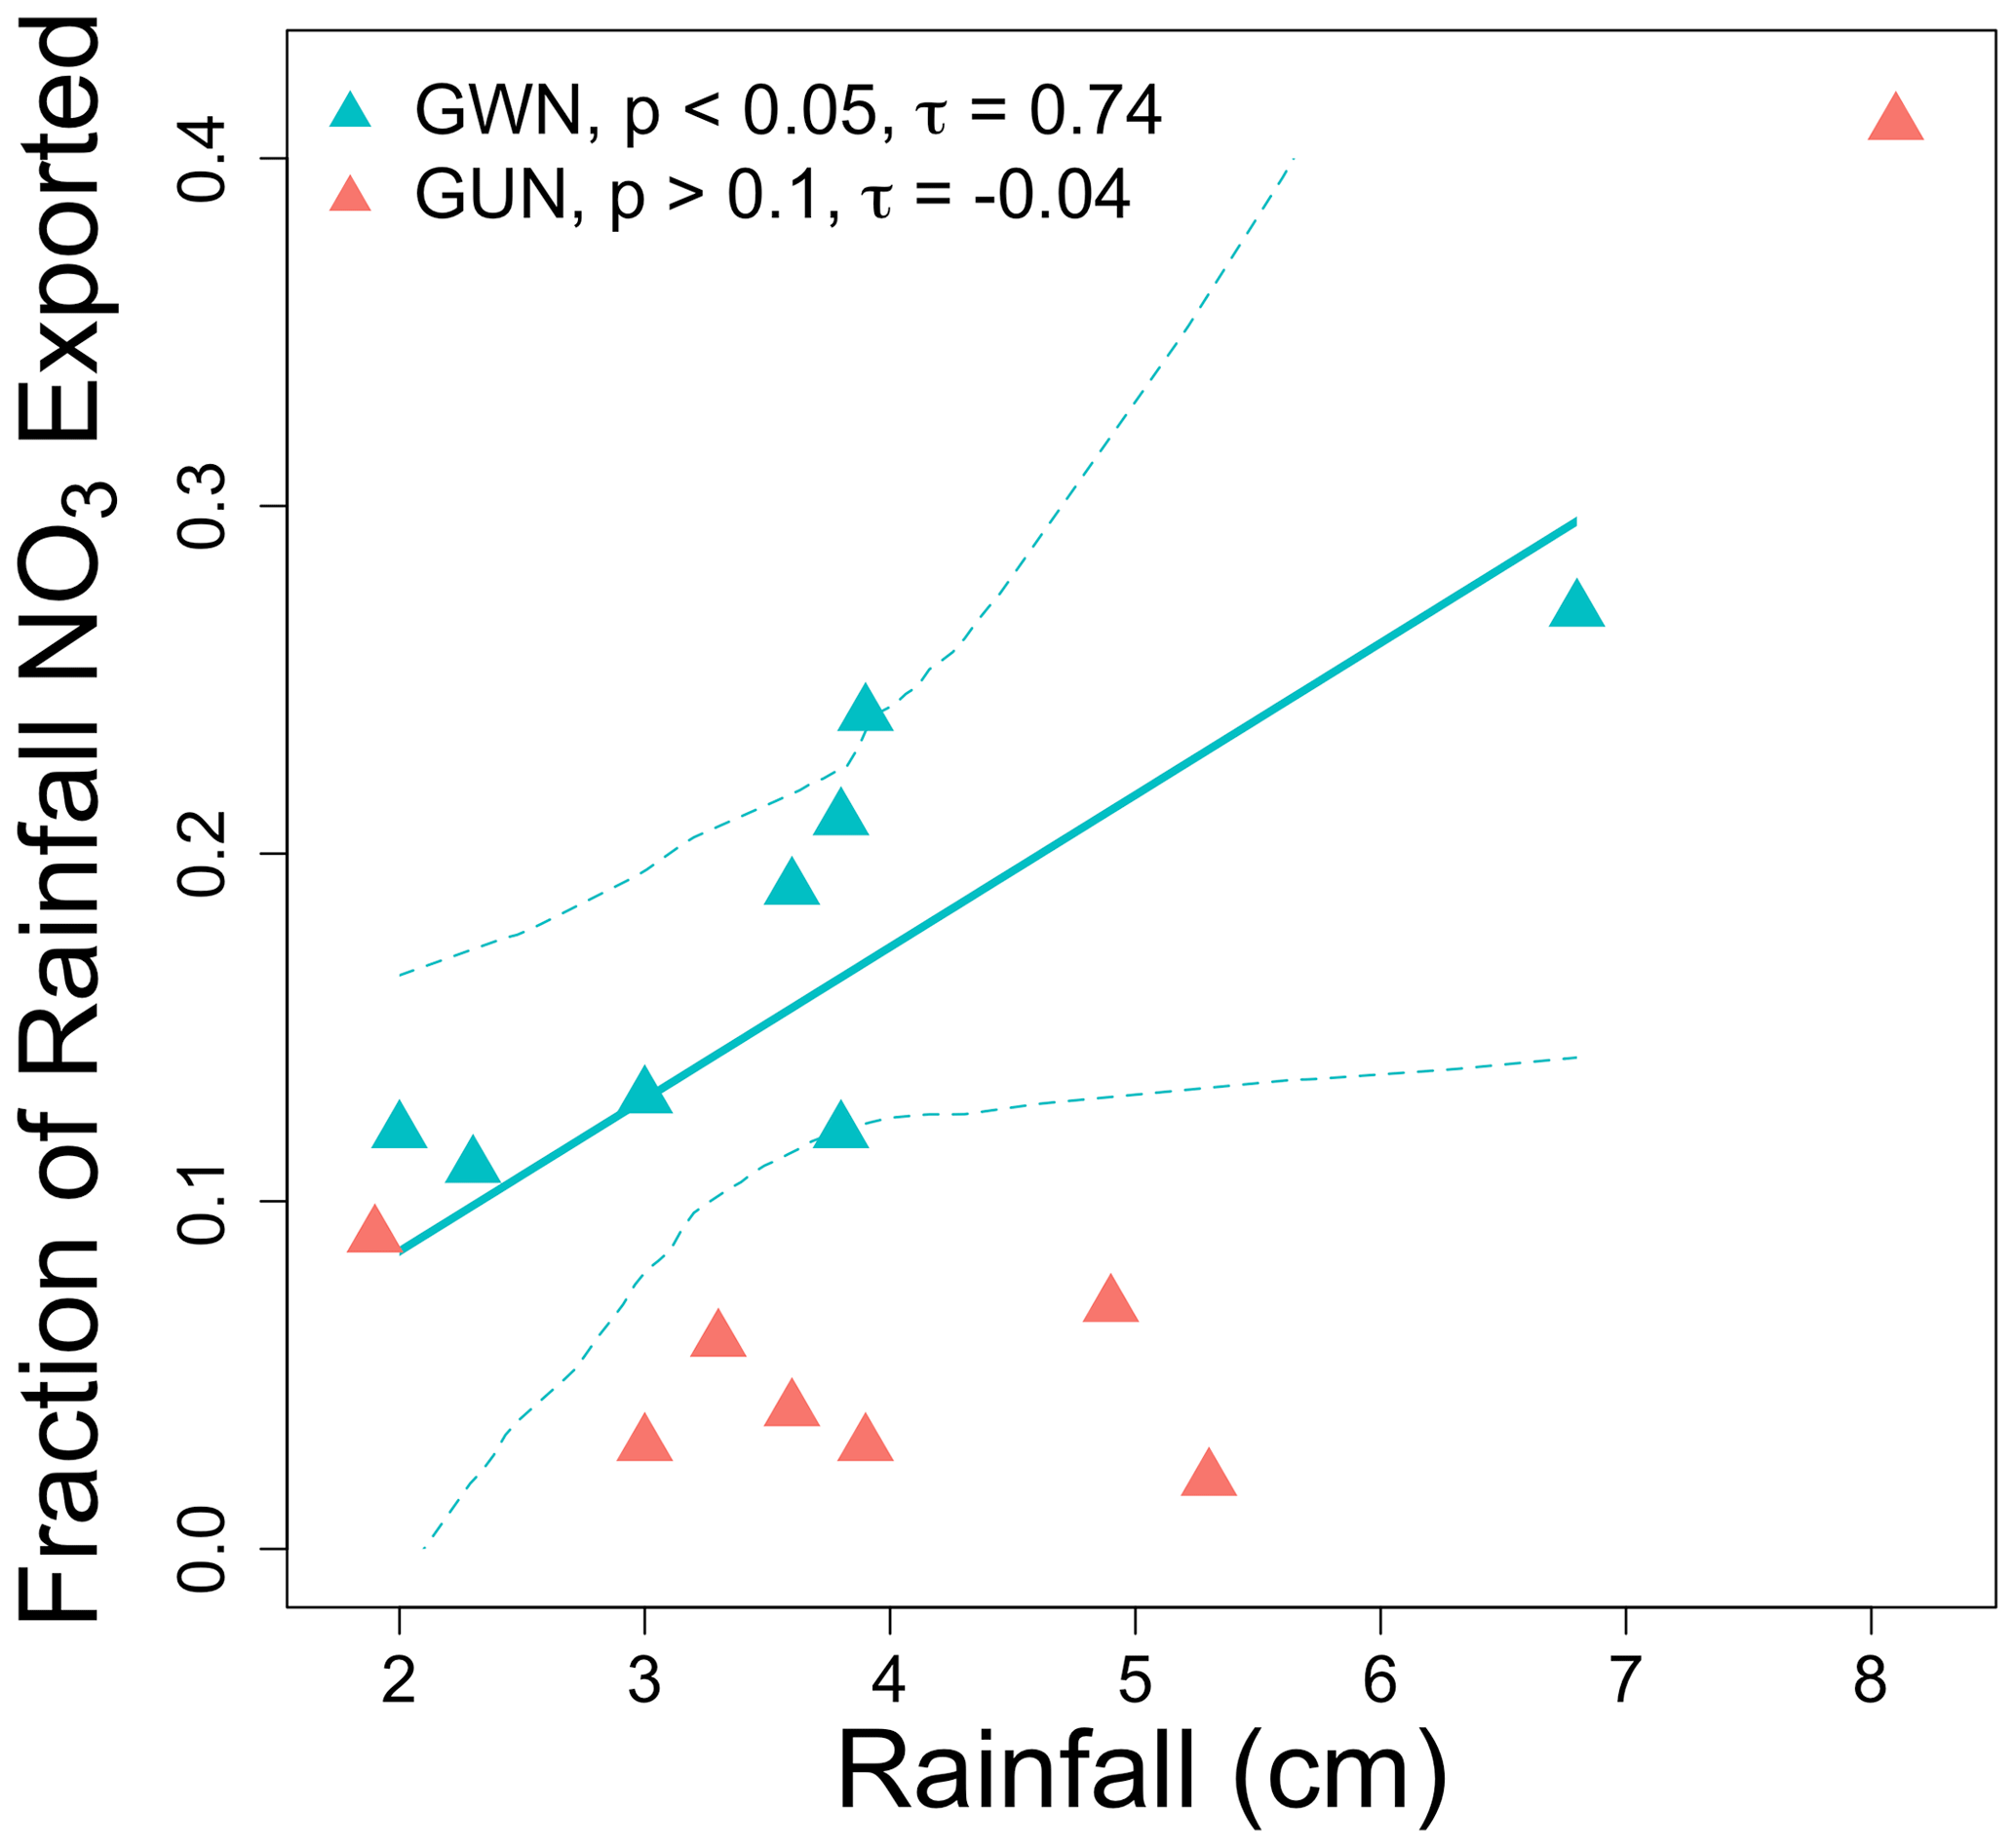
Figure 5The fraction of NO in rainfall that is exported in stream water during the same event is positively significantly related to total event rainfall at GWN (p<0.05, τ=0.74) but not at GUN (p>0.1, ). The solid line is the Theil–Sen slope, and the thin dotted line shows the bootstrapped 95 % confidence intervals.
Our study collected samples across the storm hydrograph and measured Δ17O of NO, which provided more accurate load estimates of, and insights into, storm NO export than δ18O of NO. For example, estimates of daily NO loads were biased by a median absolute value of 36 % using standard methods (i.e., daily average discharge multiplied by NO concentration, estimated using Δ17O, of a single grab sample; Tsunogai et al., 2014; Rose et al., 2015b; Nakagawa et al., 2018) when compared to true daily loads calculated using samples collected across the storm hydrograph from two events that encompassed a full day. Additionally, use of Δ17O generally provides more certain estimates of NO fractions and concentrations than δ18O because biological processing (e.g., assimilation, denitrification) can change δ18O of NO and generate large uncertainty (±30 ‰, Kendall et al., 2007) in the δ18O-NO3 Terr end-member and ultimately estimates of NO (Tsunogai et al., 2016). Δ17O of NO, due to its mass-independent fractionation origin, is not subject to the same variability associated with biological processing as δ18O, thereby decreasing uncertainty in NO estimates (Young et al., 2002; Michalski et al., 2004; Kendall et al., 2007). Indeed, average event NO fractions (i.e., would have been underestimated by an average of 3 % (range = 0 %–7 %) at both sites when using δ18O-NO only (Fig. S4) but with a greater effect at the more developed site (GWN). An average underestimate of 3 % may appear minor, but it is notable considering that event NO fractions averaged 2 % and 10 % in the less and more developed watersheds, respectively. Increased accuracy of NO export during storm events combined with the DF conceptual framework (Fig. 2) provides a relatively simple means of assessing whether storm events or baseflow have an outsized impact on NO source export. More accurate estimates of NO export also allow for more quantitative investigations into the role of impervious surfaces in routing event rainfall NO to streams.
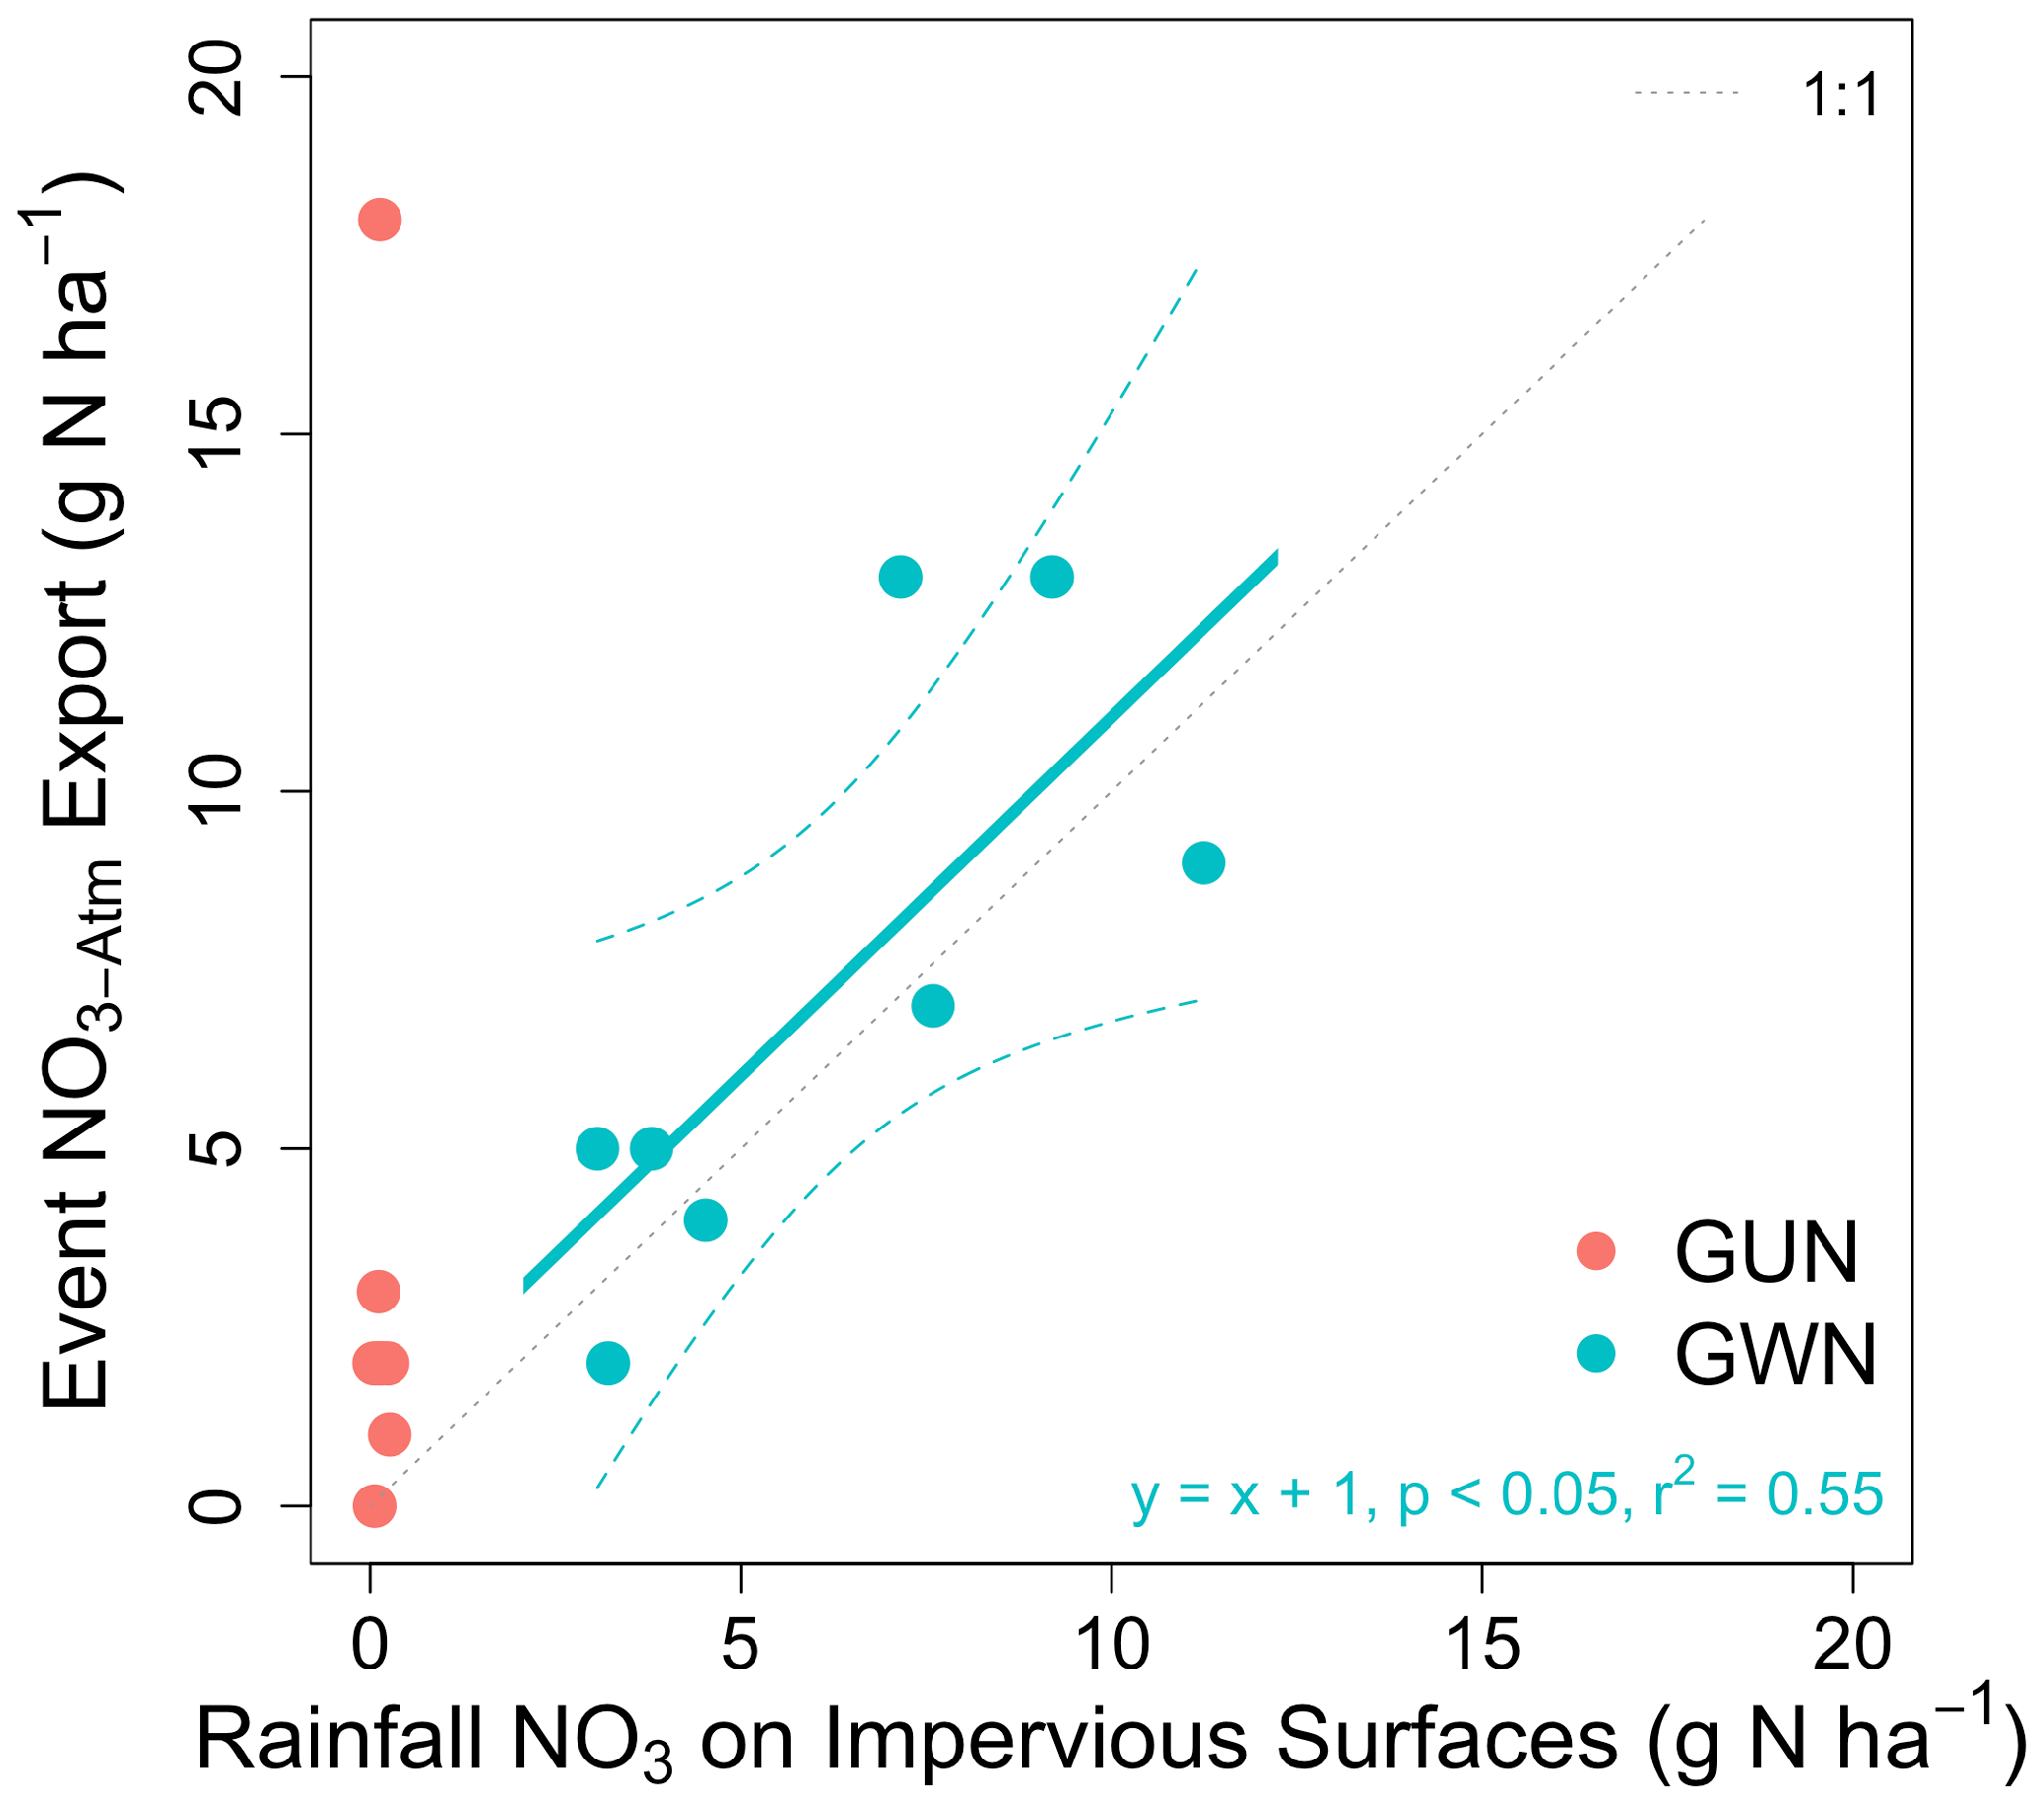
Figure 6The event NO yield (g N ha−1) has a 1:1 relationship with the estimated rainfall NO deposition on impervious surfaces (g N ha−1) at GWN (slope = 1.00, intercept = 1, r2=0.55, p<0.05) but not at GUN.
Impervious areas in the developed watershed are effective conduits of NO to surface waters, as demonstrated by the approximately proportional relationship between event stream water NO export and event NO deposition on impervious surfaces (Fig. 6). This relationship provides evidence, in addition to higher event-water fractions (Fig. 4), for the mechanism of impervious surfaces enhancing the export of NO during storm events. The 1:1 correspondence of this relationship is surprising, however. For 100 % of rainfall NO on impervious surfaces to be exported as stream water during a given event (i.e., a 1:1 relationship), all impervious areas in the watershed would have to be hydrologically connected to surface waters (i.e., effective impervious areas; Shuster et al., 2005). In a mesoscale (84 km2) and heterogeneous watershed such as GWN, the total impervious area is not equivalent to the effective impervious area. Rather, many impervious surfaces drain onto pervious surfaces or are “ineffective” at directly routing precipitation to channels (Walesh, 1989), but we note that certain pervious surfaces, such as reclaimed mine lands, effectively function as impervious (Negley and Eshleman, 2006). It is likely that the observed 1:1 relationship (Fig. 6) is additionally affected by flushing of dry NO deposition from effective impervious areas. Dry NO deposition, similar to wet deposition, inherits positive Δ17O values (∼15 ‰–30 ‰; Nelson et al., 2018) and is generally higher in urban relative to rural areas both locally (Lovett et al., 2000; Bettez and Groffman, 2013) and globally (Decina et al., 2019). Thus, flushing of dry NO deposition residing on impervious surfaces (or on surfaces such as leaves that can wash onto impervious surfaces) during storm events could contribute to the 1:1 relationship observed in the more developed watershed (green circles in Fig. 6). Δ17O of NO can additionally be used to “correct” δ15N and δ18O values (Eqs. 7 and 8) to better indicate isotope values of terrestrial NO sources (Dejwakh et al., 2012). Values of both δ15NTerr and δ18O-NO during storm events fall within the range of values that are typical of natural “soil” and fertilizer (Kendall et al., 2007), but interestingly, NO isotope values decreased during storm events relative to baseflow in both watersheds (though not significantly for δ15N in GUN; Fig. 3). This shift to lower δ15NTerr and δ18O-NO values during storm events may reflect the flushing of less “processed” NO sources from upper soil horizons (Creed et al., 1996), as processing (e.g., denitrification) generally leaves the remaining NO with more positive δ15N and δ18O values due to biologically mediated fractionation (Denk et al., 2017). Lower δ15NTerr during storm events relative to baseflow was not statistically significant in the mixed agricultural–forested watershed (GUN), but this was due to a single event in which δ15NTerr increased from baseflow to storm flow. Impervious surfaces in the developed watershed likely reduce flushing of this lower δ18O-NO by restricting infiltration, but 30 % of this watershed is not “developed” (and a higher percentage contains pervious surfaces), which likely contributes to the similarity in NO3 Terr isotope patterns between study watersheds. Additionally, relatively lower NO isotope values in storm events could be due to reduced in-stream NO uptake (e.g., assimilation, denitrification) during periods of elevated discharge (Grimm et al., 2005). Biological NO uptake generally fractionates against heavier isotopes, which increases isotope ratios of the remaining NO (Kendall et al., 2007). If in-stream NO uptake rates are reduced during high flows, the resulting effect could contribute to the lower NO isotope values during storm events. Relatively lower δ18O-NO3 Terr values during storm events relative to baseflow and associated insights into watershed-scale N biogeochemistry were only realized by using Δ17O to “correct” δ18O values. Without this correction, δ18O-NO during storm events is strongly influenced by the elevated δ18O of NO, as shown by the similar patterns between Δ17O and “uncorrected” δ18O in the more developed watershed (Fig. 3).
Large inputs and stores of N associated with agricultural activity likely contribute to baseflow and storm events having similar impacts on NO and NO export in the mixed agricultural–forested watershed (GUN). DFs of both NO and NO were approximately 1, indicating that loads are primarily explained by changes in discharge. Nutrients, including NO, showing similar patterns (loads explained primarily by discharge) over annual timescales have been attributed to large stores of NO associated with agricultural inputs (Basu et al., 2010; Thompson et al., 2011). With significant agricultural land use, both currently (41.3 % in 2016; Table 1) and historically (∼58 % in 1960; O'Bryan and McAvoy, 1966), and consistently high NO concentrations in stream water, GUN likely has large stores of NO in soil and groundwater. Interestingly, our results demonstrate the control of discharge on NO and NO loads over storm event timescales, suggesting that large reservoirs of NO contribute to stream water export of nutrients across varied flow conditions and not just baseflow.
The combination of our results with projections of increasing frequency of intense precipitation events (Najjar et al., 2010; Walsh et al., 2014) and increasing urban and suburban sprawl (Jantz et al., 2005; Seto et al., 2012) suggests that NO may become a relatively more important NO source to downstream waters, assuming no change in NO deposition rates. This assumption may not be valid everywhere, however; for example, NO deposition is declining locally (i.e., mid-Atlantic USA; Li et al., 2016) but increasing across many regions (i.e., East Asia; Liu et al., 2013). In our more developed watershed, the positive correlation between rainfall and the fraction of deposited NO exported in stream water (Fig. 5) suggests that large storm events may export proportionally greater fractions of rainfall NO in urbanizing catchments and increased loads of NO to downstream waters. Best management practices in developed watersheds (e.g., storm water control measures) can mitigate these potential impacts by increasing infiltration of rainfall (and NO dissolved in rainfall) and reducing hydrologic connectivity of overland flow paths (i.e., decrease effective impervious areas; Lee and Heaney, 2003; Walsh et al., 2009), both of which may reduce the load of NO and the proportion of “event” water in streams during storm events. Such practices may additionally reduce NO loads by stimulating denitrification (Bettez and Groffman, 2012) but could also increase the importance of baseflow in NO export due to increased infiltration. Thus, monitoring of both baseflow and storm events is necessary to quantify potential changes and make targeted water quality management decisions. Finally, best management practices intended to reduce NO loads in developed watersheds via increased infiltration may provide numerous co-benefits, including reduced runoff (Hood et al., 2007) and higher baseflow (Fletcher et al., 2013), both of which could help restore aquatic ecosystems impacted by urbanization (Walsh et al., 2005).
We found that storm flow has a disproportionately large impact on NO export, whereas baseflow has a disproportionately small impact on NO export in a moderately developed watershed. In contrast, neither storm flow nor baseflow has an outsized impact on NO or NO export in a mixed land-use watershed with significant agriculture. Hydrologic connectivity of overland flow paths associated with impervious surfaces likely promotes rapid transport of NO to streams during storm events in the more developed watershed, with higher rainfall storms exporting a greater fraction of deposited NO than lower rainfall events and event NO stream water export approximately equaling rainfall NO on impervious surfaces. Large reserves of new and/or legacy agriculturally associated nitrogen in soils in the mixed land-use watershed likely influenced the similar responses of NO or NO to storm flow and baseflow.
Complete data are presented in Tables S4 and S5.
The supplement related to this article is available online at: https://doi.org/10.5194/bg-20-2485-2023-supplement.
DMN and KNE: conceptualization, methodology, writing (review and editing), supervision, funding acquisition. JTB: conceptualization, methodology, investigation, formal analysis, writing (original draft), writing (review and editing), visualization, funding acquisition.
The contact author has declared that none of the authors has any competing interests.
Publisher’s note: Copernicus Publications remains neutral with regard to jurisdictional claims in published maps and institutional affiliations.
Thanks to Pavithra Pitumpe Arachchige and Jim Garlitz for NO concentration analysis. Robert Hirsch of the US Geological Survey provided guidance on WRTDS-K and R scripts for estimating NO3 Total uncertainty. Any opinions, findings, conclusions, and recommendations expressed in this material are those of the authors and do not necessarily reflect the views of the National Science Foundation. Thanks for helpful comments from two anonymous reviewers that improved the manuscript.
David M. Nelson, Keith N. Eshleman, and Joel T. Bostic received support from Maryland Sea Grant under award NA14OAR4170090 R/WS-3 from the National Oceanic and Atmospheric Administration, U.S. Department of Commerce. Joel T. Bostic received support from Maryland Sea Grant under award SA75281900-A from the National Oceanic and Atmospheric Administration, U.S. Department of Commerce. This material is based upon work supported by the National Science Foundation Graduate Research Fellowship (to Joel T. Bostic) under grant no. 1840380.
This paper was edited by Perran Cook and reviewed by two anonymous referees.
Arnold, C. L. and Gibbons, C. J.: Impervious surface coverage: The emergence of a key environmental indicator, J. Am. Plann. Assoc., 62, 243–258, https://doi.org/10.1080/01944369608975688, 1996.
Barnes, R. T. and Raymond, P. A.: Land-use controls on sources and processing of nitrate in small watersheds: Insights from dual isotopic analysis, Ecol. App., 20, 1961–1978, https://doi.org/10.1890/08-1328.1, 2010.
Basu, N. B., Destouni, G., Jawitz, J. W., Thompson, S. E., Loukinova, N. V., Darracq, A., Zanardo, S., Yaeger, M., Sivapalan, M., Rinaldo, A., and Rao, P. S. C.: Nutrient loads exported from managed catchments reveal emergent biogeochemical stationarity, Geophys. Res. Lett., 37, L23404, https://doi.org/10.1029/2010GL045168, 2010.
Bettez, N. and Groffman, P. M.: Denitrification potential in stormwater control structures and natural riparian zones in an urban landscape, Environ. Sci. Tech., 46, 10909–10917, https://doi.org/10.1021/es301409z, 2012.
Bettez, N. and Groffman, P. M.: Nitrogen deposition in and near an urban ecosystem. Environ. Sci. Tech., 47, 6047–6051, https://doi.org/10.1021/es400664b, 2012.
Böhlke, J. K., Mroczkowski, S. J., and Coplen, T. B.: Oxygen isotopes in nitrate: New reference materials for 18O:17O:16O measurements and observations on nitrate-water equilibration, Rapid Commun. Mass Sp., 17, 1835–1846, https://doi.org/10.1002/rcm.1123, 2003.
Bonnin, G. M., Martin, D., Lin, B., Parzybok, T., Yekta, M., and Riley, D.: Precipitation-frequency atlas of the United States, Volume 2, Version 3.0, Delaware, District of Columbia, Illinois, Indiana, Kentucky, Maryland, New Jersey, North Carolina, Ohio, Pennsylvania, South Carolina, Tennessee, Virginia, West Virginia [data set], https://repository.library.noaa.gov/view/noaa/22610 (last access: 1 April 2022), 2004.
Bostic, J. T., Nelson, D. M., Sabo, R. D., and Eshleman, K. N.: Terrestrial nitrogen inputs affect the export of unprocessed atmospheric nitrate to surface waters: Insights from triple oxygen isotopes of nitrate, Ecosystems, 25, 1384–1399, https://doi.org/10.1007/s10021-021-00722-9, 2021.
Buda, A. R. and DeWalle, D. R.: Dynamics of stream nitrate sources and flow pathways during stormflows on urban, forest and agricultural watersheds in central Pennsylvania, USA, Hydrol. Proc., 23, 3292–3305, https://doi.org/10.1002/hyp.7423, 2009.
Burns, D. A., Boyer, E. W., Elliott, E. M., and Kendall, C.: Sources and transformations of nitrate from streams draining varying land uses: Evidence from dual isotope analysis, J. Environ. Qual., 38, 1149–1159, https://doi.org/10.2134/jeq2008.0371, 2009.
Camargo, J. A. and Alonso, Á.: Ecological and toxicological effects of inorganic nitrogen pollution in aquatic ecosystems: A global assessment, Environ. Int., 32, 831–849, https://doi.org/10.1016/j.envint.2006.05.002, 2006.
Casciotti, K. L., Sigman, D. M., Hastings, M. G., Böhlke, J., and Hilkert, A: Measurement of the oxygen isotopic composition of nitrate in seawater and freshwater using the denitrifier method, Anal. Chem., 74, 4905–4912, https://doi.org/10.1021/ac020113w, 2002.
Chesepeake Bay Program, Chesapeake Bay Program Water Quality Database, 1984-present [data set], http://www.chesapeakebay.net/data/downloads/cbp_water_quality_database_1984_present (last access: 1 April 2022), 2021.
Chanat, J. G., Moyer, D. L., Blomquist, J. D., Hyer, K. E., and Langland, M. J.: Application of a weighted regression model for reporting nutrient and sediment concentrations, fluxes, and trends in concentration and flux for the Chesapeake Bay nontidal water-quality monitoring network, results through water year 2012, U.S. Geol. Survey, https://doi.org/10.3133/sir20155133, 2016.
Cook, P. G. and Herczeg, A. L.: Environmental tracers in subsurface hydrology, Springer Science & Business Media, https://doi.org/10.1007/978-1-4615-4557-6, 2012.
Creed, I. F., Band, L. E., Foster, N. W., Morrison, I. K., Nicolson, J. A., Semkin, R. S., and Jeffries, D. S.: Regulation of nitrate-N release from temperate forests: A test of the N flushing hypothesis, Water Resour. Res., 32, 3337–3354, https://doi.org/10.1029/96WR02399, 1996.
DeCicco, L. A., Lorenz, D., and Hirsch, R. M.: dataRetrieval: R packages for discovering and retrieving water data available from U.S. Federal hydrologic web services, United States Geological Survey [code], https://doi.org/10.5066/P9X4L3GE, 2018.
Decina, S. M., Hutyra, L. R., and Templer, P. H.: Hotspots of nitrogen deposition in the world's urban areas: A global data synthesis, Front. Ecol. Environ., 18, 92–100, https://doi.org/10.1002/fee.2143, 2019.
Dejwakh, N. R., Meixner, T., Michalski, G., and McIntosh, J.: Using 17O to investigate nitrate sources and sinks in a semi-arid groundwater system, Environ. Sci. Tech., 46, 745–751, https://doi.org/10.1021/es203450z, 2012.
Denk, T. R. A., Mohn, J., Decock, C., Lewicka-Szczebak, D., Harris, E., Butterbach-Bahl, K., Kiese, R., and Wolf, B.: The nitrogen cycle: A review of isotope effects and isotope modeling approaches, Soil Biol. Biochem., 105, 121–137, https://doi.org/10.1016/j.soilbio.2016.11.015, 2017.
Dingman, S. L.: Physical Hydrology, McMillan College Publishing Company, New York, 643 pp., ISBN 13 9780023297458, 1994.
Divers, M. T., Elliott, E. M., and Bain, D. J.: Quantification of nitrate sources to an urban stream using dual nitrate isotopes, Environ. Sci. Tech., 48, 10580–10587, https://doi.org/10.1021/es404880j, 2014.
Hart, E. M. and Bell, K.: prism [code], https://docs.ropensci.org/prism/ (last access: 1 April 2022), 2015.
Elliott, E. M., Kendall, C., Wankel, S. D., Burns, D. A., Boyer, E. W., Harlin, K., Bain, D. J., and Butler, T. J.: Nitrogen isotopes as indicators of NOx source contributions to atmospheric nitrate deposition across the midwestern and northeastern United States, Environ. Sci. Tech., 41, 7661–7667, https://doi.org/10.1021/es070898t, 2007.
Fenneman, N. M. and Johnson, D. W.: Physiographic divisions of the conterminus U.S. [data], U.S. Geol. Survey, 1946.
Fletcher, T., Andrieu, H., and Hamel, P.: Understanding, management and modelling of urban hydrology and its consequences for receiving waters: A state of the art, Adv. Water Res., 51, 261–279, https://doi.org/10.1016/j.advwatres.2012.09.001, 2013.
Genereux, D.: Quantifying uncertainty in tracer-based hydrograph separations, Water Resour. Res., 34, 915–919, https://doi.org/10.1029/98WR00010, 1998.
Grimm, N. B., Sheibley, R. W., Crenshaw, C. L., Dahm, C. N., Roach, W. J., and Zeglin, L. H.: N retention and transformation in urban streams, J. N. Am. Benth. Soc., 24, 626–642, https://doi.org/10.1899/04-027.1, 2005.
Huang, S., Wang, F., Elliott, E. M., Zhu, F., Zhu, W., Koba, K., Yu, Z., Hobbie, E. A., Michalski, G., Kang, R., Wang, A., Zhu, J., Fu, S., and Fang, Y.: Multiyear measurements on Δ17O of stream nitrate indicate high nitrate production in a temperate forest, Environ. Sci. Tech., 54, 4231–4239, https://doi.org/10.1021/acs.est.9b07839, 2020.
Helsel, D. R., Hirsch, R. M., Ryberg, K. R., Archfield, S. A., and Gilroy, E. J.: Statistical methods in water resources. Techniques and Methods, United States Geological Survey, Reston, VA, https://doi.org/10.3133/tm4A3, 2020.
Homer, C., Dewitz, J., Jin, S., Xian, G., Costello, C., Danielson, P., Gass, L., Funk, M., Wickham, J., Stehman, S., Auch, R., and Riitters, K.: Conterminous United States land cover change patterns 2001–2016 from the 2016 national land cover database, ISPRS J. Photo. Remote Sens., 162, 184–199, https://doi.org/10.1016/j.isprsjprs.2020.02.019, 2020.
Hood, M., Clausen, J., and Warner, G.: Comparision of stormwater lag times for low impact and traditional residential development, J. Am. Water Res. Assoc., 43, 1036–1046, https://doi.org/10.1111/j.1752-1688.2007.00085.x, 2007.
International Atomic Energy Agency: Reference and intercomparison materials for stable isotopes of light elements, Vienna: International Atomic Energy Agency [sample], 1995.
Jantz, P., Goetz, S., and Jantz, C.: Urbanization and the loss of resource lands in the Chesapeake Bay watershed, Environ. Manage., 36, 808–825, 2005.
Jarvis, N. J.: A review of non-equilibrium water flow and solute transport in soil macropores: Principles, controlling factors and consequences for water quality, Eur. J. Soil Sci., 71, 279–302, https://doi.org/10.1111/j.1365-2389.2007.00915.x, 2020.
Kaiser, J., Hastings, M. G., Houlton, B. Z., Röckmann, T., and Sigman, D. M.: Triple oxygen isotope analysis of nitrate using the denitrifier method and thermal decomposition of N2O, Anal. Chem., 79, 599–607, https://doi.org/10.1021/ac061022s, 2007.
Kaushal, S. S., Groffman, P. M., Band, L. E., Elliott, E. M., Shields, C. A., and Kendall, C.: Tracking nonpoint source nitrogen pollution in human-impacted watersheds, Environ. Sci. Tech., 45, 8225–8232, https://doi.org/10.1021/es200779e, 2011.
Kemp, W. M., Boynton, W. R., Adolf, J. E., Boesch, D. F., Boicourt, W. C., Brush, G., Cornwell, J. C., Fisher, T. R., Glibert, P. M., and Hagy, J. D.: Eutrophication of Chesapeake Bay: Historical trends and ecological interactions, Mar. Ecol. Prog. Ser., 303, 1–29, https://doi.org/10.3354/meps303001, 2005.
Kendall, C., Elliott, E., and Wankel, S.: Tracing anthropogenic inputs of nitrogen to ecosystems, in: Stable Isotopes in Ecology and Environmental Science, edited by: Michener, R., and Lajtha, K., Blackwell Publishing, https://doi.org/10.1002/9780470691854.ch12, 2007.
Kincaid, D. W., Seybold, E. C., Adair, E. C., Bowden, W. B., Perdrial, J. N., Vaughan, M. C. H., and Schroth, A. W.: Land use and season influence event-scale nitrate and soluble reactive phosphorus exports and export stoichiometry from headwater catchments, Water Resour. Res., 56, e2020WR02736, https://doi.org/10.1029/2020WR027361, 2020.
Klaus, J. and McDonnell, J.: Hydrograph separation using stable isotopes: Review and evaluation, J. Hydrol., 505, 47–64, https://doi.org/10.1016/j.jhydrol.2013.09.006, 2013.
Kottek, M., Grieser, J., Beck, C., Rudolf, B., and Rubel, F.: World map of the Köppen-Geiger climate classification updated, Meteorol. Z., 15, 259–263, https://doi.org/10.1127/0941-2948/2006/0130, 2006.
Lee, J. G. and Heaney, J. P.: Estimation of urban imperviousness and its impacts on storm water systems, J. Water Res. Plann. Manage., 129, 419–426, https://doi.org/10.1061/(ASCE)0733-9496(2003)129:5(419), 2003.
Lefcheck, J. S., Orth, R. J., Dennison, W. C., Wilcox, D. J., Murphy, R. R., Keisman, J., Gurbisz, C., Hannam, M., Landry, J. B., and Moore, K. A.: Long-term nutrient reductions lead to the unprecedented recovery of a temperate coastal region, P. Natl. Acad. Sci. USA, 115, 3658–3662, https://doi.org/10.1073/pnas.1715798115, 2018.
Li, Y., Schichtel, B. A., Walker, J. T., Schwede, D. B., Chen, X., Lehmann, C. M., Puchalski, M. A., Gay, D. A., and Collett, J. L.: Increasing importance of deposition of reduced nitrogen in the United States, P. Natl. Acad. Sci. USA, 113, 5874–5879, https://doi.org/10.1073/pnas.1525736113, 2016.
Liu, X., Zhang, Y., Wenxuan, H., Tang, A., Shen, J., Cui, Z., Vitousek, P., Erisman, J., Goudling, K., Christie, P., Fangmeier, A., and Zhang, F.: Enchanced nitrogen deposition over China, Nature, 494, 459–462, https://doi.org/10.1038/nature11917, 2013.
Lovett, G. M., Traynor, M. M., Pouyat, R. V., Carreiro, M. M., Zhu, W.-X., and Baxter, J. W.: Atmospheric deposition to oak forests along an urban−rural gradient, Environ. Sci. Tech., 34, 4294–4300, https://doi.org/10.1021/es001077q, 2000.
McGuire, K. and McDonnell, J.: Stable isotope tracers in watershed hydrology. Stable isotopes in ecology and environmental science, Blackwell Publishing Ltd., 334–374, https://doi.org/10.1002/9780470691854.ch11, 2007.
Michalski, G., Meixner, T., Fenn, M., Hernandez, L., Sirulnik, A., Allen, E., and Thiemens, M.: Tracing atmospheric nitrate deposition in a complex semiarid ecosystem using Δ17O, Environ. Sci. Tech., 38, 2175–2181, https://doi.org/10.1021/es034980, 2004.
Michalski, G., Savarino, J., Böhlke, J. K., and Thiemens, M.: Determination of the total oxygen isotopic composition of nitrate and the calibration of a Δ17O nitrate reference material, Anal. Chem., 74, 4989–4993, https://doi.org/10.1021/ac0256282, 2002.
Michalski, G., Scott, Z., Kabiling, M., and Thiemens, M. H.: First measurements and modeling of Δ17O in atmospheric nitrate, Geophys. Res. Lett., 30, 1870, https://doi.org/10.1029/2003GL017015, 2003.
Najjar, R. G., Pyke, C. R., Adams, M. B., Breitburg, D., Hershner, C., Kemp, M., Howarth, R., Mulholland, M. R., Paolisso, M., Secor, D., Sellner, K., Wardrop, D., and Wood, R.: Potential climate-change impacts on the Chesapeake Bay, Estuar. Coast. Shelf S., 86, 1–20, https://doi.org/10.1016/j.ecss.2009.09.026, 2010.
Nakagawa, F., Tsunogai, U., Obata, Y., Ando, K., Yamashita, N., Saito, T., Uchiyama, S., Morohashi, M., and Sase, H.: Export flux of unprocessed atmospheric nitrate from temperate forested catchments: a possible new index for nitrogen saturation, Biogeosciences, 15, 7025–7042, https://doi.org/10.5194/bg-15-7025-2018, 2018.
Negley, T. L. and Eshleman, K. N.: Comparison of stormflow responses of surface-mined and forested watersheds in the Appalachian Mountains, USA, Hydro. Proc., 20, 3467–3483, https://doi.org/10.1002/hyp.6148, 2006.
Nelson, D. M., Tsunogai, U., Ding, D., Ohyama, T., Komatsu, D. D., Nakagawa, F., Noguchi, I., and Yamaguchi, T.: Triple oxygen isotopes indicate urbanization affects sources of nitrate in wet and dry atmospheric deposition, Atmos. Chem. Phys., 18, 6381–6392, https://doi.org/10.5194/acp-18-6381-2018, 2018.
National Research Council: Clean coastal waters, Understanding and reducing the effects of nutrient pollution, The National Academies Press, Washington D.C., https://doi.org/10.17226/9812, 2000.
O'Bryan, D. and McAvoy, R. L.: Gunpowder Fall Maryland: Uses of a water resource today and tomorrow, U.S. Geol. Survey, https://doi.org/10.3133/wsp1815, 1966.
Paul, M. J. and Meyer, J. L.: Streams in the urban landscape, Annu. Rev. Eco. Sys., 32, 333–365, https://doi.org/10.1146/annurev.ecolsys.32.081501.114040, 2001.
PRISM Climate Group: Oregon State University [data], https://prism.oregonstate.edu (last access: 1 April 2022), 2014.
R Development Core Team, R: A language and environment for statistical computing [software], Vienna, Austria: R Foundation for Statistical Computing, https://www.r-project.org/ (last access: 5 January 2023), 2019.
Rose, L. A., Sebestyen, S. D., Elliott, E. M., and Koba, K.: Drivers of atmospheric nitrate processing and export in forested catchments, Water Resour. Res., 51, 1333–1352, https://doi.org/10.1002/2014WR015716, 2015a.
Rose, L. A., Elliott, E. M., and Adams, M. B.: Triple nitrate isotopes indicate differing nitrate source contributions to streams across a nitrogen saturation gradient, Ecosystems, 18, 1209–1223, https://doi.org/10.1007/s10021-015-9891-8, 2015b.
Sabo, R. D., Nelson, D. M., and Eshleman, K. N.: Episodic, seasonal, and annual export of atmospheric and microbial nitrate from a temperate forest, Geophys. Res. Lett., 43, 683–691, https://doi.org/10.1002/2015gl066758, 2016.
Seto, K. C., Guneralp, B., and Hutyra, L. R.: Global forecasts of urban expansion to 2030 and direct impacts on biodiversity and carbon pools, P. Natl. Acad. Sci. USA, 109, 16083–16088, https://doi.org/10.1073/pnas.1211658109, 2012.
Shuster, W. D., Bonta, J., Thurston, H., Warnemuende, E., and Smith, D. R.: Impacts of impervious surface on watershed hydrology: A review, Urban Wat. J., 2, 263–275, https://doi.org/10.1080/15730620500386529, 2005.
Sigman, D. M., Casciotti, K. L., Andreani, M., Barford, C., Galanter, M., and Böhlke, J.: A bacterial method for the nitrogen isotopic analysis of nitrate in seawater and freshwater, Anal. Chem., 73, 4145–4153, https://doi.org/10.1021/ac010088e, 2001.
Sklash, M., Farvolden, R., and Fritz, P.: A conceptual model of watershed response to rainfall, developed through the use of oxygen-18 as a natural tracer, Can. J. Earth Sci., 13, 271–283, https://doi.org/10.1139/e76-02, 1976.
Steffen, W., Richardson, K., Rockström, J., Cornell, S. E., Fetzer, I., Bennett, E. M., Biggs, R., Carpenter, S. R., Vries, W. D., Wit, C. A., Folke, C., Gerten, D., Heinke, J., Mace, G. M., Persson, L. M., Ramanathan, V., Reyers, B., and Sörlin, S.: Planetary boundaries: Guiding human development on a changing planet, Science, 347, 6219, https://doi.org/10.1126/science.1259855, 2015.
Stevens, C. J.: Nitrogen in the environment, Science, 363, 578–580, https://doi.org/10.1126/science.aav8215, 2019.
Thompson, S. E., Basu, N. B., Lascurain, Jr. J., Aubeneau, A., and Rao, P. S. C.: Relative dominance of hydrologic versus biogeochemical factors on solute export across impact gradients, Water Resour. Res., 47, W00J05, https://doi.org/10.1029/2010WR009605, 2011.
Tsunogai, U., Komatsu, D. D., Ohyama, T., Suzuki, A., Nakagawa, F., Noguchi, I., Takagi, K., Nomura, M., Fukuzawa, K., and Shibata, H.: Quantifying the effects of clear-cutting and strip-cutting on nitrate dynamics in a forested watershed using triple oxygen isotopes as tracers, Biogeosciences, 11, 5411–5424, https://doi.org/10.5194/bg-11-5411-2014, 2014.
Tsunogai, U., Miyauchi, T., Ohyama, T., Komatsu, D. D., Nakagawa, F., Obata, Y., Sato, K., and Ohizumi, T.: Accurate and precise quantification of atmospheric nitrate in streams draining land of various uses by using triple oxygen isotopes as tracers, Biogeosciences, 13, 3441–3459, https://doi.org/10.5194/bg-13-3441-2016, 2016.
Vaughan, M. C. H., Bowden, W. B., Shanley, J. B., Vermilyea, A., Sleeper, R., Gold, A. J., Pradhanang, S. M., Inamdar, S. P., Levia, D. F., Andres, A. S., Birgand, F., and Schroth, A. W.: High-frequency dissolved organic carbon and nitrate measurements reveal differences in storm hysteresis and loading in relation to land cover and seasonality, Water Resour. Res., 53, 5345–5363, https://doi.org/10.1002/2017WR020491, 2017.
Walesh, S. G.: Fundamentals of urban surface water management, Urban surface water management, John Wiley & Sons, 1–51, https://doi.org/10.1002/9780470172810.ch1, 1989.
Walsh, C. J., Roy, A. H., Feminella, J. W., Cottingham, P. D., Groffman, P. M., and Morgan, R. P.: The urban stream syndrome: Current knowledge and the search for a cure, J. N. Am. Benth. Soc., 24, 706–723, https://doi.org/10.1899/04-028.1, 2005.
Walsh, C. J., Fletcher, T. D., and Ladson, A. R.: Retention capacity: A metric to link stream ecology and storm-water management, J. Hydrol. Eng., 14, 399–406, https://doi.org/10.1061/(ASCE)1084-0699(2009)14:4(399), 2009.
Walsh, J., Wuebbles, D., Hayhoe, K., Kossin, J., Kunkel, K., Stephens, G., Thorne, P., Vose, R., Wehner, M., Willis, J., Anderson, D., Doney, S., Feely, R., Hennon, P., Kharin, V., Knutson, T., Landerer, F., Lenton, T., Kennedy, J., Somerville, R. (Eds.): Our Changing Climate, in: Climate Change Impacts in the United States: The Third National Climate Assessment, https://doi.org/10.7930/J0KW5CXT, 2014.
Young, E. D., Galy, A., and Nagahara, H.: Kinetic and equilibrium mass-dependent isotope fractionation laws in nature and their geochemical and cosmochemical significance, Geochim. Cosmochim. Ac., 66, 1095–1104, https://doi.org/10.1016/S0016-7037(01)00832-8, 2002.
Zhang, Q., Blomquist, J. D., Moyer, D. L., and Chanat, J. G.: Estimation bias in water-quality constituent concentrations and fluxes: A synthesis for Chesapeake Bay rivers and streams, Front. Eco. Evol., 7, 109, https://doi.org/10.3389/fevo.2019.00109, 2019.
Zhang, Q. and Hirsch, R. M.: River water-quality concentration and flux estimation can be improved by accounting for serial correlation through an autoregressive model, Water Resour. Res., 55, 9705–9723, https://doi.org/10.1029/2019WR025338, 2019.
Zhang, Q., Murphy, R. R., Tian, R., Forsyth, M. K., Trentacoste, E. M., Keisman, J., and Tango, P. J.: Chesapeake Bay's water quality condition has been recovering: Insights from a multimetric indicator assessment of thirty years of tidal monitoring data, Sci. Total Environ., 637, 1617–1625, https://doi.org/10.1016/j.scitotenv.2018.05.025, 2018.