the Creative Commons Attribution 4.0 License.
the Creative Commons Attribution 4.0 License.
 | 30 Jun 2023
All about nitrite: exploring nitrite sources and sinks in the eastern tropical North Pacific oxygen minimum zone
Andrew R. Babbin
Elizabeth Wallace
Katherine L. DuRussel
Claudia Frey
Donald E. Martocello III
Tyler Tamasi
Sergey Oleynik
Bess B. Ward
Oxygen minimum zones (OMZs), due to their large volumes of perennially deoxygenated waters, are critical regions for understanding how the interplay between anaerobic and aerobic nitrogen (N) cycling microbial pathways affects the marine N budget. Here, we present a suite of measurements of the most significant OMZ N cycling rates, which all involve nitrite () as a product, reactant, or intermediate, in the eastern tropical North Pacific (ETNP) OMZ. These measurements and comparisons to data from previously published OMZ cruises present additional evidence that reduction is the predominant OMZ N flux, followed by oxidation back to . The combined rates of both of these N recycling processes were observed to be much greater (up to nearly 200 times) than the combined rates of the N loss processes of anammox and denitrification, especially in waters near the anoxic–oxic interface. We also show that oxidation can occur when O2 is maintained near 1 nM by a continuous-purge system, oxidation and O2 measurements that further strengthen the case for truly anaerobic oxidation. We also evaluate the possibility that dismutation provides the oxidative power for anaerobic oxidation. The partitioning of N loss between anammox and denitrification differed widely from stoichiometric predictions of at most 29 % anammox; in fact, N loss rates at many depths were entirely due to anammox. Our new reduction, oxidation, dismutation, and N loss data shed light on many open questions in OMZ N cycling research, especially the possibility of truly anaerobic oxidation.
- Article
(9145 KB) - Full-text XML
-
Supplement
(1284 KB) - BibTeX
- EndNote


Nitrogen (N) is essential for life because of its prominent role in DNA, RNA, and protein chemistry. As a result, N limits biological productivity in many marine environments. The dissimilatory biological N loss and recycling pathways are traditionally understood to be strictly separated by O2 tolerance. The N loss processes of denitrification, the stepwise reduction of to N2, and anaerobic ammonium oxidation (anammox) – the oxidation of with to make N2 – require low O2, whereas the N recycling pathways of oxidation to and oxidation to are viewed as obligately aerobic. Importantly, is a product, reactant, or intermediate in all of these pathways. Therefore, developing an understanding of sources and sinks is essential for a complete understanding of marine N biogeochemistry.
Oxygen minimum zones (OMZs) and sediments are the two main marine environments where N loss occurs. There are three major OMZs, the eastern tropical North Pacific (ETNP), the eastern tropical South Pacific (ETSP), and the Arabian Sea, which occupy 0.1 %–1 % of the total ocean volume, depending on the O2 threshold used (Codispoti and Richards, 1976; Naqvi, 1987; Bange et al., 2000; Codispoti et al., 2005; Lam and Kuypers, 2011). Importantly, the OMZ water column is not completely deoxygenated from top to bottom; OMZs are characterized by an oxygenated surface, a depth interval of steeply declining O2 around the mixed-layer depth, called the oxycline, an oxygen-deficient zone (ODZ) spanning several hundred meters where O2 declines below the detection limit of common shipboard conductivity–temperature–depth (CTD) O2 sensors, and then a second, gradual oxycline that transitions to oxygenated deep water. Despite the OMZ regions' small size, they are responsible for 30 %–50 % of total marine N loss (DeVries et al., 2013), a magnitude significant for the global marine N budget. In this work, in order to answer several open questions about OMZs and marine N cycling, we conducted a suite of 15N stable isotope measurements of the most important N cycling microbial pathways in OMZs. We report the N loss rates of anammox and denitrification as well as the N recycling rates of reduction, oxidation, and oxidation, all of which involve .
A distinctive feature of OMZs is a secondary nitrite maximum (SNM) (Codispoti et al., 2001; Brandhorst, 1959; Codispoti and Packard, 1980). The highest nitrite concentrations within the SNM can reach 10 µM, much higher than the peak values found in the primary nitrite maximum at the base of the photic zone, which average ∼ 100 nM globally (Lomas and Lipschultz, 2006). Several recent works have shown or argued that the SNM's is supplied via high rates of the first step of denitrification, reduction to (Lam et al., 2009; Lam and Kuypers, 2011; Kalvelage et al., 2013; Babbin et al., 2017, 2020). reduction has been proposed (Anderson et al., 1982) to be one-half of a rapid loop where and are recycled through simultaneously occurring reduction and oxidation. This loop has been supported through experimental measurements of both rates (Babbin et al., 2017, 2020; Kalvelage et al., 2013; Lipschultz et al., 1990). In this view, elevated reduction also generates , via organic matter (OM) remineralization, which enhances anammox at the expense of denitrification in oxycline and upper-ODZ waters (Babbin et al., 2020). In this study, we conducted tests to further document this rapid loop's existence and role in enhancing anammox.
Recent measurements of oxidation have returned significant rates from both the oxycline and the ODZ, findings that challenge the paradigm that oxidation is an obligately aerobic process. Evidence for high, widespread oxidation rates in low-O2 waters has accumulated from direct rate measurements via 15N tracers (Füssel et al., 2011; Lipschultz et al., 1990; Peng et al., 2015, 2016; Ward et al., 1989; Kalvelage et al., 2013; Tsementzi et al., 2016; Sun et al., 2017, 2021; Babbin et al., 2017, 2020), models (Buchwald et al., 2015), and 15N natural-abundance measurements (Casciotti et al., 2013). Many explanations have been proposed including microaerophilic nitrite-oxidizing bacteria (NOB) adapted to low but nonzero O2 conditions (Penn et al., 2016; Bristow et al., 2016; Tsementzi et al., 2016; Bristow et al., 2017) where the O2 for these NOB is transiently supplied to previously deoxygenated waters by (1) vertical or horizontal mixing of the ocean surface or nearby oxic water (Casciotti et al., 2013; Tiano et al., 2014; Bristow et al., 2016; Ulloa et al., 2012), even into the anoxic ODZ (Margolskee et al., 2019), or (2) a cryptic O2 cycle where low-light-adapted phototrophs produce O2 that is consumed by NOB (Garcia-Robledo et al., 2017; Fuchsman et al., 2019).
Despite the power of these explanations, they do not preclude the possibility of widespread NOB capable of truly anaerobic oxidation, especially in waters from the deep, dark, and deoxygenated ODZ core. This possibility is bolstered by sequencing data that show the presence of an NOB metagenome-assembled genome (MAG) with a preference for the deoxygenated ODZ core in the ETSP (Sun et al., 2019) and ODZ core kinetics experiments where O2 concentrations above 5 µM inhibit oxidation (Sun et al., 2021). Here, we build on past stable isotope experimental results by performing additional depth profile experiments with purged waters from the ODZ and O2 manipulation 15N tracer experiments across a gradient of O2 concentrations from 1 to 10 µM. Our O2 manipulation experiments, unlike previous studies, were conducted in vessels that were continuously purged throughout each incubation with a precisely calibrated mixture of N2, O2, and CO2. This experimental design allowed us to continuously maintain low-O2 conditions. In addition, our oxygen concentrations in these assays were verified via a luminescence measuring oxygen sensor (LUMOS), a sensor class with a detection limit of 0.5 nM O2 (Lehner et al., 2015). Together, these method improvements convincingly show that the O2 contamination observed to occur in Niskin sampling (Garcia-Robledo et al., 2016, 2021) is removed and that vanishingly low O2 is maintained throughout the experiment.
Anaerobic oxidation would require an alternative oxidant other than O2. Many candidates have been proposed (Sun et al., 2023) for this oxidant including (Babbin et al., 2017), Mn4+, Fe3+ (Sun et al., 2021), the anammox core metabolism (Sun et al., 2021), the observed reversibility of the nitrite oxidoreductase enzyme (Wunderlich et al., 2013; Kemeny et al., 2016; Koch et al., 2015; Buchwald and Wankel, 2022), and dismutation (Babbin et al., 2020; Füssel et al., 2011; Sun et al., 2021). Due to multiple considerations such as very low in the ODZ core (Moriyasu et al., 2020), low favorability of Mn4+- or Fe3+-mediated oxidation at marine pH values (Luther, 2010), low anammox rates that do not explain the observed stoichiometry of oxidation to anammox (Kalvelage et al., 2013; Babbin et al., 2020; Sun et al., 2021), and the inability of the enzyme hypothesis to account for structural and phylogenetic differences in the nitrite oxidoreductase (NXR) enzyme of the four NOB genera (Buchwald and Wankel, 2022; Sun et al., 2019), we conducted experiments to test the remaining most plausible hypothesis: dismutation.
dismutation (Reaction R4) is energetically favorable (Strohm et al., 2007; Van de Leemput et al., 2011), although it has not been detected in nature. The reaction is proposed to occur in three steps (Reactions R1–R3) (Babbin et al., 2020), and DNA sequences that encode possible enzymes for steps two and three (Reactions R2 and R3) have been found in ODZ core metagenomic reads and MAGs (Padilla et al., 2016; Babbin et al., 2020). While these sequences were not classified as NOB, they do indicate that parts of the pathway could occur in OMZs. If discovered in OMZs, dismutation would be another N loss pathway, albeit one indistinguishable from denitrification because the 15N atoms in 30N2 come from in both pathways. Here, we evaluate the hypothesis that dismutation is a significant mechanism for oxidation under low-O2 conditions, by searching for product inhibition, the inhibition of both oxidation and 30N2 production (i.e., denitrification) in response to addition of , substrate stimulation (increases in both 30N2 production and oxidation in response to addition of ), and by comparing the oxidation to the produced 30N2 ratio. A ratio near the 3:1 stoichiometry of dismutation (; Reaction R4) would indicate that dismutation could explain the oxidation measured in the ODZ core.
A final area of OMZ biogeochemistry that we investigate is the relative balance between anammox and denitrification as well as these pathways' relationships to the rapid oxidation– reduction loop. After the discovery of anammox, many OMZ studies (Kalvelage et al., 2013; Kuypers et al., 2005; Hamersley et al., 2007; Jensen et al., 2011; Thamdrup et al., 2006; Lam et al., 2009), although not all (Ward et al., 2009; Bulow et al., 2010; Dalsgaard et al., 2012), have reported that anammox is the dominant N loss flux in OMZs; this is a surprising difference from the stoichiometry-based prediction that OMZ N loss should be at most 29 % anammox (Dalsgaard et al., 2003). While the first wave of these studies did not realize that vial septa were introducing O2 into the incubations, many studies after this discovery observed the same result (Kalvelage et al., 2013; Jensen et al., 2011; Babbin et al., 2020). The prediction of a 29 % anammox partition assumes that all for anammox was derived from the remineralization of OM with a mean marine C:N ratio through complete denitrification of to N2 (Dalsgaard et al., 2003, 2012). Anammox rates exceeding 29 % of total N loss would, therefore, require an additional source of beyond current observations of denitrification and the resulting remineralization.
The most well-supported explanations for elevated anammox are as follows:
-
Denitrification is the source, but complete denitrification peaks episodically in response to OM quality while anammox occurs at a slow, consistent, and low rate (Ward et al., 2008; Thamdrup et al., 2006; Babbin et al., 2014; Dalsgaard et al., 2012). The snapshots afforded by isotopic incubations on cruises could, therefore, easily miss episodes of high complete denitrification.
-
Denitrifiers have a strong preference for particles (Ganesh et al., 2013, 2015; Fuchsman et al., 2017), and CTD samples do not capture marine particles very well (Suter et al., 2017). As a result, differences from the expected percentage N loss partition in water column samples are due to missing denitrifiers.
-
The rapid loop between and described previously functions as an “engine” to generate for anammox at the expense of denitrification. The observed magnitudes of reduction and oxidation and these processes' ability to produce from the remineralization of OM with standard C:N ratios without complete denitrification make this an additional logical hypothesis.
The third hypothesis, the – loop, is supported by several pieces of evidence. Firstly, “omics” studies have revealed widespread modular denitrification in OMZs (Sun and Ward, 2021; Fuchsman et al., 2017). Furthermore, experimental studies have shown that anammox rates increase as reduction increases near the coast (Kalvelage et al., 2013). Our study's considerable number of data points, as well as our ability to compare results to rate measurements obtained from identical methods on previous cruises, offers a unique chance to test both the variable denitrification and rapid loop hypotheses for elevated anammox rates.
OMZs are essential regions for the marine N cycle; however, the biogeochemistry of OMZs may currently be in flux due to anthropogenic pressures. Observational studies have reported decreases in O2 across the Pacific (Ito et al., 2017) and the expansion of denitrification and anoxia in the ETNP (Horak et al., 2016). Modeling studies suggest that the OMZ volume will continue to grow in the near future, with uncertain impacts (Stramma et al., 2008; Keeling et al., 2010; Busecke et al., 2022). As a result, it is important to develop a thorough understanding of OMZ N cycling to be able to predict any changes in marine productivity as deoxygenated regions grow. This study contributes towards this goal by examining four open research questions in OMZ biogeochemistry:
-
Is the rapid-cycle hypothesis correct, i.e., that reduction and oxidation rates are much greater than N loss rates, especially in the oxycline and ODZ top?
-
Does truly anaerobic oxidation occur in OMZ regions?
-
If so, is dismutation the mechanism by which it occurs?
-
Is anammox the dominant N loss flux? If so, what is the explanation?
2.1 , , and concentration measurements
Nutrient measurements on all cruises were conducted as follows. Ambient concentrations were measured on each vessel using the sulfanilamide and N-(1-Naphthyl)ethylenediamine (NED) colorimetric technique with a spectrophotometer (Strickland and Parsons, 1972). profile samples were frozen aboard each ship and then thawed and measured immediately using the chemiluminescence method upon return to the Ward Laboratory (Braman and Hendrix, 1989). Ambient concentrations were measured on each ship using the ortho-phthalaldehyde (OPA) method (Holmes et al., 1999; Taylor et al., 2007; ASTM International, 2006). In some cases, and were measured on different casts than those of the rate measurements. In these cases, figures and calculations use interpolated nutrient values based on the potential density of nutrient sampling and rate measurement depths. Interpolations were performed with the MATLAB pchip function.
2.2 oxidation and reduction rates
Incubation experiments were performed aboard the R/V Sally Ride in March and April 2018 (SR1805). oxidation and reduction rates were measured at three stations: PS1 (open-ocean OMZ boundary), PS2 (open-ocean OMZ), and PS3 (coastal OMZ) (Fig. 1). Rates were measured throughout the water column at 10 depths per station (see Table S1 in the Supplement for depths). Water was directly sampled from the CTD into 60 mL serum vials. After overflowing three times, bottles were sealed with a rubber stopper and crimped with an aluminum seal. After this, a 3 mL headspace of He was introduced, and samples from below the oxygenated surface depths were purged for 15 min with He at a flow rate of 0.4 L min−1. This flow rate exchanged the volume of each bottle 100 times. Immediately after this, 0.1 mL of tracer solution was added to all bottles. and tracers were added to reach final concentrations of 0.5 and 3 µM, respectively. Five bottles were incubated per time course, and incubations were ended at 0 (one bottle), 12 (two bottles), and 24 h (two bottles) via addition of 0.2 mL of saturated ZnCl2. Samples were analyzed at the University of Basel using a custom-built gas bench connected by a Conflow IV interface to a Delta V Plus isotope ratio mass spectrometer (IRMS; Thermo Fisher Scientific). A total of 5 mL of the sample was used to convert to N2O using the azide method (McIlvin and Altabet, 2005). A linear increase in 15N- over time and a standard curve to convert from peak area units to nanomoles of N were used to calculate the production rates according to Eqs. (1) and (2) below:
where is the slope of produced over time and and are the respective fractions of the and pools that are labeled with 15N.
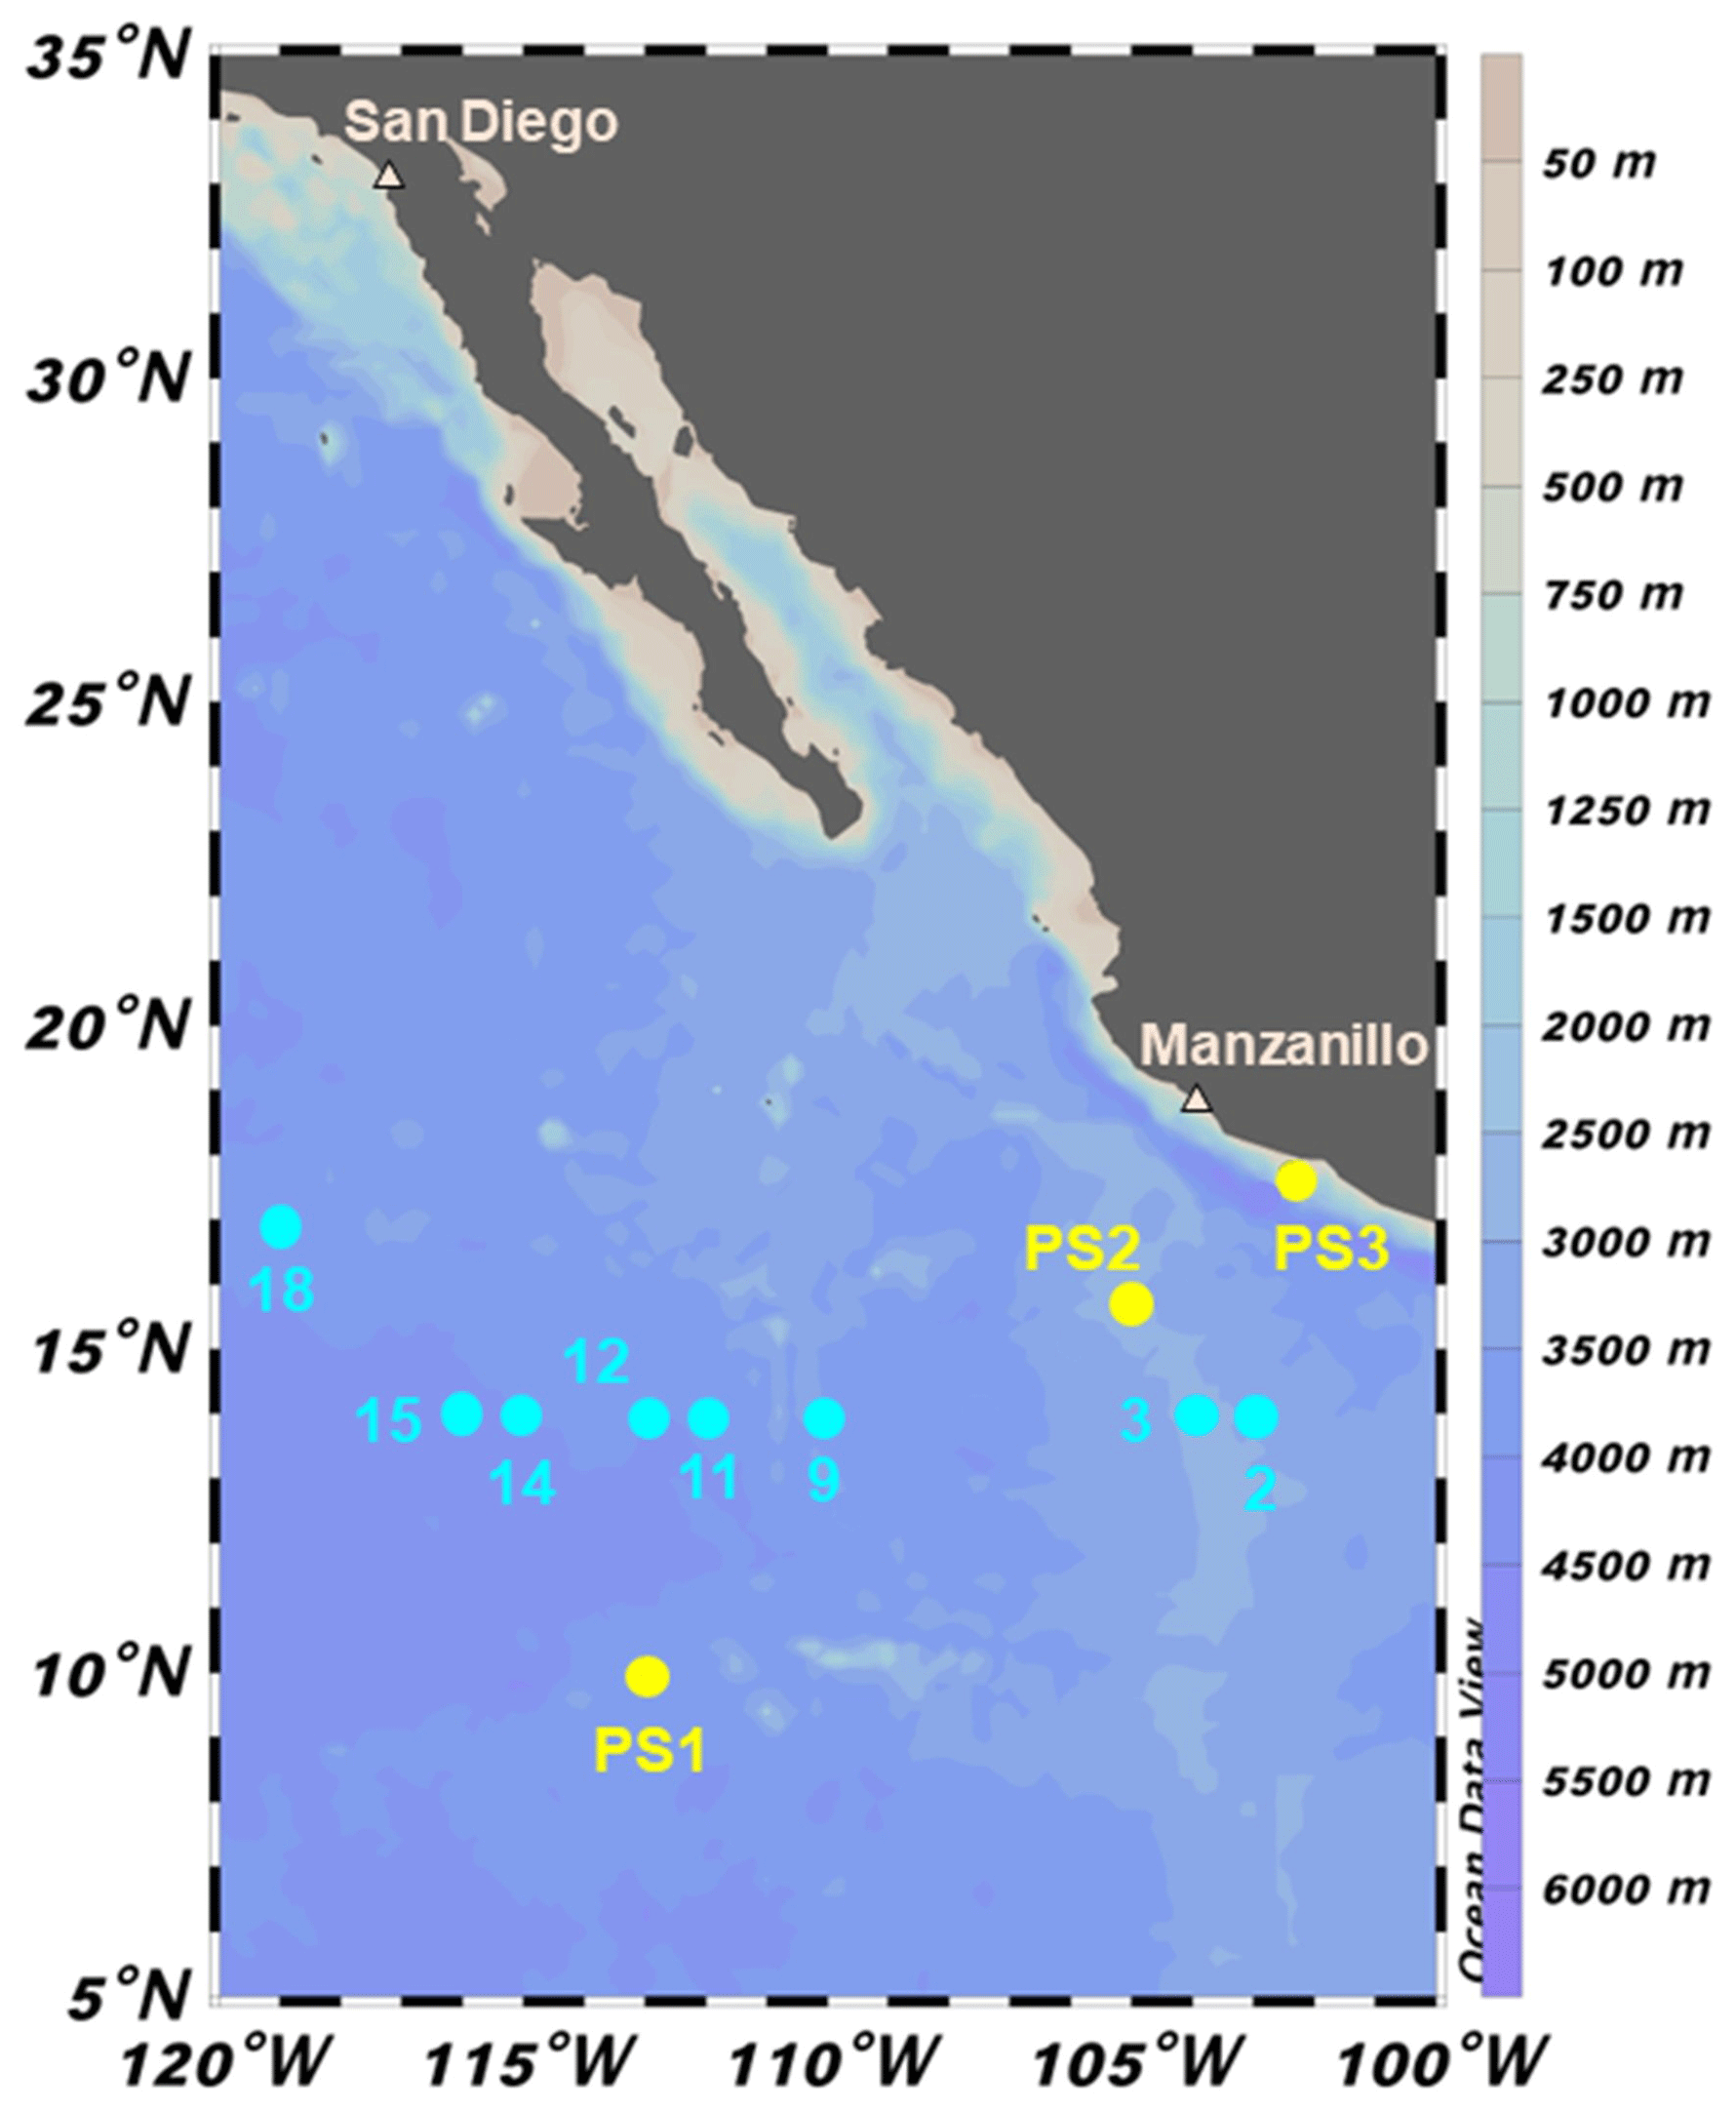
Figure 1Sampling locations during 2018 cruises to the ETNP OMZ. SR1805 stations (spring 2018) are shown in yellow and FK180624 (summer 2018) stations are shown in cyan. Stations PS1 and 18 are located in more oxic environments on the boundary of the OMZ region. The remaining FK180624 stations occur along a gradient towards the center of the OMZ region, represented by station PS2 and FK180624 stations 2 and 3. These three stations are referred to as OMZ core stations. Station PS3 (referred to as coastal) represents a final biogeochemical subregion due to its proximity to the coast.
The significance of the rates was evaluated using a Student t test with a significance level of 0.05. The reported error bars are the standard error of the regression. The oxidation rates reported here have previously been published, and the experimental method used is more thoroughly described in this previous publication (Frey et al., 2022).
2.3 Anammox and denitrification rates depth profiles
Incubation experiments were performed during SR1805 in March and April 2018 and on the R/V Falkor (FK180624) during June and July 2018. As above, rates were measured at PS1, PS2, and PS3 at 10 depths per station (see Table S1 in the Supplement for sampling depths) during SR1805. On FK180624, rates were measured at eight stations that spanned a gradient from the core of the OMZ region to its edges (see Table S2 in the Supplement for sampling depths). At all stations and depths, water was directly sampled from the CTD into 320 mL borosilicate ground-glass-stoppered bottles. After overflowing three times, bottles were stoppered with precision ground-glass caps specifically produced to prevent gas flow. The bottles were transferred to a glove bag and amended with the following treatments: 3 µM each of and (denitrification and anammox) and 3 µM each of and (anammox) on SR1805. Amendments of and totaling 2 µM were used on FK180624. It should be noted that our tracer additions were far above in situ values at many depths. Thus, all anammox and denitrification rates with high changes from baseline nutrient concentrations represent potential rates. A total of 8 mL of tracer-amended seawater was aliquoted into 12 mL Exetainer vials (LABCO). Exetainer vials were sealed in a glove bag with butyl septa and plastic screw caps that had been stored under helium for at least 1 month, removed, and then purged for 5 min at 3 psi with helium gas to remove any O2 that accumulated during sampling and processing. This purging step is another reason our anammox and denitrification rates sourced from partially or fully oxygenated waters should be regarded as potential rates.
Rates for each sampled depth were calculated using a five-time-point time course with three replicates at each point. Incubations were ended by injecting 50 µL of saturated ZnCl2, and vials were stored upside down to prevent the headspace from leaking through the vial cap during storage and transit. A total of 6 months after the cruise, samples were analyzed using a Europa 22-20 IRMS (SerCon). Raw data values were corrected for instrument drift due to run position and total N2 mass. Drift-corrected values and standard curves to convert from peak area units to nanomoles of N2 were used to calculate rates according to the equations below (Thamdrup et al., 2006; Thamdrup and Dalsgaard, 2000, 2002) (for more details, the reader is referred to the Supplement).
Denitrification (from ) was calculated as
Anammox (from ) was calculated as
Anammox (from ) was calculated as
Here, is the slope of the regression of the amount of 30 or 29N2 vs. time, and are the respective fractions of the and pools labeled as 15N, and D is the denitrification rate calculated according to Eq. (3).
A Student t test with a significance level of 0.05 was used to evaluate all rates. The reported error bars are the standard error of the regression. As the anammox rates measured via both tracers on the SR1805 cruise were similar in magnitude (Table S3 in the Supplement), anammox values reported in Figs. 2, 3, 6, 7, 8, and 9 are based on a combination of these values (see the Supplement). Previously published (Babbin et al., 2020) anammox and denitrification rates are sourced from four stations occupied during the R/V Thomas G. Thompson's March and April 2012 cruise to the ETNP (TN278) and the RVIB Nathaniel B. Palmer's June and July 2013 ETSP cruise (NBP1305), and they were conducted in the same manner as the SR1805 and FK180624 incubations. Crucially, the same mass spectrometer was used to measure N loss rates across the 2012, 2013, and 2018 cruises. Station locations for the 2012 and 2013 cruises were as follows: TN278 ETNP coastal (20∘00′N, 106∘00′W), ETNP offshore (16∘31′N, 107∘06′W), NBP1305 ETSP coastal (20∘40′S, 70∘41′W), and ETSP offshore (13∘57′S, 81∘14′W).
2.4 SR1805 oxidation depth profiles
Nitrite oxidation depth profiles were measured in the same Exetainer vials used to measure anammox and denitrification depth profiles ( treatment only). The rate of oxidation was determined by converting the produced during the incubations to N2O using the denitrifier method (Weigand et al., 2016; Granger and Sigman, 2009) (see the Supplement). The samples were stored at room temperature in the dark until analysis on a Delta V (Thermo Fisher Scientific) mass spectrometer that measures the isotopic content of N in N2O (Weigand et al., 2016). Samples were corrected for instrument drift due to run position and total N2 mass (for more details, see the Supplement). Drift-corrected δ15N values and a standard curve were then used to calculate the rate as follows:
Here, Eq. (6) is a rearrangement of the definition of δ15N,
44N2Oarea is the amount of 44N2O measured as sample peak area in volt seconds; and 0.003667 is the natural abundance of 15N in air. A Student t test with a significance level of 0.05 was used to evaluate all rates. Reported error bars are the standard error of the regression. Previously published (Babbin et al., 2020) oxidation rates are from the abovementioned TN278 and NBP1305 cruises and were conducted at the same four stations where N loss rates were measured. These oxidation rate measurements were conducted according to the same procedures used for the SR1805 depth profiles.
2.5 oxidation and O2 manipulation experiments
Experiments were conducted during cruises SR1805 and FK180624 in spring and summer 2018. Wide-mouthed PYREX round media bottles (800 mL total volume, 500 mL working volume; Corning, USA; product code 1397-500) were used for all incubations. These bottles were modified to include three stainless-steel bulkhead fittings (Swagelok, USA) secured to the interior of the lid with a Viton rubber gasket and stainless-steel washer between the lid and the sealing nut. The three ports consisted of two one-eighth inch fluidic ports (inflow and outflow) and one one-quarter inch sampling port. The fluidic ports were fitted with one-eighth inch nylon tubing, with the inflow line penetrating to the base of the bottle. The one-quarter inch sampling port had a butyl rubber septum between the Swagelok stem and nut. This setup permitted continuous gas purging of the bottles while maintaining an otherwise closed system.
For each depth and O2 treatment, three bottles were filled to 500 mL with sample water from a Niskin bottle and closed. Sample water for all experiments except station 18 on the FK180624 cruise was drawn from water below 2.2 µM O2 (see Table S4 in the Supplement for all ambient O2 values). Highly precise digital mass flow controllers (Alicat Scientific) were then used to establish the desired O2 concentrations in each bottle. Mixing ratios were calculated to create a range of O2 concentrations spanning 1, 10, 100 nM, 1 µM, and 10 µM. The gas mixture modified by the mass flow controllers was a zero-air gas mixture (Airgas) consisting of 21 % O2, 79 % N2, and 1000 ppm pCO2 (the approximate in situ value). Initial gas flow was 1 L min−1 for 1 h to equilibrate the seawater followed by 100 mL min−1 for the remainder of the experiment. Bottles were daisy-chained together to maintain the same flow rate among them (two bottles on SR1805 and six on FK180624). As in the depth profile experiments, 3 µM amendments were added prior to purging. Incubations were conducted in the dark at 12 ∘C in a cold room (SR1805) or beverage cooler (FK180624). At the beginning of the experiments, after purging for 1 h, O2 was checked with a LUMOS optode with a detection limit of 0.5 nM (Lehner et al., 2015) and CO2 was checked by measuring pH using the colorimetric meta-cresol purple method. The LUMOS optode confirmed that O2 concentrations were within a few nanomoles of the calculated values. While our use of high-precision digital mass flow controllers and this qualitative O2 check provide confidence that our O2 concentrations are accurate, due to the fact that O2 was not continuously monitored through the time course, we refer to each O2 concentration as a “putative” concentration for the remainder of this paper. Samples (50 mL) were withdrawn every 12 h for 2 d with a four inch hypodermic needle attached to a 60 mL disposable plastic syringe. Samples were ejected into acid-cleaned high-density polyethylene bottles pre-amended with 200 µL of saturated ZnCl2 solution. Bottles were screwed closed and wrapped with PARAFILM. Samples from each of the three initially collected bottles were collected to create triplicates at each time point.
2.6 dismutation experiments
Nitrite dismutation experiments were performed during SR1805 at station PS3 (coastal waters) at two deoxygenated depths: 60 and 160 m. Incubations were performed in the same manner as the above anammox, denitrification, and oxidation experiments where all three rates were measured in the same Exetainer vials. Experiments consisted of eight total treatments: four varying tracer concentrations (1.125, 5.25, 10.5, and 20.25 µM for 160 m and 0.75, 1.5, 3.75, and 7.5 µM for 60 m) and two treatments (0 or 20 µM). As above, the production of both 30N2 and via the denitrifier method (Weigand et al., 2016) was measured. In order to test our hypothesis that, if dismutation is occurring, the unexplained oxidation rate (the difference between the measured oxidation and the oxidation due to anammox) and the denitrification rate (i.e., the 30N2 production rate) should have a 3:1 ratio, a previously published anammox stoichiometry (Reaction 4; Kuenen, 2008) was used to calculate the oxidation due to anammox. The anammox rates used for this calculation are included in Fig. S4 in the Supplement.
2.7 Calculation of N loss from oxidation
The calculation of the maximum possible N loss from oxidation via NO disproportionation by ammonium-oxidizing archaea (AOA) in Table S5 in the Supplement was carried out by dividing the measured oxidation rate by 2 in accordance with the stoichiometry of oxidation and NO disproportionation proposed in a previous study (Kraft et al., 2022). It should be noted that this operation represents the extreme case where all produced in oxidation is converted to N2. We acknowledge this as an unrealistic assumption used to evaluate the extreme limits of the amount of total N loss attributable to oxidation. This operation was carried out for all depths where oxidation, anammox, and denitrification rates were measured, irrespective of O2 concentration.
2.8 Redundancy analysis (RDA), principle component analysis (PCA), and statistics
All RDA, PCA, redundancy, and correlation analyses were performed with the available packages in R (v4.2.1 “Funny-Looking Kid”) (R: A language and environment for statistical computing). All data were first normalized around zero before calculating the Pearson correlation coefficient. Gene abundances (nirS and amoA) from qPCR analyses used for the RDA and correlation analyses were measured as previously described (Peng et al., 2015; Jayakumar et al., 2009; Tang et al., 2022).
2.9 Definition of shallow boundary and ODZ core nomenclature
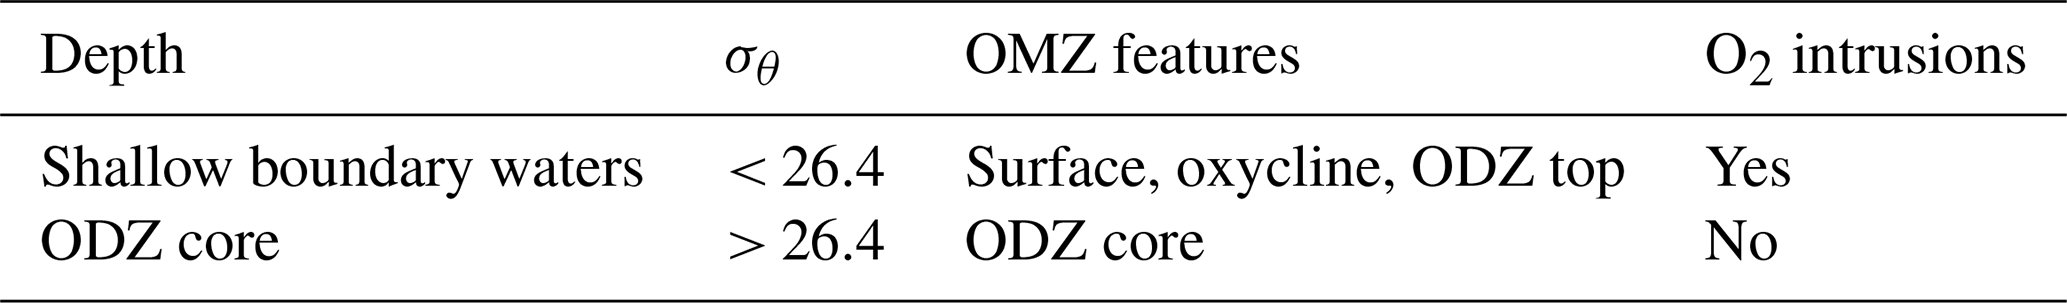
In Sects. 3 and 4, the results are classified as shallow boundary or ODZ core waters according to a previously published threshold (Babbin et al., 2020) where shallow boundary samples have an in situ potential density < 26.4. This method is based on a global profile of OMZ waters meant to delineate shallow boundary samples as waters that are oxic or may be influenced by O2 intrusions (the surface, the oxycline, and the ODZ top) from those that are not normally influenced by O2 intrusions (the ODZ core). Due to the fact that the potential density threshold is based on a global average, a few depths that are clearly in the deep oxycline based on the SR1805 O2 depth profiles are classified as ODZ core (σθ > 26.4) by the potential density threshold. Despite this caveat, we used this naming scheme throughout the remainder of the paper to enable comparisons to previous literature (Babbin et al., 2020).
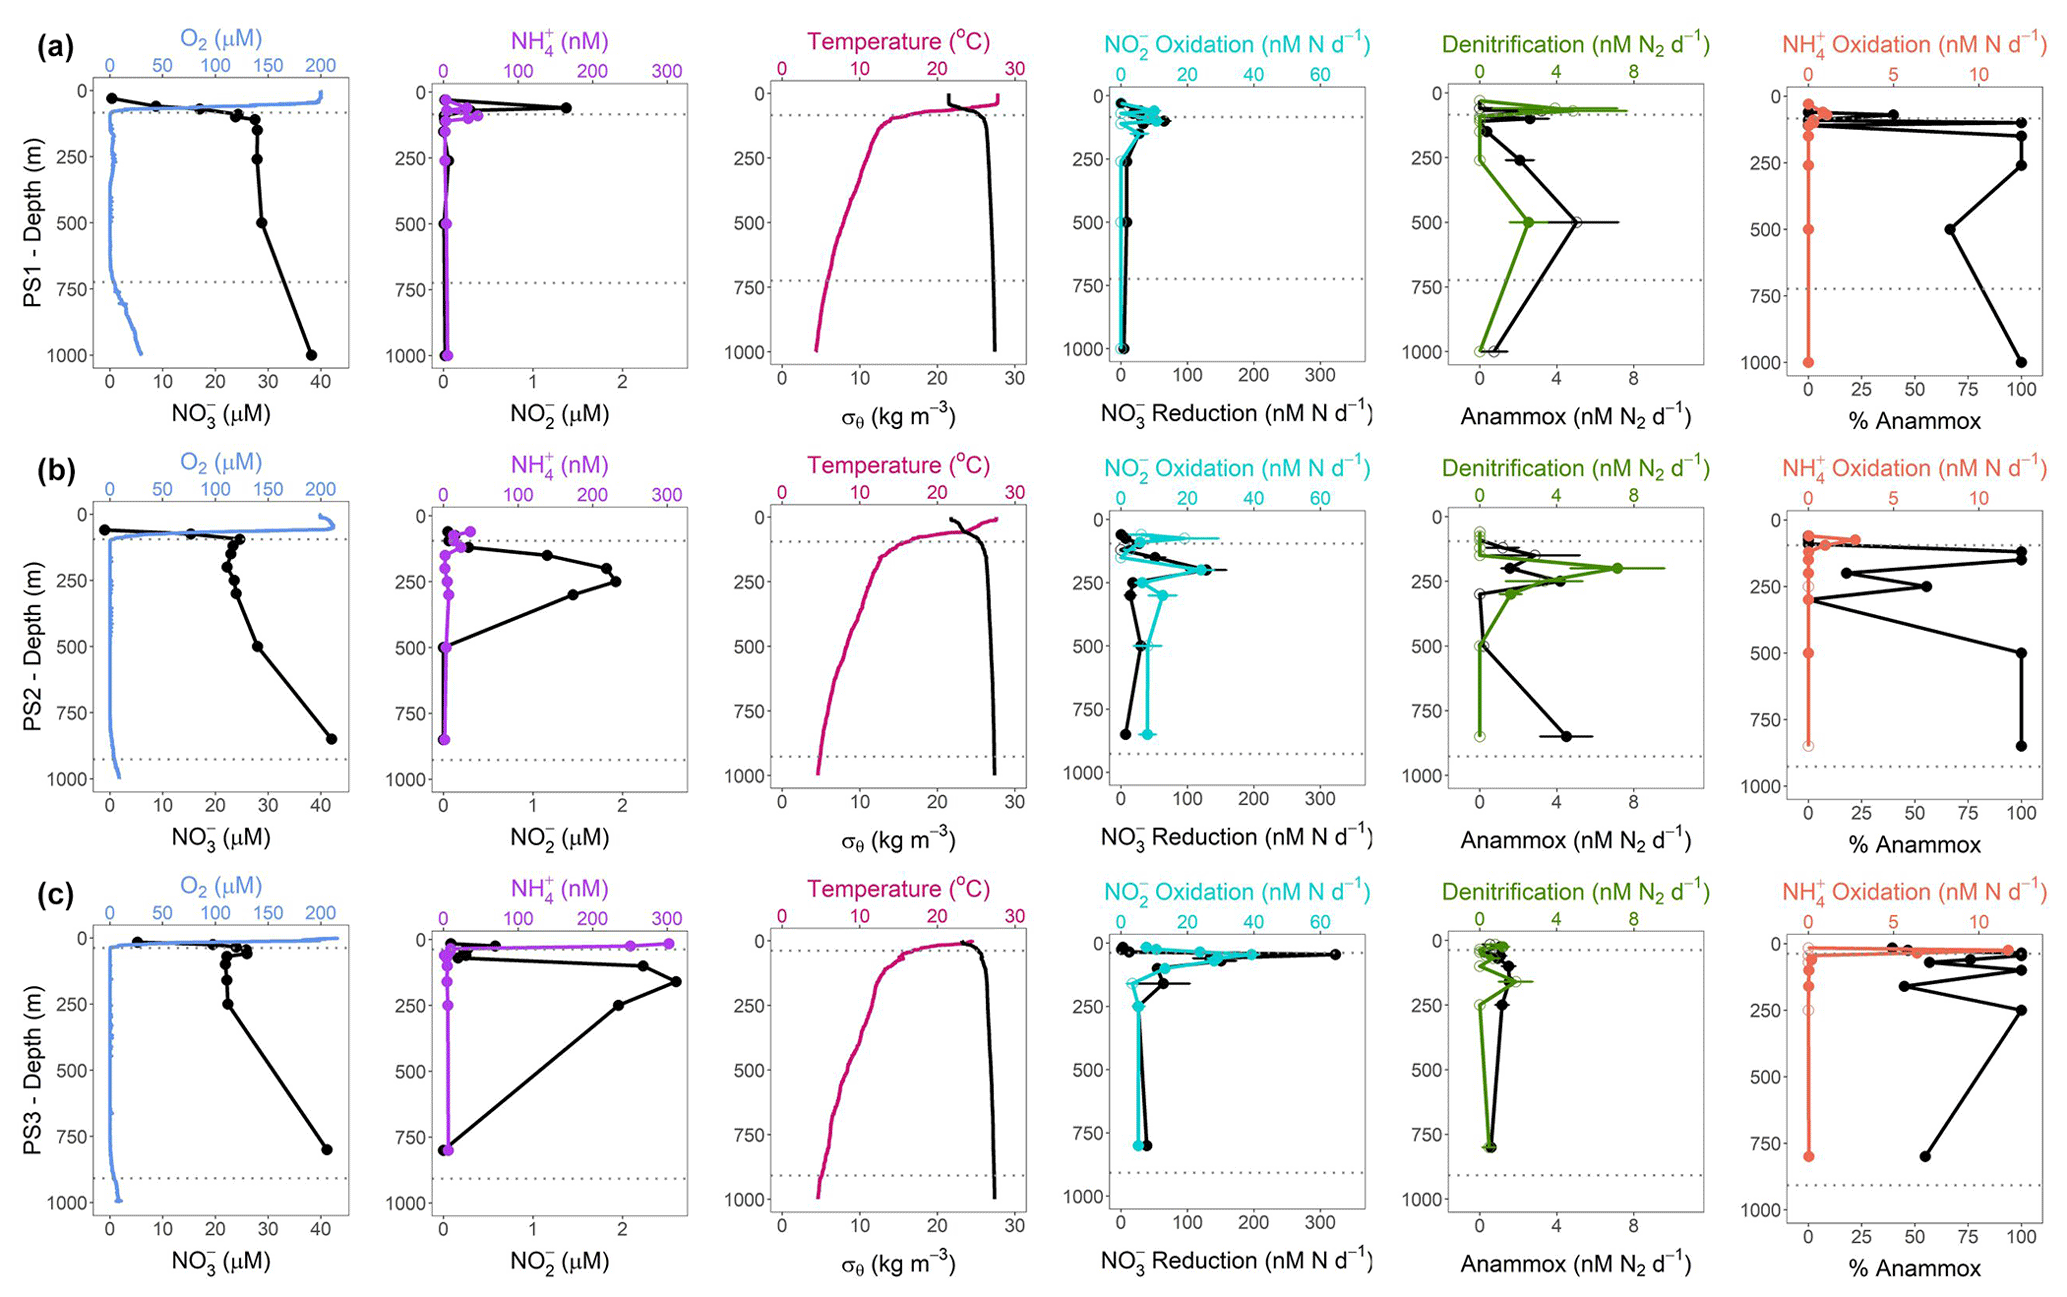
Figure 2SR1805 depth profiles of physical parameters and N cycling rates. Panel (a) shows (from left to right) the following parameters for station PS1 (offshore): O2 (µM) and (µM), in blue and black, respectively; (nM) and (µM), in purple and black, respectively; temperature (∘C) and σθ (kg m−3), in pink and black, respectively; oxidation and reduction rates (nM N d−1), in cyan and black, respectively; anammox and denitrification rates (nM N2 d−1), in black and green, respectively; and oxidation rates (nM N d−1) and percentage anammox, in coral and black, respectively. Panels (b) and (c) are the same as panel (a) but for stations PS2 (OMZ) and PS3 (coastal), respectively. Rates that are significantly different from zero are shown as filled circles, and open circles signify rates that are not significantly different from zero. Error bars are the standard error of the regression. Dotted gray lines indicate the upper and lower ODZ boundaries at the time of sampling.
3.1 The 2018 depth profiles of all N cycling rates
N cycling depth profile experiments were conducted on two cruises (SR1805 and FK180624) during spring and summer 2018. These two cruises sampled stations along a gradient from the edge of the OMZ region to near the coast. Physical and chemical conditions varied among stations PS1, PS2, and PS3 on the SR1805 cruise (spring 2018) and across all FK180624 stations (summer 2018) (Fig. 2, S1). Broadly speaking, the vertical span of the ODZ increased and the top of the ODZ shoaled as distance to shore decreased. Deep SNMs were observed at almost all stations with the only exceptions being the furthest offshore stations, stations 11 and 18 from the FK180624 cruise (Fig. S1) and station PS1 from SR1805 (Fig. 2a). Peak values for all SNMs were on the lower side of the range of previous ETNP observations (Horak et al., 2016), between 1.4 and 2.6 µM.
Of the five N cycling processes measured on the SR1805 cruise, reduction rates had the greatest magnitude at most depths. This trend was most pronounced within the upper ODZ, where reduction rates peaked at station PS2, and the oxycline, where reduction rates peaked at stations PS1 and PS3 (Fig. 2). Rates of oxidation closely tracked reduction in distribution; in fact, peak oxidation rates co-occurred with peak reduction rates at all three SR1805 stations, reaching maxima of ∼ 40nM N d−1 ( oxidation) and ∼ 300nM N d−1 ( reduction) at PS3. However, the magnitudes of oxidation rates were usually lower than reduction rates, sometimes by as much as 8-fold. The third N recycling process, oxidation, peaked at or above the oxycline, with peaks of 10 nM N d−1 or less. oxidation was consistently measured to be zero or near-zero throughout the rest of the water column.
Table 1Explanation of shallow boundary waters and ODZ core potential-density-based nomenclature (Babbin et al., 2020).
Across all SR1805 and FK180624 stations, the magnitude of the N loss processes of anammox and denitrification was almost always less than 10 nM N2 d−1, a much lower magnitude than the N recycling processes of reduction and oxidation. Like reduction and oxidation, the two N loss rates peaked in the upper ODZ or right at the oxycline in all three SR1805 stations, although a deep peak (850 m) in anammox was observed at station PS2 (Fig. 2b). This peak occurred near the bottom of the ODZ at an O2 concentration of 1.5 µM. N loss rates also peaked near the oxycline at the three FK180624 stations with broad coverage of the ODZ water column: station 2, station 9 (6 July sampling), and station 9 (9 July sampling) (Fig. S1). The relative balance between the two N loss processes as measured by percentage anammox varied widely across the water column but largely deviated from the expected partitioning of at most 29 % anammox (Dalsgaard et al., 2003, 2012). A striking example of this is that 100 % anammox values were observed in both ODZ core and shallow boundary (see Table 1 for definitions) samples at many of the SR1805 and FK180624 stations (Figs. 2, S1).
3.2 Anaerobic oxidation and O2 manipulation experiments
Significant oxidation rates were detected in depth profiles across a range of suboxic O2 concentrations (1–5 µM) (definition from Berg et al., 2022) across all SR1805 stations, often at the same depths and in the same vials where the obligately anaerobic processes of anammox and denitrification were occurring (Figs. 2, 3a–c, S2). In order to contextualize our observations, we compared our results to previously published measurements from the TN278 and NBP1305 cruises performed with identical procedures (Babbin et al., 2020). The highest rates were observed in shallow boundary waters across all three cruises (Figs. 3a–c, S2). As low but significant levels of O2 can still support aerobic oxidation, a series of O2 manipulation experiments was carried out on both the SR1805 (spring) and FK180624 (summer) 2018 cruises (Figs. 4a–f, S3). In these experiments, anoxic conditions were checked using a LUMOS O2 optode with a detection limit of 0.5 nM (Lehner et al., 2015). We observed significant oxidation as well as reduction at putative concentrations as low as 1 nM. Notably, compared to previous experiments, gas flushing was constant, with a refresh time of 8 min, so as to maintain O2 levels within the incubation even while organisms were respiring. At 1 nM, O2 is so scarce that such waters are usually classified as functionally anoxic; for example, a recent review paper defined 3 nM as the threshold below which O2 cannot play biological or biogeochemical roles (Berg et al., 2022). As a result, these experiments present convincing additional evidence for the occurrence of oxidation up to ∼ 100 nM N d−1 at O2 concentrations too low to support aerobic metabolisms.
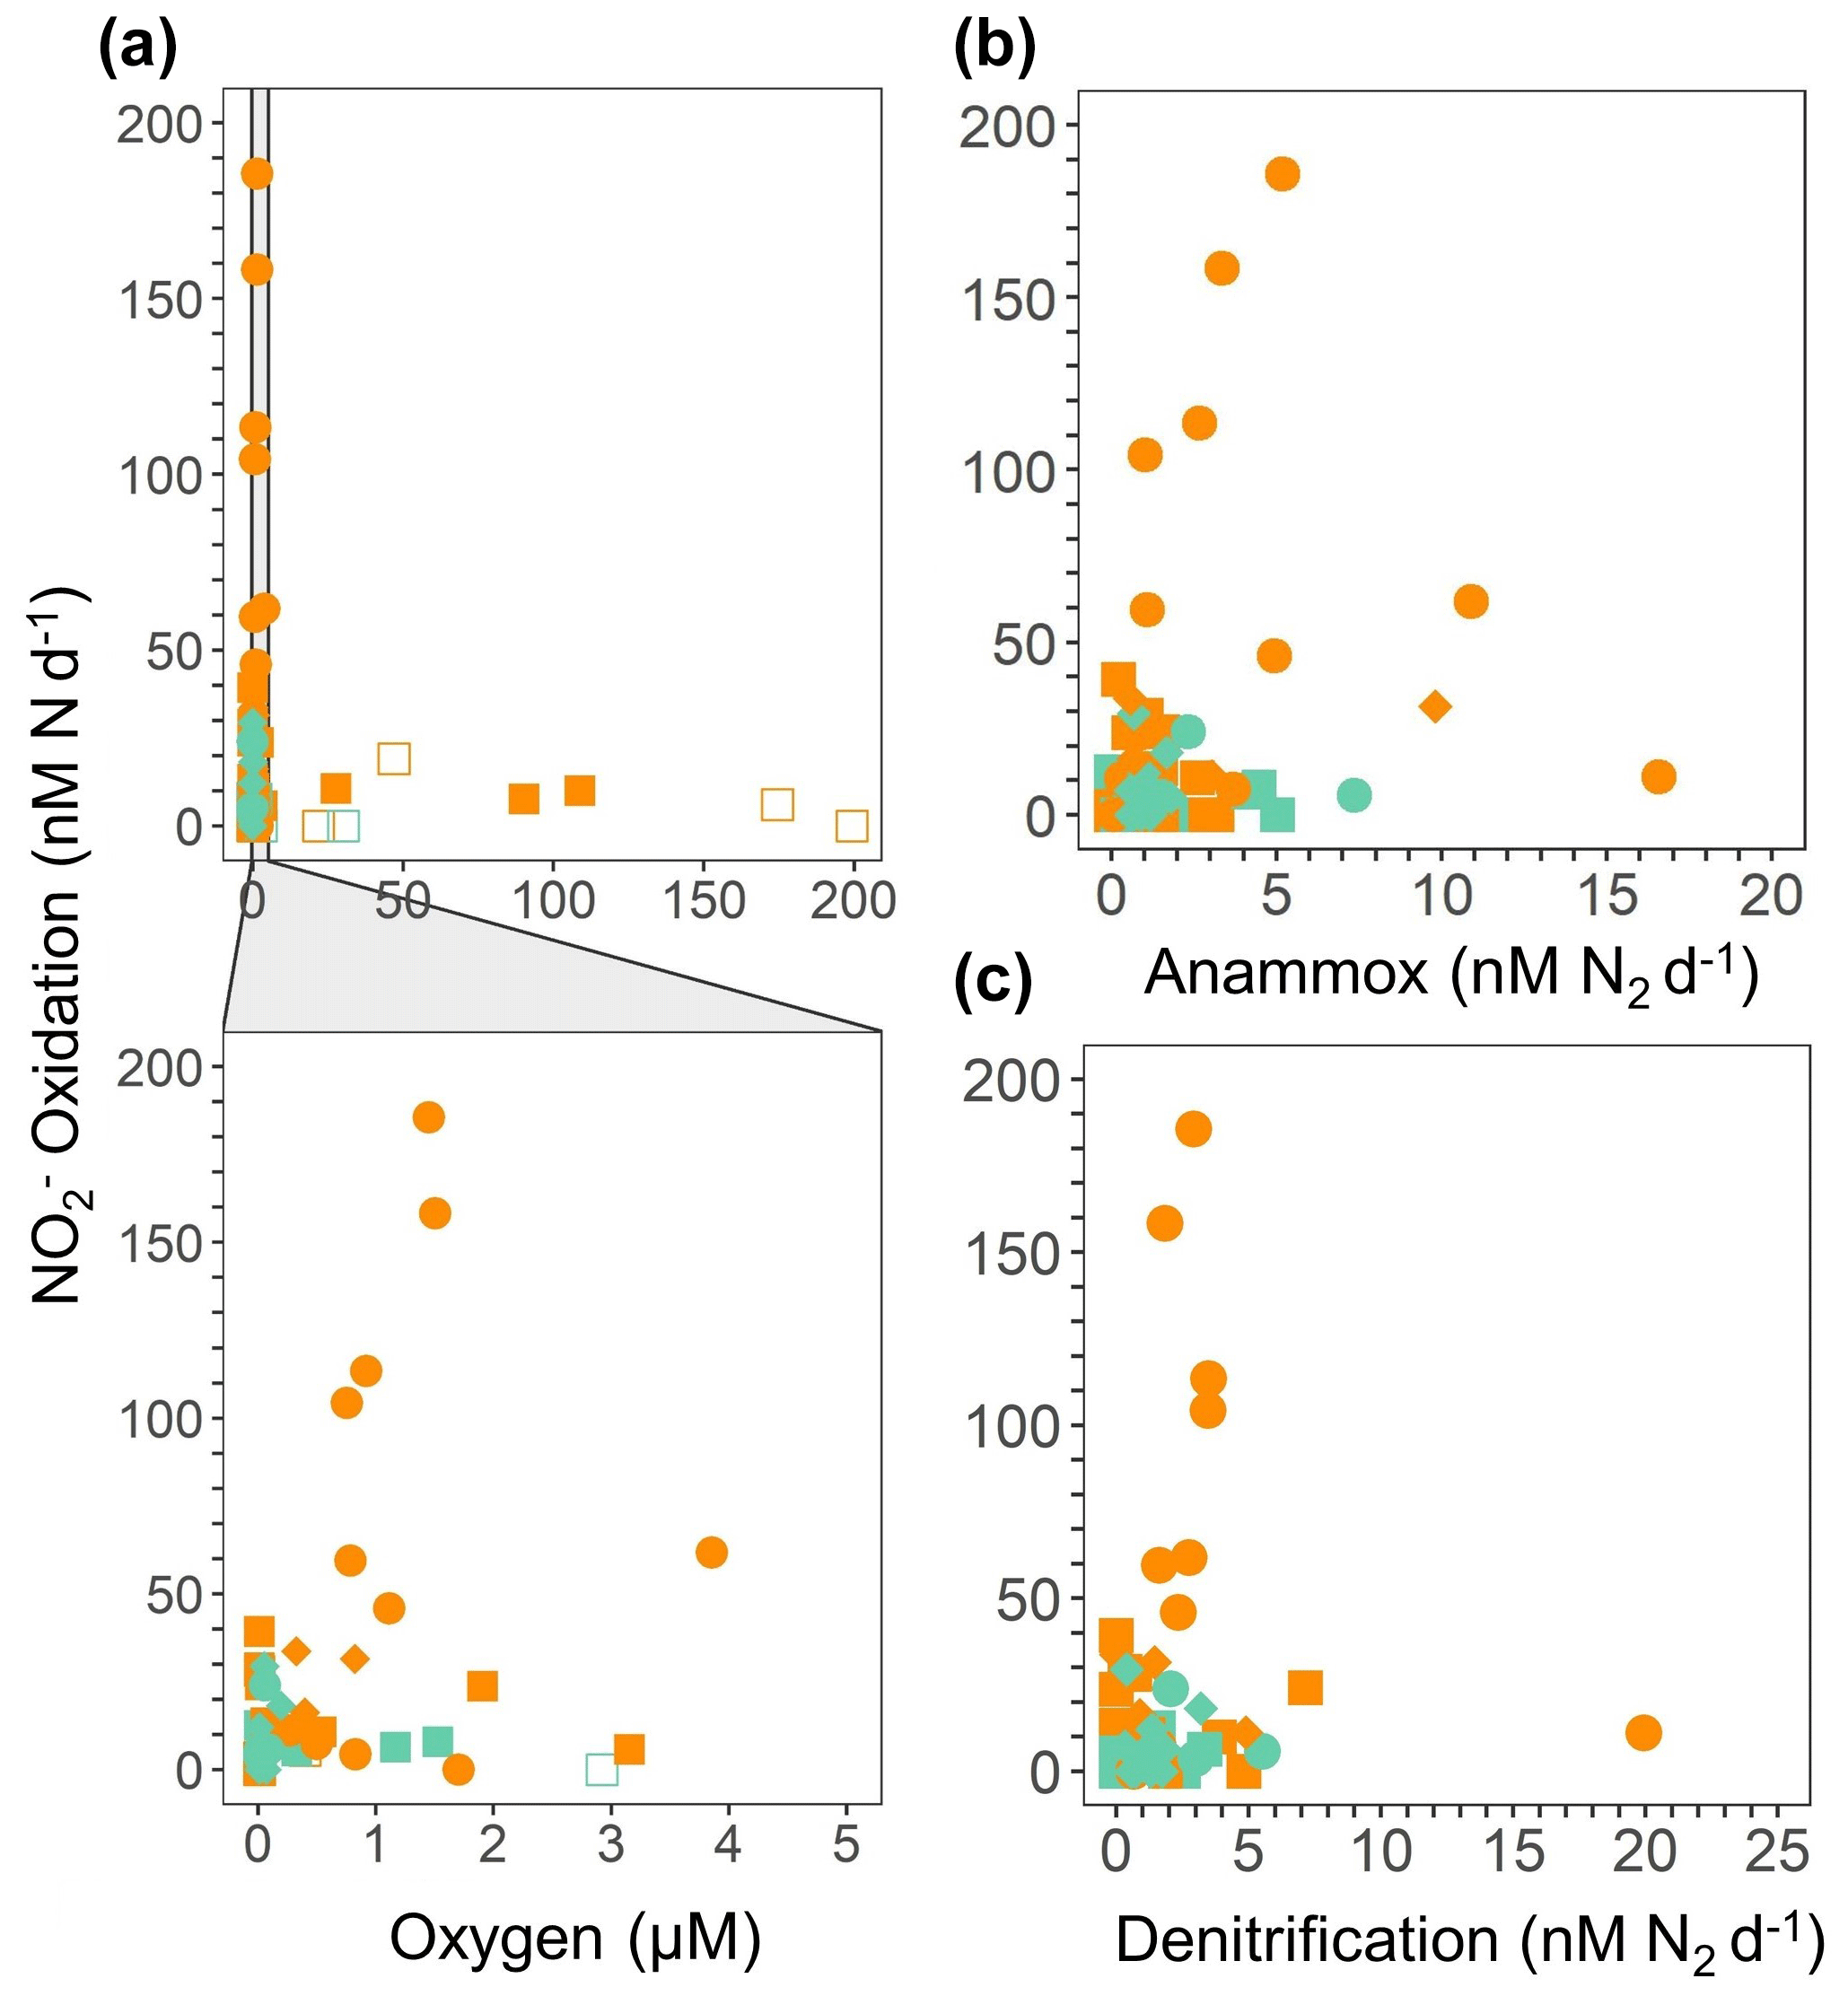
Figure 3 oxidation rates (nM N d−1) from the 2018 SR1805 (squares), 2012 ETNP TN278 (circles), and 2013 ETSP NBP1305 (diamonds) cruises vs. (a) O2 concentration (µM) from shipboard CTD sensors, (b) anammox rates (nM N2 d−1), and (c) denitrification rates (nM N2 d−1). O2 concentrations were normalized across cruises. In panel (a), rates that are significantly different from zero, as assessed via a Student t test (p value < 0.05), are displayed as filled symbols, and insignificant oxidation rates are shown as open symbols. Rates measured in shallow boundary waters are colored orange, whereas rates from the ODZ core and below are colored teal. Data for 2012 and 2013 are republished (Babbin et al., 2020).
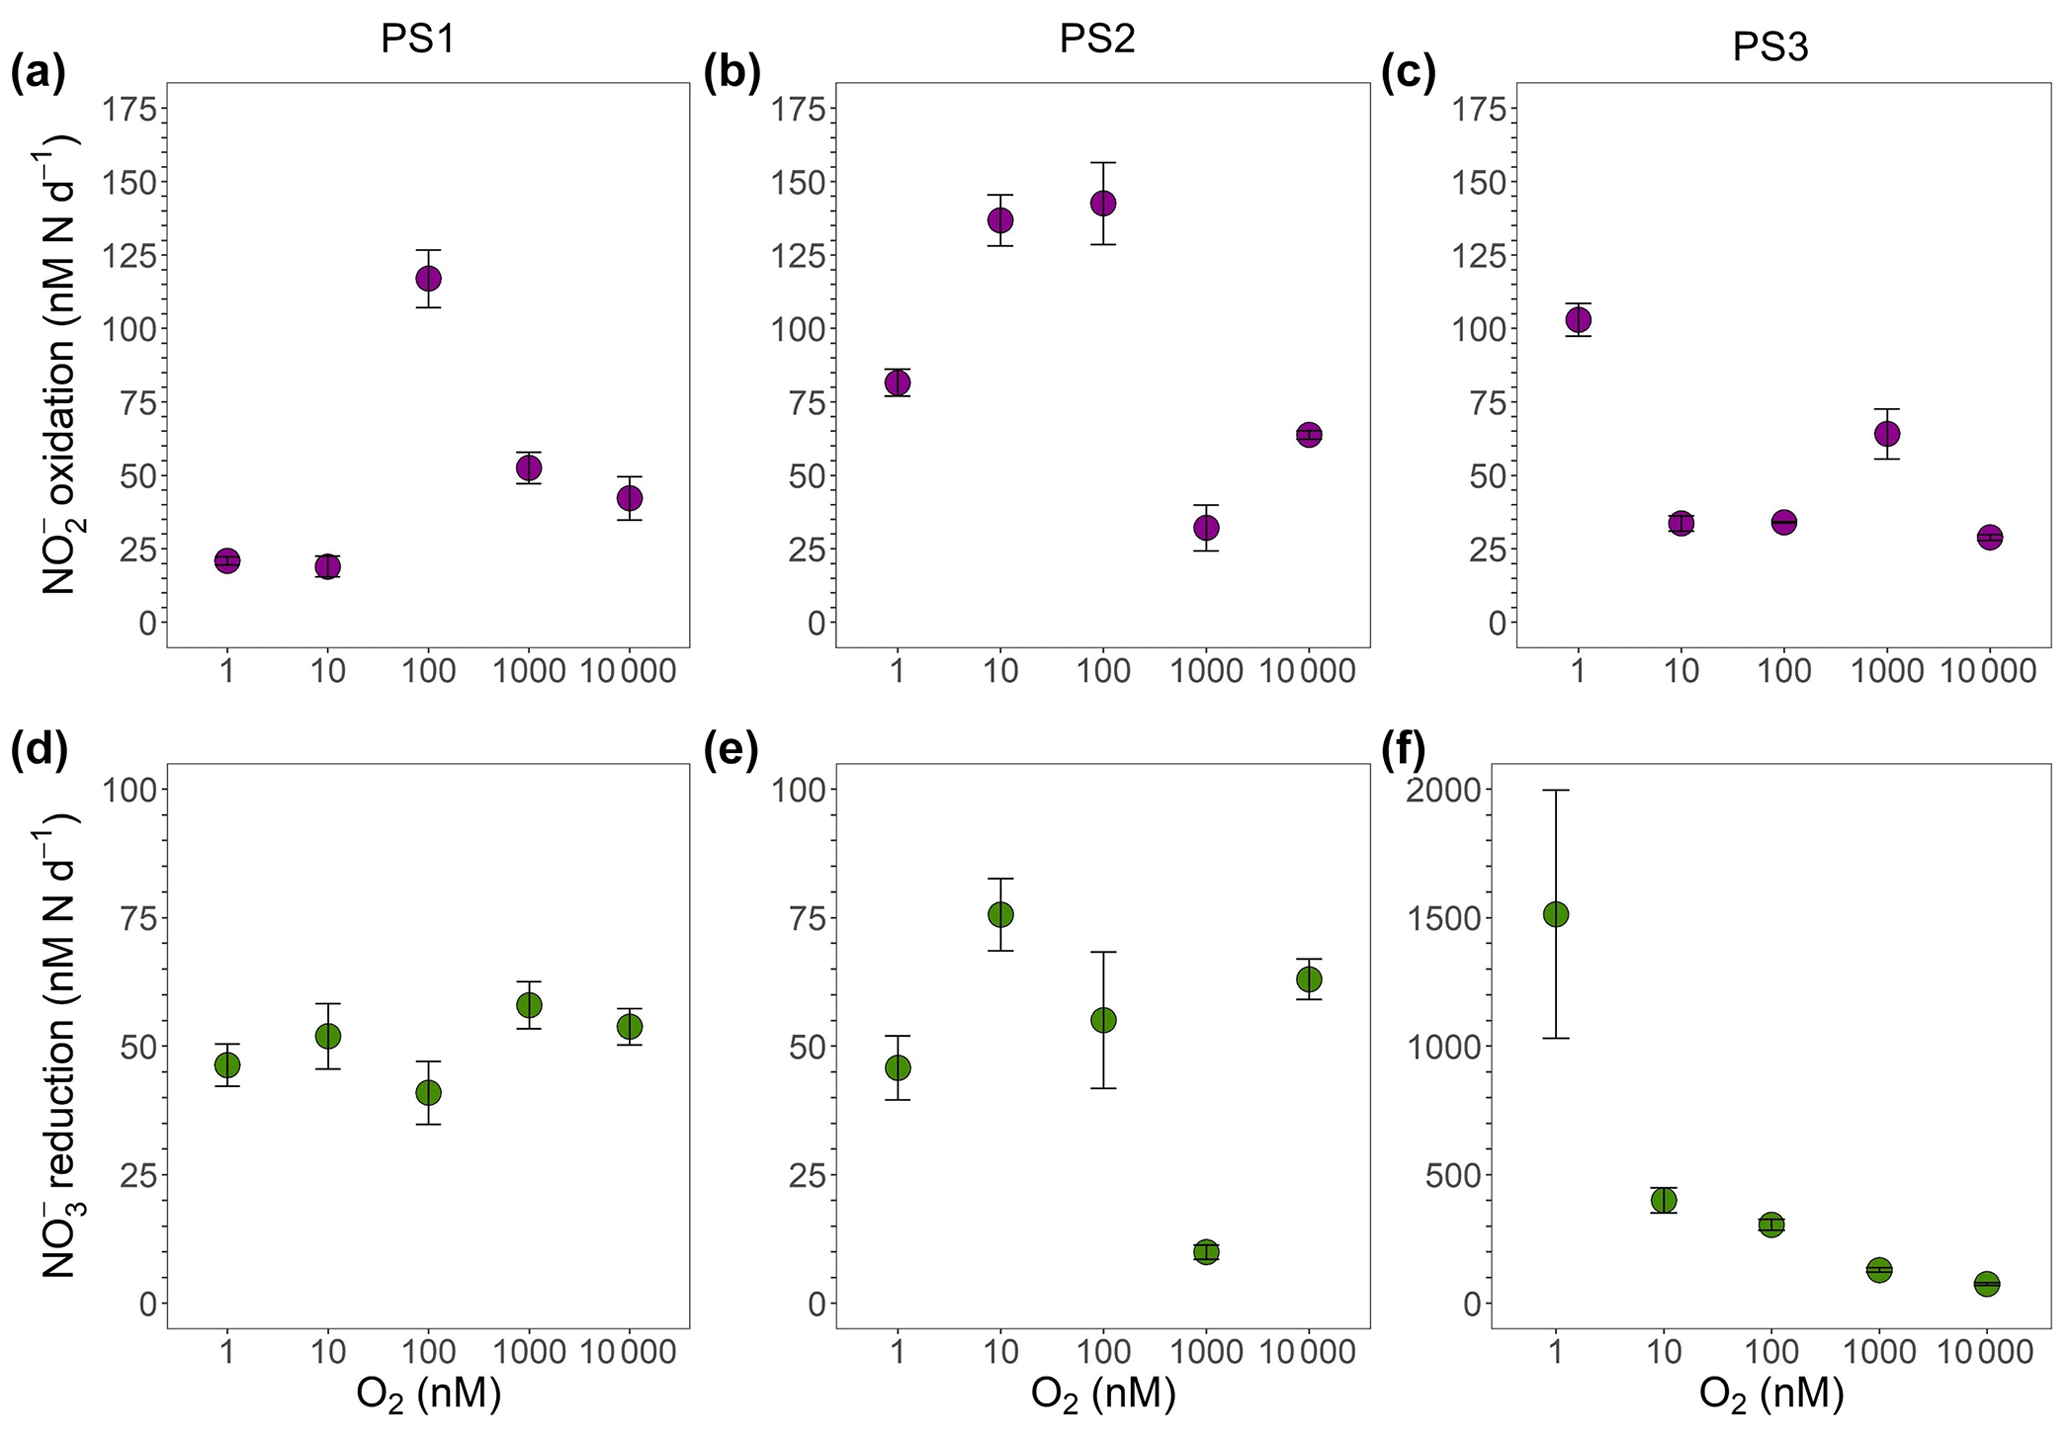
Figure 4Oxygen manipulation experiments that show (a–c) oxidation (purple) and (d–f) reduction (green) rates (nM N d−1) measured across putative O2 concentrations from 1 to 10 000 nM during the SR1805 cruise. Experiments were conducted with waters from the ODZ top: (a, d) 93–110 m (PS1), (b, e) 113–130 m (PS2), and (c, f) 45–60 m (PS3). Error bars are the standard error of the regression. All rates were significantly different from zero.
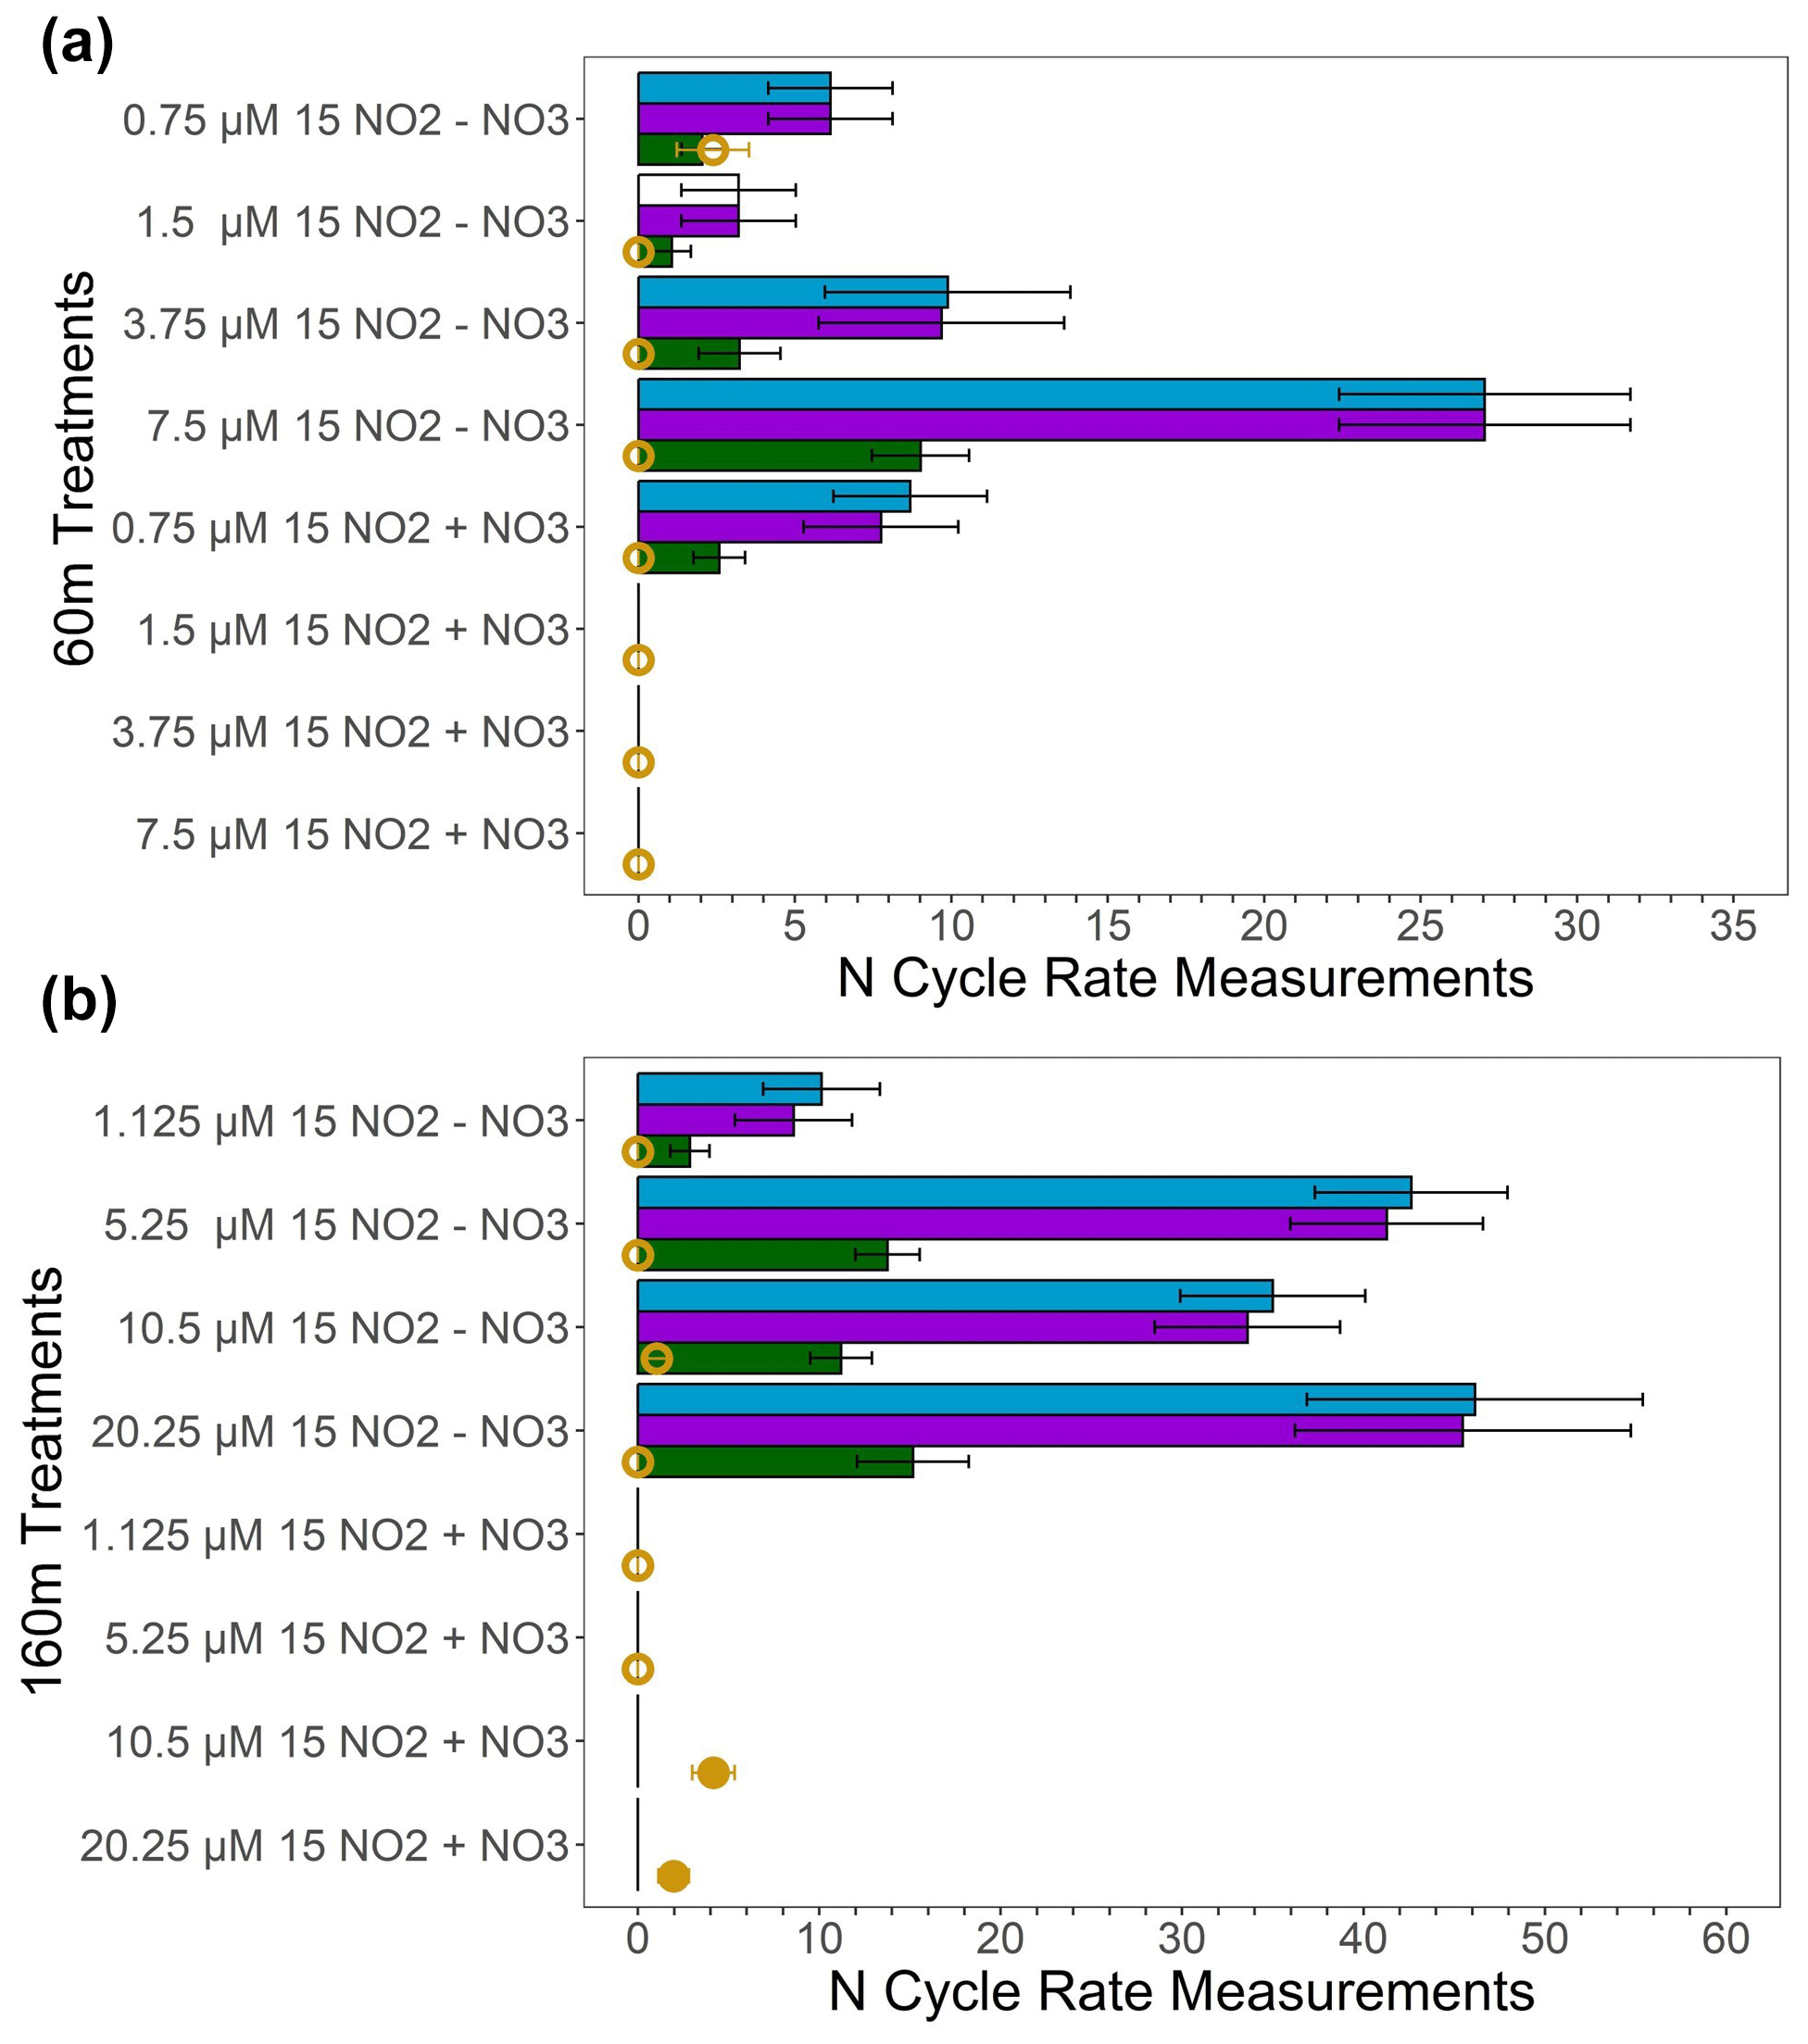
Figure 5 dismutation tests conducted in deoxygenated waters from 60 m (a) and 160 m (b) at station PS3 during the SR1805 cruise. Measured oxidation rates (nM N d−1) are displayed in blue; unexplained oxidation rates, the difference between the measured oxidation and the oxidation due to anammox (nM N d−1), are shown in purple; the predicted denitrification (nM 30N2 d−1) if all of the unexplained oxidation was due to dismutation is shown in green; and the measured denitrification rate (nM 30N2 d−1) is shown in yellow, with filled circles indicating significant rates and open circles indicating rates that are not significantly different from zero. All bars filled with colors indicate significant rates (i.e., the white bar for the 60 m 1.5 µM , 0 µM treatment oxidation rate denotes an insignificant rate). Error bars are the standard error of the regression for oxidation or are calculated based on the rules of error propagation from the standard error of the regressions for the oxidation and anammox rates. (+) treatments received 20 µM additions while the (−) treatments received no addition. Anammox rates used to calculate the unexplained oxidation rate are shown in the Supplement.
3.3 dismutation
In order to investigate the mechanism for the observed anaerobic oxidation, experiments were conducted to search for evidence of dismutation. If dismutation is the dominant explanation for the observed anaerobic oxidation, we hypothesized that (1) adding should suppress both 30N2 and production by Le Châtelier's principle; (2) increasing the concentration should increase both denitrification (the 30N2 production rate) and oxidation, especially when no additional is added; and (3) the ratio between the “unexplained oxidation”, i.e., the difference between the observed oxidation and the oxidation due to anammox, and the observed denitrification (30N2 production) rate should be close to 3:1. In experiments with He-purged water from two deoxygenated depths (60 and 160 m at station PS3; see Table S5 for O2 values) during the SR1805 cruise, we observed that adding 20 µM of suppressed oxidation across nearly all pairs of 0 and 20 µM experiments where the concentration was identical (Fig. 5). However, we did not observe a simultaneous suppression of N2 production due to the fact that the measured denitrification rate was low and insignificantly different from zero in most of our 16 treatments (Fig. 5). The lack of an observed response in N2 production could be due to already elevated ambient concentrations, 26 and 22.2 µM at 60 and 160 m, respectively. Roughly doubling the amount of would have little effect on the denitrification rate if the relevant enzymes were already saturated, as is plausible at those concentrations. As a result of our inability to observe denitrification, our first hypothesis yielded little evidence of dismutation.
Across all four 60 m, 0 µM added treatments (Fig. 5a), adding did increase oxidation; however, we did not observe an increase in denitrification. Surprisingly, across the four 60 m, 20 µM added treatments, adding decreased oxidation – the reverse of our hypothesis (Fig. 5). Across all four 160 m, 0 µM added treatments, we also observed an increase in oxidation at higher concentrations but did not observe an increase in the measured denitrification rate (Fig. 5b). In the four 160 m, 20 µM added treatments, oxidation and denitrification did not increase with concentration (Fig. 5b). Due to the consistently low and insignificant denitrification rates, our test of the addition hypothesis also yielded little evidence for dismutation.
We were also unable to observe evidence for the ratio hypothesis due to the paucity of significant denitrification (30N2 production) rates (Fig. 5). As denitrification rates were consistently low or insignificantly different from zero, the ratio of oxidation to denitrification deviated from the 3:1 ratio expected if dismutation accounted for most of the observed oxidation. The only slight exception to this is the 60 m treatment with 0.75 µM and 0 µM added – the treatment closest to in situ conditions. In this treatment, the measured denitrification rate, while insignificantly different from zero on the basis of the p value of the regression, agrees with the predicted denitrification rate based on the 3:1 stoichiometry of dismutation. While our dismutation experiments as a whole suggest that dismutation is not a likely explanation for observed anaerobic oxidation, results from the 60 m, 0.75 µM , 0 µM treatment provide slight justification to continue tests of this hypothesis.
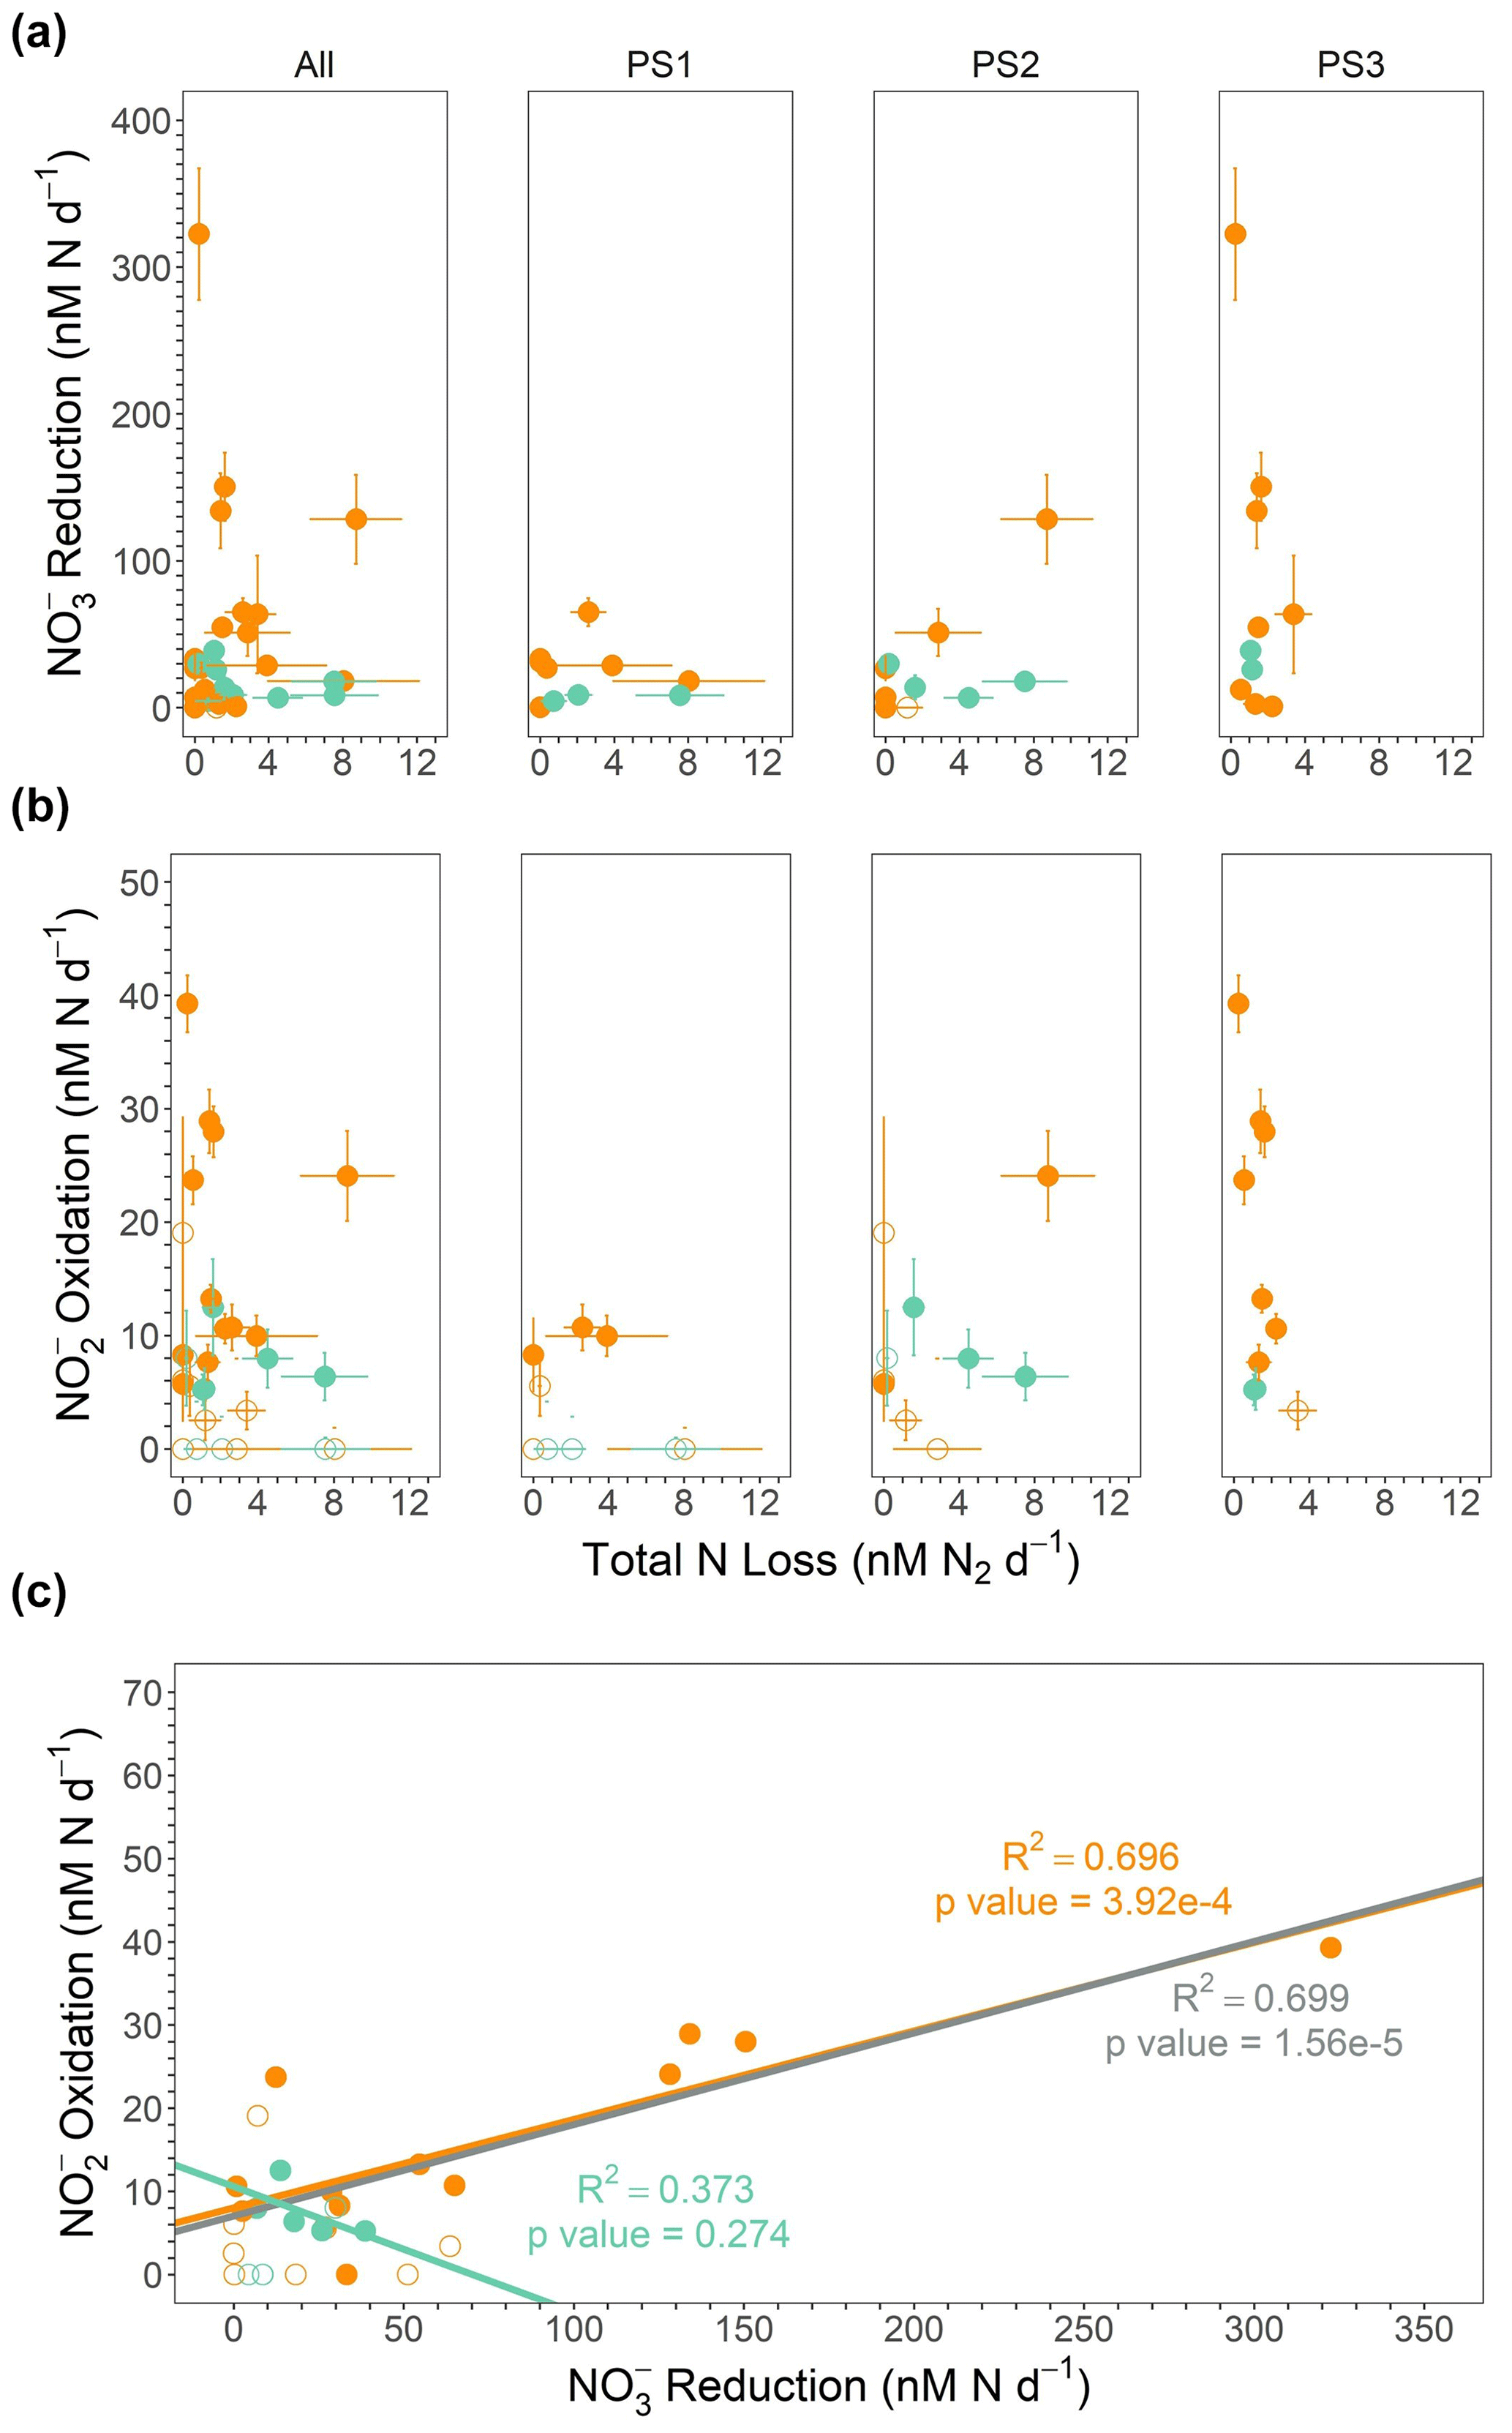
Figure 6(a) reduction (nM N d−1) vs. total N loss (the sum of denitrification and anammox in nanomoles of N2 per liter per day) from the SR1805 cruise. (b) oxidation (nM N d−1) vs. total N loss from the SR1805 cruise. (c) oxidation vs. reduction. Regression lines and statistics are shown for the significant rates from shallow boundary waters only (orange), ODZ core waters only (teal), and all significant data (gray). All points from shallow boundary waters are colored orange, and all points from the ODZ core or below are colored teal. Open circles indicate points where (a) the reduction rate, (b) the oxidation rate, or (c) either the reduction or oxidation rate is not significantly different from zero, whereas filled circles indicate rates significantly different from zero.
4.1 Rapid – cycle
Depth profiles of N transformation rates obtained on the SR1805 cruise show that the rates of oxidation and reduction are far greater than rates of the N loss processes of anammox and denitrification, especially in shallow boundary (see Table 1 for definition) waters (Figs. 2, 6a–b). In fact, when the combined N recycling pathways of oxidation and reduction are compared with the total N loss, the N recycling pathways are 3.2–192.8 times larger than the total N loss. That the minimum ratio is ∼ 3 strongly emphasizes the preponderance of oxidation and reduction above N loss processes. As expected due to the oligotrophic nature of the offshore ETNP (Fuchsman et al., 2019) and as previously found in an ETSP N cycling study (Kalvelage et al., 2013), oxidation and reduction generally increased from the offshore station (PS1) towards the coast. We observed reduction rates of a similar magnitude to previously reported ETSP studies (Kalvelage et al., 2013; Babbin et al., 2017), a finding that generalizes the predominance of reduction to in the ETNP. Thus, our work supports several recent studies (Babbin et al., 2020, 2017; Peters et al., 2016) which have suggested that most nitrogen within OMZ regions is continuously recycled between and by rapid oxidation and reduction, especially in shallow boundary waters.
A previous publication (Babbin et al., 2017) predicted that reduction should follow a Martin curve (Martin et al., 1987) power law distribution across the water column due to its dependence on the OM flux from shallower waters. Such a distribution was observed at stations PS1 and PS3; however, reduction at station PS2 did not follow a classical Martin curve profile because the production peak is well below the oxycline. This exception could be due to zooplankton, which have been observed to migrate into the ODZ on a daily basis (Bianchi et al., 2014). Due to the fact that migrating zooplankton funnel surface OM to the mesopelagic zone (Cram et al., 2022), such a transfer would move OM in a pattern not consistent with the Martin curve. The transferred OM could then support the observed peak in reduction (Fig. 2).
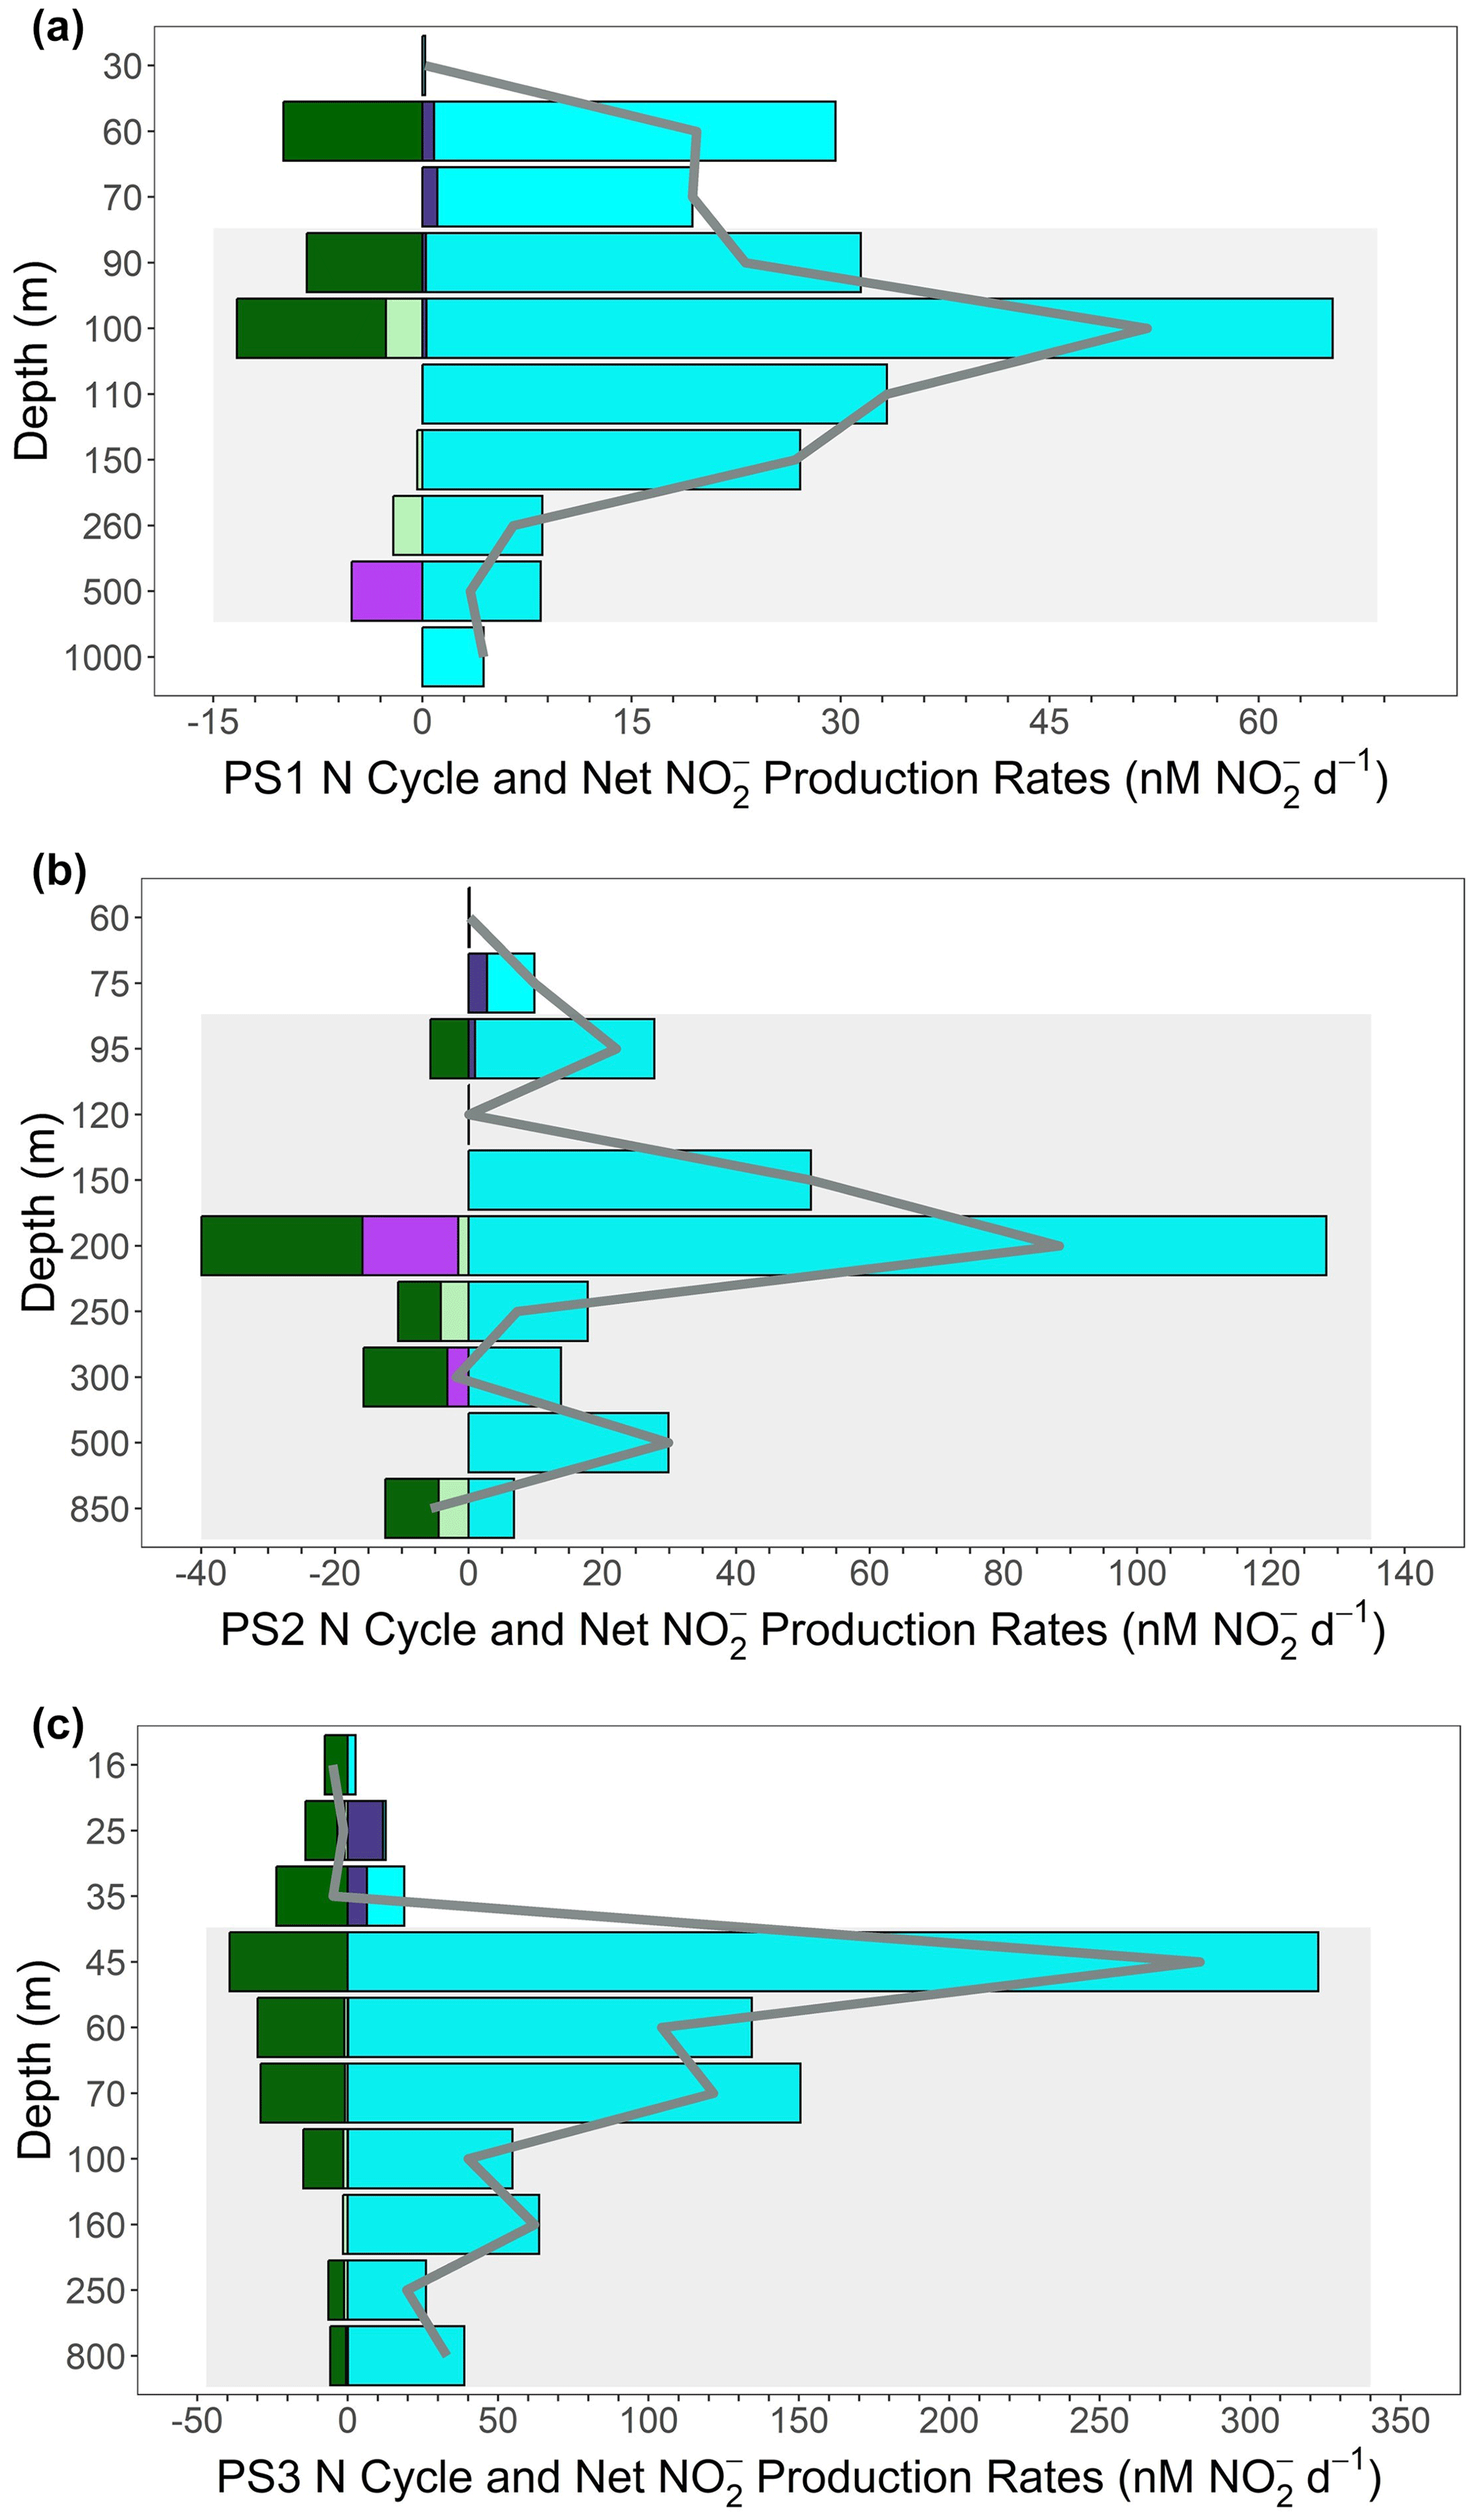
Figure 7 budget profiles from the SR1805 cruise. Plots are a combination of the production pathways of reduction (cyan); oxidation (dark purple); and the consumption pathways of anammox (light green), denitrification (bright purple), and oxidation (dark green). Consumption pathways are reported as negative numbers. All rates are reported in nanomoles of per day. The net production or consumption rate () is represented as a gray line for each depth. Gray boxes indicate the completely deoxygenated ODZ region at each station at the time of sampling for (a) PS1, (b) PS2, and (c) PS3.
These results are consistent with the idea, also supported by many recent studies (Kalvelage et al., 2013; Lam and Kuypers, 2011; Lam et al., 2009; Babbin et al., 2020, 2017; Füssel et al., 2011; Lam et al., 2011), that the accumulated in the SNM usually results from an imbalance between reduction and other N cycling pathways. We further investigated this hypothesis by constructing a net budget derived from the five microbial N cycling metabolisms measured on the SR1805 cruise (Fig. 7). Summing the depth profiles of consumption (anammox, denitrification, and oxidation) and production ( oxidation and reduction) pathways revealed that net depth-integrated production across the sampled OMZ water column depths is on the order of tens of millimoles of per square meter per day at all three stations (8.19 at PS1, 14.49 at PS2, and 28.97 at PS3). This excess is driven by reduction, which across all stations is of a much greater magnitude than all other measured N cycling processes (Figs. 2, 7).
These budget calculations take the reported rates at face value, ignoring the likelihood that some of them are potential rates. For example, anammox might have been enhanced by the addition of 3 µM . Denitrification is less likely to be stimulated by the addition of because it is generally limited by OM availability (Ward et al., 2008; Babbin et al., 2014). Thus, the relative importance of anammox and denitrification might be perturbed due to differential responses of the two rates to tracer additions. Analogously, oxidation was likely stimulated by the addition of tracer (Sun et al., 2017) but reduction was less stimulated by the addition of tracer, as the latter is a heterotrophic process and, as a component of the complete denitrification pathway, is likely limited by OM availability. These differential limitations by substrate probably mean that the calculated budget in Fig. 7 is not completely accurate, but the relative importance of the processes is robust. If anything, the dominance of anammox over denitrification is probably less than that observed, and the excess of reduction over oxidation is greater than observed. Overall, the dominance of the – loop over the N loss pathways and the overwhelming importance of reduction are both supported by these considerations.
Additional support that reduction supplies the accumulated in the SNM can be found by comparing the net production rates with the measured concentrations along the SR1805 cruise track from offshore station PS1 to coastal station PS3. As would be expected if the SNM depended on derived from reduction, the peak net production value across all depths at each station, the depth-integrated production values for each station, and the magnitude of the SNM peak concentrations all increase together from offshore station PS1 to coastal station PS3. Importantly, we did not consider water column mixing in both vertical and horizontal directions that would carry away produced or assimilation into OM, and we recommend follow-up studies that include parameterizations for these values in OMZ N cycling modeling.
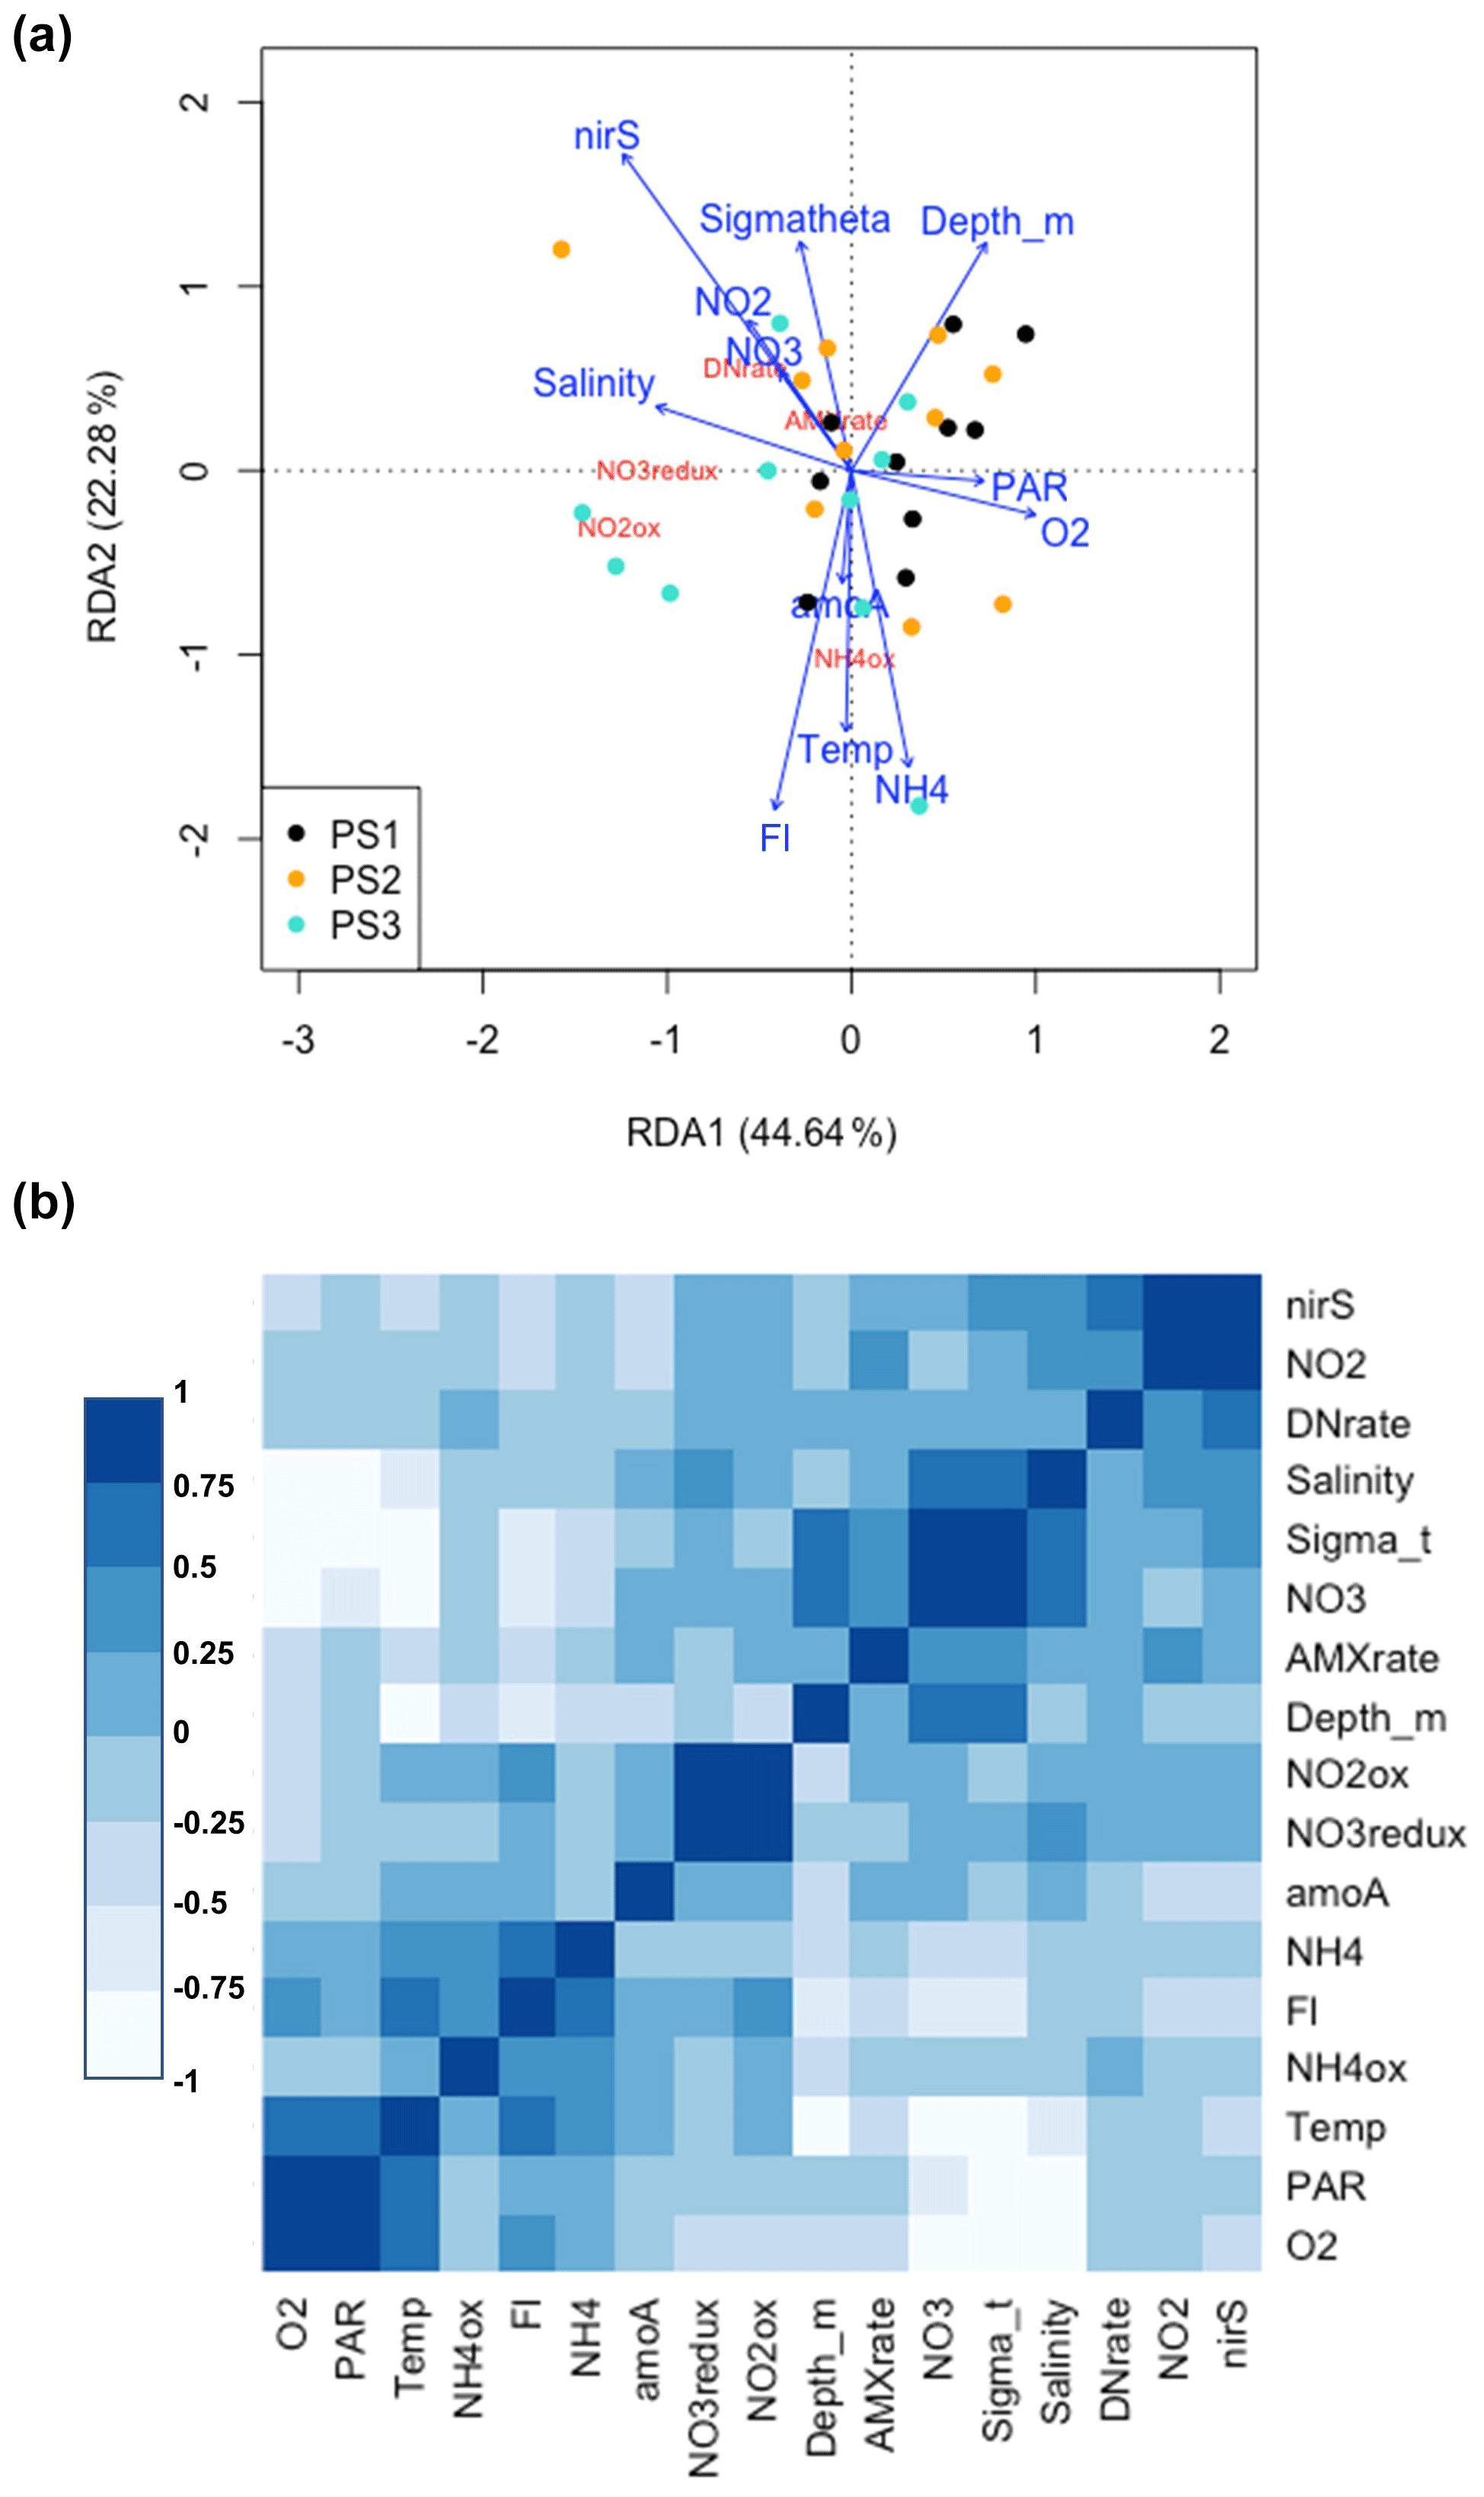
Figure 8(a) Redundancy analysis of all environmental variables and microbial rates measured on the SR1805 cruise. Points are color coded by station: black (PS1), yellow (PS2), and cyan (PS3). Variables names and arrows are color coded so that environmental variables are blue and rate measurements are red. (b) Correlation analysis for all environmental variables and microbial N cycling rates from the SR1805 cruise. More positive correlations are shaded to become bluer as significance grows, whereas negative correlations are shaded to become whiter as significance grows. The abbreviations used in the figure are as follows: O2 (oxygen concentration normalized across different sensors), PAR (photosynthetically active radiation normalized across sensors), NH4ox ( oxidation rate), Fl (chlorophyll fluorescence normalized across different sensors), NH4 ( concentration), amoA (amoA abundance), NO3redux ( reduction rate), NO2ox ( oxidation rate), AMXrate (anammox rate), NO3 ( concentration), DNrate (denitrification rate), NO2 ( concentration), and nirS (nirS abundance).
4.2 oxidation – distribution and magnitude in comparison to previous studies
The high rates of observed reduction provide sufficient to support oxidation both in the oxycline and in the ODZ, as previously proposed (Anderson et al., 1982), Our observations also further confirm isotopic studies that suggested high oxidation rates because rapid re-oxidation of back to was necessary to achieve isotopic mass balance (Buchwald et al., 2015; Casciotti et al., 2013; Granger and Wankel, 2016). Our results also align with previous experimental observations of high oxidation rates (Kalvelage et al., 2013; Babbin et al., 2020; Lipschultz et al., 1990). Support for a closely connected rapid cycle between the two processes can be seen in the strong correlation between oxidation and reduction observed in all SR1805 cruise samples, especially those from shallow boundary waters (Figs. 6c, 8). Similarly to some previous ETSP papers (Babbin et al., 2017, 2020; Frey et al., 2020) and two ETNP studies (Peng et al., 2015; Sun et al., 2017), we observed that rates of oxidation, like rates of reduction, peaked in the oxycline or in the ODZ top (Fig. 2) and then declined throughout the ODZ. Unlike some stations in these studies (Babbin et al., 2020, 2017), we did not observe a second peak in oxidation near the deep oxycline. In addition to observing a similar distribution, we also observed that oxidation occurs at a similar magnitude to some stations in previous ETSP (Babbin et al., 2020, 2017; Peng et al., 2016) and ETNP (Peng et al., 2015) studies, although our highest rates (25–40 nM N d−1) were much lower than the peaks measured at other stations in most of these reports (Babbin et al., 2020; Peng et al., 2015, 2016), which reached as high as ∼ 600 nM N d−1 (Peng et al., 2015; Lipschultz et al., 1990).
4.3 oxidation – can it occur anaerobically?
oxidation depth profiles (Figs. 2, 3) and O2 manipulation experiments (Fig. 4) provide further evidence that oxidation can occur even when O2 is as low as ∼ 1 nM. While our O2 manipulation experiments provide the most convincing evidence of anaerobic oxidation, several factors argue that the oxidation observed in our depth profile incubations may be O2 independent. These factors were first argued in a recent paper (Babbin et al., 2020):
-
The pre-incubation He purging step in our depth profile method removes more than 99 % of the N2 present in Exetainer vials (Babbin et al., 2020). If it is assumed that O2 is removed at identical efficiency, a reasonable proposition because O2 equilibrates faster than N2 (Wanninkhof, 1992), the introduction during sample processing of as much as 1 µM O2 would result in a ∼ 10 nM contamination. As a result, if NO2 oxidation is observed in samples from the deoxygenated ODZ core, contamination during sampling would be kept very small by our purging step. This conclusion was further validated by direct O2 measurements using LUMOS instruments in Exetainer vials. These tests of our purging method showed that O2 was reduced to less than 10 nM in 5 min (Sun et al., 2018).
-
Linear time courses across all time points were observed in some of our experiments, including many from deoxygenated depths at station PS3 (Figs. S7–S9 in the Supplement). If oxidation depended on O2, an initial acceleration (due to O2 contamination that sparked oxidation) or a later steep drop (due to the exhaustion of O2 by aerobic NOB) in oxidation would be expected, not a consistent linear slope.
-
Metagenomic evidence has revealed distinct NOB communities in oxic surface waters, the oxycline and ODZ top, and the ODZ core in OMZ regions (Sun et al., 2019). In addition, we observed decreasing oxidation rates with increasing in situ O2 in the SR1805 incubations as well as the TN278 and NBP1305 incubations (Fig. 3a). These observations are consistent with the hypothesis that aerobic NOB from oxic depths are ill-equipped to oxidize under deoxygenated conditions but that the unique MAGs recently identified in draft genomes from the ODZ top and core (Sun et al., 2019) are adapted to perform anaerobic oxidation.
-
Through plotting O2 concentrations against the ratio between reduction and oxidation at all SR1805 depths with significant, positive oxidation rates, we observed that the known anaerobic process of reduction and oxidation did not exhibit differential regulation by O2 as would be expected if oxidation was an obligately aerobic process (Fig. S5 in the Supplement).
Previous studies have shown that O2 additions to purged incubations of ODZ waters can inhibit oxidation (Sun et al., 2017, 2021) and that oxidation can occur in the absence of O2 consumption (Sun et al., 2021). However, another kinetics study has reported O2 stimulation of oxidation in OMZ waters (Bristow et al., 2016) and concluded that oxidation is fundamentally an aerobic process. This apparent contradiction might be explained by several details in the experimental process of that study (Bristow et al., 2016):
-
The study site is at the farthest edge of the ETSP OMZ in a location that is only anoxic in the austral summer.
-
The cruise was conducted as austral summer turned to fall (20–26 March), which is a period when O2 intrusions would be more likely.
-
O2 data from the study's cruise (Tiano et al., 2014) show that the depths from which oxidation O2 kinetics samples were sourced experienced O2 concentrations of 2 µM (50 m), 10 µM (40 m), and > 60 µM (30 m) either during sampling or a few days prior to sampling.
As a result, we argue that the observed stimulation of oxidation by O2 (Bristow et al., 2016) occurred not because all OMZ NOB are aerobic oxidizers but instead because the location, season, and levels of O2 of the sampled station selected for aerobic NOB in the source water for the purged incubations. Thus, as suggested by Sun et al. (2017, 2021), different NOB populations with different historical exposures to O2 and adaptations likely respond differently to O2 manipulations.
Here, we built on the above previous tests of anaerobic oxidation by conducting a series of incubations across an O2 gradient from ∼ 1 to 10 µM. Site waters for these incubations were drawn from the ODZ top at each SR1805 station (Table S4). We did not observe a clear inhibitory or stimulatory response of oxidation to O2 within the SR1805 or FK180624 stations; however, this lack of a clear response is in itself a revealing result – a lack of consistent stimulation by O2 implies that at least some anaerobic NOB were present. In addition, we consistently observed significant oxidation at all putative O2 concentrations, including 1 nM, which is a concentration usually considered functionally anoxic. As the O2 in the incubations was continuously supplied by a mass flow controller and subsequently checked via an extremely sensitive O2 sensor for all incubations, these results provide additional evidence that truly anaerobic oxidation can occur.
One argument against our characterization of the oxidation observed at ∼ 1 nM O2 as functionally anoxic is that the Michaelis–Menten half-saturation constant (Km) of oxidation has been calculated to be as low as 0.5 nM (Bristow et al., 2016). However, the data used to calculate this value have the same qualifications discussed previously: (1) the study site is at a location only anoxic during the austral summer, (2) the cruise was conducted during a time when O2 intrusions would be more likely, and (3) the sampled waters experienced O2 concentrations as high as 60 µM prior to sampling. Such conditions would favor aerobic NOB and the expression of high-affinity oxidation enzymes by these organisms when exposed to low-O2 conditions in incubations. As a result, we argue that the modeled Km value of 0.5 nM only applies when NOB with higher-O2 niches are placed in sub-micromolar O2 conditions. This value does not apply to NOB observed to prefer ODZ conditions (Sun et al., 2019), which we assume would be favored under our 1 nM treatment.
These O2 manipulation experiments also provided an opportunity to investigate the response of reduction to O2. The only clear intra-station pattern that emerged from these experiments was that reduction displayed possible inhibition by O2 at station PS3, as would be expected. Due to the small number of data points in our data set, we did not attempt a kinetics fitting for these data. Interestingly, the disparity observed in depth profile experiments between the magnitudes of the reduction and oxidation rates was not observed in the O2 manipulations across many O2 concentrations at stations PS1 and PS2. At station PS3, a large disparity in the magnitudes of these processes as well as the highest overall reduction rates were observed, as in the depth profile experiments (Figs. 4, 7). A few of the FK180624 data points also exhibited reduction rates that were elevated far above oxidation (Fig. S3). These results confirm the importance of reduction for the rapid recycling cycle as well as the source of for the SNM.
4.4 dismutation
In the absence of O2, oxidation would require another oxidant. Many candidate oxidants have been suggested. For example, iodate (), an abundant marine species with global average marine concentrations of ∼ 0.5 µM (Nozaki, 1997; Lam and Kuypers, 2011), has been proposed and shown to stimulate oxidation (Babbin et al., 2017). However, as is usually absent within the ODZ core (Moriyasu et al., 2020), its low concentration makes -mediated anaerobic oxidation in that location unlikely (Babbin et al., 2020). oxidation via Mn4+ or Fe3+ is thermodynamically feasible, although only at low pH (< 6) (Luther, 2010; Luther and Popp, 2002). This pH constraint, combined with the fact that concentrations of these ions are on the order of a few nanomolar in OMZs (Kondo and Moffett, 2015; Vedamati et al., 2015), makes these mechanisms unrealistic for the ODZ core. Another proposed mechanism is that the observed oxidation is due to anammox, which, if true, should result in an observed oxidation-to-anammox ratio of 0.16–0.3 (Kuenen, 2008; Strous et al., 1998; Oshiki et al., 2016). Instead, the observed ratio is sometimes more than 10 times this range, and oxidation is rarely observed to be less than anammox (Kalvelage et al., 2013; Babbin et al., 2020; Sun et al., 2021).
Another alternative hypothesis is based on the reversibility of the NXR enzyme. As this enzyme has been suggested to both oxidize and reduce (Kemeny et al., 2016; Koch et al., 2015; Wunderlich et al., 2013), reduction by NXR could, over time, enrich the 15N- pool because lighter would be favored (Casciotti, 2009). Even in tracer experiments, in which the pool is highly labeled, this reversibility at the enzyme site could lead to an apparent transfer of 15N from the to the pool if NXR-mediated reduction was occurring. This hypothesis is supported by observations of reduction under low-O2 conditions in cultures from the NOB genera Nitrobacter (Freitag et al., 1987; Bock et al., 1990), Nitrospira (Koch et al., 2015), and in pure cultures of Nitrococcus mobilis (Füssel et al., 2017). In addition, a recent study presented natural-abundance isotopic evidence in pure Nitrococcus mobilis cultures consistent with this mechanism (Buchwald and Wankel, 2022).
However, NXR reversibility has not been demonstrated for the abundant (Füssel et al., 2011; Mincer et al., 2007) and sometimes dominant (Beman et al., 2013) OMZ NOB genera Nitrospina. Furthermore, the sole source of the isotopic evidence for the enzyme reversibility hypothesis, Nitrococcus mobilis, has a cytoplasm-facing NXR substrate-binding domain (Buchwald and Wankel, 2022), a feature found to have an established evolutionary relationship with the known nitrate reductase enzyme (NAR) family in other Nitrobacter studies (Starkenburg et al., 2008; Kirstein and Bock, 1993). The NXR substrate-binding domains in Nitrospina are oriented towards the periplasm and are not evolutionarily related to enzymes for reduction (Buchwald and Wankel, 2022; Sun et al., 2019). Due to these structural and phylogenetic differences among NOB NXR, it is possible that the Nitrospina NXR may be unable to perform reduction as easily as other NOB genera. For all of these reasons, it is not yet clear if the enzyme reversibility hypothesis can explain all oxidation measured under low-O2 conditions, and other hypotheses should continue to be explored.
As a result of the above proposals' shortcomings, this paper focused on the remaining, most plausible hypothesis: dismutation. Our tests for dismutation rested on three hypotheses: (1) additions would inhibit both oxidation and 30N2 production by Le Châtelier's principle; (2) increasing should energetically favor dismutation, especially in treatments with no additional ; and (3) the ratio of non-anammox-mediated oxidation to denitrification (30N2 production) should be close to 3:1 if dismutation explains most of the observed oxidation. We observed repeated inhibition of oxidation by but no inhibition of 30N2 production due to the fact that denitrification was consistently low and insignificantly different from zero across all treatments. In treatments with 0 µM of added , increasing generally increased oxidation but not denitrification. In addition, the ratio of anammox-corrected oxidation to observed denitrification deviated from dismutation's 3:1 stoichiometry in almost all treatments. However, we did observe the simultaneous inhibition of N2 and production as well as good agreement between the anammox-corrected oxidation : denitrification ratio to the dismutation stoichiometry in one treatment – the treatment most similar to in situ conditions (60 m, 0.75 µM , and 0 µM ). As a result, while our results show little evidence for dismutation overall, we recommend additional experiments at tracer levels similar to 0.75 µM to further test for dismutation.
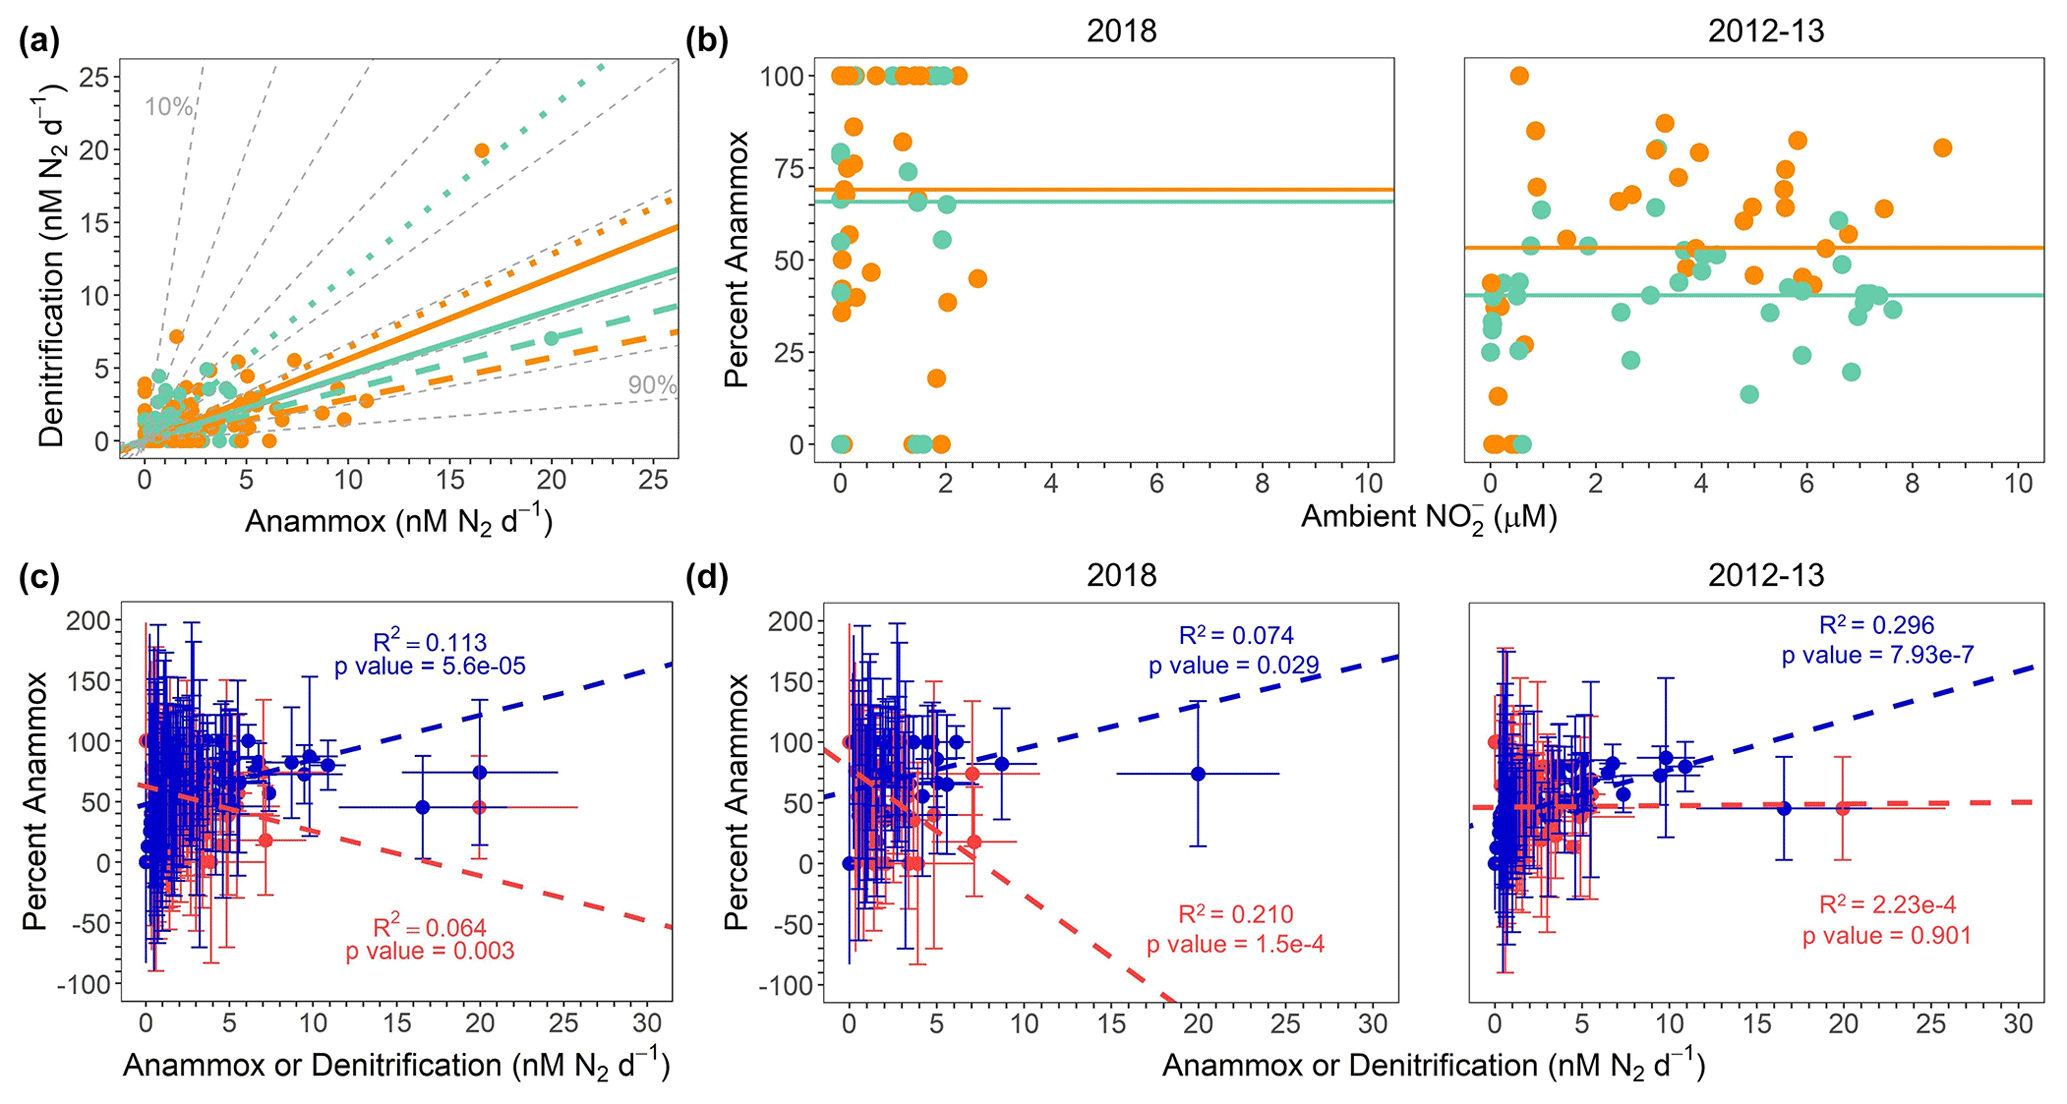
Figure 9(a) All 2012, 2013, and 2018 denitrification and anammox rates (nM N2 d−1), color coded by σθ. ODZ core samples and lines are teal (σθ > 26.4), whereas shallow boundary samples and lines are orange (σθ < 26.4). Solid, dashed, and dotted lines show regressions for all data, 2018 only, and 2012–2013 data only, respectively. Dashed gray lines depict contours for percentage anammox values. The reader is referred to Table S6 in the Supplement for regression statistics. (b) Percentage anammox vs. ambient for 2018 samples (left) and republished 2012 and 2013 samples (Babbin et al., 2020) (right). Points are colored according to the same scheme as panel (a). Lines show the average percentage anammox values in shallow boundary waters (orange) and the deoxygenated ODZ core (teal). (c) Percentage anammox vs. all anammox (blue) and all denitrification (red) rates (nM N2 d−1). Regression lines shown for the percentage AMX vs. anammox and denitrification rates follow the same color scheme as the data points. Error bars represent the standard error of the regression. (d) Percentage anammox vs. anammox (blue) and denitrification (red) rates (nM N2 d−1) for 2018 only (left) and 2012–2013 (right). Points and regression lines follow the same color scheme as in panel (c). Data shown in the 2012–2013 only panel are republished (Babbin et al., 2020).
4.5 Relative balance of anammox and denitrification
4.5.1 Are results consistent with past observations of slow, low, and steady anammox elevated above the predicted maximum of 29 % of total N loss?
According to predictions based on the composition of average marine OM (Dalsgaard et al., 2003, 2012), anammox should account for at most 29 % of the total N loss flux in OMZ regions. To test this hypothesis under a variety of conditions, regressions of denitrification vs. anammox rates were calculated for all samples from the SR1805, FK180624, TN278, and NBP1305 cruises. In order to compare our new data to a previous study (Babbin et al., 2020), which observed variations in the ratio of anammox and denitrification between samples from the ODZ top or above (σθ < 26.4, “shallow boundary waters”; Babbin et al., 2020) and samples from the deoxygenated ODZ core or below (σθ > 26.4, “ODZ core”; Babbin et al., 2020), regressions for all data (ODZ core), all data (shallow boundary), 2018 only (ODZ core), 2018 only (shallow boundary), 2012–2013 (TN278 and NBP1305) only (ODZ core), and 2012–2013 only (shallow boundary) were calculated (Table S6 in the Supplement). All regressions deviated from the predicted 29 % maximum anammox contour, although the regression from the 2012–2013 cruises' ODZ core samples was closest to the 30 % anammox contour (Fig. 9a). We observed large differences in the percentage anammox contours near the 2012–2013 and 2018 regressions. ODZ core samples from 2012–2013 regressed onto a line between the 40 % and 50 % anammox contours, whereas ODZ core samples from 2018 regressed onto a line between the 70 % and 80 % anammox contours. Differences in contouring were smaller for the shallow boundary samples, although the 2018 samples still regressed to a higher contour (just under 80 %) than the 2013–13 samples (60 %) (Fig. 9a). Our observations that all year- and density-based regressions fell within contours well above the theoretical prediction (Fig. 9a) and that anammox accounted for as much as 100 % of the total N loss at many depths in 2018 samples (Figs. 2, 9b) are consistent with the many previous studies that observed anammox as the predominant OMZ N loss pathway (Lam et al., 2009; Thamdrup et al., 2006; Kuypers et al., 2005; Hamersley et al., 2007; Jensen et al., 2011).
Our new 2018 results do not contradict the idea (Dalsgaard et al., 2012) that anammox is often measured to be the bulk of total N loss but that large, episodic occurrences of denitrification can dwarf the consistent, albeit low, anammox contribution to total N loss. Under this view, these eruptions in denitrification return the time-integrated balance of anammox and denitrification to its expected 29 % and 71 % values. In this scenario, our cruises' sampling, like many but not all others, did not coincide with episodic high rates of denitrification.
4.5.2 Do results support a connection between rapid reduction and elevated anammox?
Our 2018 results question the previously proposed view (Babbin et al., 2020) that rapid reduction produces that, in turn, elevates anammox in oxycline and upper-ODZ waters. While our data (Fig. 2) did find high rates of reduction in shallow boundary waters, the 2018 N loss data do not show elevated shallow boundary (as compared to ODZ core) percentage anammox values as would be expected if high reduction were fueling elevated anammox in the oxycline and ODZ top. This difference between our 2018 data and some previous data (Babbin et al., 2020) in support of a connection between rapid reduction and elevated anammox in the oxycline and ODZ top can be seen through a comparison of shallow boundary (σθ < 26.4; Babbin et al., 2020) and ODZ core (σθ > 26.4; Babbin et al., 2020) percentage anammox values in the 2018 SR1805 and FK180624 cruises against the 2012–2013 TN278 and NBP1305 cruises (Fig. 9b). The 2012–2013 samples showed a clear partitioning between the ODZ core and shallow boundary waters in terms of percentage anammox values. In 2012–2013, as would be expected if high oxycline and ODZ top reduction were supplying to anammox, shallow boundary samples have a higher average percentage anammox value than ODZ core samples (Fig. 9b). In 2018, this partitioning was not present – the difference between the average percentage anammox values in ODZ core and shallow boundary samples was much smaller (Fig. 9b). Interestingly, the total number of samples found to be 100 % anammox also sharply diverged between 2012–2013 and 2018. In the 2012–2013 samples, only one shallow boundary sample was found to be 100 % anammox. In 2018, many samples from both shallow boundary waters and the ODZ core were 100 % anammox (Figs. 9b, S6).
These observed differences in the partitioning of anammox and denitrification between shallow boundary waters and the ODZ core across different years and places do not support the view that from rapid reduction of the oxycline and ODZ top OM always elevates anammox rates. Instead, they suggest that other factors play an important role in setting the balance of anammox and denitrification. Interestingly, concentrations spanned a much narrower range in the two 2018 SR1805 and FK180624 cruises than the 2012–2013 TN278 and NBP1305 cruises (Fig. 9b) – a clue that the biogeochemical environment of the OMZ is subject to interannual variability. Observed differences in environmental variables like and percentage anammox partitioning between 2012, 2013, and 2018 suggest that the partitioning of total N loss must depend on additional, yet to be identified environmental or biological interactions.
4.5.3 Correlations of percentage anammox values to anammox and denitrification rates – comparison to previous literature
In order to re-examine the result (Babbin et al., 2020) that enhanced fractions of anammox are correlated to greater anammox rates and not lower denitrification (Fig. 9d right), we created percentage anammox vs. anammox and denitrification regressions with the 2018 SR1805 and FK180624 data. In 2018, unlike in 2012–2013 (Babbin et al., 2020), we observed significant relationships between percentage anammox values and both the anammox and denitrification rates (Fig. 9d left). Regressions for the 2012–2013 data showed that increases in percentage anammox values are correlated only to increases in anammox values, not to decreases in denitrification (Fig. 9d right) (Babbin et al., 2020). The 2018 regressions, on the other hand, indicate that increases in percentage anammox are correlated with both increasing anammox and decreasing denitrification rates. The influence of this difference in the 2018 samples can be seen in regressions of percentage anammox against anammox and denitrification from all three cruises, where a similar pattern to the 2018 data is observed (Fig. 9c). As above, this indicates a clear difference in the partitioning of anammox and denitrification between the 2018 SR1805 and FK180624 ETNP cruises and the 2012–2013 TN278 and NBP1305 cruises to the ETNP and ETSP. Despite the significance of the relationships, the low R2 values indicate that these relationships do not explain most of the variation in the anammox-to-denitrification ratio. As above, the causal mechanisms behind this variability remains to be elucidated.
4.5.4 Caveats about measurements of anammox and denitrification rates
One bias of our sampling scheme for N loss rates is that we do not capture particle-adhering denitrifiers. Most denitrifiers that encode the last two steps of denitrification are found on large particles (Ganesh et al., 2013, 2015; Fuchsman et al., 2017). As a result, measurements of complete denitrification from to 30N2 that do not capture large-particle communities will underestimate the rate. Unfortunately, due to the hydrodynamics of the CTD rosette it is unlikely that large particles will be trapped inside the Niskin bottle. In addition, the nipple of each Niskin is above the bottom of the bottle. As a result, the large particles that are successfully sampled by the CTD sink to the bottom of the Niskin and are not transferred into the experiment (Suter et al., 2017).
Another important caveat to some of the above conclusions in Sect. 4.5 is that the detection limits for anammox and denitrification rates are not identical. For a variety of reasons, it is easier to detect anammox. For example, anammox from a tracer is more easily detected due to low background across most of the OMZ. Anammox from the tracer is more detectible due to its reliance on incorporation of only a single 15N atom into the 29N2 product. Denitrification, on the other hand, is more difficult to detect because of higher background concentrations and because definitive denitrification requires the rarer combination of two molecules (Babbin et al., 2017).
We suspect that our sampling bias against particle-based denitrification and denitrification's higher detection limit may have played a role in our observations of denitrification rates during the 2012, 2013, and 2018 cruises where, for example, significant denitrification rates were only detected at 4 of the 30 depths sampled during SR1805 (Table S3). As a result, while the comparisons made above are helpful to examine differences in N biogeochemistry across years and stations, the true biogeochemical role of denitrification is likely greater than our tracer experiments suggest.
An additional important consideration is the possibility that anammox was stimulated by our tracer additions, which substantially enriched the and especially the concentrations above their in situ values (see Table S7 in the Supplement for enrichment factors for these two nutrients' concentrations). As mentioned above, the differential control of anammox and denitrification by substrate concentration may affect the observed ratio of the two rates in tracer incubations. Tracer additions above ambient nutrient levels are necessary to detect a mass spectrometric signal but often can result in rates above true in situ levels. Data on the kinetic responses of anammox and denitrification are scarce; this is yet another area where further research would be very useful.
4.6 Possibility of N loss via AOA and other N cycling processes
A recent paper (Kraft et al., 2022) reported that dense cultures of the AOA Nitrosopumilus maritimus can support the O2-dependent process of oxidation in deoxygenated waters via NO disproportionation to O2 and N2. This mechanism would be a third N loss process that, if occurring in OMZs, would be measured as anammox or denitrification. In order to investigate the possible significance of this N loss pathway in ODZ waters, we calculated the maximum possible N loss from oxidation – the N loss that would result if all of the 15N- produced in our oxidation experiments was converted into N2 via the proposed NO disproportionation reaction. These maximum -oxidation-derived N loss rates were a small fraction of the total N loss rates at most depths (Table S5). As a result, even these unrealistically high estimates of N2 production from AOA do not suggest that AOA are significant agents for fixed N loss. The depths where this was not the case are all either oxic or upper-oxycline depths, where oxidation rates peak and do not require NO disproportionation to supply O2, or depths where equally low oxidation, anammox, and denitrification rates would allow a higher percentage of the total N loss to be due to oxidation. As a result, our calculation argues that N loss derived from oxidation is not a significant N loss flux in ODZs. Thus, we argue that our conclusions regarding the relative balance of anammox and denitrification, as well as the relationship of these two N loss processes to other parts of the N cycle, do not need to be revised to account for N loss via NO disproportionation by AOA.
We note that an additional N recycling pathway, dissimilatory nitrate/nitrite reduction to ammonium (DNRA) can occur under low-O2 conditions similar to those preferred by anammox and denitrification. While some OMZ studies have found rates and nrfA abundances comparable to anammox, denitrification, and oxidation rates and marker gene abundances (Lam et al., 2009; Jensen et al., 2011), DNRA is best described as an extremely variable process. Other past OMZ studies have often found negligible rates (De Brabandere et al., 2014; Kalvelage et al., 2013; Füssel et al., 2011) and little genetic evidence for DNRA (Kalvelage et al., 2013; Fuchsman et al., 2017). Due to this variability, we chose to focus this study on what are arguably the most consistently relevant rates for OMZ N biogeochemistry.
Nitrogen is an essential component of life; as a result, its availability can function as a cap on biological productivity in many marine ecosystems. As all of the ocean is linked through an intricate web of currents that span the globe, the N biogeochemistry of small regions can affect the biogeochemistry of the rest of the ocean. Although OMZs account for just 0.1 %–1 % of the ocean's total volume (Lam and Kuypers, 2011; Codispoti and Richards, 1976; Naqvi, 1987; Bange et al., 2000; Codispoti et al., 2005), they account for 30 %–50 % of all total marine N loss (DeVries et al., 2013). As a result, developing an understanding of N cycling within OMZs is critical for comprehending the total marine N budget. Here, we presented measurements from the ETNP OMZ of five microbial N cycling metabolisms, all of which have as a product, reactant, or intermediate. Understanding the magnitudes of these rates is key to determining the OMZ inventory of N species as well as an important piece of understanding the marine N budget.
Our results add to the growing evidence that the N recycling process of reduction is the largest OMZ N flux, followed by the recycling process of oxidation back to . These two processes peaked in the oxycline or ODZ top and were usually much greater than the two N loss processes of anammox and denitrification – a departure from the established view that understanding N loss processes alone is the key to understanding OMZ biogeochemistry. We also add further evidence to the body of literature that supports the occurrence of anaerobic oxidation in OMZ regions, most strikingly through a series of O2 manipulation experiments that show oxidation at putative O2 concentrations as low as 1 nM. We conducted experiments on waters from two deoxygenated depths to evaluate if dismutation provides the oxidative power for observed anaerobic oxidation and found no evidence of dismutation except in one treatment – the closest to in situ conditions. Further exploration of the dismutation hypothesis might, therefore, usefully focus on conditions near in situ concentrations. Across our experiments, the percentage of N loss due to anammox was consistently above the theoretical prediction of at most 29 % anammox. Our observations that reduction and oxidation greatly surpass N loss, especially in shallow boundary waters, further reinforce the view that in the SNM is sourced from reduction.
Together, these observations provide additional data that support several new views of OMZ biogeochemistry. We hope that our work inspires additional isotopic experiments, culturing efforts, or genomic studies, especially those that seek to further test the occurrence of oxidation under functionally anoxic conditions and to examine alternative oxidants for this process. In addition, we emphasize the importance of integrating our experimental results into future OMZ N and C biogeochemical models, especially our results showing the predominance of reduction and oxidation over N loss. The development of an accurate model of OMZ N cycling is essential towards forecasting future changes in marine productivity and ecology as OMZs respond to climate change and other anthropogenic environmental changes.
All data discussed in this publication are archived at https://doi.org/10.5281/zenodo.7920778.
The supplement related to this article is available online at: https://doi.org/10.5194/bg-20-2499-2023-supplement.
XS, CF, and BBW designed the reduction and oxidation rate experiments, and CF performed shipboard manipulations, measured the profiles via mass spectrometry, and calculated the rates from IRMS raw data. BBW and JCT designed the anammox and denitrification depth profile experiments, BBW and JCT performed them, and JCT measured and calculated the profiles. BBW and XS designed the oxidation depth profile experiments; JCT, BBW, and XS performed them; XS and KD measured the profiles; and KD, EW, and JCT calculated them. TT and ARB designed the anammox and denitrification profile experiments for the FK180624 cruise, TT performed them, DEM and JCT measured the profiles, and EW and JCT calculated them. TT and ARB designed the oxidation O2 variation experiments, and TT performed, measured, and calculated the oxidation rates. ARB and TT designed the dismutation experiments; TT performed them; EW, XS, and JCT measured the dismutation samples; and EW and JCT calculated the rates. SO provided critical help with running the mass spectrometer to measure all samples except the oxygen variation experiments. BBW performed the correlation and redundancy analyses. JCT drafted the paper with input from all authors.
The contact author has declared that none of the authors has any competing interests.
Publisher's note: Copernicus Publications remains neutral with regard to jurisdictional claims in published maps and institutional affiliations.
We would like to acknowledge the crew and scientists of the R/V Sally Ride and the R/V Falkor for logistical and scientific support during our 2018 cruises. We thank Amal Jayakumar for providing amoA and nirS gene abundances for the RDA and PCA analyses. We thank Emilio Robledo-Garcia for assistance using the LUMOS instrument for the oxidation O2 gradient experiments. We thank Matthias Spieler for supporting reduction rate measurements in Basel. We thank Patrick Boduch for his aid in reviewing graphics before submission. We also acknowledge the Schmidt Ocean Institute for providing R/V Falkor ship time to Andrew R. Babbin. We thank the Simons Foundation and National Science Foundation for supporting Andrew R. Babbin, Tyler Tamasi, and Donald E. Martocello III, via the Simons Foundation grant no. 622065 and NSF grant nos. OCE-2138890 and OCE-2142998, as well as Bess B. Ward, Claudia Frey, John C. Tracey, and Xin Sun, via NSF grant no. OCE-1657663.
This research has been supported by the Schmidt Ocean Institute (grant no. Solving Microbial Mysteries with Autonomous Technology), the Simons Foundation (grant no. 622065), and the NSF Directorate for Geosciences (grant nos. OCE-2138890, OCE-2142998, and OCE-1657663).
This paper was edited by Carolin Löscher and reviewed by Clara A Fuchsman and one anonymous referee.
Anderson, J. J., Okubo, A., Robbins, A. S., and Richards, F. A.: A model for nitrate distributions in oceanic oxygen minimum zones, Deep-Sea Res. Pt. I, 29, 1113–1140, https://doi.org/10.1016/0198-0149(82)90031-0, 1982.
ASTM international: Standard Guide for Spiking into Aqueous Samples, West Conshohocken, PA, https://compass.astm.org/document/?contentCode=ASTM7CD5810-96R067Cen-US&proxycl=https3A2F2Fsecure.astm.org&fromLogin=true (last access: 9 March 2018.), 2006.
Babbin, A. R., Keil, R. G., Devol, A. H., and Ward, B. B.: Organic matter stoichiometry, flux, and oxygen control nitrogen loss in the ocean, Science, 344, 406–408, https://doi.org/10.1126/science.1248364, 2014.
Babbin, A. R., Peters, B. D., Mordy, C. W., Widner, B., Casciotti, K. L., and Ward, B. B.: Multiple metabolisms constrain the anaerobic nitrite budget in the Eastern Tropical South Pacific, Global Biogeochem. Cy., 31, 258–271, https://doi.org/10.1002/2016GB005407, 2017.
Babbin, A. R., Buchwald, C., Morel, F. M. M., Wankel, S. D., and Ward, B. B.: Nitrite oxidation exceeds reduction and fixed nitrogen loss in anoxic Pacific waters, Mar. Chem., 224, 103814, https://doi.org/10.1016/J.MARCHEM.2020.103814, 2020.
Bange, H. W., Rixen, T., Johansen, A. M., Siefert, R. L., Ramesh, R., Ittekkot, V., Hoffmann, M. R., and Andreae, M. O.: A revised nitrogen budget of the Arabian Sea, Global Biogeochem. Cy., 14, 1283–1297, https://doi.org/10.1029/1999GB001228, 2000.
Beman, J. M., Leilei Shih, J., and Popp, B. N.: Nitrite oxidation in the upper water column and oxygen minimum zone of the eastern tropical North Pacific Ocean, ISME J., 7, 2192–2205, https://doi.org/10.1038/ismej.2013.96, 2013.
Berg, J. S., Ahmerkamp, S., Pjevac, P., Hausmann, B., Milucka, J., and Kuypers, M. M. M.: How low can they go? Aerobic respiration by microorganisms under apparent anoxia, FEMS Microbiol. Rev., 46, 1–14, https://doi.org/10.1093/FEMSRE/FUAC006, 2022.
Bianchi, D., Babbin, A. R., and Galbraith, E. D.: Enhancement of anammox by the excretion of diel vertical migrators, P. Natl. Acad. Sci. USA, 111, 15653–15658, https://doi.org/10.1073/PNAS.1410790111, 2014.
Bock, E., Koops, H. P., Möller, U. C., and Rudert, M.: A new facultatively nitrite oxidizing bacterium, Nitrobacter vulgaris sp. nov., Arch. Microbiol., 153, 105–110, https://doi.org/10.1007/BF00247805, 1990.
Braman, R. S. and Hendrix, S. A.: Nanogram Nitrite and Nitrate Determination in Environmental and Biological Materials by Vanadium(III) Reduction with Chemiluminescence Detection, Anal. Chem., 61, 2715–2718, 1989.
Brandhorst, W.: Nitrification and Denitrification in the Eastern Tropical North Pacific, ICES J. Mar. Sci., 25, 3–20, 1959.
Bristow, L. A., Dalsgaard, T., Tiano, L., Mills, D. B., Bertagnolli, A. D., Wright, J. J., Hallam, S. J., Ulloa, O., Canfield, D. E., Revsbech, N. P., and Thamdrup, B.: Ammonium and nitrite oxidation at nanomolar oxygen concentrations in oxygen minimum zone waters, P. Natl. Acad. Sci. USA, 113, 10601–10606, https://doi.org/10.1073/PNAS.1600359113, 2016.
Bristow, L. A., Callbeck, C. M., Larsen, M., Altabet, M. A., Dekaezemacker, J., Forth, M., Gauns, M., Glud, R. N., Kuypers, M. M. M., Lavik, G., Milucka, J., Naqvi, S. W. A., Pratihary, A., Revsbech, N. P., Thamdrup, B., Treusch, A. H., and Canfield, D. E.: N2 production rates limited by nitrite availability in the Bay of Bengal oxygen minimum zone, Nat. Geosci., 10, 24–29, https://doi.org/10.1038/ngeo2847, 2017.
Buchwald, C. and Wankel, S. D.: Enzyme-catalyzed isotope equilibriu.: A hypothesis to explain apparent N cycling phenomena in low oxygen environments, Mar. Chem., 244, 104140, https://doi.org/10.1016/J.MARCHEM.2022.104140, 2022.
Buchwald, C., Santoro, A. E., Stanley, R. H. R., and Casciotti, K. L.: Nitrogen cycling in the secondary nitrite maximum of the eastern tropical North Pacific off Costa Rica, Global Biogeochem. Cy., 29, 2061–2081, https://doi.org/10.1002/2015GB005187, 2015.
Bulow, S. E., Rich, J. J., Naik, H. S., Pratihary, A. K., and Ward, B. B.: Denitrification exceeds anammox as a nitrogen loss pathway in the Arabian Sea oxygen minimum zone, Deep-Sea Res. Pt. I, 57, 384–393, https://doi.org/10.1016/J.DSR.2009.10.014, 2010.
Busecke, J. J. M., Resplandy, L., Ditkovsky, S. J., and John, J. G.: Diverging Fates of the Pacific Ocean Oxygen Minimum Zone and Its Core in a Warming World, AGU Adv., 3, e2021AV000470, https://doi.org/10.1029/2021AV000470, 2022.
Casciotti, K. L.: Inverse kinetic isotope fractionation during bacterial nitrite oxidation, Geochim. Cosmochim. Ac., 73, 2061–2076, https://doi.org/10.1016/J.GCA.2008.12.022, 2009.
Casciotti, K. L., Buchwald, C., and McIlvin, M.: Implications of nitrate and nitrite isotopic measurements for the mechanisms of nitrogen cycling in the Peru oxygen deficient zone, Deep-Sea Res. Pt. I, 80, 78–93, https://doi.org/10.1016/J.DSR.2013.05.017, 2013.
Codispoti, L. A. and Packard, T. T.: Denitrification rates in the eastern tropical South Pacific, J. Mar. Res., 38, 453–477, 1980.
Codispoti, L. A. and Richards, F. A.: An analysis of the horizontal regime of denitrification in the eastern tropical North Pacific, Limnol. Oceanogr., 21, 379–388, https://doi.org/10.4319/LO.1976.21.3.0379, 1976.
Codispoti, L. A., Brandes, J. A., Christensen, J. P., Devol, A. H., Naqvi, S. W. A., Paerl, H. W., and Yoshinari, T.: The oceanic fixed nitrogen and nitrous oxide budget.: Moving targets as we enter the anthropocene?, Sci. Mar., 65, 85–105, https://doi.org/10.3989/SCIMAR.2001.65S285, 2001.
Codispoti, L. A., Yoshinari, T., and Devol, A. H.: Suboxic respiration in the oceanic water column, i.: Respiration in Aquatic Ecosystems, edited b.: del Giorgio, P. A. and Williams, P. J. L., Oxford University Press, Oxford, UK ISBN 0 19 852709 8, 225–247, 2005.
Cram, J. A., Fuchsman, C. A., Duffy, M. E., Pretty, J. L., Lekanoff, R. M., Neibauer, J. A., Leung, S. W., Huebert, K. B., Weber, T. S., Bianchi, D., Evans, N., Devol, A. H., Keil, R. G., and McDonnell, A. M. P.: Slow Particle Remineralization, Rather Than Suppressed Disaggregation, Drives Efficient Flux Transfer Through the Eastern Tropical North Pacific Oxygen Deficient Zone, Global Biogeochem. Cy., 36, e2021GB007080, https://doi.org/10.1029/2021GB007080, 2022.
Dalsgaard, T., Canfield, D. E., Peterson, J., Thamdrup, B., and Acuna-Gonzales, J.: N production by anamox in the anoxic water column of Golfo Dulce, Costa Rica, Nature, 422, 606–608, https://doi.org/10.1038/nature01526, 2003.
Dalsgaard, T., Thamdrup, B., Farías, L., and Revsbech, N. P.: Anammox and denitrification in the oxygen minimum zone of the eastern South Pacific, Limnol. Oceanogr., 57, 1331–1346, https://doi.org/10.4319/lo.2012.57.5.1331, 2012.
De Brabandere, L., Canfield, D. E., Dalsgaard, T., Friederich, G. E., Revsbech, N. P., Ulloa, O., and Thamdrup, B.: Vertical partitioning of nitrogen-loss processes across the oxic-anoxic interface of an oceanic oxygen minimum zone, Environ. Microbiol., 16, 3041–3054, https://doi.org/10.1111/1462-2920.12255, 2014.
DeVries, T., Deutsch, C., Rafter, P. A., and Primeau, F.: Marine denitrification rates determined from a global 3-D inverse model, Biogeosciences, 10, 2481–2496, https://doi.org/10.5194/bg-10-2481-2013, 2013.
Freitag, A., Rudert, M., and Bock, E.: Growth of Nitrobacter by dissimilatoric nitrate reduction, FEMS Microbiol. Lett., 48, 105–109, https://doi.org/10.1111/J.1574-6968.1987.TB02524.X, 1987.
Frey, C., Bange, H. W., Achterberg, E. P., Jayakumar, A., Löscher, C. R., Arévalo-Martínez, D. L., León-Palmero, E., Sun, M., Sun, X., Xie, R. C., Oleynik, S., and Ward, B. B.: Regulation of nitrous oxide production in low-oxygen waters off the coast of Peru, Biogeosciences, 17, 2263–2287, https://doi.org/10.5194/bg-17-2263-2020, 2020.
Frey, C., Sun, X., Szemberski, L., Casciotti, K. L., Garcia-Robledo, E., Jayakumar, A., Kelly, C. L., Lehmann, M. F., and Ward, B. B.: Kinetics of nitrous oxide production from ammonia oxidation in the Eastern Tropical North Pacific, Limnol. Oceanogr., 68, 424–438, https://doi.org/10.1002/lno.12283, 2022.
Fuchsman, C. A., Devol, A. H., Saunders, J. K., McKay, C., and Rocap, G.: Niche partitioning of the N cycling microbial community of an offshore oxygen deficient zone, Front. Microbiol., 8, 2384, https://doi.org/10.3389/fmicb.2017.02384, 2017.
Fuchsman, C. A., Palevsky, H. I., Widner, B., Duffy, M., Carlson, M. C. G., Neibauer, J. A., Mulholland, M. R., Keil, R. G., Devol, A. H., and Rocap, G.: Cyanobacteria and cyanophage contributions to carbon and nitrogen cycling in an oligotrophic oxygen-deficient zone, ISME J., 13, 2714–2726, https://doi.org/10.1038/s41396-019-0452-6, 2019.
Füssel, J., Lam, P., Lavik, G., Jensen, M. M., Holtappels, M., Günter, M., and Kuypers, M. M. M.: Nitrite oxidation in the Namibian oxygen minimum zone, ISME J., 6, 1200–1209, https://doi.org/10.1038/ismej.2011.178, 2011.
Füssel, J., Lücker, S., Yilmaz, P., Nowka, B., van Kessel, M. A. H. J., Bourceau, P., Hach, P. F., Littmann, S., Berg, J., Spieck, E., Daims, H., Kuypers, M. M. M., and Lam, P.: Adaptability as the key to success for the ubiquitous marine nitrite oxidizer Nitrococcus, Sci. Adv., 3, https://doi.org/10.1126/sciadv.1700807, 2017.
Ganesh, S., Parris, D. J., Delong, E. F., and Stewart, F. J.: Metagenomic analysis of size-fractionated picoplankton in a marine oxygen minimum zone, ISME J., 8, 187–211, https://doi.org/10.1038/ismej.2013.144, 2013.
Ganesh, S., Bristow, L. A., Larsen, M., Sarode, N., Thamdrup, B., and Stewart, F. J.: Size-fraction partitioning of community gene transcription and nitrogen metabolism in a marine oxygen minimum zone, ISME J., 9, 2682–2696, https://doi.org/10.1038/ismej.2015.44, 2015.
Garcia-Robledo, E., Borisov, S., Klimant, I., and Revsbech, N. P.: Determination of respiration rates in water with sub-micromolar oxygen concentrations, Front. Mar. Sci., 3, 244, https://doi.org/10.3389/FMARS.2016.00244, 2016.
Garcia-Robledo, E., Padilla, C. C., Aldunate, M., Stewart, F. J., Ulloa, O., Paulmier, A., Gregori, G., and Revsbech, N. P.: Cryptic oxygen cycling in anoxic marine zones, P. Natl. Acad. Sci. USA, 114, 8319–8324, https://doi.org/10.1073/PNAS.1619844114, 2017.
Garcia-Robledo, E., Paulmier, A., Borisov, S. M., and Revsbech, N. P.: Sampling in low oxygen aquatic environment.: The deviation from anoxic conditions, Limnol. Oceanogr.-Meth., 19, 733–740, https://doi.org/10.1002/LOM3.10457, 2021.
Granger, J. and Sigman, D. M.: Removal of nitrite with sulfamic acid for nitrate N and O isotope analysis with the denitrifier method, Rapid Commun. Mass Spectrom, 23, 3753–3762, https://doi.org/10.1002/rcm.4307, 2009.
Granger, J. and Wankel, S. D.: Isotopic overprinting of nitrification on denitrification as a ubiquitous and unifying feature of environmental nitrogen cycling, P. Natl. Acad. Sci. USA, 113, E6391–E6400, https://doi.org/10.1073/pnas.1601383113, 2016.
Hamersley, M. R., Lavik, G., Woebken, D., Rattray, J. E., Lam, P., Hopmans, E. C., Sinninghe Damsté, J. S., Krüger, S., Graco, M., Gutiérrez, D., and Kuypers, M. M. M.: Anaerobic ammonium oxidation in the Peruvian oxygen minimum zone, Limnol. Oceanogr., 52, 923–933, https://doi.org/10.4319/LO.2007.52.3.0923, 2007.
Holmes, R. M., Aminot, A., Kérouel, R., Hooker, B. A., and Peterson, B. J.: A simple and precise method for measuring ammonium in marine and freshwater ecosystems, Can. J. Fish. Aquat. Sci., 56, 1801–1808, https://doi.org/10.1139/f99-128, 1999.
Horak, R. E. A., Ruef, W., Ward, B. B., and Devol, A. H.: Expansion of denitrification and anoxia in the eastern tropical North Pacific from 1972 to 2012, Geophys. Res. Lett., 43, 5252–5260, https://doi.org/10.1002/2016GL068871, 2016.
Ito, T., Minobe, S., Long, M. C., and Deutsch, C.: Upper ocean O2 trend.: 1958–2015, Geophys. Res. Lett., 44, 4214–4223, https://doi.org/10.1002/2017GL073613, 2017.
Jayakumar, A., Wajih, S., Naqvi, A., and Ward, B. B.: Distribution and Relative Quantification of Key Genes Involved in Fixed Nitrogen Loss From the Arabian Sea Oxygen Minimum Zone, i.: Indian Ocean Biogeochem. Process. Ecol. Var., edited by: Wiggert, J. D., Hood, R. R., Wajih, S., Naqvi, A., Brink, K. H., and Smith, S. L., Geophys. Monogr. Ser., 185, https://doi.org/10.1029/2008GM000730, 2009.
Jensen, M. M., Lam, P., Revsbech, N. P., Nagel, B., Gaye, B., Jetten, M. S. M., and Kuypers, M. M. M.: Intensive nitrogen loss over the Omani Shelf due to anammox coupled with dissimilatory nitrite reduction to ammonium, ISME J., 5, 1660–1670, https://doi.org/10.1038/ismej.2011.44, 2011.
Kalvelage, T., Lavik, G., Lam, P., Contreras, S., Arteaga, L., Löscher, C. R., Oschlies, A., Paulmier, A., Stramma, L., and Kuypers, M. M. M.: Nitrogen cycling driven by organic matter export in the South Pacific oxygen minimum zone, Nat. Geosci., 6, 228–234, https://doi.org/10.1038/NGEO1739, 2013.
Keeling, R. F., Körtzinger, A., and Gruber, N.: Ocean deoxygenation in a warming world, Ann. Rev. Mar. Sci., 2, 199–229, https://doi.org/10.1146/annurev.marine.010908.163855, 2010.
Kemeny, P. C., Weigand, M. A., Zhang, R., Carter, B. R., Karsh, K. L., Fawcett, S. E., and Sigman, D. M.: Enzyme-level interconversion of nitrate and nitrite in the fall mixed layer of the Antarctic Ocean, Global Biogeochem. Cy., 30, 1069–1085, https://doi.org/10.1002/2015GB005350, 2016.
Kirstein, K. and Bock, E.: Close genetic relationship between Nitrobacter hamburgensis nitrite oxidoreductase and Escherichia coli nitrate reductases, Arch. Microbiol., 160, 447–453, https://doi.org/10.1007/BF00245305, 1993.
Koch, H., Lücker, S., Albertsen, M., Kitzinger, K., Herbold, C., Spieck, E., Nielsen, P. H., Wagner, M., and Daims, H.: Expanded metabolic versatility of ubiquitous nitrite-oxidizing bacteria from the genus Nitrospira, P. Natl. Acad. Sci. USA, 112, 11371–11376, https://doi.org/10.1073/PNAS.1506533112, 2015.
Kondo, Y. and Moffett, J. W.: Iron redox cycling and subsurface offshore transport in the eastern tropical South Pacific oxygen minimum zone, Mar. Chem., 168, 95–103, https://doi.org/10.1016/J.MARCHEM.2014.11.007, 2015.
Kraft, B., Jehmlich, N., Larsen, M., Bristow, L. A., Könneke, M., Thamdrup, B., and Canfield, D. E.: Oxygen and nitrogen production by an ammonia-oxidizing archaeon, Science, 375, 97–100, https://doi.org/10.1126/science.abe6733, 2022.
Kuenen, J. G.: Anammox bacteria: from discovery to application, Nat. Rev. Microbiol., 6, 320–326, https://doi.org/10.1038/nrmicro1857, 2008.
Kuypers, M. M. M., Lavik, G., Woebken, D., Schmid, M., Fuchs, B. M., Amann, R., Jørgensen, B. B., and Jetten, M. S. M.: Massive nitrogen loss from the Benguela upwelling system through anaerobic ammonium oxidation, P. Natl. Acad. Sci. USA, 102, 6478–6483, https://doi.org/10.1073/PNAS.0502088102, 2005.
Lam, P. and Kuypers, M. M. M.: Microbial Nitrogen Cycling Processes in Oxygen Minimum Zones, Ann. Rev. Mar. Sci., 3, 317–345, https://doi.org/10.1146/annurev-marine-120709-142814, 2011.
Lam, P., Lavik, G., Jensen, M. M., Van Vossenberg, J. De, Schmid, M., Woebken, D., Gutiérrez, D., Amann, R., Jetten, M. S. M., and Kuypers, M. M. M.: Revising the nitrogen cycle in the Peruvian oxygen minimum zone, P. Natl. Acad. Sci. USA, 106, 4752–4757, https://doi.org/10.1073/PNAS.0812444106, 2009.
Lam, P., Jensen, M. M., Kock, A., Lettmann, K. A., Plancherel, Y., Lavik, G., Bange, H. W., and Kuypers, M. M. M.: Origin and fate of the secondary nitrite maximum in the Arabian Sea, Biogeosciences, 8, 1565–1577, https://doi.org/10.5194/bg-8-1565-2011, 2011.
Lehner, P., Larndorfer, C., Garcia-Robledo, E., Larsen, M., Borisov, S. M., Revsbech, N. P., Glud, R. N., Canfield, D. E., and Klimant, I.: LUMOS – A Sensitive and Reliable Optode System for Measuring Dissolved Oxygen in the Nanomolar Range, PLOS ONE, 10, e0128125, https://doi.org/10.1371/JOURNAL.PONE.0128125, 2015.
Lipschultz, F., Wofsy, S. C., Ward, B. B., Codispoti, L. A., Friedrich, G., and Elkins, J. W.: Bacterial transformations of inorganic nitrogen in the oxygen-deficient waters of the Eastern Tropical South Pacific Ocean, Deep-Sea Res. Pt. I, 37, 1513–1541, https://doi.org/10.1016/0198-0149(90)90060-9, 1990.
Lomas, M. W. and Lipschultz, F.: Forming the primary nitrite maximu.: Nitrifiers or phytoplankton?, Limnol. Oceanogr., 51, 2453–2467, https://doi.org/10.4319/LO.2006.51.5.2453, 2006.
Luther, G. W.: The role of one- and two-electron transfer reactions in forming thermodynamically unstable intermediates as barriers in multi-electron redox reactions, Aquat. Geochem., 16, 395–420, https://doi.org/10.1007/S10498-009-9082-3, 2010.
Luther, G. W. and Popp, J. I.: Kinetics of the Abiotic Reduction of Polymeric Manganese Dioxide by Nitrit.: An Anaerobic Nitrification Reaction, Aquat. Geochem., 8, 15–36, https://doi.org/10.1023/A:1020325604920, 2002.
Margolskee, A., Frenzel, H., Emerson, S., and Deutsch, C.: Ventilation Pathways for the North Pacific Oxygen Deficient Zone, Global Biogeochem. Cy., 33, 875–890, https://doi.org/10.1029/2018GB006149, 2019.
Martin, J. H., Knauer, G. A., Karl, D. M., and Broenkow, W. W.: VERTE.: carbon cycling in the northeast Pacific, Deep-Sea Res. Pt. I, 34, 267–285, https://doi.org/10.1016/0198-0149(87)90086-0, 1987.
McIlvin, M. R. and Altabet, M. A.: Chemical conversion of nitrate and nitrite to nitrous oxide for nitrogen and oxygen isotopic analysis in freshwater and seawater, Anal. Chem., 77, 5589–5595, https://doi.org/10.1021/ac050528s, 2005.
Mincer, T. J., Church, M. J., Taylor, L. T., Preston, C., Karl, D. M., and DeLong, E. F.: Quantitative distribution of presumptive archaeal and bacterial nitrifiers in Monterey Bay and the North Pacific Subtropical Gyre, Environ. Microbiol., 9, 1162–1175, https://doi.org/10.1111/J.1462-2920.2007.01239.X, 2007.
Moriyasu, R., Evans, N., Bolster, K. M., Hardisty, D. S., and Moffett, J. W.: The Distribution and Redox Speciation of Iodine in the Eastern Tropical North Pacific Ocean, Global Biogeochem. Cy., 34, e2019GB006302, https://doi.org/10.1029/2019GB006302, 2020.
Naqvi, S. W. A.: Some aspects of the oxygen-deficient conditions and denitrification in the Arabian Sea, J. Mar. Res., 45, 1049–1072, 1987.
Nozaki, Y.: A fresh look at element distribution in the North Pacific Ocean, Eos T. Am. Geophys. Un., 78, 221–221, https://doi.org/10.1029/97EO00148, 1997.
Oshiki, M., Satoh, H., and Okabe, S.: Ecology and physiology of anaerobic ammonium oxidizing bacteria, Environ. Microbiol., 18, 2784–2796, https://doi.org/10.1111/1462-2920.13134, 2016.
Padilla, C. C., Bristow, L. A., Sarode, N., Garcia-Robledo, E., Gómez Ramírez, E., Benson, C. R., Bourbonnais, A., Altabet, M. A., Girguis, P. R., Thamdrup, B., and Stewart, F. J.: NC10 bacteria in marine oxygen minimum zones, ISME J., 10, 2067–2071, https://doi.org/10.1038/ismej.2015.262, 2016.
Peng, X., Fuchsman, C. A., Jayakumar, A., Oleynik, S., Martens-Habbena, W., Devol, A. H., and Ward, B. B.: Ammonia and nitrite oxidation in the Eastern Tropical North Pacific, Global Biogeochem. Cy., 29, 2034–2049, https://doi.org/10.1002/2015GB005278, 2015.
Peng, X., Fuchsman, C. A., Jayakumar, A., Warner, M. J., Devol, A. H., and Ward, B. B.: Revisiting nitrification in the Eastern Tropical South Pacific: A focus on controls, J. Geophys. Res.-Oceans, 121, 1667–1684, https://doi.org/10.1002/2015JC011455, 2016.
Penn, J., Weber, T., and Deutsch, C.: Microbial functional diversity alters the structure and sensitivity of oxygen deficient zones, Geophys. Res. Lett., 43, 9773–9780, https://doi.org/10.1002/2016GL070438, 2016.
Peters, B. D., Babbin, A. R., Lettmann, K. A., Mordy, C. W., Ulloa, O., Ward, B. B., and Casciotti, K. L.: Vertical modeling of the nitrogen cycle in the eastern tropical South Pacific oxygen deficient zone using high-resolution concentration and isotope measurements, Global Biogeochem. Cy., 30, 1661–1681, https://doi.org/10.1002/2016GB005415, 2016.
R: A language and environment for statistical computing, https://www.r-project.org/, last access: 30 June 2022.
Starkenburg, S. R., Larimer, F. W., Stein, L. Y., Klotz, M. G., Chain, P. S. G., Sayavedra-Soto, L. A., Poret-Peterson, A. T., Gentry, M. E., Arp, D. J., Ward, B., and Bottomley, P. J.: Complete genome sequence of Nitrobacter hamburgensis X14 and comparative genomic analysis of species within the genus Nitrobacter, Appl. Environ. Microb., 74, 2852–2863, https://doi.org/10.1128/AEM.02311-07, 2008.
Stramma, L., Johnson, G. C., Sprintall, J., and Mohrholz, V.: Expanding oxygen-minimum zones in the tropical oceans, Science (80-), 320, 655–658, https://doi.org/10.1126/science.1153847, 2008.
Strickland, J. D. H. and Parsons, T. R.: A Practical Handbook of Seawater Analysis, Fisheries Research Board of Canada, Ottawa, 1972.
Strohm, T. O., Griffin, B., Zumft, W. G., and Schink, B.: Growth yields in bacterial denitrification and nitrate ammonification, Appl. Environ. Microb., 73, 1420–1424, https://doi.org/10.1128/AEM.02508-06, 2007.
Strous, M., Heijnen, J. J., Kuenen, J. G., and Jetten, M. S. M.: The sequencing batch reactor as a powerful tool for the study of slowly growing anaerobic ammonium-oxidizing microorganisms, Appl. Microbiol. Biot., 50, 589–596, https://doi.org/10.1007/S002530051340, 1998.
Sun, X. and Ward, B. B.: Novel metagenome-assembled genomes involved in the nitrogen cycle from a Pacific oxygen minimum zone, ISME Commun., 1, 1–5, https://doi.org/10.1038/s43705-021-00030-2, 2021.
Sun, X., Ji, Q., Jayakumar, A., and Ward, B. B.: Dependence of nitrite oxidation on nitrite and oxygen in low-oxygen seawater, Geophys. Res. Lett., 44, 7883–7891, https://doi.org/10.1002/2017GL074355, 2017.
Sun, X., Kop, L. F. M., Lau, M. C. Y., Frank, J., Jayakumar, A., Lücker, S., and Ward, B. B.: Uncultured Nitrospina-like species are major nitrite oxidizing bacteria in oxygen minimum zones, ISME J., 13, 2391–2402, https://doi.org/10.1038/s41396-019-0443-7, 2019.
Sun, X., Frey, C., Garcia-Robledo, E., Jayakumar, A., and Ward, B. B.: Microbial niche differentiation explains nitrite oxidation in marine oxygen minimum zones, ISME J., 15, 1317–1329, https://doi.org/10.1038/s41396-020-00852-3, 2021.
Sun, X., Frey, C., and Ward, B. B.: Nitrite Oxidation Across the Full Oxygen Spectrum in the Ocean, Global Biogeochem. Cy., 37, e2022GB007548, https://doi.org/10.1029/2022GB007548, 2023.
Suter, E. A., Scranton, M. I., Chow, S., Stinton, D., Medina Faull, L., and Taylor, G. T.: Niskin bottle sample collection aliases microbial community composition and biogeochemical interpretation, Limnol. Oceanogr., 62, 606–617, https://doi.org/10.1002/LNO.10447, 2017.
Tang, W., Tracey, J. C., Carroll, J., Wallace, E., Lee, J. A., Nathan, L., Sun, X., Jayakumar, A., and Ward, B. B.: Nitrous oxide production in the Chesapeake Bay, Limnol. Oceanogr., 67, 2101–2116, https://doi.org/10.1002/LNO.12191, 2022.
Taylor, B. W., Keep, C. F., Hall, R. O., Koch, B. J., Tronstad, L. M., Flecker, A. S., and Ulseth, A. J.: Improving the fluorometric ammonium metho.: matrix effects, background fluorescence, and standard additions, J. N. Am. Benthol. Soc., 26, 167–177, https://doi.org/10.1899/0887-3593(2007)26[167:ITFAMM]2.0.CO;2, 2007.
Thamdrup, B. and Dalsgaard, T.: The fate of ammonium in anoxic manganese oxide-rich marine sediment, Geochim. Cosmochim. Ac., 64, 4157–4164, https://doi.org/10.1016/S0016-7037(00)00496-8, 2000.
Thamdrup, B. and Dalsgaard, T.: Production of N2 through anaerobic ammonium oxidation coupled to nitrate reduction in marine sediments, Appl. Environ. Microb., 68, 1312–1318, https://doi.org/10.1128/AEM.68.3.1312-1318.2002, 2002.
Thamdrup, B., Dalsgaard, T., Jensen, M. M., Ulloa, O., Farías, L., and Escribano, R.: Anaerobic ammonium oxidation in the oxygen-deficient waters off northern Chile, Limnol. Oceanogr., 51, 2145–2156, https://doi.org/10.4319/LO.2006.51.5.2145, 2006.
Tiano, L., Garcia-Robledo, E., Dalsgaard, T., Devol, A. H., Ward, B. B., Ulloa, O., Canfield, D. E., and Peter Revsbech, N.: Oxygen distribution and aerobic respiration in the north and south eastern tropical Pacific oxygen minimum zones, Deep-Sea Res. Pt. I, 94, 173–183, https://doi.org/10.1016/J.DSR.2014.10.001, 2014.
Tsementzi, D., Wu, J., Deutsch, S., Nath, S., Rodriguez-R, L. M., Burns, A. S., Ranjan, P., Sarode, N., Malmstrom, R. R., Padilla, C. C., Stone, B. K., Bristow, L. A., Larsen, M., Glass, J. B., Thamdrup, B., Woyke, T., Konstantinidis, K. T., and Stewart, F. J.: SAR11 bacteria linked to ocean anoxia and nitrogen loss, Nature, 536, 179–183, https://doi.org/10.1038/nature19068, 2016.
Ulloa, O., Canfield, D. E., DeLong, E. F., Letelier, R. M., and Stewart, F. J.: Microbial oceanography of anoxic oxygen minimum zones, P. Natl. Acad. Sci. USA, 109, 15996–16003, https://doi.org/10.1073/PNAS.1205009109, 2012.
Van de Leemput, I. A., Veraart, A. J., Dakos, V., De Klein, J. J. M., Strous, M., and Scheffer, M.: Predicting microbial nitrogen pathways from basic principles, Environ. Microbiol., 13, 1477–1487, https://doi.org/10.1111/J.1462-2920.2011.02450.X, 2011.
Vedamati, J., Chan, C., and Moffett, J. W.: Distribution of dissolved manganese in the Peruvian Upwelling and Oxygen Minimum Zone, Geochim. Cosmochim. Ac., 156, 222–240, https://doi.org/10.1016/J.GCA.2014.10.026, 2015.
Wanninkhof, R.: Relationship between wind speed and gas exchange over the ocean, J. Geophys. Res.-Oceans, 97, 7373–7382, https://doi.org/10.1029/92JC00188, 1992.
Ward, B. B., Glover, H. E., and Lipschultz, F.: Chemoautotrophic activity and nitrification in the oxygen minimum zone off Peru, Deep-Sea Res. Pt. I, 36, 1031–1051, https://doi.org/10.1016/0198-0149(89)90076-9, 1989.
Ward, B. B., Tuit, C. B., Jayakumar, A., Rich, J. J., Moffett, J., and Naqvi, S. W. A.: Organic carbon, and not copper, controls denitrification in oxygen minimum zones of the ocean, Deep-Sea Res. Pt. I, 55, 1672–1683, https://doi.org/10.1016/J.DSR.2008.07.005, 2008.
Ward, B. B., Devol, A. H., Rich, J. J., Chang, B. X., Bulow, S. E., Naik, H., Pratihary, A., and Jayakumar, A.: Denitrification as the dominant nitrogen loss process in the Arabian Sea, Nature,, 461, 78–81, https://doi.org/10.1038/nature08276, 2009.
Weigand, M. A., Foriel, J., Barnett, B., Oleynik, S., and Sigman, D. M.: Updates to instrumentation and protocols for isotopic analysis of nitrate by the denitrifier method, Rapid Commun. Mass Sp., 30, 1365–1383, https://doi.org/10.1002/rcm.7570, 2016.
Wunderlich, A., Meckenstock, R. U., and Einsiedl, F.: A mixture of nitrite-oxidizing and denitrifying microorganisms affects the δ18O of dissolved nitrate during anaerobic microbial denitrification depending on the δ18O of ambient water, Geochim. Cosmochim. Ac., 119, 31–45, https://doi.org/10.1016/J.GCA.2013.05.028, 2013.