the Creative Commons Attribution 4.0 License.
the Creative Commons Attribution 4.0 License.
 | 17 Jan 2023
Contrasts in dissolved, particulate, and sedimentary organic carbon from the Kolyma River to the East Siberian Shelf
Lisa Bröder
Tommaso Tesi
Kirsi H. Keskitalo
Nikita Zimov
Anna Davydova
Philip Pika
Negar Haghipour
Timothy I. Eglinton
Jorien E. Vonk
Arctic rivers will be increasingly affected by the hydrological and biogeochemical consequences of thawing permafrost. During transport, permafrost-derived organic carbon (OC) can either accumulate in floodplain and shelf sediments or be degraded into greenhouse gases prior to final burial. Thus, the net impact of permafrost OC on climate will ultimately depend on the interplay of complex processes that occur along the source-to-sink system. Here, we focus on the Kolyma River, the largest watershed completely underlain by continuous permafrost, and marine sediments of the East Siberian Sea, as a transect to investigate the fate of permafrost OC along the land–ocean continuum. Three pools of riverine OC were investigated for the Kolyma main stem and five of its tributaries: dissolved OC (DOC), suspended particulate OC (POC), and riverbed sediment OC (SOC). They were compared with earlier findings in marine sediments. Carbon isotopes (δ13C, Δ14C), lignin phenol, and lipid biomarker proxies show a contrasting composition and degradation state of these different carbon pools. Dual C isotope source apportionment calculations imply that old permafrost-OC is mostly associated with sediments (SOC; contribution of 68±10 %), and less dominant in POC (38±8 %), whereas autochthonous primary production contributes around 44±10 % to POC in the main stem and up to 79±11 % in tributaries. Biomarker degradation indices suggest that Kolyma DOC might be relatively degraded, regardless of its generally young age shown by previous studies. In contrast, SOC shows the lowest Δ14C value (oldest OC), yet relatively fresh compositional signatures. Furthermore, decreasing mineral surface area-normalised OC- and biomarker loadings suggest that SOC might be reactive along the land–ocean continuum and almost all parameters were subjected to rapid change when moving from freshwater to the marine environment. This suggests that sedimentary dynamics play a crucial role when targeting permafrost-derived OC in aquatic systems and support earlier studies highlighting the fact that the land–ocean transition zone is an efficient reactor and a dynamic environment. The prevailing inconsistencies between freshwater and marine research (i.e. targeting predominantly DOC and SOC respectively) need to be better aligned in order to determine to what degree thawed permafrost OC may be destined for long-term burial, thereby attenuating further global warming.
- Article
(6097 KB) - Full-text XML
- BibTeX
- EndNote


Permafrost regions store approximately half of the global soil organic carbon (OC) (Hugelius et al., 2014; Zimov et al., 2006a). Amplified warming of the Arctic, currently three times as fast as the global average (IPCC, 2021), warms permafrost on a global scale (Biskaborn et al., 2019). Permafrost thaw and associated shifts in hydrology (Walvoord and Kurylyk, 2016), impact regional carbon cycling through the release of organic matter from this previously frozen pool to the fluvial network. In addition, the release of nutrients and sediment leads to a multitude of effects on the biogeochemical properties of inland and coastal waters (Terhaar et al., 2021; Vonk et al., 2015). Furthermore, decomposition of OC from thawing permafrost soils releases greenhouse gases (CO2, CH4) into the atmosphere, causing further climate warming (Schuur et al., 2015).
Arctic rivers, like rivers in general, serve as integrators of their catchments, tracking changes in terrestrial signatures of the transported organic matter at the river mouth, and can therefore be used as indicators for watershed-wide processes such as permafrost thaw or soil remobilization (van Dongen et al., 2008; Wild et al., 2019; Feng et al., 2013). Based on river mouth monitoring, the six largest Arctic rivers are estimated to transport 40 Tg of fluvial OC, of which 34 Tg DOC and 6 Tg POC, into the Arctic Ocean (Holmes et al., 2012; McClelland et al., 2016). These estimates serve as important baseline data for terrestrial carbon export to the Arctic Ocean. However, fluvial OC cycling already occurs in headwater streams, and extends beyond the river mouth to the shelf seas. Inland waterways are known not just to conservatively channel fluvial OC towards the ocean but also on the one hand to actively degrade OC into greenhouse gases and on the other hand to sequester OC on short and long timescales (days to millennia) (Cole et al., 2007; Drake et al., 2018). Similarly, the breakdown of terrestrial OC in the marine environment (e.g., Alling et al., 2010; Bröder et al., 2018), subsequent ocean acidification (Semiletov et al., 2016) and increase in marine primary production (Terhaar et al., 2021) have been the focus of recent studies. To better assess the processing and fate of terrestrial organic matter in aquatic systems, we should regard these environments as being linked in a land–ocean continuum or as a carbon cycle “without boundaries” (Battin et al., 2009).
For a complete assessment of fluvial OC, one needs to look at three different compartments: dissolved organic carbon (DOC; operationally defined as <0.7 µm), suspended particulate organic carbon (POC; >0.7 µm), and sedimentary organic carbon (SOC). In the six largest Arctic rivers, DOC concentrations are generally higher than POC concentrations (Holmes et al., 2012; McClelland et al., 2016); however, DOC consists predominantly of recent terrestrial material, whereas POC is predominantly sourced from deeper soils and permafrost (Wild et al., 2019). The fraction of DOC that is derived from Yedoma permafrost, Pleistocene-aged permafrost deposits rich in OC, along the Kolyma River, is rapidly degraded upon thawing (Mann et al., 2015; Rogers et al., 2021; Vonk et al., 2013). In contrast, POC derived from thermal erosion of river banks and coastlines, thermokarst, and other abrupt permafrost thaw features may be less prone to rapid degradation, and transported over longer distances (Keskitalo et al., 2022; Salvadó et al., 2016). Concentrations, fluxes, and isotopic signatures of POC in Arctic rivers have been studied in the past decade (McClelland et al., 2016; Wild et al., 2019), including more recent studies on the molecular structure and degradation (e.g., Kolyma river; Bröder et al., 2020; Keskitalo et al., 2022). However, the cycling and degradation of POC during lateral aquatic transport, and especially its interplay with DOC and SOC, remain elusive.
To better understand the interaction and exchange of POC with river- and marine sediments, as well as DOC, all these OC pools need to be considered. Yet to date, studies on riverine SOC transport and degradation are limited and contradictory. In the Danube River, SOC concentrations and mineral-specific surface area-normalised biomarker loadings decrease downstream, suggesting significant SOC degradation during fluvial transport (Freymond et al., 2018). On the contrary, Scheingross et al. (2019) found in an experimental setting that particle abrasion and turbulent mixing of POC in the water column has only a limited effect on degradation, and suggests that degradation takes place mostly during floodplain storage of sediment. Repasch et al. (2021) (Rio Bermejo, Argentina) and Hilton et al. (2015) (Mackenzie River, Canada) show that eroded POC is efficiently transported by rivers, redeposited in floodplains or basins offshore, and suggest that sediment transport time and mineral protection of OC might regulate the magnitude and rate of POC degradation. Additionally, processes such as leaching of POC and SOC, and, vice versa, adsorption of DOC to soil or mineral particles, influence both the composition and degradability of OC (mineral binding ballasts), and slow down the degradation of OC (Hemingway et al., 2019; Keil et al., 1994; Keskitalo et al., 2022; Kleber et al., 2021; Vonk et al., 2010b), whereas leaching of OC to the dissolved phase increases its potential for degradation (Abbott et al., 2014; Mann et al., 2015; Rogers et al., 2021; Vonk et al., 2013). No previous studies, to our knowledge, have addressed transport and degradation of SOC in the Kolyma River using riverbed samples upstream from the Kolyma River mouth.
Here, for the first time in this river system, we combine the investigation of three fractions of fluvial OC (dissolved, particulate, and sedimentary), along a 250 km-long river transect in the lower reaches of the Kolyma River, including five of its tributaries. Furthermore, we connect our fluvial data with published records from a 1000 km-long transect across the East Siberian Sea (ESS) (Tesi et al., 2014; Vonk et al., 2010a, 2012; Bröder et al., 2019; Salvadó et al., 2016). We applied a variety of bulk analyses (OC %, δ13C, Δ14C, mineral-specific surface area), and used molecular geochemical tracers (long-chain n-alkanoic acids, and lignin and cutin-derived products) to untangle, for each fraction of OC, its sources and the effect of fractionation and degradation during its transport via different aquatic (freshwater, marine) and sedimentary (i.e. river, delta, estuary, shelf) environments of the land–ocean continuum.
2.1 Study area and sample locations
The Kolyma River in Northeast Siberia is the world's largest watershed (653 000 km2) entirely underlain by continuous permafrost (Holmes et al., 2012). Its discharge follows a distinct seasonal pattern typical of Arctic rivers, with a strong peak during the spring freshet, and lower baseflow in winter. Annual water discharge is 109±7 km3 (Holmes et al., 2012), and the average annual DOC and POC flux from the Kolyma River to the East Siberian Sea is 818 Gg (109 g) and 123 Gg per year respectively (Holmes et al., 2012; McClelland et al., 2016). In its lower reaches, the river flows roughly northward through lowlands that consist of icy loess-like Yedoma deposits, or ice complex permafrost deposits (ICD), of the Pleistocene age. This Yedoma permafrost has a high OC content (2 %–5 %; Zimov et al., 2006b). Most of the Kolyma watershed is covered by boreal forests (taiga) dominated by the Cajanderi larch (Larix cajanderi Mayr), and the Kolyma Delta further north is in the tundra biome.
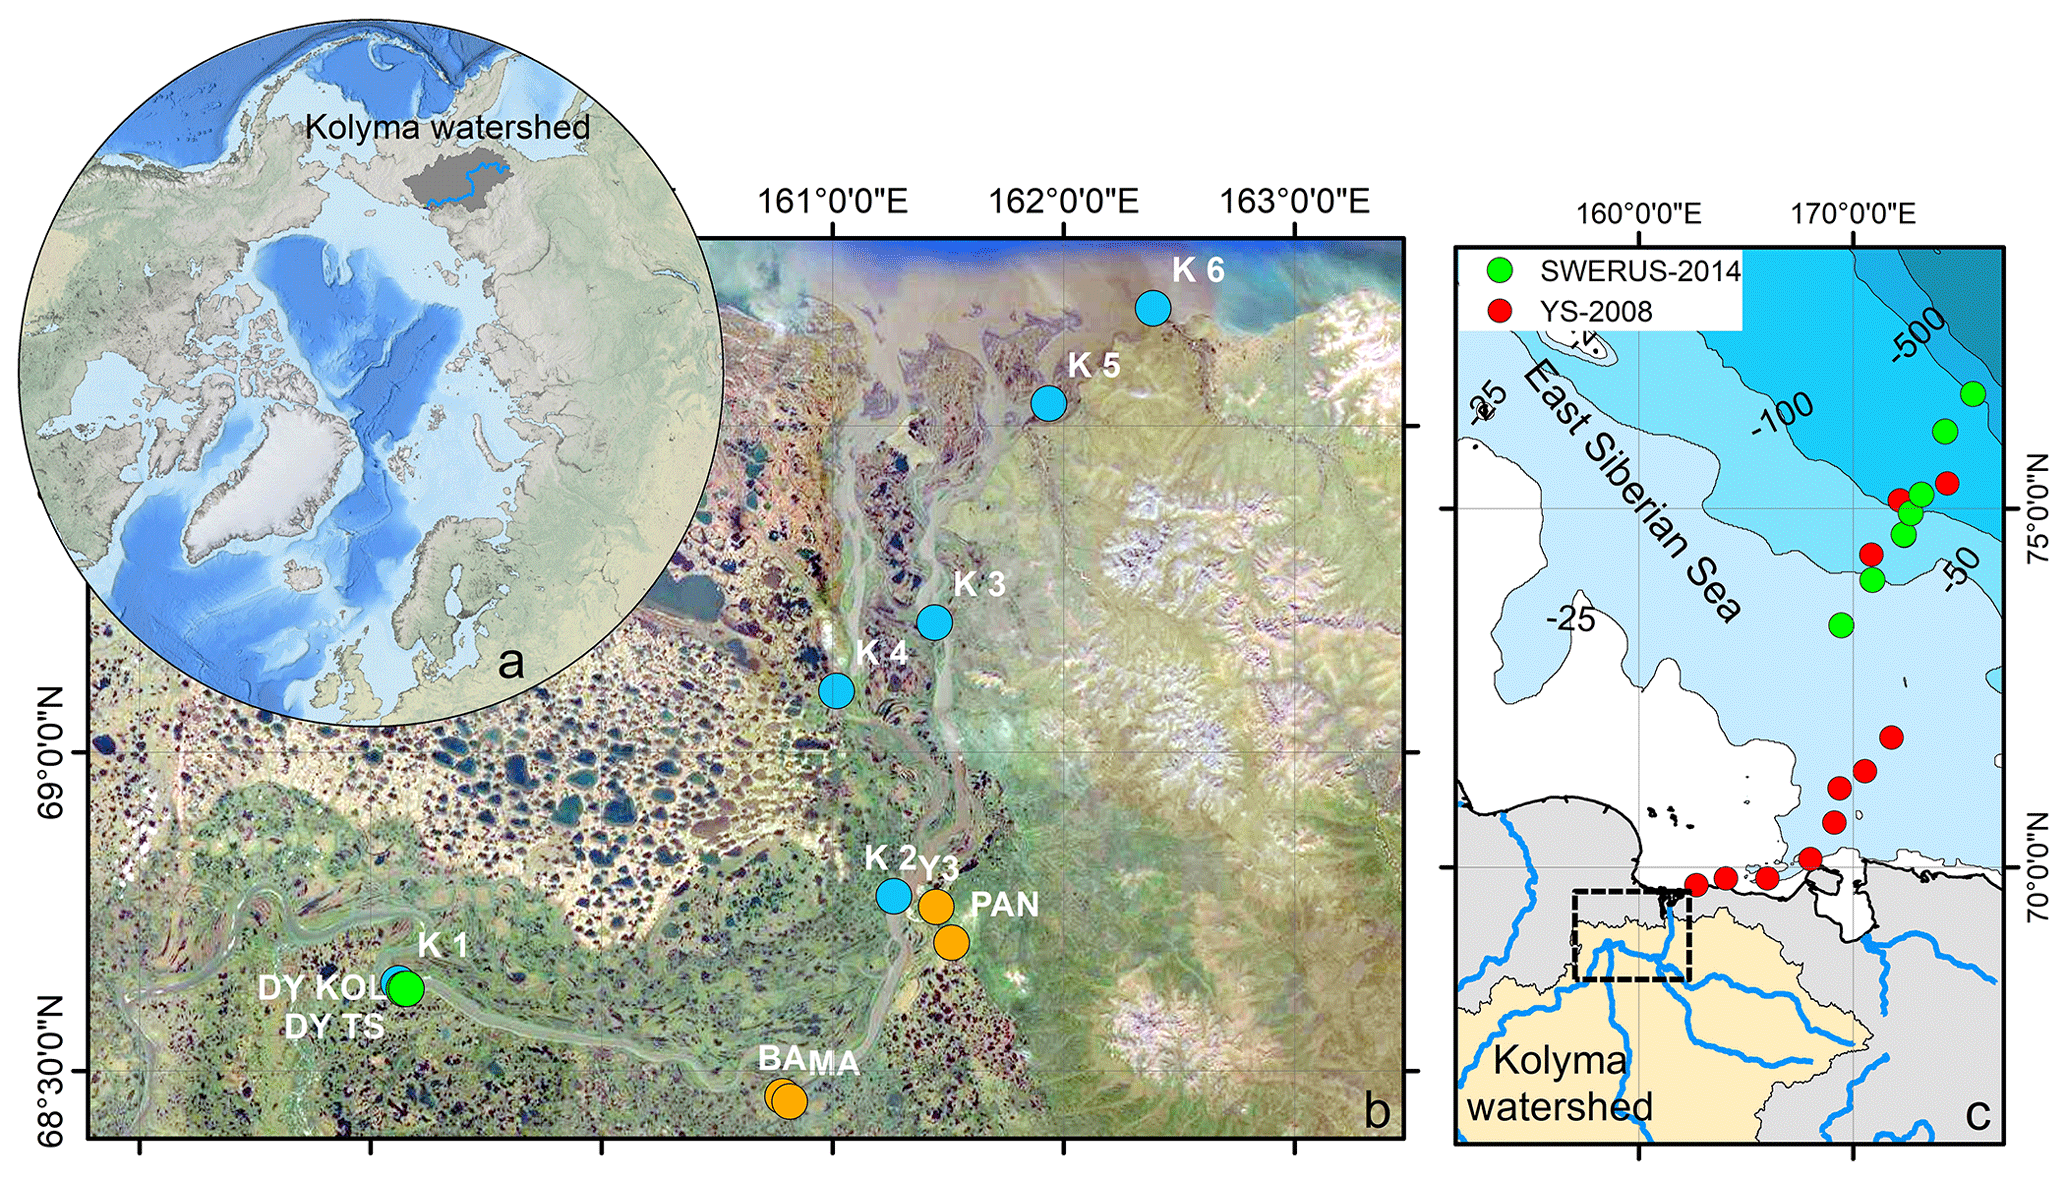
Figure 1(a) Location of the Kolyma watershed (Made with ArcMap™, © Esri. All rights reserved.). (b) Kolyma River delta with sample locations. In blue the Kolyma mainstem samples, orange the tributaries (Panteleikha (PAN), Bolshoy and Maly Anyuy (BA and MA), and Y3), green Duvanny Yar (DY). For reference, location K 2 is at the town of Cherskiy. Background image adapted from Mann et al. (2012). (c) Sample location in the East Siberian Sea following the Kolyma paleoriver-transect, extended to the shelf break. In red, the first eight locations offshore from South to North: YS34B to YS41 (Vonk et al., 2010a; Tesi et al., 2014); four locations farther offshore from South to North: YS91, YS90/SWE-63, YS88, YS86. In green, south to north: SWE-60, SWE-61, YS90/SWE-63, SWE-64, SWE-65, SWE-66, and SWE-67 (Salvadó et al., 2016; Bröder et al., 2019). The black box shows the location of panel (b).
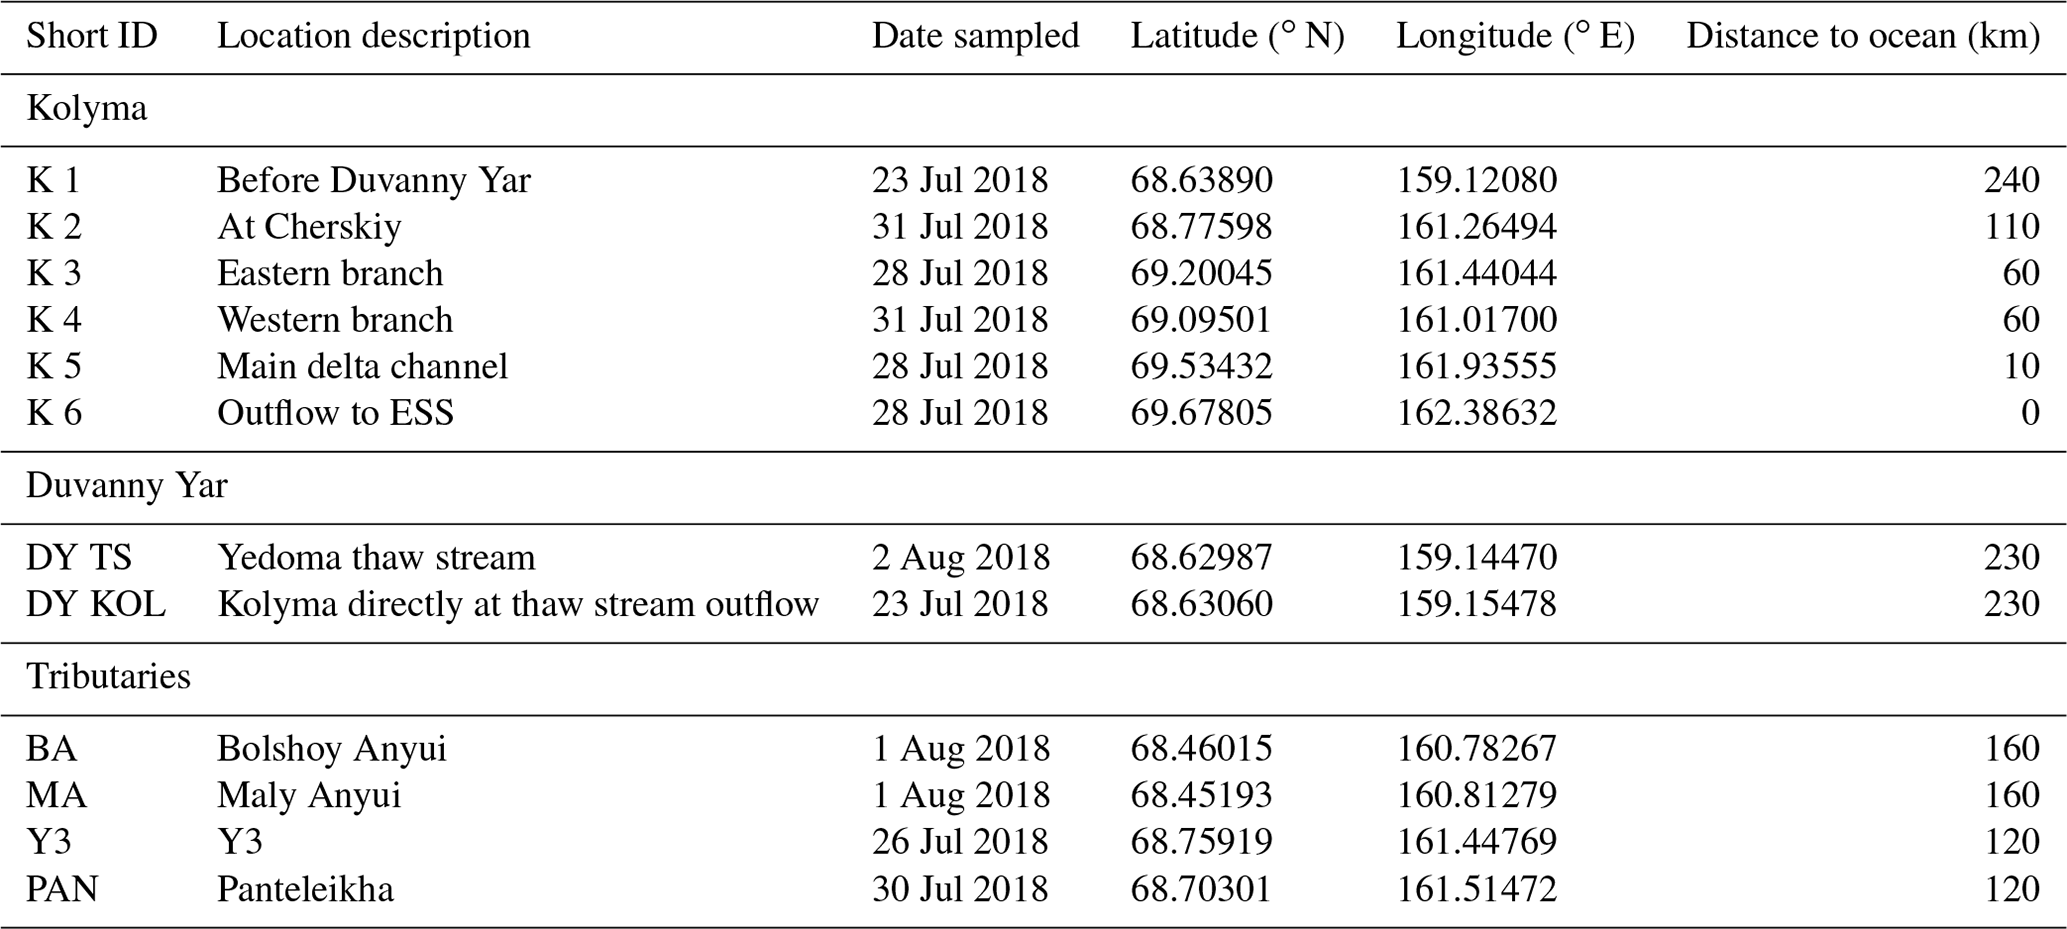
Sampling of the Kolyma River took place from the Northeast Science Station in Cherskiy during summer 2018, from 23 July to 3 August, directly after spring freshet (Fig. A1). We covered a 250 km-long transect of the Kolyma River starting at 68.63890∘ N 159.12080∘ E, where the river passes a ca. 10 km-long Yedoma-deposit riverbank exposure (Duvanny Yar, DY) to the delta outflow into the East Siberian Sea, including sampling the less-studied western delta branch of the Kolyma River (K1–K6, Fig. 1b, Table 1). In addition to the samples from the Kolyma River main stem, samples were taken from several tributaries with varying catchment sizes. Two of the larger tributaries of the Kolyma were sampled, the Maly Anyuy (MA), and the Bolshoy Anyuy (BA), with a catchment size of 49 800 and 57 300 km2 respectively, and a smaller tributary, the Panteleikha (PAN; 1630 km2), where an algal bloom was observed at the time of sampling (30 July 2018). In addition, two small streams with contrasting characteristics were sampled: (i) Y3 (∼17 km2), characterised by a relatively high DOC load and low POC load, representing soil leaching and active layer drainage (Bröder et al., 2020), and (ii) a thaw stream at Duvanny Yar (DY TS; <0.1 km2), characterised by an extremely high POC load, and a relatively low DOC load, representing eroding Yedoma permafrost (Vonk et al., 2013). At Duvanny Yar, additional samples were taken from a thawing permafrost headwall, and from the outflow of a thaw stream into the Kolyma River (DY KOL) to characterise the Yedoma permafrost endmember and mixing of the thaw streams with Kolyma waters.
We compare our samples with the data reported in Bröder et al. (2020), including POC samples from the Kolyma River (sampled at Cherskiy) and the tributary stream Y3, covering the open-water seasons (late May until late September or early October) of 2013 and 2015. These samples were included in the present study to give an insight into temporal variations at these locations, in addition to spatial variations along the transect.
Furthermore, this new dataset is compared with published data on surface water DOC and POC, and surface sediments from the East Siberian Sea. The East Siberian Sea is situated between the Laptev Sea and the New Siberian Islands to the west and the Chukchi Sea and Wrangel Island to the east (Fig. 1a). It covers an area of approximately one million square kilometres, and has an average depth of 58 metres. Previous publications (Tesi et al., 2014; Vonk et al., 2010a, 2012) have characterised surface water DOC and POC in the ESS, along with underlying surface sediments, following the paleoriver valley of the Kolyma up to 600 km offshore (Fig. 1c). The samples along this transect were collected on 3–5 September 2008, and started ca. 12 km farther offshore than our farthest river transect point (K6). An increase in salinity was measured in surface water moving from K 5 (0.15) to K 6 (2.6) to the first point of the marine transect (YS-34B, 17.8; Vonk et al., 2010a). Data from a more recent cruise (between 31 July and 4 August 2014) are used to extend this transect up to 1000 km offshore (Bröder et al., 2019; Salvadó et al., 2016). The ESS around the extended transect is influenced by the Pacific inflow and the Transpolar Drift farther offshore, and the West to East flowing Siberian Coastal Current closer to shore (Stein and Macdonald, 2004; Dudarev et al., 2022). The list of ESS station locations and data used in this study can be found in Table A1.
Table 1Sample locations, description, sampling data, short ID, and the distance of each location to the mouth of the Kolyma River.
2.2 Sampling and sample processing
2.2.1 Particulate and dissolved organic matter, and solid phase extractions
About 20 L of surface water was collected in LDPE bags (Vitop, Rink GmbH) in the centre of the river at each location, except for sample DY KOL, which was sampled at the shore of the Kolyma in the outflow of a thaw stream (Table 1). Within 12 h of sampling, the collected surface water was filtered through pre-combusted (400 ∘C, 12 h including temperature ramping) and pre-weighed glass fibre filters (pore size 0.7 µm, Whatman GF/F). Small GF/F filters (diameter 47 mm; glass filtration tower, Wheaton) were used for total suspended particulate matter (SPM), POC concentration, and carbon isotope analyses, whereas large GF/F filters (diameter 90 mm, pore size 0.7 µm, Whatman; custom made, stainless steel filtration tower) were used to collect larger quantities of suspended material for biomarker analysis. Filters were stored and transported frozen (−20 ∘C), and freeze-dried before further analyses.
The filtrate (DOC) was stored in pre-combusted 40 mL amber glass vials, acidified to pH 2 with concentrated HCl, and transported refrigerated (+5 ∘C) and dark. After subsampling, the remaining filtrate (0.8 to 12.8 L, depending on DOC concentration) was used for the solid phase extraction (SPE) of DOC, following the method of Louchouarn et al. (2000) and Spencer et al. (2010). For this purpose, the filtrate was acidified to pH 2 using concentrated HCl (37 %) and 2 % methanol was added to aid extraction efficiency (Spencer et al., 2010). The acidified filtrate was pumped through a pre-rinsed SPE cartridge (60 mL Mega Bond-Elut C18; Agilent) using a peristaltic pump with flexible silicone tubing (Cole-Parmer instrument company). The loaded SPE cartridges were stored and transported refrigerated (+5 ∘C) and dark. Back at the Vrije Universiteit Amsterdam, the SPE cartridges were extracted by eluting twice with 40 mL of methanol into pre-combusted glass vials, which were subsequently dried on a hot plate at 40–50 ∘C under a stream of N2. The recovery of the SPE procedure was 63±7 % (n=12).
2.2.2 Riverbed sediment organic matter
Riverbed sediments of the Kolyma main stem were sampled using a Van Veen grab-sampler, sampling surface sediment up to 1–5 cm, and stored in sterile Whirl-Pak® bags. These samples represent recently deposited sediment (i.e. with a large fraction of silt and clay) in more quietly flowing locations of the river and delta. Within 12 h of collection, sediments were frozen (−20 ∘C) and remained so during transport. At the laboratory at the Vrije Universiteit Amsterdam, the samples were freeze-dried, and sieved through a 200 µm and a 63 µm mesh, resulting in three size fractions of sediment: coarse sand (>200 µm), fine sand (63–200 µm) and a combination of silt and clay (<63 µm).
Particles coarser than silt (>63 µm) are quickly deposited during sediment transport, and carry little mineral-associated OC. In contrast, the fine sediment fraction (<63 µm) carries the bulk of the mineral-associated OC (Coppola et al., 2007; Keil et al., 1994; Tesi et al., 2016) and is considered to represent an integrated signal of suspended matter transported by the river (Freymond et al., 2018). Therefore, in this study, we focus only on the fine, easily transportable fraction of the sediment. The term “SOC” here therefore refers to the OC content of the <63 µm sediment fraction. This fractionation step allows us to cross-compare the same fraction of sediment and OC at different locations along the river transect and beyond, on the shelf, despite the heterogeneity of bulk sediments.
2.3 Mineral-specific surface area analysis
For mineral surface area (SA) measurements, subsamples of about 1.5 g freeze-dried sediment were combusted at 450 ∘C for 12 h to remove OC, rinsed twice with MilliQ to remove salt and ashes, and freeze dried again. Directly prior to analysis, the samples were degassed for a minimum of 2 h at 300 ∘C under vacuum. The analyses were performed at the Vrije Universiteit Amsterdam on a Quantachrome Nova 4200e, using the six-point Brunauer–Emmett–Teller method (Brunauer et al., 1938). The SA measurements were regularly checked against two certified reference materials (5.41 and 27.46 m2 g−1).
2.4 Bulk elemental analyses
2.4.1 Carbon concentrations and stable carbon isotope analyses
Concentration of DOC and DOC-δ13C were analysed with an Aurora1030 TOC analyser coupled to a Delta V Advantage isotope ratio mass spectrometer (IRMS) at KU Leuven (Belgium), following the method described by Deirmendjian et al. (2020).
The POC concentrations, and POC-δ13C were measured on a combined elemental analyser – isotope ratio mass spectrometer (EA-IRMS) at the National Research Council Institute of Polar Sciences (Bologna, Italy). Before subsampling, the concentration of SPM was determined by weighing the sediment-loaded filters after freeze-drying and dividing by the volume of water filtered. A subsample was punched out of each 47 mm GF/F filter, placed in a pre-combusted silver capsule, and weighed. Inorganic C was removed by adding 50 µL of 1 M HCl twice to the silver capsules. After oven drying (over NaOH pellets to neutralise acid, at 60 ∘C), the silver capsules were wrapped in tin capsules to aid combustion during analysis.
Sediment (<63 µm fraction) was crushed and homogenized in an agate mortar, and two subsamples of each sample were weighed into pre-combusted silver capsules for total OC and δ13C analyses. The sediment was acidified as described above for the filters to remove inorganic C, wrapped in tin capsules after acidification, and measured for OC at the Sediment Laboratory and for δ13C at the Stable Isotope Laboratory of the Vrije Universiteit Amsterdam (The Netherlands). All δ13C values are reported in ‰ relative to the international standard Vienna Pee Dee Belemnite (VPDB).
2.4.2 Radiocarbon analyses
Radiocarbon (14C) analyses were carried out using an EA coupled to a MICADAS accelerator mass spectrometer at the Laboratory of Ion Beam Physics of the Swiss Federal Institute of Technology (ETH, Zürich, Switzerland), following the method described in McIntyre et al. (2017). A second subsample of the GF/F filters (POC) was punched out and a subsample of sediment (SOC) was taken and weighed in pre-combusted silver capsules for 14C analyses. For these samples, inorganic carbon was removed by fumigation in a desiccator with 37 % HCl at 60 ∘C for 72 h (Komada et al., 2008). After fumigation, samples were dried over NaOH pellets at 60 ∘C for 72 h to neutralise the acid, and wrapped in tin capsules. The final 14C results are corrected for constant background contamination using the method described in Haghipour et al. (2018). All radiocarbon data are presented either as Δ14C (‰) or as conventional, uncalibrated radiocarbon age (years) (Stuiver and Polach, 1977).
2.5 Molecular and biomarker analyses
2.5.1 CuO oxidation products
Microwave-assisted alkaline CuO oxidation was carried out at the laboratory of the Vrije Universiteit Amsterdam to extract lignin and cutin products from SPE-DOC and SOC samples, following the method of Goñi and Montgomery (2000). In summary, Teflon extraction vessels were loaded with ∼2–4 mg OC, 500 mg CuO and 50 mg ferrous ammonium sulfate. For SPE-DOC samples, 10 mg of glucose was added to prevent superoxidation of lignin polymers. Then, 10 mL of degassed 2 N NaOH solution was added under oxygen-free conditions. The oxidation was performed using a MARS 6 microwave (CEM Cooperation) at 150 ∘C (1600 W, 8 min ramp, with continued heating for 90 min). The resulting extract was centrifuged, transferred to a pre-combusted glass vial, and an internal recovery standard (Ethyl vanillin; Sigma-Aldrich) was added. The samples were acidified to pH 1 by adding concentrated HCl, and then extracted twice with ethyl acetate. The samples were dehydrated with anhydrous Na2SO4, transferred to combusted amber glass vials, and dried under a flow of N2. Prior to analyses on an Agilent gas chromatograph-mass spectrometer (GC-MS) at the National Research Council Institute of Polar Sciences (Bologna, Italy), samples were re-dissolved in pyridine and methylated with N, O-Bistrifluoroacetamide. The individual lignin phenols, benzoic acids, and p-hydroxybenzenes were quantified by comparison with commercially available standards, and quantification of cutin-derived products was carried out using the response of trans-cinnamic acid.
2.5.2 Lipid biomarker analyses
For the extraction of lipid biomarkers from POC, freeze-dried 90 mm GF/F filters were selected and placed in pre-extracted Teflon extraction vessels. For some locations, multiple filters (up to three) had to be extracted to obtain enough material (∼6 to 26 mg OC). For riverbed SOC, ∼2 g of sediment was weighed in per extraction vessel, containing ∼12–17 mg OC. Samples were solvent-extracted twice with 15 mL DCM : MeOH (9:1 ) at 100 ∘C (1600 W, 5 min ramp, continued heating for 15 min), using a MARS 6 microwave (CEM Cooperation). The resulting extract was saponified with 10–15 mL of KOH in methanol (0.5 M) at 70 ∘C for 2 h. Subsequently, 5–10 mL of MilliQ water with 2 % NaCl was added. The neutral fraction (containing n-alkanes) was extracted with hexane (3×10 mL), after which the samples were acidified to pH 2 with concentrated HCl. The acid fraction was then extracted with hexane : DCM (4:1 ), methylated with BF3-MeOH (80 ∘C, 30 min), and extracted with DCM after addition of MilliQ water. The acid fraction was further cleaned of impurities by column chromatography (SiO2, water-deactivated), by eluting first with hexane, then DCM : hexane (4:1) and DCM. The cleaned methylated n-alkanoic acids, concentrated in the DCM : hexane fraction, were then analysed on a GC-MS at the National Research Council Institute of Polar Sciences (Bologna, Italy). Quantification of high molecular weight (HMW; carbon chain length 24–30) n-alkanoic acids was done by comparison with commercially available standards (alkanoic acid C22, C24, C26, C28 and C30; Sigma-Aldrich). The carbon preference index (CPI) of the HMW n-alkanoic acids is calculated as the ratio between even and odd carbon chain lengths (Eq. 1):
2.6 Endmember analyses
Source apportionment models are commonly used to distinguish different source contributions to the total OC pool based on their isotopic signature. Dual-carbon isotope endmember mixing models have proven to be useful tools for disentangling the various sources of organic matter in different environments, as these Markov chain Monte Carlo (MCMC) techniques account for uncertainties in both the endmember values and the uncertainties in sample measurements and thus provide better constraints on the relative contributions of different sources to bulk OC (Andersson et al., 2015; Bosch et al., 2015; Vonk et al., 2012; Wild et al., 2019). For this sample set, we identified three different OC sources that contributed to the POC and SOC, and calculated their relative fractions using a dual-isotope δ13C and Δ14C endmember mixing model. Our approach combines an isotopic mass-balance source apportionment model, Bayesian MCMC, which uses dual-isotope signatures (endmembers) from bulk OC to differentiate between the following three sources: (i) permafrost OC; (ii) modern vegetation and surface soil OC; (iii) riverine primary production OC (for the Kolyma samples) or marine primary production OC (for the ESS samples). We defined the endmember for permafrost OC as a mixture of Pleistocene ice complex deposits (ICD) and Holocene permafrost (including Holocene peat), with a δ13C value of ‰ (Vonk et al., 2012) and a Δ14C value of ‰. This Δ14C value was derived as the mean of the ICD endmember ( ‰; n=329; Wild et al., 2019) and the Holocene/peat permafrost endmember ( ‰; n=138; Wild et al., 2019) assuming approximately equal carbon stock input of these two pools in this region (Zimov et al., 2006a). Different weighing of these two permafrost OC pools (e.g., spatial area-weighing of ICD coverage giving a Δ14C value of ‰) did not significantly change the result of the model. The endmember for the second source, modern vegetation and surface soil OC (including the active layer, soil OC, and recent vegetation; hereafter “vegetation/soil OC”), was adapted from Wild et al. (2019) with a δ13C value of ‰ (n=150) and a Δ14C value of ‰ (n=118). Wild et al. (2019) presented endmembers of these sources separately, but, owing to the inclusion of a primary production source as a third source, we combined them into one contemporary terrestrial endmember. Therefore, their values were averaged, equally weighted to one endmember. The third source, primary production OC (fluvial or marine), has an endmember δ13C value of ‰ and a Δ14C value of for riverine samples (henceforth named “Riverine PP OC”), whereas the endmember for marine samples (“Marine PP OC”) is δ13C ‰, Δ14C ‰ (Vonk et al., 2012). The riverine PP OC endmember is based on a compilation of samples and using the endmember values of previous studies: δ13C ‰, Δ14C ‰ (Winterfeld et al., 2015a), δ13C ‰, Δ14C ‰ (Wild et al., 2019), and the sample of the Panteleikha River from this study (δ13C ‰, Δ14C ‰), where an algal bloom was observed during the study period. For the marine δ13C endmember ( ‰), we also tested a value of ‰, used in Bröder et al. (2016) for ESS sediments. The modelling results showed a minimal, non-significant change for SOC in endmember contributions (Fig. A2). However, for POC, there was a large shift on the first part of the marine transect from POC being marine PP dominated to being vegetation/soil OC dominated using the ‰ endmember (Fig. A2). This is probably related to the sharp transition from a riverine PP to a marine PP endmember, whereas in reality the transition is not as sharp and likely a mixture of these two sources within the estuary. The contribution of the permafrost endmember to the POC pool was not significantly affected by this shift. Increasing or decreasing the standard deviation of either of the marine PP endmembers (−24 ‰ and −21 ‰) from ±1 ‰ to ±3 ‰ did not make a difference.
The dual-isotope/three-sources version of the MCMC source apportionment model was adapted from Bosch et al. (2015). We used MATLAB (version 2021a) to model contributions of the three different sources, with the following model parameters: 1 000 000 iterations, a burn-in (initial search phase) of 10 000, and a data thinning of 10. For further details on the method see (Andersson et al., 2015; Andersson, 2011; Bosch et al., 2015).
The Kolyma River transports fluvial organic matter towards the East Siberian Sea in three different compartments: the dissolved, particulate, and sedimentary OC pools. Our study targets all these compartments and adds a spatial dimension by not only sampling along a 250 km main stem transect, but also including a range of tributaries, and extending the riverine transect ∼1000 km across the ESS using existing data (Table A1; Bröder et al., 2019; Salvadó et al., 2016; Tesi et al., 2014; Vonk et al., 2010a). In contrast to previous studies (e.g., Bröder et al., 2020; McClelland et al., 2016), we do not focus on the seasonal OC variability within fluvial systems (i.e. comparing different stages of the hydrograph), but aim to convey a consolidated picture of riverine dissolved, particulate, and sedimentary OC delivered to the East Siberian Sea, and to give an insight into the processes that affect these OC pools along the land–ocean continuum.
3.1 Three contrasting OC pools: concentrations of DOC, POC, and SOC
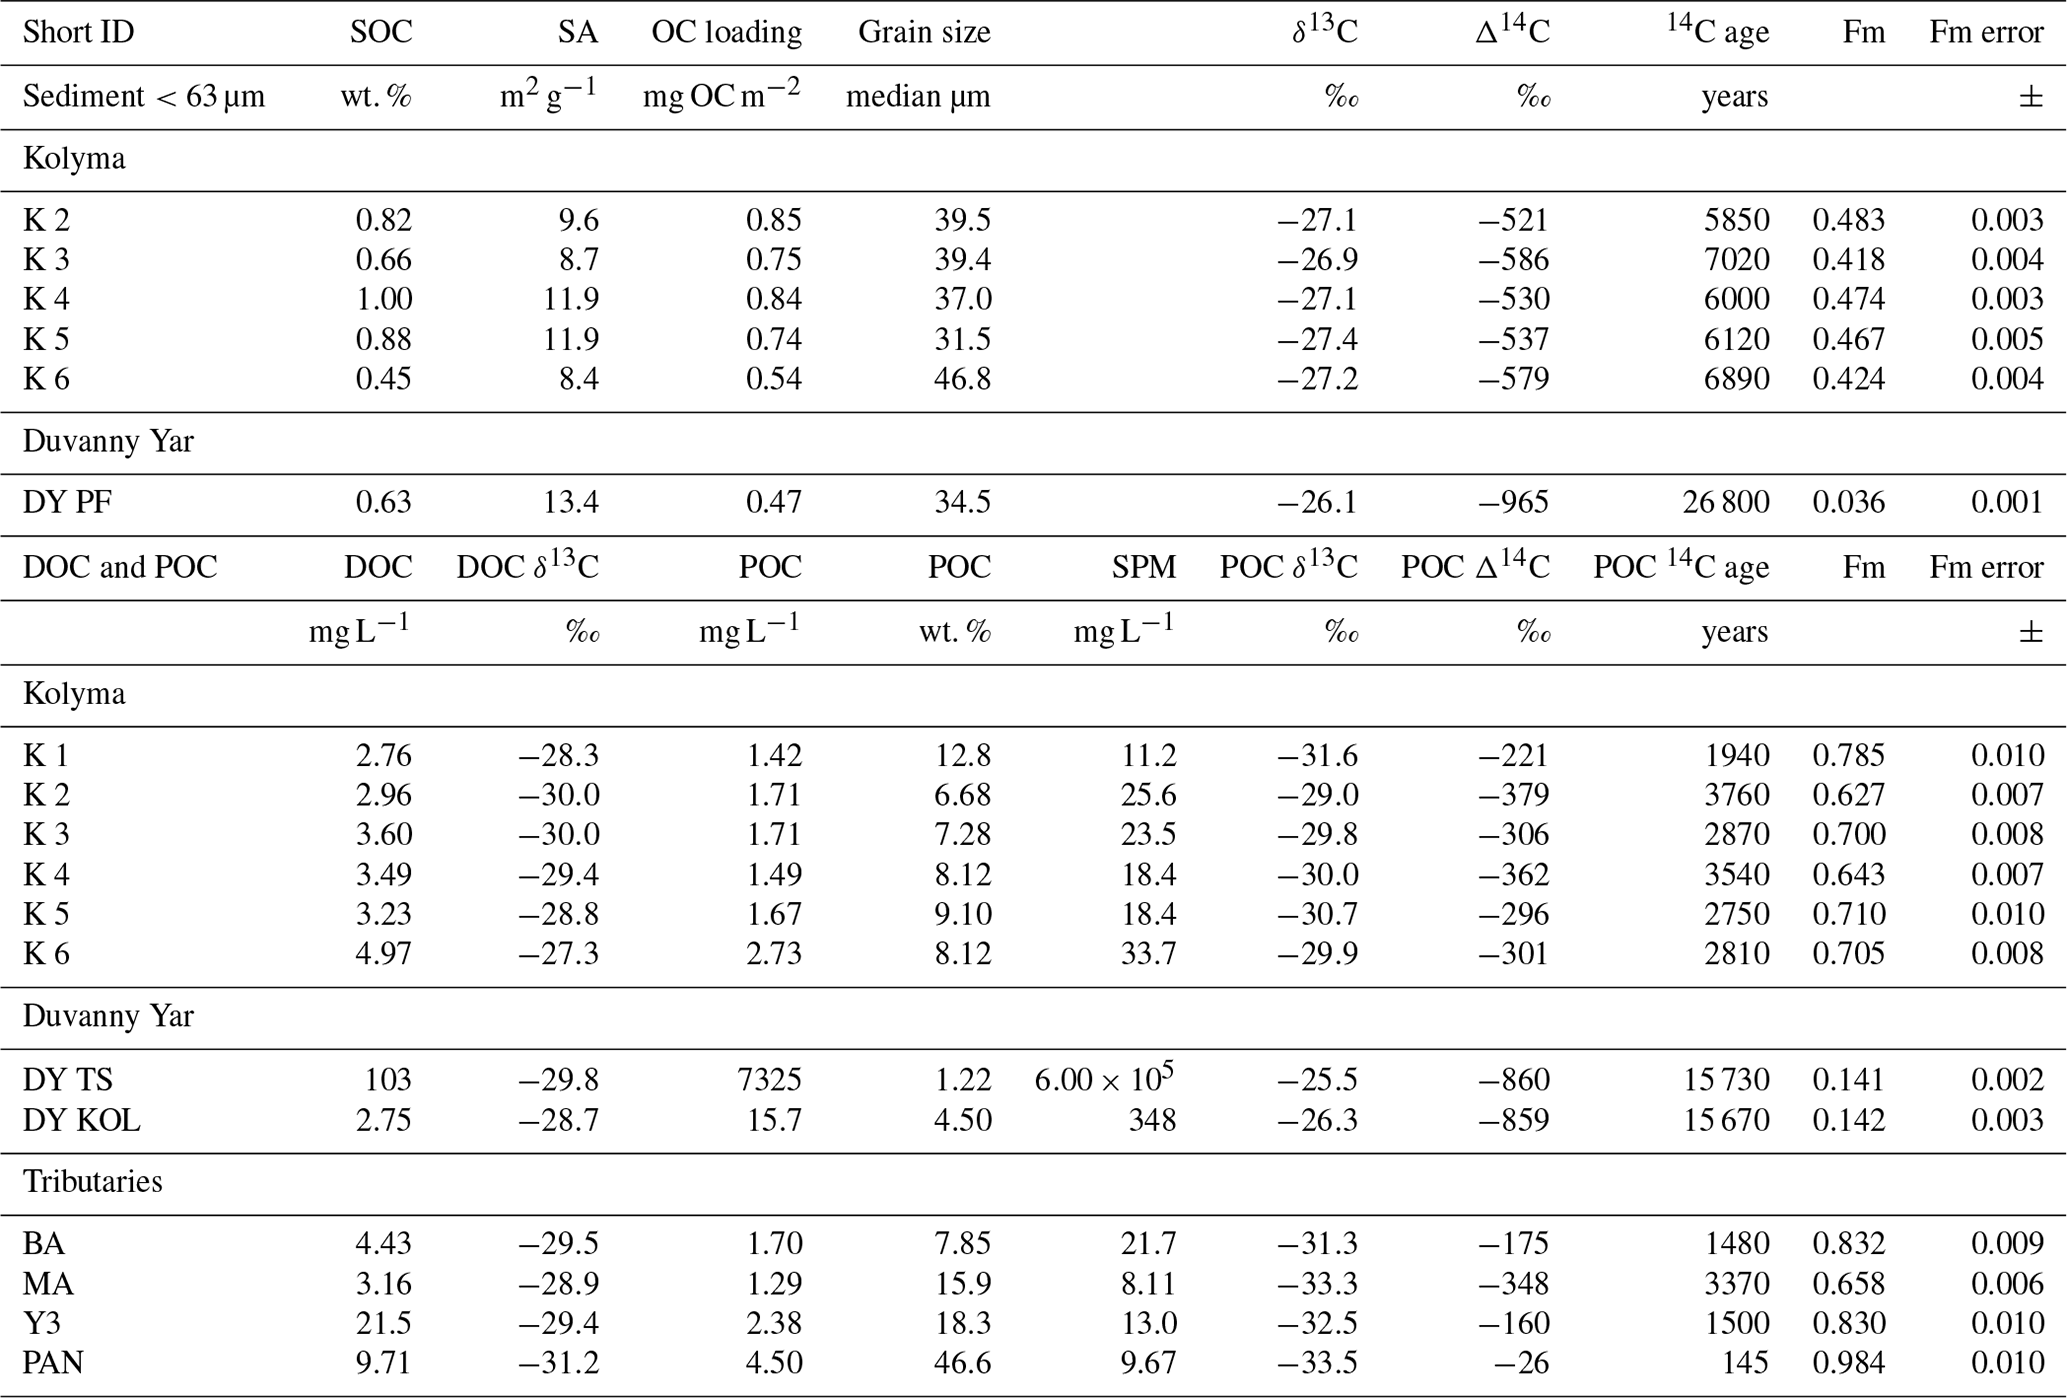
In Arctic rivers, DOC and POC concentrations vary significantly during seasons. Concentrations found in this study (Table 2) match the typical range of DOC and POC values of the Kolyma River in the late summer season (Bröder et al., 2020; Holmes et al., 2012; McClelland et al., 2016). The DOC concentrations along the Kolyma River transect range from 2.76 to 4.97 mg L−1, which is a little higher than DOC in ESS surface waters (∼0.6–1.8 mg L−1; Salvadó et al., 2016; Alling et al., 2010). The POC concentrations during this period range from 1.49 to 2.73 mg L−1 and show a rapid decrease once offshore in the ESS, from 2.7 mg L−1 at location K6 to 0.2 mg L−1 approximately 50 km farther at location YS34B (at a water depth of 10 m; Vonk et al., 2010a, Fig. 1). The Kolyma tributaries PAN and Y3 show notably higher DOC and POC concentrations of 21.5 and 9.71 mg L−1 DOC, and 4.50 and 2.38 mg L−1 POC, respectively, than the Kolyma. The sample DY TS shows extremely high concentrations of DOC (103 mg L−1) and POC (>7300 mg L−1), which are in the same range as other thaw streams at this location (Vonk et al., 2013). Sample DY KOL, located right at the outflow of a thaw stream into the Kolyma River, shows that the extremely high concentrations of DOC and POC coming from DY thaw streams are quickly diluted by river water and/or settle rapidly to the riverbed. The DOC concentration in this sample is in the same range as the Kolyma main stem (2.75 mg L−1), whereas the POC concentration remains elevated at 103 mg L−1. The SOC concentrations in the <63 µm fraction of riverine sediment show values ranging from 0.45 % to 1.0 % (0.76±0.19 %, mean ± standard deviation, n=5) along the Kolyma River transect, which are slightly lower than ESS SOC (which was not sieved), with concentrations between 0.80 % and 1.76 % (mean of 1.15±2.94 %, n=18; Salvadó et al., 2016; Vonk et al., 2010a). The fraction of OC in particulate matter (OC concentrations normalised to TSS) is much higher than in SOC, ranging from 6.7 % to 12.8 % within the Kolyma and with values up to 47 % for the Pantaleikha, pointing towards a significant contribution of primary production (i.e. pure organic matter without minerals) to the particulate load.
Table 2Bulk data for sediment organic carbon (SOC), dissolved organic carbon (DOC), and particulate organic carbon (POC). Including concentrations, surface area (SA), organic carbon loading and isotopic data δ13C, Δ14C, conventional, uncalibrated radiocarbon age (years), and fraction modern (Fm) with the measurement error.
3.2 Three contrasting OC pools: isotopes of DOC, POC, and SOC
Each organic carbon pool (DOC, POC, and SOC) shows distinctly different stable carbon isotope (δ13C) and radiocarbon isotope (Δ14C) ratios, which are important tools in characterising OC and tracing OC from different sources. The DOC-δ13C along the Kolyma River transect ranges from −27.3 ‰ to −30.0 ‰ (Table 2), which is comparable with previously published data (Feng et al., 2013; Mann et al., 2015; Wild et al., 2019). Although we have not measured DOC-Δ14C in this work, earlier studies show that the Kolyma River and its tributary DOC is relatively young (Δ14C within the range +150 ‰ to −100 ‰; Neff et al., 2006; Wild et al., 2019). The DOC-δ13C of the tributaries and Duvanny Yar are within the same range as the Kolyma, except for sample PAN, which shows a lower δ13C value of −31.2 ‰. An earlier study on a Duvanny Yar thaw stream found DOC-Δ14C values between −974 ‰ and −911 ‰ (up to 30 000 years old) (Vonk et al., 2013). However, such old DOC has not been found in the main Kolyma River, likely because of the rapid turnover times of permafrost DOC in Arctic waters (Rogers et al., 2021).
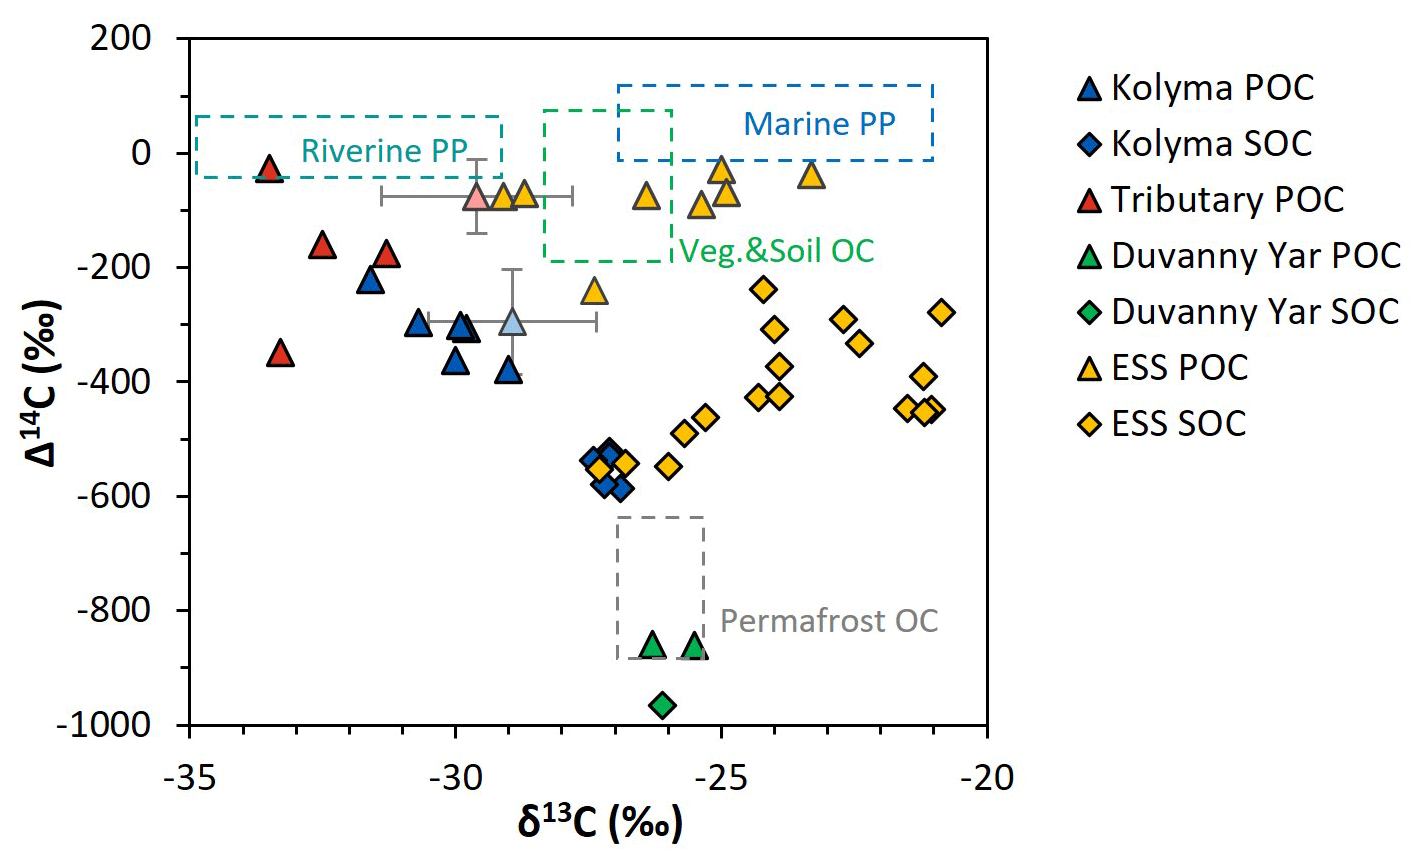
Figure 2Δ14C versus δ13C values of the Duvanny Yar (DY), Kolyma, tributary, and East Siberian Sea (ESS) samples. Triangles are POC samples, diamonds are SOC samples. The Kolyma main stem is in dark blue, ESS in yellow, tributaries in red, and the DY in green. The boxes represent the endmembers as defined in Sect. 2.6. The triangles with standard deviation show the mean ± standard deviation of Kolyma particulate organic carbon (POC, faded blue) and Y3, one of the tributaries, POC (faded red) samples of Bröder et al. (2020) for reference.
The δ13C of Kolyma POC ranges from −29.0 ‰ to −31.6 ‰ , and the Δ14C ranges from −221 ‰ to −379 ‰, corresponding to 1940 to 3760 years (Fig. 2). The δ13C values of the Kolyma transect correlate with POC % (the OC weight % of dried particulate matter; R2=0.91, p<0.01) and Δ14C (R2=0.79, p<0.01), in other words, samples with a high POC % have a more depleted δ13C value and a less negative (younger) Δ14C value, both supporting a significant contribution from riverine production. The tributary and Duvanny Yar samples are clearly different from those of the Kolyma in their isotopic signature of POC: the two Duvanny Yar POC samples are higher in δ13C (−25.5 ‰ and −26.3 ‰), and have a substantially lower Δ14C (−859 ‰ and −860 ‰; 15 700 years) than Kolyma POC, whereas the other tributaries (PAN, MA, BA, and Y3) show generally lower δ13C values (−31.3 ‰ to −33.5 ‰) and higher (i.e. younger) Δ14C values (−26 ‰ to −348 ‰; 145 to 3370 years) than Kolyma POC. The Δ14C-POC values in the Kolyma (K1–K6) are within the same range as Kolyma summer POC of 2013 and 2015 ( ‰, n=38; Bröder et al., 2020; Fig. 2), and slightly younger than the mean Kolyma summer POC between 2003 and 2011 ( ‰, n=32; McClelland et al., 2016).
These trends in δ13C and Δ14C in POC point towards the influence of a younger, more 13C-depleted source of OC in the Kolyma River and especially in the tributaries. A similar trend was found in Bröder et al. (2020), suggesting the influence of riverine primary production. In situ production of OC by fluvial organisms in Arctic rivers and streams has not received much attention, but frequently displays very low δ13C values (e.g., ‰ in Winterfeld et al. (2015a) Lena River; ‰ Ob and Yenisey rivers, Galimov et al. (2006); ‰ in Shakil et al. (2020), streams on the Peel Plateau). The lower δ13C values of heterotrophic OC are due to contributions of recycled CO2 that sources from terrestrial organic matter breakdown, which is already relatively low in δ13C (Meyers, 1994). Winterfeld et al. (2015a) applied a source-apportionment approach to Lena River POC in summer and found that primary production accounted for up to 80 % of the fluvial POC. This “recycled carbon” (Wild et al., 2019) appears to be an important component of summer POC transport, which is reflected in the overall 13C-depleted values in the Kolyma River and tributaries' POC pool (Fig. 2, and Sect. 3.3).
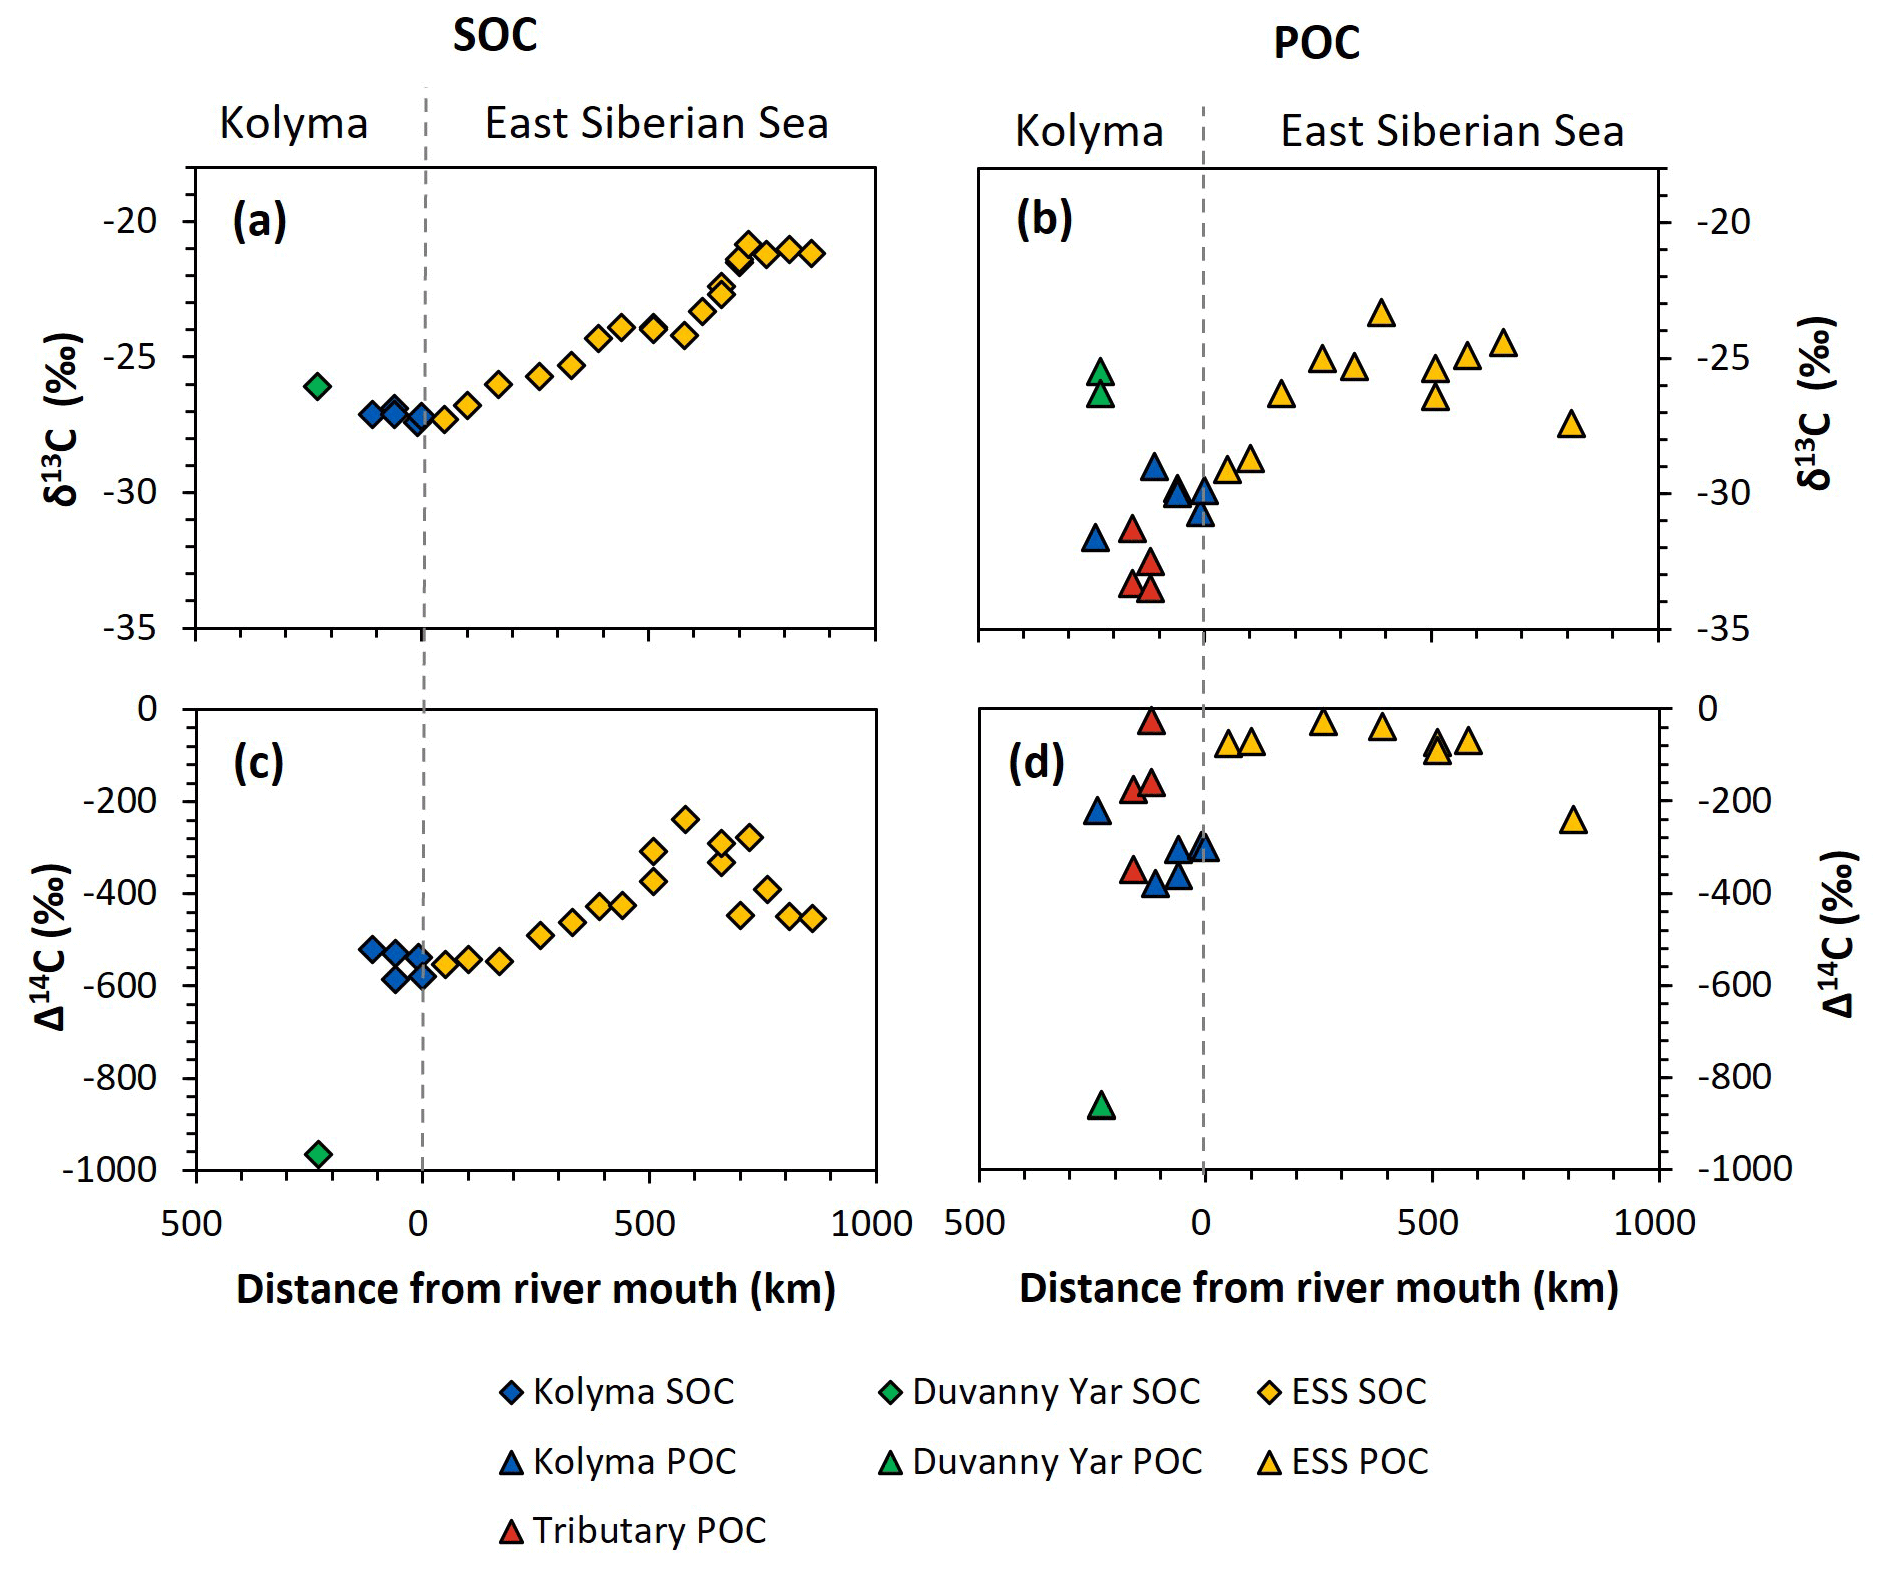
Figure 3Carbon isotopes over the transect distance, with the riverine part on the left side of each figure, and the marine part on the right. (a) δ13C ratio (in ‰ relative to VPDB) of Duvanny Yar (DY; green), Kolyma (blue), and East Siberian Sea (ESS; yellow) sediment organic carbon (SOC). (b) δ13C ratio of DY (green), Kolyma (blue), tributaries' (red), and ESS (yellow) particulate organic carbon (POC). (c) Δ14C ratio of DY, Kolyma, and ESS SOC. Lower Δ14C ratios indicate older OC. (d) Δ14C ratio of DY, Kolyma, tributaries', and ESS POC.
Comparing the carbon isotope data of fluvial POC collected in this study with surface water POC collected along the extended Kolyma River transect in the ESS shows a large difference between the terrestrial and marine samples (Figs. 2, 3b and d). The ESS POC is distinctly younger than the Kolyma POC: Δ14C values between −28 ‰ and −75 ‰ for the inner ESS and between −69 ‰ and −240 ‰ for the outer ESS, and similarly less negative δ13C: ranging from −23.3 ‰ to −29.1 ‰, with a trend towards higher values moving from the river mouth further offshore (Salvadó et al., 2016; Vonk et al., 2010a). This abrupt transition between fresh water and saline water POC composition is likely tied to the different phytoplankton communities present in these respective environments, as seen in other Arctic river deltas (e.g., Kraberg et al., 2013; Lena River delta).
We find that the Kolyma SOC is distinctly older (Δ14C of −521 ‰ to −586 ‰; 5850 to 7020 years) and shows less negative δ13C than POC, displaying a narrow range in δ13C values (−26.9 ‰ to −27.4 ‰) (Figs. 2, 3a and c). On the other hand, Kolyma River SOC is distinctly younger than the Yedoma permafrost material from Duvanny Yar (Fig. 2). The Yedoma permafrost sample DY PF shows an extremely low Δ14C value of −965 ‰ (26 800 years), and a slightly higher δ13C ratio than Kolyma POC-. The ESS SOC close to shore shows a similar age to the Kolyma SOC in this study, with a trend towards less negative Δ14C values further offshore (−624 ‰ to −332 ‰, Δ14C). In ESS SOC-δ13C, a trend can be seen moving from −27.1 ‰, close to the Kolyma SOC, towards higher δ13C values of −22.4 ‰ further offshore (Fig. 3a). This increase in δ13C and Δ14C values of POC and SOC moving from river to shelf is likely due to the increased contribution of marine PP OC to the SOC and POC pools further offshore, together with sorting and settling of terrestrial and permafrost-derived OC (Bröder et al., 2018; Tesi et al., 2014; Vonk et al., 2012), processes that will be discussed in more detail in the next sections.
3.3 Quantifying the sources of OC: End member mixing analyses
The Δ14C and δ13C signatures of POC and SOC can be used to quantify the relative contributions of different organic carbon sources (i.e., permafrost OC; vegetation/soil OC; riverine PP OC for the Kolyma and marine PP OC for the ESS) to these two carbon pools, following the method described in Sect. 2.6. We revisit the endmember mixing results from Vonk et al. (2012) for the ESS and from Wild et al. (2019) for the Kolyma River to connect river and shelf environments with the newly defined endmembers (see Sect. 2.6 for endmember definitions). Relative contributions of the different sources varied considerably between POC and SOC, and Kolyma and ESS (Fig. 4).

Figure 4Mean relative contribution (± standard deviation from Monte Carlo simulations) of three endmembers over transect distance for (a) surface water particulate organic carbon (POC) and (b) sediment organic carbon (SOC), based on dual carbon isotope (Δ14C and δ13C) endmember analyses. For the riverine part of the transect (Kolyma; left side of the figure), the endmembers are: Permafrost organic carbon (OC) in grey, Vegetation/soil OC in green, and Riverine primary production (PP) OC in cyan. For the marine part of the transect (East Siberian Sea; right side of the figure), the endmembers are: Permafrost OC in grey, Vegetation/soil OC in green, and Marine primary production OC in dark blue. Definition of the endmembers are described in Sect. 2.6 and can be seen Fig. 2.
Along the river transect, Kolyma River main stem POC consists largely of riverine PP OC (44±10 %), while the tributary POC shows even higher riverine PP OC contributions of 64±10 % (mean ± standard deviation). The contribution of vegetation/soil OC is roughly equal for POC and SOC, ranging from 18±14 % in Kolyma main stem POC, 15±11 % in tributary POC and 19±12 % in Kolyma SOC. Permafrost OC is the dominant source in Kolyma SOC (68±10 %), and the second largest contributor to the Kolyma main stem POC (38±8 %). As expected, the contribution of permafrost OC is highest in Duvanny Yar POC and SOC samples (93±4 %).
Source apportionment modelling on the Kolyma POC data from Bröder et al. (2020) shows that the mean contribution of permafrost OC to Kolyma POC is in the same range (38±9 %) as in this study over their whole sampling period (ranging from spring 2012 to fall 2015), while the contribution of vegetation/soil OC is slightly (26±16 %) higher, and the contribution of riverine PP OC is slightly (37±12 %) lower than in the samples of this study. This could be due to the timing of the sampling; Bröder et al. (2020) also include the early and late summer when riverine PP may not be high, while our study likely includes the peak of the riverine PP production. At tributary Y3, including this dataset, the contribution of permafrost OC is only 11±6 %. The bulk of the POC in Y3 comes from the other two sources: 51±19 % from riverine and 38±20 % from vegetation/soil, which is in line with the conclusion of Bröder et al. (2020), that the Y3 tributary does not have the erosional force to mobilize permafrost.
For the marine transect, the riverine primary production endmember was “replaced” with the marine primary production endmember, since marine primary production is absent in the river, and riverine primary production OC is thought to be rapidly recycled in a marine setting, which is supported by the rapid shift towards a higher δ13C ratio of POC in the first part of the offshore ESS transect. Marine primary production appears to be the dominant source of POC in the ESS, supplying roughly half of the OC along the entire ESS transect (47±12 %). Furthermore, we find similar results as Vonk et al. (2012, 2010a) for ESS SOC: an increase in the contribution of marine PP OC (from 10 % to ∼50 %; Fig. 4b), and a steady decrease of the two terrestrial endmembers farther offshore. Notably, the permafrost OC endmember remains the dominant source of OC up to 500 km offshore, decreasing from 70 % to ∼40 %, before marine PP OC becomes dominant. Note that we have not incorporated lateral transport times of sediment OC (estimated up to 3600 years. across the Laptev shelf; Bröder et al., 2018) that affect all terrestrial OC during sedimentary transport. In contrast, for POC we find an initial sharp decrease in the contribution of permafrost OC, from ∼40 % in the Kolyma River to ∼10 % at the first transect point offshore (Fig. 4a), remaining around 10 % for the entire length of the transect. Likely, the permafrost OC consists mostly of mineral-bound OC, material that has been shown to rapidly settle in the near-shore region (Jong et al., 2020; Karlsson et al., 2011; Vonk et al., 2010b), which may explain the high permafrost contribution to the SOC pool and rapid decrease of permafrost OC in the POC pool. On the contrary, primary production biomass and organic debris is not mineral-bound and can be transported over long distances (Karlsson et al., 2011; Vonk et al., 2010b; Tesi et al., 2016), which is reflected in the relatively high contributions of these pools in the POC of the ESS.
3.4 Sources of OC: lignin biomarker concentrations and proxies
Terrigenous biomarkers such as lignin derived phenols, cutin-derived hydroxy fatty acids and HMW n-alkanoic acids can be used to further trace the source, pathway, and fate of OC in rivers and in the marine environment (e.g., Freymond et al., 2018; Tesi et al., 2014). The lignin content, either normalised to OC content (as mg g−1 OC) or to mineral surface area (as µg m−2), refers to the sum of vanillyl (V), syringyl (S) and cinnamyl (C) phenols, and is an indicator for the contribution of higher vascular plant material to the total organic matter pool (Goñi and Hedges, 1992). The ratios between lignin phenol groups S V and C V can be used for tracing the various types of plants generating these phenols (Hedges and Mann, 1979). These lignin source proxies have been extensively used to characterize and trace different pools of OC on land, in rivers and in the marine environment (e.g., Amon et al., 2012; Goñi et al., 2000).
The lignin concentrations in DOC of the Kolyma transect range from 1.70 to 5.11 mg g−1 OC (Table 3), and the DOC lignin concentration in the four tributaries (MA, PAN, Y3 and BA) are in the same range as the Kolyma transect (3.61 to 5.62 mg g−1 OC). These are in the same range as earlier results in the Kolyma River (4.7 mg g−1 OC; Feng et al., 2017; 6.5 mg g−1 OC Amon et al., 2012). Sample DY TS is a notable exception, with a higher lignin concentration of 11.79 mg g−1 OC. For the ESS, only a few dissolved lignin concentrations are published, and they are an order of magnitude lower than in the Kolyma River, at roughly 0.2 mg g−1 OC at four points in the outer ESS (Salvadó et al., 2016). Lignin concentrations in Kolyma SOC (<63 µm) range from 6.46 to 14.87 mg g−1 OC, which is clearly higher than in DOC, but lower than in the first two sampling points in the ESS (not sieved; 28.40 and 16.00 mg g−1 OC; Salvadó et al., 2016). Farther offshore, the lignin concentrations in SOC gradually decrease to 0.10 mg g−1 OC, indicating a decreasing influence of terrestrial biomass on the total OC pool, which is supported by the bulk C isotopes (Salvadó et al., 2016).
A similar pattern is evident in cutin concentrations. For the Kolyma transect, they range from 0.40 to 1.35 mg g−1 OC for DOC and 2.18 to 5.67 mg g−1 OC for SOC. The cutin concentrations of the four tributaries are in the same range (0.52 to 1.23 mg g−1 OC) as for Kolyma DOC, while in the Duvanny Yar thaw stream (DY TS) the concentrations are much higher at 4.79 mg g−1 OC. The cutin to lignin ratio is higher for SOC than for DOC in the main Kolyma samples (0.40±0.12 versus 0.21±0.11, respectively; Fig. A3), which could be due to a methodological bias: the SOC cutin to lignin ratio could be artificially raised by the sieving step while processing the sediments, thus the lignin-rich organic debris could remain in the coarse fraction (Tesi et al., 2016).
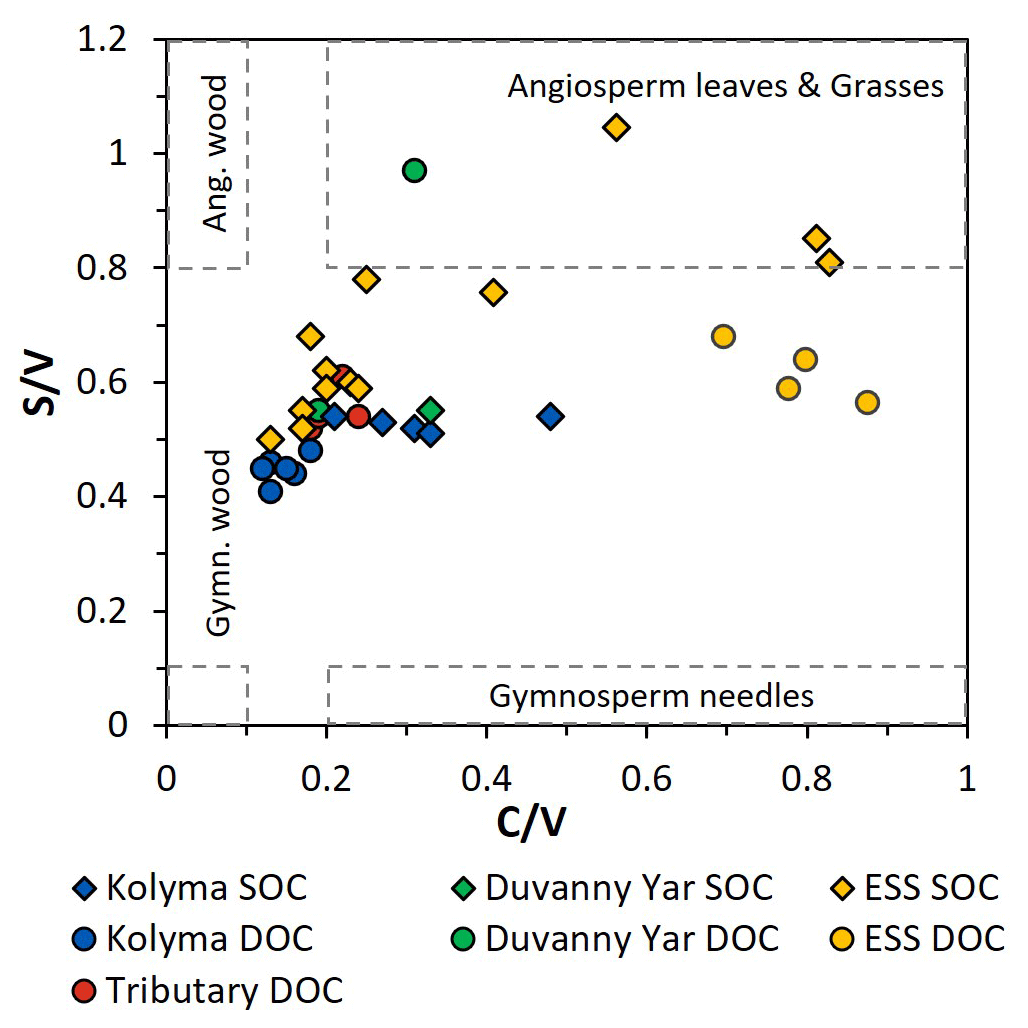
Figure 5The ratios between syringyl vanillyl (S V) and cinnamyl vanillyl (C V) can be used as biomarker source proxies for sediment organic carbon (SOC; diamonds), dissolved organic carbon (DOC; circles) from the Kolyma River (blue), Duvanny Yar (green), East Siberian Sea (ESS; yellow) and a few smaller tributaries of the Kolyma (red). Ranges for vegetation and tissue types (boxes) are based on Goñi et al. (2000).
To further pinpoint the source of higher plant-derived OC, ratios between lignin phenol groups (C V and S V) can be used to distinguish different vegetation sources: woody versus non-woody material and gymnosperm versus angiosperm material (Hedges and Mann, 1979; Goñi and Hedges, 1992; Goñi and Montgomery, 2000). The S V and C V ratios show fairly consistent values for the Kolyma transect DOC, with an S V ratio of 0.41 to 0.48 and a C V ratio of 0.12 to 0.18 (Fig. 5). For the Kolyma SOC, the S V and C V ratios are slightly higher than those for DOC (0.51 to 0.54 and 0.21 to 0.48). These ratios indicate a roughly equal mix of gymnosperm and angiosperm material in both DOC and SOC within the Kolyma main stem (Fig. 5), and an equal mix of woody and non-woody material in DOC. This is in accordance with earlier studies on the sources of DOC in the Kolyma River (Amon et al., 2012), and indicative of the mixed vegetation of the Kolyma watershed (taiga- and tundra vegetation). The DOC sample DY TS appears to consist completely of non-woody angiosperm organic matter, with very high S V and C V ratios of 0.97 and 0.31, respectively. However, the DOC sample at DY KOL and the permafrost SOC sample DY PF show to be more of a mix of angiosperm and gymnosperm soft tissue material (S V 0.55, C V 0.33), in the same range as Kolyma SOC and DOC, and in line with other studies on Yedoma deposits (Winterfeld et al., 2015b; with 0.51–1.24 for S V and 0.27–1.07 for C V, Lena Delta Pleistocene and Holocene deposits).
3.5 Sorting and degradation of OC along the land-ocean continuum: OC and biomarker loading
Changes in surface area normalized concentrations (i.e., loadings) of terrestrial OC at bulk and molecular level, measured across coastal shelves (e.g., Tesi et al., 2016; Bröder et al., 2018) and along riverine transects (e.g., Freymond et al., 2018), provide means to quantify loss of OC due to degradation (Aller and Blair, 2006; Keil et al., 1997). Due to the large variability in hydrodynamic conditions and heterogeneous sediments found within a river, and even more so along a river to shelf transect, it is necessary to trace a specific fraction (e.g., through a consistent method of sediment fractionation) to be able to directly compare sediments across dynamic land-ocean transects. Mineral SA normalization is useful for the fraction high in mineral-bound OC (generally the <63 µm fraction: silt and finer), but works less well on sediment with either large fractions of non-mineral bound carbon (e.g., loose organic debris) or material low in mineral-bound OC (e.g., coarse sand). In addition, the <63 µm fraction is the most easily transported fraction of sediment in rivers, even at lower flow velocities, and is thus the fraction that is transported farthest offshore, as coarse organic debris and sand quickly settles near the coasts (Tesi et al., 2016; Wakeham et al., 2009).
The SA-normalised OC-loadings of the <63 µm river sediment range from 0.54 to 0.85 mg OC m−2, with no apparent trend along the main stem transect. These OC loadings are within the range of typical river-influenced sediments (0.4–1.0 mg OC m−2; (Keil et al., 1994; Mayer, 1994; Blair and Aller, 2012), and similar to OC loadings found in other river systems (Freymond et al., 2018; Danube River; similar sediment sampling protocol). The loading of OC on Kolyma sediment is on average higher than for the surface sediments of the ESS (Bröder et al., 2019; 0.19 to 0.46 mg OC m−2), and a decreasing trend in OC loadings can be seen with increasing distance from land/water depth, suggesting that loss of mineral-bound OC occurs during offshore transport (Keil et al., 1997).
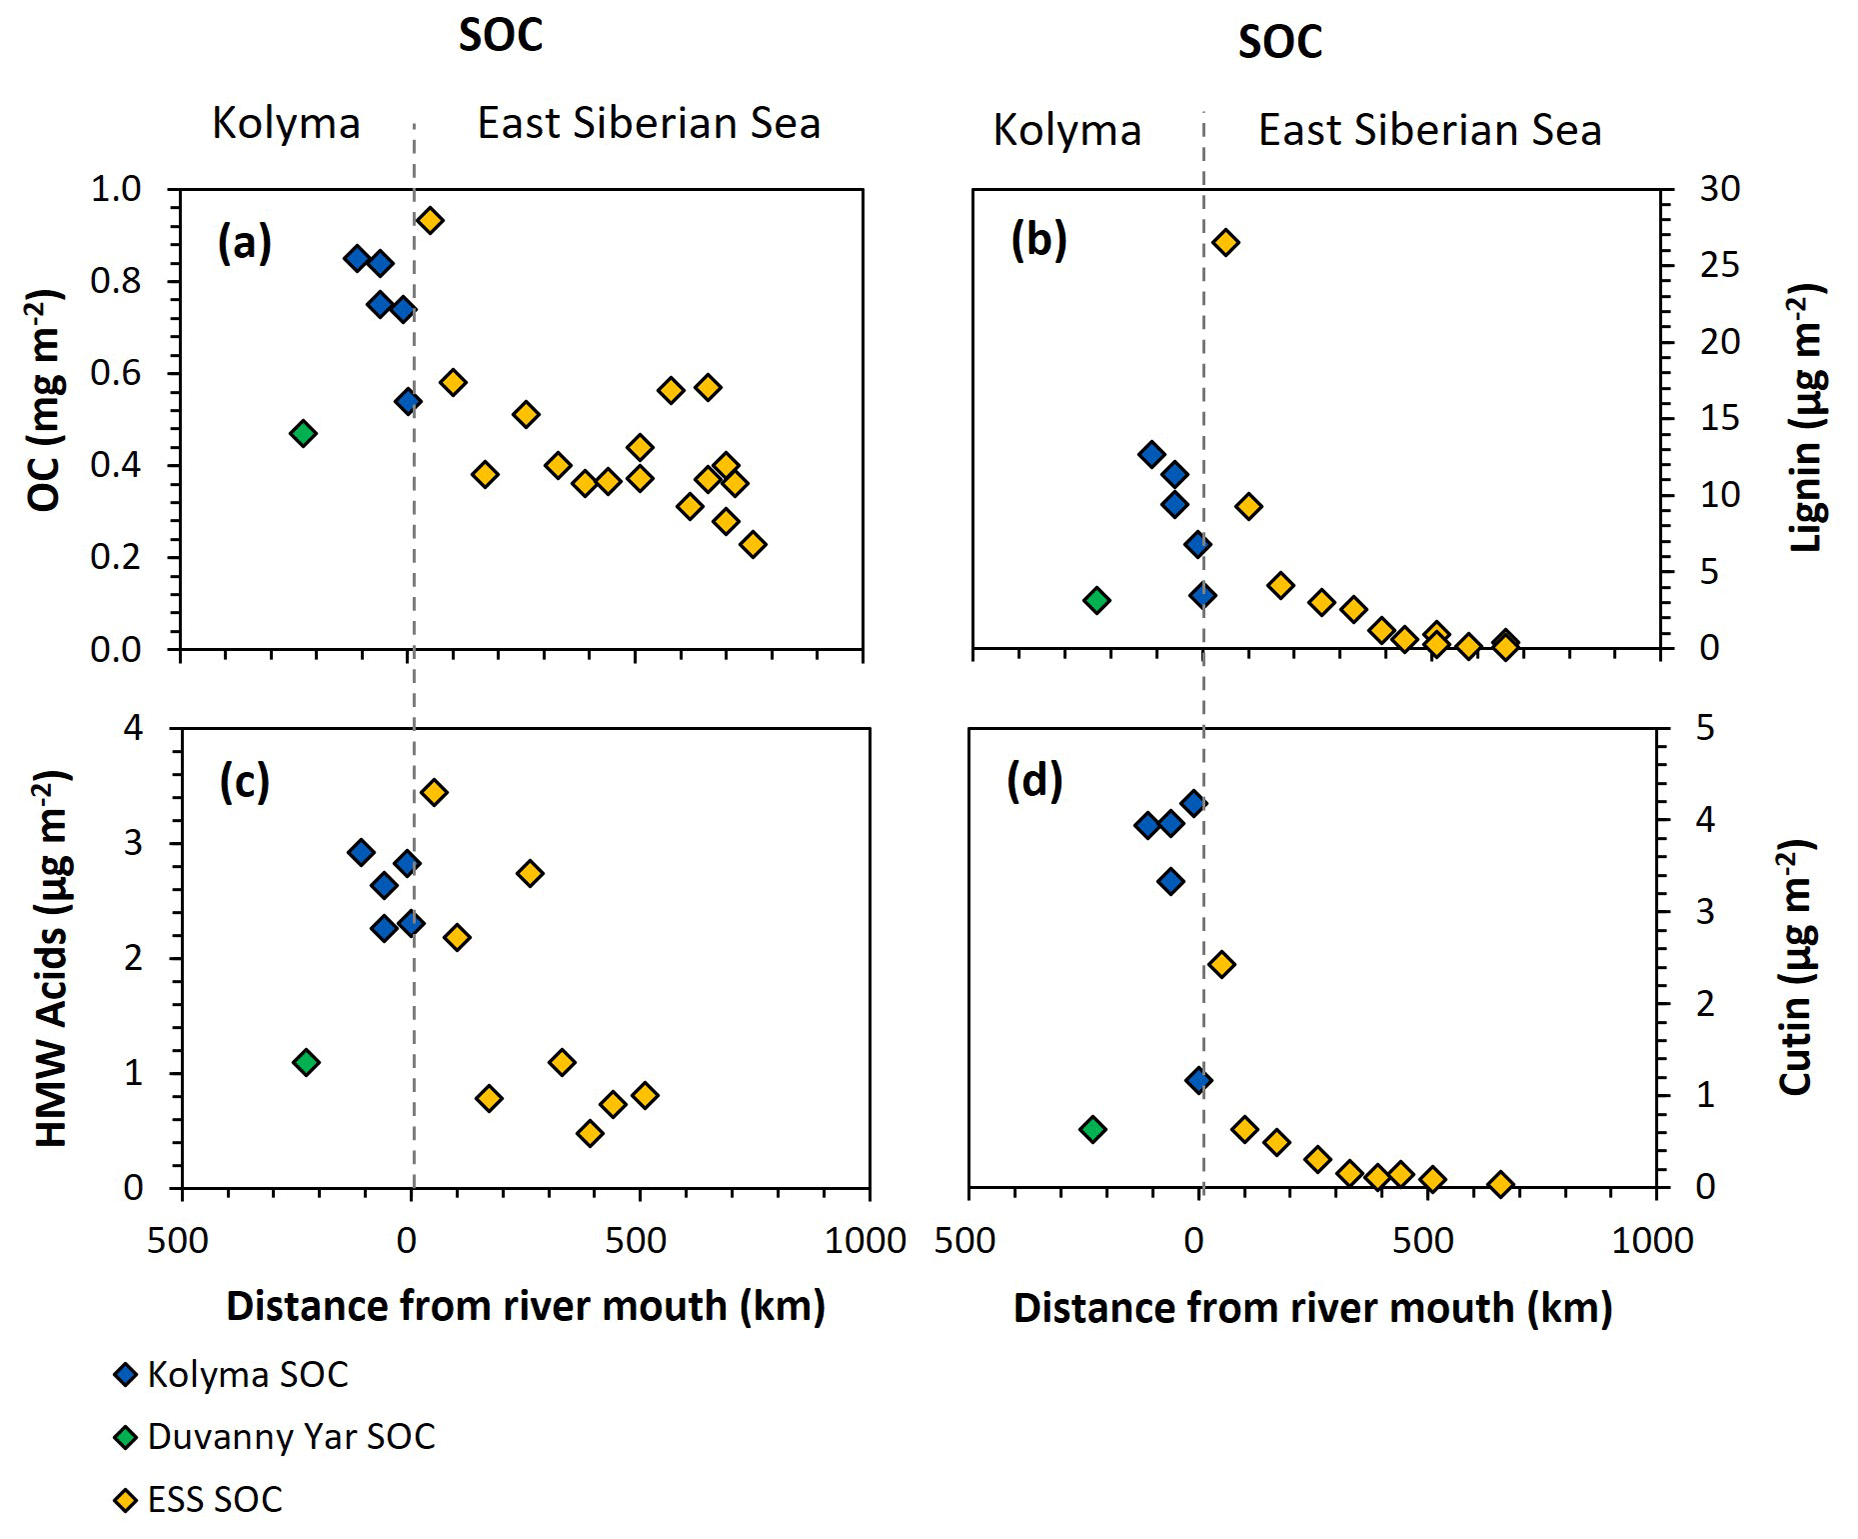
Figure 6Organic carbon (OC) and biomarker concentrations normalised to mineral surface area over transect distance for the Kolyma (blue), Duvanny Yar (green), and East Siberian Sea (ESS; yellow) sediment organic carbon (SOC) samples. (a) OC concentrations (mg m−2), (b) Lignin concentrations (µg m−2), (c) Cutin concentrations (µg m−2), and (d) HMW n-alkanoic acids (C24–C30) concentrations (µg m−2).
For biomarkers, the SA-normalized lignin concentrations of Kolyma River sediment vary between 5.13 and 12.67 µg m−2 (Fig. 6b), while the SA-normalized cutin concentrations are lower, ranging between 1.17 and 4.18 µg m−2 (Fig. 6c). The SA-normalised HMW acid concentrations are between 2.26 and 2.92 µg m−2 (Fig. 6d). For Duvanny Yar, the OC and biomarker loadings are lower than for Kolyma sediments, due to the combination of high SA and lower OC and biomarker concentration. Freymond et al. (2018) found HMW n-alkanoic acid loadings of 0.4–1.5 µg m−2, and lignin loadings between 0.6 and 26.4 µg m−2 in sediments from the Danube River and its tributaries, using the same sampling and similar extraction methods, which is on the same order of magnitude as for the Kolyma River.
Along the ESS transect sediments, a sharply decreasing trend in lignin loadings was found in earlier studies (Karlsson et al., 2011; Tesi et al., 2014; Vonk et al., 2010a), from 28.4 µg m−2 near the coast down to 0.1 µg m−2 on the outer shelf (Fig. 6b), and a similar trend for cutin, from 2.4 to 0.1 µg m−2 (Fig. 6d), and HMW acids from 3.4 to 0.8 µg m−2 (Fig. 6c). When comparing the marine end of the riverine transect with the shallowest sample of the marine transect, the lignin and cutin concentrations seem disconnected at this riverine-marine interface: the lignin loadings of the riverine sediment samples appear lower than expected while the cutin concentrations appear higher than expected, which is also reflected in the cutin/lignin ratios (Fig. A3). Only the riverine HMW n-alkanoic acid concentrations align well with the beginning of the marine transect. This discrepancy in behaviour of different biomarkers could be due to their different affinity towards mineral particles. We recognise that we are comparing sieved (<63 µm) riverbed samples with non-sieved (bulk) marine samples, but as Tesi et al. (2016) showed that 88 %–95 % of the marine sediments in the eastern part of the ESS consist of the <63 µm fraction, we do not expect this size difference to be the main contributor to the observed discrepancy. Instead, earlier sediment partitioning studies that fractionated sediments by both density and size, found that lignin is mostly present in the low-density fraction (<1.8 g mL−1) as coarse organic debris (Wakeham et al., 2009; Tesi et al., 2016). It is true that low-density material is often relatively large in size, which in our case (sieving river sediments through 63 µm) places low density material in the coarse fraction. This may explain the lower concentrations of lignin for the riverine transect. In contrast, cutin-derived acids are more closely associated to fine mineral particles, and HWM n-alkanoic acids are more evenly distributed among sediment fractions (Tesi et al., 2016), explaining the better match of these two biomarker groups in comparing Kolyma <63 µm sediment to the ESS transect.
Freymond et al. (2018) propose normalizing OC and biomarkers to SA as the benchmark for comparing river and marine sediments. However, our results point out that this approach seems to work only for certain biomarker groups, since the method we apply based on Freymond et al. (2018), appears to underestimate lignin and overestimate cutin concentrations. Therefore, we propose to use sediment fractionation methods not purely on size but also on density, and to apply these techniques consistently for all samples, ideally along transects that stretch across the entire river to shelf continuum. While multiple fractionation steps are often time and labour intensive, our results suggest that fractionating only by size (i.e., sieving over 63 µm) is not enough to completely resolve sorting and degradation dynamics of terrestrial OC across the dynamic land-ocean interface, since certain biomarker groups have affinity for different (density) fractions of the sediment.
3.6 Degradation state of OC along the land-ocean continuum: biomarker proxies
The relative abundances of specific lignin phenol compound classes can be used as proxies for the overall degradation status of organic carbon, for instance, the acid aldehyde ratios of vanillyl (Vd Vl) and syringyl (Sd Sl) phenols are often used as an indicator for degradation of plant organic matter (Hedges et al., 1988; Opsahl and Benner, 1995). More degraded lignin yields more acids relative to aldehydes in the CuO extraction process, which is reflected in a higher Vd Vl and Sd Sl ratio. However, these ratios are also influenced by leaching and adsorption processes (Hernes et al., 2007). Another CuO-oxidation product that is frequently used as a degradation indicator is 3,5-dihydroxybenzoic acid (3,5Bd), due to the recalcitrant nature of 3,5Bd, the ratio 3,5Bd V increases with OC degradation in soils and sediments (Houel et al., 2006). In addition to CuO-oxidation products, the ratio between odd and even HMW n-alkanoic acids, the carbon preference index (CPI), can be used as a degradation proxy. The CPI is indicative of organic matter maturity, since fresh plant material has a strong even-over-odd preference for n-alkanoic acids (Freeman and Pancost, 2014; Eglinton and Hamilton, 1967), which is lost with ongoing degradation. Thus, organic matter with lower CPI values is considered to be more degraded.
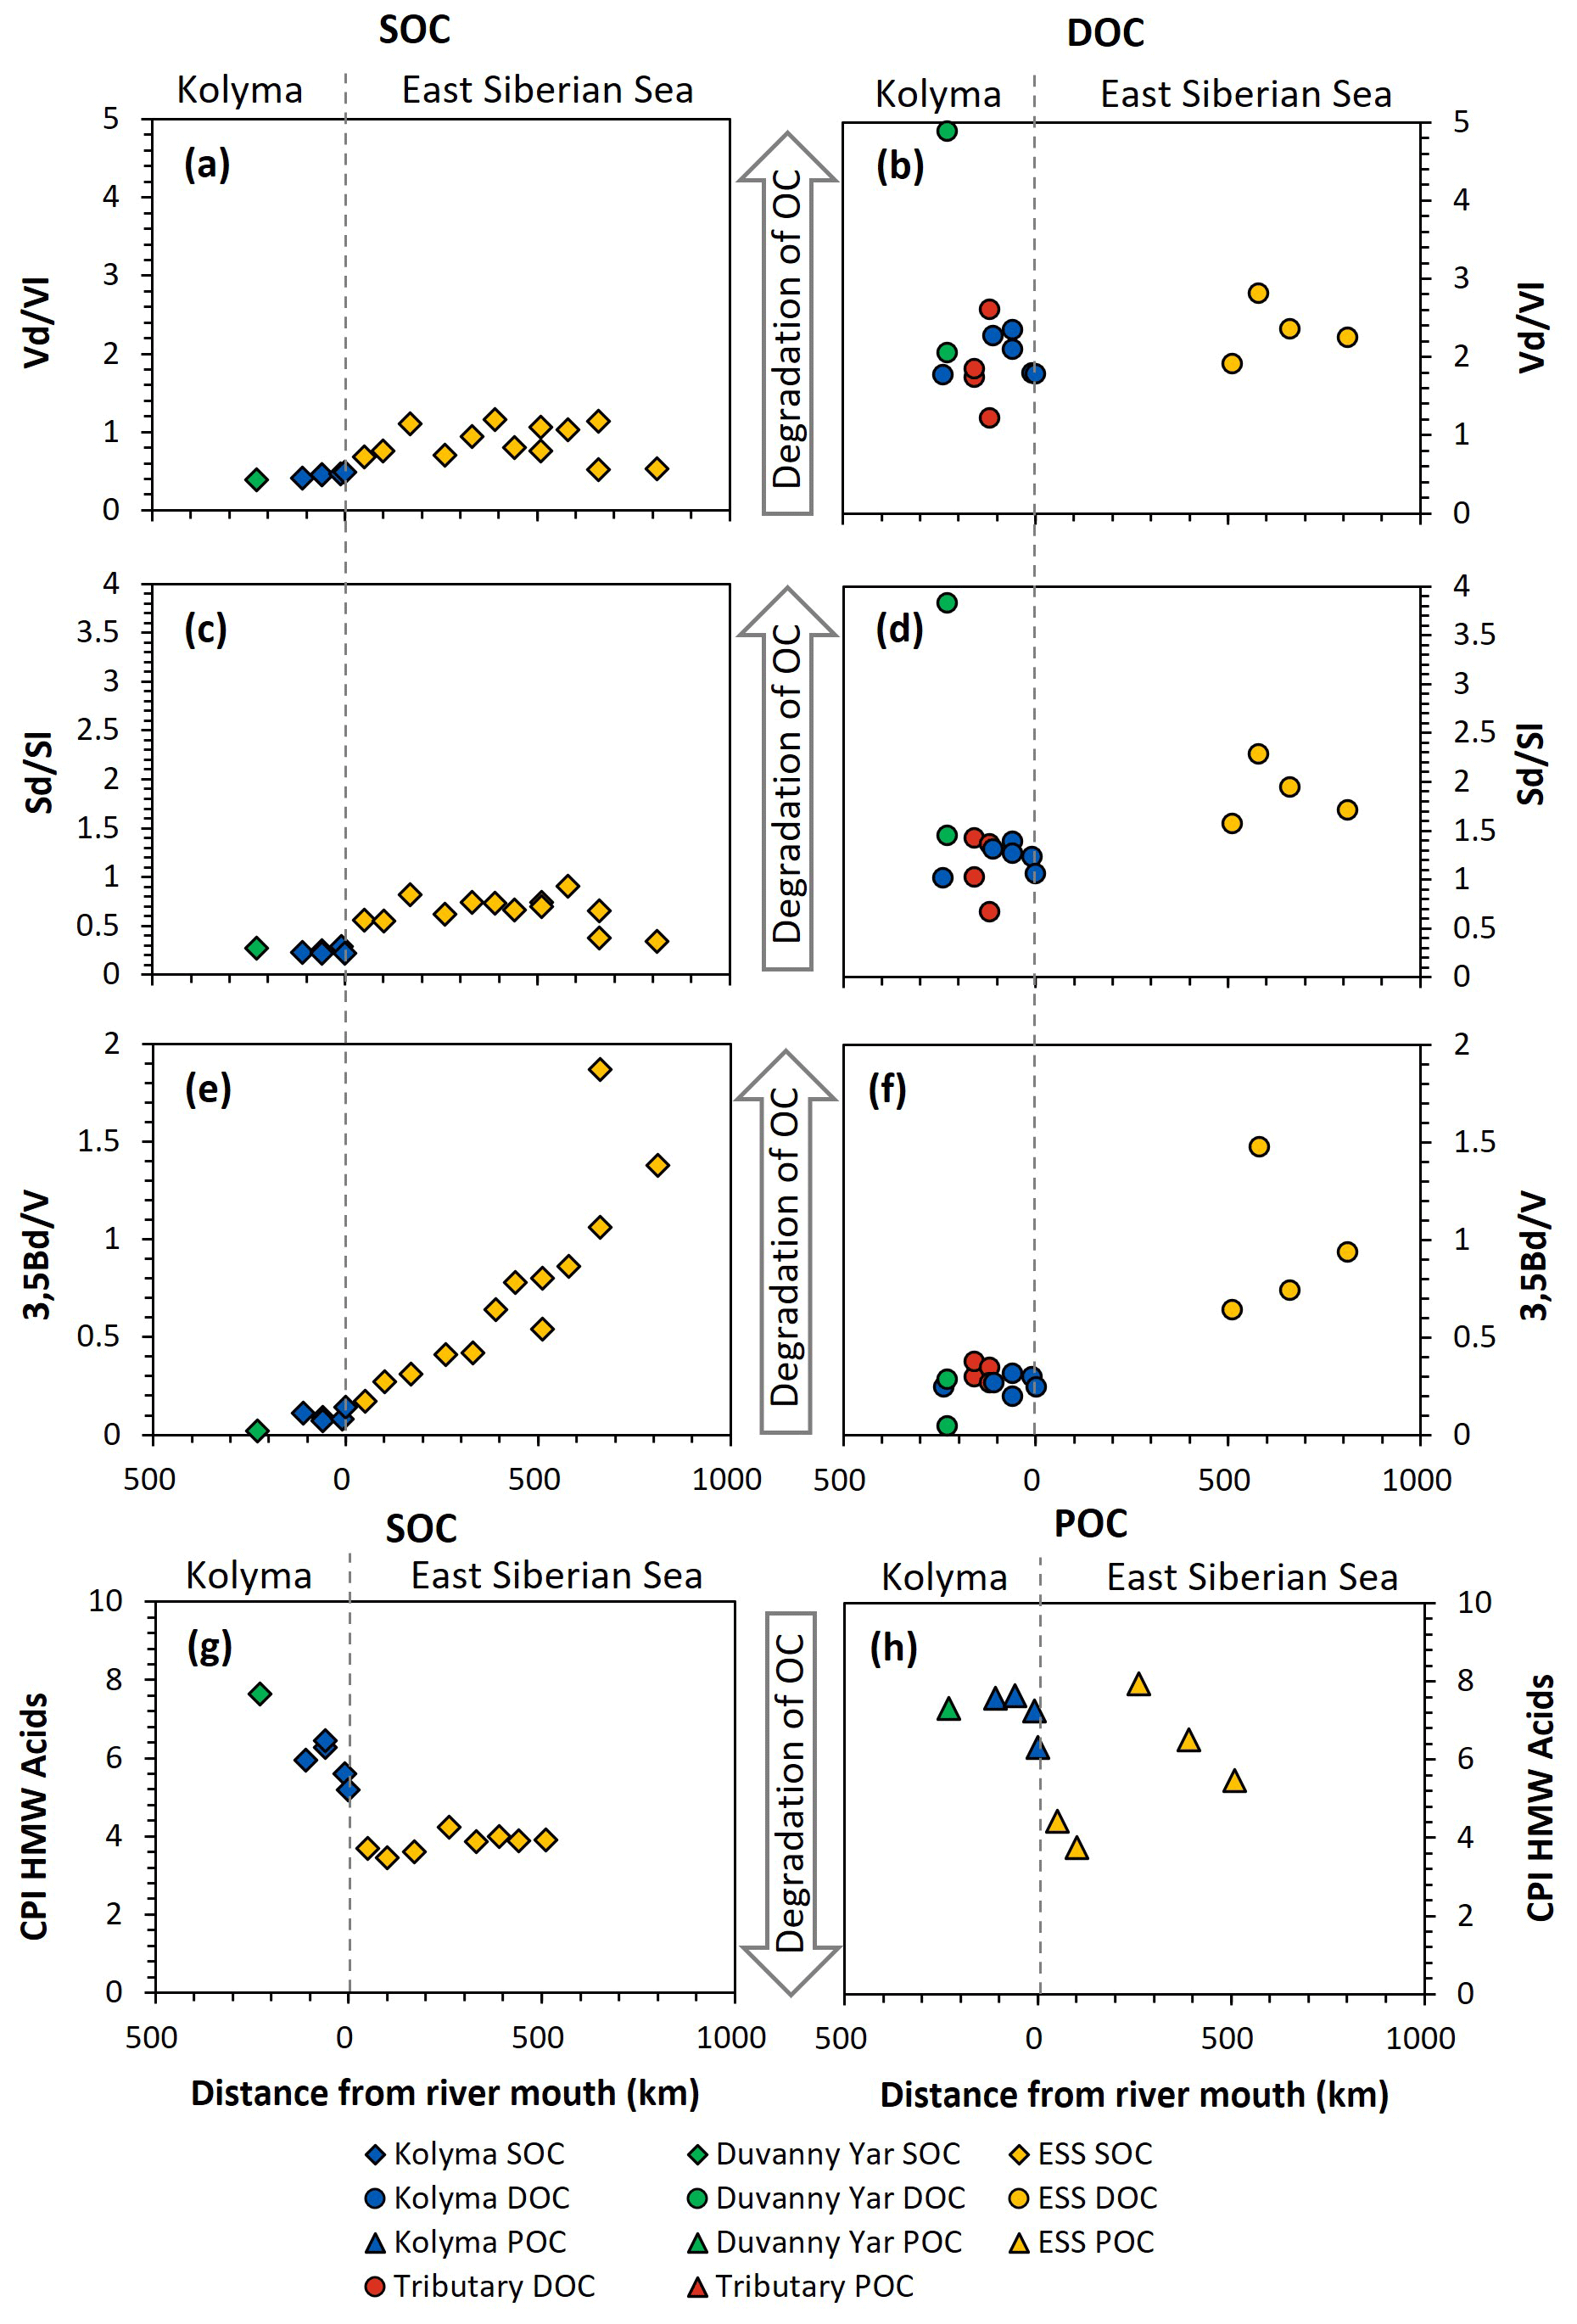
Figure 7Biomarker degradation proxies of sediment organic carbon (SOC; diamonds), dissolved organic carbon (DOC; circles) and particulate organic carbon (POC; triangles) from the Kolyma River (blue), Duvanny Yar (green), East Siberian Sea (ESS; yellow) and a couple smaller tributaries of the Kolyma (red) over transect distance. For visual aid the arrows in the middle point towards more degraded values. (a) Acid aldehyde ratio of Vanillyl phenols (Vd Vl) of SOC, and (b) of DOC. (c) Acid to aldehyde ratio of Syringyl phenols (Sd Sl) of SOC, and (d) of DOC. (e) 3,5Bd V ratio of SOC, and (f) DOC. (g) the carbon preference index of HMW n-alkanoic acids (C24–C30) of SOC, and (h) of POC.
SOC and DOC in the Kolyma River display distinctly different Vd Vl and Sd Sl ratios. The SOC shows low values of Vd Vl and Sd Sl, ranging from 0.21 to 0.48 and 0.39 to 0.47, respectively (Fig. 7a and c), indicating that SOC is relatively fresh and not degraded. In contrast, the DOC shows higher values, indicating more degradation, with Vd Vl ranging from 1.77 to 2.35, and Sd Sl ranging from 1.06 to 1.39 (Fig. 7b and d). Similarly, the 3.5Bd V ratios are lower for Kolyma SOC (0.07–0.14) than for DOC (0.20 to 0.32) (Fig. 7e and f). In the tributaries, a wider range of Sd Sl and Vd Vl ratios was found in DOC, ranging from 0.67 to 3.83 and from 1.22 to 4.89, respectively. Notably, the Yedoma thaw stream (DY TS) shows the highest Vd Vl and Sd Sl ratio, and, in contrast, the lowest 3,5Bd V ratio among all DOC samples, meaning it is fresh in terms of 3,5Bd V, but degraded according to Vd Vl and Sd Sl. The CPI of HMW n-alkanoic acids, measured in SOC and POC, is slightly lower (i.e., more degraded) in SOC (5.20 to 6.45) than in POC (6.32 to 7.63) in the Kolyma River, while sample DY PF shows a higher (i.e., fresher) CPI of 7.65 (Fig. 7g and h). In an earlier study on Yedoma permafrost (or “ice complex deposits”) in the Lena Delta (Sánchez-García et al., 2014), a wide range of CPI values was found, between 3.0 and 12.0. The CPI of HMW n-alkanoic acids of Sánchez-García et al. (2014) (mean of 6.6±2.7, n=17) is however very close to our sample DY PF. For two POC samples (K1 and K4), odd HMW n-alkanoic acid concentrations were below the detection limit, so the CPI of these two samples could not be calculated.
Table 3Molecular biomarker data for sediment organic carbon (SOC), dissolved organic carbon (DOC), and particulate organic carbon (POC).
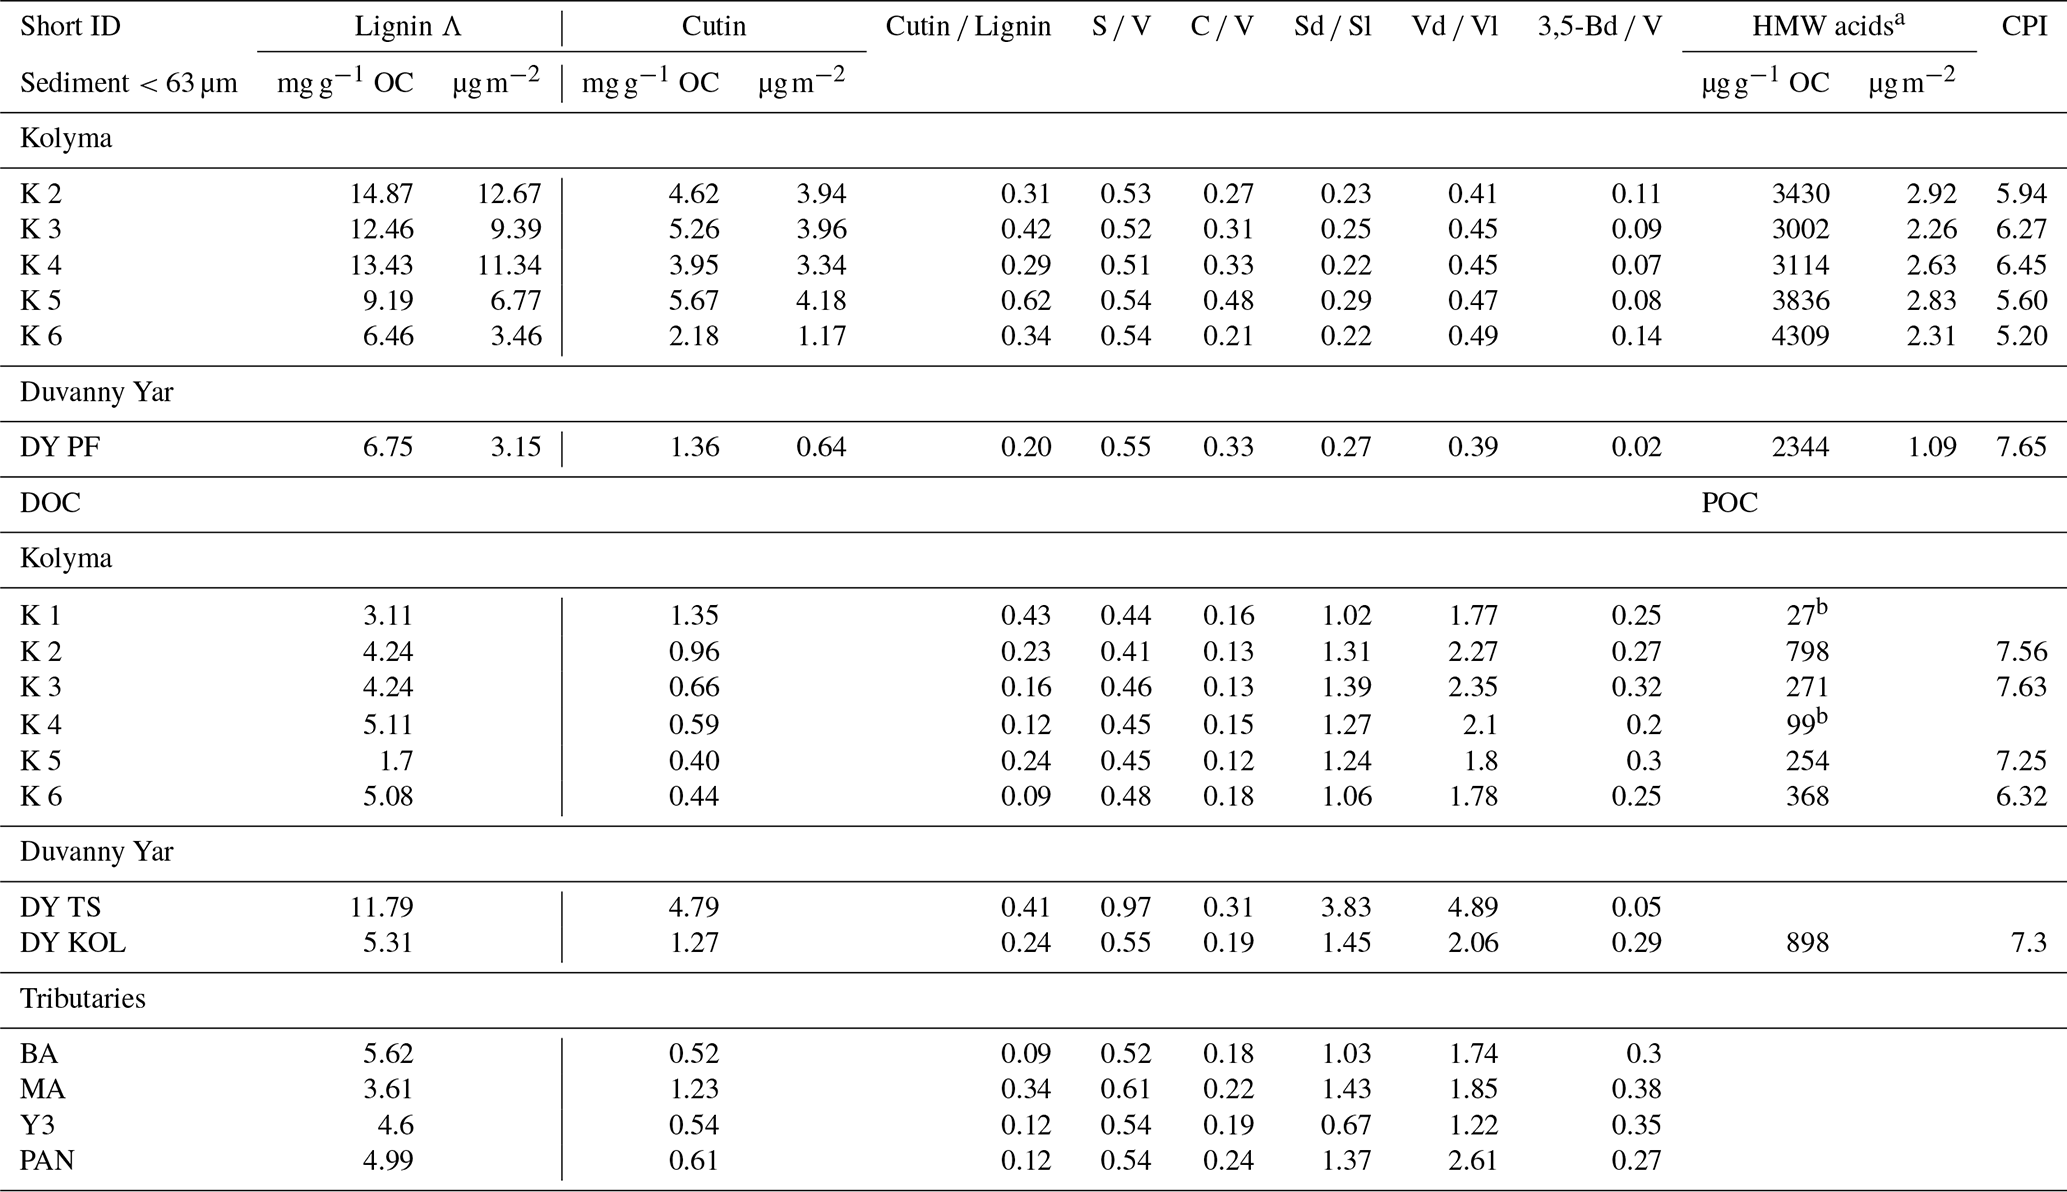
a HMW n-alkanoic acids with chain lengths C24–C30. bNot enough to calculate CPI
When connecting the Kolyma transect to the ESS, both the Vd Vl, Sd Sl and 3,5Bd V ratios are consistently higher in ESS sediments than in Kolyma sediments (Fig. 7a, c, e). While Vd Vl and Sd Sl show no clear trend across the entire transect, the trend in 3,5Bd V appears to connect well with the riverine transect, with increasing ratios (i.e., more degraded OC) farther offshore. For DOC, data from the outer ESS show similar Vd Vl ratios, and slightly higher Sd Sl and 3,5Bd V ratios than riverine DOC (Fig. 7b, d, f). The CPI of ESS SOC clusters around ∼4 (Fig. 7g), which is considerably lower (i.e., more degraded) than Kolyma SOC. For POC, the CPI does not show a clear trend across the river-shelf transect (Fig. 7h), however, it remains higher (i.e., fresher) than SOC, which is in line with the results of Salvadó et al. (2016).
Our results for all four degradation proxies (Vd Vl, Sd Sl, 3.5Bd V, and HMW n-alkanoic acid CPI) in the sedimentary OC pool suggest that riverine SOC is less degraded than its marine counterpart, likely due to the relatively short residence time of SOC in rivers (years to decades; Repasch et al., 2021; Hilton et al., 2015), as compared to SOC in shelf sediments (centuries to millenia; Bröder et al., 2018). Additionally, we found that within the river there is relatively little change with distance downstream, and, similarly, the changes over distance on the marine side are limited or very gradual. However, on the relatively short (ca. 30–50 km) transition zone between the freshwater system and the marine system there is a large change in most measured dissolved, particulate and sedimentary parameters.
When one looks at patterns across different pools such as DOC versus SOC or POC versus DOC, the patterns are more ambiguous. This is likely caused by (i) a variety of processes such as leaching, sorption or fractionation that are at play between these pools, in addition to (ii) the temporal aspect that is different for DOC and POC (daily to seasonal snapshots) than SOC (integrating several years to decades). Generally, however, we can say that SOC and POC appear relatively fresh (despite having a high radiocarbon age) and DOC appears more degraded (yet with a lower radiocarbon age), as is also found in previous studies (Feng et al., 2017; Goñi et al., 2000; Salvadó et al., 2016; Tesi et al., 2014; Vonk et al., 2013, 2010a). The SOC pool is the main (temporary) storage place for permafrost thaw-derived OC, and we propose to devote more scientific attention to the physical and chemical processes affecting the transport and degradation of this fraction, as eventually this will determine the fraction of permafrost OC that can be captured for long term-burial.
The aim of this study was to use an integrated approach to investigate the changes of different phases of OC (dissolved, particulate and sediment OC), and the effect of fractionation and degradation on permafrost-derived OC during transport over large distances along the land-ocean continuum. We conclude that permafrost-derived OC makes up the bulk of the total SOC along the source-to-sink system, and accounts for a significant part of the POC in the Kolyma River. In contrast, the contribution of permafrost-derived OC is marginal to POC in the marine realm and to DOC across the entire transect, despite the presence of 14C depleted sources within the watershed. Overall, this highlights the importance of accounting for all carbon pools in order to allow for comparisons between fluvial and marine systems across different temporal scales.
We found a decrease in OC and terrigenous biomarkers normalised to sediment mineral surface area across the transect, indicating loss through degradation of terrestrial OC over transport distance, and especially pronounced changes in the transition zone between the freshwater and marine realm. Molecular biomarker proxies indicating OC degradation show a remarkably “fresh” biomarker signature for SOC, despite its generally lower Δ14C values (i.e. older) than DOC and POC. Biomarker degradation proxies along the land-ocean continuum generally compare well between river samples and marine samples, yet show diverse degradation patterns when comparing between different OC pools (e.g., DOC versus SOC). Processes such as leaching and sorption, causing transfer of OC between DOC and POC pools, may explain some of the patterns we observed, in addition to the contrasting timescales that these pools represent (from days to years). We therefore want to emphasize that an integrated approach is necessary to obtain a complete picture of OC transport along the river-ocean continuum, and recommend to (a) minimally compare one pool (e.g., SOC) across land-ocean transects, and ideally (b) compare all pools (SOC, POC, DOC) consistently across land-ocean transects. Furthermore, as we here have shown that permafrost-derived OC is mostly transported within the SOC fraction, we recommend increasing scientific focus on the sedimentary fraction when studying the fluvial and marine fate of permafrost OC.
Finally, we want to acknowledge that large discrepancies remain between the freshwater and marine research fields when studying OC dynamics as marine studies seem to focus mostly on SOC, while river studies mostly target DOC. It is necessary to connect these two environments and make sure to (i) apply common consistent methodology, and (ii) increase emphasis on the dynamic terrestrial-marine transition zone in order to completely resolve the fate of terrestrial OC along river-shelf systems.
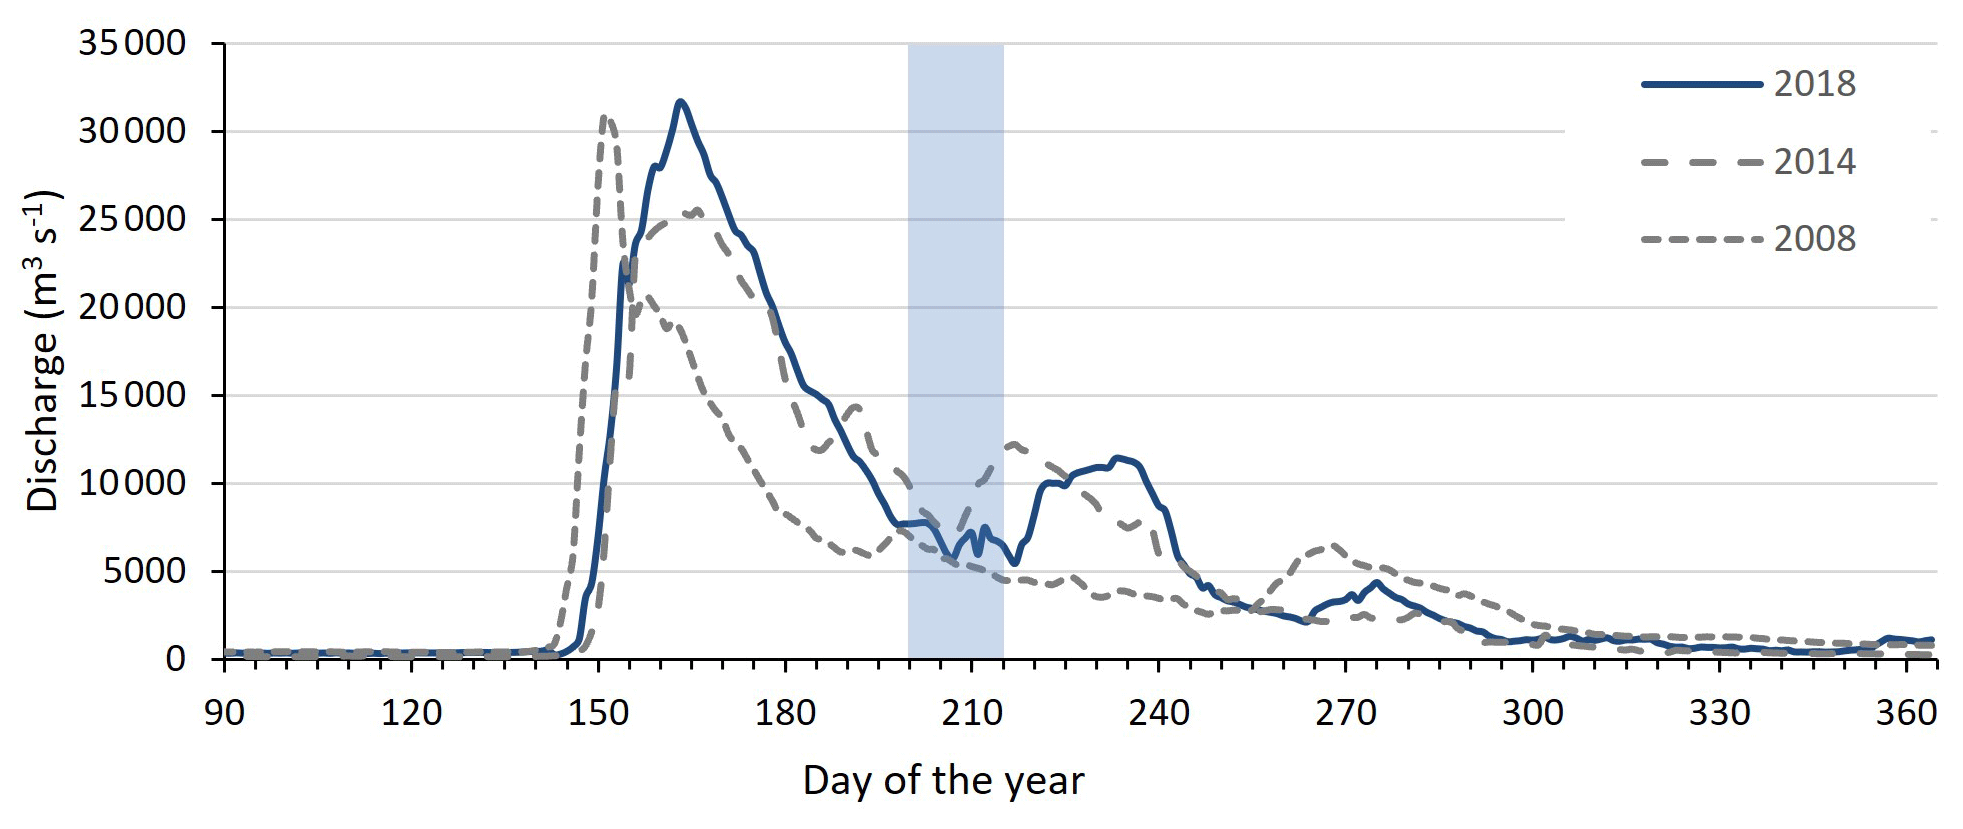
Figure A1Discharge of the Kolyma River at Kolymskoye, about 40 km upriver of sampling point K 1, in 2018 (Shiklomanov et al., 2021, Artic GRO dataset). Sampling period of this study highlighted in blue, directly after spring freshet. In grey dotted lines the discharge of the Kolyma River during the 2008 and 2014 East Siberian Sea sampling campaigns for comparison.
Table A1East Siberian Sea (ESS) sample locations, names, and distance from the mouth of the Kolyma River for sediment samples, surface water dissolved organic carbon samples (DOC) and surface water particulate organic carbon samples (POC). Data used in this study was gathered from four earlier publications: Bröder et al. (2019), Salvadó et al. (2016), Tesi et al. (2014), Vonk et al. (2010a). Specifically, Tesi et al. (2014) and Vonk et al. (2010a) have characterized surface water DOC and POC in the ESS, along with underlying surface sediments, following the paleo river valley of the Kolyma up to 600 km offshore, collected on 3–5 September 2008, and data from a more recent cruise (between 31 July and 4 August 2014) are used to extend this transect up to 1000 km offshore (Bröder et al., 2019; Salvadó et al., 2016).
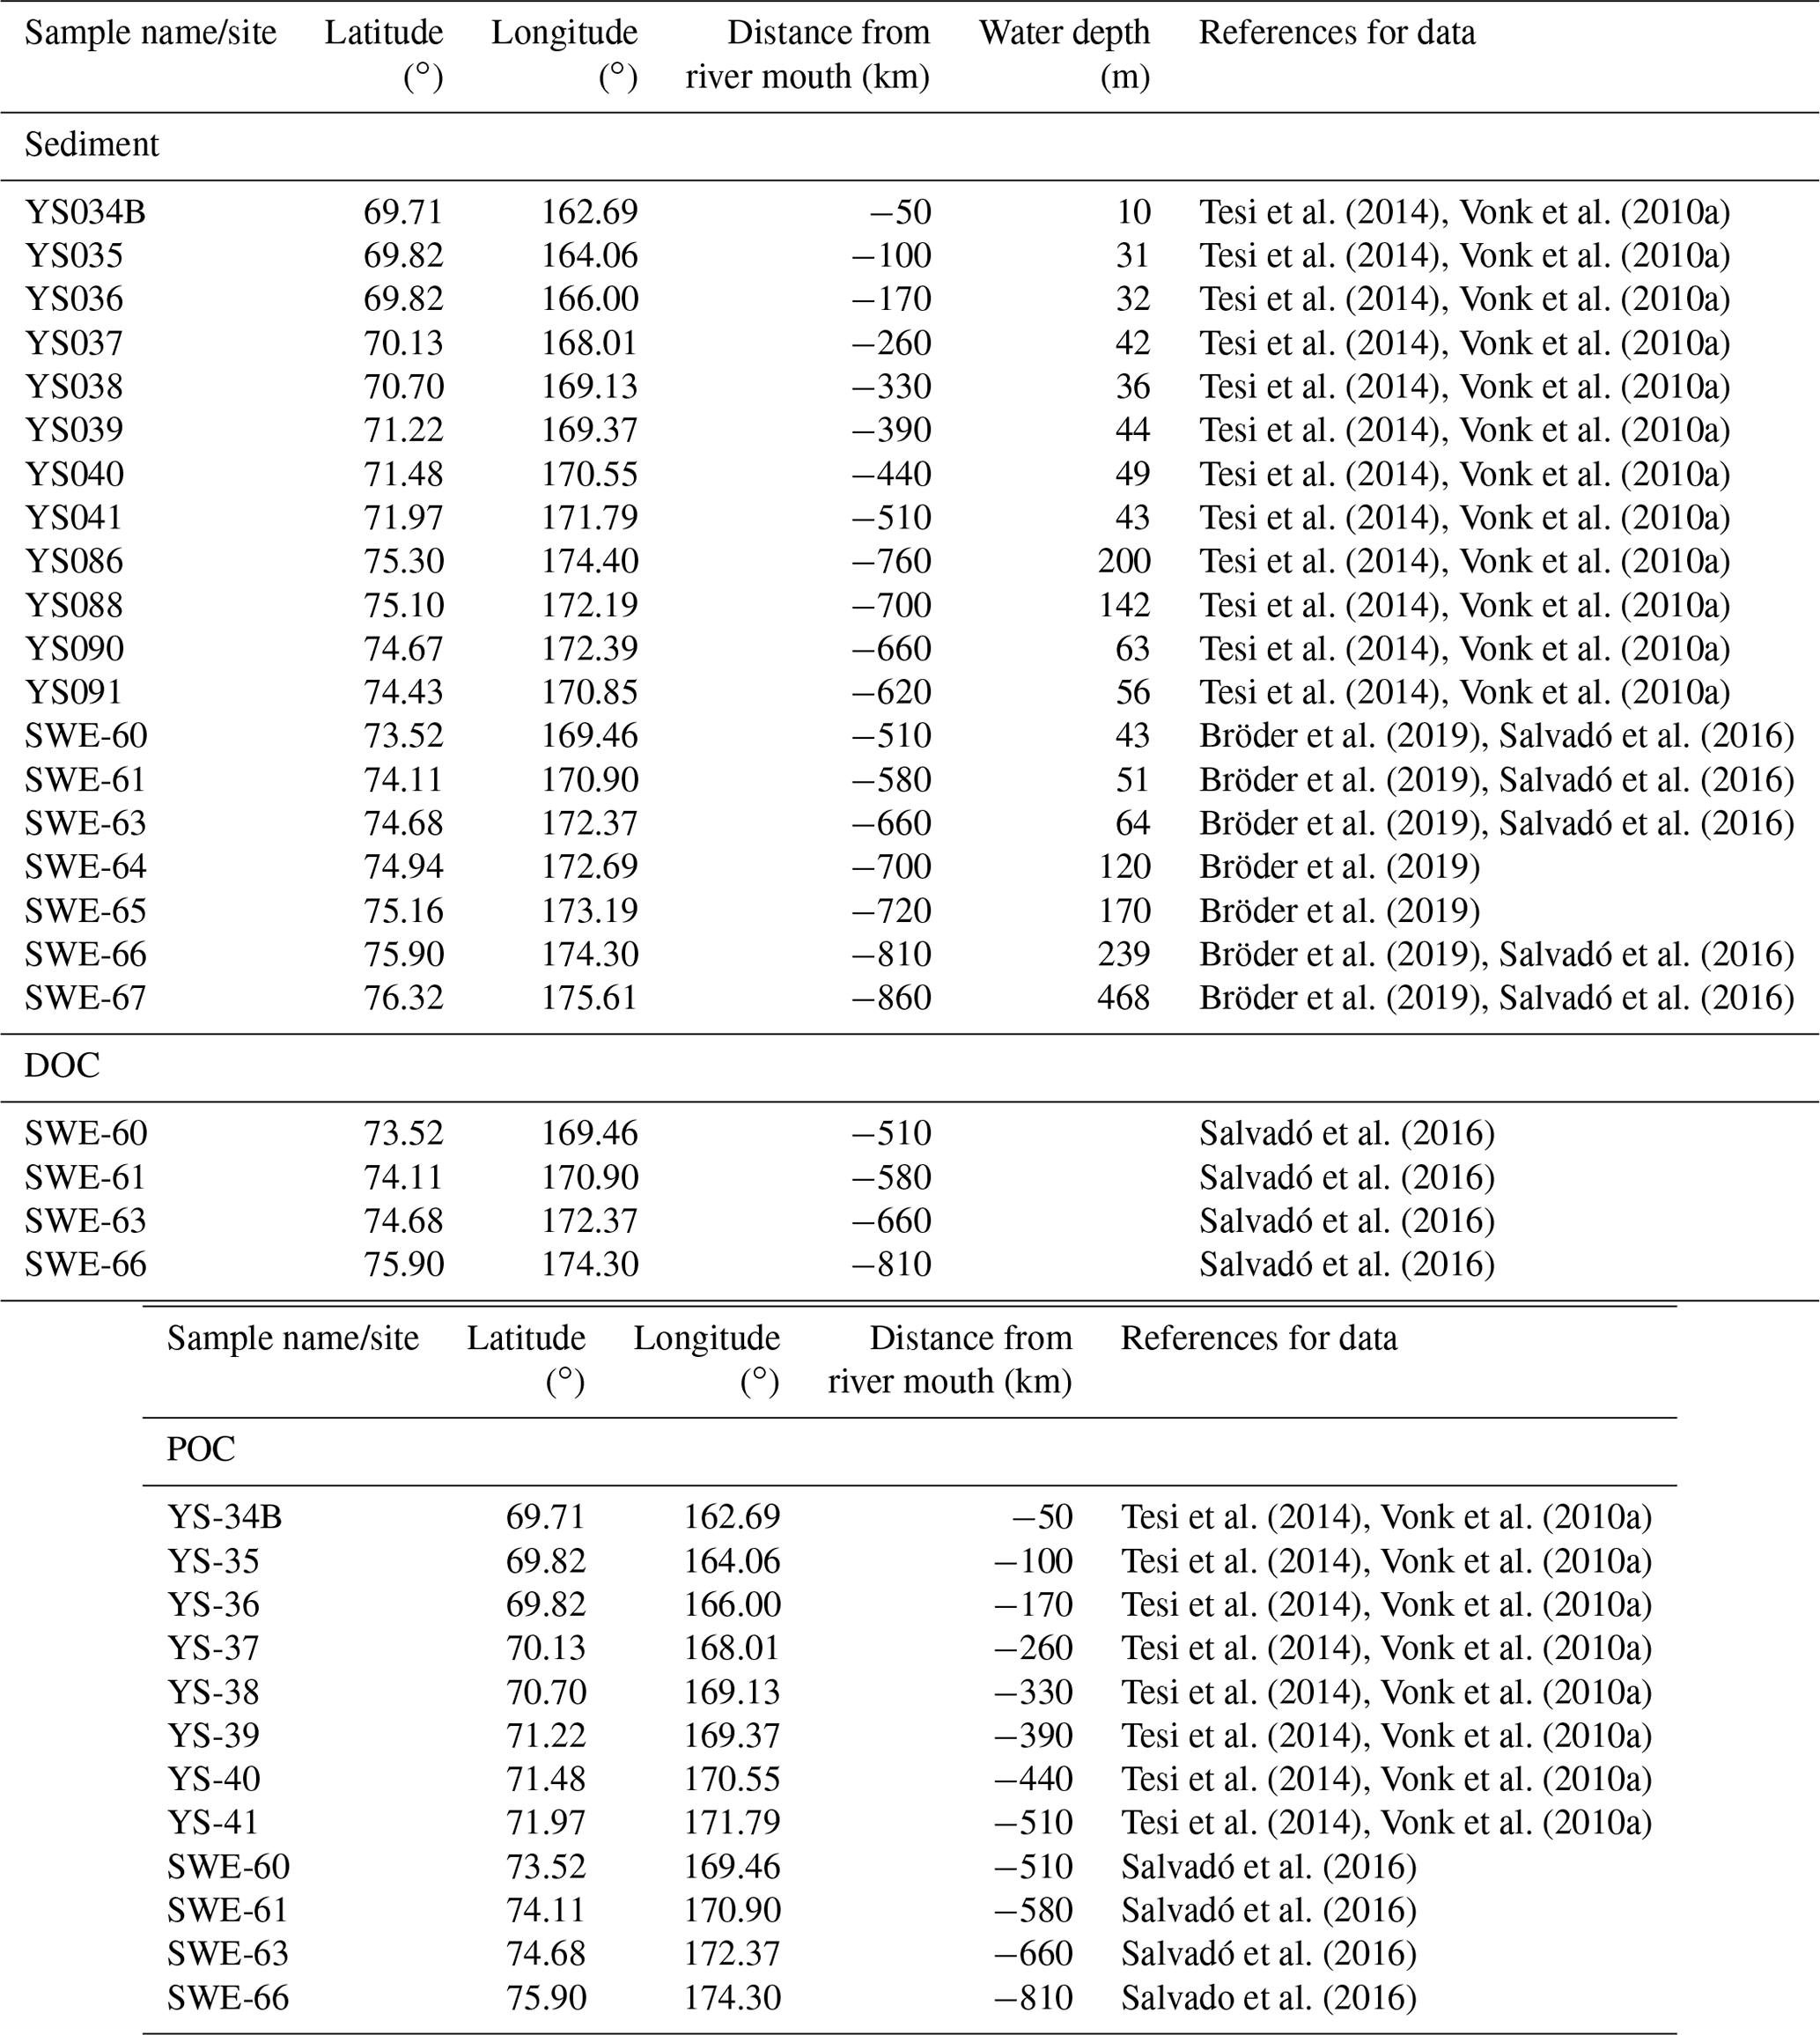
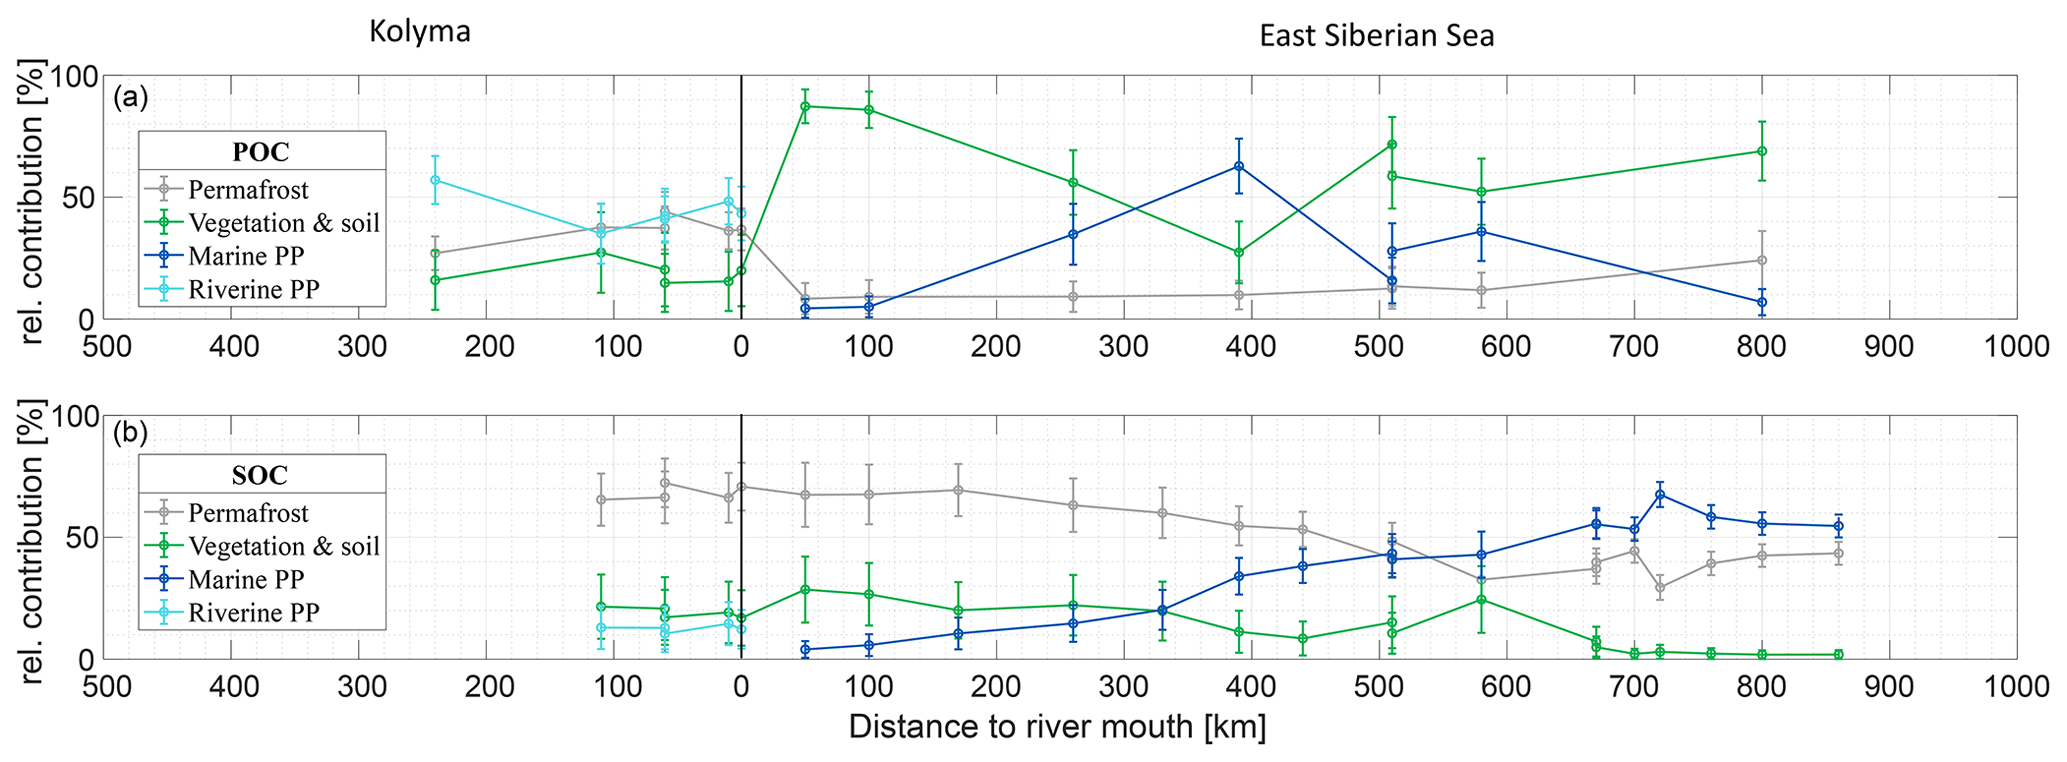
Figure A2Mean relative contribution (plus and minus one standard deviation from Monte Carlo simulations) of three endmembers over transect distance for (a) surface water particulate organic carbon (POC) and (b) sediment organic carbon (SOC), based on dual carbon isotope (Δ14C and δ13C) endmember analyses (EMMA). For the riverine part of the transect (Kolyma; left side of the figure), the endmembers are: Permafrost organic carbon (OC) in grey, Vegetation/soil OC in green, and Riverine primary production (PP) OC in cyan. For the marine part of the transect (East Siberian Sea; right side of the figure), the endmembers are: Permafrost OC in grey, Vegetation/soil OC in green, and Marine primary production OC in dark blue. This figure was made using the alternative Marine PP endmember ( ‰), for comparison to Fig. 4 of the main text, which uses the Marine PP endmember of ‰.
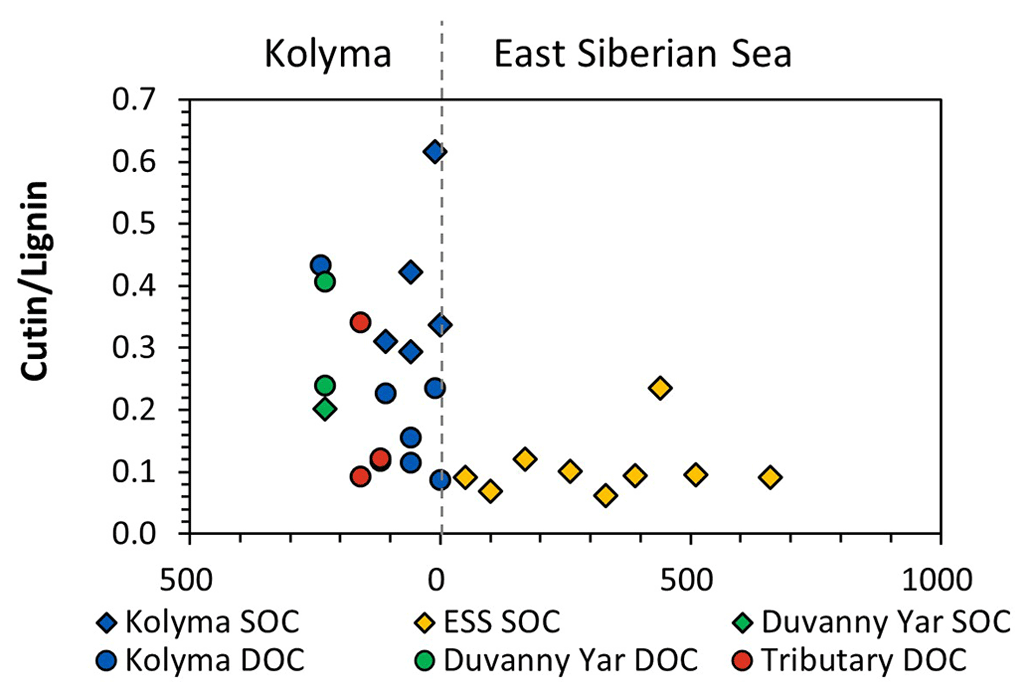
Figure A3Cutin to Lignin ratios of Kolyma (blue), Duvanny Yar (green), tributaries (red), and East Siberian Sea (ESS; yellow) sediment organic carbon (SOC; diamonds) and dissolved organic carbon (DOC; circles).
All data that support the findings of this study are included within the article and/or are available for download in Bröder et al. (2019), Salvadó et al. (2016), Tesi et al. (2014), Vonk et al. (2010a). The East Siberian Shelf sediment data has recently been compiled in the CASCADE database (https://doi.org/10.17043/cascade-2; Martens et al., 2021).
The conceptualisation of the study was done by JEV and DJ, with funding acquired by JEV. The field study and sample collection was done by DJ, LB, KHK, AD and NZ, the lab analyses by DJ, LB, TT and NH, and the data analyses by DJ, TT and PP. Lab- and field resources were used from TT, NZ, AD, NH, TIE and JEV. Writing of the original draft was done by DJ with valuable input from all authors.
The contact author has declared that none of the authors has any competing interests.
Publisher's note: Copernicus Publications remains neutral with regard to jurisdictional claims in published maps and institutional affiliations.
We want to thank the owners and staff of the Northeast Science Station (Cherskiy, Russia) for their logistical support during the field campaign. We want to thank Suzanne Verdegaal-Warmerdam, Oscar Kloostra, Martine Hagen and Roel van Elsas of the VU Amsterdam Sediment Lab and Stable Isotope Lab, and the staff of the ETH Laboratory of Ion Beam Physics for their help with the laboratory analyses.
This research has been supported by the European Commission, H2020 Research Infrastructures (THAWSOME (grant no. 676982)).
This paper was edited by Yuan Shen and reviewed by two anonymous referees.
Abbott, B. W., Larouche, J. R., Jones, J. B., Bowden, W. B., and Balser, A. W.: Elevated dissolved organic carbon biodegradability from thawing and collapsing permafrost, J. Geophys. Res.-Biogeo., 119, 2049–2063, https://doi.org/10.1002/2014JG002678, 2014.
Aller, R. C. and Blair, N. E.: Carbon remineralization in the Amazon-Guianas tropical mobile mudbelt: A sedimentary incinerator, Cont. Shelf Res., 26, 2241–2259, https://doi.org/10.1016/j.csr.2006.07.016, 2006.
Alling, V., Sanchez-Garcia, L., Porcelli, D., Pugach, S., Vonk, J. E., Van Dongen, B., Mörth, C. M., Anderson, L. G., Sokolov, A., Andersson, P., Humborg, C., Semiletov, I., and Gustafsson, Ö.: Nonconservative behavior of dissolved organic carbon across the Laptev and East Siberian seas, Global Biogeochem. Cycles, 24, 1–15, https://doi.org/10.1029/2010GB003834, 2010.
Amon, R. M. W., Rinehart, A. J., Duan, S., Louchouarn, P., Prokushkin, A., Guggenberger, G., Bauch, D., Stedmon, C., Raymond, P. A., Holmes, R. M., McClelland, J. W., Peterson, B. J., Walker, S. A., and Zhulidov, A. V.: Dissolved organic matter sources in large Arctic rivers, Geochim. Cosmochim. Ac., 94, 217–237, https://doi.org/10.1016/j.gca.2012.07.015, 2012.
Andersson, A.: A systematic examination of a random sampling strategy for source apportionment calculations, Sci. Total Environ., 412–413, 232–238, https://doi.org/10.1016/j.scitotenv.2011.10.031, 2011.
Andersson, A., Deng, J., Du, K., Zheng, M., Yan, C., Sköld, M., and Gustafsson, Ö.: Regionally-varying combustion sources of the january 2013 severe haze events over eastern China, Environ. Sci. Technol., 49, 2038–2043, https://doi.org/10.1021/es503855e, 2015.
Battin, T. J., Luyssaert, S., Kaplan, L. A., Aufdenkampe, A. K., Richter, A., and Tranvik, L. J.: The boundless carbon cycle, Nat. Geosci., 2, 598–600, https://doi.org/10.1038/ngeo618, 2009.
Biskaborn, B. K., Smith, S. L., Noetzli, J., Matthes, H., Vieira, G., Streletskiy, D. A., Schoeneich, P., Romanovsky, V. E., Lewkowicz, A. G., Abramov, A., Allard, M., Boike, J., Cable, W. L., Christiansen, H. H., Delaloye, R., Diekmann, B., Drozdov, D., Etzelmüller, B., Grosse, G., Guglielmin, M., Ingeman-Nielsen, T., Isaksen, K., Ishikawa, M., Johansson, M., Johannsson, H., Joo, A., Kaverin, D., Kholodov, A., Konstantinov, P., Kröger, T., Lambiel, C., Lanckman, J.-P., Luo, D., Malkova, G., Meiklejohn, I., Moskalenko, N., Oliva, M., Phillips, M., Ramos, M., Sannel, A. B. K., Sergeev, D., Seybold, C., Skryabin, P., Vasiliev, A., Wu, Q., Yoshikawa, K., Zheleznyak, M., and Lantuit, H.: Permafrost is warming at a global scale, Nat. Commun., 10, 264, https://doi.org/10.1038/s41467-018-08240-4, 2019.
Blair, N. E. and Aller, R. C.: The fate of terrestrial organic carbon in the Marine environment, Ann. Rev. Mar. Sci., 4, 401–423, https://doi.org/10.1146/annurev-marine-120709-142717, 2012.
Bosch, C., Andersson, A., Kruså, M., Bandh, C., Hovorková, I., Klánová, J., Knowles, T. D. J., Pancost, R. D., Evershed, R. P., and Gustafsson, Ö.: Source Apportionment of Polycyclic Aromatic Hydrocarbons in Central European Soils with Compound-Specific Triple Isotopes (δ13C, Δ14C, and δ2H), Environ. Sci. Technol., 49, 7657–7665, https://doi.org/10.1021/acs.est.5b01190, 2015.
Bröder, L., Tesi, T., Andersson, A., Eglinton, T. I., Semiletov, I. P., Dudarev, O. V., Roos, P., and Gustafsson, Ö.: Historical records of organic matter supply and degradation status in the East Siberian Sea, Org. Geochem., 91, 16–30, https://doi.org/10.1016/j.orggeochem.2015.10.008, 2016.
Bröder, L., Tesi, T., Andersson, A., Semiletov, I., and Gustafsson, Ö.: Bounding cross-shelf transport time and degradation in Siberian-Arctic land-ocean carbon transfer, Nat. Commun., 9, 806, https://doi.org/10.1038/s41467-018-03192-1, 2018.
Bröder, L., Andersson, A., Tesi, T., Semiletov, I., and Gustafsson, Ö.: Quantifying Degradative Loss of Terrigenous Organic Carbon in Surface Sediments Across the Laptev and East Siberian Sea, Global Biogeochem. Cycles, 33, 85–99, https://doi.org/10.1029/2018GB005967, 2019.
Bröder, L., Davydova, A., Davydov, S., Zimov, N., Haghipour, N., Eglinton, T. I., and Vonk, J. E.: Particulate Organic Matter Dynamics in a Permafrost Headwater Stream and the Kolyma River Mainstem, J. Geophys. Res.-Biogeo., 125, 1–16, https://doi.org/10.1029/2019JG005511, 2020.
Brunauer, S., Emmett, P. H., and Teller, E.: Adsorption of Gases in Multimolecular Layers, J. Am. Chem. Soc., 60, 309–319, https://doi.org/10.1021/ja01269a023, 1938.
Cole, J. J., Prairie, Y. T., Caraco, N. F., McDowell, W. H., Tranvik, L. J., Striegl, R. G., Duarte, C. M., Kortelainen, P., Downing, J. A., Middelburg, J. J., and Melack, J.: Plumbing the global carbon cycle: Integrating inland waters into the terrestrial carbon budget, Ecosystems, 10, 171–184, https://doi.org/10.1007/s10021-006-9013-8, 2007.
Coppola, L., Gustafsson, Ö., Andersson, P., Eglinton, T. I., Uchida, M., and Dickens, A. F.: The importance of ultrafine particles as a control on the distribution of organic carbon in Washington Margin and Cascadia Basin sediments, Chem. Geol., 243, 142–156, https://doi.org/10.1016/j.chemgeo.2007.05.020, 2007.
Deirmendjian, L., Lambert, T., Morana, C., Bouillon, S., Descy, J. P., Okello, W., and Borges, A. V.: Dissolved organic matter composition and reactivity in Lake Victoria, the world's largest tropical lake, Biogeochemistry, 150, 61–83, https://doi.org/10.1007/s10533-020-00687-2, 2020.
Drake, T. W., Raymond, P. A., and Spencer, R. G. M.: Terrestrial carbon inputs to inland waters: A current synthesis of estimates and uncertainty, Limnol. Oceanogr. Lett., 3, 132–142, https://doi.org/10.1002/lol2.10055, 2018.
Dudarev, O., Charkin, A., Shakhova, N., Ruban, A., and Semiletov, I.: Progress in Oceanography East Siberian Sea: Interannual heterogeneity of the suspended particulate matter and its biogeochemical signature, Prog. Oceanogr., 208, 102903, https://doi.org/10.1016/j.pocean.2022.102903, 2022.
Eglinton, G. and Hamilton, R. J.: Leaf Epicuticular Waxes, Science, 156, 1322–1335, https://doi.org/10.1126/science.156.3780.1322, 1967.
Feng, X., Vonk, J. E., van Dongen, B. E., Gustafsson, O., Semiletov, I. P., Dudarev, O. V., Wang, Z., Montlucon, D. B., Wacker, L., and Eglinton, T. I.: Differential mobilization of terrestrial carbon pools in Eurasian Arctic river basins, P. Natl. Acad. Sci. USA, 110, 14168–14173, https://doi.org/10.1073/pnas.1307031110, 2013.
Feng, X., Vonk, J. E., Griffin, C., Zimov, N., Montluçon, D. B., Wacker, L., and Eglinton, T. I.: 14C Variation of Dissolved Lignin in Arctic River Systems, ACS Earth Sp. Chem., 1, 334–344, https://doi.org/10.1021/acsearthspacechem.7b00055, 2017.
Freeman, K. H. and Pancost, R. D.: Biomarkers for Terrestrial Plants and Climate, in: Treatise on Geochemistry, Elsevier, 395–416, https://doi.org/10.1016/B978-0-08-095975-7.01028-7, 2014.
Freymond, C. V., Kündig, N., Stark, C., Peterse, F., Buggle, B., Lupker, M., Plötze, M., Blattmann, T. M., Filip, F., Giosan, L., and Eglinton, T. I.: Evolution of biomolecular loadings along a major river system, Geochim. Cosmochim. Ac., 223, 389–404, https://doi.org/10.1016/j.gca.2017.12.010, 2018.
Galimov, E. M., Kodina, L. A., Stepanets, O. V., and Korobeinik, G. S.: Biogeochemistry of the Russian Arctic. Kara Sea: Research results under the SIRRO project, 1995–2003, Geochemistry Int., 44, 1053–1104, https://doi.org/10.1134/S0016702906110012, 2006.
Goñi, M. A. and Hedges, J. I.: Lignin Dimers - Structures, Distribution, and Potential Geochemical Applications, Geochim. Cosmochim. Ac., 56, 4025–4043, 1992.
Goñi, M. A. and Montgomery, S.: Alkaline CuO oxidation with a microwave digestion system: Lignin analyses of geochemical samples, Anal. Chem., 72, 3116–3121, https://doi.org/10.1021/ac991316w, 2000.
Goñi, M. A., Yunker, M. B., MacDonald, R. W., and Eglinton, T. I.: Distribution and sources of organic biomarkers in arctic sediments from the Mackenzie River and Beaufort Shelf, Mar. Chem., 71, 23–51, https://doi.org/10.1016/S0304-4203(00)00037-2, 2000.
Haghipour, N., Ausin, B., Usman, M. O., Ishikawa, N., Wacker, L., Welte, C., Ueda, K., and Eglinton, T. I.: Compound-Specific Radiocarbon Analysis by Elemental Analyzer–Accelerator Mass Spectrometry: Precision and Limitations, Anal. Chem., 91, 2042–2049, https://doi.org/10.1021/acs.analchem.8b04491, 2018.
Hedges, J. I. and Mann, D. C.: The characterization of plant tissues by their lignin oxidation products, Geochim. Cosmochim. Ac., 43, 1803–1807, https://doi.org/10.1016/0016-7037(79)90028-0, 1979.
Hedges, J. I., Blanchette, R. A., Weliky, K., and Devol, A. H.: Effects of fungal degradation on the CuO oxidation products of lignin: A controlled laboratory study, Geochim. Cosmochim. Ac., 52, 2717–2726, https://doi.org/10.1016/0016-7037(88)90040-3, 1988.
Hemingway, J. D., Rothman, D. H., Grant, K. E., Rosengard, S. Z., Eglinton, T. I., Derry, L. A., and Galy, V. V.: Mineral protection regulates long-term global preservation of natural organic carbon, Nature, 570, 228–231, https://doi.org/10.1038/s41586-019-1280-6, 2019.
Hernes, P. J., Robinson, A. C., and Aufdenkampe, A. K.: Fractionation of lignin during leaching and sorption and implications for organic matter “freshness,” Geophys. Res. Lett., 34, 1–6, https://doi.org/10.1029/2007GL031017, 2007.
Hilton, R. G., Galy, V., Gaillardet, J., Dellinger, M., Bryant, C., O'Regan, M., Gröcke, D. R., Coxall, H., Bouchez, J., and Calmels, D.: Erosion of organic carbon in the Arctic as a geological carbon dioxide sink, Nature, 524, 84–87, https://doi.org/10.1038/nature14653, 2015.
Holmes, R. M., McClelland, J. W., Peterson, B. J., Tank, S. E., Bulygina, E., Eglinton, T. I., Gordeev, V. V., Gurtovaya, T. Y., Raymond, P. A., Repeta, D. J., Staples, R., Striegl, R. G., Zhulidov, A. V., and Zimov, S. A.: Seasonal and Annual Fluxes of Nutrients and Organic Matter from Large Rivers to the Arctic Ocean and Surrounding Seas, Estuar. Coasts, 35, 369–382, https://doi.org/10.1007/s12237-011-9386-6, 2012.
Houel, S., Louchouarn, P., Lucotte, M., Canuel, R., and Ghaleb, B.: Translocation of soil organic matter following reservoir impoundment in boreal systems: Implications for in situ productivity, Limnol. Oceanogr., 51, 1497–1513, https://doi.org/10.4319/lo.2006.51.3.1497, 2006.
Hugelius, G., Strauss, J., Zubrzycki, S., Harden, J. W., Schuur, E. A. G., Ping, C.-L., Schirrmeister, L., Grosse, G., Michaelson, G. J., Koven, C. D., O'Donnell, J. A., Elberling, B., Mishra, U., Camill, P., Yu, Z., Palmtag, J., and Kuhry, P.: Estimated stocks of circumpolar permafrost carbon with quantified uncertainty ranges and identified data gaps, Biogeosciences, 11, 6573–6593, https://doi.org/10.5194/bg-11-6573-2014, 2014.
IPCC: Climate Change 2021: The Physical Science Basis. Contribution of Working Group I to the Sixth Assessment Report of the Intergovernmental Panel on Climate Change, edited by: Masson-Delmotte, V., Zhai, P., Pirani, A., Connors, S. L., Péan, C., Berger, S., Caud, N., Chen, Y., Goldfarb, L., Gomis, M. I., Huang, M., Leitzell, K., Lonnoy, E., Matthews, J. B. R., Maycock, T. K., Waterfield, T., Yelekçi, O., Yu, R., and Zhou, B., Cambridge University Press, Cambridge, United Kingdom and New York, NY, USA, in press, https://doi.org/10.1017/9781009157896, 2021.
Jong, D., Bröder, L., Tanski, G., Fritz, M., Lantuit, H., Tesi, T., Haghipour, N., Eglinton, T. I., and Vonk, J. E.: Nearshore zone dynamics determine pathway of organic carbon from eroding permafrost coasts, Geophys. Res. Lett., 47, e2020GL088561, https://doi.org/10.1029/2020GL088561, 2020.
Karlsson, E. S., Charkin, A., Dudarev, O., Semiletov, I., Vonk, J. E., Sánchez-García, L., Andersson, A., and Gustafsson, Ö.: Carbon isotopes and lipid biomarker investigation of sources, transport and degradation of terrestrial organic matter in the Buor-Khaya Bay, SE Laptev Sea, Biogeosciences, 8, 1865–1879, https://doi.org/10.5194/bg-8-1865-2011, 2011.
Keil, R. G., Montluçon, D. B., Prahl, F. G., and Hedges, J. I.: Sorptive preservation of labile organic matter in marine sediments, Nature, 370, 549–552, https://doi.org/10.1038/370549a0, 1994.
Keil, R. G., Mayer, L. M., Quay, P. D., Richey, J. E., and Hedges, J. I.: Loss of organic matter from riverine particles in deltas, Geochim. Cosmochim. Ac., 61, 1507–1511, https://doi.org/10.1016/S0016-7037(97)00044-6, 1997.
Keskitalo, K. H., Bröder, L., Jong, D., Zimov, N., Davydova, A., Davydov, S., Tesi, T., Mann, P. J., Haghipour, N., Eglinton, T. I., and Vonk, J. E.: Seasonal variability in particulate organic carbon degradation in the Kolyma River, Siberia, Environ. Res. Lett., 17, 034007, https://doi.org/10.1088/1748-9326/ac4f8d, 2022.
Kleber, M., Bourg, I. C., Coward, E. K., Hansel, C. M., Myneni, S. C. B., and Nunan, N.: Dynamic interactions at the mineral–organic matter interface, Nat. Rev. Earth Environ., 2, 402–421, https://doi.org/10.1038/s43017-021-00162-y, 2021.
Komada, T., Anderson, M. R., and Dorfmeier, C. L.: Carbonate removal from coastal sediments for the determination of organic carbon and its isotopic signatures, d13C and D14C: comparison of fumigation and direct acidification by hydrochloric acid, Limnol. Oceanogr. Methods, 6, 254–262, https://doi.org/10.4319/lom.2008.6.254, 2008.
Kraberg, A. C., Druzhkova, E., Heim, B., Loeder, M. J. G., and Wiltshire, K. H.: Phytoplankton community structure in the Lena Delta (Siberia, Russia) in relation to hydrography, Biogeosciences, 10, 7263–7277, https://doi.org/10.5194/bg-10-7263-2013, 2013.
Louchouarn, P., Opsahl, S., and Benner, R.: Isolation and Quantification of Dissolved Lignin from Natural Waters Using Solid-Phase Extraction and GC/MS, Anal. Chem., 72, 2780–2787, https://doi.org/10.1021/ac9912552, 2000.
Mann, P. J., Davydova, A., Zimov, N., Spencer, R. G. M., Davydov, S., Bulygina, E., Zimov, S., and Holmes, R. M.: Controls on the composition and lability of dissolved organic matter in Siberia's Kolyma River basin, J. Geophys. Res.-Biogeo., 117, 1–15, https://doi.org/10.1029/2011JG001798, 2012.
Mann, P. J., Eglinton, T. I., McIntyre, C. P., Zimov, N., Davydova, A., Vonk, J. E., Holmes, R. M., and Spencer, R. G. M.: Utilization of ancient permafrost carbon in headwaters of Arctic fluvial networks, Nat. Commun., 6, 1–7, https://doi.org/10.1038/ncomms8856, 2015.
Martens, J., Romankevich, E., Semiletov, I., Wild, B., van Dongen, B., Vonk, J., Tesi, T., Shakhova, N., Dudarev, O. V., Kosmach, D., Vetrov, A., Lobkovsky, L., Belyaev, N., Macdonald, R., Pieńkowski, A. J., Eglinton, T. I., Haghipour, N., Dahle, S., Carroll, M. L., Åström, E. K. L., Grebmeier, J. M., Cooper, L. W., Possnert, G., and Gustafsson, Ö.: The Circum-Arctic Sediment Carbon Database – CASCADE, Dataset version 2, Bolin Centre Database [data set], https://doi.org/10.17043/cascade-2, 2021.
Mayer, L. M.: Surface area control of organic carbon accumulation in continental shelf sediments, Geochim. Cosmochim. Ac., 58, 1271–1284, https://doi.org/10.1016/0016-7037(94)90381-6, 1994.
McClelland, J. W., Holmes, R. M., Peterson, B. J., Raymond, P. A., Striegl, R. G., Zhulidov, A. V., Zimov, S. A., Zimov, N., Tank, S. E., Spencer, R. G. M., Staples, R., Gurtovaya, T. Y., and Griffin, C. G.: Particulate organic carbon and nitrogen export from major Arctic rivers, Global Biogeochem. Cycles, 30, 629–643, https://doi.org/10.1002/2015GB005351, 2016.
McIntyre, C. P., Wacker, L., Haghipour, N., Blattmann, T. M., Fahrni, S., Usman, M., Eglinton, T. I., and Synal, H. A.: Online 13C and 14C Gas Measurements by EA-IRMS-AMS at ETH Zürich, Radiocarbon, 59, 893–903, https://doi.org/10.1017/RDC.2016.68, 2017.
Meyers, P. A.: Preservation of elemental and isotopic source identification of sedimentary organic matter, Chem. Geol., 114, 289–302, https://doi.org/10.1016/0009-2541(94)90059-0, 1994.
Neff, J. C., Finlay, J. C., Zimov, S. A., Davydov, S. P., Carrasco, J. J., Schuur, E. A. G., and Davydova, A. I.: Seasonal changes in the age and structure of dissolved organic carbon in Siberian rivers and streams, Geophys. Res. Lett., 33, 1–5, https://doi.org/10.1029/2006GL028222, 2006.
Opsahl, S. and Benner, R.: Early diagenesis of vascular plant tissues: Lignin and cutin decomposition and biogeochemical implications, Geochim. Cosmochim. Ac., 59, 4889–4904, https://doi.org/10.1016/0016-7037(95)00348-7, 1995.
Repasch, M., Scheingross, J. S., Hovius, N., Lupker, M., Wittmann, H., Haghipour, N., Gröcke, D. R., Orfeo, O., Eglinton, T. I., and Sachse, D.: Fluvial organic carbon cycling regulated by sediment transit time and mineral protection, Nat. Geosci., 14, 842–848, https://doi.org/10.1038/s41561-021-00845-7, 2021.
Rogers, J. A., Galy, V., Kellerman, A. M., Chanton, J. P., Zimov, N., and Spencer, R. G. M.: Limited Presence of Permafrost Dissolved Organic Matter in the Kolyma River, Siberia Revealed by Ramped Oxidation, J. Geophys. Res.-Biogeo., 126, 1–18, https://doi.org/10.1029/2020JG005977, 2021.
Salvadó, J. A., Tesi, T., Sundbom, M., Karlsson, E., Kruså, M., Semiletov, I. P., Panova, E., and Gustafsson, Ö.: Contrasting composition of terrigenous organic matter in the dissolved, particulate and sedimentary organic carbon pools on the outer East Siberian Arctic Shelf, Biogeosciences, 13, 6121–6138, https://doi.org/10.5194/bg-13-6121-2016, 2016.
Sánchez-García, L., Vonk, J. E., Charkin, A. N., Kosmach, D., Dudarev, O. V., Semiletov, I. P., and Gustafsson, O.: Characterisation of three regimes of collapsing arctic ice complex deposits on the SE Laptev Sea coast using biomarkers and dual carbon isotopes, Permafr. Periglac. Process., 25, 172–183, https://doi.org/10.1002/ppp.1815, 2014.
Scheingross, J. S., Hovius, N., Dellinger, M., Hilton, R. G., Repasch, M., Sachse, D., Gröcke, D. R., Vieth-Hillebrand, A., and Turowski, J. M.: Preservation of organic carbon during active fluvial transport and particle abrasion, Geology, 47, 958–962, https://doi.org/10.1130/G46442.1, 2019.
Schuur, E. A. G., McGuire, A. D., Schädel, C., Grosse, G., Harden, J. W., Hayes, D. J., Hugelius, G., Koven, C. D., Kuhry, P., Lawrence, D. M., Natali, S. M., Olefeldt, D., Romanovsky, V. E., Schaefer, K., Turetsky, M. R., Treat, C. C., and Vonk, J. E.: Climate change and the permafrost carbon feedback, Nature, 520, 171–179, https://doi.org/10.1038/nature14338, 2015.
Semiletov, I., Pipko, I., Gustafsson, Ö., Anderson, L. G., Sergienko, V., Pugach, S., Dudarev, O., Charkin, A., Gukov, A., Bröder, L., Andersson, A., Spivak, E., and Shakhova, N.: Acidification of East Siberian Arctic Shelf waters through addition of freshwater and terrestrial carbon, Nat. Geosci., 9, 361–365, https://doi.org/10.1038/ngeo2695, 2016.
Shakil, S., Tank, S. E., Kokelj, S. V., Vonk, J. E., and Zolkos, S.: Particulate dominance of organic carbon mobilization from thaw slumps on the Peel Plateau, NT: Quantification and implications for stream systems and permafrost carbon release, Environ. Res. Lett., 15, 114019, https://doi.org/10.1088/1748-9326/abac36, 2020.
Shiklomanov, A. I., Holmes, R. M., McClelland, J. W., Tank, S. E., and Spencer, R. G. M.: Arctic Great Rivers Observatory, Discharge Dataset, Version 20220630, https://arcticgreatrivers.org/data/ (last access: 30 June 2022), 2021.
Spencer, R. G. M., Aiken, G. R., Dyda, R. Y., Butler, K. D., Bergamaschi, B. A., and Hernes, P. J.: Comparison of XAD with other dissolved lignin isolation techniques and a compilation of analytical improvements for the analysis of lignin in aquatic settings, Org. Geochem., 41, 445–453, https://doi.org/10.1016/J.ORGGEOCHEM.2010.02.004, 2010.
Stein, R. and Macdonald, R. W. (Eds.): The Organic Carbon Cycle in the Arctic Ocean, Springer Verlag, ISBN 978-3-642-18912-8, 2004.
Stuiver, M. and Polach, H. A.: Discussion Reporting of 14C Data, Radiocarbon, 19, 355–363, https://doi.org/10.1017/S0033822200003672, 1977.
Terhaar, J., Lauerwald, R., Regnier, P., Gruber, N., and Bopp, L.: Around one third of current Arctic Ocean primary production sustained by rivers and coastal erosion, Nat. Commun., 12, 169, https://doi.org/10.1038/s41467-020-20470-z, 2021.
Tesi, T., Semiletov, I., Hugelius, G., Dudarev, O., Kuhry, P., and Gustafsson, Ö.: Composition and fate of terrigenous organic matter along the Arctic land-ocean continuum in East Siberia: Insights from biomarkers and carbon isotopes, Geochim. Cosmochim. Ac., 133, 235–256, https://doi.org/10.1016/j.gca.2014.02.045, 2014.
Tesi, T., Semiletov, I., Dudarev, O., Andersson, A., and Gustafsson, Ö.: Matrix association effects on hydrodynamic sorting and degradation of terrestrial organic matter during cross-shelf transport in the Laptev and East Siberian shelf seas, J. Geophys. Res.-Biogeo., 121, 731–752, https://doi.org/10.1002/2015JG003067, 2016.
van Dongen, B. E., Semiletov, I., Weijers, J. W., and Gustafsson, Ö.: Contrasting lipid biomarker composition of terrestrial organic matter exported from across the Eurasian Arctic by the five great Russian Arctic rivers, Global Biogeochem. Cycles, 22, https://doi.org/10.1029/2007GB002974, 2008.
Vonk, J. E., Sánchez-García, L., Semiletov, I., Dudarev, O., Eglinton, T., Andersson, A., and Gustafsson, Ö.: Molecular and radiocarbon constraints on sources and degradation of terrestrial organic carbon along the Kolyma paleoriver transect, East Siberian Sea, Biogeosciences, 7, 3153–3166, https://doi.org/10.5194/bg-7-3153-2010, 2010a.
Vonk, J. E., Van Dongen, B. E., and Gustafsson, Ö.: Selective preservation of old organic carbon fluvially released from sub-Arctic soils, Geophys. Res. Lett., 37, 5–9, https://doi.org/10.1029/2010GL042909, 2010b.
Vonk, J. E., Sánchez-García, L., van Dongen, B. E., Alling, V., Kosmach, D., Charkin, A., Semiletov, I. P., Dudarev, O. V., Shakhova, N., Roos, P., Eglinton, T. I., Andersson, A., and Gustafsson, Ö.: Activation of old carbon by erosion of coastal and subsea permafrost in Arctic Siberia, Nature, 489, 137–140, https://doi.org/10.1038/nature11392, 2012.
Vonk, J. E., Mann, P. J., Davydov, S., Davydova, A., Spencer, R. G. M., Schade, J., Sobczak, W. V., Zimov, N., Zimov, S., Bulygina, E., Eglinton, T. I., and Holmes, R. M.: High biolability of ancient permafrost carbon upon thaw, Geophys. Res. Lett., 40, 2689–2693, https://doi.org/10.1002/grl.50348, 2013.
Vonk, J. E., Tank, S. E., Bowden, W. B., Laurion, I., Vincent, W. F., Alekseychik, P., Amyot, M., Billet, M. F., Canário, J., Cory, R. M., Deshpande, B. N., Helbig, M., Jammet, M., Karlsson, J., Larouche, J., MacMillan, G., Rautio, M., Walter Anthony, K. M., and Wickland, K. P.: Reviews and syntheses: Effects of permafrost thaw on Arctic aquatic ecosystems, Biogeosciences, 12, 7129–7167, https://doi.org/10.5194/bg-12-7129-2015, 2015.
Wakeham, S. G., Canuel, E. A., Lerberg, E. J., Mason, P., Sampere, T. P., and Bianchi, T. S.: Partitioning of organic matter in continental margin sediments among density fractions, Mar. Chem., 115, 211–225, https://doi.org/10.1016/j.marchem.2009.08.005, 2009.
Walvoord, M. A. and Kurylyk, B. L.: Hydrologic Impacts of Thawing Permafrost-A Review, Vadose Zo. J., 15, vzj2016.01.0010, https://doi.org/10.2136/vzj2016.01.0010, 2016.
Wild, B., Andersson, A., Bröder, L., Vonk, J., Hugelius, G., McClelland, J. W., Song, W., Raymond, P. A., and Gustafsson, Ö.: Rivers across the Siberian Arctic unearth the patterns of carbon release from thawing permafrost, P. Natl. Acad. Sci. USA, 116, 10280–10285, https://doi.org/10.1073/pnas.1811797116, 2019.
Winterfeld, M., Goñi, M. A., Just, J., Hefter, J., and Mollenhauer, G.: Characterization of particulate organic matter in the Lena River delta and adjacent nearshore zone, NE Siberia – Part 2: Lignin-derived phenol compositions, Biogeosciences, 12, 2261–2283, https://doi.org/10.5194/bg-12-2261-2015, 2015a.
Winterfeld, M., Laepple, T., and Mollenhauer, G.: Characterization of particulate organic matter in the Lena River delta and adjacent nearshore zone, NE Siberia – Part I: Radiocarbon inventories, Biogeosciences, 12, 3769–3788, https://doi.org/10.5194/bg-12-3769-2015, 2015b.
Zimov, S. A., Davydov, S. P., Zimova, G. M., Davydova, A. I., Schuur, E. A. G., Dutta, K., and Chapin, I. S.: Permafrost carbon: Stock and decomposability of a globally significant carbon pool, Geophys. Res. Lett., 33, 1–5, https://doi.org/10.1029/2006GL027484, 2006a.
Zimov, S. A, Schuur, E. A. G., and Chapin, F. S.: Permafrost and the Global Carbon Budget, Science, 312, 1612–1613, https://doi.org/10.1126/science.1128908, 2006b.