the Creative Commons Attribution 4.0 License.
the Creative Commons Attribution 4.0 License.
 | 18 Jul 2023
Maximum respiration rates in hyporheic zone sediments are primarily constrained by organic carbon concentration and secondarily by organic matter chemistry
Vanessa A. Garayburu-Caruso
Robert E. Danczak
Amy E. Goldman
Lupita Renteria
Joshua M. Torgeson
Jacqueline Hager
River corridors are fundamental components of the Earth system, and their biogeochemistry can be heavily influenced by processes in subsurface zones immediately below the riverbed, referred to as the hyporheic zone. Within the hyporheic zone, organic matter (OM) fuels microbial respiration, and OM chemistry heavily influences aerobic and anaerobic biogeochemical processes. The link between OM chemistry and respiration has been hypothesized to be mediated by OM molecular diversity, whereby respiration is predicted to decrease with increasing diversity. Here we test the specific prediction that aerobic respiration rates will decrease with increases in the number of unique organic molecules (i.e., OM molecular richness, as a measure of diversity). We use publicly available data across the United States from crowdsourced samples taken by the Worldwide Hydrobiogeochemical Observation Network for Dynamic River Systems (WHONDRS) consortium. Our continental-scale analyses rejected the hypothesis of a direct limitation of respiration by OM molecular richness. In turn, we found that organic carbon (OC) concentration imposes a primary constraint over hyporheic zone respiration, with additional potential influences of OM richness. We specifically observed respiration rates to decrease nonlinearly with the ratio of OM richness to OC concentration. This relationship took the form of a constraint space with respiration rates in most systems falling below the constraint boundary. A similar, but slightly weaker, constraint boundary was observed when relating respiration rate to the inverse of OC concentration. These results indicate that maximum respiration rates may be governed primarily by OC concentration, with secondary influences from OM richness. Our results also show that other variables often suppress respiration rates below the maximum associated with the richness-to-concentration ratio. An important focus of future research will identify physical (e.g., sediment grain size), chemical (e.g., nutrient concentrations), and/or biological (e.g., microbial biomass) factors that suppress hyporheic zone respiration below the constraint boundaries observed here.
- Article
(3617 KB) - Full-text XML
-
Supplement
(1115 KB) - BibTeX
- EndNote


River corridors are key components of the Earth system that connect terrestrial landscapes to the ocean through the transport and transformation of organic matter (OM) and nutrients (Harvey and Gooseff, 2015; Schlünz and Schneider, 2000; Schlesinger and Melack, 1981). In addition, river corridors have strong connections to the atmosphere in terms of significant emissions of greenhouse gases such as CO2, contributing ∼ 3.9 Pg CO2-C yr−1 to the atmosphere (Raymond et al., 2013; Drake et al., 2018). Within river corridors the hyporheic zone (Orghidan, 2010) can have a dominant influence over net metabolism and biogeochemical transformations (Boulton et al., 1998; Naegeli and Uehlinger, 1997; Krause et al., 2011). Here we define the hyporheic zone as shallow subsurface sediments through which surface water enters, moves through, and at some point returns to the main channel. These zones are considered biogeochemical “hotspots” and can be responsible for 3 %–96 % of the total stream metabolism (Jones, 1995; Fuss and Smock, 1996; Naegeli and Uehlinger, 1997; Kaplan and Newbold, 2000; Battin et al., 2003; Ward et al., 2018). In turn, hyporheic zones can contribute significantly to the overall CO2 emissions from inland waters (Burrows et al., 2017; Newcomer et al., 2018; Comer-Warner et al., 2019; Son et al., 2022). Recent work has found that detailed properties of OM chemistry can significantly influence respiration rates in hyporheic zone sediments (Stegen et al., 2018; Garayburu-Caruso et al., 2020a; Sengupta et al., 2020; Graham et al., 2018, 2017; Song et al., 2020). These observations demonstrate a need to deepen understanding of the relationships between hyporheic zone biogeochemistry (e.g., respiration rates) and OM chemistry.
A conceptual hypothesis was recently developed that may provide new insight into the connections between OM chemistry and biogeochemical rates. More specifically, Lehmann et al. (2020) hypothesize that OM can be protected from degradation (in part) by high levels of molecular diversity. Biogeochemical rates that depend on OM oxidation (e.g., aerobic respiration) may therefore be suppressed with increases in the number of unique organic molecules (referred to here as OM molecular richness). The concept is that high levels of OM molecular richness lead to low returns on investment, relative to the energy invested in building and maintaining the molecular machinery needed to metabolize any given type of organic molecule. The consequence is low respiration rates. The underlying mechanism has been proposed to help protect OM in some ecosystems such as deep-sea (Arrieta et al., 2015) and river corridor (Stegen et al., 2018) environments.
The hypothesis of lower biogeochemical rates with higher OM molecular richness has not been evaluated in hyporheic zone sediments despite the established connection between OM chemistry and hyporheic zone respiration rates. We posit that higher levels of hydrologic connectivity in hyporheic zones relative to unsaturated systems (e.g., soil) may diminish influences of spatial isolation such as an OM stabilization mechanism (Schmidt et al., 2011), potentially leading to particularly strong relationships between respiration rates and OM chemistry. In turn, it is plausible that the hyporheic zone is an ecosystem in which we may find support for the hypothesized negative relationship between respiration rates and OM molecular richness. Here we test this hypothesis at the continental scale using publicly available data from the Worldwide Hydrobiogeochemical Observation Network for Dynamic River Systems (WHONDRS) consortium (Stegen and Goldman, 2018; Garayburu-Caruso et al., 2020b; Toyoda et al., 2020; Goldman et al., 2020).
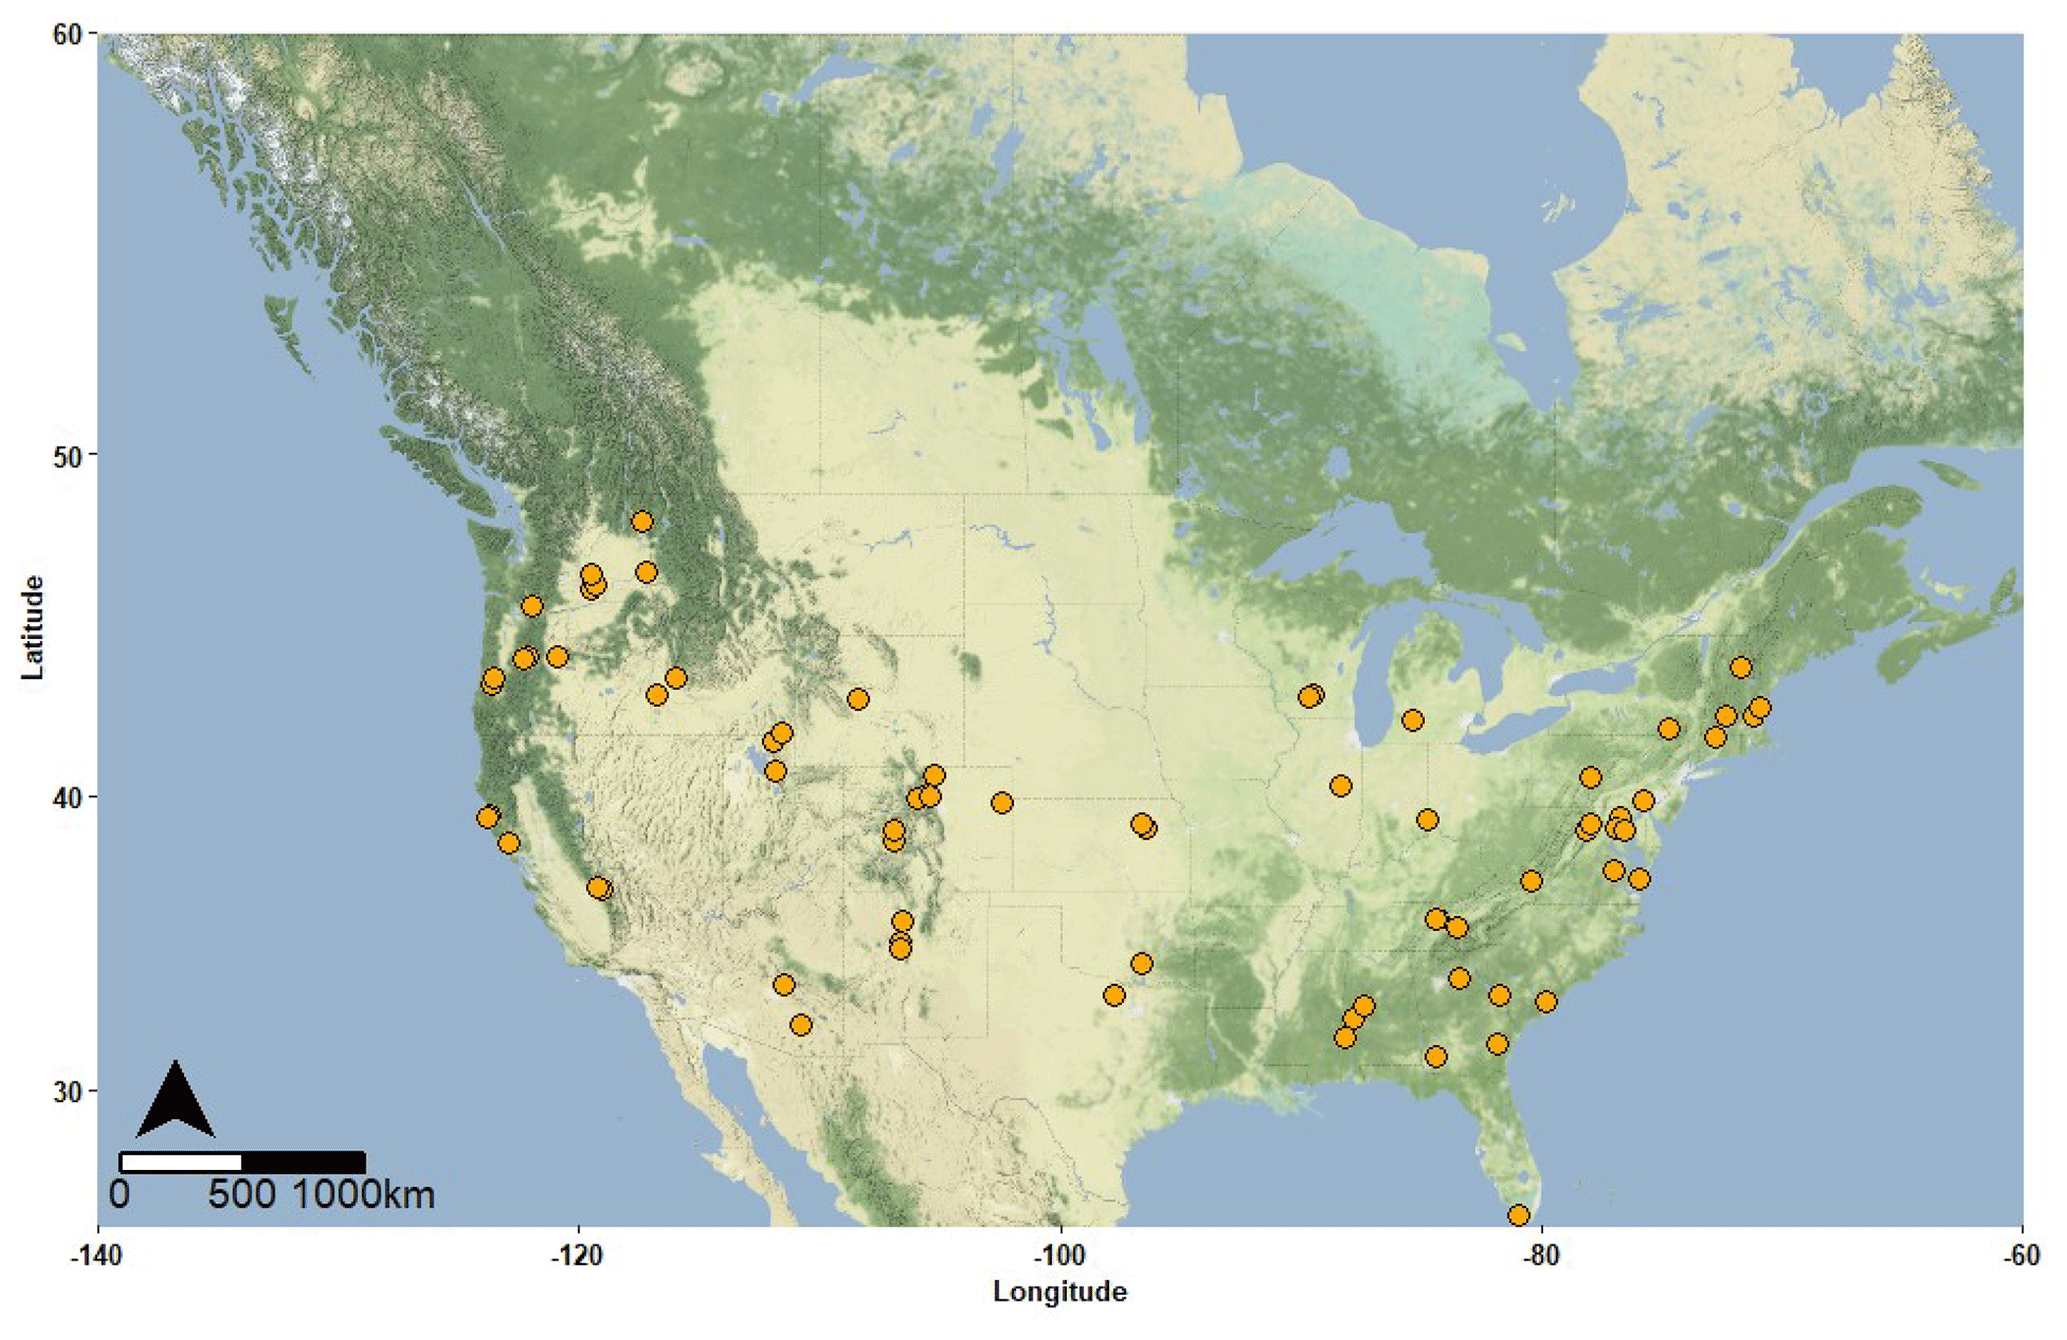
Figure 1Spatial distribution of sampling locations. At each location three sediment samples were collected from locations distributed along an upstream–downstream gradient within a single stream reach. The map was generated by Casey McGrath using R via function get_stamenmap in package ggmap (Kahle et al., 2013). Map tiles by Stamen Design, under CC BY 3.0, and the base map is copyrighted: ©OpenStreetMap contributors 2022. The base map is distributed under the Open Data Commons Open Database 504 License (ODbL) v1.0.
Sample collection and data generation
During the summer of 2019, the WHONDRS consortium carried out a multi-continent river corridor study to evaluate interactions between metabolomes, microbial metabolism, biogeochemical function, and ecosystem features. Garayburu-Caruso et al. (2020b) describe details on metadata, sample collection, analysis, and processing of ultrahigh-resolution mass spectrometry data. Briefly, during late July and August 2019 sediment samples were collected across multiple continents, but the current study focuses on samples collected in the contiguous United States (ConUS) (Fig. 1). Sampled locations spanned a broad range of environmental conditions; for example, stream order ranged from first to eighth, land cover composition varied with upstream forest cover ranging from 0 %–97 % and urban cover ranging from 0 %–28 %, and physical settings were from relatively steep headwater streams to large lowland rivers. At each site, shallow sediments (∼ 1–3 cm depth) were collected at three separate depositional zones. The zones were ∼ 10 m away from each other and were labeled as upstream, midstream, and downstream. Samples were shipped to the Pacific Northwest National Laboratory (PNNL) campus in Richland, WA (USA), on ice within 24 h of collection. We conceptualize these sediments as part of the hyporheic zone as we make the assumption that the supply and exchange of nutrients and OM from the stream influences the biogeochemical processes experienced by the sediments. In turn, we assume that all samples came from shallow (∼ 1–3 cm depth) hyporheic zone sediments through which surface water enters, moves through, and at some point returns to the main channel.
In the laboratory, sediments were sieved with a 2 mm sieve and subsampled into 50 mL conical tubes (Genesee Scientific Olympus™ Plastics) to separate field and incubation aliquots. Note that in the methods provided by Garayburu-Caruso et al. (2020b) there is an error in the description of the sediment preservation prior to mass spectrometry analysis. Corrected preservation methods are described immediately below. Sediments from the field aliquot were flash frozen in liquid nitrogen immediately after sieving to maintain the sediment characteristics observed in the field and stored at −80 ∘C until analysis. The incubation aliquots were not flash frozen immediately; instead they were kept in the dark inside an environmental chamber at 21 ∘C along with other sediments to be used for respiration measurements (see below) so that the two sets of sediment samples experienced the same conditions leading up to the use of the sediment for respiration estimation. The next morning, incubation aliquots were retrieved from the environmental chamber, flash frozen in liquid nitrogen, and stored at −80 ∘C until analysis. In our analyses we used the “field” sediments to study water-extractable organic carbon concentration and OM chemistry prior to the respiration incubation. We used the “incubation” sediments as a check for changes or variation in organic carbon concentration between field sediments and those sediments that were actually incubated. As a quality assurance procedure (detailed below), we removed samples with the largest changes in organic carbon concentration between field and incubation sediments.
Field and incubation sediments were extracted with Milli-Q water, and the resulting supernatant from sediment extractions was filtered through a 0.22 µm Sterivex filter (EMD Millipore). Non-purgeable organic carbon (NPOC) was determined on the supernatant by a Shimadzu combustion carbon analyzer TOC-L CSH/CSN E100V with ASI-L autosampler. We only included data from sites that had similar NPOC concentrations between the paired field and incubation samples. Our rationale for this approach is based on the assumption that if NPOC is highly variable across replicate sub-samples (i.e., across paired field and incubation samples), the associated sediments used for respiration measurements may have been highly heterogeneous despite our efforts to homogenize sediments prior to analyses. In turn, we assume that high heterogeneity may lead to unreliable estimates of NPOC, respiration, and OM molecular richness for a given site. Focusing analyses on the subset of sites that had relatively good correspondence in NPOC between field and incubation samples is, therefore, a conservative approach aimed at working with only the most reliable data.
To subset the data, we calculated the ratio between field and incubation NPOC concentrations within each site. If the ratio was less than 1, it was inverted so that all ratios were greater than 1 because the important consideration was the proportional difference between the field and the incubation NPOC concentrations. The same proportional difference could lead to ratios below or above 1 depending on whether field or incubation NPOC was higher. For our analysis we needed to know the proportional difference, not whether field NPOC was higher or lower than incubation NPOC. In turn, we inverted the field-to-incubation NPOC ratio if it was below 1 so that all proportional differences were more quantitatively comparable. We then regressed log-transformed field NPOC vs. log-transformed incubation NPOC and calculated the R2 of the associated regression. Log-transformation was used due to the presence of skewed NPOC distributions. Subsequently, we removed samples in order of their ratio, starting with the largest ratio (i.e., the largest proportional difference between field and incubation NPOC). Higher R2 values indicated a tighter relationship between field and incubation NPOC and thus more reliable data. We repeated these steps for all the samples in the field–incubation dataset (n=228). We then plotted the R2 vs. the number of samples removed and selected a threshold for the number of samples to remove (Fig. S1 in the Supplement). The resulting curve showed that R2 increased as a function of points removed until it leveled off. This nonlinear saturating relationship was well-described by a Michaelis–Menten function (Michaelis and Menten, 1913; Johnson and Goody, 2011). In this function, the half saturation constant indicates the resource availability at which half of the maximum intake is reached (Mulder and Hendriks, 2014). We used the half saturation constant, estimated from fitting the function to the data in Fig. S1, in a conceptually analogous way. That is, the half saturation constant indicated the number of samples that would need to be removed to gain half of the maximum potential increase in fit between field and incubation NPOC. This resulted in removing 30 samples, leading to R2 = 0.74 for the relationship between field and incubation NPOC, which was half way between a minimum R2 = 0.47 and maximum R2 = 1. This procedure was used to increase the reliability of the OM molecular richness estimates by removing samples that had the greatest variability in NPOC, which could translate into variability in OM richness as there was a weak but significant relationship between OM richness and NPOC (R2 = 0.20, p < 0.001, Fig. S2 in the Supplement).
Subsetting the data is a data quality control challenge, and there are a variety of ways in which one could approach it. In all quality control approaches there is a tradeoff between increasing confidence in data and removing so much data that statistical analyses become impossible. We aimed to increase data confidence up to an inflection point beyond which there appeared to be diminishing returns. Based on the functional form of the data, it appeared that a Michaelis–Menten function fit the data very well. This functional form also has the useful feature of estimating the half saturation constant, which we considered to be a practically useful inflection point.
Fourier transform ion cyclotron resonance mass spectrometry (FTICR-MS)
We used ultrahigh-resolution Fourier transform ion cyclotron resonance mass spectrometry (FTICR-MS) to generate mass spectra of sediment OM pools. Field sediment extracts were normalized to 1.5 mg C L−1, acidified to pH 2, and extracted with solid phase extraction (SPE) PPL cartridges following procedures described by Dittmar et al. (2008). Note that all samples were normalized to a consistent NPOC concentration prior to SPE, and the same sample volume was extracted with the same cartridges and resin mass. Since concentrations were normalized prior SPE, we did not measure extraction efficiency post-extraction. While extraction efficiency will vary across samples, our approach focuses on studying how many unique molecules were present in a sample rather than the relative concentrations of individual molecules. We assume that variation in extraction efficiency is not systematically linked to respiration rate to such a degree that the number of detected peaks becomes correlated with respiration. Although we cannot definitively evaluate this assumption, we do not use information on relative peak intensities, which should be influenced by SPE more than the number of peaks is influenced by SPE. It seems extremely unlikely that the number of observed peaks would become systematically and spuriously linked to respiration due to variation in extraction efficiency. In the worst case, biases would strengthen the statistical link between respiration and the number of unique peaks, but we found this relationship to be very weak (see “Results and discussion”).
FTICR-MS analyses were carried out at the Environmental Molecular Science Laboratory (EMSL) in Richland, WA, using a 12 tesla (12 T) Bruker SolariX FTICR mass spectrometer (Bruker, SolariX, Billerica, MA, USA) in negative mode. The method used to assign molecular formulas to FTICR-MS spectra is described in Garayburu-Caruso et al. (2020b). Briefly, Formularity (Tolić et al., 2017) was used to align mass lists generated using Bruker DataAnalysis V4.2. Resulting reports were processed using ftmsRanalysis (Bramer et al., 2020). It is important to note that FTICR-MS is a non-targeted approach to reliably identify molecular formulas of organic molecules with masses, but it is not quantitative and does not provide information about the structure of the molecular formulas identified. Our analyses on the field FTICR-MS data only included samples that passed through the subsetting process described above based on field and incubation NPOC. We calculated OM richness as the total number of unique peaks present in one sample.
Incubations and respiration rates
Respiration rates were determined following methods described by Garayburu-Caruso et al. (2020a). Sieved sediments were subsampled into 40 mL clear glass vials (I-Chem amber VOA glass vials) with a 0.5 cm diameter factory calibrated oxygen sensor dot (Fibox 3; PreSens GmbH, Regensburg, Germany). Vials with sediments and unfiltered water from each site were kept in the dark inside the environmental chamber at 21 ∘C until next-day incubations. Reactors consisted of 10 mL of sieved sediments and ∼ 30–35 mL of aerated unfiltered water with no headspace, shaken at 250 rpm for 2 h. Dissolved oxygen (DO) was measured noninvasively every 15 min for the first hour and every 30 min during the second hour using an oxygen optical meter (Fibox 3; PreSens GmbH, Germany) to read the oxygen sensor dots on the vials. Respiration rates were calculated as the slope of the linear regression between DO concentration and incubation time for each reactor and further normalized per gram of sediment in each reactor. Normalized and not-normalized rates are reported in this article.
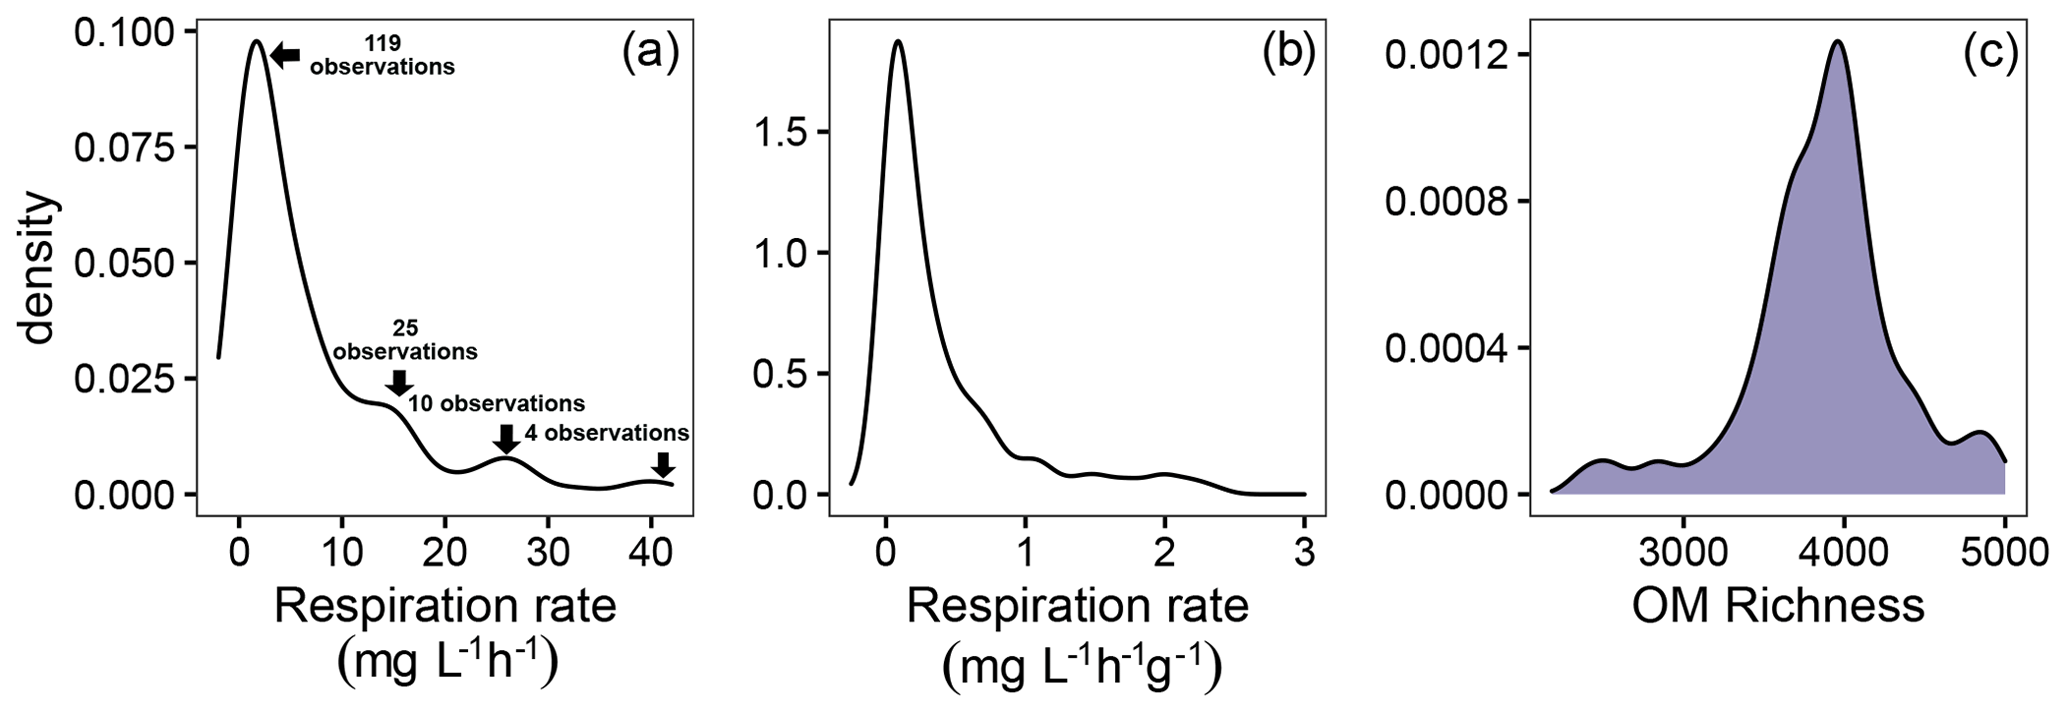
Figure 2Density plots of aerobic respiration measured as oxygen consumption that was either not normalized relative to sediment mass (a) or normalized by sediment mass (b). Panel (c) is a density plot for the number of unique peaks identified in sediment samples, which we refer to as OM richness.
Statistical analysis
All statistical analyses were completed using R (version 3.6.3) (R Core Team, 2021) with p < 0.05 as the significance threshold. We used ordinary least squares regressions (function “lm”) to evaluate relationships between respiration rates and OM richness or NPOC. While not initially expected, we observed an apparent non-linear constraint-based relationship between respiration rate and the inverse of NPOC. To evaluate the statistical significance of the constraint boundary, we subdivided the data into 10 even bins and found the maximum respiration rate in each of those bins. We then fit a negative exponential function to the relationship between maximum respiration rates and the values associated with those maxima (i.e., we did not use the average of each bin). To evaluate the potential contribution of OM richness, we used the same approach to regress respiration rate against the ratio of OM richness to NPOC concentration. Base functions in R and ggplot2 (Wickham, 2016) were used for these analyses and associated plotting.
Scripts necessary to reproduce the primary results of this article are available at https://github.com/WHONDRS-Hub/Respiration_and_OM_Richness/, last access: 24 June 2022. Goldman et al. (2020) provide the raw, unprocessed FTICR-MS data and respiration rate data. FTICR-MS data used in this article were processed following instructions provided in the Goldman et al. (2020) data package.
Both respiration rates and OM molecular richness varied significantly across samples, providing a useful dataset to study the hypothesized negative relationship between these two variables. More specifically, the distribution of aerobic respiration rates revealed a broad range of rates that were highly skewed for rates that were either not normalized (Fig. 2a) or were normalized (Fig. 2b) per gram of sediment. These skewed distributions indicate the potential for biogeochemical “hot spots” (McClain et al., 2003) or “control points” (Bernhardt et al., 2017) at the continental scale. The distribution for OM molecular richness (i.e., number of identified organic molecules) appeared to be multimodal but dominated by one primary peak (Fig. 2c). OM molecular richness ranged from ∼ 2000–5000 peaks, and we took advantage of this variation to evaluate the relationship between OM richness and respiration rates.
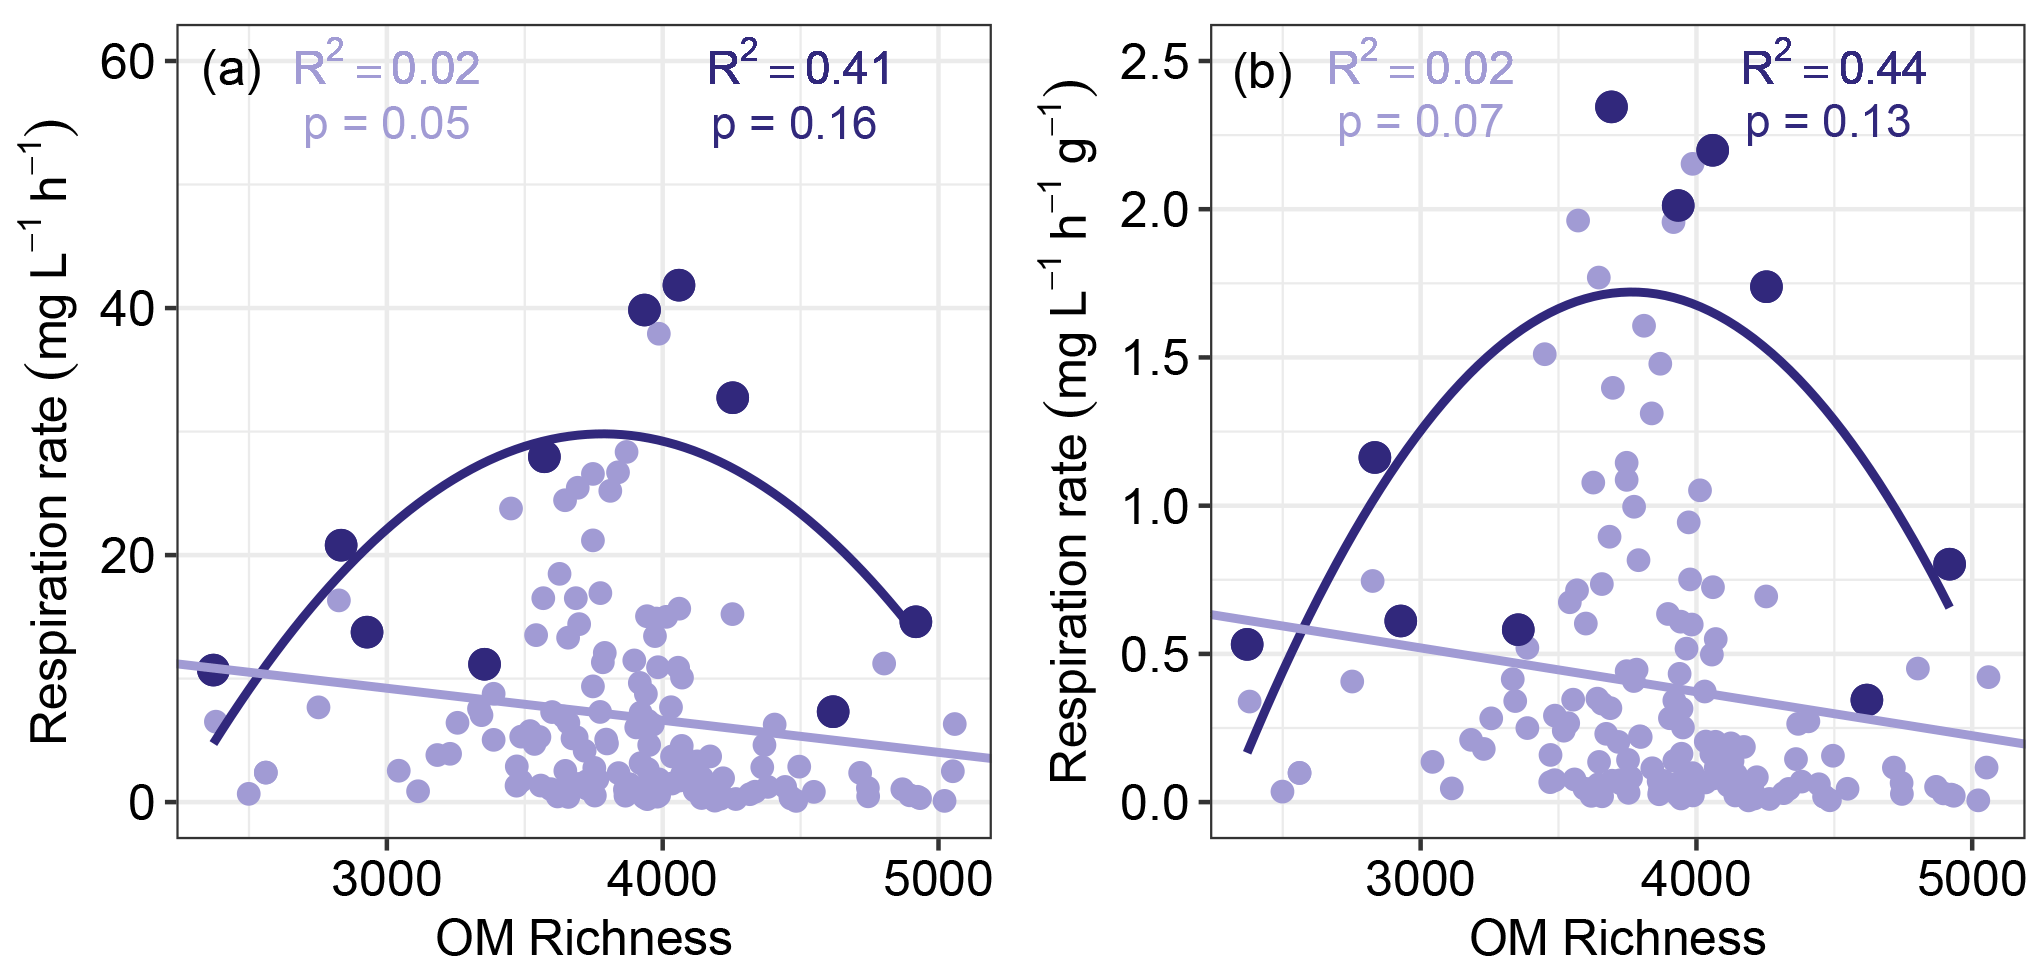
Figure 3Sediment aerobic respiration as a function of OM richness. Respiration was measured as oxygen consumption and was either not normalized (a) or normalized by sediment mass (b). Quadratic regression models based on maximum respiration rates are shown in dark purple, while linear regression models based on all respiration values are shown in light purple. Maximum respiration rates were found by subdividing each horizontal axis into 10 even bins. In all cases the models provided poor fits to the data.
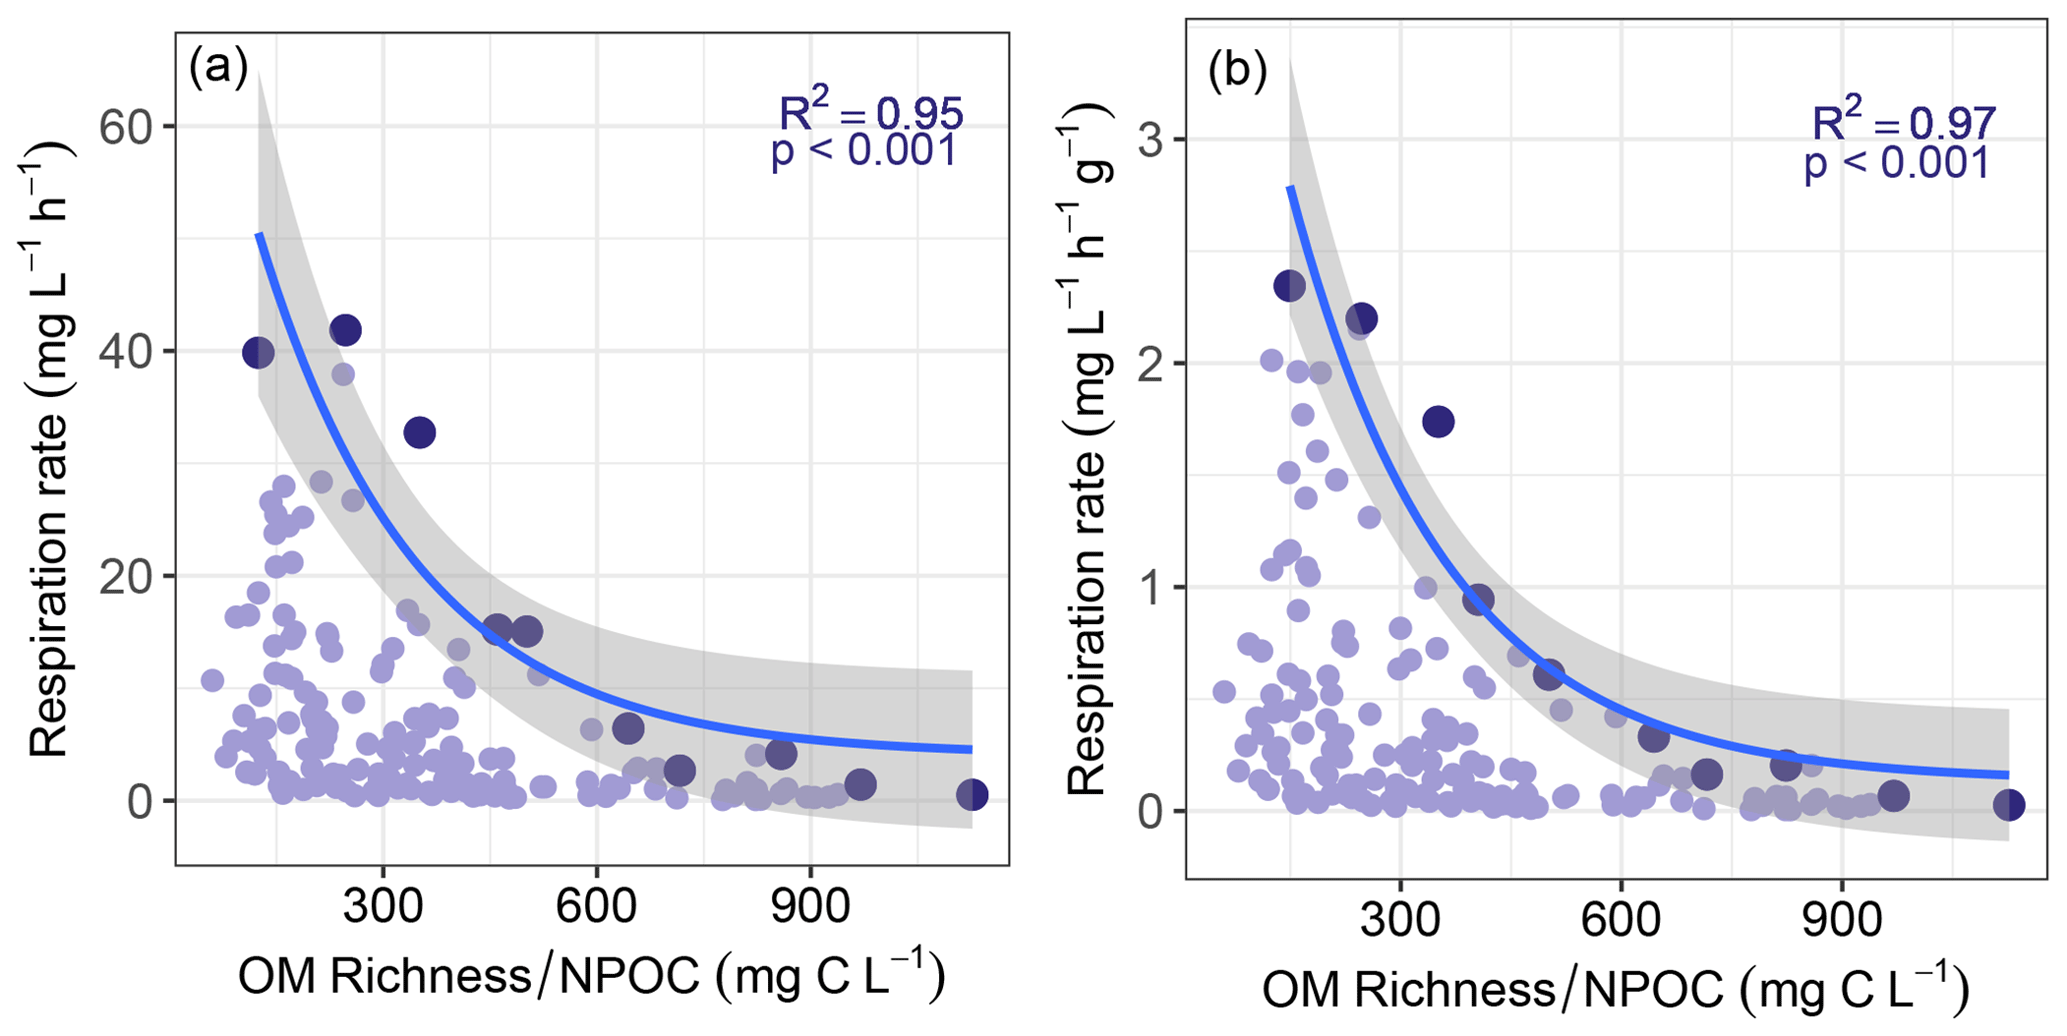
Figure 4Maximum sediment respiration rate decreased with increasing values of ratio of OM molecular richness to non-purgeable organic carbon concentration (NPOC). Panels (a) and (b) are for respiration that was either not normalized or normalized by sediment mass, respectively. Maximum respiration rates (shown in the darker colors) were found by subdividing each horizontal axis into 10 even bins. All other respiration rates and the corresponding richness-to-concentration ratios are shown in lighter colors. Solid lines represent negative exponential models fit to the maximum respiration rates, with shaded areas indicating 95 % confidence intervals. Statistics for each model are provided on each panel. Statistics associated with exponential regression models based on all respiration values (light purple) can be found in Table S1.
We did not observe a clear negative relationship between sediment aerobic respiration rates and OM molecular richness, which rejected the hypothesis that higher OM richness will suppress respiration (Fig. 3a and c). The data in Fig. 3 suggest there may instead be a peak in maximum respiration rate near intermediate levels of OM molecular richness. There may, therefore, be an optimal level of OM molecular richness that enables high respiration rates but does not guarantee elevated rates, leading to a unimodal constraint space. Regressions based on maximum respiration rates across the OM richness axis were not significant, however (Fig. 3). These results further reject the hypothesis of any direct relationship between respiration rate and OM richness.
While we did not observe a direct link between respiration and OM richness, extending the Lehmann et al. (2020) hypothesis revealed a potential influence of OM richness, after controlling for water-soluble organic carbon (OC) concentration, measured as NPOC. That is, we posit that any connection between OM richness and respiration is likely modified by the amount of OC. The magnitude of OM richness relative to the concentration of OC could, therefore, provide a stronger constraint over respiration than OM richness alone. High ratios indicate high levels of OM richness relative to the amount of OC, while low ratios indicate low levels of OM richness relative to the amount of OC. In the context of the Lehmann et al. (2020) hypothesis, respiration would therefore be expected to decrease with increasing richness-to-concentration ratios.
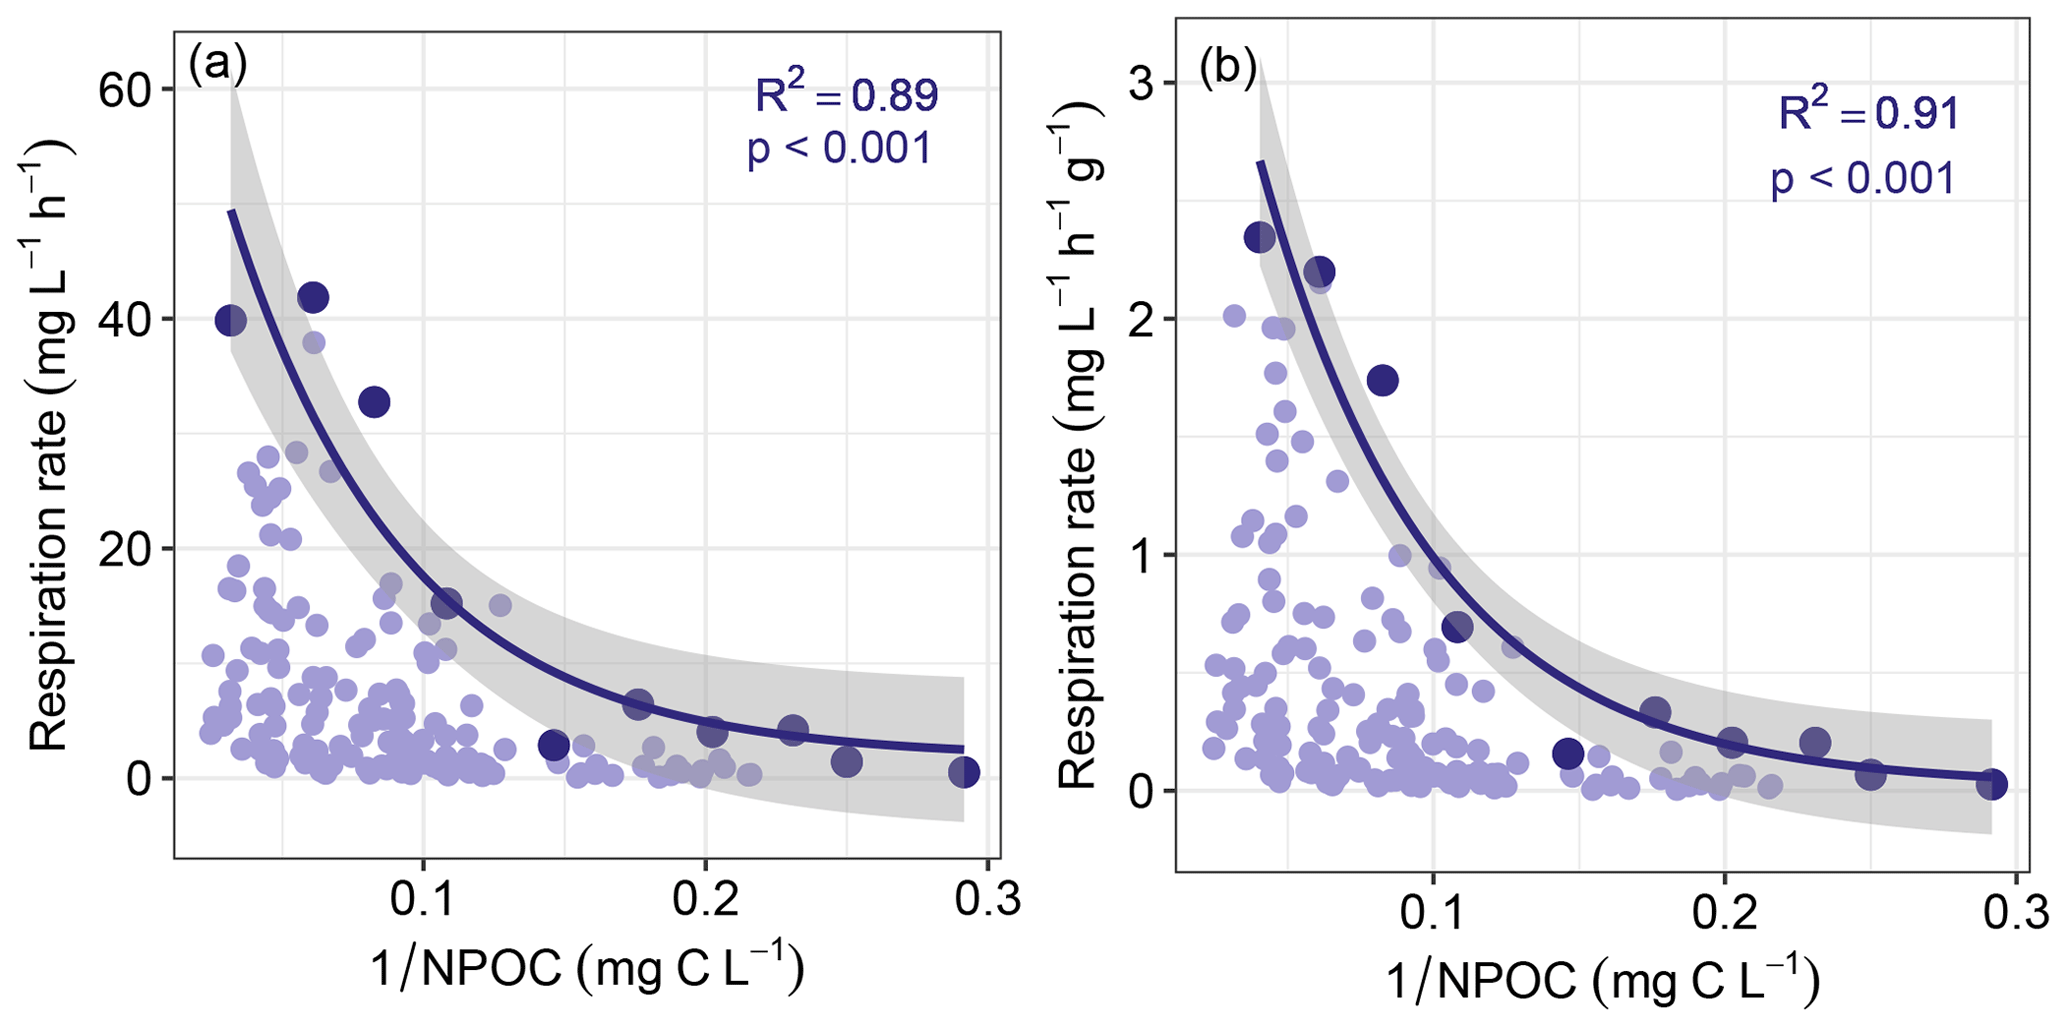
Figure 5Maximum sediment respiration decreased with the inverse of non-purgeable organic carbon concentration (NPOC). Panels (a) and (b) are for respiration that was either not normalized or normalized by sediment mass, respectively. Maximum respiration rates (shown in the darker colors) were found by subdividing each horizontal axis into 10 even bins. All other respiration rates and the corresponding values are shown in lighter colors. Solid lines represent negative exponential models fit to the maximum respiration rates, with shaded areas indicating 95 % confidence intervals. Statistics for each model are provided on each panel. Statistics associated with exponential regression models based on all respiration values (light purple) can be found in Table S1.
Consistent with this extended hypothesis, we find that maximum respiration rates decreased with increasing richness-to-concentration ratios (Fig. 4). This suggests that at the continental-scale OM molecular richness may indirectly influence aerobic respiration rates. However, the influence of OM richness is likely to be relatively minor. That is, maximum respiration rate was also well-explained simply to the inverse of OC concentration (Fig. 5). Note that regression models applied to the whole datasets presented in Figs. 4 and 5 were relatively weak when compared to models of the constraint boundaries (R2 = 0.32–0.34 vs. R2 = 0.89–0.97; Table S1 in the Supplement). This further supports our inference of respiration rates being constrained based on the richness-to-concentration ratio. Additionally, the relationship between respiration rates and OC concentrations was relatively weak (Fig. S3 in the Supplement). The statistical models using the richness-to-concentration ratio are technically better models as they have higher R2 values than models using only the inverse of OC concentration (cf. Figs. 4 and 5). We also note that both types of models are univariate, so there is no penalty for multiple explanatory variables. The bulk of variation in maximum respiration rates (∼ 90 %) is, however, explained simply by the inverse of OC concentration.
We infer that OC concentration could impose a primary constraint over maximum respiration rates, with OM richness potentially contributing additional constraints. As such, any influences of OM richness over respiration rates in hyporheic zone sediments are likely modulated by OC concentration. This is conceptually consistent with observations in marine (Arrieta et al., 2015) and river corridor systems (Stegen et al., 2018). That is, when OM molecular richness is high relative to OC concentration, the probability of a microbe repeatedly encountering the same type of molecule is minimized. In that case, the costs of maintaining metabolic machinery to metabolize any specific type of molecule may outweigh the energy gains (Arrieta et al., 2015). When costs outweigh gains, respiration is expected to be minimized, which is consistent with the respiration constraint boundary to be lowest at the highest richness-to-concentration ratios. In addition, the constraint boundary was non-linear, which is most likely due to the fact that respiration rates cannot be below zero such that increasingly large richness-to-concentration ratios cannot further suppress respiration.
The combined influences of OM richness and OC concentration are realized as a non-linear constraint space with the vast majority of measured respiration rates falling well below the constraint boundary. This indicates that in most cases, additional controls over respiration drive respiration below its potential maximum. Discerning these additional controls is an important avenue of future work. For example, it would be useful to evaluate the degree to which microbial community diversity, composition, biomass, and/or functional potential are related to deviations from the constraint boundary. In addition, the FTICR-MS data used here provide presence–absence of organic molecules, but not relative abundances of organic molecules. Accounting for among-molecule variation in concentrations could provide insights into factors driving respiration below the constraint boundary. Any potential biases introduced by solid phase extraction (see Methods) and other methodological details would, however, need to be accounted for prior to including information on relative abundances. In addition, we removed data points that had high measurement uncertainty (see Methods) as these could mask true relationships. This focused our analyses on samples with relatively homogenous sediments. Locations with very heterogeneous sediments, even after sieving to < 2 mm, may be important to capture in future analyses. One approach to meet this challenge is analyzing a small number of technical replicates (∼ 3) for all locations, examining variation among them, and analyzing numerous ( > 10) additional technical replicates for locations with the most heterogeneous sediments. This would be an efficient way to enable robust use of all sampled systems. Geography is another aspect that needs broader consideration in future efforts. The current study was limited to the ConUS and within that domain there were some poorly sampled regions (Fig. 1) due to logistical limitations. Improved and expanded geographic sampling may not change the constraint boundary itself, but it will likely help discern what drives variation below the boundary. More generally, there are many potential influences spanning physical (e.g., sediment texture), chemical (e.g., mineralogy), and biological (e.g., fungal-to-bacterial ratios) features that could modulate the location of any given sample or system relative to the constraint boundary quantified here. Exploring system heterogeneity in context of these additional features will be helpful to understand what drives samples/systems below the constraint boundary.
The outcomes of our study are useful for guiding models towards and away from features and processes that need to be represented to enable predictions of river corridor biogeochemical function. For large-scale models, it appears there is a constraint envelope for hyporheic zone respiration rates that is related primarily to OC concentration and even more strongly to OM richness relative to OC concentration. This constraint boundary emerged from sites distributed across the ConUS (Fig. S4 in the Supplement), indicating that it is transferable across a broad range of river corridor systems. The richness-to-concentration ratio, therefore, offers a simple way to represent variation in maximum respiration rates across river corridors. Furthermore, for sites without estimates of OM richness, our results suggest that variation in maximum respiration rate could be reasonably estimated via OC concentration alone. The constraint spaces observed here could also be included in models more mechanistically whereby they would emerge from the representation of how microbial metabolism is influenced by both OM molecular richness and OC concentration. The constraint spaces could, alternatively, be included more phenomenologically in models through probabilistic sampling respiration rates within the constraint space. Regardless of how the constraint boundaries are represented in models, they have important implications for fundamental and applied aspects of river corridors. Systems that are close to the boundary will consume more oxygen within their sediments, potentially releasing more CO2 (Saccardi and Winnick, 2021) and having negative influences on fish embryos (Jensen et al., 2009), but positive influences on contaminant transformations (Fischer et al., 2005; Lewandowski et al., 2019). Knowledge of what environmental factors move systems closer to or further away from the constraints boundaries will, therefore, be helpful in making decisions about how to manage river corridors.
There may be additional aspects of OM molecular richness and chemical diversity (e.g., thermodynamic properties, elemental ratios) that influence respiration and other biogeochemical rates in hyporheic zone sediments (e.g., Garayburu-Caruso et al., 2020a; Song et al., 2020). There are rich opportunities for future studies to explore links between respiration rates and a broad range of univariate and multivariate OM diversity measures quantified through metrics such as Rao's entropy (Mentges et al., 2017) and dendrogram-based methods (Danczak et al., 2020, 2021; Hu et al., 2022). There is a need to examine such possibilities at both local and global scales and to extend our river-focused analyses to additional ecosystem types. The methods, data, and metadata from this study are all used/formatted consistently to enable expansion of this dataset to more rivers and/or other systems such as soils and marine sediments. Continuing to use the approaches and formats established here will facilitate synthesis and, in turn, knowledge of what patterns and processes are or are not transferable across ecosystems.
Scripts necessary to reproduce the primary results of this article are available at https://github.com/WHONDRS-Hub/Respiration_and_OM_Richness/. This GitHub repository also includes the version of data used for analyses in this paper, and any reuse should cite Goldman et al. (2020).
Data were published previously in Goldman et al. (2020) in the ESS-DIVE repository and are licensed for reuse under the Creative Commons Attribution 4.0 International License. Software can be accessible as indicated in the code availability statement.
The supplement related to this article is available online at: https://doi.org/10.5194/bg-20-2857-2023-supplement.
JCS and VAGC conceptualized the study, VAGC performed analyses with feedback from JCS, RED processed some of the data, AEG managed the sampling campaign, and LR, JMT, and JH processed samples. JCS and VAGC drafted the initial manuscript and all authors contributed to revisions.
The contact author has declared that none of the authors has any competing interests.
Publisher's note: Copernicus Publications remains neutral with regard to jurisdictional claims in published maps and institutional affiliations.
We would like to thank the Worldwide Hydrobiogeochemical Observation Network for Dynamic River Systems (WHONDRS) consortium members for collecting the samples used in this study. WHONDRS and the associated data and science could not exist without efforts from the consortium. For this study, WHONDRS was supported by the River Corridor Science Focus Area (SFA) at the Pacific Northwest National Laboratory (PNNL). The SFA is supported by the United States Department of Energy, Office of Biological and Environmental Research (BER), Environmental System Science (ESS) Program. Some of the data used for this study were generated at the United States Department of Energy Environmental Molecular Science Laboratory User Facility. PNNL is operated by Battelle Memorial Institute for the United States Department of Energy under contract no. DE-AC05-76RL01830. We thank Casey McGrath for generating Fig. 1 and providing the associated R scripts.
This research has been supported by the U.S. Department of Energy (grant no. 54737).
This paper was edited by Andrew Thurber and reviewed by two anonymous referees.
Arrieta, J. M., Mayol, E., Hansman, R. L., Herndl, G. J., Dittmar, T., and Duarte, C. M.: Dilution limits dissolved organic carbon utilization in the deep ocean, Science, 348, 331–333, https://doi.org/10.1126/science.1258955, 2015.
Battin, T. J., Kaplan, L. A., Newbold, J. D., and Hendricks, S. P.: A mixing model analysis of stream solute dynamics and the contribution of a hyporheic zone to ecosystem function, Freshwater Biol., 48, 995–1014, https://doi.org/10.1046/j.1365-2427.2003.01062.x, 2003.
Bernhardt, E. S., Blaszczak, J. R., Ficken, C. D., Fork, M. L., Kaiser, K. E., and Seybold, E. C.: Control Points in Ecosystems: Moving Beyond the Hot Spot Hot Moment Concept, Ecosystems, 20, 665–682, https://doi.org/10.1007/s10021-016-0103-y, 2017.
Boulton, A. J., Findlay, S., Marmonier, P., Stanley, E. H., and Valett, H. M.: The functional significance of the hyporheic zone in streams and rivers, Annu. Rev. Ecol. Syst., 29, 59–81, https://doi.org/10.1146/annurev.ecolsys.29.1.59, 1998.
Bramer, L. M., White, A. M., Stratton, K. G., Thompson, A. M., Claborne, D., Hofmockel, K., and McCue, L. A.: ftmsRanalysis: An R package for exploratory data analysis and interactive visualization of FT-MS data, PLOS Comput. Biol., 16, e1007654, https://doi.org/10.1371/journal.pcbi.1007654, 2020.
Burrows, R. M., Rutlidge, H., Bond, N. R., Eberhard, S. M., Auhl, A., Andersen, M. S., Valdez, D. G., and Kennard, M. J.: High rates of organic carbon processing in the hyporheic zone of intermittent streams, Sci. Rep., 7, 1–11, https://doi.org/10.1038/s41598-017-12957-5, 2017.
Comer-Warner, S. A., Gooddy, D. C., Ullah, S., Glover, L., Percival, A., Kettridge, N., and Krause, S.: Seasonal variability of sediment controls of carbon cycling in an agricultural stream, Sci. Total Environ., 688, 732–741, https://doi.org/10.1016/j.scitotenv.2019.06.317, 2019.
Danczak, R. E., Chu, R. K., Fansler, S. J., Goldman, A. E., Graham, E. B., Tfaily, M. M., Toyoda, J., and Stegen, J. C.: Using metacommunity ecology to understand environmental metabolomes, Nat. Commun., 11, 6369, https://doi.org/10.1038/s41467-020-19989-y, 2020.
Danczak, R. E., Goldman, A. E., Chu, R. K., Toyoda, J. G., Garayburu-Caruso, V. A., Tolić, N., Graham, E. B., Morad, J. W., Renteria, L., Wells, J. R., Herzog, S. P., Ward, A. S., and Stegen, J. C.: Ecological theory applied to environmental metabolomes reveals compositional divergence despite conserved molecular properties, Sci. Total Environ., 788, 147409, https://doi.org/10.1016/j.scitotenv.2021.147409, 2021.
Dittmar, T., Koch, B., Hertkorn, N., and Kattner, G.: A simple and efficient method for the solid-phase extraction of dissolved organic matter (SPE-DOM) from seawater, Limnol. Oceanogr.-Meth., 6, 230–235, https://doi.org/10.4319/lom.2008.6.230, 2008.
Drake, T. W., Raymond, P. A., and Spencer, R. G. M.: Terrestrial carbon inputs to inland waters: A current synthesis of estimates and uncertainty, Limnol. Oceanogr. Lett., 3, 132–142, https://doi.org/10.1002/lol2.10055, 2018.
Fischer, H., Kloep, F., Wilzcek, S., and Pusch, M. T.: A river's liver–microbial processes within the hyporheic zone of a large lowland river, Biogeochemistry, 76, 349–371, 2005.
Fuss, C. and Smock, L.: Spatial and temporal variation of microbial respiration rates in a blackwater stream, Freshwater Biol., 36, 339–349, https://doi.org/10.1046/j.1365-2427.1996.00095.x, 1996.
Garayburu-Caruso, V. A., Stegen, J. C., Song, H.-S., Renteria, L., Wells, J., Garcia, W., Resch, C. T., Goldman, A. E., Chu, R. K., Toyoda, J., and Graham, E. B.: Carbon Limitation Leads to Thermodynamic Regulation of Aerobic Metabolism, Environ. Sci. Tech. Let., 7, 517–524, https://doi.org/10.1021/acs.estlett.0c00258, 2020a.
Garayburu-Caruso, V. A., Danczak, R. E., Stegen, J. C., Renteria, L., Mccall, M., Goldman, A. E., Chu, R. K., Toyoda, J., Resch, C. T., Torgeson, J. M., Wells, J., Fansler, S., Kumar, S., and Graham, E. B.: Using community science to reveal the global chemogeography of river metabolomes, Metabolites, 10, 518, https://doi.org/10.3390/metabo10120518, 2020b.
Goldman, A. E., Arnon, S., Bar-Zeev, E., Chu, R. K., Danczak, R. E., Daly, R. A., Delgado, D., Fansler, S., Forbes, B., Garayburu-Caruso, V. A., Graham, E. B., Laan, M., McCall, M. L., McKever, S., Patel, K. F., Ren, H., Renteria, L., Resch, C. T., Rod, K. A., Tfaily, M., Tolic, N., Torgeson, J. M., Toyoda, J. G., Wells, J., Wrighton, K. C., Stegen, J. C., and Consortium, T. W.: WHONDRS Summer 2019 Sampling Campaign: Global River Corridor Sediment FTICR-MS, Dissolved Organic Carbon, Aerobic Respiration, Elemental Composition, Grain Size, Total Nitrogen and Organic Carbon Content, Bacterial Abundance, and Stable Isotopes, River Corridor and Watershed Biogeochemistry SFA, ESS-DIVE repository [data set], https://doi.org/10.15485/1729719, https://data.ess-dive.lbl.gov/datasets/doi:10.15485/1729719 (last access: 7 Juli 2022), 2020.
Graham, E. B., Tfaily, M. M., Crump, A. R., Goldman, A. E., Bramer, L. M., Arntzen, E., Romero, E., Resch, C. T., Kennedy, D. W., and Stegen, J. C.: Carbon Inputs From Riparian Vegetation Limit Oxidation of Physically Bound Organic Carbon Via Biochemical and Thermodynamic Processes, J. Geophys. Res.-Biogeo., 122, 3188–3205, https://doi.org/10.1002/2017JG003967, 2017.
Graham, E. B., Crump, A. R., Kennedy, D. W., Arntzen, E., Fansler, S., Purvine, S. O., Nicora, C. D., Nelson, W., Tfaily, M. M., and Stegen, J. C.: Multi 'omics comparison reveals metabolome biochemistry, not microbiome composition or gene expression, corresponds to elevated biogeochemical function in the hyporheic zone, Sci. Total Environ., 642, 742–753, https://doi.org/10.1016/j.scitotenv.2018.05.256, 2018.
Harvey, J. and Gooseff, M.: River corridor science: Hydrologic exchange and ecological consequences from bedforms to basins, Water Resour. Res., 51, 6893–6922, https://doi.org/10.1002/2015WR017617, 2015.
Hu, A., Jang, K.-S., Meng, F., Stegen, J., Tanentzap, A. J., Choi, M., Lennon, J. T., Soininen, J., and Wang, J.: Microbial and Environmental Processes Shape the Link between Organic Matter Functional Traits and Composition, Environ. Sci. Technol., 56, 10504–10516, https://doi.org/10.1021/acs.est.2c01432, 2022.
Jensen, D. W., Steel, E. A., Fullerton, A. H., and Pess, G. R.: Impact of Fine Sediment on Egg-To-Fry Survival of Pacific Salmon: A Meta-Analysis of Published Studies, Rev. Fish. Sci., 17, 348–359, https://doi.org/10.1080/10641260902716954, 2009.
Johnson, K. A. and Goody, R. S.: The Original Michaelis Constant: Translation of the 1913 Michaelis–Menten Paper, Biochemistry, 50, 8264–8269, https://doi.org/10.1021/bi201284u, 2011.
Jones, J.: Factors controlling hyporheic respiration in a desert stream, Freshwater Biol., 34, 91–99, https://doi.org/10.1111/j.1365-2427.1995.tb00426.x, 1995.
Kahle, D. and Wickham, H.: ggmap: Spatial Visualization with ggplot2, R J., 5, 144–161, 2013.
Kaplan, L. A. and Newbold, J. D.: 10 – Surface and Subsurface Dissolved Organic Carbon, in: Streams and Ground Waters, edited by: Jones, J. B. and Mulholland, P. J., Academic Press, San Diego, 237–258, https://doi.org/10.1016/B978-012389845-6/50011-9, 2000.
Krause, S., Hannah, D. M., Fleckenstein, J. H., Heppell, C. M., Kaeser, D., Pickup, R., Pinay, G., Robertson, A. L., and Wood, P. J.: Inter-disciplinary perspectives on processes in the hyporheic zone, Ecohydrology, 4, 481–499, https://doi.org/10.1002/eco.176, 2011.
Lehmann, J., Hansel, C. M., Kaiser, C., Kleber, M., Maher, K., Manzoni, S., Nunan, N., Reichstein, M., Schimel, J. P., Torn, M. S., Wieder, W. R., and Kögel-Knabner, I.: Persistence of soil organic carbon caused by functional complexity, Nat. Geosci., 13, 529–534, https://doi.org/10.1038/s41561-020-0612-3, 2020.
Lewandowski, J., Arnon, S., Banks, E., Batelaan, O., Betterle, A., Broecker, T., Coll, C., Drummond, J. D., Gaona Garcia, J., Galloway, J., Gomez-Velez, J., Grabowski, R. C., Herzog, S. P., Hinkelmann, R., Höhne, A., Hollender, J., Horn, M. A., Jaeger, A., Krause, S., Löchner Prats, A., Magliozzi, C., Meinikmann, K., Mojarrad, B. B., Mueller, B. M., Peralta-Maraver, I., Popp, A. L., Posselt, M., Putschew, A., Radke, M., Raza, M., Riml, J., Robertson, A., Rutere, C., Schaper, J. L., Schirmer, M., Schulz, H., Shanafield, M., Singh, T., Ward, A. S., Wolke, P., Wörman, A., and Wu, L.: Is the Hyporheic Zone Relevant beyond the Scientific Community?, Water, 11, 2230, https://doi.org/10.3390/w11112230, 2019.
McClain, M. E., Boyer, E. W., Dent, C. L., Gergel, S. E., Grimm, N. B., Groffman, P. M., Hart, S. C., Harvey, J. W., Johnston, C. A., Mayorga, E., McDowell, W. H., and Pinay, G.: Biogeochemical Hot Spots and Hot Moments at the Interface of Terrestrial and Aquatic Ecosystems, Ecosystems, 6, 301–312, https://doi.org/10.1007/s10021-003-0161-9, 2003.
Mentges, A., Feenders, C., Seibt, M., Blasius, B., and Dittmar, T.: Functional Molecular Diversity of Marine Dissolved Organic Matter Is Reduced during Degradation, Front. Mar. Sci., 4, https://doi.org/10.3389/fmars.2017.00194, 2017.
Michaelis, L. and Menten, M. L.: Die kinetik der invertinwirkung, Biochem. Z., 49, 333–369, 1913.
Mulder, C. and Hendriks, A. J.: Half-saturation constants in functional responses, Global Ecol. Conserv., 2, 161–169, 2014.
Naegeli, M. W. and Uehlinger, U.: Contribution of the Hyporheic Zone to Ecosystem Metabolism in a Prealpine Gravel-Bed-River, J. N. Am. Benthol. Soc., 16, 794–804, https://doi.org/10.2307/1468172, 1997.
Newcomer, M. E., Hubbard, S. S., Fleckenstein, J. H., Maier, U., Schmidt, C., Thullner, M., Ulrich, C., Flipo, N., and Rubin, Y.: Influence of Hydrological Perturbations and Riverbed Sediment Characteristics on Hyporheic Zone Respiration of CO2 and N2, J. Geophys. Res.-Biogeo., 123, 902–922, https://doi.org/10.1002/2017JG004090, 2018.
Orghidan, T.: A new habitat of subsurface waters: the hyporheic biotope, Fund. Appl. Limnol., 291–302, https://doi.org/10.1127/1863-9135/2010/0176-0291, 2010.
R Core Team: R: A Language and Environment for Statistical Computing, R Foundation for Statistical Computing, Vienna, Austria, 2021.
Raymond, P. A., Hartmann, J., Lauerwald, R., Sobek, S., McDonald, C., Hoover, M., Butman, D., Striegl, R., Mayorga, E., Humborg, C., Kortelainen, P., Dürr, H., Meybeck, M., Ciais, P., and Guth, P.: Global carbon dioxide emissions from inland waters, Nature, 503, 355–359, https://doi.org/10.1038/nature12760, 2013.
Saccardi, B. and Winnick, M.: Improving Predictions of Stream CO2 Concentrations and Fluxes Using a Stream Network Model: A Case Study in the East River Watershed, CO, USA, Global Biogeochem. Cy., 35, e2021GB006972, https://doi.org/10.1029/2021GB006972, 2021.
Schlesinger, W. H. and Melack, J. M.: Transport of organic carbon in the world's rivers, Tellus, 33, 172–187, https://doi.org/10.3402/tellusa.v33i2.10706, 1981.
Schlünz, B. and Schneider, R. R.: Transport of terrestrial organic carbon to the oceans by rivers: re-estimating flux- and burial rates, Int. J. Earth Sci., 88, 599–606, https://doi.org/10.1007/s005310050290, 2000.
Schmidt, M. W. I., Torn, M. S., Abiven, S., Dittmar, T., Guggenberger, G., Janssens, I. A., Kleber, M., Kögel-Knabner, I., Lehmann, J., Manning, D. A. C., Nannipieri, P., Rasse, D. P., Weiner, S., and Trumbore, S. E.: Persistence of soil organic matter as an ecosystem property, Nature, 478, 49–56, https://doi.org/10.1038/nature10386, 2011.
Sengupta, A., Fansler, S. J., Chu, R. K., Danczak, R. E., Garayburu-Caruso, V. A., Renteria, L., Song, H.-S., Toyoda, J., Wells, J., and Stegen, J. C.: Disturbance Triggers Non-Linear Microbe-Environment Feedbacks, bioRxiv, 2020.09.30.314328, https://doi.org/10.1101/2020.09.30.314328, 2020.
Son, K., Fang, Y., Gomez-Velez, J. D., and Chen, X.: Spatial Microbial Respiration Variations in the Hyporheic Zones Within the Columbia River Basin, J. Geophys. Res.-Biogeo., 127, e2021JG006654, https://doi.org/10.1029/2021JG006654, 2022.
Song, H.-S., Stegen, J. C., Graham, E. B., Lee, J.-Y., Garayburu-Caruso, V. A., Nelson, W. C., Chen, X., Moulton, J. D., and Scheibe, T. D.: Representing Organic Matter Thermodynamics in Biogeochemical Reactions via Substrate-Explicit Modeling, Front. Microbiol., 11, 531756, https://doi.org/10.3389/fmicb.2020.531756, 2020.
Stegen, J. C. and Goldman, A. E.: WHONDRS: a Community Resource for Studying Dynamic River Corridors, mSystems, 3, https://doi.org/10.1128/mSystems.00151-18, 2018.
Stegen, J. C., Johnson, T., Fredrickson, J. K., Wilkins, M. J., Konopka, A. E., Nelson, W. C., Arntzen, E. V., Chrisler, W. B., Chu, R. K., Fansler, S. J., Graham, E. B., Kennedy, D. W., Resch, C. T., Tfaily, M., and Zachara, J.: Influences of organic carbon speciation on hyporheic corridor biogeochemistry and microbial ecology, Nat. Commun., 9, 585, https://doi.org/10.1038/s41467-018-02922-9, 2018.
Tolić, N., Liu, Y., Liyu, A., Shen, Y., Tfaily, M. M., Kujawinski, E. B., Longnecker, K., Kuo, L.-J., Robinson, E. W., Paša-Tolić, L., and Hess, N. J.: Formularity: Software for Automated Formula Assignment of Natural and Other Organic Matter from Ultrahigh-Resolution Mass Spectra, Anal. Chem., 89, 12659–12665, https://doi.org/10.1021/acs.analchem.7b03318, 2017.
Toyoda, J. G., Goldman, A. E., Arnon, S., Bar-Zeev, E., Chu, R. K., Danczak, R. E., Daly, R. A., Forbes, B., Garayburu-Caruso, V. A., Graham, E. B., Lin, X., Moran, J. J., Ren, H., Renteria, L., Resch, C. T., Tfaily, M., Tolic, N., Torgeson, J. M., Wells, J., Wrighton, K. C., Stegen, J. C., and Consortium, T. W.: WHONDRS Summer 2019 Sampling Campaign: Global River Corridor Surface Water FTICR-MS, NPOC, TN, Anions, Stable Isotopes, Bacterial Abundance, and Dissolved Inorganic Carbon, River Corridor and Watershed Biogeochemistry SFA, ESS-DIVE repository [data set], https://doi.org/10.15485/160377, https://data.ess-dive.lbl.gov/datasets/doi:10.15485/1603775 (last access: 7 Juli 2022), 2020.
Ward, N. D., Sawakuchi, H. O., Neu, V., Less, D. F. S., Valerio, A. M., Cunha, A. C., Kampel, M., Bianchi, T. S., Krusche, A. V., Richey, J. E., and Keil, R. G.: Velocity-amplified microbial respiration rates in the lower Amazon River, Limnol. Oceanogr. Lett., 3, 265–274, https://doi.org/10.1002/lol2.10062, 2018.
Wickham, H.: Ggplot2: Elegant Graphics for Data Analysis, 2nd Edn., Use R!, Switzerland, Springer, https://doi.org/10.1007/978-3-319-24277-4, 2016.