the Creative Commons Attribution 4.0 License.
the Creative Commons Attribution 4.0 License.
 | 07 Aug 2023
Seasonal variability of nitrous oxide concentrations and emissions in a temperate estuary
Tina Sanders
Yoana G. Voynova
Hermann W. Bange
Kirstin Dähnke
Nitrous oxide (N2O) is a greenhouse gas, with a global warming potential 298 times that of carbon dioxide. Estuaries can be sources of N2O, but their emission estimates have significant uncertainties due to limited data availability and high spatiotemporal variability. We investigated the spatial and seasonal variability of dissolved N2O and its emissions along the Elbe Estuary (Germany), a well-mixed temperate estuary with high nutrient loading from agriculture. During nine research cruises performed between 2017 and 2022, we measured dissolved N2O concentrations, as well as dissolved nutrient and oxygen concentrations along the estuary, and calculated N2O saturations, flux densities, and emissions. We found that the estuary was a year-round source of N2O, with the highest emissions in winter when dissolved inorganic nitrogen (DIN) loads and wind speeds are high. However, in spring and summer, N2O saturations and emissions did not decrease alongside lower riverine nitrogen loads, suggesting that estuarine in situ N2O production is an important source of N2O. We identified two hotspot areas of N2O production: the Port of Hamburg, a major port region, and the mesohaline estuary near the maximum turbidity zone (MTZ). N2O production was fueled by the decomposition of riverine organic matter in the Hamburg Port and by marine organic matter in the MTZ. A comparison with previous measurements in the Elbe Estuary revealed that N2O saturation did not decrease alongside the decrease in DIN concentrations after a significant improvement of water quality in the 1990s that allowed for phytoplankton growth to re-establish in the river and estuary. The overarching control of phytoplankton growth on organic matter and, subsequently, on N2O production highlights the fact that eutrophication and elevated agricultural nutrient input can increase N2O emissions in estuaries.
- Article
(5705 KB) - Full-text XML
-
Supplement
(1869 KB) - BibTeX
- EndNote


Nitrous oxide (N2O) is an important atmospheric trace gas that contributes to global warming and stratospheric ozone depletion (WMO, 2018; IPCC, 2021). Estuaries are important regions of nitrogen turnover (Middelburg and Nieuwenhuize, 2000; Crossland et al., 2005; Bouwman et al., 2013) and a potential source of N2O (Bange, 2006; Barnes and Upstill-Goddard, 2011; Murray et al., 2015). Together with coastal wetlands, estuaries contribute between 0.17 and 0.95 Tg N2O−N of the annual global budget of 16.9 Tg N2O−N (Murray et al., 2015; Tian et al., 2020). N2O emission estimates from estuaries are associated with significant uncertainties due to limited data availability and high spatiotemporal variability (e.g., Bange, 2006; Barnes and Upstill-Goddard, 2011; Maavara et al., 2019), presenting a big challenge for the global N2O emission estimates.
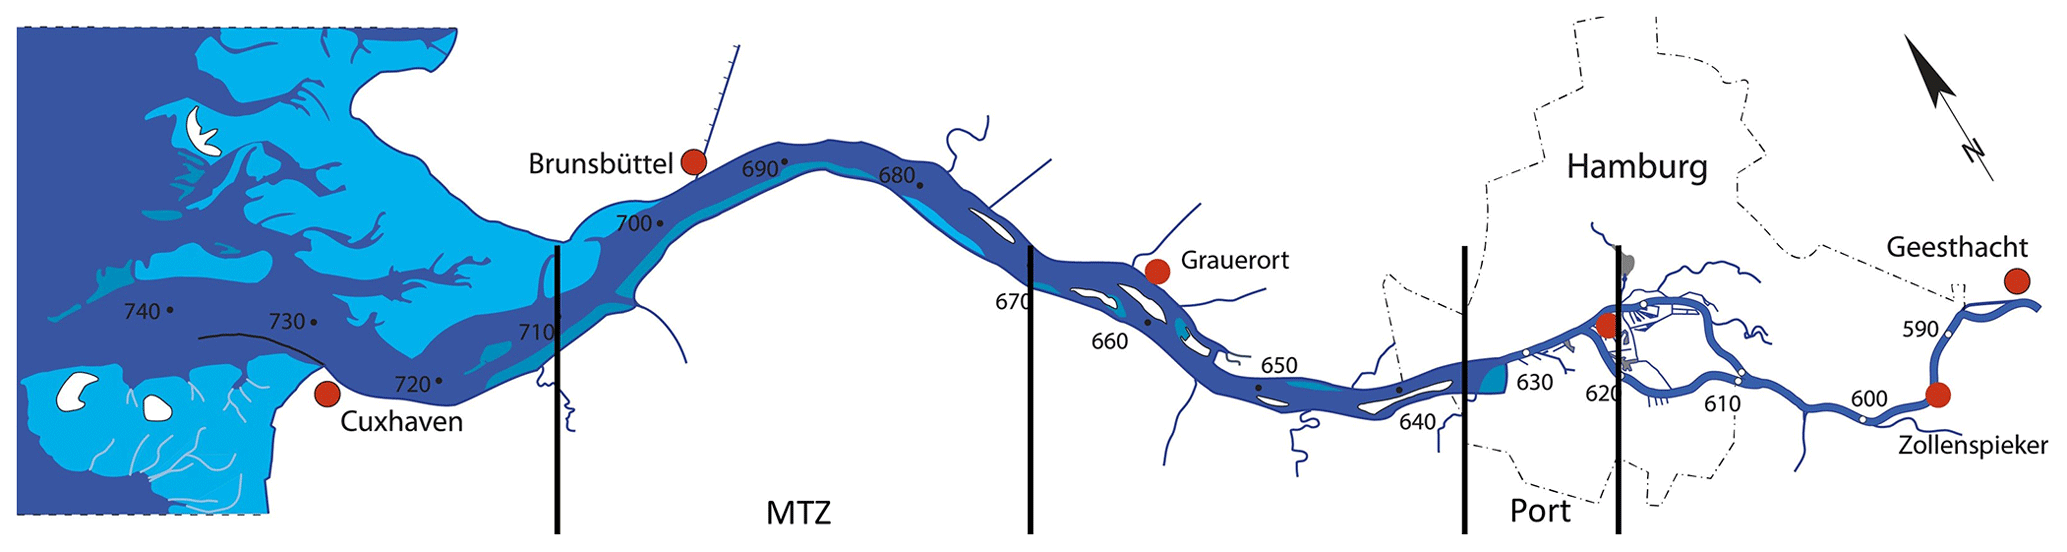
Figure 1Map of the Elbe Estuary sampled during our research cruises with stream kilometers (graphic courtesy of FGG Elbe, modified after Amann et al., 2012). The light blue color indicates Wadden Sea areas that are exposed at low tide. The vertical black lines indicate the Hamburg Port region and a typical position for the maximum turbidity zone (MTZ; Bergemann, 2004).
Nitrification and denitrification are the most important N2O production pathways in estuaries. Under oxic conditions, N2O is produced as a side product during the first step of nitrification, the oxidation of ammonia to nitrite (e.g., Wrage et al., 2001; Barnes and Upstill-Goddard, 2011). At low oxygen (but not anoxic) conditions, nitrifier denitrification may occur, during which nitrifiers reduce nitrite to N2O (e.g., Wrage et al., 2001; Bange, 2008). Denitrification takes place under anoxic conditions and mostly acts as a source of N2O but can also reduce N2O to N2 (e.g., Knowles, 1982; Bange, 2008). In estuaries, denitrification can occur in anoxic sediments, the anoxic water column, or anoxic microsites of particles, whereas nitrification and nitrifier denitrification take place in the oxygenated water column (Beaulieu et al., 2010; Murray et al., 2015; Ji et al., 2018; Tang et al., 2022).
In estuaries, the most important factors controlling N2O emissions are considered to be oxygen availability and dissolved inorganic nitrogen loads (Murray et al., 2015). Since N2O measurements in estuaries are scarce, global N2O emissions can be estimated by using emission factors and considering dissolved inorganic nitrogen (DIN) or total nitrogen (TN) loads, where it is assumed that higher nitrogen loads lead to higher N2O emissions (Kroeze et al., 2005, 2010; Ivens et al., 2011; Hu et al., 2016). However, several studies instead reported no obvious relationship between nitrogen concentrations and N2O emissions (Borges et al., 2015; Marzadri et al., 2017; Wells et al., 2018), highlighting the need to understand the causes for variability in the relationship between nitrogen loads and N2O emissions (Wells et al., 2018).
The Elbe Estuary is a heavily managed estuary with high agricultural nitrogen inputs that hosts the third largest port in Europe (e.g., Radach and Pätsch, 2007; Bergemann and Gaumert, 2008; Pätsch et al., 2010; Quiel et al., 2011). It has been identified as a N2O source, with a hotspot of N2O production in the Port of Hamburg (Hanke and Knauth, 1990; Brase et al., 2017a). We aimed to investigate drivers for N2O emissions along the estuary, specifically the N2O and DIN ratio (N2O:DIN). To do so, we (1) looked for potential long-term changes in N2O saturations; (2) investigated potential production hotspots, as well as the spatial and temporal distribution of N2O saturations; and (3) used the N2O:DIN ratio for a comparison with other estuaries.
2.1 Study site
The Elbe River stretches over 1094 km from the Giant Mountains (Czech Republic) to the North Sea (Cuxhaven, Germany). The catchment of the Elbe River is 140 268 km2 (Boehlich and Strotmann, 2019), with 74 % urban and agricultural land use (Johannsen et al., 2008). The Elbe is the second largest German river discharging into the North Sea, as well as the largest source of dissolved nitrogen for the German Bright, which is heavily affected by eutrophication (van Beusekom et al., 2019).
The Elbe Estuary is a well-mixed temperate estuary, which begins at stream kilometer 586 at a weir in Geesthacht and stretches through the Port of Hamburg, entering the North Sea near Cuxhaven at stream kilometer 727 (Fig. 1). Estuaries are commonly structured along their salinity gradient into an oligohaline (salinity: 0.5–5.0), a mesohaline (salinity: 5.0–18.0), and a polyhaline (salinity > 18.0) region (US EPA, 2006). The Elbe Estuary has a length of 142 km (Boehlich and Strotmann, 2019) and a mean annual discharge of 712 m3 s−1 (measured at gauge Neu Darchau at stream kilometer 536; HPA and Freie und Hansestadt Hamburg, 2017). The average water residence time is ∼ 32 d, ranging from ∼ 72 d during times of low discharge (300 m3 s−1) to ∼ 10 d during times of high discharge (2000 m3 s−1; Boehlich and Strotmann, 2008). The Elbe Estuary has an annual nitrogen load of 84 Gg-N (FGG Elbe, 2018), and point sources along the estuary provide only a small part of the total nitrogen input (Hofmann et al., 2005; IKSE, 2018). Oxygen concentrations in the Elbe Estuary vary seasonally, with oxygen depletion during the summer months and oxygen minimum zones regularly experiencing concentrations below 94 µmol O2 L−1 (Schroeder, 1997; Gaumert and Bergemann, 2007; Schöl et al., 2014).
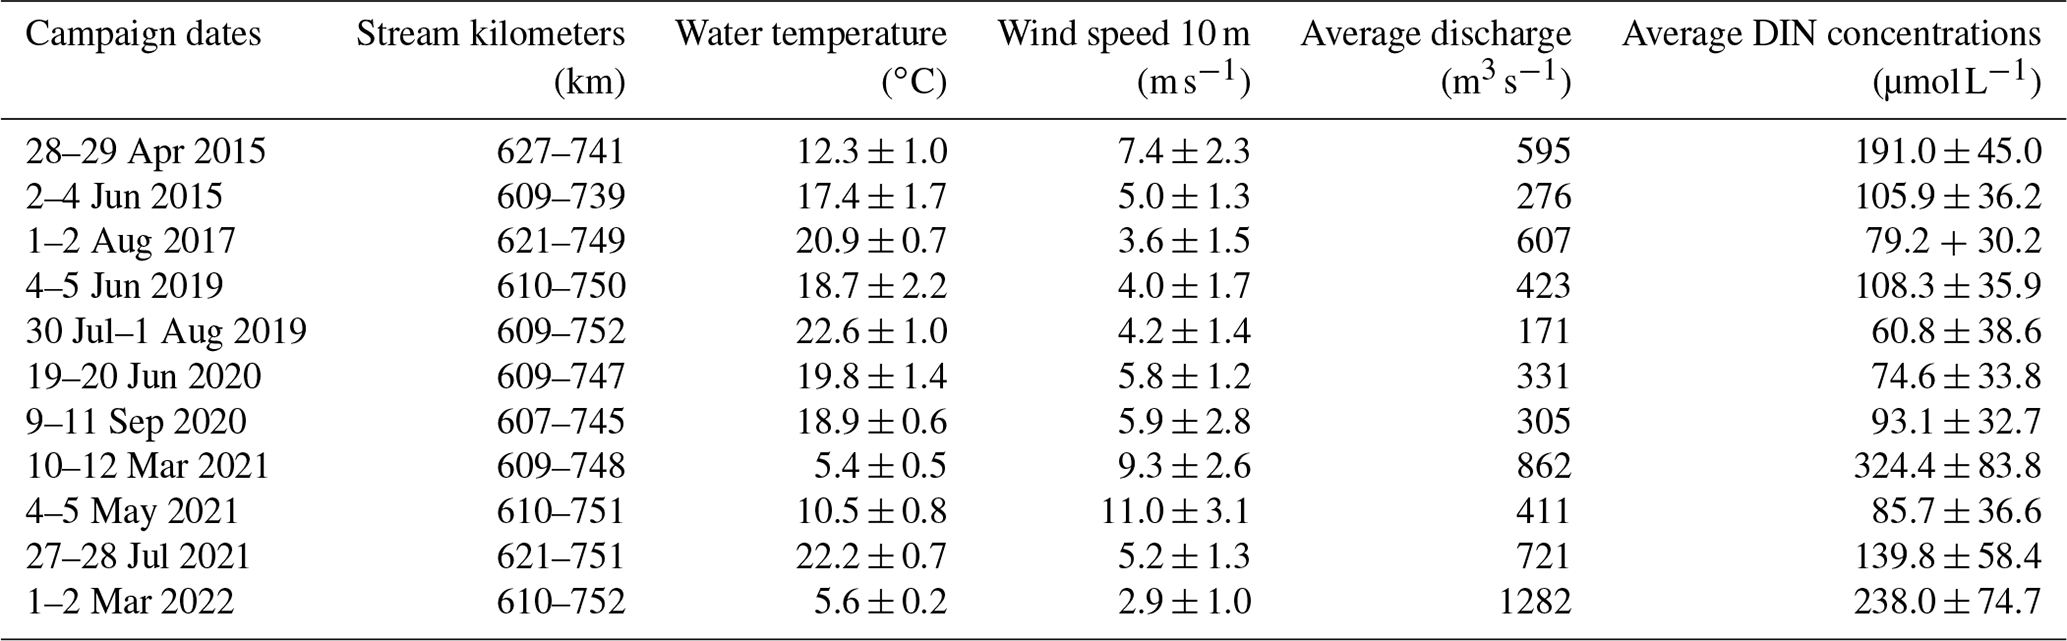
Table 1Campaign dates with the sampled Elbe Estuary sections shown via stream kilometers, average discharge during each cruise measured at the Neu Darchau gauging station, averages and standard deviations for water temperature, wind speed at 10 m height, dissolved inorganic nitrogen (DIN) concentrations for each campaign.
The Elbe Estuary is dredged year-round to maintain a water depth of 15–20 m and to grant access for large container ships to the Port of Hamburg (Boehlich and Strotmann, 2019; Hein et al., 2021). Construction work for further deepening of the fairway was carried out during our study period, from 2019 to early 2022. Upstream of the Port of Hamburg, water depth is less than 10 m (Hein et al., 2021).
2.2 Transect sampling and measurements
We performed nine sampling campaigns along the estuary with the research vessel Ludwig Prandtl (Table 1). Most cruises took place during spring and summer, with water temperatures > 10 ∘C (May to September). Two cruises were conducted during winter (early March, water temperature < 6 ∘C; Table 1). Transects started in the German Bight and continued along the salinity gradient, through the Port of Hamburg to Oortkaten (stream kilometer 609). To ensure comparable current and mixing conditions, transect sampling was always done after high tide, with the ship traveling upstream against the tide. For comparison with previous measurements, we included summer data from a previous study in 2015 (Brase et al., 2017a).
An onboard membrane pump continuously provided water at 1.2 m depth to an online in situ FerryBox system and to an equilibrator used for the measurements of N2O dry mole fraction (Sect. 2.4). The FerryBox system continuously measured water temperature, salinity, oxygen concentrations, pH, and turbidity. We corrected the salinity-corrected optode measurements using comparisons to Winkler titrations of discrete samples. See Table S1 in the Supplement for further details.
Discrete water samples (30–40 samples for each cruise) were collected every 20 min from a bypass of the FerryBox system. For nutrient analysis, water samples were filtered immediately through combusted, pre-weighted GF/F filters (4 h, 450 ∘C) and were frozen in acid-washed PE bottles until analysis. The filters were also stored frozen (−20 ∘C) and subsequently analyzed for suspended particulate matter (SPM), particulate nitrogen (PN), total particulate carbon (PC), and ratios (Fig. S1 in the Supplement).
2.3 Nutrient measurements
Filtered water samples were measured in triplicates with a continuous flow auto analyzer (AA3, SEAL Analytics) using standard colorimetric and fluorometric methods (Hansen and Koroleff, 1999) for dissolved nitrate (), nitrite (), and ammonium () concentrations. Detection limits were 0.05, 0.05, and 0.07 µmol L−1 for nitrate, nitrite, and ammonium, respectively.
2.4 Equilibrator-based N2O measurements and calculations
Equilibrated dry mole fractions of N2O were measured by an N2O analyzer based on off-axis integrated cavity output (OA-ICOS) absorption spectroscopy (Model 914-0022, Los Gatos Res. Inc., San Jose, CA, USA), which was coupled with a seawater and gas equilibrator using off-axis cavity output spectroscopy. Brase et al. (2017a) described the set-up and instrument precision in detail. Twice a day, two standard gas mixtures of N2O in synthetic air (500.5 ppb ± 5 % and 321.2 ppb ± 3 %) were analyzed to validate our measurements. No drift was detected during our cruises.
We calculated the dissolved N2O concentrations in water with the Bunsen solubility function of Weiss and Price (1980), using 1 min averages of the measured N2O dry mole fraction (ppb). Temperature differences between the sample inlet and the equilibrator were taken into account for the calculation of the final N2O concentrations (Rhee et al., 2009). N2O saturation was calculated based on N2O concentrations in water (N2Ocw) and the atmospheric equilibration concentrations (N2Oeq; Eq. 1). Atmospheric N2O dry mole fractions were measured before and after each transect cruises using an air duct from the deck of the research vessel.
The gas transfer coefficients (k) were determined based on Borges et al. (2004; Eq. 3), Nightingale et al. (2000), Wanninkhof (1992), and Clark et al. (1995) using the Schmidt number (Sc) and wind speeds (u10) measured at 10 m height (Eq. 2). The Schmidt number was calculated as ratio of the kinematic viscosity in water (Siedler and Peters, 1986) to the N2O diffusivity in water (Rhee et al., 2009). Cruise wind speeds (Table 1) varied significantly from the average annual wind speeds of the two federal states, in which the Elbe Estuary is located (4.7 m s−1, Schleswig-Holstein and Hamburg: Mittlere Windgeschwindigkeit (1986–2015) – Norddeutscher Klimamonitor, 2023), and also compared to seasonal average wind speeds determined for the stations Cuxhaven and Hamburg (Rosenhagen et al., 2011). Thus, to estimate uncertainties due to varying wind conditions during our cruises, we used (1) the in situ wind speeds measured on board the R/V Ludwig Prandtl at 10 m height by a MaxiMet GMX600 (Gill Instruments Limited, Hampshire, UK), (2) the average annual wind speed (Schleswig-Holstein and Hamburg: Mittlere Windgeschwindigkeit (1986–2015) – Norddeutscher Klimamonitor, 2023), and (3) the seasonally averaged wind speeds (Rosenhagen et al., 2011). The flux densities in the main text were calculated using Eq. (3), and the wind speeds measured on board the vessel. Results of the other calculations are listed in the Supplement (Table S2).
To estimate N2O emissions, we separated the Elbe Estuary into five regions: limnic (stream kilometer 585 to 615), Port of Hamburg (stream kilometer 615 to 632), oligohaline (stream kilometer 632 to 704), mesohaline (stream kilometer 704–727), and polyhaline (stream kilometer 727 to 750), see Table S3. Respective areas were provided by the German Federal Waterways Engineering and Research Institute (BAW; Victoria Oritz, personal communication, 2023) and Geerts et al. (2012). In order to account for seasonality, cruises were defined as winter (March), spring (April and May), summer (June and July), and late summer/autumn (August and September). We then calculated daily N2O emissions per section and season. For upscaling, we used the calculated monthly emissions to estimate annual emissions (winter: November to March, spring: April to May, summer: June to July, and late summer/autumn: August to October). To address uncertainties, we calculated N2O emissions based on different parameterizations and wind speeds as described above.
2.5 Excess N2O and apparent oxygen utilization
The correlation between excess N2O (N2Oxs) and apparent oxygen utilization (AOU) can provide insights into N2O production (Nevison et al., 2003; Walter et al., 2004). We calculated N2Oxs as the difference between the N2O concentration in water and the theoretical equilibrium concentration (N2Oeq) (Eq. 4). AOU was determined using Eq. (5), where O2 is the measured dissolved oxygen concentration, and is the theoretical equilibrium concentration between water and atmosphere calculated according to Weiss (1970).
A linear relationship between AOU and N2Oxs is usually an indicator for N2O production from nitrification (Nevison et al., 2003; Walter et al., 2004).
2.6 Statistical analysis
All statistical analyses were done using R packages. The packages ggpubr v.0.6.0 (Kassambara, 2023) and stats v.4.0.2 (R-Core Team, 2021) were used to calculate Pearson correlations (R) and p values.
3.1 Hydrographic properties and DIN distribution
Discharge ranged between 171 and 1282 m3 s−1 during our cruises (ZDM, 2022), with higher discharge in winter and lower discharge in summer (Table 1). Average water temperature over the entire estuary ranged from 5.4 ± 0.5 ∘C in March 2021 to 22.6 ± 1.0 ∘C in August 2017 (Table 1). For further evaluation, March 2021 and 2022 cruises were regarded as winter cruises (water temperature < 6 ∘C), whereas all cruises with higher water temperatures were jointly regarded as spring and summer conditions.
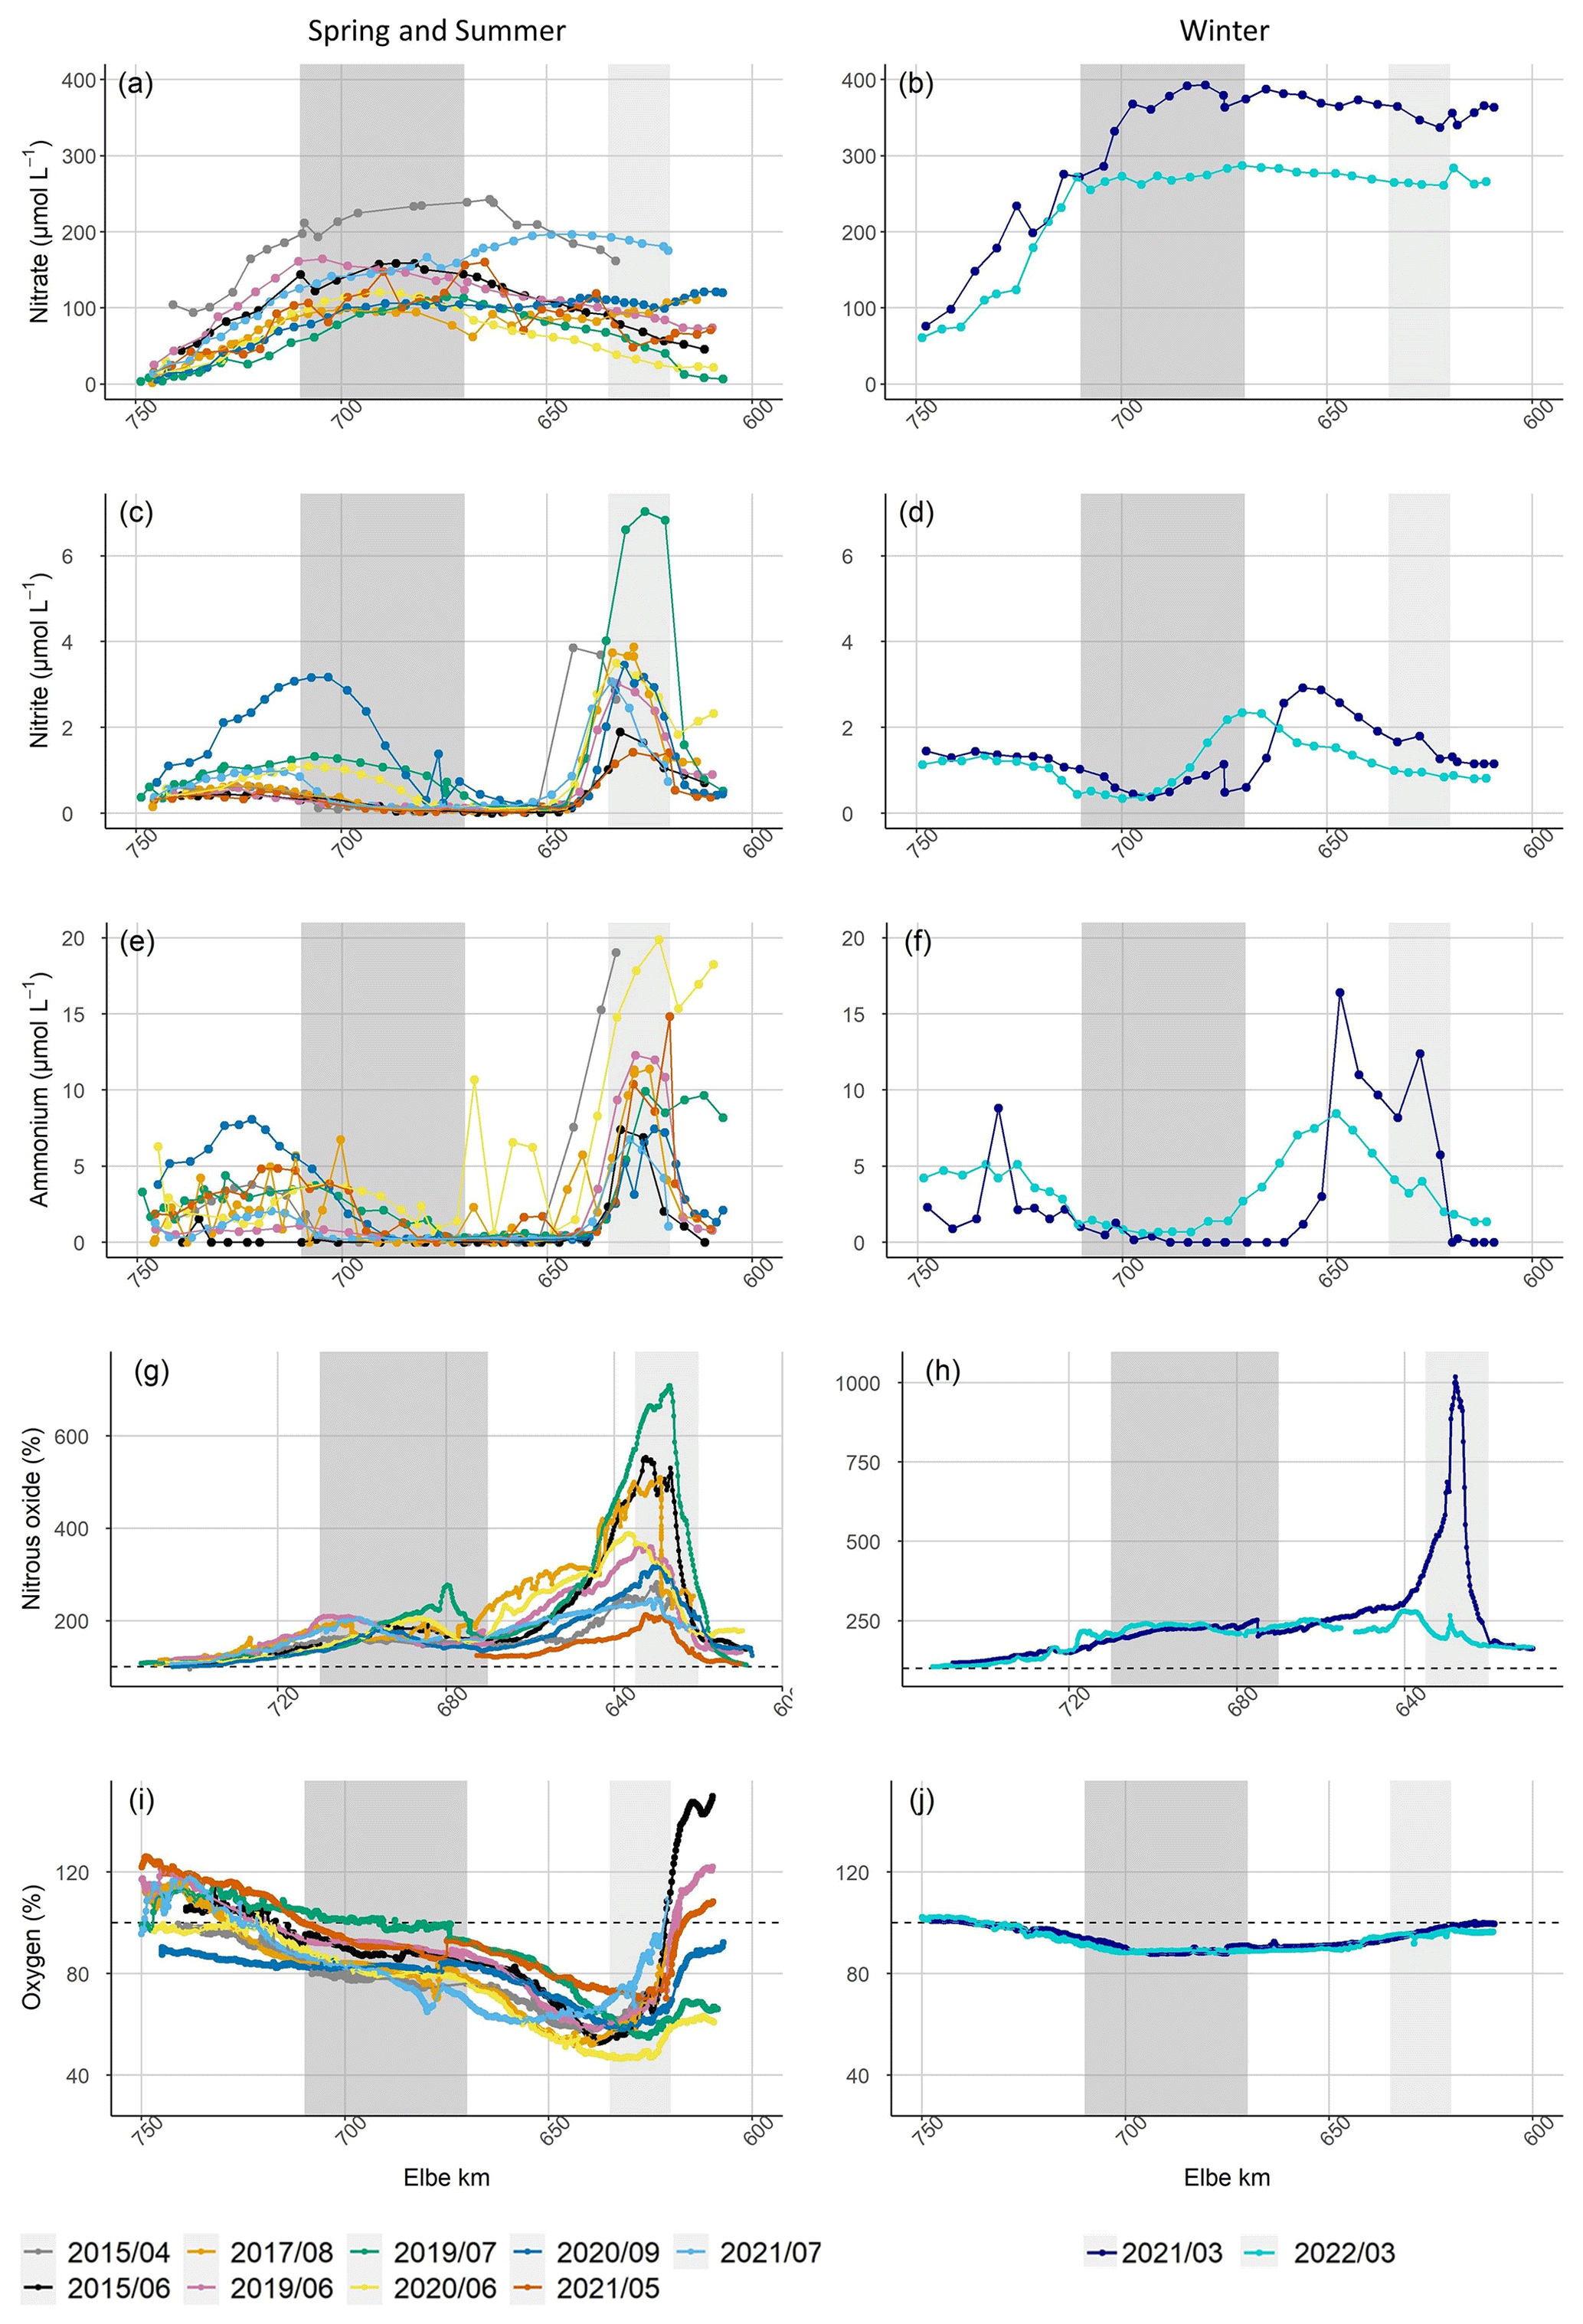
Figure 2Nitrate concentration along the Elbe Estuary (a) in spring/summer and (b) in winter. Nitrite concentration along the Elbe Estuary (c) in spring/summer and (d) in winter. Ammonium concentration along the Elbe Estuary (e) in spring/summer and (f) in winter. N2O in percent saturation along the Elbe Estuary (g) in spring/summer and (h) in winter. Dissolved oxygen in percent saturation along the Elbe Estuary (i) in spring/summer and (j) in winter. All variables are plotted against Elbe stream kilometers (Elbe km). Light grey shading denotes the Hamburg Port region, dark grey shading the typical position of the maximum turbidity zone (MTZ; Bergemann, 2004). Note the difference in y-axis scales for the plots of panels (g) and (h). The dashed black lines in panels (g) and (h), as well as panels (i) and (j), indicate saturation of 100 % for nitrous oxide and dissolved oxygen, respectively.
Nitrate was the major form of dissolved inorganic nitrogen (DIN) during all cruises. In winter, high nitrogen concentrations entered the estuary from the river. Towards summer, the riverine input of nitrate (stream kilometer < 620) decreased, but along the estuary, nitrate concentrations increased up to ∼ stream kilometer 700 then decreased towards the North Sea. Nitrate concentrations were highest during both March cruises, with averages of 319.0 ± 85.7 and 230.9 ± 76.2 µmol L−1 in 2021 and 2022, respectively. During summer, nitrate concentrations were lower, with averages between 151.0 ± 58.1 µmol L−1 in May 2021 and 63.3 ± 38.8 µmol L−1 in July 2019 (Fig. 2a and b).
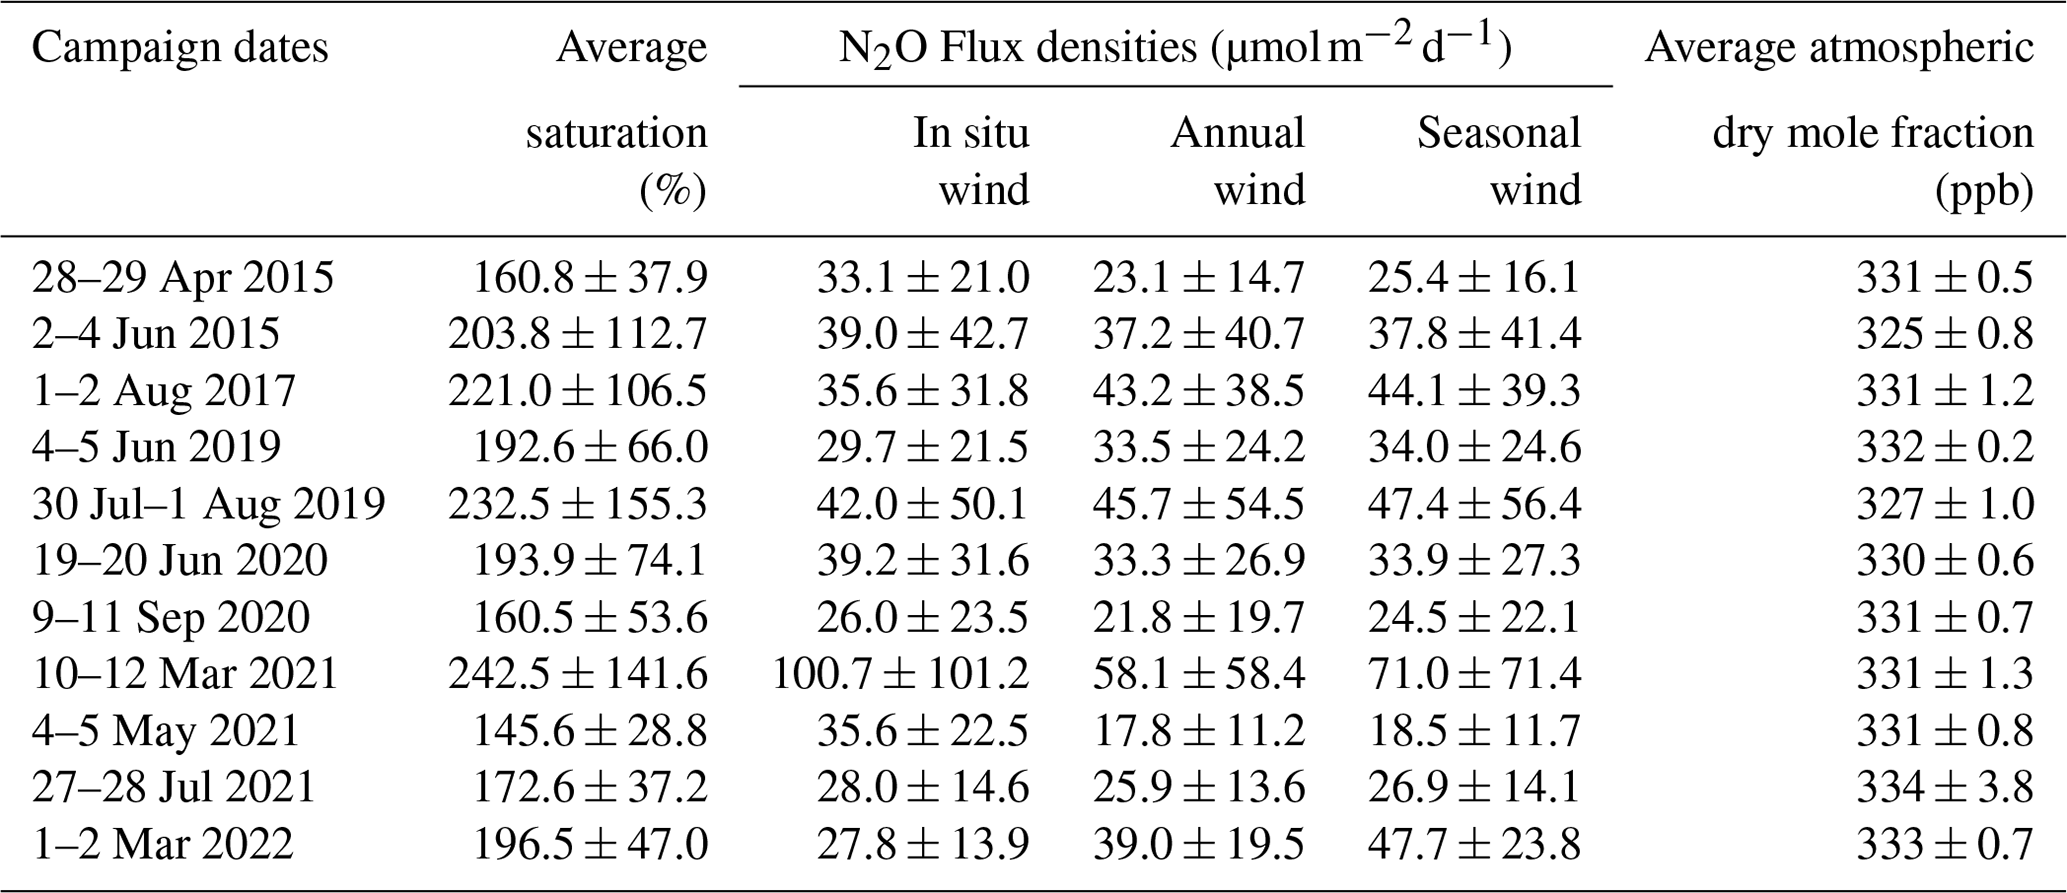
Table 2Calculated average N2O saturation, sea-to-air fluxes calculated following Borges et al. (2004) and atmospheric N2O dry mole fractions during our cruises in the Elbe Estuary.
Nitrite and ammonium concentrations were usually low (< 1 µmol L−1) throughout the Elbe Estuary but peaked in the Hamburg Port region and around stream kilometer 720 (Fig. 2c and e). We measured pronounced variations in nitrite concentrations during most of our cruises, ranging from > 6.0 µmol L−1 (July 2019) to concentrations below the detection limit (Fig. 2c and d). The highest ammonium concentration was measured in March 2021 at 23.5 µmol L−1 (Fig. 2e and f).
3.2 Atmospheric N2O and N2O saturation
The average atmospheric N2O dry mole fractions ranged from 325 ppb in June 2015 to 336 ppb in July 2022 (Table 2). The differences between our measurements and the mean monthly N2O mole fraction measured at the Mace Head atmospheric monitoring station (Ireland; Lan et al., 2022) were always less than 1.5 %, indicating a good agreement with the monitoring data.
During all cruises, the Elbe Estuary was supersaturated in N2O in the freshwater region (Fig. 2g and h). The average N2O saturation over the entire transect ranged between 146 % and 243 %, with an overall average of 197 % for all cruises. The highest N2O occurred in the Hamburg Port region in spring and summer, with an average N2O peak of 402 % saturation and a maximum supersaturation of 710 % in July 2019. The distributions of N2O during winter cruises were significantly different: in March 2022, the highest N2O (280 % saturation) occurred at stream kilometer 640. In contrast, in March 2021, we found an extraordinarily high peak with a saturation of 1018 % at stream kilometer 627. Between stream kilometer 680 and 720, a supersaturation of up to 277 % occurred in spring and summer. Further towards the North Sea, N2O decreased, approaching equilibrium with the atmosphere.
3.3 N2O flux densities and N2O emissions
For N2O flux densities, we present calculated values after Borges et al. (2004, Table 2) but also include results using other parameterizations in Table S2 and Fig. S2. The N2O flux densities were usually highest in the Hamburg Port area, with an average of 95.0 ± 97.9 , and lowest towards the North Sea, with an average of 3.9 ± 3.0 (Elbe stream kilometers > 735). The average N2O flux density of all cruises was 39.9 ± 46.9 (calculated with in situ wind speeds measured during the cruises).
Table 3Annual N2O emission estimates in Gg-N2O yr−1 calculated with different parameterizations and wind speeds.
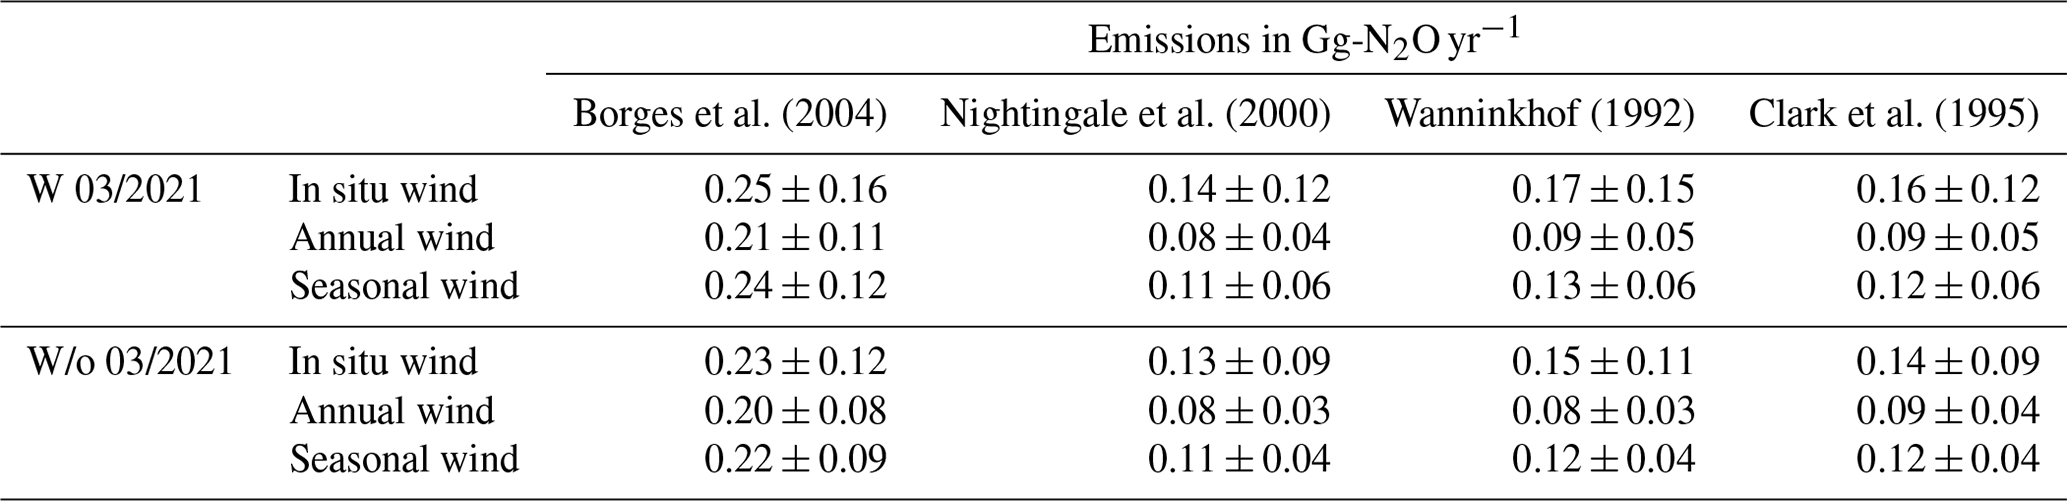
N2O emission estimates varied significantly depending on the used parameterization and wind speeds. Note that we calculated emissions twice: (1) including (w 03/2021) and (2) deliberately excluding (w/o 03/2021) the N2O peak saturation measured in the Port of Hamburg in March 2021, using linearly interpolated concentrations, respectively. The highest emissions were calculated following the methods by Borges et al. (2004) and using in situ wind speeds, resulting in emissions of 0.25 ± 0.16 and 0.23 ± 0.12 Gg-N2O yr−1 with and without the N2O peak in March 2021, respectively. The lowest emissions of 0.08 Gg-N2O yr−1 arose with the parameterization of Nightingale et al. (2000) and Wanninkhof (1992) and using annual wind speeds (Table 3).
3.4 Dissolved oxygen saturation
Average oxygen varied between 76 and 95 % saturation, with an oxygen minimum in the Hamburg Port area. Winter cruises varied little, with oxygen remaining relatively constant along the estuary (> 88 % saturation). During most spring and summer cruises, water from the river coming into the estuary was supersaturated in oxygen (> 100 % saturation). In the Hamburg Port region, oxygen saturation generally decreased. The lowest values occurred in June 2020 with 47 % saturation. The along-estuary oxygen minimum in the summer months (June to August) was always below 61 % saturation. In spring and summer, oxygen increased towards the North Sea and reached 100 % saturation (Fig. 2i and j).
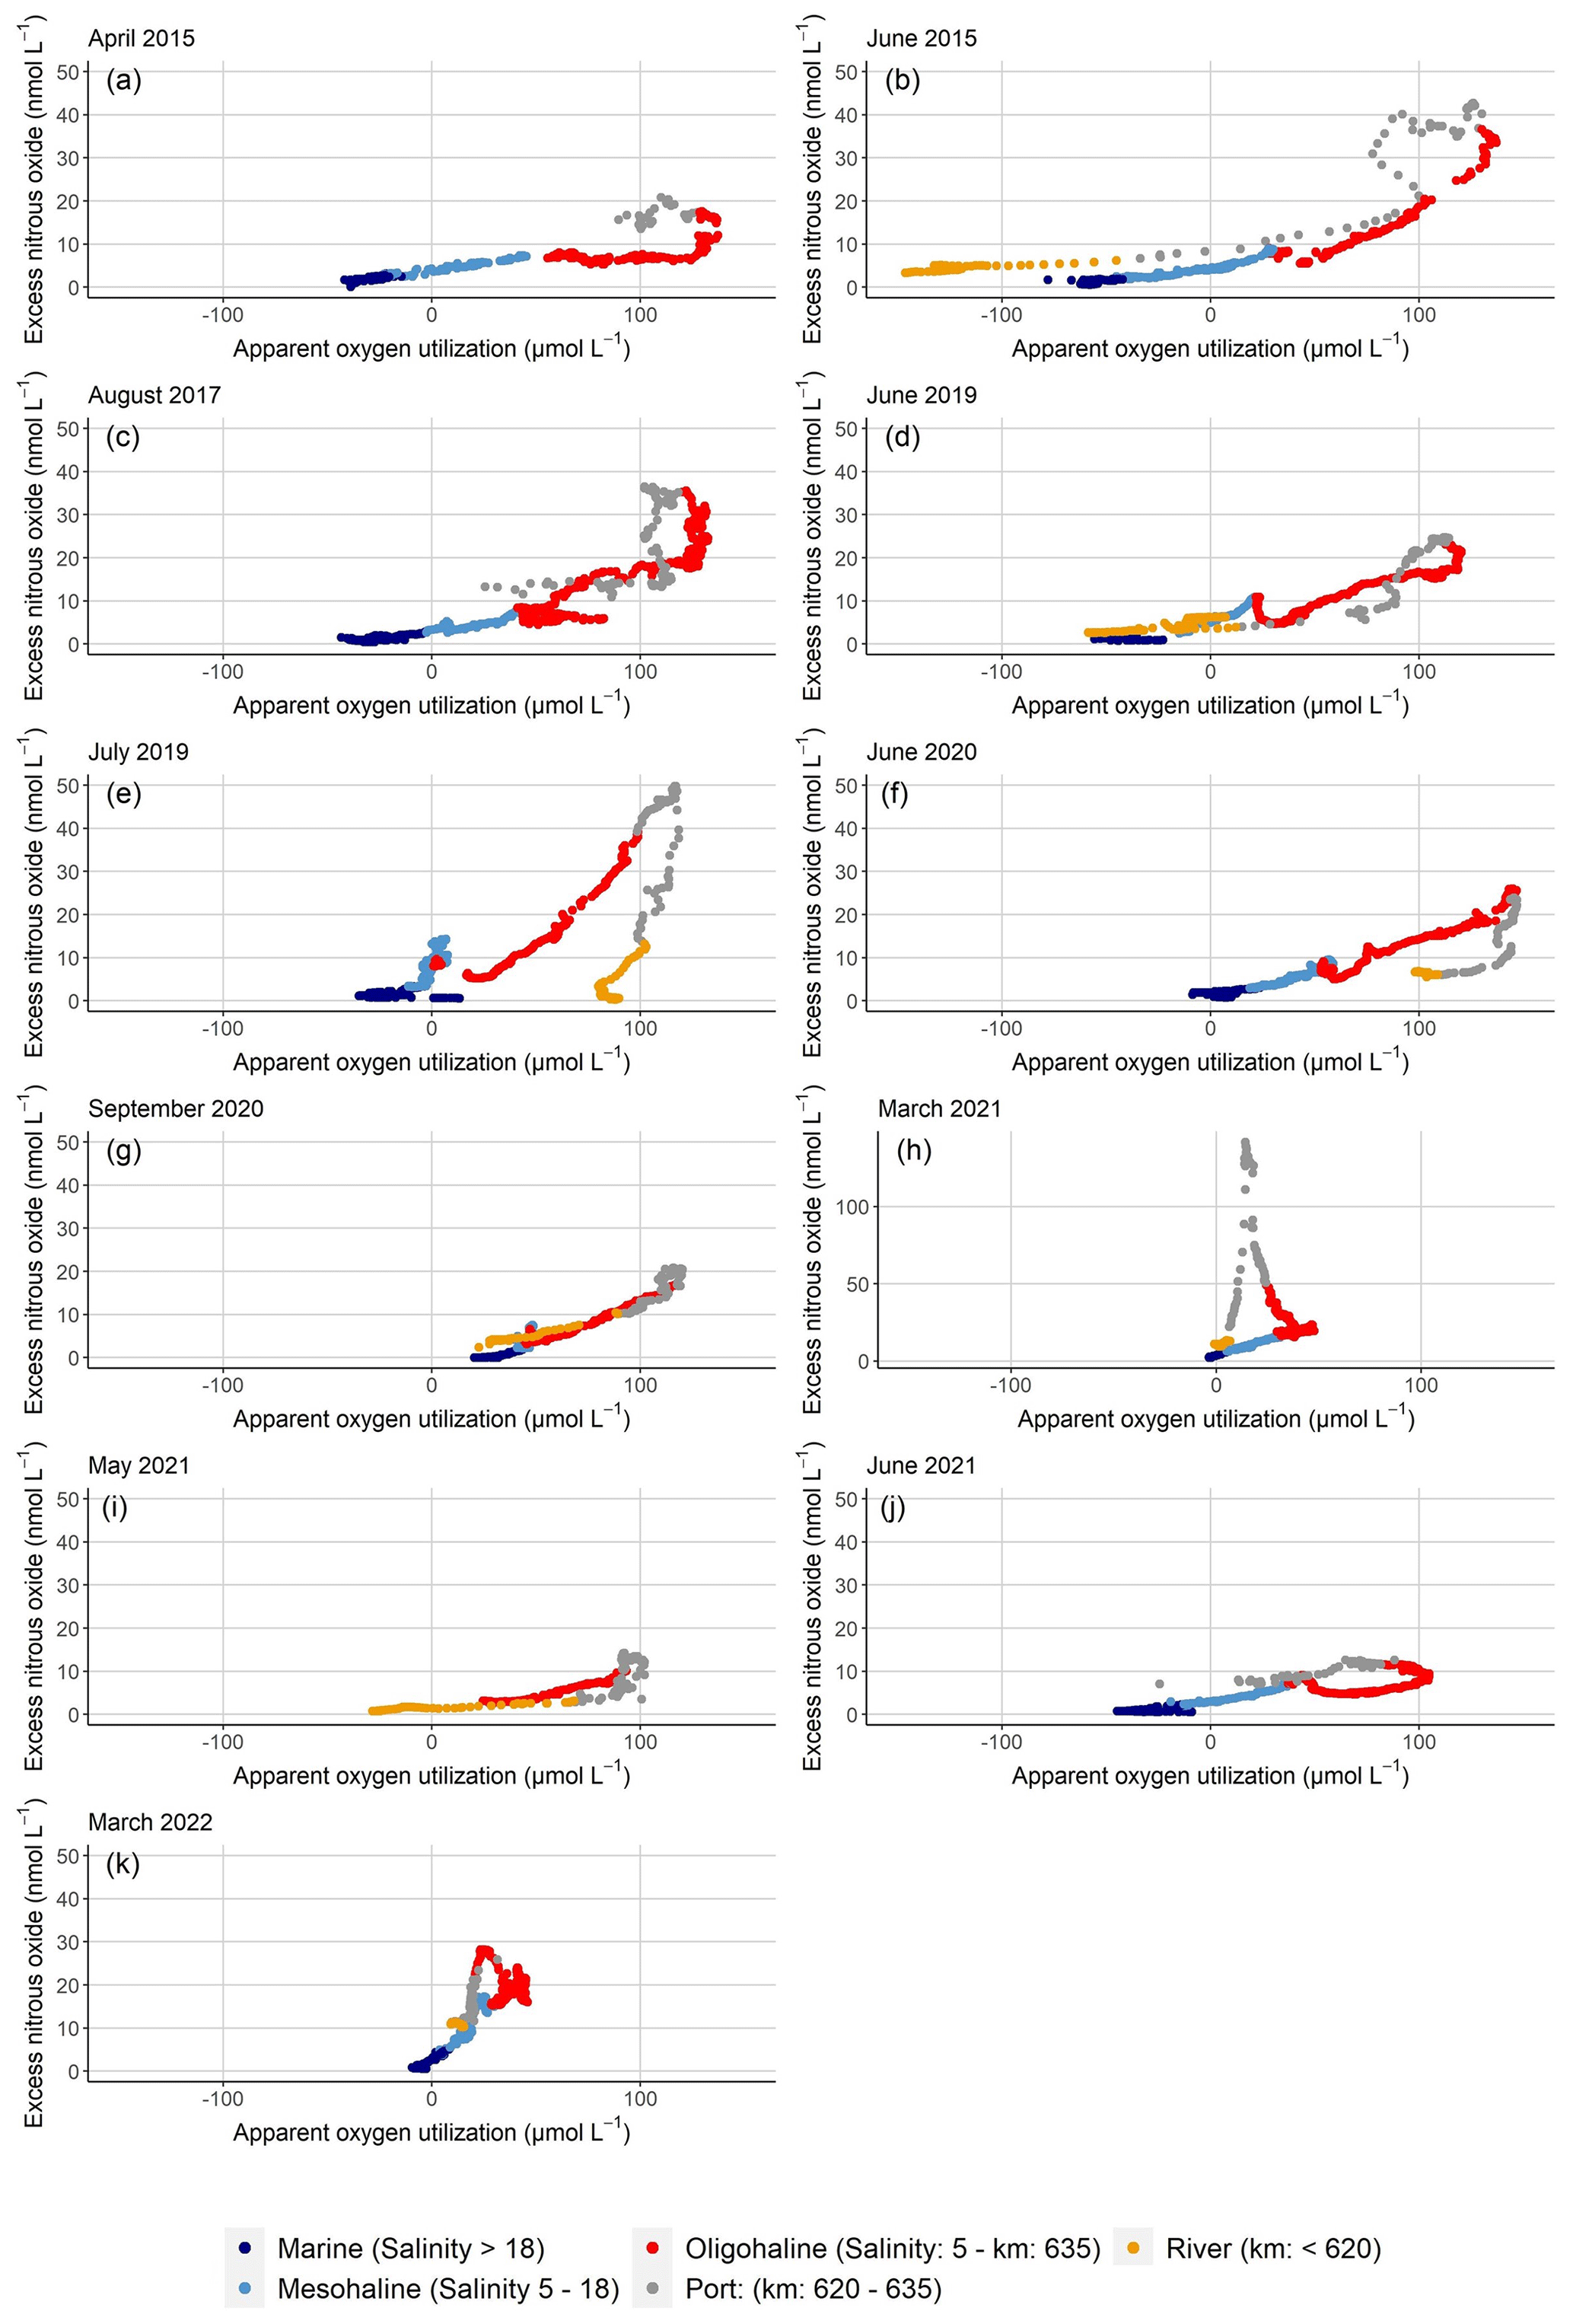
Figure 3Plots of N2Oxs vs. AOU for (a) April 2015, (b) June 2015, (c) August 2017, (d) June 2019, (e) July 2019, (f) June 2020, (g) September 2020, (h) March 2021, (i) May 2021, (j) June 2021, and (k) March 2022. The values are colored to distinguish between different regions of the estuary. The y-axis scale differs for Fig. 3h.
Plots of excess N2O (N2Oxs) and apparent oxygen utilization (AOU) revealed excess N2O along the entire estuary (Fig. 3). During all cruises, elevated riverine N2Oxs entered the estuary (stream kilometer < 620). A linear positive relationship between N2Oxs and AOU suggested nitrification as the main production pathway in large sections of the estuary (Nevison et al., 2003; Walter et al., 2004). However, in summer, a change of slope in the Port of Hamburg as well as in the mesohaline section of the estuary suggested either increased in situ N2O production or external N2O input. In winter, we found an increasing slope in the Hamburg Port region and in the oligohaline part of the Elbe Estuary (Fig. 3h and k).
Table 4Pearson correlation coefficients (R) for N2O saturation (%) with temperature (T in ∘C), pH value, oxygen (O2 in % saturation), ammonium concentrations ( in µmol L−1), nitrite concentrations ( in µmol L−1), nitrate concentrations ( in µmol L−1), SPM concentrations (SPM in mg L−1), values, particulate carbon fraction (PC in %), and particulate nitrogen fraction (PN in %) for the entire data set, spring and summer cruises (sp/su), data with salinity > 1, spring and summer cruises with salinity > 1, data with salinity < 1, and spring and summer cruises with salinity < 1.
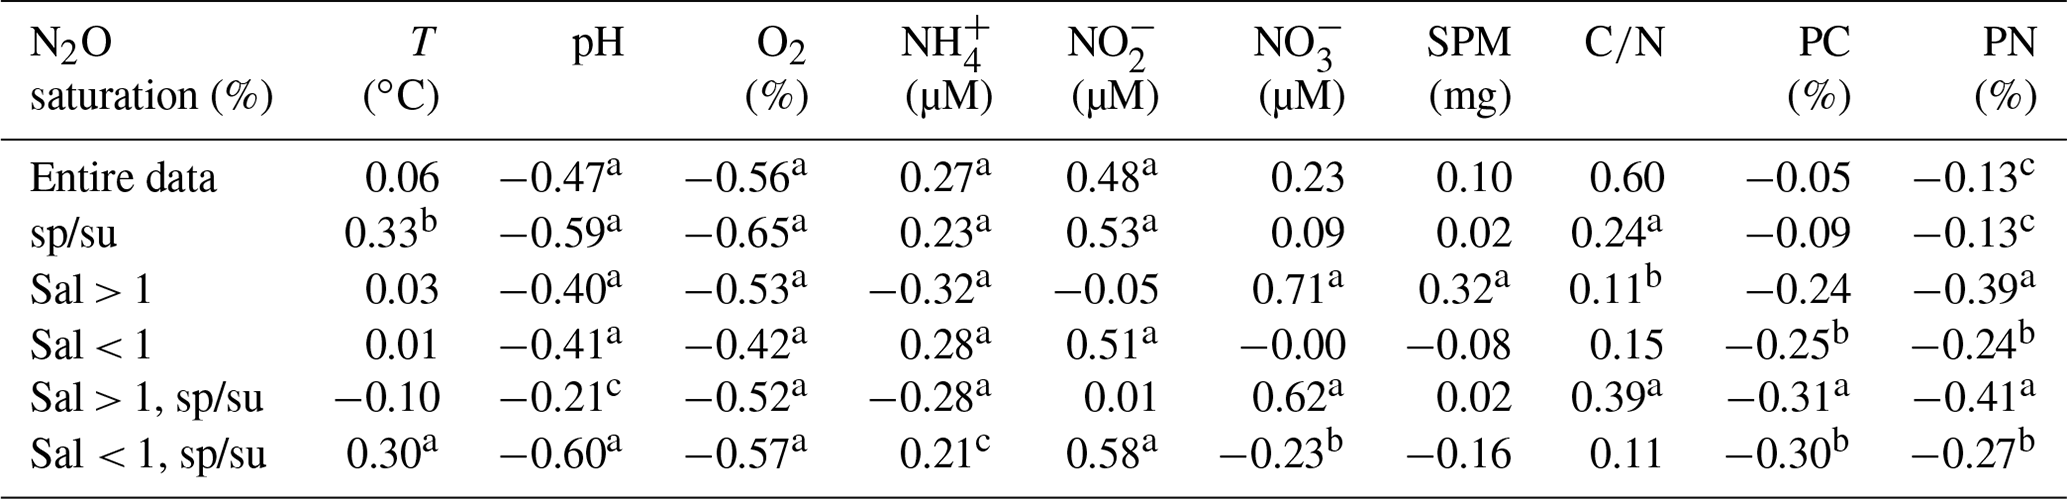
a The significance for p values < 0.001. b The significance for p values < 0.01. c The significance for p values < 0.05.
Table 5Pearson correlation coefficients (R) for average N2O saturation (%) with average discharge (Q in m3 s−1) temperature (T in ∘C), pH value, oxygen (O2 in % saturation), ammonium concentrations ( in µmol L−1), nitrite concentrations ( in µmol L−1), nitrate concentrations ( in µmol L−1), SPM concentrations (SPM in mg L−1), values, particulate carbon fraction (PC in %), and particulate nitrogen fraction (PN in %) for the entire data set, spring and summer cruises (sp/su), data with salinity > 1, spring and summer cruises with salinity > 1, data with salinity < 1, and spring and summer cruises with salinity < 1.
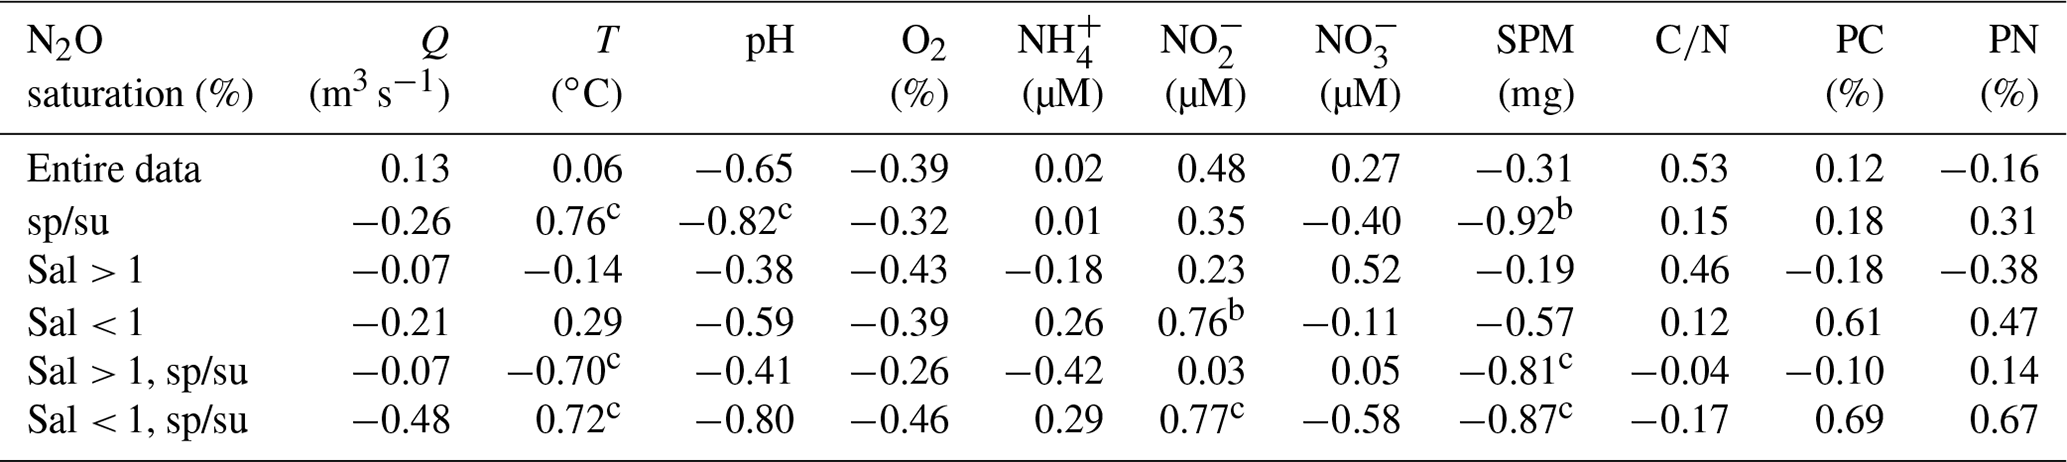
a The significance for p values < 0.001. b The significance for p values < 0.01. c The significance for p values < 0.05.
3.5 Statistical analysis
We performed statistical analyses to identify potential N2O production pathways and controlling factors. Table 4 summarizes the results for the entire data set with further separation into spring and summer cruises (sp/su), as well as separation according to the presence of a salinity gradient (salinity > 1) or of freshwater regions (salinity < 1). Furthermore, we performed a corresponding analysis to assess the significance of correlations between average values of different parameters for each cruise (Table 5). N2O saturation showed significant negative correlation with oxygen (Table 4) as well as a consistent negative correlation with pH (Tables 4 and 5). Furthermore, nitrite concentrations positively correlated with N2O saturation in the freshwater section of the estuary (Tables 4 and 5).
4.1 N2O saturation and flux densities of the Elbe Estuary
The average N2O saturation and flux density were 197 % and 39.9 ± 46.9 , respectively. The N2O flux densities from the Elbe Estuary were in the mid-range of flux densities of other European estuaries ranging from 2.9 to 96.5 (Garnier et al., 2006; Gonçalves et al., 2010; Murray et al., 2015), and average N2O saturations fitted to values determined by Reading et al. (2020) for highly modified urban systems. The relationship of N2Oxs and AOU (Fig. 3), with changing slopes in the Port of Hamburg and mesohaline estuary, was determined by either initial riverine N2O production or in situ production along the estuary. During spring and summer, we found increasing N2O concentrations in the Hamburg Port region (see also Brase et al., 2017a) and in the salinity gradient (stream kilometer 680–700, salinity ∼ 5). Both N2O peaks varied in magnitude and spatial extension, suggesting in situ biological production (Fig. 2g). This matches earlier research linking estuarine N2O fluxes to in situ generation (e.g., Bange, 2006; Barnes and Upstill-Goddard, 2011; Murray et al., 2015).
Previous measurements of N2O saturation and flux densities in the Elbe Estuary between the 1980s and 2015 (Hanke and Knauth, 1990; Barnes and Upstill-Goddard, 2011; Brase et al., 2017a) showed a significant reduction of N2O saturation due to the reduced riverine nutrient load and higher dissolved oxygen concentrations (Brase et al., 2017a). However, since the BIOGEST study in 1997 (Barnes and Upstill-Goddard, 2011), N2O remained relatively stable at ∼ 200 % saturation despite a concurrent decrease in TN concentration from ∼ 400 to around 200 µmol L−1 (Fig. S3; Hanke and Knauth, 1990; Barnes and Upstill-Goddard, 2011; Brase et al., 2017a; FIS, 2022). Since N2O saturation did not decrease in scale with riverine nitrogen input, this suggests that the yield of N2O production increased along the estuary. Dähnke et al. (2008) showed a shift from dominating denitrification towards significant nitrification in the Elbe Estuary due to the significant improvement of water quality after the reunification of Germany in 1990, and this could influence N2O distributions in the estuary. In the following sections, we investigate the biogeochemical controls of this in situ N2O production. For this purpose, we discuss the two zones of intense N2O production separately and also distinguish between cruises in spring and summer (water temperature > 10 ∘C) and in winter (water temperature < 6 ∘C).
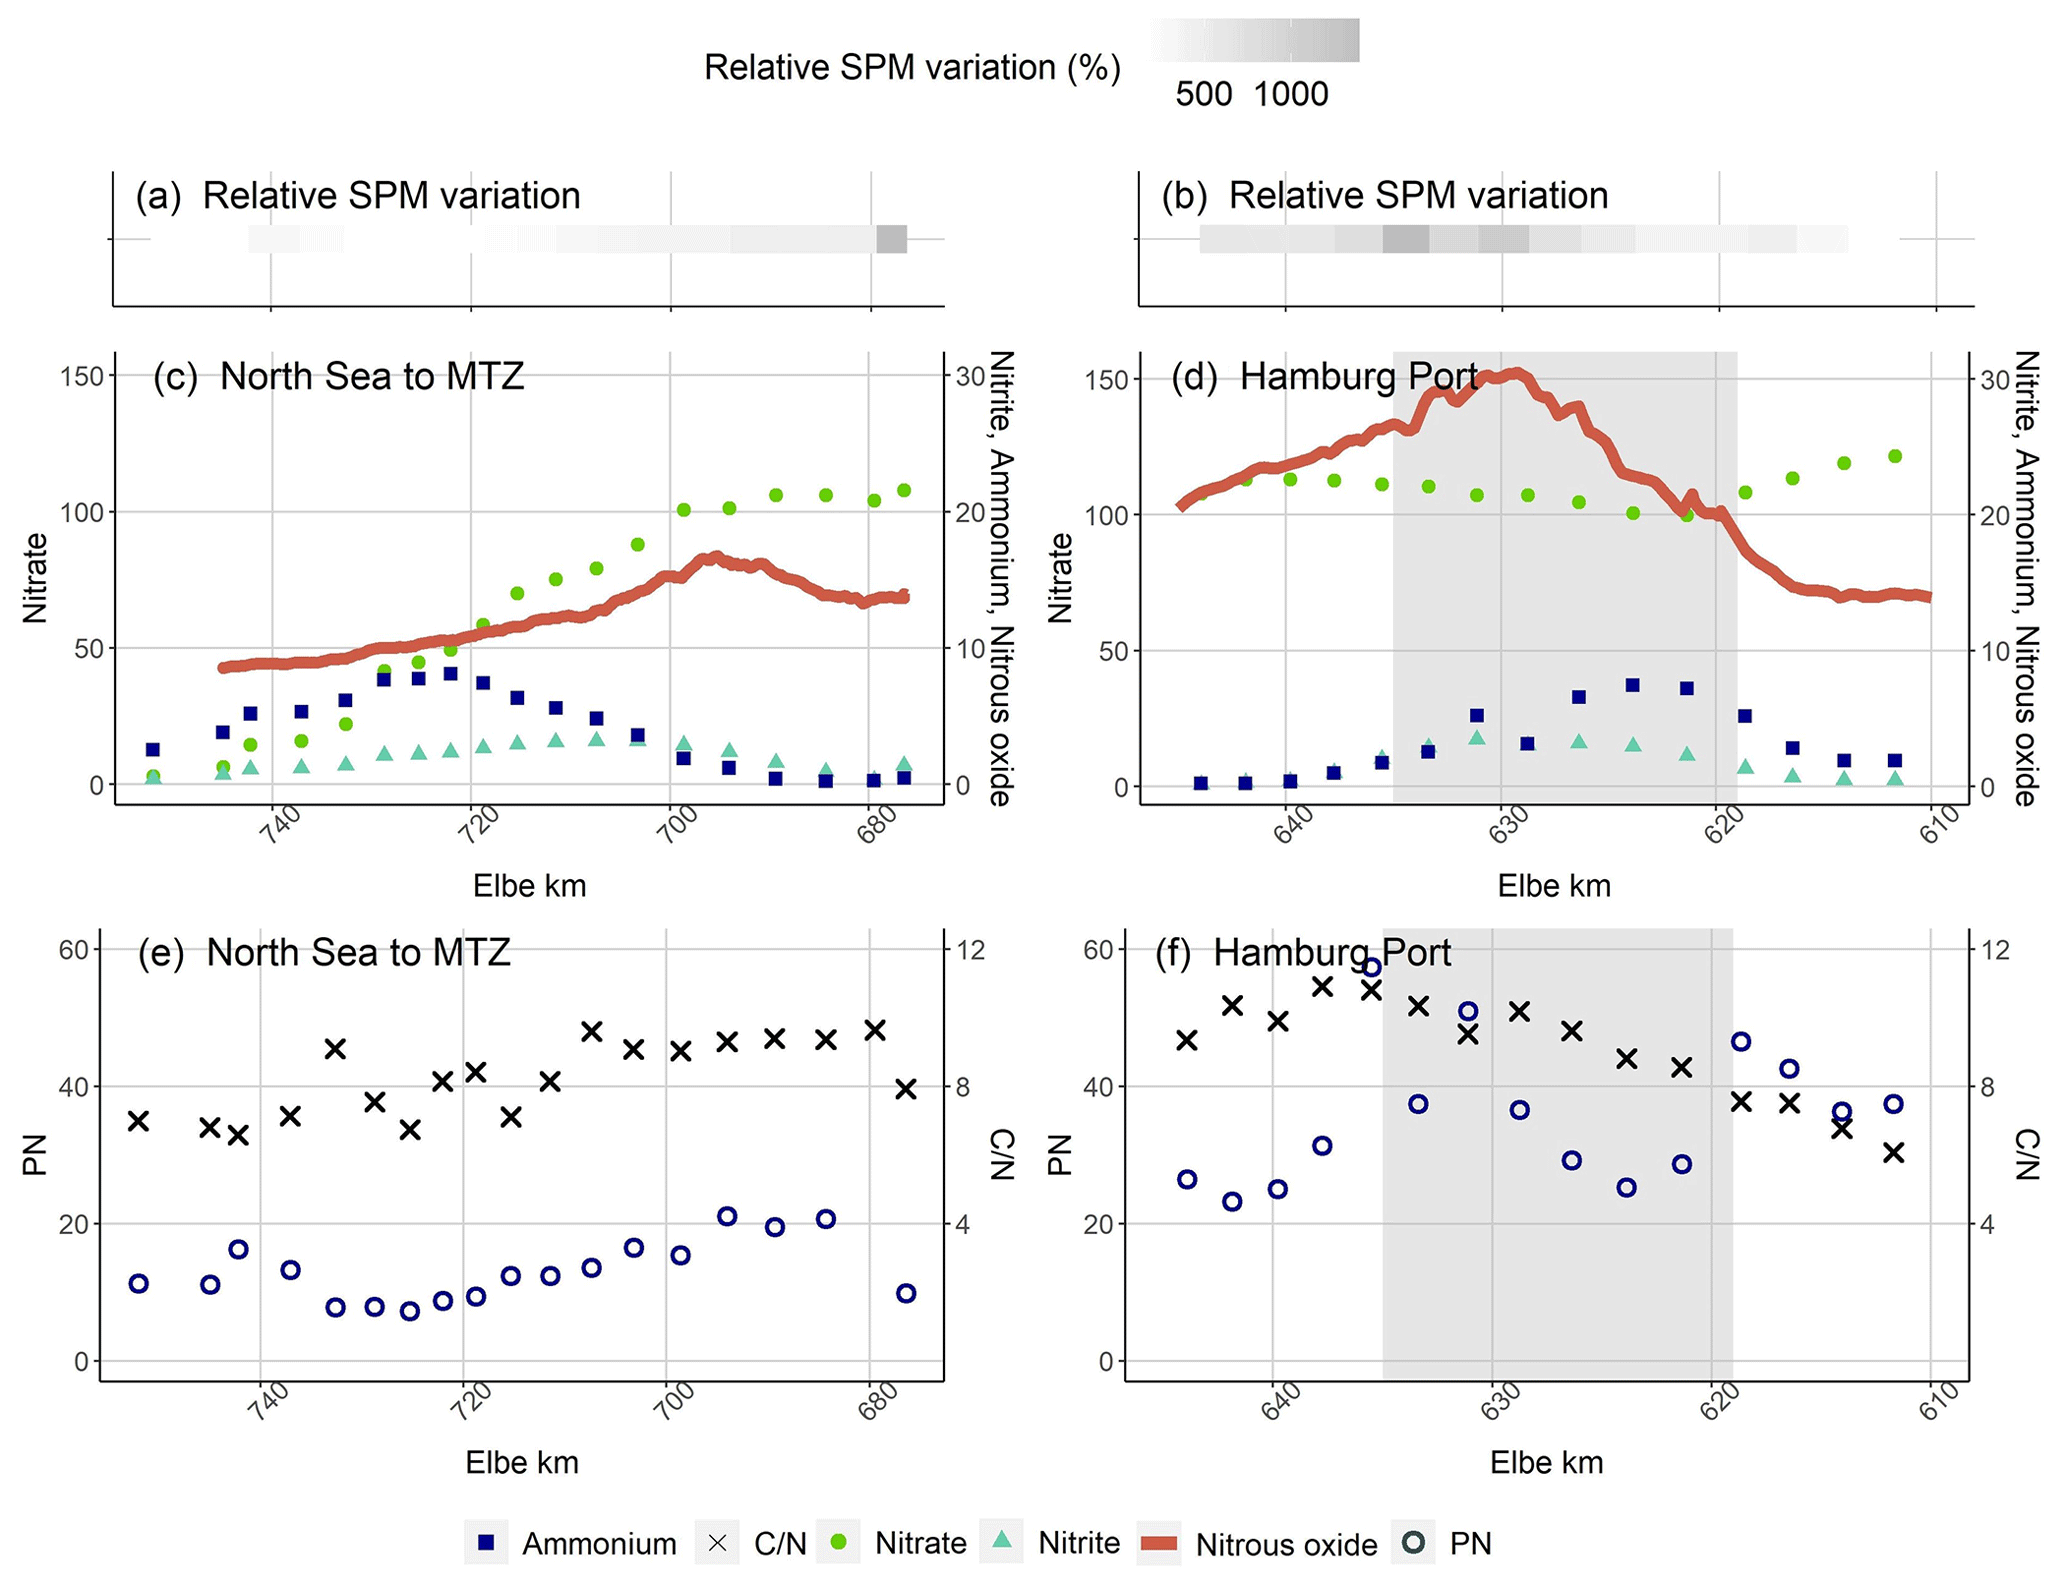
Figure 4Succession of N-bearing substances coming from the North Sea and in the Port of Hamburg in September 2020: relative change of SPM concentrations (a) from the North Sea and (b) in the Port of Hamburg. Nitrate in µmol L−1, nitrite in µmol L−1, ammonium in µmol L−1 and nitrous oxide concentrations in nmol L−1 plotted against Elbe stream kilometers (c) from the North Sea and (d) in the Port of Hamburg. Particulate nitrogen concentrations in µmol L−1 and values plotted against stream kilometers (e) from the North Sea and (f) in the Port of Hamburg. The grey area in panels (d) and (f) shows the position of the Port of Hamburg.
4.2 N2O production in spring and summer in the mesohaline estuary
The N2O peak in the transition between the oligohaline and mesohaline estuary was accompanied by a sudden change in the slope of the AOU vs. N2Oxs plots (Fig. 3), pointing towards N2O production in the oxic water column. Peaks of nitrite and ammonium concentrations coincided with the elevated nitrous oxide saturations between Elbe kilometers 680–700, with an ammonium peak around stream kilometer ∼ 720 and a nitrite peak at ∼ 700 (Fig. 4a). The highest N2O concentrations were usually measured between the nitrite peak and the region with highest turbidity (Fig. 4a, September 2020, and Figs. S4–S14). This co-occurrence of nitrite accumulation and increased N2O saturation have been interpreted as signs for N2O production via denitrification (e.g., Wertz et al., 2018; Sharma et al., 2022). However, denitrification does not seem likely in this oxic water column. Such a succession of nitrite and ammonium peaks is also typical for remineralization and nitrification, and the slight decrease of oxygen concentrations around the higher N2O saturation (Fig. 2g and i) suggests oxygen consumption, possibly caused by these two processes. Sanders et al. (2018) measured small but detectable nitrification rates (1–2 ) for this region of the Elbe Estuary, suggesting that N2O may be a side product of nitrification.
This succession of N-bearing substances (Figs. 4 and S4–S14) suggests input of particulate matter from the North Sea and upstream particle transport towards the maximum turbidity zone of the estuary (MTZ). This transport mechanism is in line with Wolfstein and Kies (1999), who explained organic matter contents and chlorophyll a concentrations in the polyhaline part of the Elbe Estuary by input of freshly produced particulate matter of marine origin. Generally, maximum turbidity zones are generated by the balance between river-induced flushing and upstream transport of marine SPM, as a function of estuarine geomorphology, gravitational circulation, and tidal flow, trapping the particles in the MTZ (Bianchi, 2007; Sommerfield and Wong, 2011; Winterwerp and Wang, 2013). Other studies detected N2O production from water column nitrification in estuarine MTZs (e.g., Barnes and Owens, 1999; de Wilde and de Bie, 2000; Bange, 2006; Barnes and Upstill-Goddard, 2011; Harley et al., 2015), caused by high bacterial numbers, particulate nitrogen availability, and long residence times (Murray et al., 2015).
For the selected data set, we calculated a negative correlation between average SPM concentrations and N2O saturation (R = −0.81, Table 5) and found that the N2O peak was located downstream of the MTZ and upstream of increasing nitrite and ammonium concentrations (Fig. 4a). This suggests that (1) the mere concentration of SPM is not the driving factor of nitrification as a source of N2O but that organic matter quality is key to biological turnover (Dähnke et al. 2022), and (2) the material transport from the North Sea upstream towards the MTZ (Kappenberg and Fanger, 2007; Schoer, 1990) is a main mechanism for N2O generation. We find organic matter with low ratios and with relatively high PN and PC contents in the outermost samples (ranging from 5.9 in June 2020 to 8.8 August 2017), indicating fresh and easily degradable organic matter (Fig. S1, e.g., Redfield et al., 1963; Fraga et al., 1998; Middelburg and Herman, 2007). Towards the MTZ, values, PN contents, and PC contents decreased, indicating remineralization in the water column. This remineralization and subsequent nitrification can then cause the observed succession of ammonium, nitrite, and N2O peaks (Fig. 4a), contributing to the high nitrate concentrations in the MTZ, where high values (9–11/16) indicate low organic matter quality (e.g., Hedges and Keil, 1995; Middelburg and Herman, 2007). Overall, we conclude that remineralization of marine organic matter, followed by nitrification, produced the N2O peak in the salinity gradient of the Elbe Estuary. This production was mainly fueled by fresh organic matter entering the estuary from the North Sea.
4.3 Hamburg Port: N2O production in spring and summer
During all cruises, we measured highest N2O saturation in the Port of Hamburg. These peaks can be caused by input from a waste water treatment plant by deepening and dredging operations, enhanced benthic production, or in situ production in the water column.
Point sources generally play a minor role in the Elbe Estuary (Hofmann et al., 2005; IKSE, 2018). We estimated the wastewater discharge fraction of stream flow according to Büttner et al. (2020) for the waste water treatment plant (WWTP) Köhlbrandhöft, which treats the waste water from the Hamburg metropolitan region, with less than 5 % even under low fresh water inflow. Thus, point sources seemed not to be the cause for the elevated N2O concentrations. However, discharge of WWTPs can potentially be important sources of N2O (Beaulieu et al., 2010; Chun et al., 2020; Brown et al., 2022), and the effect of wastewater input on N2O concentrations and emissions may change with altered river discharge, water temperature, and riverine nitrogen loads in the future.
Dredging can be a potential source of N2O in the water column. The estuary is continuously deepened and dredged to grant access for large container ships, which stirs up bottom sediments. Ammonium concentrations in the sediment pore water are high (Zander et al., 2020, 2022) and N2O can be produced by nitrifier denitrification in the sediments (Deek et al., 2013). However, we found no correlation of high SPM concentrations and N2O saturation, indicating no major influence on N2O dynamics from channel dredging and deepening.
Several studies identified the Hamburg Port region as a hotspot of biogeochemical turnover: Deek et al. (2013) showed denitrification, whereas Sanders et al. (2018) measured intense nitrification. Norbisrath et al. (2022) determined intense total alkalinity generation, and Dähnke et al. (2022) found that nitrogen turnover was driven by high particulate organic matter in this region. Brase et al. (2017a) identified the Hamburg port region as a hotspot of N2O production and hypothesized that simultaneous nitrification and sediment denitrification were responsible. We use our expanded data set to further evaluate this hypothesis and to identify drivers for N2O production in the port region.
During all cruises in spring and summer, we measured ammonium and nitrite peaks in the Hamburg Port region (Fig. 2c and e, exemplary for September 2020 in Fig. 4b). Several researchers did address the nitrogen turnover and this accumulation of nitrite and ammonium, assuming that the sudden increase of water depth in the Port leads to a light limitation and decomposition of riverine organic material (Schroeder, 1997; Schöl et al., 2014). This in turn raises ammonium and nitrite concentrations and fosters nitrification in the port region (Sanders et al., 2018; Dähnke et al., 2022).
High nitrite concentrations are favorable for N2O production by nitrifier denitrification (Quick et al., 2019), while low oxygen conditions facilitate N2O production from both nitrification and denitrification. We found that N2O saturation increased with decreasing discharge (R = −0.48, Table 5) during spring and summer. This further points towards in situ N2O production because longer residence times lead to a possible accumulation of N2O from either nitrification or denitrification (e.g., Nixon et al. 1996; Pind et al. 1997; Silvennoinen et al. 2007; Gonçalves et al. 2010). Overall, our data showed the succession of ammonium, nitrite, and N2O production (Figs. 4b and S4–S14) as well as a breakup of the linear relation between AOU and N2Oxs in the Port region (Fig. 3). In combination with previous nitrogen process studies performed in the Elbe Estuary (Deek et al., 2013; Sanders et al., 2018; Dähnke et al., 2022), this supports simultaneous sedimentary denitrification and nitrification in the water column as responsible pathways for N2O production in the Port of Hamburg (Brase et al., 2017a).
In spring and summer, we found no linear relationship between N2Oxs and AOU in the Hamburg Port (Fig. 3). This may result from combined N2O production by nitrification and denitrification. However, oxygen saturation and N2O saturation were inversely correlated in Hamburg Port (Tables 4 and 5), suggesting that N2O production was controlled by oxygen concentrations and thus was related to oxygen consumption in the port region. Most (75 %) of this oxygen consumption is caused by respiration, whereas the remaining 25 % stems from nitrification (Schöl et al., 2014; Sanders et al., 2018). This respiration in turn is determined by remineralization of algal material from the upstream river that is transported to and respired within the port region (Schroeder, 1997; Kerner, 2000; Schöl et al., 2014), linking estuarine N2O production to river eutrophication. Fabisik et al. (2023) showed that algae could additionally contribute to N2O production. In the Elbe, fresh organic matter from the river with low values as well as high PN and PC contents entered the estuary. This organic material was rapidly degraded in the Hamburg Port region (Fig. S1). Dähnke et al. (2022) found that labile organic matter fueled nitrification but also denitrification in the fresh water part of the Elbe Estuary, which, as shown in our study, results in high N2O production in the Hamburg Port, leading to the reported negative correlations of PC and PN content with N2O saturation.
Overall, oxygen conditions mainly controlled N2O production in the Hamburg Port region in spring and summer. Since respiration of organic matter dominates oxygen drawdown in the port region, we deduce that N2O production there is linked to the decomposition of phytoplankton produced in the upstream Elbe River regions.
4.4 Hamburg Port: N2O production in winter
In winter, low water temperature (< 6 ∘C) should hamper biological production (Koch et al., 1992; Halling-Sorensen and Jorgensen, 1993). Indeed, we did not detect a N2O peak in the MTZ in winter, but we found high N2O concentrations in the port region. For March 2022, we found a linear increase of N2Oxs and AOU along with oxygen consumption and increasing ammonium, nitrite, and PN concentrations, indicating nitrification in the Hamburg Port producing N2O. Unlike in summer, N2O concentrations showed a flat increase extending far into the oligohaline section of the estuary (Figs. 2 and S1).
However, in March 2021, we found a sharp and sudden increase in N2O, with a peak concentration that by far exceeded internal biological sources in summer (Fig. 2h). An ammonium peak in the water column coincided with the N2O maximum (Figs. 2f and S12). If microbial activity is mostly temperature-inhibited, a local source of N2O in the port seems the most likely cause.
We considered intensified deepening operations in the Port of Hamburg as one potential source of elevated N2O saturation. Deepening and dredging work occurred in the Hamburg Port region in 2021 (HPA; Maja Karrasch, personal communication, 2022), but this also applied to 2022, when we saw no sharp N2O peak (Fig. 2h). Furthermore, the regions of deepening and dredging did not match the region of high N2O concentrations, and turbidity at the time of sampling did not change significantly compared to other cruises. Jointly, this suggests that channel dredging and deepening was not the primary cause for the 2021 winter N2O peak.
Another possible source of N2O is the WWTP outflow in the Southern Elbe that joins the main estuary at stream kilometer 626 (Fig. 1), matching the N2O peak at stream kilometer 627 (Fig. 2h). As explained above (Sect. 4.3), the effect of this WWTP on N2O saturations under normal conditions should be negligible. This peak can be the result of an extraordinary event during our sampling. We indeed found that an extreme rain event occurred on 11 March 2021 (HAMBURG WASSER; Frank Laurich, personal communication, 2022), with a statistical recurrence probability of 1 to 5 years (https://sri.hamburgwasser.de/, last access: 4 April 2023). This rare event caused a temperature drop in the WWTP due to high inflows of cold rainwater leading to aggravated operation conditions at the time of sampling. While the operators could still meet the limits for the effluent levels of nitrate and ammonium, higher than usual ammonium loads exited the treatment plant at this time. We hypothesize that these elevated ammonium WWTP loads were rapidly converted to N2O as the warmer and biologically active waste water entered the Elbe Estuary in March 2021. An important factor for aggravated conditions was a temperature drop in the WWTP caused by cold rain water (HAMBURG WASSER; Frank Laurich, personal communication, 2022); we therefore hypothesize that a similar rain event in warmer months would not have the same effect.
Therefore, we argue that our March 2021 cruise likely represents an exception due to an extreme weather situation, whereas normal winter conditions in the estuary comply with the N2O production, like in March 2022.
4.5 Seasonally varying N2O:DIN dynamic
We calculated annual N2O emissions of the Elbe Estuary ranging from 0.08 ± 0.03 to 0.25 ± 0.16 Gg-N2O yr−1, which varied from recent N2O summer emission estimate of 0.18 ± 0.01 Gg-N2O yr−1 by Brase et al. (2017a). Estuarine N2O emissions are affected by tides, diel variations, and currents (Barnes et al., 2006; Baulch et al., 2012; Gonçalves et al., 2015), all of which we did not address in our study. The range of possible parameterizations of gas transfer coefficients further complicates a direct comparison of fluxes between studies (Hall and Ulseth, 2020; Rosentreter et al., 2021), which was reflected in the big differences of our emission estimates (Table 2). Therefore, a direct comparison to other studies is difficult.
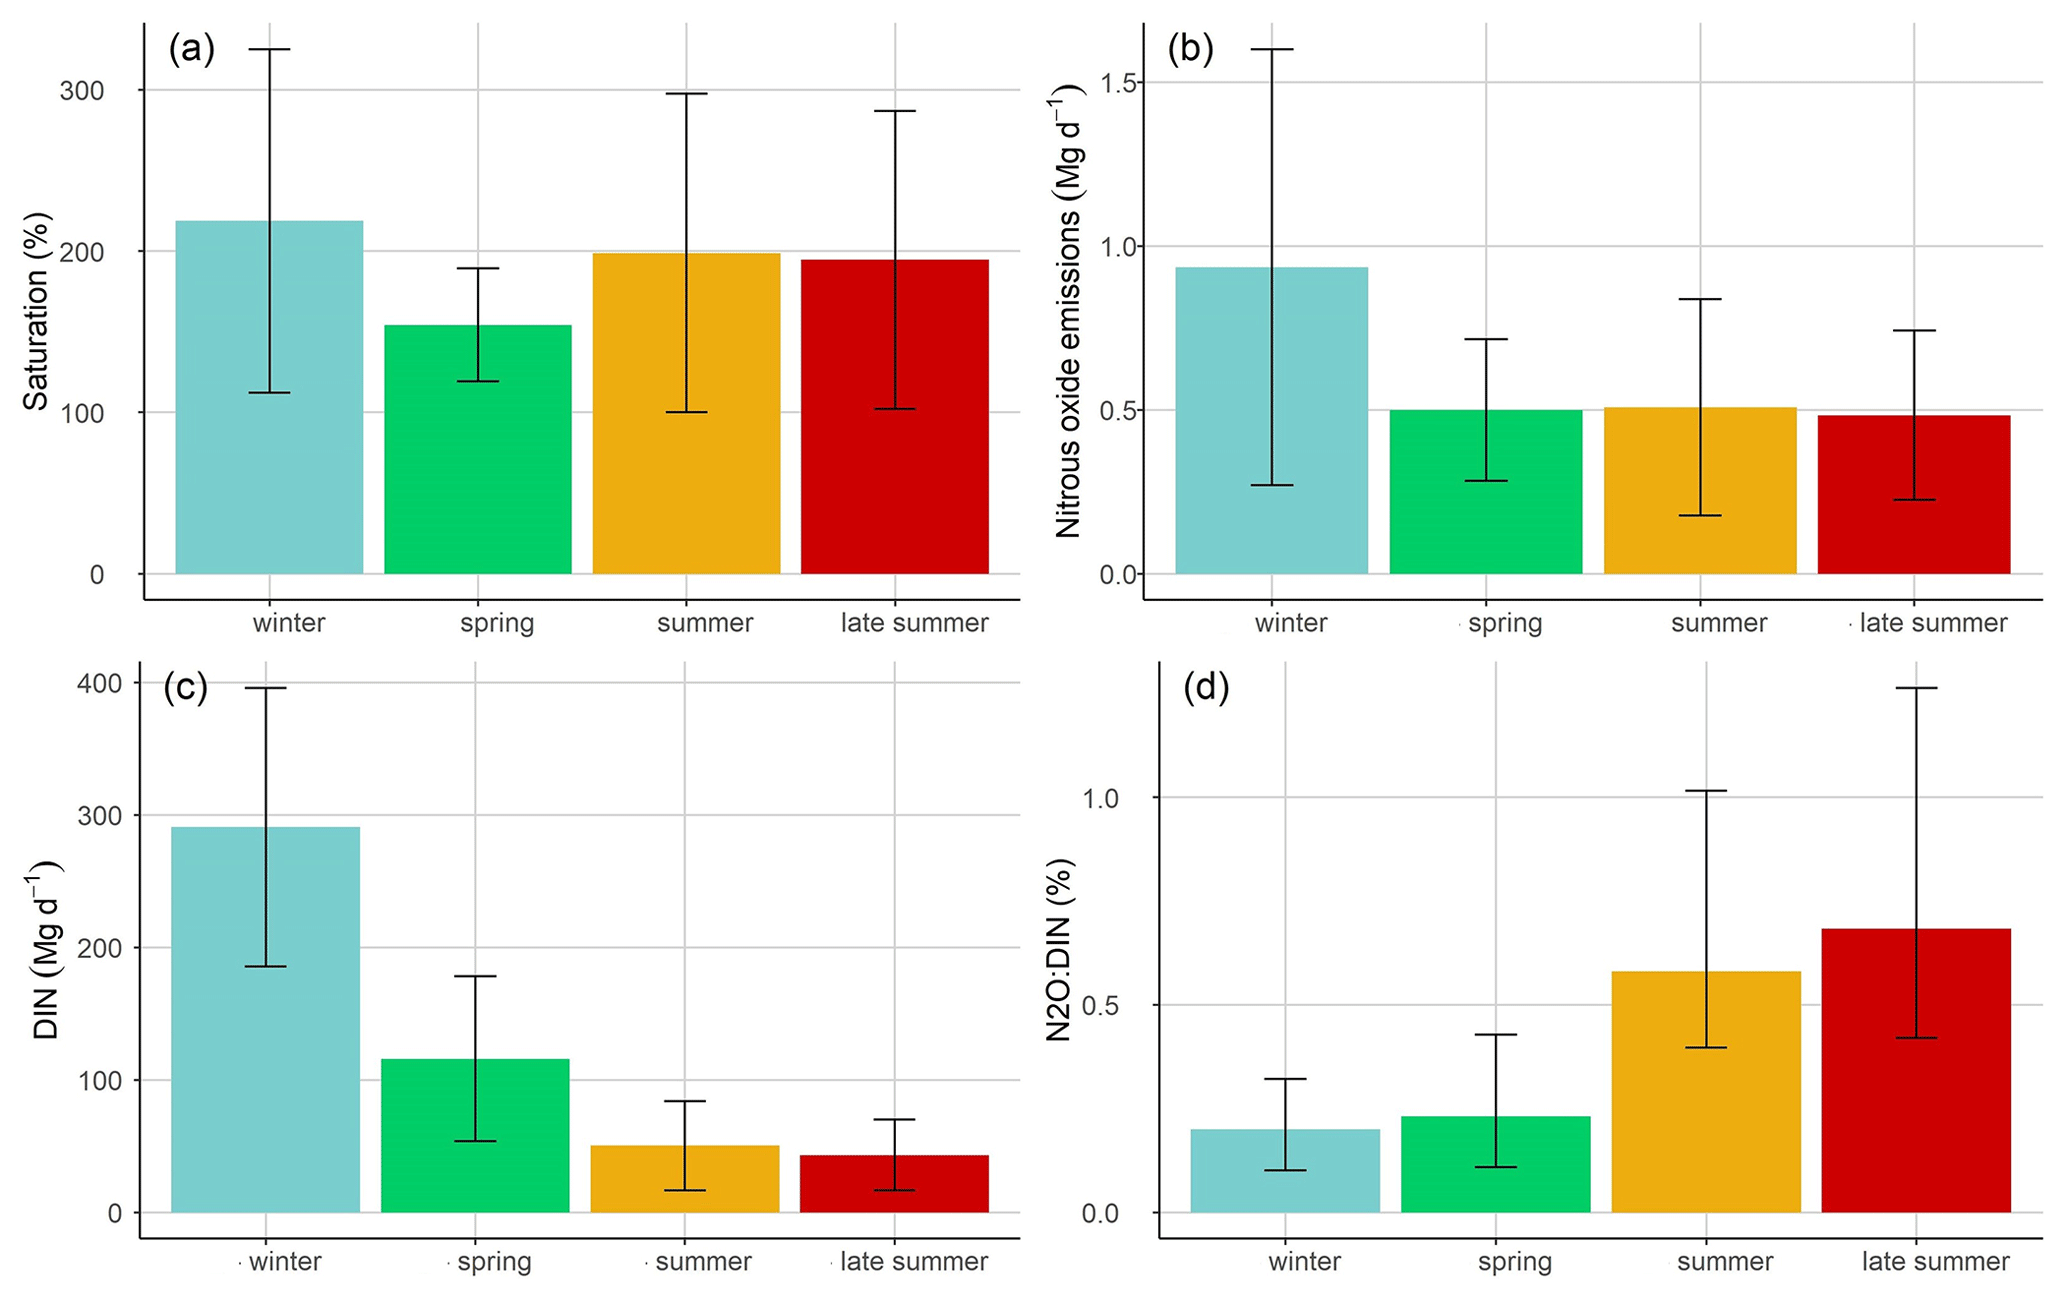
Figure 5(a) Average nitrous oxide saturation for each season, (b) average nitrous oxide emissions for each season calculated after Borges et al. (2004), (c) average DIN loads for each season, and (d) ratio of nitrous oxide emissions and DIN loads (N2O:DIN) for each season. The error bars represent the standard deviations for panels (a–c). The N2O:DIN ratios are shown as average values calculated for each parameterization and wind speeds with error bars representing their variability.
In a more general approach, the relationship between N2O and DIN (N2O:DIN) is used for global estimates of N2O emissions (Kroeze et al., 2005, 2010; Ivens et al., 2011; Hu et al., 2016). Using publicly available data (Tables S4 and S5), we calculated the amount of the annual nitrogen load released as N2O. Depending on the parameterization used for the gas transfer coefficients, 0.14 % to 0.67 % of the annual DIN loads of the Elbe Estuary were released as N2O (0.11 % to 0.57 % for TN loads). This is significantly less than the 1 % predicted by Kroeze et al. (2005) but matches the results from other estuaries with high agricultural input, e.g., Wells et al. (2018) with 0.3 % to 0.7 % (0.1 % for TN loads) and Robinson et al. (1998) with 0.5 % (0.3 % for TN loads), as well as the 0.11 % to 0.37 % estimated by Maavara et al. (2019), who used TN loads to predict global estuarine emissions. In general, N2O:DIN ratios vary widely (e.g., Baulch et al., 2012; Maavara et al., 2019; Smith and Böhlke, 2019). Wells et al. (2018) even found that a range from −25 % to 7 % of DIN was emitted as N2O in estuaries with low land-use intensity. At our site, the highest emissions were estimated in winter (Fig. 5b) along with the highest DIN loads (Fig. 5c). In spring, summer, and late summer, N2O emissions reduced along with DIN loads (Fig. 5b and c). However, N2O release did not scale with the seasonal change of DIN. In winter, 0.10 % to 0.32 % of DIN were released as N2O, whereas during the other seasons up to 1.26 % were emitted. Thus, our results corroborate that there is a varying relationship between DIN and N2O (Borges et al., 2015; Marzadri et al., 2017; Wells et al., 2018), showing that this relationship even varies seasonally on site due to changing drivers for N2O production and emissions, e.g., temperature (Murray et al., 2015; Quick et al., 2019) and oxygen levels (de Bie et al., 2002; Rosamond et al., 2012; Yevenes et al., 2017).
Next to DIN loads, we find that organic matter is an important driver for N2O production by providing substrate for nitrification. Furthermore, the comparison of results with previous measurements in the Elbe Estuary revealed that N2O saturation stopped to scale with DIN input after the 1990s (Sect. 4.1). The significant regime change after the 1990s enabled phytoplankton growth to re-establish in the river that had previously been inhibited by high pollutant levels and low light availability (Kerner, 2000; Amann et al., 2012; Hillebrand et al., 2018; Rewrie et al., 2023). The prevailing high nitrification rates in the estuary (Dähnke et al., 2008; Sanders et al., 2018) support an overarching control of organic matter on N2O production and emissions along the Elbe Estuary.
Overall, the Elbe is a year-round source of N2O to the atmosphere, with the highest emissions occurring in winter, along with high DIN loads and high wind speeds. However, summer N2O saturation and emissions did not decrease with lower riverine nitrogen input, suggesting variable relations of DIN and N2O (Borges et al., 2004; Marzadri et al., 2017; Wells et al., 2018) and seasonal variability of this ratio caused by changing drivers for N2O production and emissions. Two hotspots of N2O production were found in the Elbe Estuary: the Port of Hamburg and the mesohaline estuary near the estuarine turbidity maximum. Biological N2O production was fueled by riverine organic matter in the Hamburg Port or marine organic matter in the MTZ. A comparison with historical N2O measurements in the Elbe Estuary revealed that N2O saturation did not decrease with DIN input after the 1990s. The improvement of water quality in the Elbe Estuary allowed phytoplankton growth after the reunification of Germany in 1990s (Kerner, 2000; Amann et al., 2012; Hillebrand et al., 2018; Rewrie et al., 2023) and led to a switch from dominant denitrification to high nitrification (Dähnke et al., 2008; Sanders et al., 2018), supporting the overarching control of organic matter on N2O production along the Elbe Estuary. Thus, our findings indicate that DIN availability is not the sole control of N2O production in estuaries with high agricultural input.
High organic matter availability due to phytoplankton blooms driven by river eutrophication fuels nitrification and subsequent N2O emissions, causing a decoupling of the N2O:DIN ratio. Therefore, N2O emissions in heavily managed estuaries with high agricultural loads are clearly linked to eutrophication. A reduced nitrogen input would reduce phytoplankton growth and thus also N2O emissions. However, the development of phytoplankton blooms is not solely controlled by nutrient inputs but also by, e.g., temperature, residence time, water depth, and grazing. Thus, complex biological and chemical processes control phytoplankton dynamics (Scharfe et al., 2009; Dijkstra et al., 2019; Kamjunke et al., 2021), which will change significantly in the future due to the effects of climate change (IPCC, 2022). A holistic approach to water quality mitigation and climate change adaptation is needed to prevent high N2O emissions.
The data sets generated and/or analyzed in this study from 2017 to 2022 are currently available upon request from the corresponding author and will be made publicly available at coastMap Geoportal (http://www.coastmap.org, last access: 27 July 2023), connecting to PANGAEA (https://www.pangaea.de/, last access: 27 July 2023) with DOI availability in the near future. Data of N2O concentrations measured in the Elbe Estuary in 2015 are available at https://doi.org/10.1594/PANGAEA.882348 (Brase et al., 2017b).
The supplement related to this article is available online at: https://doi.org/10.5194/bg-20-3229-2023-supplement.
GS, TS, and KD designed this study. GS did the sampling and measurements for cruises from 2020 to 2022 as well as the data interpretation and evaluation. TS was responsible for the sampling and measurements for cruises done in 2017 and 2019. YGV provided the oxygen data correction from the FerryBox data. KD, HWB, YGV, and TS contributed with scientific and editorial recommendations. GS prepared the paper with contributions from all co-authors.
At least one of the (co-)authors is a member of the editorial board of Biogeosciences. The peer-review process was guided by an independent editor, and the authors also have no other competing interests to declare.
Publisher's note: Copernicus Publications remains neutral with regard to jurisdictional claims in published maps and institutional affiliations.
This study was funded by the Deutsche Forschungsgemeinschaft (DFG, German Research Foundation) under Germany's Excellence Strategy – EXC 2037 “CLICCS – Climate, Climatic Change, and Society”, contribution to the Center for Earth System Research and Sustainability (CEN) of Universität Hamburg. Parts of the study were done in the framework of the cross-topic activity MOSES (Modular Observation Solutions for Earth Systems) within the Helmholtz program Changing Earth (Topic 4.1). We thank the crew of R/V Ludwig Prandtl for the great support during the cruises. Thanks to Leon Schmidt and the entire working group “Aquatic nutrients cycles” for measuring the nutrients and the support during the campaigns. We are thankful for the Hereon FerryBox Team for providing the FerryBox data. Thanks to the working group of Biogeochemistry at the Institute for Geology of the University of Hamburg for measuring ratios, PC fractions, and PN fractions. We thank Frank Laurich (HAMBURG WASSER) and Maja Karrasch (Hamburg Port Authority) for their interest in our N2O measurements and their willingness to provide information. Thanks to Victoria Oritz (Federal Waterways and Engineering and Research Insitute) for providing the respective areas of the Elbe Estuary. Thanks to the NOAA ESRL GML CCGG Group for providing high quality, readily accessible atmospheric N2O data.
This research has been supported by the Deutsche Forschungsgemeinschaft (grant no. 390683824).
The article processing charges for this open-access publication were covered by the Helmholtz-Zentrum Hereon.
This paper was edited by Jack Middelburg and reviewed by Perran Cook and two anonymous referees.
Amann, T., Weiss, A., and Hartmann, J.: Carbon dynamics in the freshwater part of the Elbe estuary, Germany: Implications of improving water quality, Estuar. Coast. Shelf S., 107, 112–121, https://doi.org/10.1016/j.ecss.2012.05.012, 2012.
Bange, H. W.: Nitrous oxide and methane in European coastal waters, Estuar. Coast. Shelf S., 70, 361–374, https://doi.org/10.1016/j.ecss.2006.05.042, 2006.
Bange, H. W.: Gaseous Nitrogen Compounds (NO, N2O, N2, NH3) in the Ocean, Chap. 2, in: Nitrogen in the Marine Environment, 2nd Edn., edited by: Capone, D. G., Bronk, D. A., Mulholland, M. R., and Carpenter, E. J., https://doi.org/10.1016/B978-0-12-372522-6.00002-5, 51–94, ISBN 9780123725226, 2008.
Barnes, J. and Owens, N. J. P.: Denitrification and Nitrous Oxide Concentrations in the Humber Estuary, UK, and Adjacent Coastal Zones, Mar. Pollut. Bull., 37, 247–260, https://doi.org/10.1016/S0025-326X(99)00079-X, 1999.
Barnes, J. and Upstill-Goddard, R. C.: N2O seasonal distributions and air–sea exchange in UK estuaries: Implications for the tropospheric N2O source from European coastal waters, J. Geophys. Res.-Biogeo., 116, G01006, https://doi.org/10.1029/2009JG001156, 2011.
Barnes, J., Ramesh, R., Purvaja, R., Nirmal Rajkumar, A., Senthil Kumar, B., Krithika, K., Ravichandran, K., Uher, G., and Upstill-Goddard, R.: Tidal dynamics and rainfall control N2O and CH4 emissions from a pristine mangrove creek, Geophys. Res. Lett., 33, L15405, https://doi.org/10.1029/2006GL026829, 2006.
Baulch, H. M., Dillon, P. J., Maranger, R., Venkiteswaran, J. J., Wilson, H. F., and Schiff, S. L.: Night and day: short-term variation in nitrogen chemistry and nitrous oxide emissions from streams, Freshwater Biol., 57, 509–525, https://doi.org/10.1111/j.1365-2427.2011.02720.x, 2012.
Beaulieu, J. J., Shuster, W. D., and Rebholz, J. A.: Nitrous Oxide Emissions from a Large, Impounded River: The Ohio River, Environ. Sci. Technol., 44, 7527–7533, https://doi.org/10.1021/es1016735, 2010.
Bergemann, M.: Die Trübungszone in der Tideelbe – Beschreibung der räumlichen und zeitlichen Entwicklung, Wassergütestelle Elbe, https://www.fgg-elbe.de/files/Download-Archive/Fachberichte/Truebungsverhaeltnisse/04Truebungsz.pdf (last access: 27 July 2023), 2004.
Bergemann, M. and Gaumert, T.: Elbebericht 2008: Ergebnisse des nationalen Überwachungsprogramms Elbe der Bundesländerüber den ökologischen und chemischen Zustand der Elbe nach EG-WRRLsowie der Trendentwicklung von Stoffen und Schadstoffgruppen, Flussgebietsgemeinschaft Elbe (FGG Elbe), Hamburg, https://www.fgg-elbe.de/berichte/aktualisierung-nach-art-13-2021.html?file=files/Downloads/EG_WRRL/ber/bp2021/Bewirtschaftungsplan_FGG_Elbe_2021.pdf&cid=14864 (last access: 27 July 2023), 2008.
Bianchi, T. S.: Biogeochemistry of Estuaries, Oxford University Press, New York, 706 pp., https://doi.org/10.1093/oso/9780195160826.001.0001, 2007.
Boehlich, M. J. and Strotmann, T.: The Elbe Estuary, Küste, 74, 288–306, 2008.
Boehlich, M. J. and Strotmann, T.: Das Elbeästuar, Küste, 87, Kuratorium für Forschung im Küsteningenieurwesen (KFKI), https://doi.org/10.18171/1.087106, 2019.
Borges, A., Vanderborght, J.-P., Schiettecatte, L.-S., Gazeau, F., Ferrón-Smith, S., Delille, B., and Frankignoulle, M.: Variability of gas transfer velocity of CO2 in a macrotidal estuary (The Scheldt), Estuaries, 27, 593–603, https://doi.org/10.1007/BF02907647, 2004.
Borges, A. V., Darchambeau, F., Teodoru, C. R., Marwick, T. R., Tamooh, F., Geeraert, N., Omengo, F. O., Guérin, F., Lambert, T., Morana, C., Okuku, E., and Bouillon, S.: Globally significant greenhouse-gas emissions from African inland waters, Nat. Geosci., 8, 637–642, https://doi.org/10.1038/ngeo2486, 2015.
Bouwman, A. F., Bierkens, M. F. P., Griffioen, J., Hefting, M. M., Middelburg, J. J., Middelkoop, H., and Slomp, C. P.: Nutrient dynamics, transfer and retention along the aquatic continuum from land to ocean: towards integration of ecological and biogeochemical models, Biogeosciences, 10, 1–22, https://doi.org/10.5194/bg-10-1-2013, 2013.
Brase, L., Bange, H. W., Lendt, R., Sanders, T., and Dähnke, K.: High Resolution Measurements of Nitrous Oxide (N2O) in the Elbe Estuary, Front. Mar. Sci., 4, 162, https://doi.org/10.3389/fmars.2017.00162, 2017a.
Brase, L., Bange, H. W., Lendt, R., Sanders, T., and Dähnke, K.: Nitrous oxide (N2O) measurements in the surface water of the Elbe Estuary in 2015, PANGAEA [data set], https://doi.org/10.1594/PANGAEA.882348, 2017b.
Brown, A. M., Bass, A. M., and Pickard, A. E.: Anthropogenic-estuarine interactions cause disproportionate greenhouse gas production: A review of the evidence base, Mar. Pollut. Bull., 174, 113240, https://doi.org/10.1016/j.marpolbul.2021.113240, 2022.
Büttner, O., Jawitz, J. W., and Borchardt, D.: Ecological status of river networks: stream order-dependent impacts of agricultural and urban pressures across ecoregions, Environ. Res. Lett., 15, 1040b3, https://doi.org/10.1088/1748-9326/abb62e, 2020.
Chun, Y., Kim, D., Hattori, S., Toyoda, S., Yoshida, N., Huh, J., Lim, J.-H., and Park, J.-H.: Temperature control on wastewater and downstream nitrous oxide emissions in an urbanized river system, Water Res., 187, 116417, https://doi.org/10.1016/j.watres.2020.116417, 2020.
Clark, J. F., Schlosser, P., Simpson, H. J., Stute, M., Wanninkhof, R., and Ho, D. T.: Relationship between gas transfer velocities and wind speeds in the tidal Hudson River determined by the dual tracer technique, in: Air–Water Gas Transfer, edited by: Jähne, B. and Monahan, E. C., AEON Verlag, Hanau, 785–800, http://www.soest.hawaii.edu/oceanography/faculty/ho/papers/Relationship_between_Gas_Transfer_Velocities_and_W.pdf (last access: 27 July 2023), 1995.
Crossland, C. J., Baird, D., Ducrotoy, J.-P., Lindeboom, H., Buddemeier, R. W., Dennison, W. C., Maxwell, B. A., Smith, S. V., and Swaney, D. P.: The Coastal Zone – a Domain of Global Interactions, in: Coastal Fluxes in the Anthropocene: The Land-Ocean Interactions in the Coastal Zone Project of the International Geosphere-Biosphere Programme, edited by: Crossland, C. J., Kremer, H. H., Lindeboom, H. J., Marshall Crossland, J. I., and Tissier, M. D. A., Springer, Berlin, Heidelberg, https://doi.org/10.1007/3-540-27851-6_1, 1–37, 2005.
Dähnke, K., Bahlmann, E., and Emeis, K.-C.: A nitrate sink in estuaries? An assessment by means of stable nitrate isotopes in the Elbe estuary, Limnol. Oceanogr., 53, 1504–1511, https://doi.org/10.4319/lo.2008.53.4.1504, 2008.
Dähnke, K., Sanders, T., Voynova, Y., and Wankel, S. D.: Nitrogen isotopes reveal a particulate-matter-driven biogeochemical reactor in a temperate estuary, Biogeosciences, 19, 5879–5891, https://doi.org/10.5194/bg-19-5879-2022, 2022.
de Bie, M. J. M., Middelburg, J. J., Starink, M., and Laanbroek, H. J.: Factors controlling nitrous oxide at the microbial community and estuarine scale, Mar. Ecol.-Prog. Ser., 240, 1–9, https://doi.org/10.3354/meps240001, 2002.
de Wilde, H. P. and de Bie, M. J.: Nitrous oxide in the Schelde estuary: production by nitrification and emission to the atmosphere, Mar. Chem., 69, 203–216, https://doi.org/10.1016/S0304-4203(99)00106-1, 2000.
Deek, A., Dähnke, K., van Beusekom, J., Meyer, S., Voss, M., and Emeis, K.-C.: N2 fluxes in sediments of the Elbe Estuary and adjacent coastal zones, Mar. Ecol.-Prog. Ser., 493, 9–21, https://doi.org/10.3354/meps10514, 2013.
Dijkstra, Y. M., Chant, R. J., and Reinfelder, J. R.: Factors Controlling Seasonal Phytoplankton Dynamics in the Delaware River Estuary: an Idealized Model Study, Estuaries Coasts, 42, 1839–1857, https://doi.org/10.1007/s12237-019-00612-3, 2019.
Fabisik, F., Guieysse, B., Procter, J., and Plouviez, M.: Nitrous oxide (N2O) synthesis by the freshwater cyanobacterium Microcystis aeruginosa, Biogeosciences, 20, 687–693, https://doi.org/10.5194/bg-20-687-2023, 2023.
FGG Elbe: Nährstoffminderungsstrategie für die Flussgebietsgemeinschaft Elbe, Flussgebietsgemeinschaft Elbe (FGG Elbe), Magdeburg, https://www.fgg-elbe.de/files/Downloads/News/Projekte/Naehrstoffminderungsstrategie_2018_12-04.pdf (last access: 27 July 2023), 2018.
FIS: Das Fachinfomrationssystem der FGG Elbe [data set], https://www.elbe-datenportal.de/FisFggElbe/content/start/ZurStartseite.action;jsessionid=A37EDCF5B5EC1ECB15091447E64EC53895 (last access: 21 November 2022), 2022.
Fraga, F., Ríos, A. F., Pérez, F. F., and Figueiras, F. G.: Theoretical limits of oxygen:carbon and oxygen:nitrogen ratios during photosynthesis and mineralisation of organic matter in the sea, Sci. Mar., 62, 161–168, https://doi.org/10.3989/scimar.1998.62n1-2161, 1998.
Garnier, J., Cébron, A., Tallec, G., Billen, G., Sebilo, M., and Martinez, A.: Nitrogen Behaviour and Nitrous Oxide Emission in the Tidal Seine River Estuary (France) as Influenced by Human Activities in the Upstream Watershed, Biogeochemistry, 77, 305–326, https://doi.org/10.1007/s10533-005-0544-4, 2006.
Gaumert, T. and Bergemann, M.: Sauerstoffgehalt der Tideelbe – Entwicklung der kritischen Sauerstoffgehalte im Jahr 2007 und in den Vorjahren, Erörterung möglicher Ursachen und Handlungsoptionen, Flussgebietsgemeinschaft Elbe, https://www.fgg-elbe.de/files/Download-Archive/Fachberichte/Sauerstoffhaushalt/FGG_Elbe-O2-Haushalt.pdf (last access: 27 July 2023), 2007.
Geerts, L., Wolfstein, K., Jacobs, S., van Damme, S., and Vandenbruwaene, W.: Zonation of the TIDE estuaries, TIDE toolbox, https://www.tide-toolbox.eu/pdf/reports/Zonation_of_the_TIDE_estuaries.pdf (last access: 27 July 2023), 2012.
Gonçalves, C., Brogueira, M. J., and Camões, M. F.: Seasonal and tidal influence on the variability of nitrous oxide in the Tagus estuary, Portugal, Sci. Mar., 74, 57–66, https://doi.org/10.3989/scimar.2010.74s1057, 2010.
Gonçalves, C., Brogueira, M. J., and Nogueira, M.: Tidal and spatial variability of nitrous oxide (N2O) in Sado estuary (Portugal), Estuar. Coast. Shelf S., 167, 466–474, https://doi.org/10.1016/j.ecss.2015.10.028, 2015.
Hall Jr., R. O. and Ulseth, A. J.: Gas exchange in streams and rivers, WIREs Water, 7, e1391, https://doi.org/10.1002/wat2.1391, 2020.
Halling-Sorensen, B. and Jorgensen, S. E. (Eds.): 3. Process Chemistry and Biochemistry of Nitrification, in: Studies in Environmental Science, Vol. 54, Elsevier, https://doi.org/10.1016/S0166-1116(08)70525-9, 55–118, 1993.
Hanke, V.-R. and Knauth, H.-D.: N2O-Gehalte in Wasser-und Luftproben aus den Bereichen der Tideelbe und der Deutschen Bucht, GKSS-Forschungszentrum, Weinheim, 1990.
Hansen, H. P. and Koroleff, F.: Determination of nutrients, in: Methods of Seawater Analysis, edited by: Grasshoff, K., Kremling, K., and Ehrhardt, M., John Wiley & Sons, Ltd, 159–228, https://doi.org/10.1002/9783527613984.ch10, 1999.
Harley, J. F., Carvalho, L., Dudley, B., Heal, K. V., Rees, R. M., and Skiba, U.: Spatial and seasonal fluxes of the greenhouse gases N2O, CO2 and CH4 in a UK macrotidal estuary, Estuar. Coast. Shelf S., 153, 62–73, https://doi.org/10.1016/j.ecss.2014.12.004, 2015.
Hedges, J. I. and Keil, R. G.: Sedimentary organic matter preservation: an assessment and speculative synthesis, Mar. Chem., 49, 81–115, https://doi.org/10.1016/0304-4203(95)00008-F, 1995.
Hein, S. S. V., Sohrt, V., Nehlsen, E., Strotmann, T., and Fröhle, P.: Tidal Oscillation and Resonance in Semi-Closed Estuaries—Empirical Analyses from the Elbe Estuary, North Sea, Water, 13, 848, https://doi.org/10.3390/w13060848, 2021.
Hillebrand, G., Hardenbicker, P., Fischer, H., Otto, W., and Vollmer, S.: Dynamics of total suspended matter and phytoplankton loads in the river Elbe, J. Soils Sediments, 18, 3104–3113, https://doi.org/10.1007/s11368-018-1943-1, 2018.
Hofmann, J., Behrendt, H., Gilbert, A., Janssen, R., Kannen, A., Kappenberg, J., Lenhart, H., Lise, W., Nunneri, C., and Windhorst, W.: Catchment–coastal zone interaction based upon scenario and model analysis: Elbe and the German Bight case study, Reg. Environ. Change, 5, 54–81, https://doi.org/10.1007/s10113-004-0082-y, 2005.
HPA and Freie und Hansestadt Hamburg: Deutsches Gewässerkundliches Jahrbuch – Elbegebiet, Teil III, Untere Elbe ab der Havelmündung – 2014, Hamburg, 2017.
Hu, M., Chen, D., and Dahlgren, R. A.: Modeling nitrous oxide emission from rivers: a global assessment, Glob. Change Biol., 22, 3566–3582, https://doi.org/10.1111/gcb.13351, 2016.
IKSE: Strategie zur Minderung der Nährstoffeinträge in Gewässer in der internationalen Flussgebietsgemeinschaft Elbe, Internationale Kommission zur Schutz der Elbe, Magdeburg, https://www.fgg-elbe.de/files/Downloads/News/Projekte/Naehrstoffminderungsstrategie_2018_12-04.pdf (last access: 27 July 2023), 2018.
IPCC: Climate Change 2021: The Physical Science Basis. Contribution of Working Group I to the Sixth Assessment Report of the Intergovernmental Panel on Climate Change, edited by: Masson-Delmotte, V., Zhai, P., Pirani, A., Connors, S. L., Péan, C., Berger, S., Caud, N., Chen, Y., Goldfarb, L., Gomis, M. I., Huang, M., Leitzell, K., Lonnoy, E., Matthews, J. B. R., Maycock, T. K., Waterfield, T., Yelekçi, Ö., Yu, R., and Zhou, B., Cambridge University Press, Cambridge, United Kingdom and New York, NY, USA, https://doi.org/10.1017/9781009157896, 2021.
IPCC: Climate Change 2022: Impacts, Adaptation and Vulnerability. Contribution of Working Group II to the Sixth Assessment Report of the Intergovernmental Panel on Climate Change, edited by: Pörtner, H.-O., Roberts, D. C., Tignor, M. M. B., Poloczanska, E. S., Mintenbeck, K., Alegría, A., Craig, M., Langsdorf, S., Löschke, S., Möller, V., Okem, A., and Rama, B., Cambridge University Press, Cambridge, UK and New York, NY, USA, 3056 pp., https://doi.org/10.1017/9781009325844, 2022.
Ivens, W. P. M. F., Tysmans, D. J. J., Kroeze, C., Löhr, A. J., and van Wijnen, J.: Modeling global N2O emissions from aquatic systems, Curr. Opin. Env. Sust., 3, 350–358, https://doi.org/10.1016/j.cosust.2011.07.007, 2011.
Ji, Q., Frey, C., Sun, X., Jackson, M., Lee, Y.-S., Jayakumar, A., Cornwell, J. C., and Ward, B. B.: Nitrogen and oxygen availabilities control water column nitrous oxide production during seasonal anoxia in the Chesapeake Bay, Biogeosciences, 15, 6127–6138, https://doi.org/10.5194/bg-15-6127-2018, 2018.
Johannsen, A., Dähnke, K., and Emeis, K.: Isotopic composition of nitrate in five German rivers discharging into the North Sea, Org. Geochem., 39, 1678–1689, https://doi.org/10.1016/j.orggeochem.2008.03.004, 2008.
Kamjunke, N., Rode, M., Baborowski, M., Kunz, J., Zehner, J., Borchardt, D., and Weitere, M.: High irradiation and low discharge promote the dominant role of phytoplankton in riverine nutrient dynamics, Limnol. Oceanogr., 66, https://doi.org/10.1002/lno.11778, 2021.
Kappenberg, J. and Fanger, H.-U.: Sedimenttransportgeschehen in der tidebeeinflussten Elbe, der Deutschen Bucht und in der Nordsee, GKSS-Forschungszentrum, Geesthacht, https://www.hereon.de/imperia/md/content/hzg/zentrale_einrichtungen/bibliothek/berichte/gkss_berichte_2007/gkss_2007_20.pdf (last access: 27 July 2023), 2007.
Kassambara, A.: ggpubr: “ggplot2” Based Publication Ready Plots, https://CRAN.R-project.org/package=ggpubr (last access: 27 July 2023), 2023.
Kerner, M.: Interactions between local oxygen deficiencies and heterotrophic microbial processes in the elbe estuary, Limnologica, 30, 137–143, https://doi.org/10.1016/S0075-9511(00)80008-0, 2000.
Knowles, R.: Denitrification, Microbiol. Rev., 46, 43–70, https://doi.org/10.1128/mr.46.1.43-70.1982, 1982.
Koch, M. S., Maltby, E., Oliver, G. A., and Bakker, S. A.: Factors controlling denitrification rates of tidal mudflats and fringing salt marshes in south-west England, Estuar. Coast. Shelf S., 34, 471–485, https://doi.org/10.1016/S0272-7714(05)80118-0, 1992.
Kroeze, C., Dumont, E., and Seitzinger, S. P.: New estimates of global emissions of N2O from rivers and estuaries, Environ. Sci., 2, 159–165, https://doi.org/10.1080/15693430500384671, 2005.
Kroeze, C., Dumont, E., and Seitzinger, S.: Future trends in emissions of N2O from rivers and estuaries, J. Integr. Environ. Sci., 7, 71–78, https://doi.org/10.1080/1943815X.2010.496789, 2010.
Lan, X., Dlugokencky, E. J., Mund, J. W., Crotwell, A. M., Crotwell, M. J., Moglia, E., Madronich, M., Neff, D., and Thoning, K. W.: Atmospheric Nitrous Oxide Dry Air Mole Fractions from the NOAA GML Carbon Cycle Cooperative Global Air Sampling Network, 1997–2021, Version: 2022-11-21, https://doi.org/10.15138/53g1-x417 [data set], 2022.
Maavara, T., Lauerwald, R., Laruelle, G. G., Akbarzadeh, Z., Bouskill, N. J., Van Cappellen, P., and Regnier, P.: Nitrous oxide emissions from inland waters: Are IPCC estimates too high?, Glob. Change Biol., 25, 473–488, https://doi.org/10.1111/gcb.14504, 2019.
Marzadri, A., Dee, M. M., Tonina, D., Bellin, A., and Tank, J. L.: Role of surface and subsurface processes in scaling N2O emissions along riverine networks, P. Natl. Acad. Sci. USA, 114, 4330–4335, https://doi.org/10.1073/pnas.1617454114, 2017.
Middelburg, J. J. and Herman, P. M. J.: Organic matter processing in tidal estuaries, Mar. Chem., 106, 127–147, https://doi.org/10.1016/j.marchem.2006.02.007, 2007.
Middelburg, J. J. and Nieuwenhuize, J.: Uptake of dissolved inorganic nitrogen in turbid, tidal estuaries, Mar. Ecol. Prog. Ser., 192, 79–88, https://doi.org/10.3354/meps192079, 2000.
Murray, R. H., Erler, D. V., and Eyre, B. D.: Nitrous oxide fluxes in estuarine environments: response to global change, Glob. Change Biol., 21, 3219–3245, https://doi.org/10.1111/gcb.12923, 2015.
Nevison, C., Butler, J. H., and Elkins, J. W.: Global distribution of N2O and the ΔN2O-AOU yield in the subsurface ocean, Global Biogeochem. Cy., 17, 1119, https://doi.org/10.1029/2003GB002068, 2003.
Nightingale, P. D., Malin, G., Law, C. S., Watson, A. J., Liss, P. S., Liddicoat, M. I., Boutin, J., and Upstill-Goddard, R. C.: In situ evaluation of air–sea gas exchange parameterizations using novel conservative and volatile tracers, Global Biogeochem. Cy., 14, 373–387, https://doi.org/10.1029/1999GB900091, 2000.
Nixon, S. W., Ammerman, J. W., Atkinson, L. P., Berounsky, V. M., Billen, G., Boicourt, W. C., Boynton, W. R., Church, T. M., Ditoro, D. M., Elmgren, R., Garber, J. H., Giblin, A. E., Jahnke, R. A., Owens, N. J. P., Pilson, M. E. Q., and Seitzinger, S. P.: The fate of nitrogen and phosphorus at the land–sea margin of the North Atlantic Ocean, Biogeochemistry, 35, 141–180, https://doi.org/10.1007/BF02179826, 1996.
Norbisrath, M., Pätsch, J., Dähnke, K., Sanders, T., Schulz, G., van Beusekom, J. E. E., and Thomas, H.: Metabolic alkalinity release from large port facilities (Hamburg, Germany) and impact on coastal carbon storage, Biogeosciences, 19, 5151–5165, https://doi.org/10.5194/bg-19-5151-2022, 2022.
Pätsch, J., Serna, A., Dähnke, K., Schlarbaum, T., Johannsen, A., and Emeis, K.-C.: Nitrogen cycling in the German Bight (SE North Sea) – Clues from modelling stable nitrogen isotopes, Cont. Shelf Res., 30, 203–213, https://doi.org/10.1016/j.csr.2009.11.003, 2010.
Pind, A., Risgaard-Petersen, N., and Revsbech, N. P.: Denitrification and microphytobenthic consumption in a Danish lowland stream: diurnal and seasonal variation, Aquat. Microb. Ecol., 12, 275–284, https://doi.org/10.3354/ame012275, 1997.
Quick, A. M., Reeder, W. J., Farrell, T. B., Tonina, D., Feris, K. P., and Benner, S. G.: Nitrous oxide from streams and rivers: A review of primary biogeochemical pathways and environmental variables, Earth-Sci. Rev., 191, 224–262, https://doi.org/10.1016/j.earscirev.2019.02.021, 2019.
Quiel, K., Becker, A., Kirchesch, V., Schöl, A., and Fischer, H.: Influence of global change on phytoplankton and nutrient cycling in the Elbe River, Reg. Environ. Change, 11, 405–421, https://doi.org/10.1007/s10113-010-0152-2, 2011.
Radach, G. and Pätsch, J.: Variability of continental riverine freshwater and nutrient inputs into the North Sea for the years 1977–2000 and its consequences for the assessment of eutrophication, Estuaries Coasts, 30, 66–81, https://doi.org/10.1007/BF02782968, 2007.
Reading, M. J., Tait, D. R., Maher, D. T., Jeffrey, L. C., Looman, A., Holloway, C., Shishaye, H. A., Barron, S., and Santos, I. R.: Land use drives nitrous oxide dynamics in estuaries on regional and global scales, Limnol. Oceanogr., 65, 1903–1920, https://doi.org/10.1002/lno.11426, 2020.
Redfield, A. C., Ketchum, B. H., and Richards, F. A.: The influence of organisms on the composition of sea-water, in: The composition of seawater: Comparative and descriptive oceanography, The sea: ideas and observations on progress in the study of the seas, 2. Interscience Publishers, New York, ISBN 9780674017283, 554 pp., 1963.
Rewrie, L. C. V., Voynova, Y. G., van Beusekom, J. E. E., Sanders, T., Körtzinger, A., Brix, H., Ollesch, G., and Baschek, B.: Significant shifts in inorganic carbon and ecosystem state in a temperate estuary (1985–2018), Limnol. Oceanogr., https://doi.org/10.1002/lno.12395, online first, 2023.
Rhee, T. S., Kettle, A. J., and Andreae, M. O.: Methane and nitrous oxide emissions from the ocean: A reassessment using basin-wide observations in the Atlantic, J. Geophys. Res.-Atmos., 114, D12304, https://doi.org/10.1029/2008JD011662, 2009.
Robinson, A. D., Nedwell, D. B., Harrison, R. M., and Ogilvie, B. G.: Hypernutrified estuaries as sources of N2O emission to the atmosphere: the estuary of the River Colne, Essex, UK, Mar. Ecol.-Prog. Ser., 164, 59–71, https://doi.org/10.3354/meps164059, 1998.
Rosamond, M. S., Thuss, S. J., and Schiff, S. L.: Dependence of riverine nitrous oxide emissions on dissolved oxygen levels, Nat. Geosci., 5, 715–718, https://doi.org/10.1038/ngeo1556, 2012.
Rosenhagen, G., Schatzmann, M., and Schrön, A.: Das Klima der Metropolregion auf Grundlage meteorologischer Messungen und Beobachtungen, in: Klimabericht für die Metropolregion Hamburg, edited by: von Storch, H. and Claussen, M., Springer, Berlin, Heidelberg, 19–59, https://doi.org/10.1007/978-3-642-16035-6_2, 2011.
Rosentreter, J. A., Wells, N. S., Ulseth, A. J., and Eyre, B. D.: Divergent Gas Transfer Velocities of CO2, CH4, and N2O Over Spatial and Temporal Gradients in a Subtropical Estuary, J. Geophys. Res.-Biogeo., 126, e2021JG006270, https://doi.org/10.1029/2021JG006270, 2021.
Sanders, T., Schöl, A., and Dähnke, K.: Hot Spots of Nitrification in the Elbe Estuary and Their Impact on Nitrate Regeneration, Estuaries Coasts, 41, 128–138, https://doi.org/10.1007/s12237-017-0264-8, 2018.
Scharfe, M., Callies, U., Blöcker, G., Petersen, W., and Schroeder, F.: A simple Lagrangian model to simulate temporal variability of algae in the Elbe River, Ecol. Model., 220, 2173–2186, https://doi.org/10.1016/j.ecolmodel.2009.04.048, 2009.
Schleswig-Holstein and Hamburg: Mittlere Windgeschwindigkeit (1986–2015)* | Norddeutscher Klimamonitor, https://www.norddeutscher-klimamonitor.de/klima/1986-2015/jahr/mittlere-windgeschwindigkeit/schleswig-holstein-hamburg/coastdat-1.html (last access: 27 April 2023), 2023.
Schoer, J. H.: Determination of the origin of suspended matter and sediments in the Elbe estuary using natural tracers, Estuaries, 13, 161–172, https://doi.org/10.2307/1351585, 1990.
Schöl, A., Hein, B., Wyrwa, J., and Kirchesch, V.: Modelling Water Quality in the Elbe and its Estuary – Large Scale and Long Term Applications with Focus on the Oxygen Budget of the Estuary, Küste, 203–232, 2014.
Schroeder, F.: Water quality in the Elbe estuary: Significance of different processes for the oxygen deficit at Hamburg, Environ. Model. Assess., 2, 73–82, https://doi.org/10.1023/A:1019032504922, 1997.
Sharma, N., Flynn, E. D., Catalano, J. G., and Giammar, D. E.: Copper availability governs nitrous oxide accumulation in wetland soils and stream sediments, Geochim. Cosmochim. Ac., 327, 96–115, https://doi.org/10.1016/j.gca.2022.04.019, 2022.
Siedler, G. and Peters, H.: Properties of sea water, Physical properties, in: Oceanography, vol. V/3a, edited by: Sündermann, J., Springer, Berlin, Germany, 233–264, ISBN 3-540-15092-7, 1986.
Silvennoinen, H., Hietanen, S., Liikanen, A., Stange, C. F., Russow, R., Kuparinen, J., and Martikainen, P. J.: Denitrification in the River Estuaries of the Northern Baltic Sea, AMBIO J. Hum. Environ., 36, 134–140, https://doi.org/10.1579/0044-7447(2007)36[134:DITREO]2.0.CO;2, 2007.
Smith, R. L. and Böhlke, J. K.: Methane and nitrous oxide temporal and spatial variability in two midwestern USA streams containing high nitrate concentrations, Sci. Total Environ., 685, 574–588, https://doi.org/10.1016/j.scitotenv.2019.05.374, 2019.
Sommerfield, C. K. and Wong, K.-C.: Mechanisms of sediment flux and turbidity maintenance in the Delaware Estuary, J. Geophys. Res.-Oceans, 116, C01005, https://doi.org/10.1029/2010JC006462, 2011.
Tang, W., Tracey, J. C., Carroll, J., Wallace, E., Lee, J. A., Nathan, L., Sun, X., Jayakumar, A., and Ward, B. B.: Nitrous oxide production in the Chesapeake Bay, Limnol. Oceanogr., 67, 2101–2116, https://doi.org/10.1002/lno.12191, 2022.
R-Core Team: The R Stats Package, Version 4.0.2: https://www.rdocumentation.org/packages/stats/versions/3.6.2/topics/prcomp (last access: 29 January 2021), 2021.
Tian, H., Xu, R., Canadell, J. G., Thompson, R. L., Winiwarter, W., Suntharalingam, P., Davidson, E. A., Ciais, P., Jackson, R. B., Janssens-Maenhout, G., Prather, M. J., Regnier, P., Pan, N., Pan, S., Peters, G. P., Shi, H., Tubiello, F. N., Zaehle, S., Zhou, F., Arneth, A., Battaglia, G., Berthet, S., Bopp, L., Bouwman, A. F., Buitenhuis, E. T., Chang, J., Chipperfield, M. P., Dangal, S. R. S., Dlugokencky, E., Elkins, J. W., Eyre, B. D., Fu, B., Hall, B., Ito, A., Joos, F., Krummel, P. B., Landolfi, A., Laruelle, G. G., Lauerwald, R., Li, W., Lienert, S., Maavara, T., MacLeod, M., Millet, D. B., Olin, S., Patra, P. K., Prinn, R. G., Raymond, P. A., Ruiz, D. J., van der Werf, G. R., Vuichard, N., Wang, J., Weiss, R. F., Wells, K. C., Wilson, C., Yang, J., and Yao, Y.: A comprehensive quantification of global nitrous oxide sources and sinks, Nature, 586, 248–256, https://doi.org/10.1038/s41586-020-2780-0, 2020.
US EPA: Volunteer Estuary Monitoring: A Methods Manual, United States Environmental Protection Agency (EPA), EPA-842-B-06-003, 2006.
van Beusekom, J. E. E., Carstensen, J., Dolch, T., Grage, A., Hofmeister, R., Lenhart, H., Kerimoglu, O., Kolbe, K., Pätsch, J., Rick, J., Rönn, L., and Ruiter, H.: Wadden Sea Eutrophication: Long-Term Trends and Regional Differences, Front. Mar. Sci., 6, 370, https://doi.org/10.3389/fmars.2019.00370, 2019.
Walter, S., Bange, H. W., and Wallace, D. W. R.: Nitrous oxide in the surface layer of the tropical North Atlantic Ocean along a west to east transect, Geophys. Res. Lett., 31, L23S07, https://doi.org/10.1029/2004GL019937, 2004.
Wanninkhof, R.: Relationship between wind speed and gas exchange over the ocean, J. Geophys. Res.-Oceans, 97, 7373–7382, https://doi.org/10.1029/92JC00188, 1992.
Weiss, R. F.: The solubility of nitrogen, oxygen and argon in water and seawater, Deep Sea Res. Oceanogr. Abstr., 17, 721–735, https://doi.org/10.1016/0011-7471(70)90037-9, 1970.
Weiss, R. F. and Price, B. A.: Nitrous oxide solubility in water and seawater, Mar. Chem., 8, 347–359, https://doi.org/10.1016/0304-4203(80)90024-9, 1980.
Wells, N. S., Maher, D. T., Erler, D. V., Hipsey, M., Rosentreter, J. A., and Eyre, B. D.: Estuaries as Sources and Sinks of N2O Across a Land Use Gradient in Subtropical Australia, Global Biogeochem. Cy., 32, 877–894, https://doi.org/10.1029/2017GB005826, 2018.
Wertz, S., Goyer, C., Burton, D. L., Zebarth, B. J., and Chantigny, M. H.: Processes contributing to nitrite accumulation and concomitant N2O emissions in frozen soils, Soil Biol. Biochem., 126, 31–39, https://doi.org/10.1016/j.soilbio.2018.08.001, 2018.
Winterwerp, J. C. and Wang, Z. B.: Man-induced regime shifts in small estuaries – I: theory, Ocean Dynam., 63, 1279–1292, https://doi.org/10.1007/s10236-013-0662-9, 2013.
WMO (World Meteorological Organization): Scientific Assessment of Ozone Depletion: 2018, Global Ozone Research and Monitoring Project – Report No. 58, 588 pp., Geneva, Switzerland, 2018.
Wolfstein, K. and Kies, L.: Composition of suspended participate matter in the Elbe estuary: Implications for biological and transportation processes, Dtsch. Hydrogr. Z., 51, 453–463, https://doi.org/10.1007/BF02764166, 1999.
Wrage, N., Velthof, G. L., van Beusichem, M. L., and Oenema, O.: The role of nitrifier denitrification in the production of nitrous oxide, Soil Biol. Biochem., 33, 1723–1732, https://doi.org/10.1016/S0038-0717(01)00096-7, 2001.
Yevenes, M. A., Bello, E., Sanhueza-Guevara, S., and Farías, L.: Spatial Distribution of Nitrous Oxide (N2O) in the Reloncaví Estuary–Sound and Adjacent Sea (41∘–43∘ S), Chilean Patagonia, Estuaries Coasts, 40, 807–821, https://doi.org/10.1007/s12237-016-0184-z, 2017.
Zander, F., Heimovaara, T., and Gebert, J.: Spatial variability of organic matter degradability in tidal Elbe sediments, J. Soils Sediments, 20, 2573–2587, https://doi.org/10.1007/s11368-020-02569-4, 2020.
Zander, F., Groengroeft, A., Eschenbach, A., Heimovaara, T. J., and Gebert, J.: Organic matter pools in sediments of the tidal Elbe river, Limnologica, 96, 125997, https://doi.org/10.1016/j.limno.2022.125997, 2022.
ZDM: Abfluss – Neu Darchau, Wasserstraßen- und Schifffahrtsamt Elbe [data set], https://www.kuestendaten.de/DE/Services/Messreihen_Dateien_Download/Download_Zeitreihen_node.html (last access: 11 May 2023), 2022.