the Creative Commons Attribution 4.0 License.
the Creative Commons Attribution 4.0 License.
 | 20 Jan 2023
Tropical cyclones facilitate recovery of forest leaf area from dry spells in East Asia
Yi-Ying Chen
Sebastiaan Luyssaert
Forests disturbance by tropical cyclones is mostly documented by field studies of exceptionally strong cyclones and satellite-based approaches attributing decreases in leaf area. By starting their analysis from the observed damage, these studies are biased and may, therefore, limit our understanding of the impact of cyclones in general. This study overcomes such biases by jointly analyzing the cyclone tracks, climate reanalysis, and changes in satellite-based leaf area following the passage of 140 ± 41 cyclones. Sixty days following their passage, 18 ± 8 % of the cyclones resulted in a decrease and 48 ± 18 % showed no change in leaf area compared to nearby forest outside the storm track. For a surprising 34 ± 7 % of the cyclones, an increase in leaf area was observed. Cyclones resulting in higher leaf area in their affected compared to their reference area coincided with an atmospheric pressure dipole steering the cyclone towards a region experiencing a dry spell caused by the same dipole. When the dipole was present, the destructive power of cyclones was offset by their abundant precipitation enabling forest canopies in the affected area to recover faster from the dry spell than canopies in the reference area. This study documents previously undocumented widespread antagonist interactions on forest leaf area between tropical cyclones and droughts.
- Article
(5273 KB) - Full-text XML
- BibTeX
- EndNote


Each year almost 30 cyclones, about one-third of the world's tropical cyclones, develop over the Pacific Ocean north of the Equator (Landsea, 2000), where a subtropical ridge steers them mainly west and northwest towards East Asia, where 90 % make landfall. The majority of the tropical cyclones in the northwestern Pacific basin develop between June and November (Bushnell et al., 2018) and more than half acquire typhoon strength (WMO, 2017). Although natural ecosystems, such as forests, have adapted to recurring high wind speeds (Eloy et al., 2017; Louf et al., 2018; Curran et al., 2008), stem breakage is almost unavoidable at wind speeds above 40 m s−1 (Virot et al., 2016) but has been widely reported at wind speeds well below this threshold together with other damage (Tang et al., 2003; Chiu et al., 2018; Chang et al., 2020).
By jointly analyzing cyclone tracks (The Joint Typhoon Warning Center (JTWC), 2019), climate reanalysis data (ERA5-Land; ECMWF, 2019), satellite-based proxies of soil dryness (SPEIbase v2.6; Beguería et al., 2014), land cover (ESA CCI, the European Space Agency's Climate Change Initiative; ESA, 2017), and leaf area (Martins et al., 2020), we estimated (a) the impact of tropical cyclones on leaf area, and (b) the main drivers of this impact. Previous studies attributed decreases in leaf area or related satellite-based indices to different disturbance agents (Ozdogan et al., 2014; Honkavaara et al., 2013; Forzieri et al., 2020), including cyclones (Takao et al., 2014). A damage-based approach is designed to identify only decreases in leaf area, thus failing to identify events in which tropical cyclones left the leaf area unaltered or even increased it. In contrast, this study starts the analysis from the actual storm tracks, which allows for an unbiased assessment of the impact of cyclones on forests (Blanc and Strobl, 2016).
The land area affected was identified for each of the 580 tropical cyclones that occurred in the study region between 1999 and 2018, considering that cyclone-driven damage could only occur within the storm track at locations that experienced high wind speeds or high precipitation. Pixels within the storm track defined as 2, 3, or 4 times the diameter of the cyclone for which threshold values for wind or precipitation were exceeded were classified as affected areas (Fig. A1), the remaining pixels in the track served as a cyclone-specific reference area. The uncertainty derived from defining the width of the storm track (Willoughby and Rahn, 2004) and determining which wind speeds and amounts of precipitation could result in damage are accounted for by an ensemble of nine related definitions with different threshold values (Table A1). In this study uncertainties represent the standard deviation across the nine definitions for the affected area and are shown in Figs. 1, A1, and A3.
The impact of a tropical cyclone on leaf area was calculated based on the adjusted Hedge's effect size by comparing the change in leaf area before and after the cyclone in the affected area with the change before and after the cyclone in the reference area for each individual cyclone (Eq. A1). Using a reference area that is specific to each cyclone means that seasonal dynamics related to leaf phenology and seasonal monsoons are accounted for in the effect size, which is a unitless description of the mean change in leaf area normalized by its standard deviation (Eq. A1). Hence, a positive effect size denotes a faster increase (or a slower decrease) in leaf area in the affected area compared to the reference area following the passage of a tropical cyclone.
A total of 316 ± 22 tropical cyclones or 54 ± 4 % of the storm events under study could not be further analyzed (Table A1) because leaf area index observations were missing from either the affected area, the reference area, or both, thus violating the requirements for calculating the effect size (Eq. A1). Of the remaining 264 ± 22 tropical cyclones, only 140 ± 41 passed the additional quality check necessary to be retained for further analysis in this study, i.e., the difference in the leaf area between the reference and affected area prior to the passage of a storm should be less than 10 % of the leaf area in the reference area. In other words, prior to the storm, the leaf area in the reference area had to be similar to the leaf area in what will become the affected area once the storm passed.
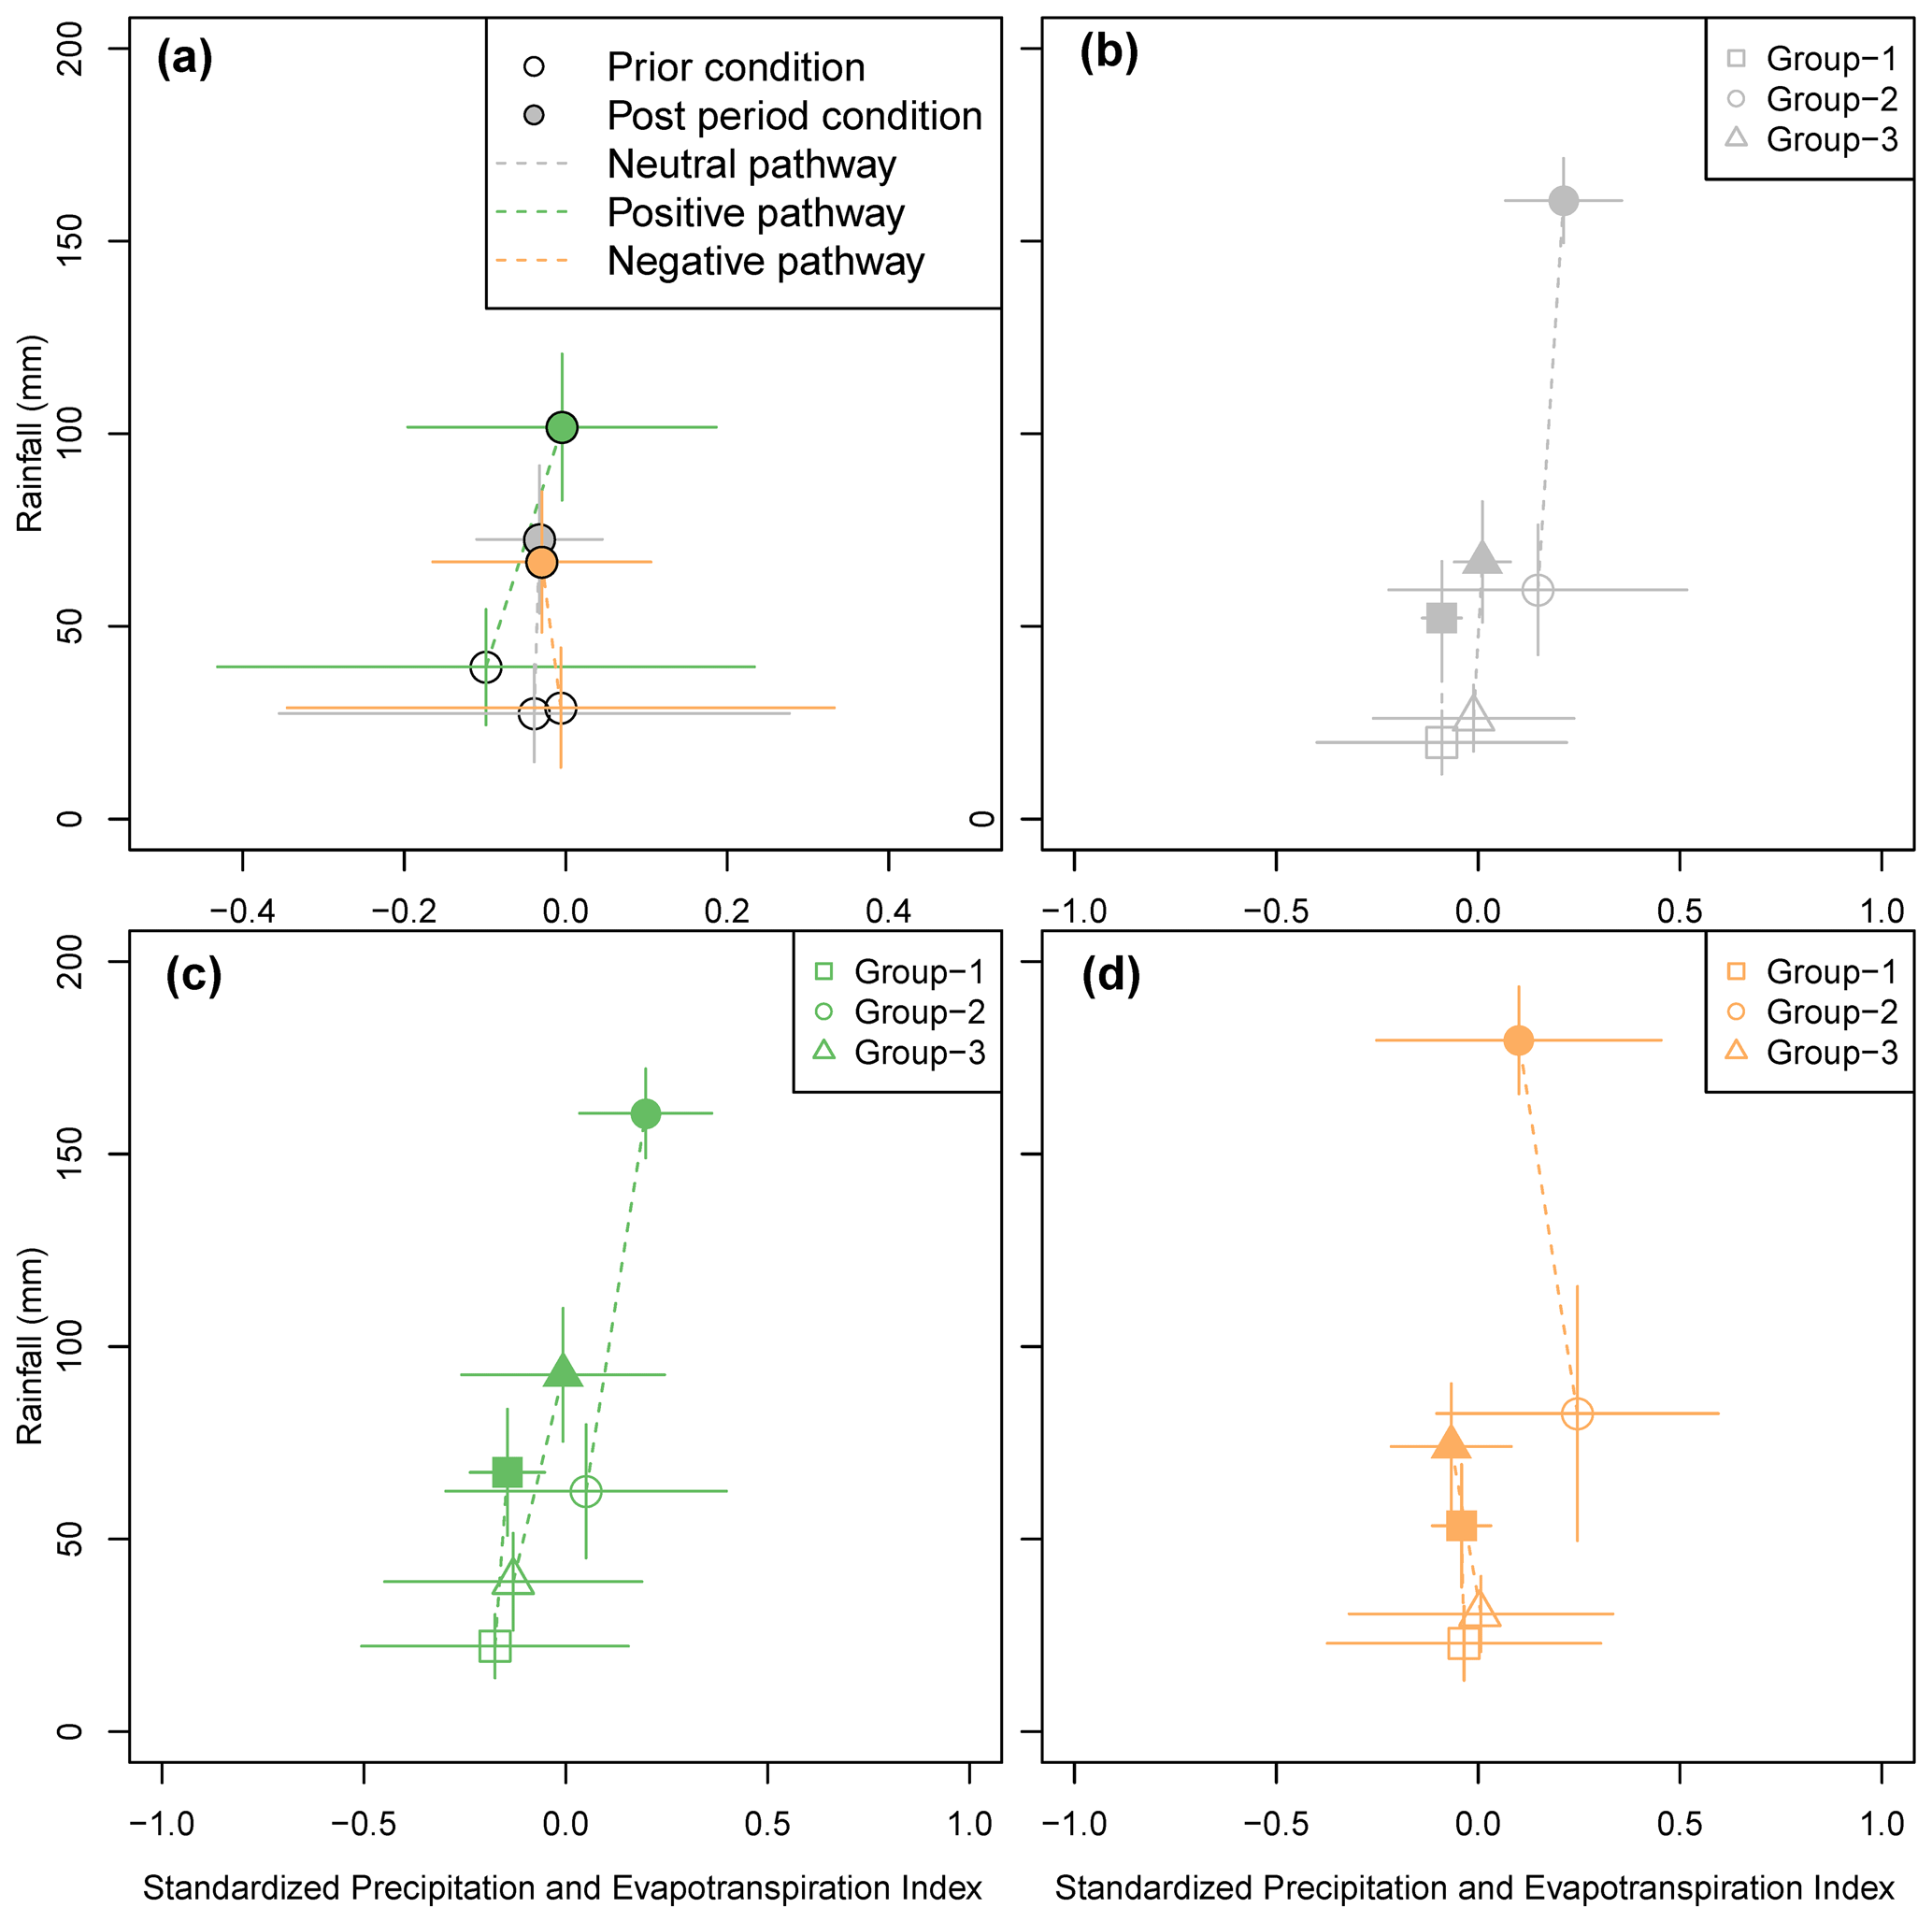
Figure 1Changes in standardized precipitation and evapotranspiration index following the precipitation brought by tropical cyclones. (a) Response in standardized precipitation and evapotranspiration index following the passage of a tropical cycle that resulted in a decrease (orange), no change (gray), or increase (green) in leaf area. Increasing leaf area was observed in forests that experienced a dry spell prior to the passage of a cyclone that brought sufficient precipitation to end the dry spell. (b–d) Response in standardized precipitation and evapotranspiration index following the passage of a tropical cycle that resulted in no change (gray; b) an increase (green; c), and a decrease (orange; d) in leaf area for the three cyclone groups (Table 1). Similar responses hint at similar mechanisms underlying the responses in leaf area irrespective of the cyclone group. The dashed line indicates the pathway moving from the condition prior to the condition after the passage of the cyclones.
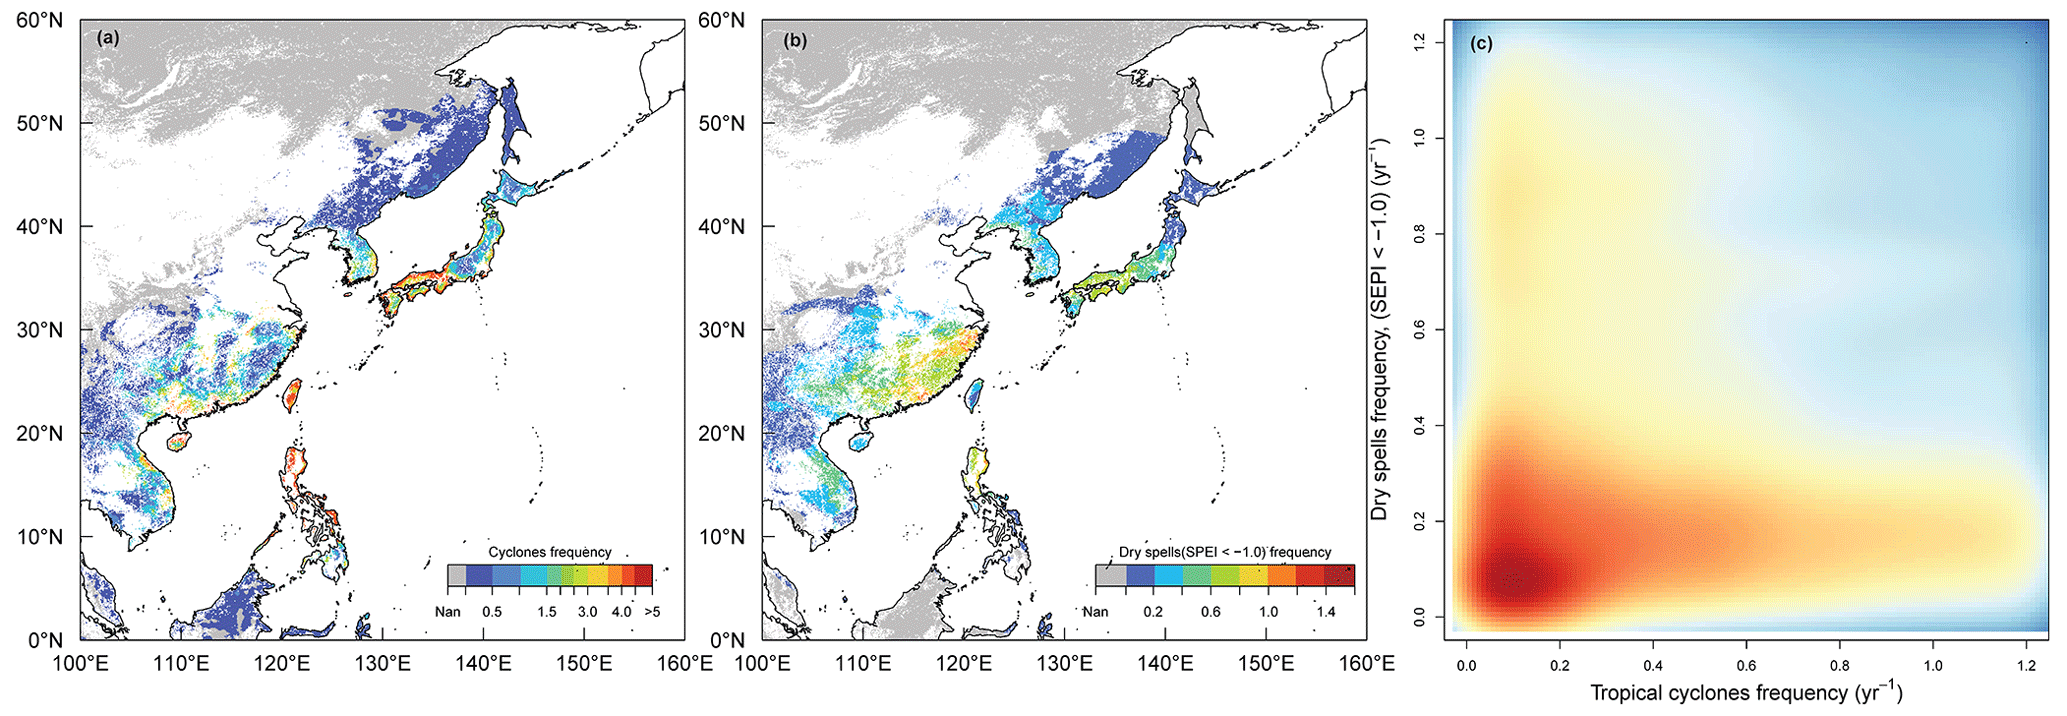
Figure 2Spatial distribution of cyclone frequency, frequency of dry spells with a standardized precipitation and evaporation index below −1, and their correlation. (a) Return frequency (yr−1) of tropical cyclones between 1999 and 2018 following a combined wind–precipitation definition considering three diameters to define the width of the storm track (definition 3a in Table A1). (b) Return frequency (yr−1) of dry spells between 1999 and 2018 following the same definition. (c) Smoothed density plot of the relationship (r ∼ 0.11) between the return frequency of cyclones and dry spells. High-density regions are shown in warm colors compared to the cold colors used to indicate low-density regions. The density plot is based on all nine definitions for affected areas (Table A1).
Of the 580 cyclones, 31 % were less than class I, 14 % were classified as class I, 11 % as class II, 10 % as class III, 21 % as class IV, and 13 % as class V. The distribution of the intensity classes of the sample of 140 ± 41 cyclones that could be further analyzed was similar to the census of the 580 cyclones (Fig. A3). Despite the loss of around 75 % of the events, the sample analyzed in this study was unbiased in terms of cyclone intensity classes (Fig. A3).
Tropical cyclones have been widely observed to defoliate and disturb forests (Wang et al., 2013; Uriarte et al., 2019; Chambers et al., 2007; Douglas, 1999; Lin et al., 2011). Nevertheless, in this study, only 18 ± 8 % of the observed cyclones resulted in a detectable reduction in leaf area 60 d after their passage as a direct effect of limb breaking, uprooting, stem breakage, and landslides following high wind speeds and heavy precipitation. For 48 ± 18 % of the cyclones, the change in leaf area 60 d after a cyclone passed was so small that it could not be distinguished from the threshold representing no change. Ecological theory predicts forest dwarfing in regions with high cyclone frequencies compared to the longevity of a tree, directly through gradual removal of taller trees over many generations (Lin et al., 2020; McDowell et al., 2020) and indirectly through the loss of nutrients (Tang et al., 2003; Lin et al., 2011). Where forest dwarfing has occurred, it might be hard to observe the short-term effects of an individual tropical cyclone on forest structure and function (Mabry et al., 1998).
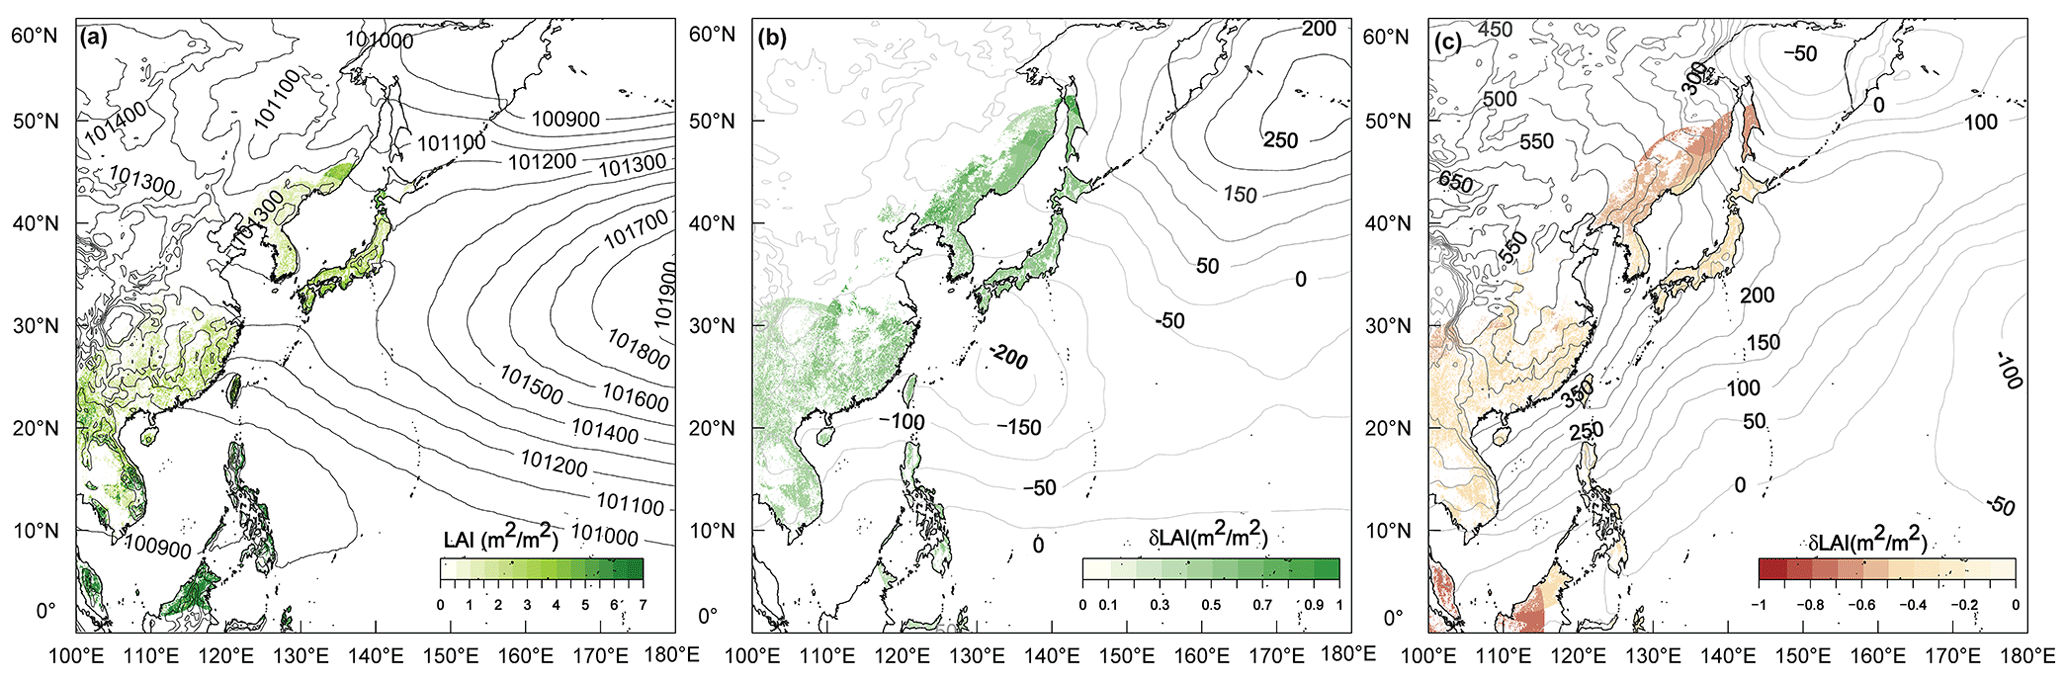
Figure 3Pressure fields (Pa) and changes therein in the month of the passage of a tropical cyclone for cyclones that had a neutral, positive, or negative impact on the leaf area (m2 m−2) of forests. Effect sizes are based on the definition that uses 3 times the cyclone diameter and wind speed to identify the affected and reference areas (definition 3a in Table A1). (a) Mean atmospheric pressure and leaf area prior to the passage of a tropical cyclone that had a neutral impact on forest leaf area. (b) Changes in mean atmospheric pressure and leaf area between cyclones with a neutral and positive effect on leaf area. (c) Changes in mean atmospheric pressure and leaf area between cyclones with a neutral and negative effect on leaf area.
For a surprising 34 ± 7 % of the cyclones an increase or, given the way the effect size was calculated, a reduced decrease in leaf area was observed, leading to the question of which conditions could explain such an increase (or reduced decrease). Following Liebig's law of the minimum (Chapin et al., 2011), the observed increase (or reduced decrease) in leaf area implies that about one-third of the cyclones alleviated one or more growth factors that were limiting leaf area prior to the passage of the cyclones. We hypothesize that a dry spell could be the growth limiting factor prior to the cyclone, whereas the precipitation brought by the cyclone could enhance plant growth through mitigating soil dryness.
To test this hypothesis, the standardized precipitation and evapotranspiration index prior to 60 d following the passage of the cyclone, the accumulated precipitation prior to the cyclone, and the accumulated precipitation brought by the cyclone were determined for each of the 140 ± 41 tropical cyclones that passed the quality checks. An increase (or reduced decrease) in leaf area was observed for cyclones that made landfall during a dry spell and brought sufficient precipitation to increase the standardized precipitation and evapotranspiration index (Fig. 1a) supporting our hypothesis. The hypothesis was further supported by no observed change in leaf area for cyclones making landfall when plant water demand was satisfied by soil moisture availability shown by the standardized precipitation and evapotranspiration index approaching zero (Fig. 1a). Furthermore, decreases in leaf area 60 d following the cyclone were observed for cyclones making landfall when there was an excess in plant-available water (Fig. 1d).
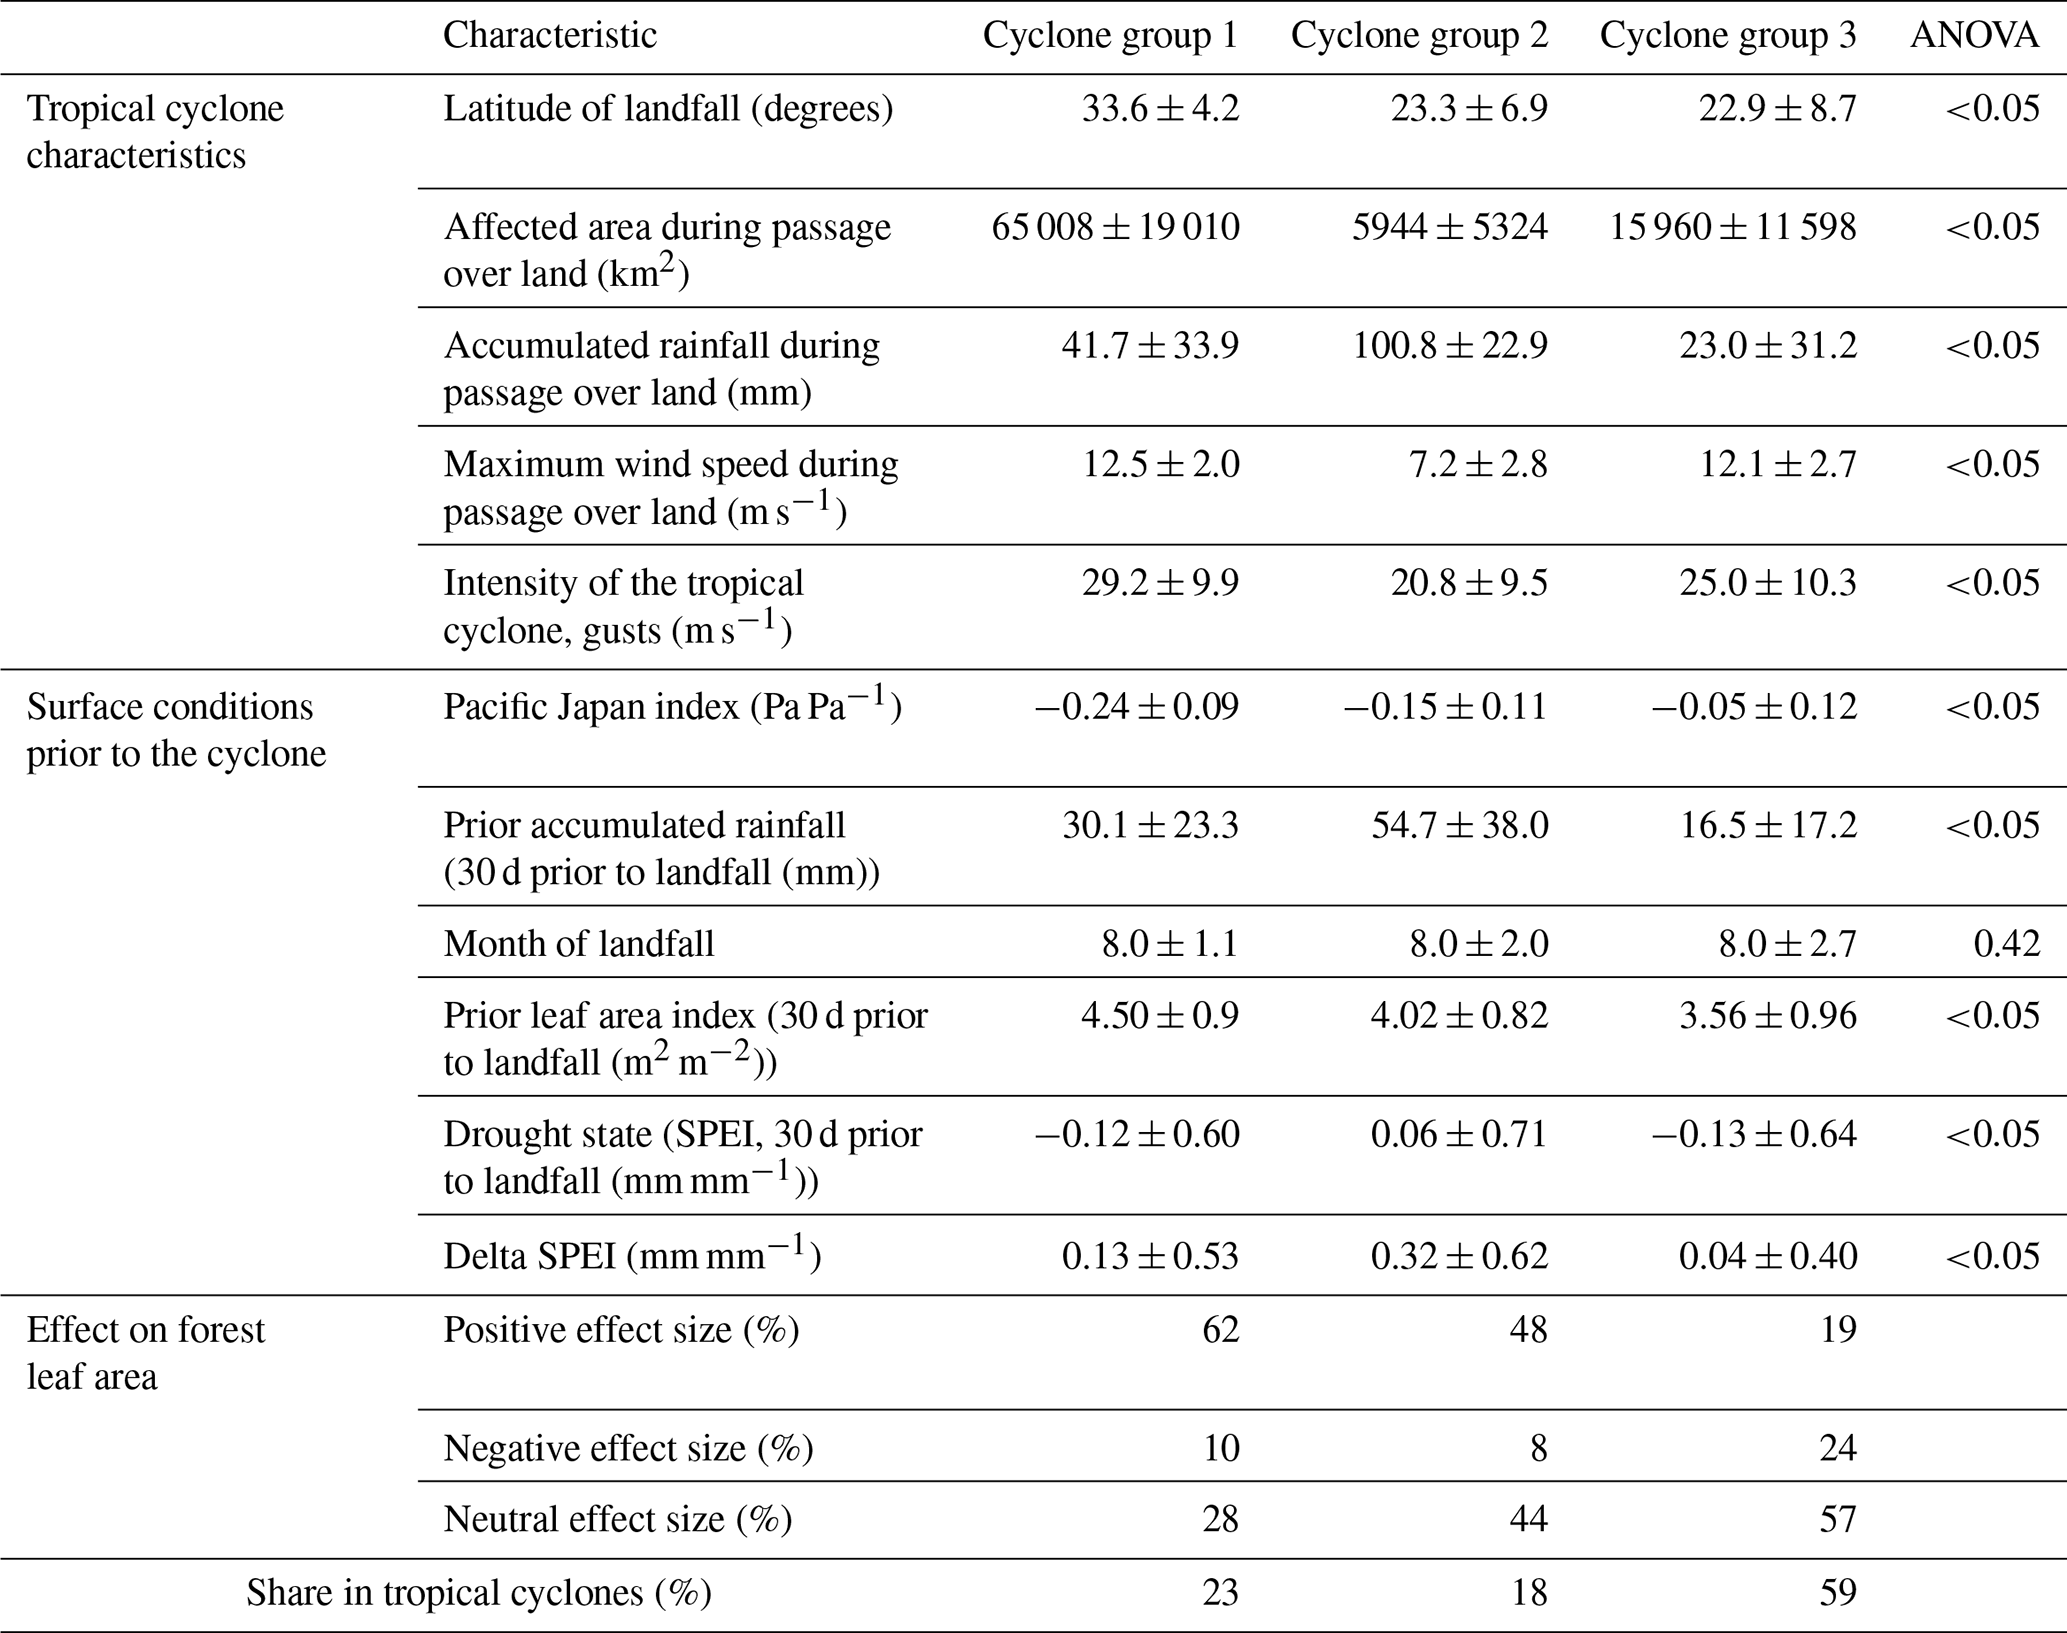
Table 1Median and standard deviation for five cyclone characteristics and six surface characteristics mainly prior to the passage of the 140 ± 41 tropical cyclones that passed the quality checks. Cyclone groups 1 to 3 were the outcome of a decision tree (Fig. A4) that classified the four main factors of factorial analysis of the land surface characteristics, cyclone characteristics, and effect sizes to identify collinearity (Table A2). The column labeled with ANOVA shows the p value of an ANOVA test to test for significant differences between cyclone groups.
Where a dry spell prior to the cyclone in combination with the precipitation brought by the cyclone provides a mechanistic explanation for increased plant growth following the passage of a tropical cyclone, the abundance of such events (i.e., 34 ± 7%) suggests a non-random relationship between the location and timing of dry spells and cyclones (Fig. 2c). For the midlatitudes, dry summers do indeed see an increase in the number of tropical cyclones making landfall, which often ends the summer drought (Yoo et al., 2015). In South Korea, for example, at least 43 % but possibly as much as 90 % of the summer droughts in coastal regions were abruptly ended by a tropical cyclone (Yoo et al., 2015). The co-occurrence of dry spells and tropical cyclones has been linked to a meridional dipole system in the midlatitude regions of East Asia with a high-pressure system in the region of 40–50∘ N and 150–160∘ E, where it causes the dry spell and the low-pressure system in the region of 20–30∘ N and 120–150∘ E.
To confirm the relationship between dry spells and the occurrence of cyclones, the meta-data for each of the 140 ± 41 tropical cyclones were extended, resulting in the first group of meta-data of six characteristics describing the land surface mainly before the passage of a cyclone and a second group containing five characteristics of the cyclone itself. Following combined factorial analysis to identify collinearity between the land surface characteristics, cyclone characteristics, and effect sizes (Table A2), the four main factors which explained 58 % of the variance were used in a decision tree (Fig. A4) to create three cyclone groups (Table 1).
Sixty-two percent of the cyclones which were generated when the meridional dipole was present (indicated by a negative Pacific Japan index (Nitta, 1987)), making landfall at midlatitudes during a dry spell and bringing sufficient precipitation to rewet the soil and end the dry episode, increased the leaf area (or reduced the decrease) in the affected compared to the reference area (cyclone group 1; Table 1). When the dipole is in place, tropical cyclones generated from the monsoon trough over the western Pacific Ocean are steered through the trough in between the high- and low-pressure systems towards and then along the coast of East Asia (Choi et al., 2010). While traveling along the edges of the high-pressure system, the tropical cyclone may disturb the circulation, resulting in an unfavorable environment to sustain the dipole (Choi et al., 2011; Kubota et al., 2016) and bringing precipitation to the dry region that was under the high-pressure system.
Group 2 cyclones made landfall at low latitudes when the meridional dipole was in place and brought abundant precipitation which increased soil wetness (Table 1). Given that under the meridional dipole, the dry spell occurs under the high-pressure system typically located between 40 and 50∘ N but that many of the group 2 cyclones made landfall at lower latitudes (i.e., 23.3 ± 6.9∘ N), chances to end a dry spell were lower which was reflected in the almost equal chance to increase the leaf area (48 %) or had an effect that could not be detected by our method (44 %; Table 1). Nevertheless, the mechanistic relationship between soil dryness, precipitation, and change in leaf area was confirmed also for this group (Fig. 1b–d).
Almost 60 % of the tropical cyclones studied were classified as group 3 cyclones, making them the most abundant type of cyclone in the study region. Although 57 % of the cyclones in this group resulted in no effect on leaf area (Table 1), this group contained about one-third of the cyclones resulting in a positive effect on leaf area (Table 1), which occurred when the soil was dry and the cyclone brought sufficient precipitation to rewet the soil (Fig. 1b–d).
Analyzing the atmospheric pressure separately for cyclones that resulted in no change, an increase, or a decrease in leaf area (Fig. 3) showed that tropical cyclones that were followed by an increase (or reduced decrease) in leaf area coincided with a meridional dipole (Fig. 3b). Moreover, the genesis of tropical cyclones that were followed by a decrease in leaf area occurred under very different atmospheric conditions compared to cyclones followed by an increasing leaf area (Fig. 3c). A relationship between the atmospheric system causing dry spells, tropical cyclones, and their subsequent impact on leaf area suggests that whether more drought damage is to be expected in the future will not only depend on an increase in drought frequency and intensity but will in part be determined by the weather system that is causing the drought. Although the co-occurrence of droughts and cyclones has previously been demonstrated (Choi et al., 2011; Kubota et al., 2016), we believe this study to be the first to document its large-scale antagonist effect on forest leaf area.
By studying a representative sample of tropical cyclones in terms of storm intensity, we showed that almost half of the tropical cyclones, i.e., 48 ± 18 %, caused little to no damage to forest leaf area, suggesting that forest dwarfing is a general structural adaption in the study region. Moreover, a third, i.e., 34 ± 7 % of the cyclones in East Asia resulted in an increase (or reduced decrease) in forest growth because these storms relieved water stress within their track or even ended dry spells. Remarkably, precipitation brought by a cyclone appeared as a more powerful predictor than cyclone intensity when it comes to the vegetation response (Table 1; Fig. A3). The observed frequency of positive vegetation responses to cyclones suggests that the present-day vision of cyclones as agents of destruction (Altman et al., 2018; Negrón-Juárez et al., 2010, 2014) should be refined toward a recognition that, depending on the environmental conditions prior to the storm and the atmospheric conditions leading to the genesis of the tropical cyclone, cyclones frequently facilitate the recovery of forest leaf area and as such dampen the effects of dry spells.
A1 Cyclone track and track diameter
Since 1945, tropical cyclones in the western North Pacific Ocean have been tracked and their intensity recorded by the Joint Typhoon Warning Center (JTWC). The track data shared by the Joint Typhoon Warning Center consist of quality-controlled 6-hourly geolocation observations of the center of the storm with the diameter of the storm being a proxy for its intensity (JTWC, 2019). For the period under consideration, from 1999 to 2018, the geolocations and diameters are the output of the Dvorak model (Dvorak, 1984; Dvorak et al., 1990) derived from visible and infrared satellite imagery. Storm diameters are available starting from January 2003. Prior to this date a generic diameter of 100 km (Lin et al., 2020) is used in this study. Linear interpolation of the 6-hourly track data resulted in hourly track data to fill in any gaps in the mapping of the cyclone track.
In this study, we focus on East Asia which, given the absence of natural boundaries, is defined as the land contained within the northwestern Pacific basin that, according to the Joint Typhoon Warning Center stretches from 0 to 60∘ N and 100 to 150∘ E. The Joint Typhoon Warning Center (2019) compiled track and intensity data for 580 tropical cyclones between 1999 and 2018 in the northwestern Pacific basin. A shorter time series (1999 to 2018) than the entire length of time available (1945 to 2018) was analyzed due to the more limited availability of the leaf area index data, which had to be jointly analyzed with the track and intensity data to quantify the impact of cyclones on natural ecosystems.
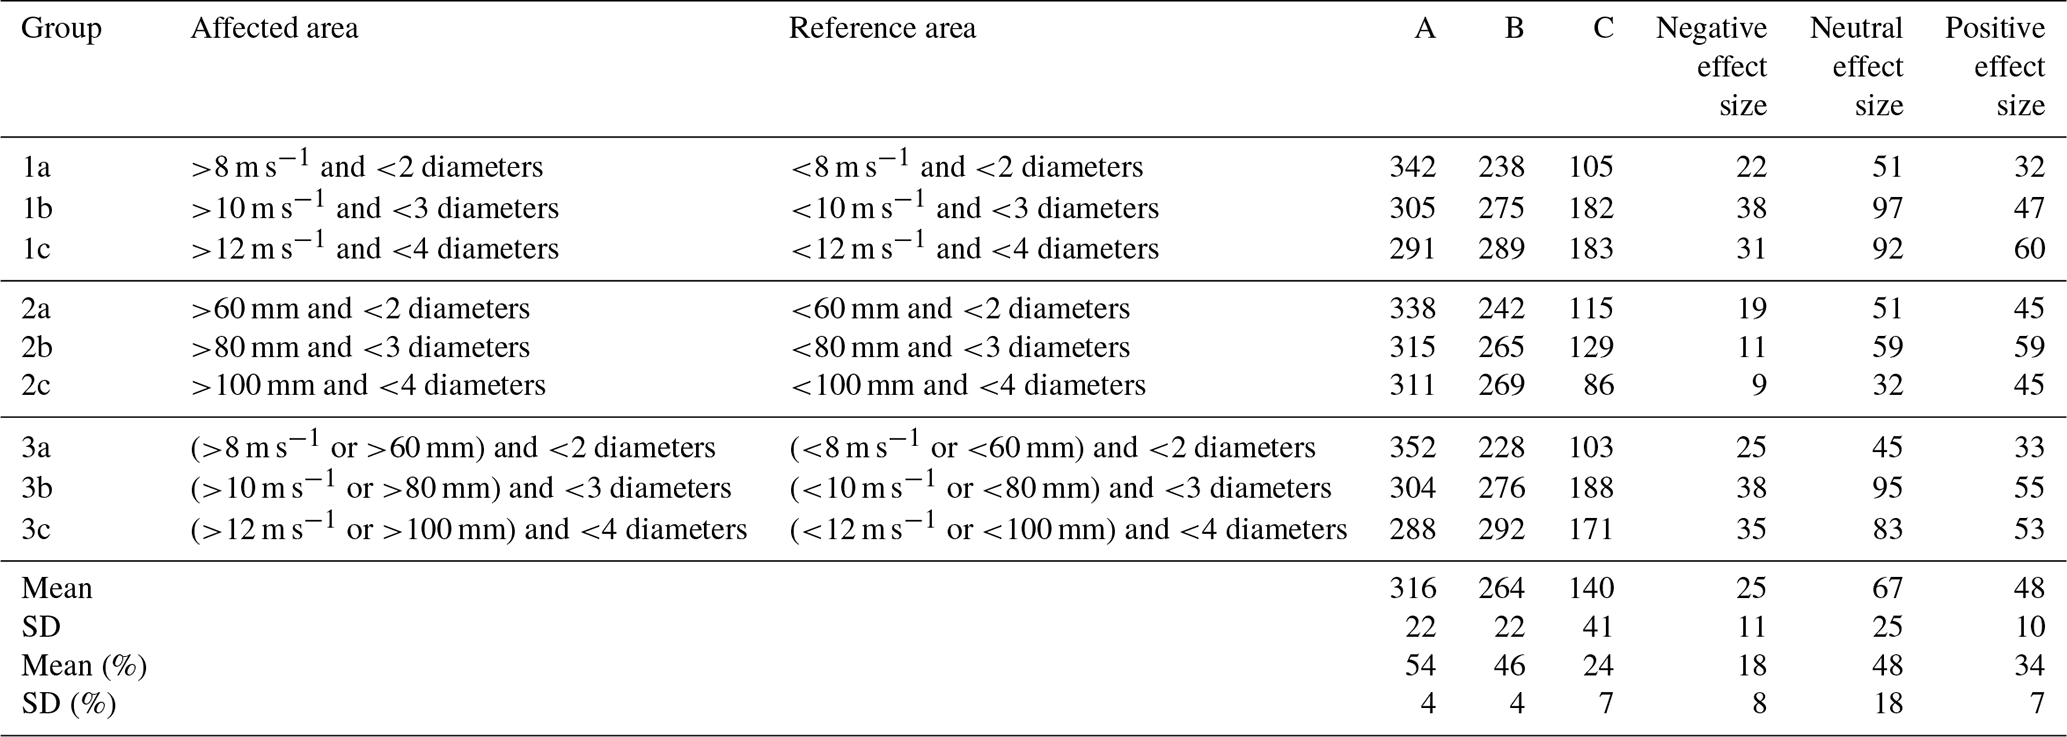
Table A1Criteria for distinguishing between the affected and reference areas following the passage of an individual cyclone and the number of events according to each specific definition. Group 1 groups definitions are based on wind speed, group 2 definitions are based on precipitation, and group 3 definitions are based on both wind speed and precipitation. All three definitions include an estimate of the storm path based on a multiple of the reported storm diameter. Column A denotes the number of events for which data were lacking so that the effect size could not be calculated; column B denotes the number of events for which all required data were available; column C denotes the subset of B for which the data passed the quality control; ES refers to effect size. A total of 580 unique tropical cyclones were considered in this study.
A2 Area affected by individual cyclones
The land area thought to be affected by a specific cyclone as well as the reference area for each of the 580 cyclones that occurred in the study area between 1999 and 2018 were identified based on nine different but related definitions (Table A1). Each definition comprises a combination of at least two out of three criteria, e.g., the diameter of the cyclone, the maximum wind speed at each location during the passage of the cyclone, and accumulated precipitation at each location during the passage of the cyclone. Each forested pixel within each individual storm track was classified as either an affected area or a reference area based on these nine definitions. Differences in the results coming from differences in the definitions were used throughout the analysis to estimate semantic uncertainties. Uncertainties related to the estimated diameter of the cyclone, wind speed, and precipitation data were not accounted for in the calculation of the affected and reference areas because they were thought to be smaller than the uncertainty coming from differences in the definitions themselves.
The underlying assumption behind the definitions is that forests can only be affected by a specific cyclone if they are located along its storm track. The minimum width of each storm track is the diameter of the cyclone as reported by the Joint Typhoon Warning Center. Following the observation that over the ocean, the actual wind speed exceeds the critical wind speed for stem breakage or uprooting (i.e., 17 m s−1, Chen et al., 2018) over a distance of at least 3 times the diameter of the cyclone (Willoughby and Rahn, 2004), the minimum width of a storm track in which cyclone-related forest damage could occur is defined as 3 times the diameter recorded by the Joint Typhoon Warning Center although wind speeds drop dramatically when cyclones make landfall (Kaplan and Demaria, 2001). The minimum width of a storm track over land should, therefore, be reduced compared to the observations over the ocean. This study used three different widths to define a storm track, i.e., 2, 3, or 4 times the recorded diameter (Table A1).

Figure A1Spatial and temporal patterns of potential forest damage by tropical cyclones in East Asia. (a) Return frequency (yr−1) of tropical cyclones between 1999 and 2018 following a combined wind–precipitation definition considering three diameters to define the width of the storm track (definition 3a in Table A1). Since 1999, 2 240 000 ± 690 000 km2 of forest in the study region experienced conditions that may have resulted in cyclone-driven damage, at least once every decade. No less than 540 000 ± 260 000 km2, including 70 % of the tropical forest in the region, experienced potentially damaging conditions at least once per year and are thus classified as being under chronic wind stress. Forests unlikely to have experienced a tropical cyclone between 1999 and 2018 are shaded in gray. For land locations shown in white, the forest is not the dominant land cover. The dot–dashed lines show the cyclone tracks between 1999 and 2018. The black lines indicate the events that passed the quality control criteria used in this study. (b) Latitudinal gradients of potentially damaged forest area (km2 yr−1) between 1999 to 2018 for all nine definitions of affected area. Damage potential is the outcome of an interplay between cyclone frequency, cyclone intensity, and the presence of forests. The different definitions of affected area (Table A1) consistently show a high potential for forest damage over island and coastal regions located between 10 and 35∘ N. This high potential is largely driven by the frequency of tropical cyclones (Fig. A2), i.e., two or more cyclones making landfall per year. Depending on how the affected area is defined, there is a second region located between 40 and 50∘ N with a high potential for storm damage. In this region, the potential damage is the outcome of the high forest cover resulting in a strong dependency on the assumed width of the storm track (Fig. A2). (c) Temporal dynamics of the total potentially damaged forest area (km2 yr−1) for all nine definitions of affected area. Irrespective of the definition of the affected area, the coefficient of variation in the between-year variation in potentially damaged areas ranged from 15 % to 20 %. Excluding the four most powerful typhoons that occurred in the region since 1999 changed the average coefficient of variation from 17 % to 16 %. This suggests that the most powerful typhoons make only a small contribution to the total annually potentially affected area in the region. Likewise, a recent literature review reported that 66 % of the research papers in this area have examined the effects of only about 6 % of the most powerful cyclones (Lin et al., 2020). The relatively small contribution of those events to the potential damage area suggests that in regions with frequent tropical storms, disturbance ecology would benefit from broadening its scope by examining the effects and recovery of a representative sample of tropical cyclones rather than focusing on the most devastating events.
Being located within the track of a specific cyclone is essential but not sufficient for damage to occur. Within a storm track, only forested pixels that experienced high wind speeds or high precipitation were counted as in the potentially affected area. Forest pixels that were located within the storm track but did not experience high wind speeds or high precipitation were counted as in the reference area. Note that to better account for the uncertainties arising from this approach, the threshold values for wind speed and precipitation were increased as the track diameter increased (Table A1). For a narrow storm track, it is reasonable to assume that there would be damage shown in all pixels except those where wind speed or precipitation did not exceed a relatively low threshold value. For wide storm tracks the opposite applies; it is reasonable to assume that a few of the pixels would show damage except where wind speed or precipitation exceeded relatively high threshold values.
Wind speed and precipitation data were extracted from the ERA5-Land reanalysis data for land (ECMWF, 2019). The ERA5-Land reanalysis dataset has a spatial resolution of 9 km × 9 km and a time step of 1 h. It is the product of a data assimilation study conducted with the H-TESSEL scheme by ERA5 IFS Cy45r1 and nudged by climatological observations (ECMWF, 2018). The Cy45r1 reanalysis dataset shows statistically neutral results for the position error of individual cyclones (ECMWF Confluence Wiki: Implementation of IFS cycle 45r1, https://confluence.ecmwf.int/display/FCST/, last access: 25 June 2019). The spatial representation of the reanalysis data is reported to compare favorably with observational data (Chen et al., 2021) outside the domain of this study. No reports on similar tests for the current study domain, i.e., East Asia, were found. Furthermore, land cover maps released through the European Space Agency's Climate Change Initiative (ESA, 2017) were used to restrict the analysis to forests. The Climate Change Initiative maps integrate observations from several space-borne sensors, including MERIS, SPOT-VGT, AVHRR, and PROBA-V, into a continuous map with a 300 m resolution from 1994 onwards.
Wind speed and precipitation data were spatially disaggregated and temporally aggregated to match the spatial and temporal resolution of the leaf area index product (see below). Maximum wind speed and accumulative precipitation were aggregated over time steps to match the 10 d resolution of the leaf area index product. We preserved the temporal resolution of the land cover map but aggregated its spatial resolution from 300 m to 1 km to match the resolution of the leaf area index product. During aggregation, the majority of land cover at the 300 m resolution was assigned to the 1 km pixel resolution.
Table A2Loadings of each characteristic on four principal axes and collinearity between variables within the same group. Given the exploratory nature of this analysis, a factor loading of 0.6 was used as a cutoff, and those values exceeding that level are highlighted in boldface.

A3 Impact on leaf area of an individual cyclone
Version 2 of European Space Agency's Climate Change Initiative product was used to calculate leaf area in this study. The product has a 1 km spatial resolution and a 10 d temporal resolution and is available from 1999 onwards. The default leaf area index product is distributed as a composite image using at least six valid observations on a pixel within a 30 d moving window (Verger et al., 2014). The composite image is drawn from satellite-based observations of the surface reflectance in the red, near-infrared, and shortwave infrared from SPOT-VGT (from 1999 to May 2014) and PROBA-V (from June 2014 to present). Gaps in missing observations are filled by the application of a relationship between local weather and leaf area index dynamics. Gap filling resulted in errors on the leaf area index estimates of less than 0.18 (Martins et al., 2017). The spatiotemporal resolution of the leaf area index products was the coarsest of all data products used and therefore determined the spatiotemporal resolution of the analysis as a whole. Moreover, the availability of the leaf area index product determined the starting date for the study.
The impact of cyclones on leaf area was calculated by comparing the change in leaf area before and after the cyclone in the affected area with changes before and after the cyclone in the reference area for each individual cyclone. In this approach, the reference area serves as the control for the affected area, given that the reference area and the affected area may have a different size, the adjusted Hedge's effect size (Rustad et al., 2001) can be used to calculate the effect size of an individual cyclone on leaf area (Eq. A1). Using a reference area that is specific to each cyclone, seasonal dynamics such as leaf phenology are accounted for in the effect size. Effect size is thus a unitless quantifier that describes the mean change in state, obtained by normalizing the mean difference in leaf area with the standard deviation (Eq. A1). A positive or negative effect size value indicates, respectively, an increase or decrease in leaf area (LAI, leaf area index) following the passage of a cyclone:
where ES is the event-based effect size for leaf area. The upper bar represents the mean of leaf area index in the reference (ref) or the affected (aff) area. The subscripts bef and aft denote the observation dates before and after the cyclone; σ denotes the standard deviation of all observations within the storm track. Given the 10 d frequency of the ESA leaf area index product, two leaf area index maps are used for the calculation of the effect size: one to characterize the leaf area index 1 to 10 d before the cyclone and the other to characterize the leaf area index 60 to 70 d after the cyclone. To distinguish between the affected and reference areas the effect sizes were calculated for each event using the nine definitions. After applying the quality control criteria (see below) a different number of events was available for each definition (Table A1).

Figure A2Contribution of return frequency and forest cover to the affected area: (a) the zonal average of forest coverage (dotted line; km2) and the return frequency (dashed line; yr−1) of tropical cyclones from 0 to 60∘ N averaged over East Asia, as defined in this study; (b) zonal average of the interaction between return frequency and forest cover, calculated by multiplying the return frequency with the forest cover (dot–dash line; km2 yr−1) and the estimated zonal average of the annual affected forest area (full line; km2 yr−1). Correlations between return frequency and affected area (Pearson correlation coefficient = −0.35; p value < 0.01; n=60), forest cover and affected area (Pearson correlation coefficient = 0.089; p value = 0.5; n = 60), and frequency times cover and affected area (Pearson correlation coefficient = 0.44; p value < 0.01; n = 60). The latter thus correlates best with the zonal variation in the affected area and was therefore shown in panel (b). Results are shown for affected areas defined as locations within an area extending to 3 times the cyclone width for which the wind exceeded a threshold (definition 3a in Table A1).
Starting the analysis from the actual storm tracks, as was the case in this study, allows for an unbiased assessment of the impact of cyclones on forests (Blanc and Strobl, 2016), in contrast to studies that attribute decreases in leaf area or related satellite-based indices to different disturbance agents (Ozdogan et al., 2014; Honkavaara et al., 2013; Forzieri et al., 2020) including cyclones (Takao et al., 2014). By design, the latter approach is not capable of identifying neutral or positive impacts of cyclones on leaf area. As positive effects were not limited to the cyclones from a low-intensity class (Fig. A3), the intensity class had little explanatory power (Table 1) making a systematic bias towards positive effect sizes caused by low-intensity cyclones unlikely. Given the 60 d time window, our method is more likely to be biased towards detecting no changes in leaf area than detecting positive or negative changes in leaf area.
A meaningful effect size relies on the change in the reference area to evaluate whether the change in leaf area in the affected area is faster, similar, or slower. The way the effect size is calculated thus accounts for phenological changes in leaf area. If the reference area were not used in the calculation of the effect size, the change in leaf area over the affected area would mostly represent leaf phenology especially if the 60 d window includes the start or the end of the growing season, and it would thus be unsuitable to address the question at hand.

Figure A3Cumulative distribution of tropical cyclones as a function of their maximum intensity for the nine definitions of affected area used in this study. The cumulative distribution for the census of 580 tropical cyclones recorded for the study period is shown left of the y axis for class I (31 %), class II (45 %), class III (55 %), class IV (66 %), and class V (87 %) cyclones. The numbers shown on the right of the y axis represent the cumulative distribution of the sample of the 580 events following a specific definition. Panel (a) shows wind only for two diameters, (b) wind only for three diameters, (c) wind only for four diameters, (d) rain only for two diameters, (e) rain only for three diameters, (f) rain only for four diameters, (g) wind or rain for two diameters, (h) wind or rain for three diameters, and (i) wind or rain for four diameters as detailed in Table A1. The intensity distribution for tropical cyclones with a negative effect size is shown in orange, for tropical cyclones with a neutral effect size in blue, and for tropical cyclones with a positive effect size in green. The black solid line shows the distribution for the specific definition (n = 140 ± 41 cyclones depending on the definition). The gray solid line shows the distribution of the 580 events that occurred between 1999 to 2018. Small deviations between the gray and the black line suggest that the sample represented the 580 cyclones well in terms of their intensity class. The maximum wind speed of category I cyclones is between 32 and 42 m s−1, between 42 and 49 m s−1 for category II, between 49 and 58 m s−1 for category III, between 58 and 69 m s−1 for category IV, and exceeding 69 m s−1 for category V. In East Asia, tropical cyclones of intensity class III or higher are called typhoons.

Figure A4Decision tree proposing three groups of cyclones based on cyclone characteristics, surface properties mainly prior to the passage of the cyclone, and its effect on leaf area in the affected compared to the reference area. Each box shows the fractions of negative (right), neutral (middle), and positive (left) effect sizes (see also Table 1). The number of events is listed as the percentage of the total number of events in the random tree (n=1262). The first two principal components PC1 and PC2 (Table A2) were used to create a two-layer decision tree.
As this study aims to quantify changes in leaf area index, it could not make use of gap-filled leaf area index values which would level off such changes. Furthermore, calculating the effect size required leaf area index estimates before the passage of the cyclone in the reference and soon-to-be-affected area and leaf area index estimates after the passage of the cyclone in the reference and affected area. The 60 d time frame was a compromise to avoid excessive data gaps in the leaf area index product when using the composite leaf area index product. Because the leaf area index product reports leaf area index values within a 60 d window, the analysis had to be refined so that this 60 d window never included the cyclone. The offset between the cyclone and a leaf area index observation from the composite leaf area index product was calculated by subtracting the date of the cyclone from the last observation date of the leaf area index composite data before the cyclone or the first observation date of the leaf area index composite data after the cyclone. Pixels with a negative offset indicated that the composite data were likely to include observations from both before and after the cyclone and were therefore discarded in the calculations of the effect size.
The calculation of the effect size assumes having a similar leaf area index between the area that will become the affected area and the area that will become the reference area after the passage of a cyclone. If the absolute difference in leaf area index between the reference and the affected area was less than 10 %, the effect size calculated for this event was included in subsequent analyses. This can be formalized as
where the 0.1 represents the 10 % threshold that was guided by the observed relationship between the remotely sensed leaf area and its deviation to ground truth data for leaf areas of 5 m2 m−2 or below (Fig. 26 in Jorge, 2020). This quality control criterion reflects the idea that prior to the passage of a tropical cyclone, the LAI needs to be similar in what will become the reference and affected area. If not, changes in leaf area following the passage of the cyclone cannot be assigned to its passage.
Following the passage of a tropical cyclone, a change in LAI of less than 10 % before and after the passage of the cyclone was, in line with the quality control criterion, considered to be too small to be considered substantial. Such events were classified as cyclones with a neutral effect size. This classification was formalized as
A4 Multivariate analysis
Each tropical cyclone was characterized by some cyclone characteristics: (1) latitude of landfall (degrees); (2) intensity of the tropical cyclone (m s−1); (3) month of landfall; (4) maximum wind speed during passage over land (m s−1); (5) affected area during passage over land (km2). Likewise, the area affected by the cyclone was characterized by (6) accumulated rainfall on land 30 d prior to landfall of the cyclone (mm); (7) accumulated rainfall during passage over land (mm); (8) leaf area 30 d prior to landfall (m2 m−2); (9) standardized precipitation evapotranspiration index (mm mm−1) as a drought proxy; (10) change in standardized precipitation evapotranspiration index (mm mm−1); and (11) Pacific Japan index the month of landfall (Pa Pa−1). These characteristics were calculated as the average along the trajectory of the cyclone.
Characteristics 1 to 4 were retrieved from the Joint Typhoon Warning Center database as detailed in “Cyclone track and track diameter” (Sect. A1). Characteristics 5 and 7 were quantified from the analysis combining cyclone track, cyclone diameter, and ERA5-Land reanalysis, as explained in “Area affected by individual cyclones” (Sect. A2). Characteristics 6 and 7 were retrieved from the ERA5-Land reanalysis data for land (ECMWF, 2019). Characteristic 8 was taken from the leaf area index analysis as explained in “Impact on leaf area of an individual cyclone” (Sect. A3). For characteristics 9 and 10, the standardized precipitation evapotranspiration index was used and combined with the cyclone masks created in the “Area affected by individual cyclones” (Sect. A2). Characteristic 11, the Pacific Japan index, was calculated from ERA5 hourly reanalysis (Hersbach et al., 2018). Details on the calculation of characteristics 9, 10, and 11 are provided in subsequent sections.
Factor analysis (Grice, 2001) was used to reveal the collinearity among the selected variables in the prior conditions, tropical cyclone characteristic group, and effect size (Table A2). The four main factors which explained 58 % of the variance, were classified into three groups (Table 1) using a decision tree (Fig. A4). Note that only the first and second axis were used in the decision tree. The decision tree was created by means of the recursive partitioning approach with a maximum of two levels and a minimum of 20 samples in each node provided by the R rpart package (Therneau et al., 2019).
A5 Drought analysis
The standardized precipitation evapotranspiration index, is a proxy index for a drought that represents the climatic water balance and was used to assess the drought of a forest soil before and after the passage of an individual tropical cyclone. The standardized precipitation evapotranspiration index data between 1999 and 2018 were retrieved from the Global Standardized Precipitation and Evapotranspiration Index Database (SPEIbase v2.6, Beguería et al., 2014), which is based on the CRU TS v.4.03 dataset (Harris et al., 2020). In this study, the temporal resolution of the data was preserved, but the spatial resolution was regridded from the original half-degree to 1 km to match the resolution of the ESA leaf area index product. The contribution of an individual tropical cyclone to ending a drought was evaluated by comparing the standardized precipitation and evapotranspiration index from affected and reference areas through the following equation:
where δSPEI is the event-based change in standardized precipitation and evapotranspiration index. A positive or negative δSPEI, respectively, denotes an increase or decrease in available water resources following the passage of a tropical cyclone. The subscript imon represents the integration time of available water resources in the calculation of the standardized precipitation and evapotranspiration index either in the reference (ref) or the affected (aff) area which are defined in the previous section. The same time window, i.e., 60 d, was applied for the calculation of δSPEI and event-based effect size for leaf area index. The surface state was considered to experience a dry spell when the standardized precipitation and evapotranspiration index dropped below −1.0 in this study.
A6 Atmospheric analysis
The Pacific Japan index was calculated by comparing the difference of the 3-month running mean atmospheric pressure anomaly from Yokohama in Japan (35∘ N, 155∘ E) with Hengchun in Taiwan (22.5∘ N, 125∘ E) (Kubota et al., 2016) with the 20-year climatology from 1999 to 2019. A monthly Pacific Japan index was used in this study and the pressure data were retrieved from ERA5 (Hersbach et al., 2018). The Pacific Japan index for the month of the passage of each tropical cyclone were stratified according to the impact (given by the effect size) of the cyclone on forest leaf area. Mean absolute atmospheric pressure field and leaf area were calculated for those cyclones with a neutral effect size on leaf area (Fig. 3a). Changes in pressure field and leaf area were calculated for both cyclones with a positive and negative impact on leaf area (Fig. 3b and c).
Data table, R scripts, and data for performing the analysis and creating the plots can be found at https://doi.org/10.5281/zenodo.7511040 (Chen, 2023).
YYC and SL designed the study. YYC investigated and visualized the results. YYC and SL contributed to the interpretation of the results. SL wrote the original draft. SL and YYC reviewed and edited the paper.
At least one of the (co-)authors is a member of the editorial board of Biogeosciences. The peer-review process was guided by an independent editor, and the authors also have no other competing interests to declare.
Publisher’s note: Copernicus Publications remains neutral with regard to jurisdictional claims in published maps and institutional affiliations.
We acknowledge the reviewers and the editors for advice on the methodology, which improved the overall scientific quality of this study. We thank Matthew J. McGrath, Chao Yue, and Barry Gardiner for providing their comments on the result of this study during the early phase of this study. Yi-Ying Chen thanks Huang-Hsiung Hsu for the discussion of analyzing atmospheric conditions and Chi-Hua Wu for the comments on considering the uncertainty in remote-sensing data. Yi-Ying Chen would like to thank the National Center for High-performance Computing (NCHC) for sharing its computational resources and data storage facilities.
Yi-Ying Chen was funded through the Ministry of Science and Technology (grant nos. MOST 109-2111-M-001-011 and grant MOST 110-2111-M-001-011). Sebastiaan Luyssaert was partly funded through the H2020 project HoliSoils (SEP-210673589) and the HE project INFORMA (101060309).
This paper was edited by Martin De Kauwe and Sara Vicca, and reviewed by two anonymous referees.
Altman, J., Ukhvatkina, O. N., Omelko, A. M., Macek, M., Plener, T., Pejcha, V., Cerny, T., Petrik, P., Srutek, M., Song, J.-S., Zhmerenetsky, A. A., Vozmishcheva, A. S., Krestov, P. V., Petrenko, T. Y., Treydte, K., and Dolezal, J.: Poleward migration of the destructive effects of tropical cyclones during the 20th century, P. Natl. Acad. Sci. USA, 115, 11543–11548, https://doi.org/10.1073/pnas.1808979115, 2018.
Beguería, S., Vicente-Serrano, S. M., Reig, F., and Latorre, B.: Standardized precipitation evapotranspiration index (SPEI) revisited: Parameter fitting, evapotranspiration models, tools, datasets and drought monitoring, Int. J. Climatol., 34, 3001–3023, https://doi.org/10.1002/joc.3887, 2014.
Blanc, E. and Strobl, E.: Assessing the impact of typhoons on rice production in the Philippines, J. Appl. Meteorol. Climatol., 55, 993–1007, https://doi.org/10.1175/jamc-d-15-0214.1, 2016.
Bushnell, J. M., Cherrett, R. C., and Falvey, R. J.: Annual Tropical Cyclone Report 2018, 147 pp., 2018.
Chambers, J. Q., Fisher, J. I., Zeng, H., Chapman, E. L., Baker, D. B., and Hurtt, G. C.: Hurricane Katrina's carbon footprint on U.S. Gulf coast forests, Science, 318, 1107–1107, https://doi.org/10.1126/science.1148913, 2007.
Chang, C.-T., Lee Shaner, P.-J., Wang, H.-H., and Lin, T.-C.: Resilience of a subtropical rainforest to annual typhoon disturbance: Lessons from 25-year data of leaf area index, Forest Ecol. Manag., 470–471, 118210, https://doi.org/10.1016/j.foreco.2020.118210, 2020.
Chapin, F. S., Matson, P. A., Vitousek, P. M.: Principles of Terrestrial Ecosystem Ecology, Springer New York, New York, NY, https://doi.org/10.1007/978-1-4419-9504-9, 2011.
Chen, Y.-Y.: Tropical cyclones facilitate recovery of forest leaf area from dry spells in East Asia (final), Zenodo [data set], https://doi.org/10.5281/zenodo.7511040, 2023.
Chen, Y.-Y., Gardiner, B., Pasztor, F., Blennow, K., Ryder, J., Valade, A., Naudts, K., Otto, J., McGrath, M. J., Planque, C., and Luyssaert, S.: Simulating damage for wind storms in the land surface model ORCHIDEE-CAN (revision 4262), Geosci. Model Dev., 11, 771–791, https://doi.org/10.5194/gmd-11-771-2018, 2018.
Chen, Y., Sharma, S., Zhou, X., Yang, K., Li, X., Niu, X., Hu, X., and Khadka, N.: Spatial performance of multiple reanalysis precipitation datasets on the southern slope of central Himalaya, Atmos. Res., 250, 105365, https://doi.org/10.1016/j.atmosres.2020.105365, 2021.
Chiu, C.-M., Chien, C.-T., Nigh, G., and Chung, C.-H.: Influence of climate on tree mortality in Taiwania (Taiwania cryptomerioides) stands in Taiwan, New Zeal. J. For. Sci., 48, 6, https://doi.org/10.1186/s40490-018-0111-0, 2018.
Choi, K.-S., Wu, C.-C., and Cha, E.-J.: Change of tropical cyclone activity by Pacific-Japan teleconnection pattern in the western North Pacific, J. Geophys. Res.-Atmos., 115, 1–13, https://doi.org/10.1029/2010JD013866, 2010.
Choi, K.-S., Kim, D.-W., and Byun, H.-R.: Relationship between summer drought of mid-latitudes in East Asia and tropical cyclone genesis frequency in the Western North Pacific, in: Advances in Geosciences (A 6-Volume Set), edited by: Satake, K. and Wu, C.-C., World Scientific Publishing Co. Pte. Ltd., 1–13, https://doi.org/10.1142/9789814355315_0001, 2011.
The Joint Typhoon Warning Center Tropical Cyclone Best-Tracks (JTWC): 1945–2000, https://www.metoc.navy.mil/jtwc/products/best-tracks/tc-bt-report.html, last access: 25 June 2019.
Curran, T. J., Brown, R. L., Edwards, E., Hopkins, K., Kelley, C., McCarthy, E., Pounds, E., Solan, R., and Wolf, J.: Plant functional traits explain interspecific differences in immediate cyclone damage to trees of an endangered rainforest community in north Queensland, Austral. Ecol., 33, 451–461, https://doi.org/10.1111/j.1442-9993.2008.01900.x, 2008.
Douglas, I.: Hydrological investigations of forest disturbance and land cover impacts in South–East Asia: a review, Philos. T. R. Soc. Lond. Ser. B, 354, 1725–1738, https://doi.org/10.1098/rstb.1999.0516, 1999.
Dvorak, V. F.: Tropical cyclone intensity analysis using satellite data, https://repository.library.noaa.gov/view/noaa/19322 (last access: 7 January 2023), 1984.
Dvorak, V. F., Smigielski, F. J., and States, U.: A workbook on tropical clouds and cloud systems observed in satellite imagery, https://catalog.hathitrust.org/Record/002715963 (last access: 7 January 2023), 1990.
ECMWF: IFS Documentation CY45R1 – Part II: Data assimilation, in: IFS Documentation CY45R1, ECMWF, https://doi.org/10.21957/a3ri44ig4, 2018.
ECMWF: ERA5-Land hourly data from 1981 to present, ECMWF, https://doi.org/10.24381/cds.e2161bac, 2019.
Eloy, C., Fournier, M., Lacointe, A., and Moulia, B.: Wind loads and competition for light sculpt trees into self-similar structures, Nat. Commun., 8, 1–11, https://doi.org/10.1038/s41467-017-00995-6, 2017.
ESA: Land Cover CCI Product User Guide Version 2, 105 pp., 2017.
Forzieri, G., Pecchi, M., Girardello, M., Mauri, A., Klaus, M., Nikolov, C., Rüetschi, M., Gardiner, B., Tomaštík, J., Small, D., Nistor, C., Jonikavicius, D., Spinoni, J., Feyen, L., Giannetti, F., Comino, R., Wolynski, A., Pirotti, F., Maistrelli, F., Savulescu, I., Wurpillot-Lucas, S., Karlsson, S., Zieba-Kulawik, K., Strejczek-Jazwinska, P., Mokroš, M., Franz, S., Krejci, L., Haidu, I., Nilsson, M., Wezyk, P., Catani, F., Chen, Y.-Y., Luyssaert, S., Chirici, G., Cescatti, A., and Beck, P. S. A.: A spatially explicit database of wind disturbances in European forests over the period 2000–2018, Earth Syst. Sci. Data, 12, 257–276, https://doi.org/10.5194/essd-12-257-2020, 2020.
Grice, J. W.: Computing and evaluating factor scores, Psychol. Method., 6, 430–450, https://doi.org/10.1037/1082-989X.6.4.430, 2001.
Harris, I., Osborn, T. J., Jones, P., and Lister, D.: Version 4 of the CRU TS monthly high-resolution gridded multivariate climate dataset, Sci. Data, 7, 1–18, https://doi.org/10.1038/s41597-020-0453-3, 2020.
Hersbach, H., Bell, B., Berrisford, P., Biavati, G., Horányi, A., Muñoz Sabater, J., Nicolas, J., Peubey, C., Radu, R., Rozum, I., Schepers, D., Simmons, A., Soci, C., Dee, D., Thépaut, J.-N. H. H., Bell, B., Berrisford, P., Biavati, G., and Horányi, A. J.-N.: ERA5 hourly data on single levels from 1959 to present, Copernicus Climate Change Service (C3S) Climate Data Store (CDS), https://doi.org/10.24381/cds.adbb2d47, 2018.
Honkavaara, E., Litkey, P., and Nurminen, K.: Automatic storm damage detection in forests using high-altitude photogrammetric imagery, Remote Sens., 5, 1405–1424, https://doi.org/10.3390/rs5031405, 2013.
Jorge, S.-Z.: Copernicus Global Land Operations “Vegetation and Energy”, https://land.copernicus.eu/global/sites/cgls.vito.be/files/products/CGLOPS1_SQE2019_LAI300m-V1_I1.00.pdf (last access: 7 January 2023), 2020.
Kaplan, J. and Demaria, M.: On the decay of tropical cyclone winds after landfall in the New England Area, J. Appl. Meteorol., 40, 280–286, https://doi.org/10.1175/1520-0450(2001)040<0280:OTDOTC>2.0.CO;2, 2001.
Kubota, H., Kosaka, Y., and Xie, S. P.: A 117-year long index of the Pacific-Japan pattern with application to interdecadal variability, Int. J. Climatol., 36, 1575–1589, https://doi.org/10.1002/joc.4441, 2016.
Landsea, C. W.: Climate variability of tropical cyclones: Past, Present and Future, in: Storms, edited by: Pielke, R. A. S. and Pielke, R. A. J., Routledge, New York, ISBN: 0-145-17239-x 220–241, 2000.
Lin, T.-C., Hamburg, S., Lin, K.-C., Wang, L.-J., Chang, C.-T., Hsia, Y.-J., Vadeboncoeur, M. A., Mabry McMullen, C. M., and Liu, C.-P.: Typhoon disturbance and forest dynamics: Lessons from a Northwest Pacific subtropical forest, Ecosystems, 14, 127–143, https://doi.org/10.1007/s10021-010-9399-1, 2011.
Lin, T.-C., Hogan, J. A., and Chang, C. T.: Tropical Cyclone Ecology: A Scale-Link Perspective, Trends Ecol. Evol., 35, 594–604, https://doi.org/10.1016/j.tree.2020.02.012, 2020.
Louf, J. F., Nelson, L., Kang, H., Song, P. N., Zehnbauer, T., and Jung, S.: How wind drives the correlation between leaf shape and mechanical properties, Sci. Rep., 8, 1–7, https://doi.org/10.1038/s41598-018-34588-0, 2018.
Mabry, C. M., Hamburg, S. P., Lin Teng-Chiu, Horng, F. W., King, H. B., and Hsia, Y. J.: Typhoon disturbance and stand-level damage patterns at a subtropical forest in Taiwan, Biotropica, 30, 238–250, https://doi.org/10.1111/j.1744-7429.1998.tb00058.x, 1998.
Martins, J. P., Trigo, I., and de Freitas, S. C.: Copernicus Global Land Operations ”Vegetation and Energy” “CGLOPS-1”, Copernicus Glob. L. Oper., 368, 1–93, https://doi.org/10.1126/science.aaz9463, 2020.
McDowell, N. G., Allen, C. D., and erson-Teixeira, K., Aukema, B. H., Bond-Lamberty, B., Chini, L., Clark, J. S., Dietze, M., Grossiord, C., Hanbury-Brown, A., Hurtt, G. C., Jackson, R. B., Johnson, D. J., Kueppers, L., Lichstein, J. W., Ogle, K., Poulter, B., Pugh, T. A. M., Seidl, R., Turner, M. G., Uriarte, M., Walker, A. P., and Xu, C.: Pervasive shifts in forest dynamics in a changing world, Science, 368, 964, https://doi.org/10.1126/science.aaz9463, 2020.
Negrón-Juárez, R., Baker, D. B., Zeng, H., Henkel, T. K., and Chambers, J. Q.: Assessing hurricane-induced tree mortality in U.S. Gulf Coast forest ecosystems, J. Geophys. Res., 115, G04030, https://doi.org/10.1029/2009JG001221, 2010.
Negrón-Juárez, R., Baker, D. B., Chambers, J. Q., Hurtt, G. C., and Goosem, S.: Multi-scale sensitivity of Landsat and MODIS to forest disturbance associated with tropical cyclones, Remote Sens. Environ., 140, 679–689, https://doi.org/10.1016/j.rse.2013.09.028, 2014.
Nitta, T.: Convective Activities in the Tropical Western Pacific and Their Impact on the Northern Hemisphere Summer Circulation, J. Meteorol. Soc. Japan. Ser. II, 65, 373–390, https://doi.org/10.2151/jmsj1965.65.3_373, 1987.
Ozdogan, M., Vladimirova, N., Radeloff, V. C., Krylov, A., Wolter, P. T., and Baumann, M.: Landsat remote sensing of forest windfall disturbance, Remote Sens. Environ., 143, 171–179, https://doi.org/10.1016/j.rse.2013.12.020, 2014.
Rustad, L. E., Campbell, J. L., Marion, G. M., Norby, R. J., Mitchell, M. J., Hartley, A. E., Cornelissen, J. H. C., Gurevitch, J., Alward, R., Beier, C., Burke, I., Canadell, J., Callaghan, T., Christensen, T. R., Fahnestock, J., Fernandez, I., Harte, J., Hollister, R., John, H., Ineson, P., Johnson, M. G., Jonasson, S., John, L., Linder, S., Lukewille, A., Masters, G., Melillo, J., Mickelsen, A., Neill, C., Olszyk, D. M., Press, M., Pregitzer, K., Robinson, C., Rygiewiez, P. T., Sala, O., Schmidt, I. K., Shaver, G., Thompson, K., Tingey, D. T., Verburg, P., Wall, D., Welker, J., and Wright, R.: A meta-analysis of the response of soil respiration, net nitrogen mineralization, and aboveground plant growth to experimental ecosystem warming, Oecologia, 126, 543–562, https://doi.org/10.1007/s004420000544, 2001.
Takao, G., Saigusa, N., Yamagata, Y., Hayashi, M., and Oguma, H.: Quantitative assessment of the impact of typhoon disturbance on a Japanese forest using satellite laser altimetry, Remote Sens. Environ., 156, 216–225, https://doi.org/10.1016/j.rse.2014.09.028, 2014.
Tang, S., Lin, T.-C., Hsia, Y.-J., Hamburg, S. P., and Lin, K.-C.: Typhoon effects on litterfall in a subtropical forest, Can. J. For. Res., 33, 2184–2192, https://doi.org/10.1139/x03-154, 2003.
Therneau, T., Atkinson, B., and Ripley, B.: Rpart: Recursive partitioning for classification, regression and survival trees, CRAN R package version 4.1-15, https://rdrr.io/cran/rpart/ (last access: 7 January 2023), 2019.
Uriarte, M., Thompson, J., and Zimmerman, J. K.: Hurricane María tripled stem breaks and doubled tree mortality relative to other major storms, Nat. Commun., 10, 1–7, https://doi.org/10.1038/s41467-019-09319-2, 2019.
Verger, A., Baret, F., and Weiss, M.: Near real-time vegetation monitoring at global scale, IEEE J. Sel. Top. Appl. Earth Obs. Remote Sens., 7, 3473–3481, https://doi.org/10.1109/JSTARS.2014.2328632, 2014.
Virot, E., Ponomarenko, A., Dehandschoewercker, Quéré, D., and Clanet, C.: Critical wind speed at which trees break, Phys. Rev. E, 93, 023001, https://doi.org/10.1103/PhysRevE.93.023001, 2016.
Wang, H.-C., Wang, S.-F., Lin, K.-C., Lee Shaner, P.-J., and Lin, T.-C.: Litterfall and Element Fluxes in a Natural Hardwood Forest and a Chinese-fir Plantation Experiencing Frequent Typhoon Disturbance in Central Taiwan, Biotropica, 45, 541–548, https://doi.org/10.1111/btp.12048, 2013.
Willoughby, H. E. and Rahn, M. E.: Parametric representation of the primary hurricane vortex, Part I: Observations and evaluation of the Holland (1980) model, Mon. Weather Rev., 132, 3033–3048, https://doi.org/10.1175/MWR2831.1, 2004.
WMO: Global Guide to Tropical Cyclone Forecasting, World Meteorological Organization, 399 pp., ISBN: 978-92-63-11194-4, 2017.
Yoo, J., Kwon, H.-H. H., So, B.-J. J., Rajagopalan, B., and Kim, T.-W. W.: Identifying the role of typhoons as drought busters in South Korea based on hidden Markov chain models, Geophys. Res. Lett., 42, 2797–2804, https://doi.org/10.1002/2015GL063753, 2015.