the Creative Commons Attribution 4.0 License.
the Creative Commons Attribution 4.0 License.
 | 19 Sep 2023
Rethinking the deployment of static chambers for CO2 flux measurement in dry desert soils
Nadav Bekin
The mechanisms underlying the soil CO2 flux (Fs) in dry desert soils are not fully understood. To better understand these processes, we must accurately estimate these small fluxes. The most commonly used method, static chambers, inherently alters the conditions that affect the flux and may introduce errors of the same order of magnitude as the flux itself. Regional and global assessments of annual soil respiration rates are based on extrapolating point measurements conducted with flux chambers. Yet, studies conducted in desert ecosystems rarely discuss potential errors associated with using static chambers in dry and bare soils. We hypothesized that a main source of error is the collar protrusion above the soil surface. During the 2021 dry season, we deployed four automated chambers on collars with different configurations in the Negev, Israel. Fs exhibited a repetitive diel cycle of nocturnal uptake and daytime efflux. CO2 uptake measured over the conventionally protruding collars was significantly lower than over the collars flushed with the soil surface. Using thermal imaging, we proved that the protruding collar walls distorted the ambient heating and cooling regime of the topsoil layer, increasing the mean surface temperatures. Higher soil temperatures during the night suppressed the flux driving forces, i.e., soil–atmosphere CO2 and temperature gradients, ultimately leading to an underestimation of up to 50 % of the actual Fs. Accordingly, the total daily CO2 uptake by the soil in the conventionally deployed collars was underestimated by 35 %. This suggests that desert soils are a larger carbon sink than previously reported and that drylands, which cover approximately 40 % of Earth's terrestrial surface, may play a significant role in the global carbon balance.
- Article
(8449 KB) - Full-text XML
- BibTeX
- EndNote


Soil respiration, i.e., the carbon dioxide (CO2) efflux from the soil to the atmosphere, is among the largest components of the carbon balance in terrestrial ecosystems, contributing approximately 60 PgC to the atmosphere every year (Houghton, 2007). In arid and semi-arid environments, soil respiration is mostly thought to be restricted to short pulses of increased moisture availability from rainfall events, during which microbial metabolic activity increases rapidly, followed by long periods of desiccation and low to negligible soil respiration rates (Cable et al., 2008; Austin et al., 2004). In the last 2 decades, studies carried out in several deserts have challenged this paradigm, reporting a diel course of CO2 exchange, consisting of nocturnal CO2 uptake and daytime efflux (Ball et al., 2009; Sagi et al., 2021; Lopez-Canfin et al., 2022). Researchers usually attribute this diel cycle to changes in soil temperatures and soil air pressure that lead to cycles of expansion–contraction of soil air, following the ideal gas law (Yang et al., 2020). These cycles change the surface CO2 concentration and may generate a soil–atmosphere pressure gradient (Ganot et al., 2014), both driving forces for soil CO2 flux (Fs). Another explanation is based on Henry's law. This states that diurnal fluctuations of soil temperatures change the solubility of soil CO2 in water films, which changes the concentration of gaseous CO2 in soil pores and leads to the exchange of CO2 between the soil and the atmosphere by diffusion (Fa et al., 2016). In saline/alkaline soils, this process is thought to cause a diel cycle of calcium carbonate (CaCO3) precipitation–dissolution, which enhances Fs (Hamerlynck et al., 2013; Fa et al., 2016). Yet, the factors controlling Fs in desert soils and the partitioning between them are still under debate.
Furthermore, the ability to accurately estimate the soil CO2 flux in desert soils at the very dry end is controversial due to the potential for measurement-induced modifications to soil and atmospheric conditions that can introduce errors of the same order of magnitude as the flux being measured. This problem is exacerbated when using static chambers to measure flux, as the chambers inherently alter the conditions that affect the flux (Pumpanen et al., 2010; Parkin et al., 2012). During efflux, CO2 concentration in the chamber builds up, decreasing the diffusion gradient between CO2 in the soil pores and the chamber headspace and thereby altering CO2 concentration within the topsoil layer and reducing the flux (Pumpanen et al., 2004). Artificial changes in air pressure within the chamber headspace compared to the ambient atmosphere are another source of error (Bain et al., 2005; Lund et al., 1999).
There are additional sources of errors associated with the chamber–soil contact method (Ngao et al., 2006; Baram et al., 2022). Flux chambers are typically deployed on a collar (i.e., PVC pipe) that is inserted into the soil, with the upper 3–5 cm of the collar protruding above the soil surface to allow for chamber deployment. This practice modifies the soil surface temperature by shading a portion of the measured surface area. The non-representative soil surface temperature results in modified heat exchange between the soil and the atmosphere, as well as a modified soil temperature profile (Ninari and Berliner, 2002). Soil microbial and physical processes that drive Fs are susceptible to changes in soil temperature (Cable et al., 2011), and thus shading the soil surface can lead to errors in Fs measurements. These errors may intensify in high-latitude cold deserts, in which the low angle of insolation will dictate a larger shaded surface area for longer periods during the day. Fs was shown to be particularly affected by fluctuations in soil temperatures in cold deserts (Parsons et al., 2004; Ball et al., 2009). While these effects are likely minimal in temperate, vegetated areas, they could be significant in bare soil, partly because fluctuations in surface temperatures are not regulated by vegetation cover as in humid environments. Desert soils also have lower specific heat capacity than soils in humid environments due to lower water content (Hillel, 1998). The lower water content also means that a larger portion of the available energy is invested in soil heating rather than stored as latent heat during evaporation (Brutsaert, 1982). However, studies using static chambers in desert ecosystems rarely discuss potential errors associated with the unique characteristics of desert soils. Moreover, to our knowledge, the effect of the collar height above the surface on soil surface temperature and, consequently, on Fs has never been studied.
Under dry soil conditions, the depth to which the collar is inserted can also significantly influence the flux measurements. The ideal insertion depth is debatable, as both shallow and deep collar insertion depths can lead to errors, depending on climate and soil conditions. Inserting the collar to a shallower depth than the depth to which feedback from the chamber still affects gas concentrations may result in lateral diffusion, leading to underestimation of the vertical flux (Healy et al., 1996). However, an insertion depth of only 2.5 cm and a measurement period of 10 min will reduce this underestimation to 1 % for a soil with air-filled porosity of 0.3 m3 m−3 (Hutchinson and Livingston, 2001). Hence, for short measurement periods (common today) and soils with low effective diffusivity, errors resulting from lateral diffusion may be insignificant. With current static chamber systems, even small Fs values measured in dry desert soils can be accurately quantified with much shorter measurement periods of only 1–2 min (Yang et al., 2022), thus overcoming a significant drawback of the shallow collars. Deep collar insertion, on the other hand, can lead to either overestimation or underestimation of the flux by generating vertical mass flow of air along the collar walls or by facilitating root cutting, respectively (Heinemeyer et al., 2011). Still, in most studies, collars are inserted into the soil to a depth of ∼5–10 cm and, in some cases, to a depth of 30–60 cm, while more than a third of all authors fail to report the collar insertion depth (Rochette and Eriksen-Hamel, 2008; Cable et al., 2011; Fa et al., 2018; Jian et al., 2020; Sagi et al., 2021; Yang et al., 2022).
In this paper, we aimed to investigate the effect of the collar height above the soil surface and collar depth of insertion on Fs in a dry, bare desert soil. Given the small fluxes in these conditions, as well as the fact that regional and global assessments of annual soil respiration are based on extrapolating point measurements conducted with flux chambers (Jian et al., 2020), minimizing measurement errors associated with the collar deployment technic is critical. Arid and semi-arid regions, which comprise approximately 40 % of Earth's terrestrial surface, constitute the largest uncertainty in mean annual soil respiration estimations (Stell et al., 2021). Improving the accuracy of Fs measurements in desert environments is essential for enhancing our understanding of the terrestrial carbon balance and our ability to predict climate change.
2.1 Research site
The study was carried out at the Wadi Mashash experimental farm in the northern Negev, Israel (31∘04′14′′ N, 34∘51′62′′ E; 360 m.a.s.l.; 65 km SE of the Mediterranean Sea). The climate in the research site is arid, with an average annual rainfall of 116 mm (IMS, 2021) occurring mostly between October and April. The daily mean maximum and minimum temperatures for January (winter) are 15.9 and 8.0 ∘C, respectively, while those for August (summer) are 33.3 and 20.7 ∘C. During the summer season, the prevailing wind direction is NW due to the sea breeze carrying water vapor from the Mediterranean Sea inland. The sea breeze reaches its peak at a wind speed of 7 m s−1 (at 10 m height) in the afternoon. The research is located on a largely bare plain of sandy-loam loess soil (72.5 % sand, 15 % silt, and 12.5 % clay), partly covered by a biological soil crust over a thin physical crust, with dry annual grasses and shrubs.
Air temperature and relative humidity (100K6A1A, BetaTherm, USA) were monitored along with wind speed and direction as part of an eddy-covariance system (IRGASON, Campbell Scientific, Inc.). Air temperature was measured at 5 s intervals and averaged over 15 min periods. Wind speed and direction were determined from high-frequency measurements of 3D wind speed taken at 20 Hz intervals and then averaged over 30 min periods and stored in a data logger (CR6, Campbell Scientific, Inc.). Net radiation was measured at a height of 2.4 m using a four-component net radiometer (SN-500-SS, Apogee Instruments, Inc., USA) at 10 s intervals, averaged over 15 min periods, and stored in a data logger (CR5000, Campbell Scientific, Inc.).
3.1 Soil CO2 flux measurements
We measured Fs using a non-dispersive infrared gas analyzer with a range of 0–20 000 ppm and an accuracy of 1.5 % of reading. The analyzer was connected to four automated non-steady-state chambers (LI-8100A-104C, LI-COR, Lincoln, Nebraska, USA). The chambers were closed on a pre-inserted collar every 30 min for a measurement period of 60 s, with a 10 s dead-band period to allow for homogeneous air mixing within the system. Each measurement started with a 90 s pre-purge and ended with a 45 s post-purge period.
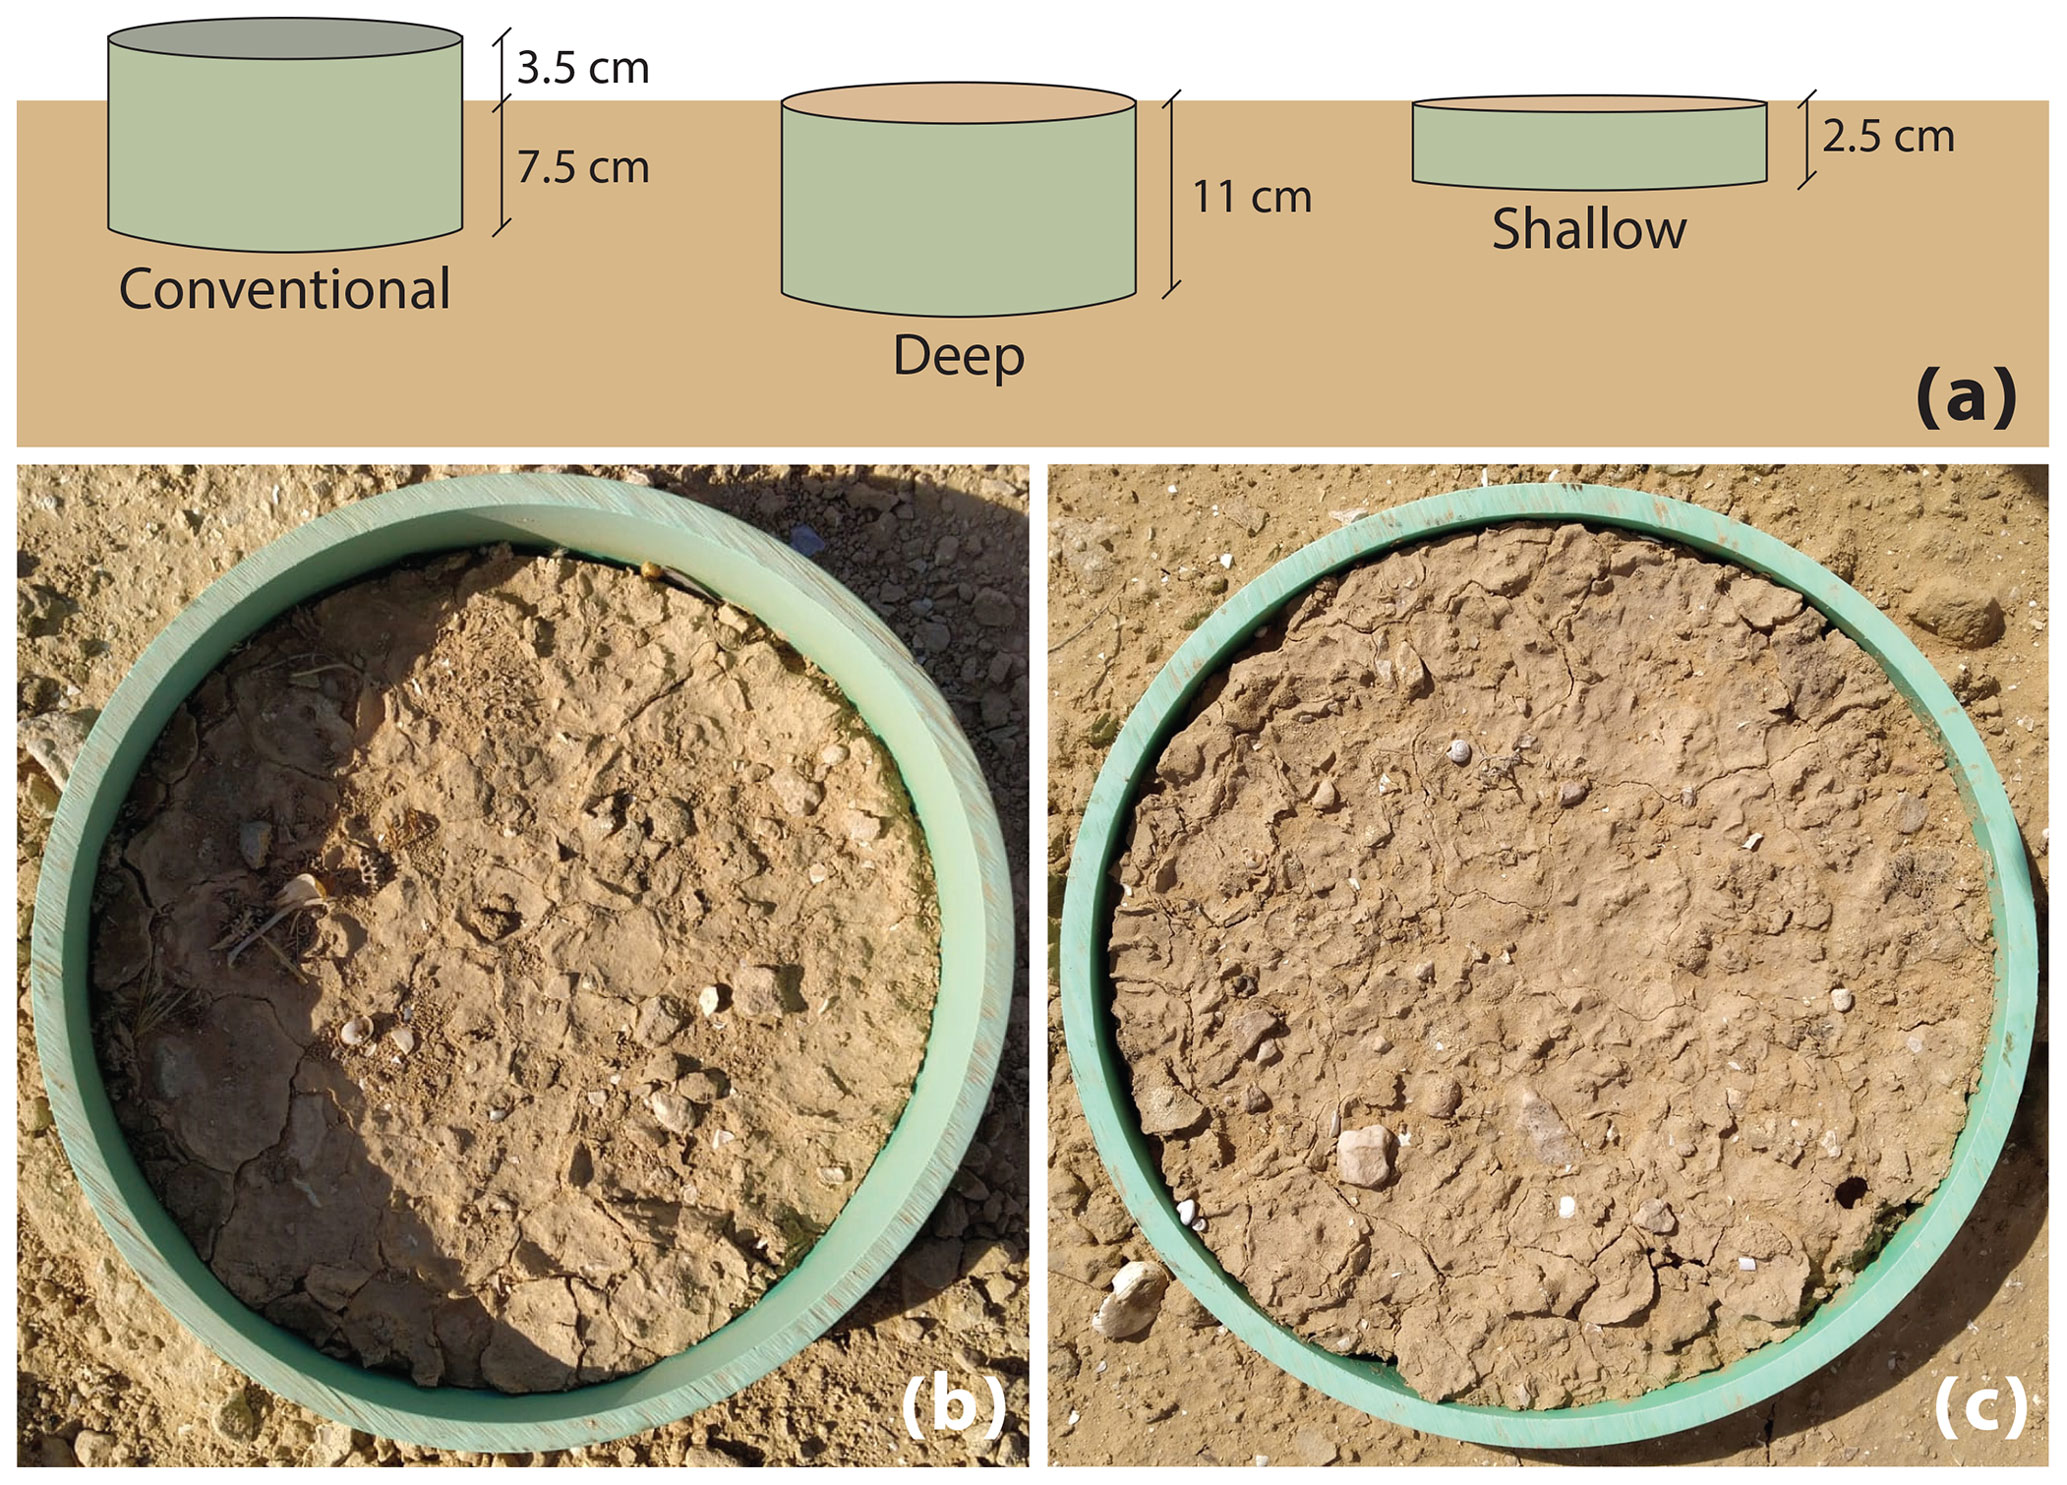
Figure 1(a) The three types of collars used in this experiment. (b) Photo of a conventional (CONV) collar. (c) Photo of a collar flush with the soil surface, representing the DEEP and SHAL treatments.
We deployed the chambers on three types of collars (i.e., treatments): (1) the conventional type (CONV) – an 11 cm long collar, inserted 7.5 cm into the soil and leaving 3.5 cm of collar above the soil surface (Fig. 1); (2) the deep type (DEEP) – an 11 cm long collar completely inserted into the soil, leaving the top of the collar flush with the soil surface; and (3) the shallow type (SHAL) – a 2.5 cm long collar completely inserted into the soil, with the top of the collar flush with the soil surface. Three collars from each type (1–3) were inserted into the soil 2 months before measurements started. All collars had an inner diameter of 20 cm.
Table 1Chamber placement during the six measurement periods, 12 May–29 June 2021.
One chamber (PERM) continuously measured soil CO2 flux on the same collar throughout the experiment.
We collected data between May and June of the 2021 dry season. Three chambers were rotated between the collars on a near-weekly basis (periods 1–6; Table 1), ensuring that each period consisted of at least 5 full and representative days. The fourth chamber was placed on an additional DEEP collar for the whole experiment duration (the permanent type – PERM). The chambers were rotated in two configurations (Table 1): during periods 1, 3, and 5, each chamber was set over a different treatment; e.g., in period 1, chambers were placed over collars CONV1, DEEP1, and SHAL1. During periods 2, 4, and 6, the three chambers were placed on the same treatment (SAME); e.g., in period 2, chambers were placed over collars CONV1, CONV2, and CONV3.
3.2 Ancillary soil measurements
The temperature profile in the soil was measured by self-made T-type thermocouples buried at depths of 0.5, 1, 2, 3, 4, 5, 10, 15, 20, 30, and 50 cm. The thermocouple buried at 0.5 cm provided a proxy for the soil surface temperature. The soil heat flux was derived using the combination method with three repetitions, using a soil heat flux plate (HFT3, Campbell Scientific, Inc.) buried at a depth of 5 cm. Heat storage above the plates was derived from two self-made T-type thermocouples buried at depths of 1.25 and 3.75 cm, and soil water content was measured with a time-domain reflectometer (TDR-315, Acclima, Inc., USA) installed at a depth of 3 cm. The volumetric water content of the soil was lower than 3 % throughout the experiment. Temperature profile and water content data were collected at 10 s intervals, and 15 min averages were stored in a data logger (CR1000X, Campbell Scientific, Inc.) and multiplexer (AM16/32B, Campbell Scientific, Inc.). Soil heat flux data were also collected at 10 s intervals, and 15 min averages were stored in a data logger (CR5000, Campbell Scientific, Inc.).
3.3 Radiometric surface temperature
A 24 h field campaign was conducted on 17–18 August 2021. During the campaign, the surface radiometric temperature of the collars was acquired hourly using a thermal infrared camera (A655sc, FLIR, Wilsonville, Oregon, USA), immediately before taking Fs measurements.
3.4 Data analysis
To calculate Fs, a linear function was fitted to the change in CO2 mole fraction over time for each measurement, using the software LI-COR SoilFluxPro 5.2.0 (LI-COR, Lincoln, Nebraska, USA). The fitting period, which usually lasted 20 s, started after air mixing within the chamber was achieved.
To decipher the differences between collars and given the limited number of chambers, we derived an “average day” for each collar type (CONV, DEEP, and SHAL). First, 5 full representative days from each experiment period (Table 1) was analyzed. Then, for each of the four chambers, an average diel course was calculated from the 5 analyzed days, resulting in 4 average days per period. All average days from all periods (4 treatments × 6 periods = 24 average days) were then divided into three groups based on collar type (6 average days per treatment), and a single average day per treatment was calculated as the mean of the 6 average days. Each time point in the three treatment average days consists of 30 values (6 average days × 5 d per average).
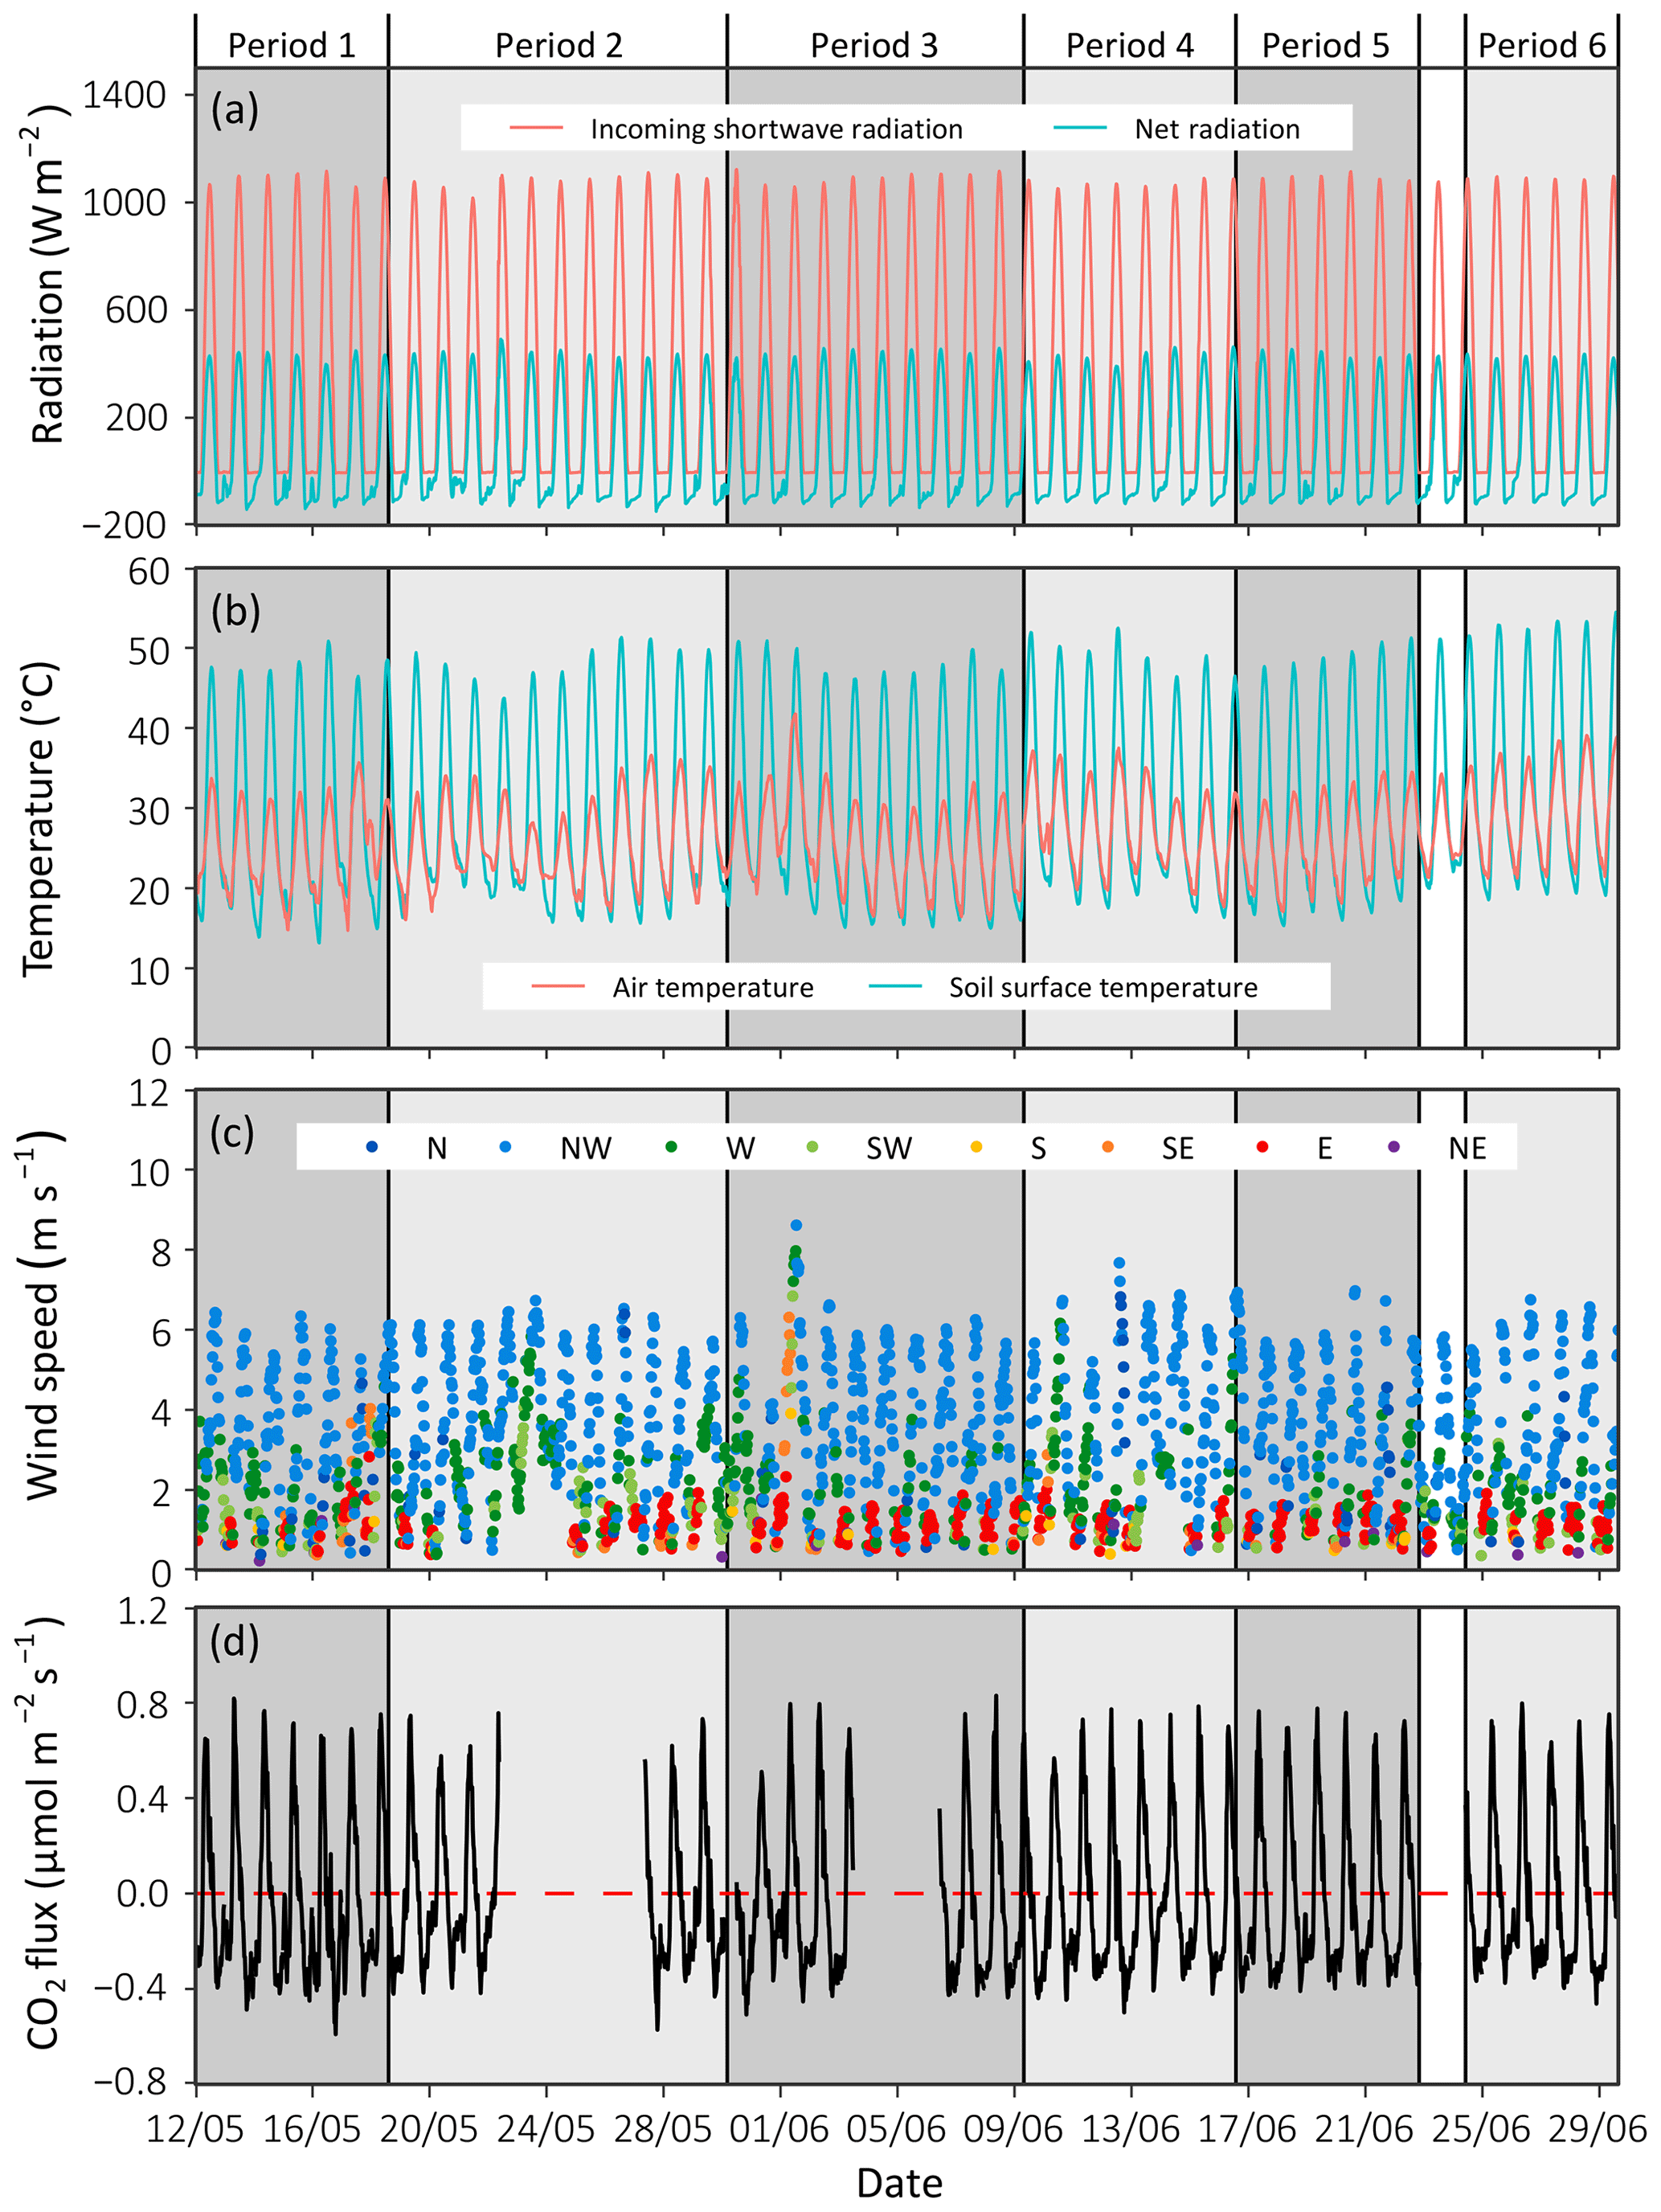
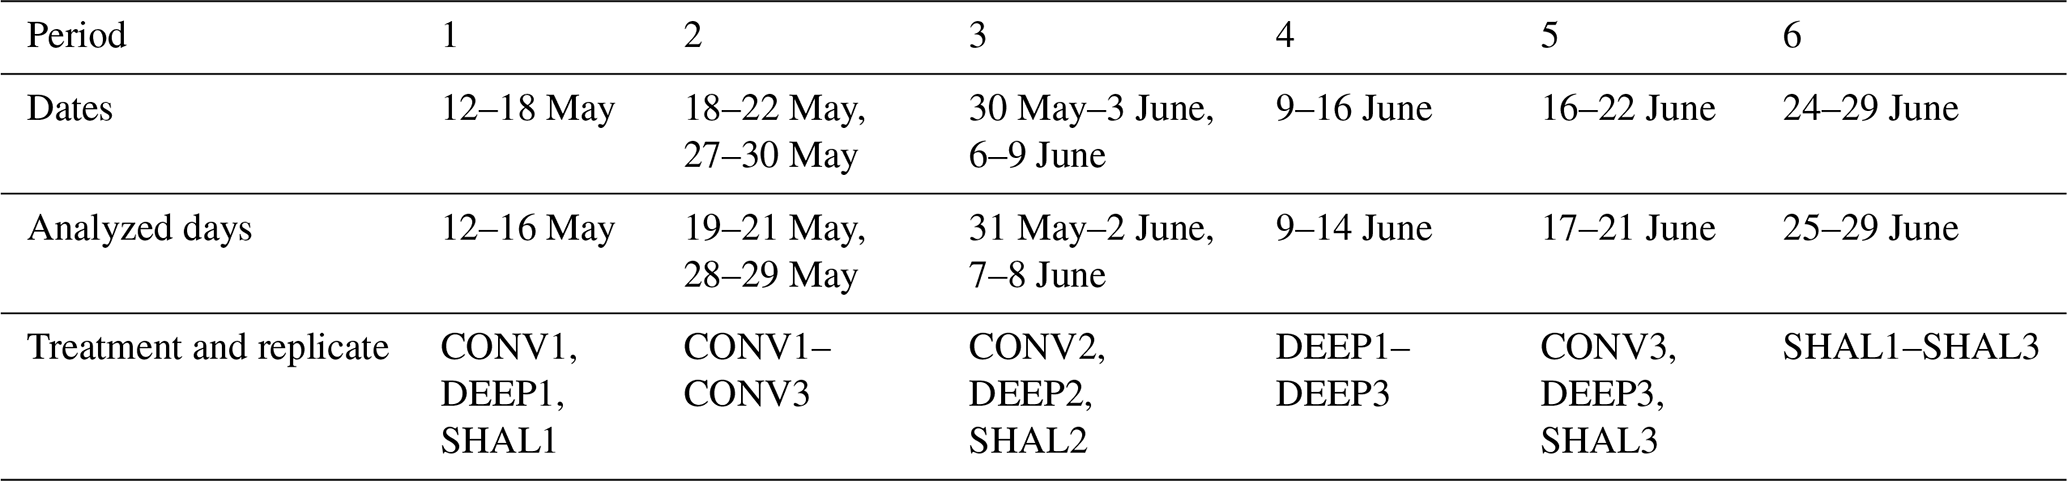
Figure 2Time series with half-hourly data of environmental variables measured at the Wadi Mashash experimental farm during the 2021 summer season. (a) Incoming shortwave radiation and net radiation. (b) Air and soil surface temperatures measured at 0.5 cm depth. (c) Wind speed color-coded according to wind direction: north (N), northwest (NW), west (W), southwest (SW), south (S), southeast (SE), east (E), and northeast (NE). (d) The soil CO2 flux measured by the permanent chamber (PERM).
The differences between the treatments were tested for significance using linear mixed models (LMMs), following the approach developed by Spyroglou et al. (2021). We built a statistical model using LMMs that predicted the response variable (i.e., the mean daily cycle of Fs) as a function of treatment and time as fixed factors (fixed for all data points) and each collar as a subject-specific factor (random effect). This allowed us to assess not only the effect of treatment but also the effect of time and individual collars on Fs while incorporating all 24 h time series into a single model. Still, this model fails to defuse the autocorrelation between data points in each time series. To address this, the LMM residuals were passed through an autoregressive integrated moving average (ARIMA) model and then incorporated within the LMM as errors. The predicted Fs values produced by the corrected model were compared between treatments for each time interval separately using a two-tailed t test with a 95 % confidence interval. To avoid type I errors, the p value was divided by the number of tests performed on each time point according to the Bonferroni correction. Therefore, the corrected p value used here is . The differences between the treatments were also tested by comparing peak daily and daily accumulated efflux and uptake value. This was executed using one-way ANOVA and a post hoc Tukey test with a 95 % confidence interval. The modeling process and statistical analysis were performed using “stats”, “lme4”, and “forecast” packages in RStudio 4.1.1.
To analyze the collars' surface temperature, the region of interest (ROI) for each thermal image was defined for the collar's inner surface area using FLIR ResearchIR Max 4.40.35. The surface temperature of all pixels within the ROI was then exported to RStudio to calculate statistical parameters used to compare treatments. The soil surface emissivity was set to 0.95 for all images (Li et al., 2013).
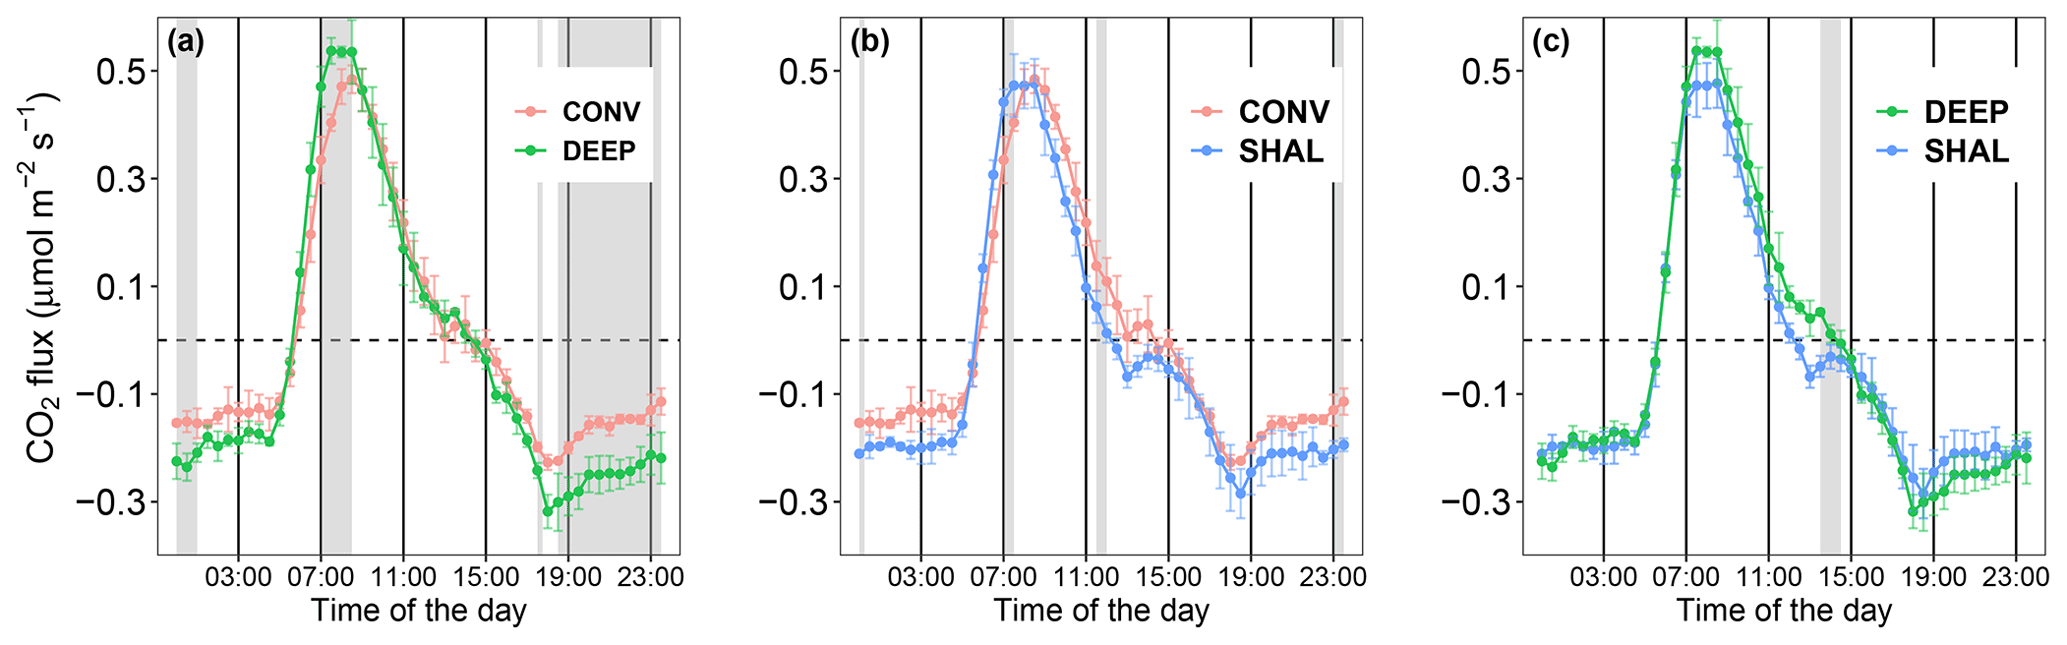
Figure 3Mean daily cycles of the soil CO2 flux measured in the following collar types: (a) the conventional (CONV) and deep (DEEP) insertion types, (b) the conventional (CONV) and shallow (SHAL) types, and (c) the shallow (SHAL) and deep (DEEP) types. Error bars denote 2 standard deviations (n=30). Gray areas represent periods in which differences between the treatments were statistically significant (p value < 0.008).
4.1 Meteorological and soil conditions
The experiment period was characterized by clear-sky days, with similar diel patterns and magnitudes of incoming shortwave and net radiation (Fig. 2). Solar noon occurred at 11:30 on every day of the experiment (UTC + 02:00; this time zone is used throughout the paper). Sunrise and sunset occurred at 04:30–05:00 and 19:00, respectively. The daily minimum and maximum air and soil surface temperatures were 19.45 ± 2.3 and 34.5 ± 2.7 ∘C (air) and 17.7 ± 2 to 49.6 ± 2.2 ∘C (soil surface), respectively. The mean daily range was 13.7 ± 1.0 and 31.8 ± 1.2 ∘C for the air and the soil surface, respectively, with a slight variation between the experiment weeks. The soil surface temperature regularly dropped below air temperature at night (Fig. 2b). The prevailing wind direction was NW, peaking in the afternoon at a mean speed of 6.2 ± 0.2 m s−1 (2 m height).
Soil CO2 flux measured on the permanent collar followed a consistent diurnal pattern throughout the experiment (Fig. 2d), confirming that the weekly periods can be used to test differences between treatments. Starting in the afternoon (mean time 13:30), negative CO2 flux (i.e., uptake, from the atmosphere to the soil) occurred, peaking, on average, at a flux of −0.4 ± 0.04 µmol m−2 s−1 (at 18:30). Then in the early morning (06:00), the flux reversed, and positive CO2 flux (i.e., efflux, from the soil to the atmosphere) increased sharply until 08:30, when a daily maximum of 0.71 ± 0.08 µmol m−2 s−1 was observed. After that, efflux gradually decreased until the afternoon.
4.2 The effect of collar type on soil CO2 flux
The daily temporal dynamic of Fs shows little variation among the different treatments. However, the rate of increasing CO2 efflux in the early morning, measured by the CONV collars, was lower than in the other treatments, as evidenced by the curve's concave nature (Fig. 3). Consequently, the daily maximum CO2 efflux of CONV occurred at 08:30, an hour later than in the other treatments. The SHAL collars were also different from the other treatments in the timing of CO2 uptake onset, occurring each day between 12:00–12:30, 2 h before uptake started in the other treatments (Fig. 3).
The LMM, combined with time series analysis, yielded statistically significant results (p<0.008) for the differences in Fs between CONV and DEEP during the morning (07:00–08:30) and the evening/night (17:30–01:00). In fact, Fs values of CONV were consistently lower than those of DEEP. The relative differences peaked at 06:00 and 23:30, when mean daytime CO2 efflux and nocturnal CO2 uptake were 56 % and 53 % lower in CONV than in DEEP. Fs values measured in the CONV collars were also significantly lower than those of SHALL, by a maximum of 41 %, but for shorter periods around noon and midnight. Fs values measured in the DEEP collars were only significantly different from those of SHAL (p<0.008) from 13:30 to 14:30.
Table 2Summary of main features – the mean daily cycles of Fs.
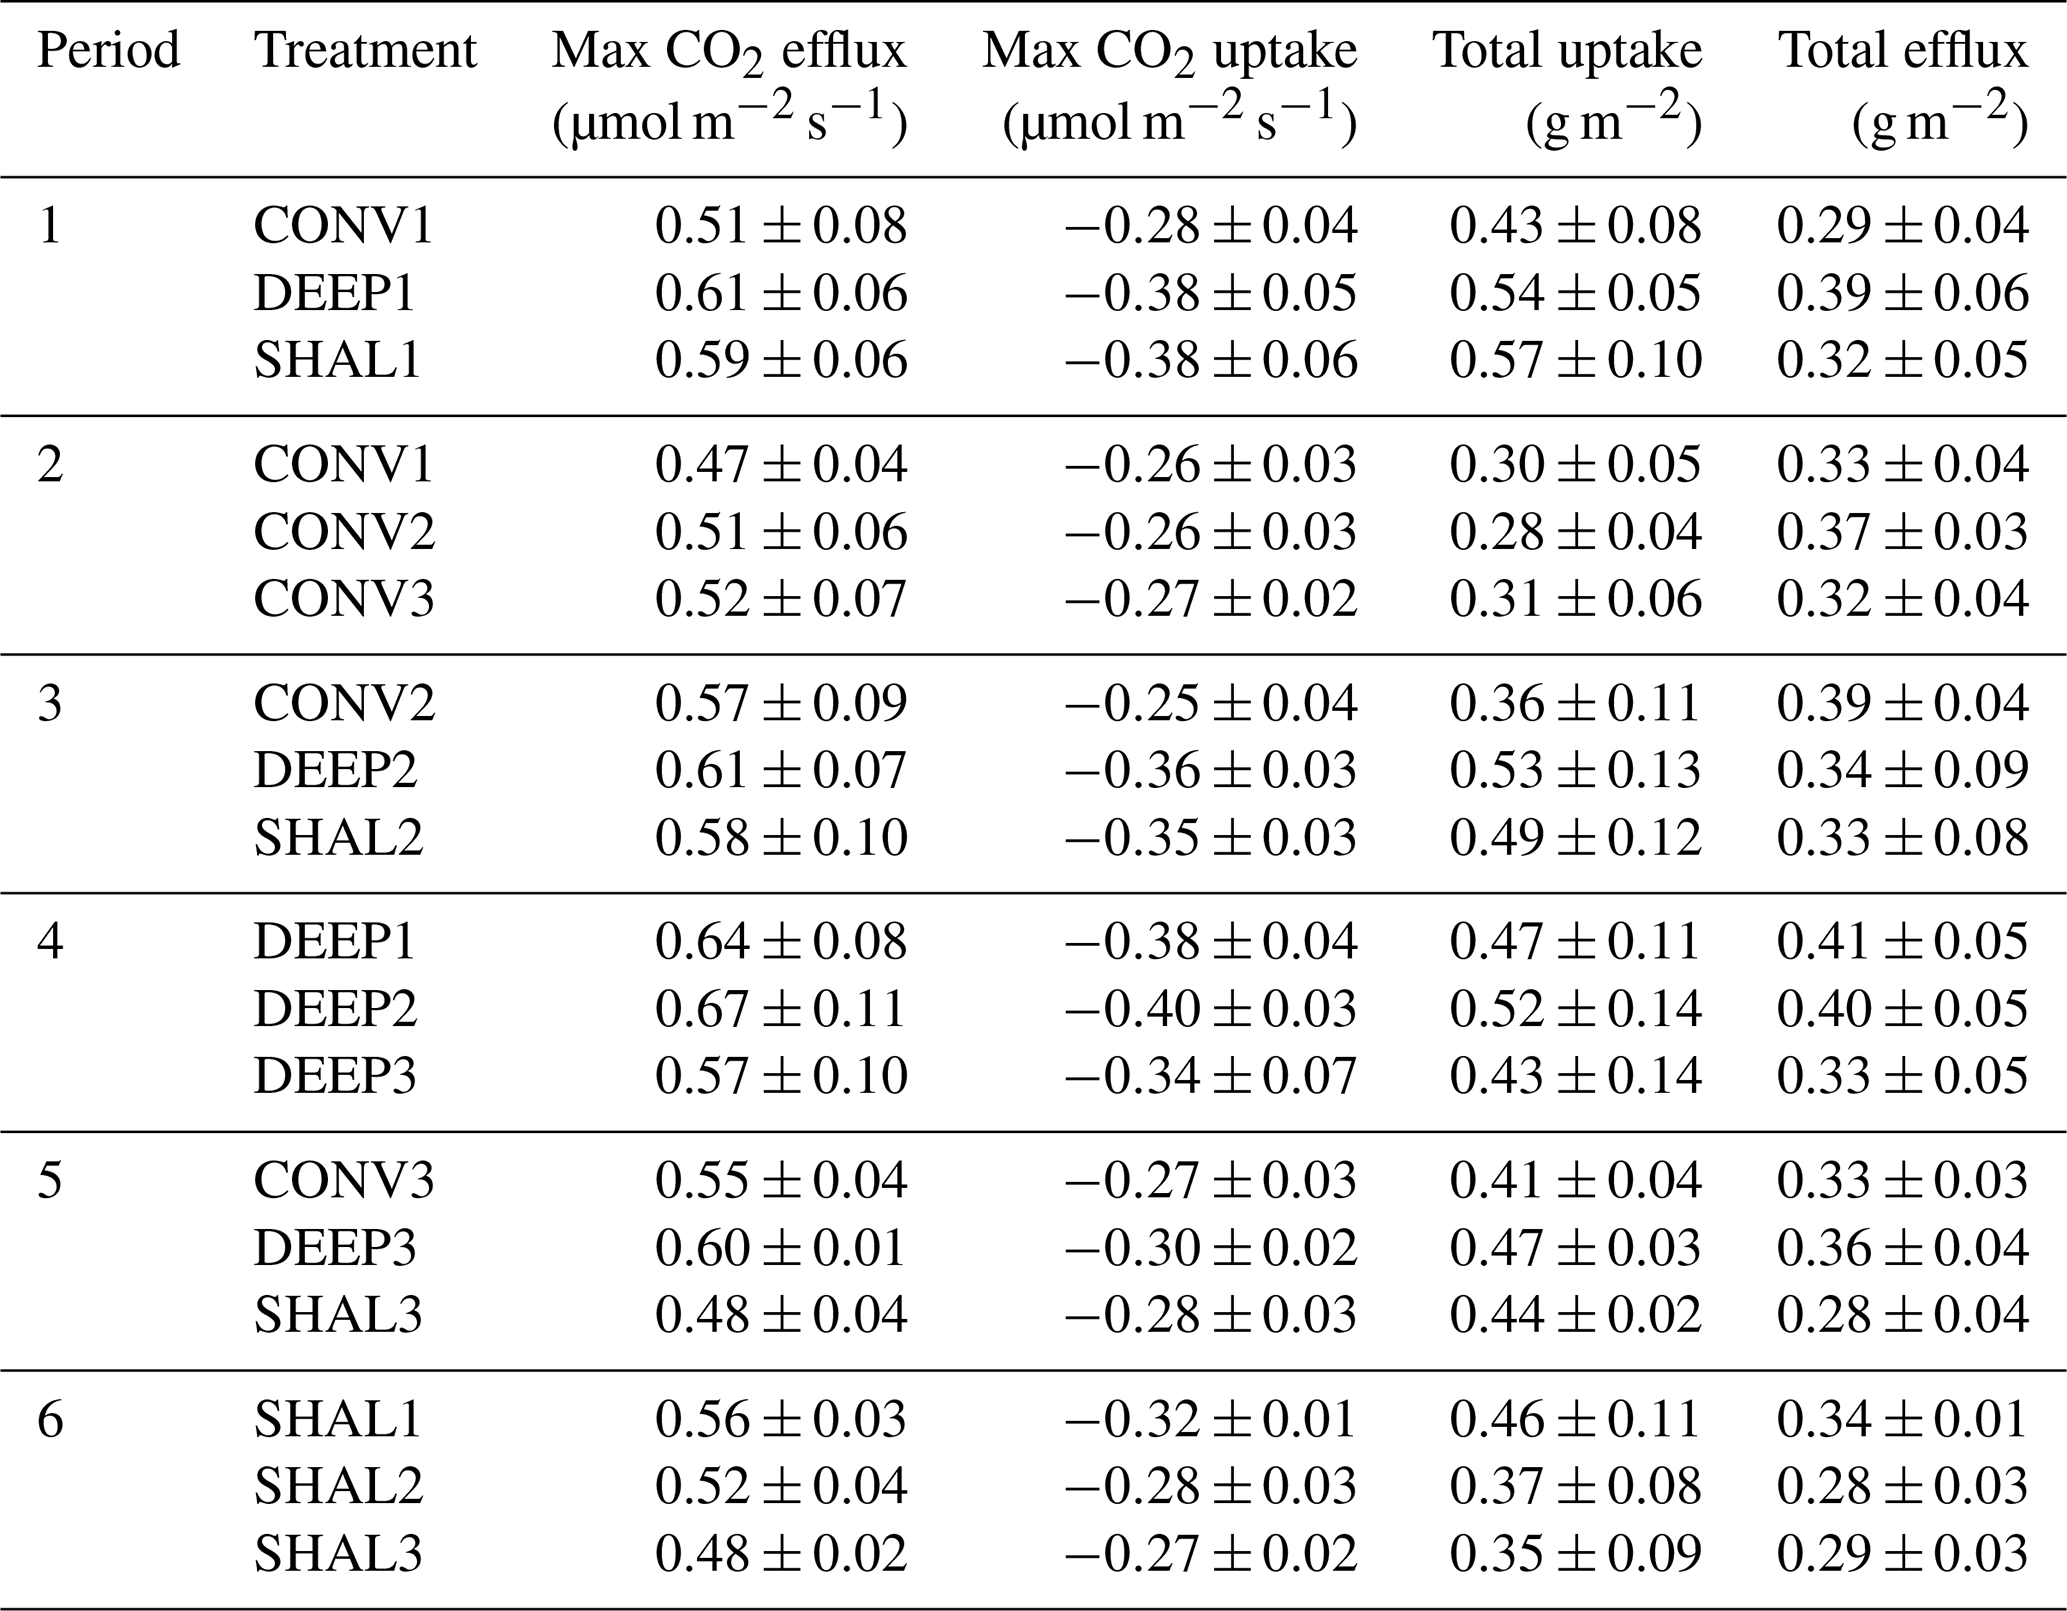
Each value in the table is an average of 5 d ± 1 standard deviation.
The mean peak daily efflux measured in the DEEP treatment differed significantly from the other two treatments (p<0.05), while no statistically significant difference in peak efflux was found for SHAL and CONV (one-way ANOVA and Tukey post hoc test). The differences between the total daily amount of CO2 emitted during the day measured in SHAL and CONV were also insignificant (p>0.05; Table 2). In contrast, the total daily amounts of CO2 taken up by the soil in the CONV collars were significantly lower than those in the SHAL and the DEEP collars (Table 2), which may lead to erroneous estimations of daily net CO2 exchange.
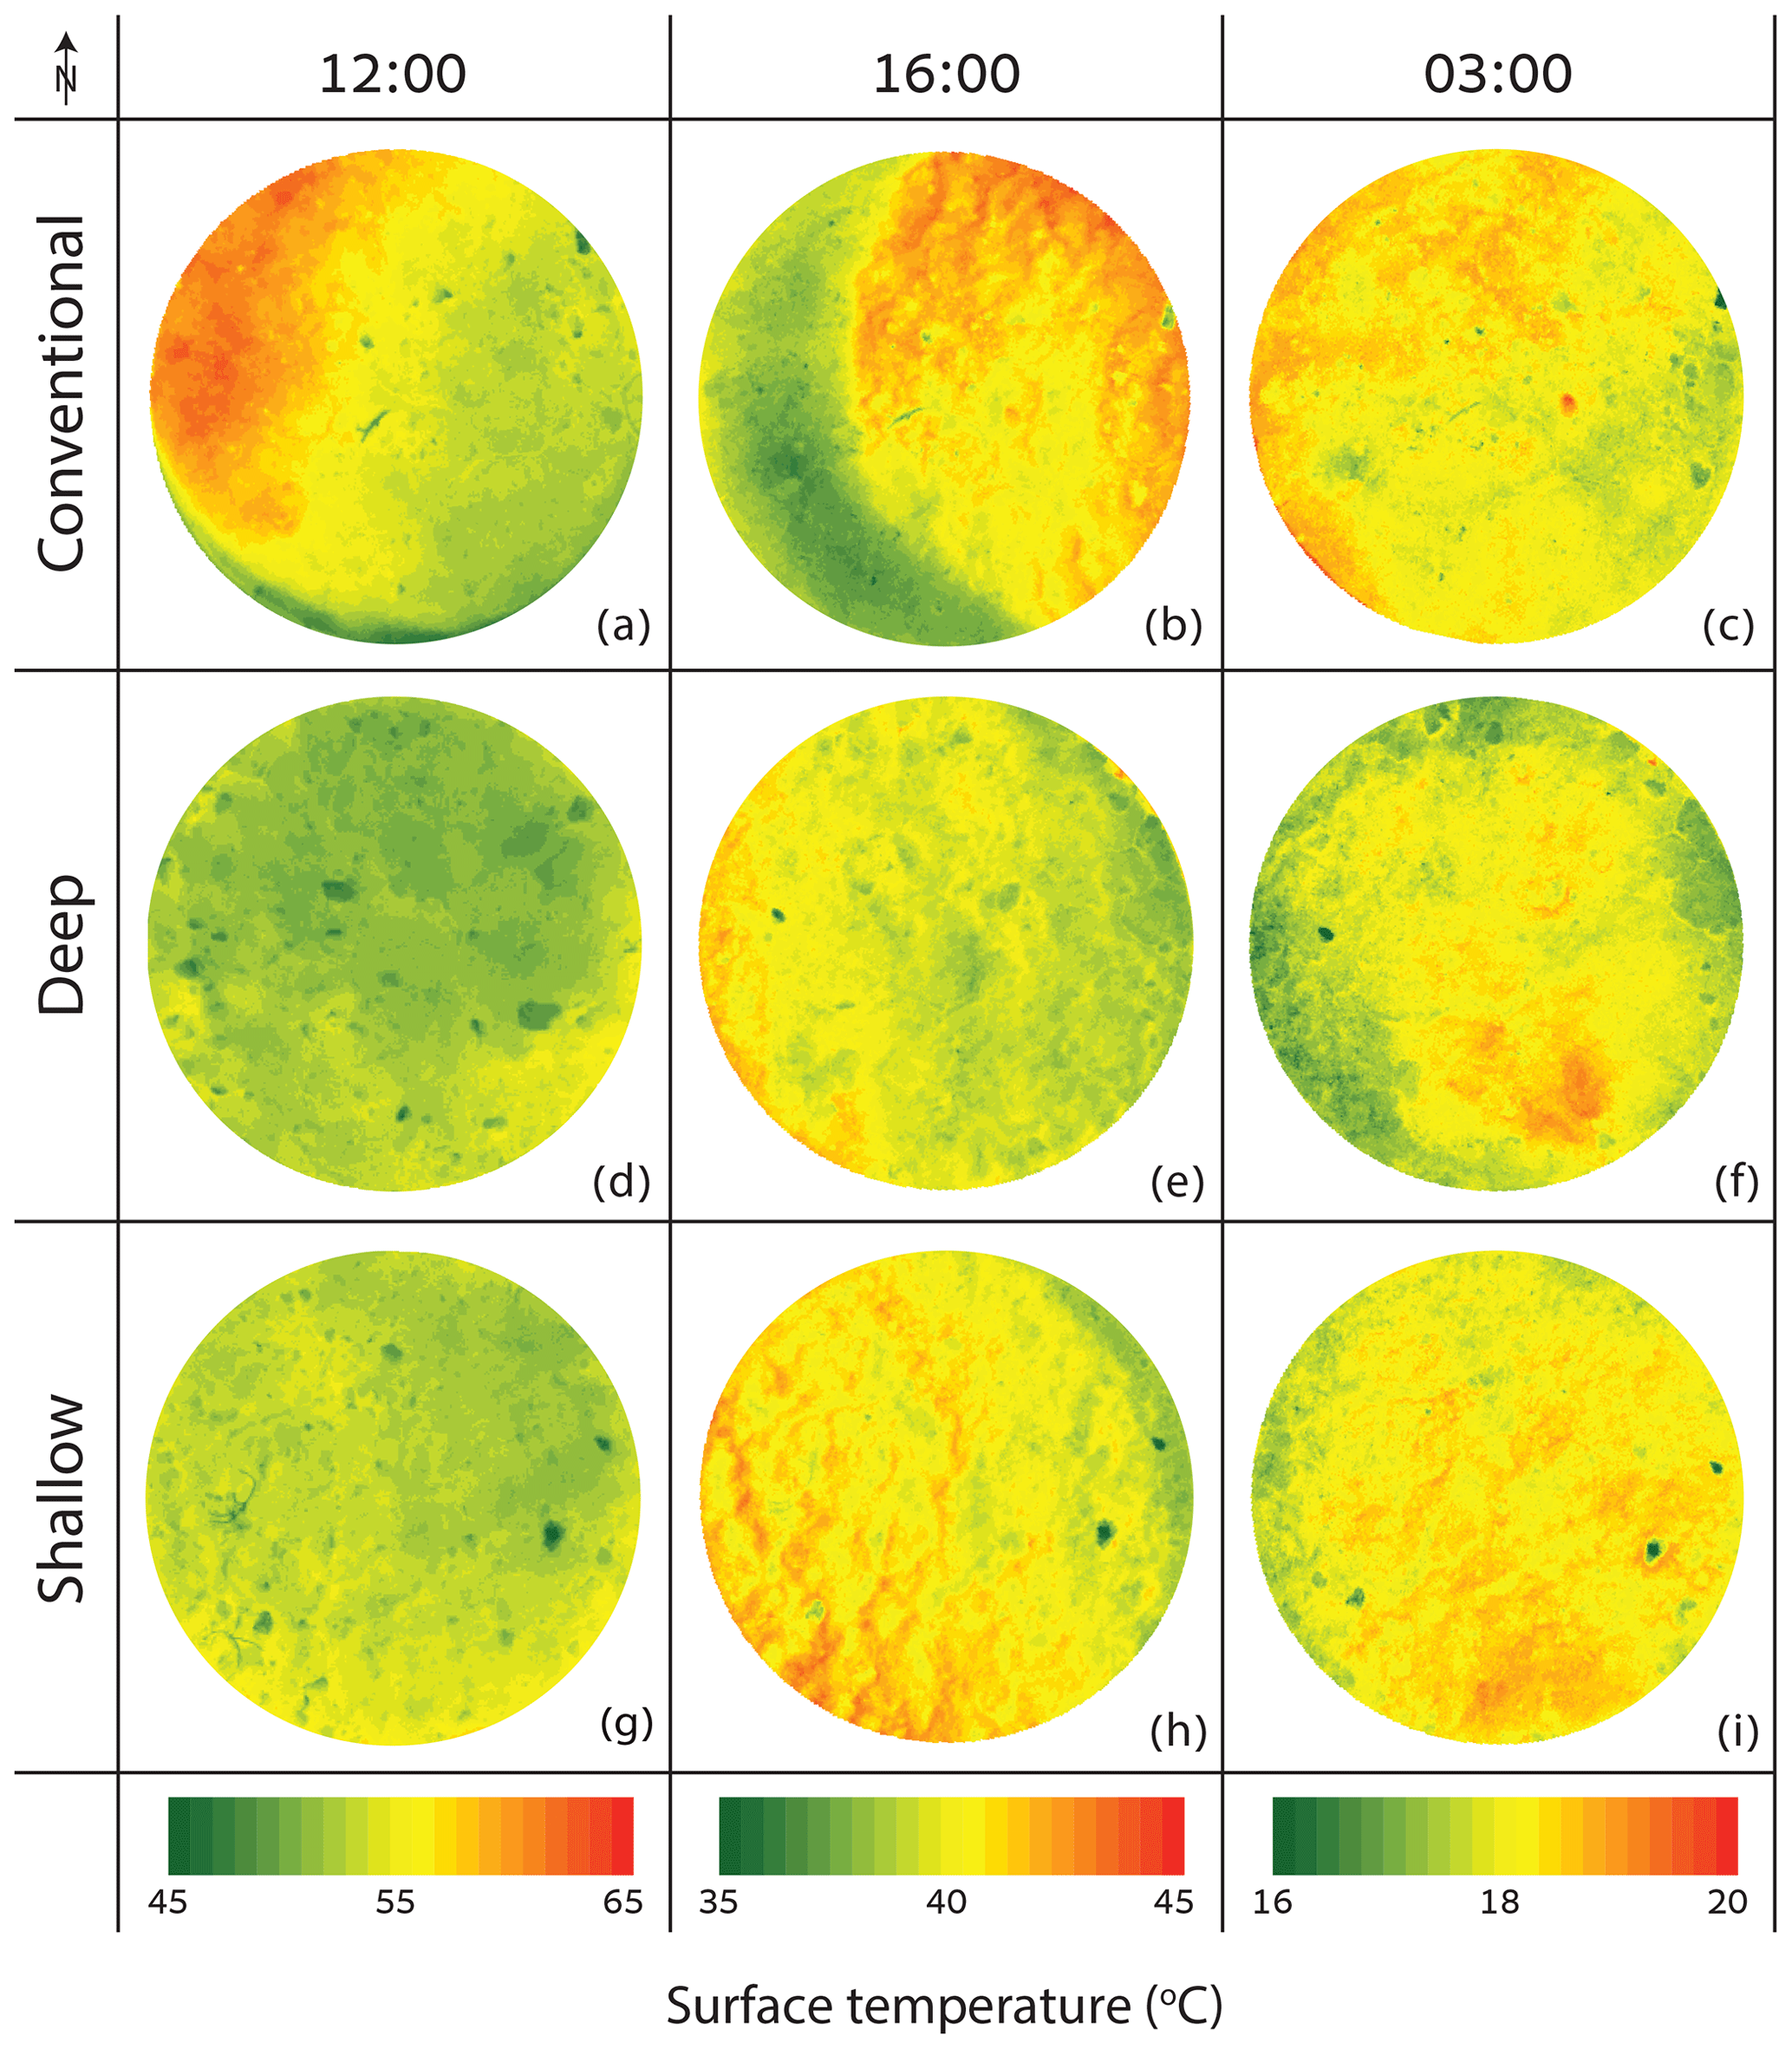
Figure 4Thermal images of the soil surface radiometric temperature of one collar for each treatment at example hours of the day. (a–c) The conventional treatment. (d–f) The deep treatment. (g–i) The shallow treatment. Note that each hour has a different temperature range.
4.3 The effect of collar type on the radiometric soil surface temperature
The mean and range of soil radiometric surface temperatures in the CONV collars were higher than in the DEEP and SHAL collars, even at midday (Fig. 4). At 16:00, the three treatments all exhibited a mean surface temperature of 40 ∘C, but the range of surface temperatures in the CONV collars was double those of the other treatments. During the night, the mean surface temperature of the CONV collars was 0.5–1 ∘C higher than in the DEEP collars and 0.5–0.9 ∘C higher than in the SHAL collars. After sunrise, the surface temperatures of DEEP and SHAL increased faster than in the CONV collars until 07:00. Later, the mean surface temperature of DEEP and SHAL maintained a similar distribution over time, while the range and mean surface temperature of CONV increased sharply (Fig. 5).
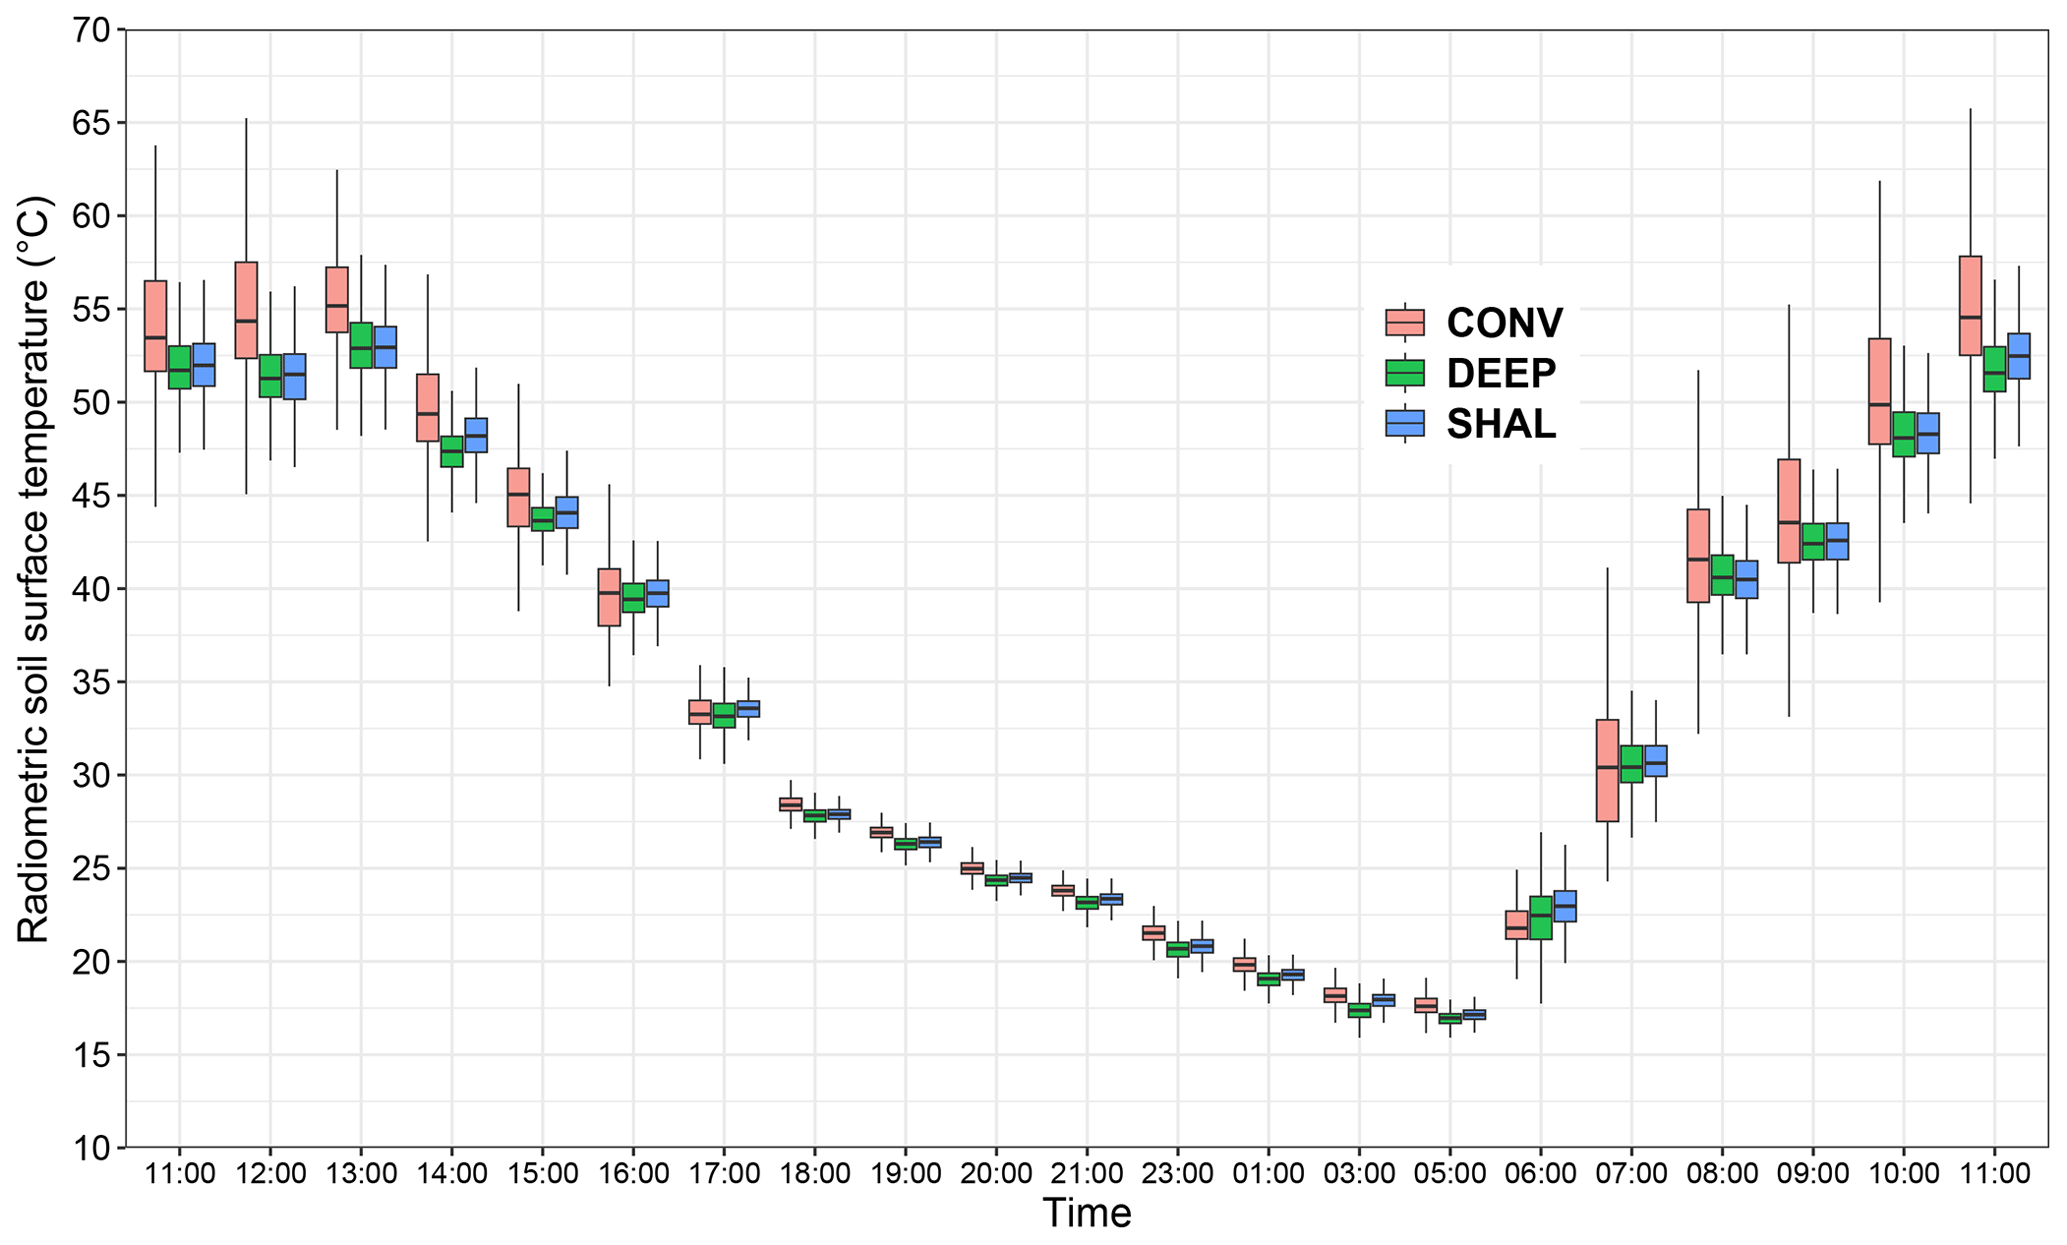
Figure 5Boxplot and whiskers of the radiometric soil surface temperatures measured in the three types of collars on 17–18 August 2021.
4.4 The effect of the soil heat flux on soil CO2 flux
Changes in soil surface temperature induced by the collar treatment significantly affected Fs. Nonetheless, Fs and soil surface temperatures were uncoupled throughout the day, and therefore soil surface temperature may not be the sole variable that explains Fs dynamics (Figs. 3 and 5). For example, while the soil surface temperature decreased throughout the night, Fs decreased until the evening (18:00) and slowly increased during the night. However, the soil surface temperature has a prime effect on the temperature profile within the soil, as well as the direction and magnitude of soil heat flux. In fact, Fig. 6 shows that Fs was linearly correlated with the soil heat flux during the night and morning efflux. Later, Fs decreased earlier than the soil heat flux, resulting in a daytime hysteresis relationship (Fig. 6b).
Our study's results indicate that in dry and bare desert soils, using collars that protrude over the soil surface (CONV) can decrease Fs. This finding is consistent with a prior global assessment that identified a negative correlation between collar height above the soil surface and mean annual soil respiration rates (Jian et al., 2020). However, while we found that protruding collars resulted in significant errors of nearly 50 % in Fs (Fig. 3 and Table 2), Jian et al. (2020) demonstrated that collar height leads to a much smaller bias of only ∼10 % in annual soil respiration rates. They explained this bias by nonuniform air mixing within the chamber system resulting from the larger system volume but did not consider the potential effect of elevated collars on soil surface temperatures. Moreover, 85 % of the annual soil respiration rate values Jian et al. (2020) used were estimated based on a limited number of instantaneous CO2 efflux measurements, which were usually performed during the daytime and, therefore, overlook diurnal dynamics in Fs. Since Fs is not constant throughout the day in desert soils but varies between daytime efflux and nocturnal uptake (Fig. 3), a small discontinuous number of daytime measurements will fail to capture errors in flux measurements. Finally, while most studies discussing potential sources of errors in Fs measurements were conducted in conditions where the dominant flux was a result of microbial respiration, in dry desert soils Fs is primarily driven by an abiotic process governed by changes in soil temperatures (Soper et al., 2017). Therefore, errors associated with using static chambers in dry desert soils are likely related to alteration of geochemical processes in the soil rather than the factors that influence soil microbial activity.
The abiotic process driving nocturnal CO2 uptake in desert soils is often explained by the combined effect of the contraction and dissolution of gaseous CO2 in soil water. These processes decrease gaseous CO2 concentration in the soil surface layer, forming an atmosphere-to-soil concentration gradient and CO2 diffusion into the soil (Yang et al., 2020; Sagi et al., 2021). Contraction of soil air may decrease CO2 concentration in the soil surface layer and lead to an atmosphere-to-soil pressure gradient and thermal convection, which further contributes to CO2 uptake (Ganot et al., 2014). Soil temperature negatively affects both contraction and dissolution. Higher temperature results in less contraction and dissolution and thus a higher CO2 concentration in the surface air-filled soil pores, ultimately leading to a smaller soil–atmosphere CO2 gradient and lower Fs. It is therefore expected that a modification of the surface temperature by the collar will affect the magnitude of the flux.
The elevated walls in the CONV collars limit nocturnal radiative cooling of the topsoil layer, resulting in higher soil temperatures that suppress the CO2 concentration gradient and the actual CO2 uptake from the atmosphere (Figs. 4 and 7). Following sunrise, soil temperature increases in the DEEP and SHAL collars, promoting CO2 expansion and outgassing from water films, rapidly increasing CO2 efflux (Fa et al., 2016). This process is delayed in the CONV collars because the surface is entirely shaded by the collar walls (Fig. 7b), resulting in a lower mean temperature and a narrower overall range of surface temperatures (Fig. 5; 06:00, and Fig. 7b). As a result, CO2 efflux increases at a slower rate (Fig. 3). When the sun elevation increases, solar radiation is reflected off the collar walls into the measured area, increasing the radiation flux in the unshaded soil surface and, consequently, increasing the mean and range of soil surface temperatures compared to the DEEP and SHAL collars (Figs. 4a and b, 5, and 7). Thus, lower surface temperatures cannot explain the significantly lower CO2 efflux measured in the CONV collars between 07:00 and 08:30. Instead, it is probably related to the significantly lower total nighttime CO2 uptake, which leads to a faster depletion of soil CO2 the following morning (Table 2).
The results of our study indicate that lateral diffusion is not a significant concern in dry, bare desert soils when the measurement period (i.e., the length of time during which the chamber is closed over the collar) is short, as demonstrated by the insignificant differences between Fs measured over the SHAL and DEEP collars. This confirms the findings of Hutchinson and Livingston (2001). Although statistically insignificant, the mean CO2 efflux in the SHAL collars was consistently lower than in the DEEP collars between 07:00 and 14:30 (Fig. 3 and Table 2). Additionally, the flux direction measured over the SHAL collars consistently changed from efflux (positive) to uptake (negative) earlier than in the other treatments and earlier than when the soil heat flux changed from positive to negative (Fig. 6). A change in the soil heat flux sign indicates that temperatures in the uppermost soil layer are decreasing, promoting the removal of gaseous CO2 from the soil air phase and followed by CO2 uptake from the atmosphere. Hence, when soil temperatures are undisturbed (e.g., by the presence of a collar), we expect the onset of CO2 uptake to coincide with the change in soil heat flux direction (Fig. 6). The only difference between the SHAL and DEEP collars was their insertion depth (for both the collars, the top end was flush with the soil surface). Root cutting, which is often suggested as an explanation for lower Fs measured over deeper collars (Heinemeyer et al., 2011), is inapplicable when the soil is sparsely vegetated. Furthermore, our results show higher Fs values when measured over deeply inserted collars (DEEP) than when measured over shallow collars (SHAL). Potential overestimation of Fs resulting from enhanced airflow along the collar walls in the DEEP collars was minimized by inserting the collars more than 2 months prior to the measurements, a sufficiently long time to allow the soil to settle around them (Hutchinson and Livingston, 2001). Lateral diffusion below the shallow collars therefore remains the most probable explanation. As suggested by Healy et al. (1996), lateral movement likely decreased the CO2 concentration in the soil top layer during CO2 efflux, decreasing the concentration gradient between the soil and the chamber headspace, resulting in an underestimation of Fs. The lower soil CO2 concentration beneath the SHAL collars caused the concentration gradient that drives the vertical flux to reverse direction toward the soil, starting CO2 uptake earlier than in the other treatments (Fig. 3).
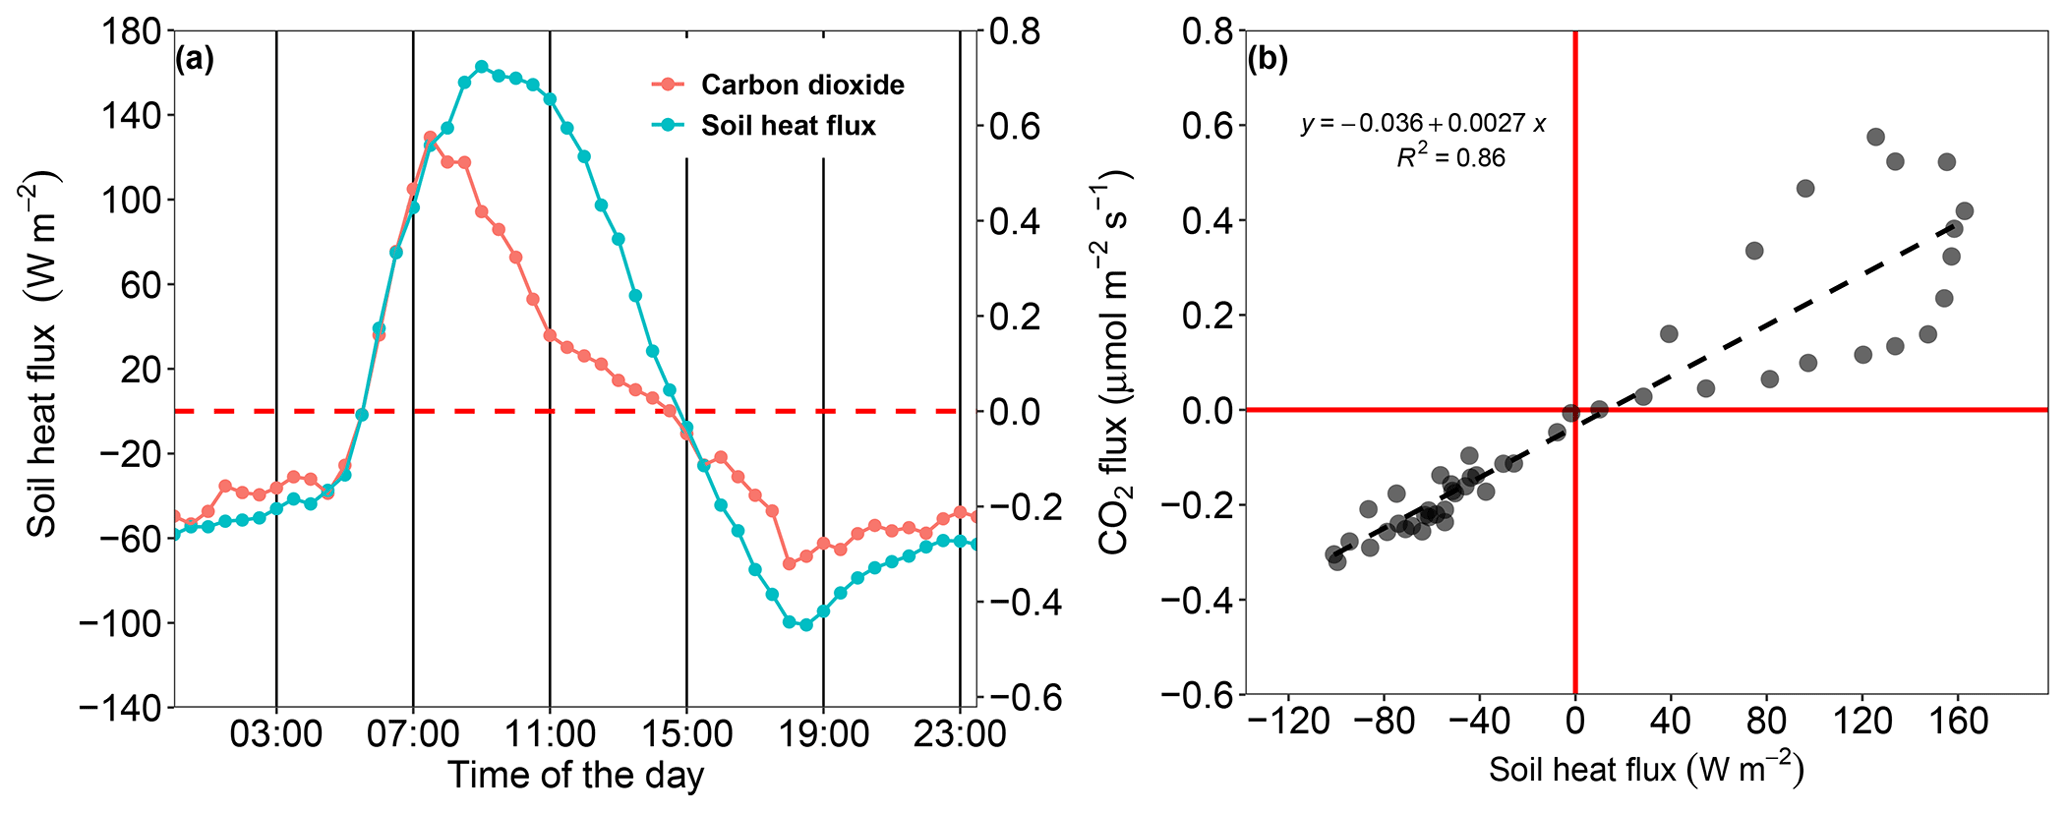
Figure 6Relationship between the mean days of Fs and the soil heat flux for period 4 (9–16 June 2021). Note that positive Fs values indicate that the direction of the flux is from the soil to the atmosphere and vice versa for negative Fs values. Positive and negative soil heat flux values indicate the opposite directions to Fs values.
The conventionally deployed collars (CONV) underestimated the instantaneous CO2 uptake and thus the total CO2 uptake during the night (Table 2). This suggests that the actual carbon sequestration by desert soils is higher than previously reported. In some cases, the net daily exchange measured in the CONV collars is even positive, indicating a net efflux of CO2 to the atmosphere (Table 2). Note, however, that the net daily values measured by the CONV collars are very small and thus more susceptible to errors, to the point of flipping the direction, leading to the conclusion that the absolute daily net values must be viewed with caution. Theoretically, if Fs in dry desert soils is derived by abiotic geochemical processes, a balanced net daily cycle would be expected, where nocturnal CO2 uptake is compensated by daytime efflux. Even in alkaline soils, such as the ones in our study site, where the nocturnal dissolution of CaCO3 may sustain CO2 uptake from the atmosphere, the reverse reaction should occur when water evaporates and CaCO3 precipitates, promoting CO2 efflux and system equilibrium (Roland et al., 2013). This hypothesis was supported by Hamerlynck et al. (2013), who found that a soil in the Chihuahuan Desert, USA, only serves as a minor carbon sink (0.88 g C m−2 accumulated over 3 months) and concluded that this contribution is insignificant to the global carbon balance. Contrarily, in the Taklamakan (Yang et al., 2020) and the Gurbantünggüt (Xie et al., 2009) deserts in China, nocturnal CO2 uptake led to a mean annual uptake of 7.11 and 62–622 g C m−2, respectively. This gave rise to the hypothesis that nocturnal CO2 uptake by desert soils might explain a substantial portion of the global missing sink. However, the authors did not provide a mechanism to explain where the carbon is stored, especially given that the leaching of dissolved carbonates to groundwater is limited in space and time (Ma et al., 2014; Schlesinger, 2017; Yang et al., 2022). Furthermore, the abiotic component of Fs contributed 21 % of mean CO2 efflux in a semi-arid pine forest located ∼35 km northeast of our study site and therefore functioned as a source for atmospheric carbon rather than as a sink in that ecosystem (Qubaja et al., 2020). Either way, no conclusions can be drawn about the role desert soils play in the global carbon balance until a methodology to measure these small fluxes is proved to be accurate. Our study shows that instantaneous Fs and Fs daily balance could be significantly affected by even as little as a few centimeters difference in collar height and depth. This implies that previous estimates of the carbon balance of desert ecosystems using static chambers need to be carefully considered.
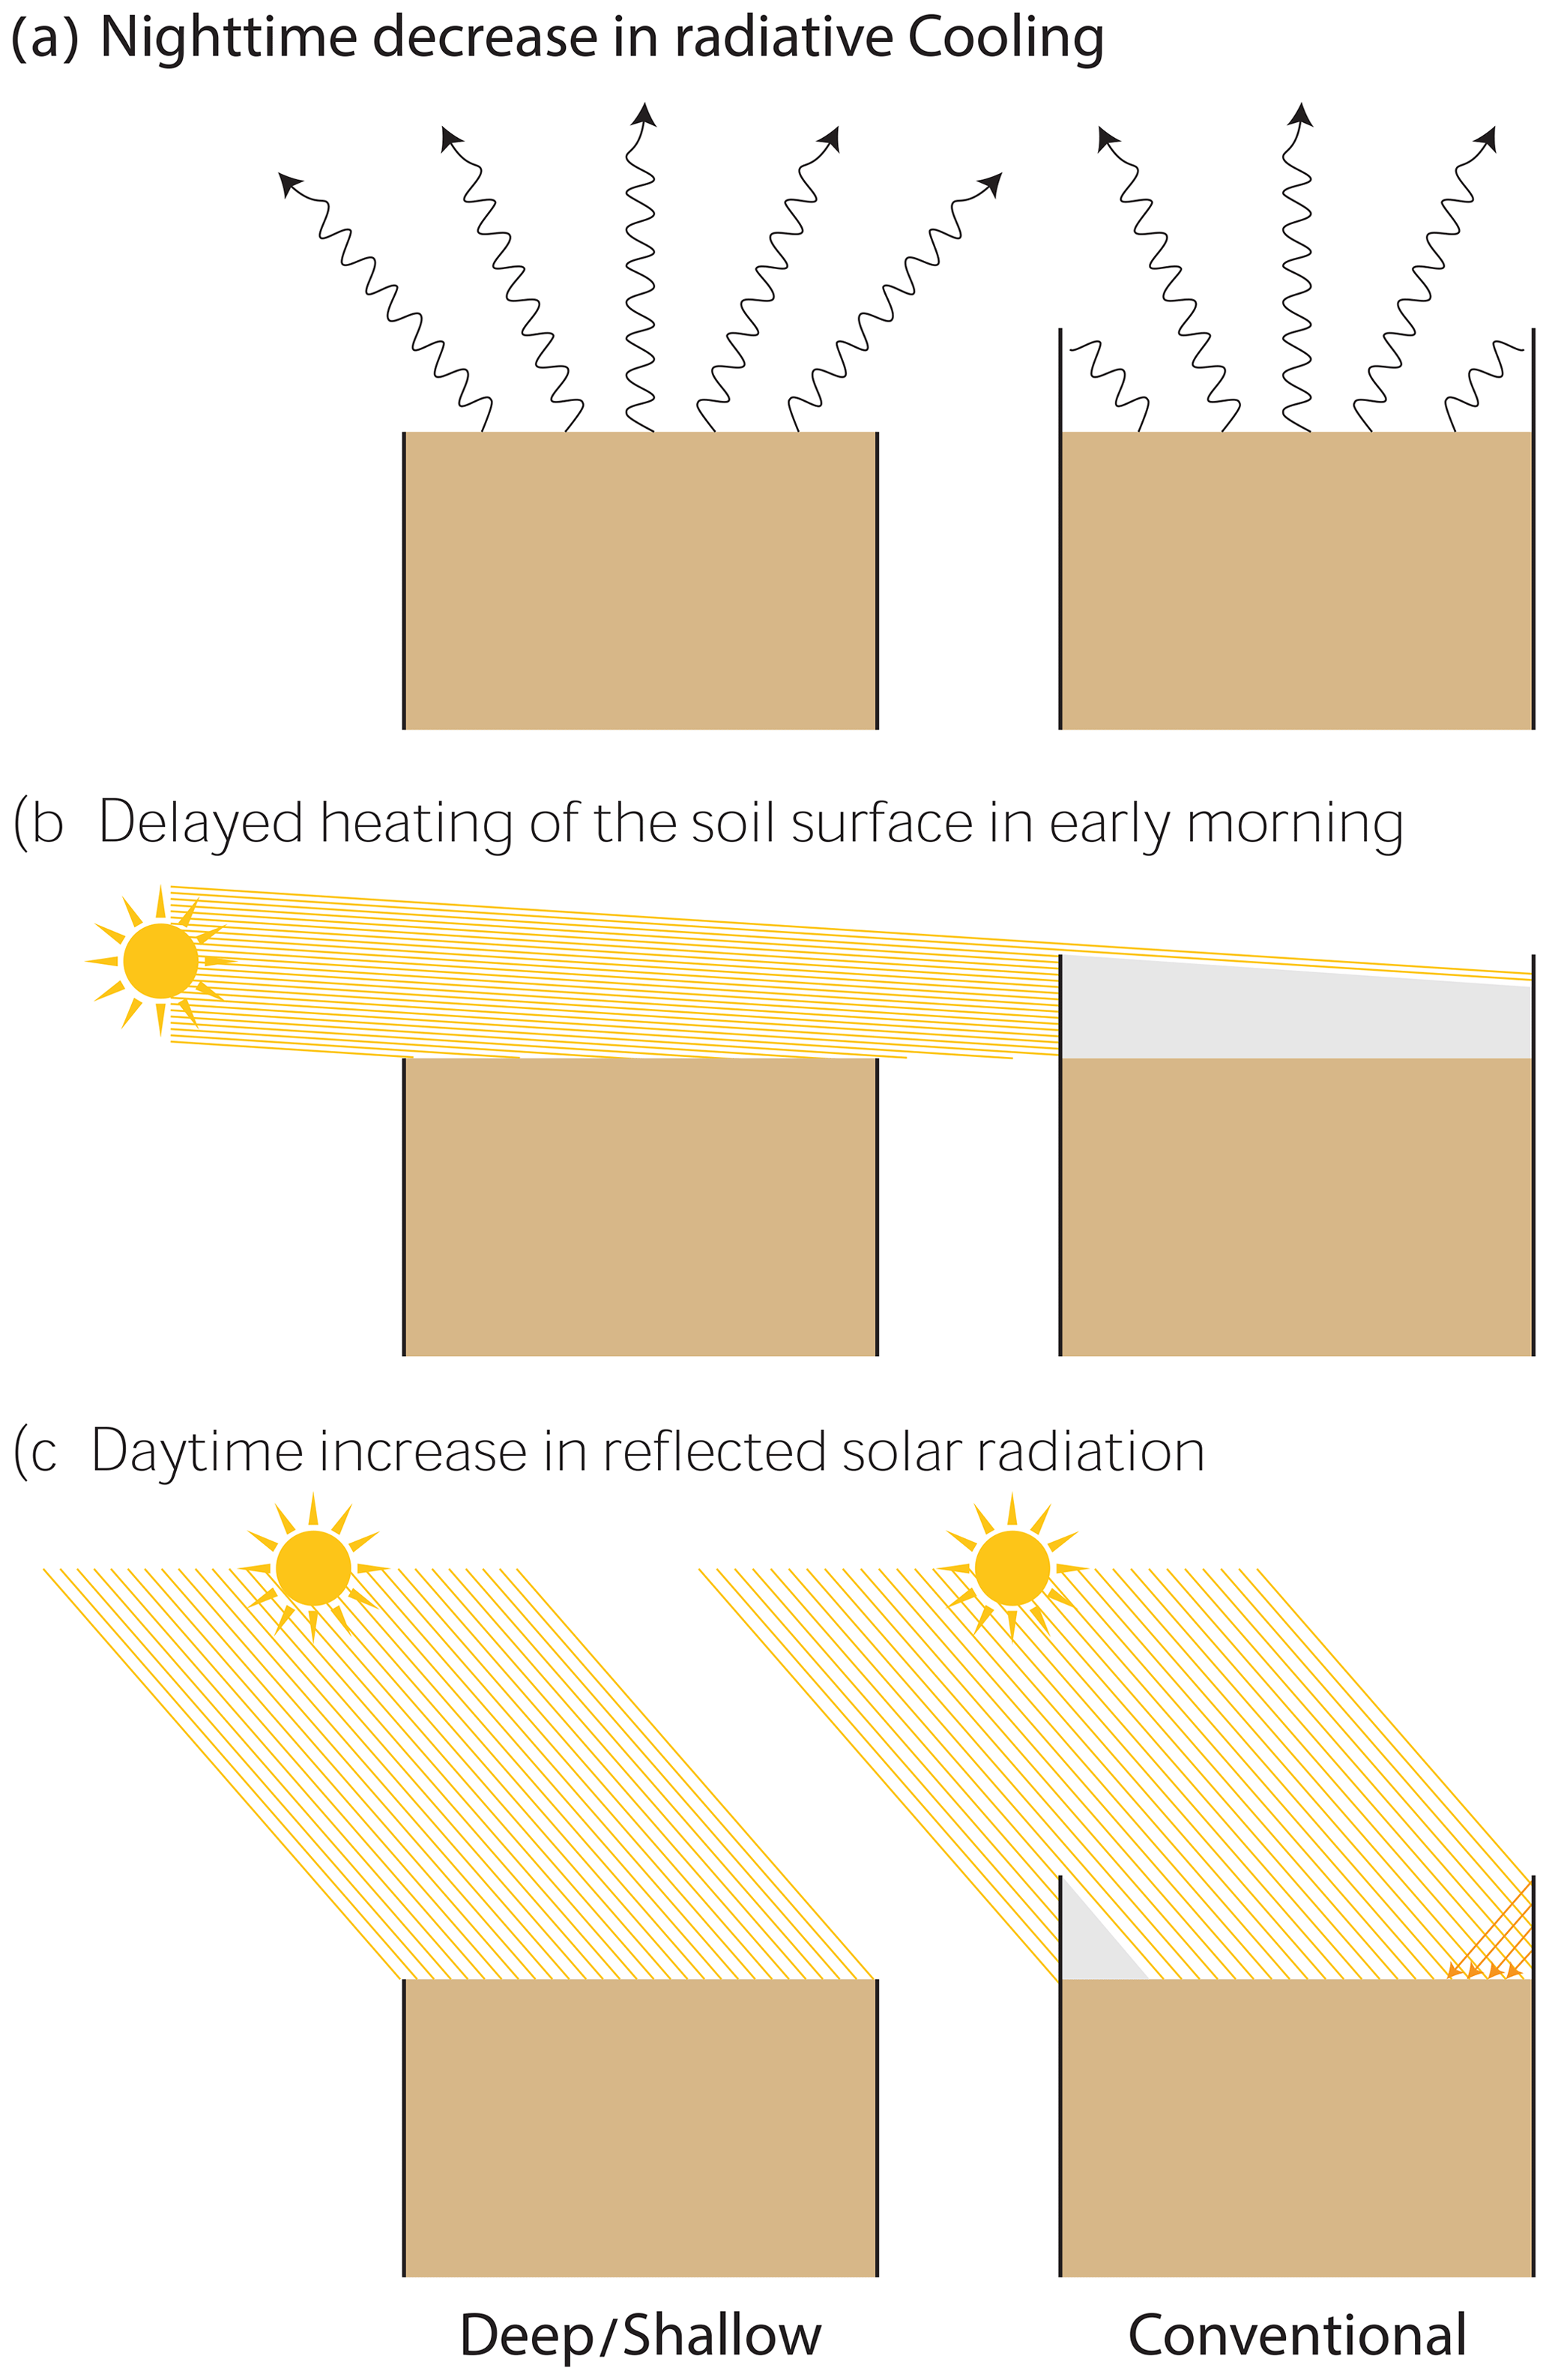
Figure 7Conceptual model showing the effects of collar deployment on soil surface radiative heating and cooling during the night (a), early morning (b), and daytime (c).
In fact, studies show that the abiotic mechanisms involved in Fs are not restricted to dry desert conditions but rather play a significant role in Fs in deserts under wet soil conditions (Fa et al., 2016). This was found for both a semi-arid pine forest (Qubaja et al., 2020) and a temperate grassland (Plestenjak et al., 2012). Hence, the collar disruption to abiotic processes likely affects the carbon balance in various ecosystems beyond the scope of deserts during the dry season. Alteration of Fs due to collar insertion is not restricted to abiotic processes. The soil biological processes, especially activity of the biological soil crust, may be significantly affected by altered soil surface conditions. Since they cover a vast area of Earth's drylands and play a significant role in desert ecosystems' carbon balance (Wilske et al., 2008), it is important to consider these effects.
The drivers of abiotic soil CO2 flux observed in dry desert soils are still far from being understood. Further research is needed to reconcile the discrepancy between the theoretical basis, which suggests a balanced daily cycle, and field measurements, which often show net uptake by the soil on both diel and annual scales. Particularly, studies should focus on improving our understanding of CO2 in the soil profile in desert soils and on allocating the sources of water that are assumed to act as a solvent for CO2 even when the soil is dry. None of these questions, however, can be addressed without an accurate methodology to measure the small Fs values that characterize bare desert soils.
During a 2-month measurement period in the summer of 2021, the soil in the Wadi Mashash experimental farm exhibited a repetitive diel cycle of CO2 flux that consisted of nocturnal CO2 uptake and daytime efflux, driven by a combination of physical and geochemical processes in the soil. We show here for the first time that collar deployment practices significantly affect this abiotic diel cycle by altering the factors that drive Fs. Notably, morning CO2 efflux and nocturnal CO2 uptake were underestimated when measured on conventionally inserted collars because the elevated collar walls distorted the ambient surface temperature regime. We conclude that in bare desert soils, collars should be deployed flush with the soil surface to prevent distortion of heat exchange between the soil and the atmosphere and between soil layers, two important drivers of the abiotic Fs. Lateral diffusion under shallow collars may occur and affect temporal dynamics. However, we found this to be of a lesser concern in compact soils and over short measurement periods. Still, in dry desert soils, the collar insertion depth should exceed the depth at which the fluctuations in soil CO2 concentration that drive Fs occur, roughly 2 cm (Hamerlynck et al., 2013).
Deployment protocols of flux chambers should be adapted to the unique characteristics of desert soils rather than follow standard procedures suitable for mesic environments. We conclude that using collars with at least 3 cm length inserted flush with the soil surface will minimize measurement errors of CO2 flux and will pave the way to accurate estimates of the carbon balance of desert ecosystems.
Code and data will be provided upon request.
NB: conceptualization, data curation, formal analysis, investigation, methodology, and writing (original draft). NA: conceptualization, funding acquisition, methodology, project administration, resources, supervision, and writing (review and editing).
The contact author has declared that neither of the authors has any competing interests.
Publisher's note: Copernicus Publications remains neutral with regard to jurisdictional claims in published maps and institutional affiliations.
This research was supported by the Israel Science Foundation (grant number 2381/21).
This research has been supported by the Israel Science Foundation (grant no. 2381/21).
This paper was edited by Ivonne Trebs and reviewed by two anonymous referees.
Austin, A. T., Yahdjian, L., Stark, J. M., Belnap, J., Porporato, A., Norton, U., Ravetta, D. A., and Schaeffer, S. M.: Water pulses and biogeochemical cycles in arid and semiarid ecosystems, Oecologia, 141, 221–235, https://doi.org/10.1007/s00442-004-1519-1, 2004.
Bain, W. G., Hutyra, L., Patterson, D. C., Bright, A. V., Daube, B. C., Munger, J. W., and Wofsy, S. C.: Wind-induced error in the measurement of soil respiration using closed dynamic chambers, Agric. For. Meteorol., 131, 225–232, https://doi.org/10.1016/j.agrformet.2005.06.004, 2005.
Ball, B. A., Virginia, R. A., Barrett, J. E., Parsons, A. N., and Wall, D. H.: Interactions between physical and biotic factors influence CO2 flux in Antarctic dry valley soils, Soil Biol. Biochem., 41, 1510–1517, https://doi.org/10.1016/j.soilbio.2009.04.011, 2009.
Baram, S., Bar-Tal, A., Gal, A., Friedman, S. P., and Russo, D.: The effect of static chamber base on N2O flux in drip irrigation, Biogeosciences, 19, 3699–3711, https://doi.org/10.5194/bg-19-3699-2022, 2022.
Brutsaert, W.: Evaporation into the Atmosphere, https://doi.org/10.1007/978-94-017-1497-6, 1982.
Cable, J. M., Ogle, K., Williams, D. G., Weltzin, J. F., and Huxman, T. E.: Soil texture drives responses of soil respiration to precipitation pulses in the sonoran desert: Implications for climate change, Ecosystems, 11, 961–979, https://doi.org/10.1007/s10021-008-9172-x, 2008.
Cable, J. M., Ogle, K., Lucas, R. W., Huxman, T. E., Loik, M. E., Smith, S. D., Tissue, D. T., Ewers, B. E., Pendall, E., Welker, J. M., Charlet, T. N., Cleary, M., Griffith, A., Nowak, R. S., Rogers, M., Steltzer, H., Sullivan, P. F., and van Gestel, N. C.: The temperature responses of soil respiration in deserts: A seven desert synthesis, Biogeochemistry, 103, 71–90, https://doi.org/10.1007/s10533-010-9448-z, 2011.
Fa, K. Y., Zhang, Y. Q., Wu, B., Qin, S. G., Liu, Z., and She, W. W.: Patterns and possible mechanisms of soil CO2 uptake in sandy soil, Sci. Total Environ., 544, 587–594, https://doi.org/10.1016/j.scitotenv.2015.11.163, 2016.
Fa, K., Zhang, Y., Lei, G., Wu, B., Qin, S., Liu, J., Feng, W., and Lai, Z.: Underestimation of soil respiration in a desert ecosystem, Catena, 162, 23–28, https://doi.org/10.1016/j.catena.2017.11.019, 2018.
Ganot, Y., Dragila, M. I., and Weisbrod, N.: Impact of thermal convection on CO2 flux across the earth-atmosphere boundary in high-permeability soils, Agric. For. Meteorol., 184, 12–24, https://doi.org/10.1016/j.agrformet.2013.09.001, 2014.
Hamerlynck, E. P., Scott, R. L., Sánchez-Cañete, E. P., and Barron-Gafford, G. A.: Nocturnal soil CO2 uptake and its relationship to subsurface soil and ecosystem carbon fluxes in a Chihuahuan Desert shrubland, J. Geophys. Res.-Biogeo., 118, 1593–1603, https://doi.org/10.1002/2013JG002495, 2013.
Healy, R. W., Striegl, R. G., Russell, T. F., Hutchinson, G. L., and Livingston, G. P.: Numerical Evaluation of Static-Chamber Measurements of Soil-Atmosphere Gas Exchange: Identification of Physical Processes, Soil Sci. Soc. Am. J., 60, 740–747, https://doi.org/10.2136/sssaj1996.03615995006000030009x, 1996.
Heinemeyer, A., Di Bene, C., Lloyd, A. R., Tortorella, D., Baxter, R., Huntley, B., Gelsomino, A., and Ineson, P.: Soil respiration: Implications of the plant-soil continuum and respiration chamber collar-insertion depth on measurement and modelling of soil CO2 efflux rates in three ecosystems, Eur. J. Soil Sci., 62, 82–94, https://doi.org/10.1111/j.1365-2389.2010.01331.x, 2011.
Hillel, D: Environmental Soil Physics, Academic Press, San Diego, CA, USA, 771 pp., ISBN 78-0-12-348525-0, 1998.
Houghton, R. A.: Balancing the global carbon budget, Annu. Rev. Earth Planet. Sc., 35, 313–347, https://doi.org/10.1146/annurev.earth.35.031306.140057, 2007.
Jian, J., Gough, C., Sihi, D., Hopple, A. M., and Bond-Lamberty, B.: Collar Properties and Measurement Time Confer Minimal Bias Overall on Annual Soil Respiration Estimates in a Global Database, J. Geophys. Res.-Biogeo., 125, 1–13, https://doi.org/10.1029/2020JG006066, 2020.
Li, Z. L., Wu, H., Wang, N., Qiu, S., Sobrino, J. A., Wan, Z., Tang, B. H., and Yan, G.: Land surface emissivity retrieval from satellite data, Int. J. Remote Sens., 34, 3084–3127, https://doi.org/10.1080/01431161.2012.716540, 2013.
Lopez-Canfin, C., Lázaro, R., and Sánchez-Cañete, E. P.: Water vapor adsorption by dry soils: A potential link between the water and carbon cycles, Sci. Total Environ., 824, 153746, https://doi.org/10.1016/j.scitotenv.2022.153746, 2022.
Lund, C. P., Riley, W. J., Pierce, L. L., and Field, C. B.: The effects of chamber pressurization on soil-surface CO2 flux and the implications for NEE measurements under elevated CO2, Glob. Chang. Biol., 5, 269–281, https://doi.org/10.1046/j.1365-2486.1999.00218.x, 1999.
Ma, J., Liu, R., Tang, L.-S., Lan, Z.-D., and Li, Y.: A downward CO2 flux seems to have nowhere to go, Biogeosciences, 11, 6251–6262, https://doi.org/10.5194/bg-11-6251-2014, 2014.
Ngao, J., Longdoz, B., Perrin, D., Vincent, G., Epron, D., Le Dantec, V., Soudani, K., Aubinet, M., Willim, F., and Granier, A.: Cross-calibration functions for soil CO2 efflux measurement systems, Ann. For. Sci., 63, 477–484, https://doi.org/10.1051/forest:2006028, 2006.
Ninari, N. and Berliner, P. R.: The role of dew in the water and heat balance of bare loess soil in the Negev Desert: Quantifying the actual dew deposition on the soil surface, Atmos. Res., 64, 323–334, https://doi.org/10.1016/S0169-8095(02)00102-3, 2002.
Parkin, T. B., Venterea, R. T., and Hargreaves, S. K.: Calculating the Detection Limits of Chamber-based Soil Greenhouse Gas Flux Measurements, J. Environ. Qual., 41, 705–715, https://doi.org/10.2134/jeq2011.0394, 2012.
Parsons, A. N., Barrett, J. E., Wall, D. H., and Virginia, R. A.: Soil Carbon Dioxide Flux in Antarctic Dry Valley Ecosystems, Ecosystems, 286–295, https://doi.org/10.1007/s10021-003-0132-1, 2004.
Plestenjak, G., Eler, K., and Vodnik, D.: Sources of soil CO2 in calcareous grassland with woody plant encroachment, J. Soils Sediments, 12, 1327–1338, https://doi.org/10.1007/s11368-012-0564-3, 2012.
Pumpanen, J., Kolari, P., Ilvesniemi, H., Minkkinen, K., Vesala, T., Niinistö, S., Lohila, A., Larmola, T., Morero, M., Pihlatie, M., Janssens, I., Yuste, J. C., Grünzweig, J. M., Reth, S., Subke, J. A., Savage, K., Kutsch, W., Østreng, G., Ziegler, W., Anthoni, P., Lindroth, A., and Hari, P.: Comparison of different chamber techniques for measuring soil CO2 efflux, Agric. For. Meteorol., 123, 159–176, https://doi.org/10.1016/j.agrformet.2003.12.001, 2004.
Pumpanen, J., Longdoz, B., and Kutsch, W. L.: Field measurements of soil respiration: Principles and constraints, potentials and limitations of different methods, Soil Carbon Dyn. An Integr. Methodol., 16–33, https://doi.org/10.1017/CBO9780511711794.003, 2010.
Qubaja, R., Tatarinov, F., Rotenberg, E., and Yakir, D.: Partitioning of canopy and soil CO2 fluxes in a pine forest at the dry timberline across a 13-year observation period, Biogeosciences, 17, 699–714, https://doi.org/10.5194/bg-17-699-2020, 2020.
Rochette, P. and Eriksen-Hamel, N. S.: Chamber Measurements of Soil Nitrous Oxide Flux: Are Absolute Values Reliable?, Soil Sci. Soc. Am. J., 72, 331–342, https://doi.org/10.2136/sssaj2007.0215, 2008.
Roland, M., Serrano-Ortiz, P., Kowalski, A. S., Goddéris, Y., Sánchez-Cañete, E. P., Ciais, P., Domingo, F., Cuezva, S., Sanchez-Moral, S., Longdoz, B., Yakir, D., Van Grieken, R., Schott, J., Cardell, C., and Janssens, I. A.: Atmospheric turbulence triggers pronounced diel pattern in karst carbonate geochemistry, Biogeosciences, 10, 5009–5017, https://doi.org/10.5194/bg-10-5009-2013, 2013.
Sagi, N., Zaguri, M., and Hawlena, D.: Soil CO2 influx in drylands: A conceptual framework and empirical examination, Soil Biol. Biochem., 156, 108209, https://doi.org/10.1016/j.soilbio.2021.108209, 2021.
Schlesinger, W. H.: An evaluation of abiotic carbon sinks in deserts, Glob. Chang. Biol., 23, 25–27, https://doi.org/10.1111/gcb.13336, 2017.
Soper, F. M., McCalley, C. K., Sparks, K., and Sparks, J. P.: Soil carbon dioxide emissions from the Mojave desert: Isotopic evidence for a carbonate source, Geophys. Res. Lett., 44, 245–251, https://doi.org/10.1002/2016GL071198, 2017.
Spyroglou, I., Skalák, J., Balakhonova, V., Benedikty, Z., Rigas, A. G., and Hejátko, J.: Mixed models as a tool for comparing groups of time series in plant sciences, Plants, 10, 1–16, https://doi.org/10.3390/plants10020362, 2021.
Stell, E., Warner, D., Jian, J., Bond-Lamberty, B., and Vargas, R.: Spatial biases of information influence global estimates of soil respiration: How can we improve global predictions?, Glob. Chang. Biol., 27, 3923–3938, https://doi.org/10.1111/gcb.15666, 2021.
Wilske, B., Burgheimer, J., Karnieli, A., Zaady, E., Andreae, M. O., Yakir, D., and Kesselmeier, J.: The CO2 exchange of biological soil crusts in a semiarid grass-shrubland at the northern transition zone of the Negev desert, Israel, Biogeosciences, 5, 1411–1423, https://doi.org/10.5194/bg-5-1411-2008, 2008.
Xie, J., Li, Y., Zhai, C., Li, C., and Lan, Z.: CO2 absorption by alkaline soils and its implication to the global carbon cycle, Environ. Geol., 56, 953–961, https://doi.org/10.1007/s00254-008-1197-0, 2009.
Yang, F., Huang, J., He, Q., Zheng, X., Zhou, C., Pan, H., Huo, W., Yu, H., Liu, X., Meng, L., Han, D., Ali, M., and Yang, X.: Impact of differences in soil temperature on the desertcarbon sink, Geoderma, 379, 114636, https://doi.org/10.1016/j.geoderma.2020.114636, 2020.
Yang, F., Huang, J., Zheng, X., Huo, W., Zhou, C., Wang, Y., Han, D., Gao, J., Mamtimin, A., Yang, X., and Sun, Y.: Evaluation of carbon sink in the Taklimakan Desert based on correction of abnormal negative CO2 flux of IRGASON, Sci. Total Environ., 838, 155988, https://doi.org/10.1016/j.scitotenv.2022.155988, 2022.