the Creative Commons Attribution 4.0 License.
the Creative Commons Attribution 4.0 License.
 | 25 Sep 2023
Diel and seasonal methane dynamics in the shallow and turbulent Wadden Sea
Anne Margriet Mol
Katherine Mesdag
Pierre Ramond
Rachel Ndhlovu
Julia Catherine Engelmann
Thomas Röckmann
Helge Niemann
The Wadden Sea is a coastal system along the fringe of the land–sea borders of Denmark, Germany and the Netherlands. The Wadden Sea is extremely productive and influenced by strong variations in physical and biological forcing factors that act on timescales of hours to seasons. Productive coastal seas are known to dominate the ocean's methane emission to the atmosphere, but knowledge of controls and temporal variations in methane dynamics in these vastly dynamic systems is scarce. Here we address this knowledge gap by measuring methane inventories and methanotrophic activity at a temporal resolution of 1 h over a period of 2 d, repeatedly during four successive seasons in the central Dutch Wadden Sea. We found that methane dynamics varied between colder and warmer seasons, with generally higher water column methane concentrations and methanotrophic activity in the warmer seasons. The efflux of methane to the atmosphere was, on the other hand, lower in the warmer seasons because of lower wind speeds. On a diel scale, tides controlled methanotrophic activity, which increased ∼40 % at low tide compared to high tide. We estimate that methane oxidizing bacteria reduce the methane budget of the Dutch Wadden Sea by only 2 %, while escapes to the atmosphere and are flushed out into the open North Sea at ebb tide. Our findings indicate that tides play a key role in controlling methane dynamics and methanotrophic activity and highlight the importance of high-resolution and repeated sampling strategies to resolve methane dynamics in fast-changing coastal systems.
- Article
(5202 KB) - Full-text XML
-
Supplement
(563 KB) - BibTeX
- EndNote


Methane and methane oxidation
Atmospheric methane (CH4) concentrations have been increasing since industrial times, surpassing 1900 ppb in 2021 (Lan et al., 2022) and contributing more than 20 % of total radiative forcing in the atmosphere (Etminan et al., 2016). Due to its relatively short atmospheric lifetime of ∼10 years (Canadell et al., 2021), reducing methane emissions to the atmosphere could play a key role in global warming mitigation strategies. However, the implementation of such strategies requires a thorough understanding of methane sources and sinks. Anthropogenic methane emissions (336–376 Tg yr−1) are rather well constrained and constitute ∼60 % of the total atmospheric budget (Saunois et al., 2020). Individual natural sources, on the other hand, are associated with comparably large uncertainties. This is particularly true for methane emissions originating from marine environments (5 to 28 Tg CH4 yr−1; Rosentreter et al., 2021).
The inner shelf (0–50 m water depth) only accounts for ∼3 % of the global ocean surface but is the main source of marine methane emissions to the atmosphere (Weber et al., 2019). In these shallow ecosystems, light availability as well as terrestrial inputs of nutrients support a high diversity of producers and consumers that generate huge quantities of organic matter (Philippart et al., 2009; Beck and Brumsack, 2012). Consequently, rates of organic-matter degradation, including methanogenesis in anoxic sediments are high, often leading to elevated levels of free and dissolved methane in sediments and porewaters (Bange et al., 1994; Røy et al., 2008; Wu et al., 2015). Transport of methane-rich porewaters and the ebullition of methane bubbles, in return, lead to elevated methane concentrations in the water column (Reeburgh, 2007; Grunwald et al., 2009; James et al., 2016). It is estimated that ∼5 % of shelf sea surface waters have methane concentrations above 100 nM (Weber et al., 2019). Nevertheless, a substantial amount of dissolved methane is oxidized by aerobic methanotrophic bacteria (MOB), which mediate the aerobic oxidation of methane (MOx) (Reeburgh, 2007):
Similar to other metabolic processes involving small molecules, MOx discriminates against isotopically heavy methane (i.e. containing 13C and 2H (D) instead of 12C and 1H) so that the residual methane pool successively becomes 13C and D enriched as a result of ongoing MOx (Barker and Fritz, 1981; Whiticar, 1999).
MOB typically belong to the Gammaproteobacteria (type I and type X), Alphaproteobacteria (type II), Verrucomicrobia and members of candidate division NC10 (Hanson and Hanson, 1996; Knief, 2015). MOB build a microbial methane filter in the water column that functions as the ultimate sink for oceanic methane before reaching the atmosphere. Yet, little is known about the controls and capacity of this microbial filter in the inner-shelf ecosystems where the vertical distance between the sedimentary source and the atmosphere is short. Factors such as oxygen (Boetius and Wenzhöfer, 2013; Steinle et al., 2017) and methane availability (Mau et al., 2013; James et al., 2016) affect MOx, but increasing water temperatures also play a role by impacting metabolic rates of MOB (He et al., 2012). The capacity of the microbial methane filter in the water column is typically higher during extended periods of continuity, i.e. when the water column is more stagnant (Steinle et al., 2015; James et al., 2016). This increases the contact time of MOB with methane-rich waters so that the size of the MOB standing stock increases. However, water mass movement induced by destratification or seasonal winds leads to shifting mixing regimes that disrupt continuity on a seasonal scale (Gründger et al., 2021). On a daily scale, tides induce currents, which also disrupt continuity and hence can affect MOx, too (Steinle et al., 2015). This disruption of continuity is particularly strong in the extremely dynamic inner-shelf seas, where rapid changes in environmental conditions can lead to rapid changes in water column dynamics.
The Wadden Sea, a UNESCO heritage site that consists of the largest continuous tidal flat area worldwide (14 900 km2), is an extremely dynamic system, with major hydrological changes occurring at seasonal to diel timescales. The Wadden Sea stretches for about 500 km along the coast of the Netherlands, Germany and Denmark. Here, we investigated methane dynamics in the Dutch part of the Wadden Sea, which is separated from the North Sea by five barrier islands (Fig. 1). Our aim was to temporally resolve methane dynamics from an hourly to a seasonal scale to determine key controls on methane dynamics and to establish a methane budget for the Dutch Wadden Sea.
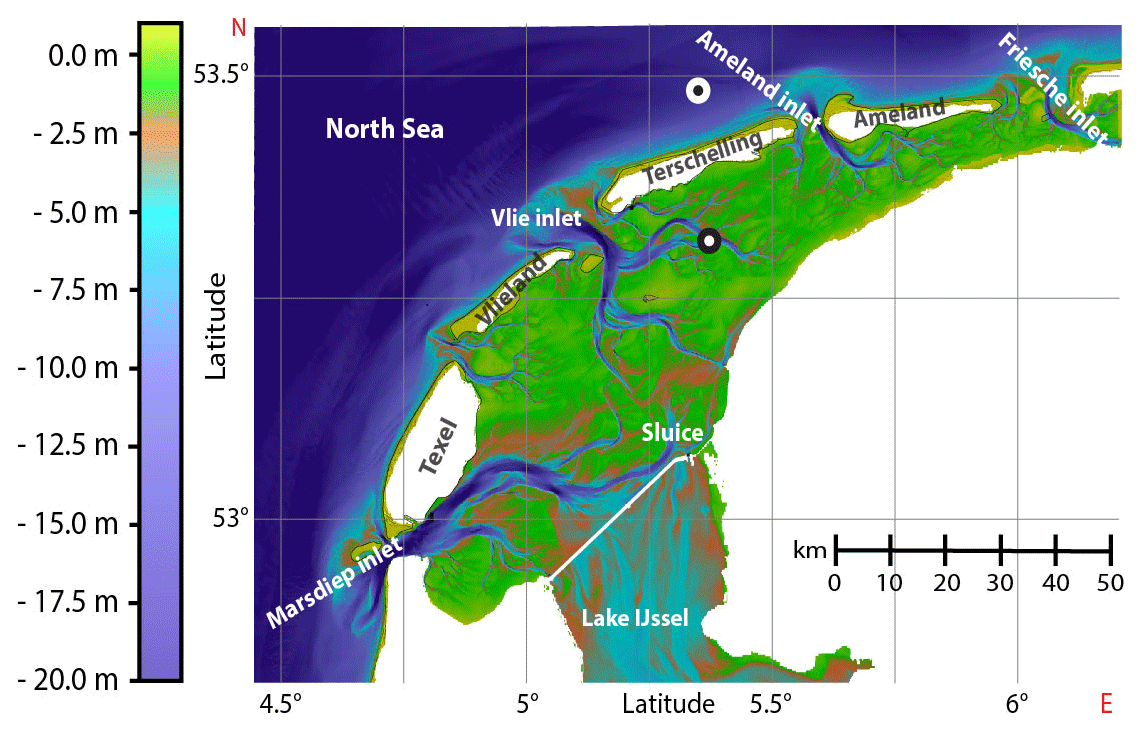
Figure 1Bathymetry of the western sector of the Dutch Wadden Sea between the Marsdiep and Friesche inlet (modified from Matericì et al., 2022). Tidal inlets between barrier islands facilitate water exchange with the open North Sea. The time series station is located south of the island Terschelling (black mark; 53∘19.015 N, 5∘22.071 E). The offshore reference station is located 8 km north of Terschelling (white mark; 53∘29.190 N, 5∘21.449 E).
2.1 Experimental design
A chain of five barrier islands (located 5 to 30 km offshore) shelters the Dutch Wadden Sea from waves and strong westerly winds. Between these barrier islands and with the rhythm of the tides, large volumes of water are transported in and out of the Dutch Wadden Sea through deep tidal inlets, such as the Marsdiep (most western point of the Wadden Sea) and the Vlie inlet (Duran-Matute et al., 2014). Our fixed mooring station (53∘19.015 N, 5∘22.071 E) is in a branch of the Vlie inlet between the island of Terschelling and the mainland, roughly in the middle of the Dutch Wadden Sea (Fig. 1). This location was chosen as it remains submerged at low tide and lies in between the Wadden Sea's landward and offshore termination. The water flowing by this station thus equally integrates the tidal flat area, mostly during ebb tide, as well as the inflowing North Sea water during rising tide. Also, the station was relatively far away from the port of Harlingen (∼20 km) so that a potential influence of methane-rich port waters is minimized. The reference station was located 8 km north of the island Terschelling in the North Sea (53∘29.190 N, 5∘21.449 E).
Samples were recovered with the R/V Navicula during four sampling campaigns: winter (19–21 February 2019), spring (23–25 April 2019), summer (22–24 July 2019) and autumn (11–13 November 2019). During each campaign, we conducted hourly conductivity–temperature–depth (CTD) casts with discrete water sampling over a 2 d period. During CTD casts, water mass properties (temperature, salinity, depth) and oxygen concentrations were measured continuously using a Sea-Bird (SBE911) + CTD system. Discrete water samples were recovered with Niskin bottles from 1 and 3 m water depth and, upon recovery, immediately sampled for subsequent analyses of water column constituents (methane concentrations, methane isotopic composition and methane oxidation rates).
Sediment samples were retrieved using a box corer, and upon recovery, subsampled with small push cores (diameter 7 cm, ∼18 cm sediment recovery). Push cores were subsampled for methane concentrations by taking 5 mL of sediment every 2 cm that was quickly added to 60 mL glass bottles containing 30 mL of a saturated NaCl brine solution, and the bottles were immediately sealed with butyl rubber stoppers. Atmospheric flask samples (250 mL) were taken hourly at ∼10 m above the sea surface, in winter and spring. In summer and autumn, atmospheric methane concentrations were continuously measured using a cavity ring-down spectrometer (CRDS, Picarro model G2301).
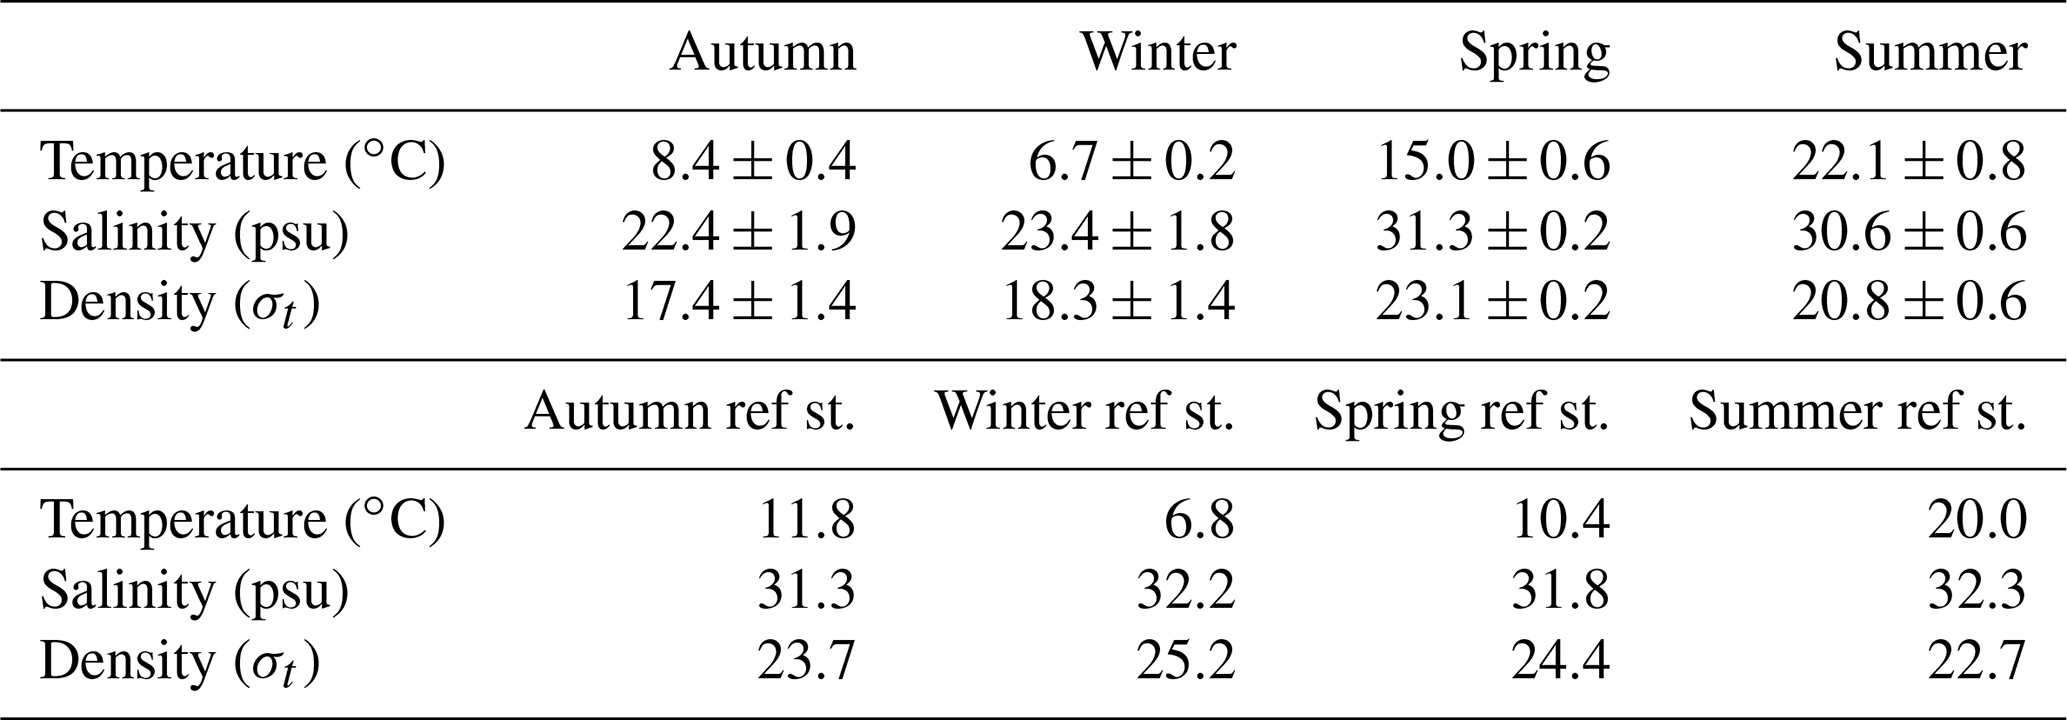
Table 1Average seawater temperature, salinity and density at the time series station (central Dutch Wadden Sea) and reference station (offshore of Terschelling, North Sea). For the time series station, values are presented as the mean ± standard deviation for the ∼2 d measurement period during a given season. At the reference station, we only measured one CTD cast per season.
2.2 Dissolved methane concentrations and stable isotope ratios
Dissolved methane concentrations were determined using a headspace (HS) technique (Green, 2005). In brief, immediately upon CTD recovery, 260 mL glass serum bottles were filled HS-free, closed with black butyl rubber stoppers (Rubber B.V. the Netherlands) and crimp-top sealed. Next, we added a 5 mL N2 headspace and fixed the sample with 5 mL NaOH solution (25 % w/v). HS methane concentrations of sediments and dissolved methane were measured in our home laboratories with a gas chromatograph (GC; Thermo Scientific FOCUS GC equipped with a Restek stainless steel column HayeSep Q Packed GC Column, 80/100, General Configuration (length 2 m, 2 mm i.d., 1/8 in. o.d.). with flame ionization detection). The instrument was calibrated with a certified 100 ppm methane standard (Scott Specialty Gases Netherlands B.V.).
Similarly, seawater aliquots were taken for methane stable carbon and hydrogen isotope measurements, but these samples were fixed with 60 µL HgCl2 (2 mM). A continuous-flow isotope ratio mass spectrometry (CF-IRMS) system was used to quantify D-CH4 in the gas phase (Thermo Delta Plus XL, Thermo Fisher Scientific Inc., Germany) as described previously (Röckmann et al., 2016; Jacques et al., 2021). Isotopic values are represented in the delta notation against the Vienna Standard Mean Ocean Water (VSMOW) (δD). To monitor precision and accuracy, sample measurements were alternated with measurements of an in-house air standard (cross-calibrated against certified reference standards) containing 1975.5 ppb methane with a δD value of −90.81 ± 1.1 ‰. We constructed a two-endmember mixing model (Mariotti et al., 1981; Jacques et al., 2021) and a Rayleigh fractionation model. This was done to investigate whether enrichment of D in the residual methane was caused by MOx, which is known to discriminate against heavy isotopes (Barker and Fritz, 1981; Whiticar, 1999), or by mixing with comparably heavy atmospheric methane (see Supplement).
2.3 Methane oxidation rate measurements
MOx was determined by ex situ incubations with trace amounts of 3H-labelled methane as described previously (Niemann et al., 2015). Briefly, aliquots from each Niskin bottle were filled HS-free in 20 mL glass vials in triplicate, sealed with grey bromobutyl stoppers known not to hamper methanotrophic activity and amended with 5 µL of 3H-CH4 in N2 (4.5 kBq, American Radiolabeled Chemicals, USA). The samples were incubated in a temperature-controlled incubator for 72 h in the dark, maintaining in situ temperature conditions. Activities of residual C3H4 and the MOx product 3H2O were measured by liquid scintillation counting.
The MOx first-order rate constant (k) was determined from the fractional tracer turnover (Reeburgh, 2007):
where t is incubation time in days. k was corrected for (negligible) tracer turnover in killed controls (KCs; fixed with 100 µL HgCl2 directly after sampling) and multiplied with dissolved methane concentrations [CH4], yielding MOx:
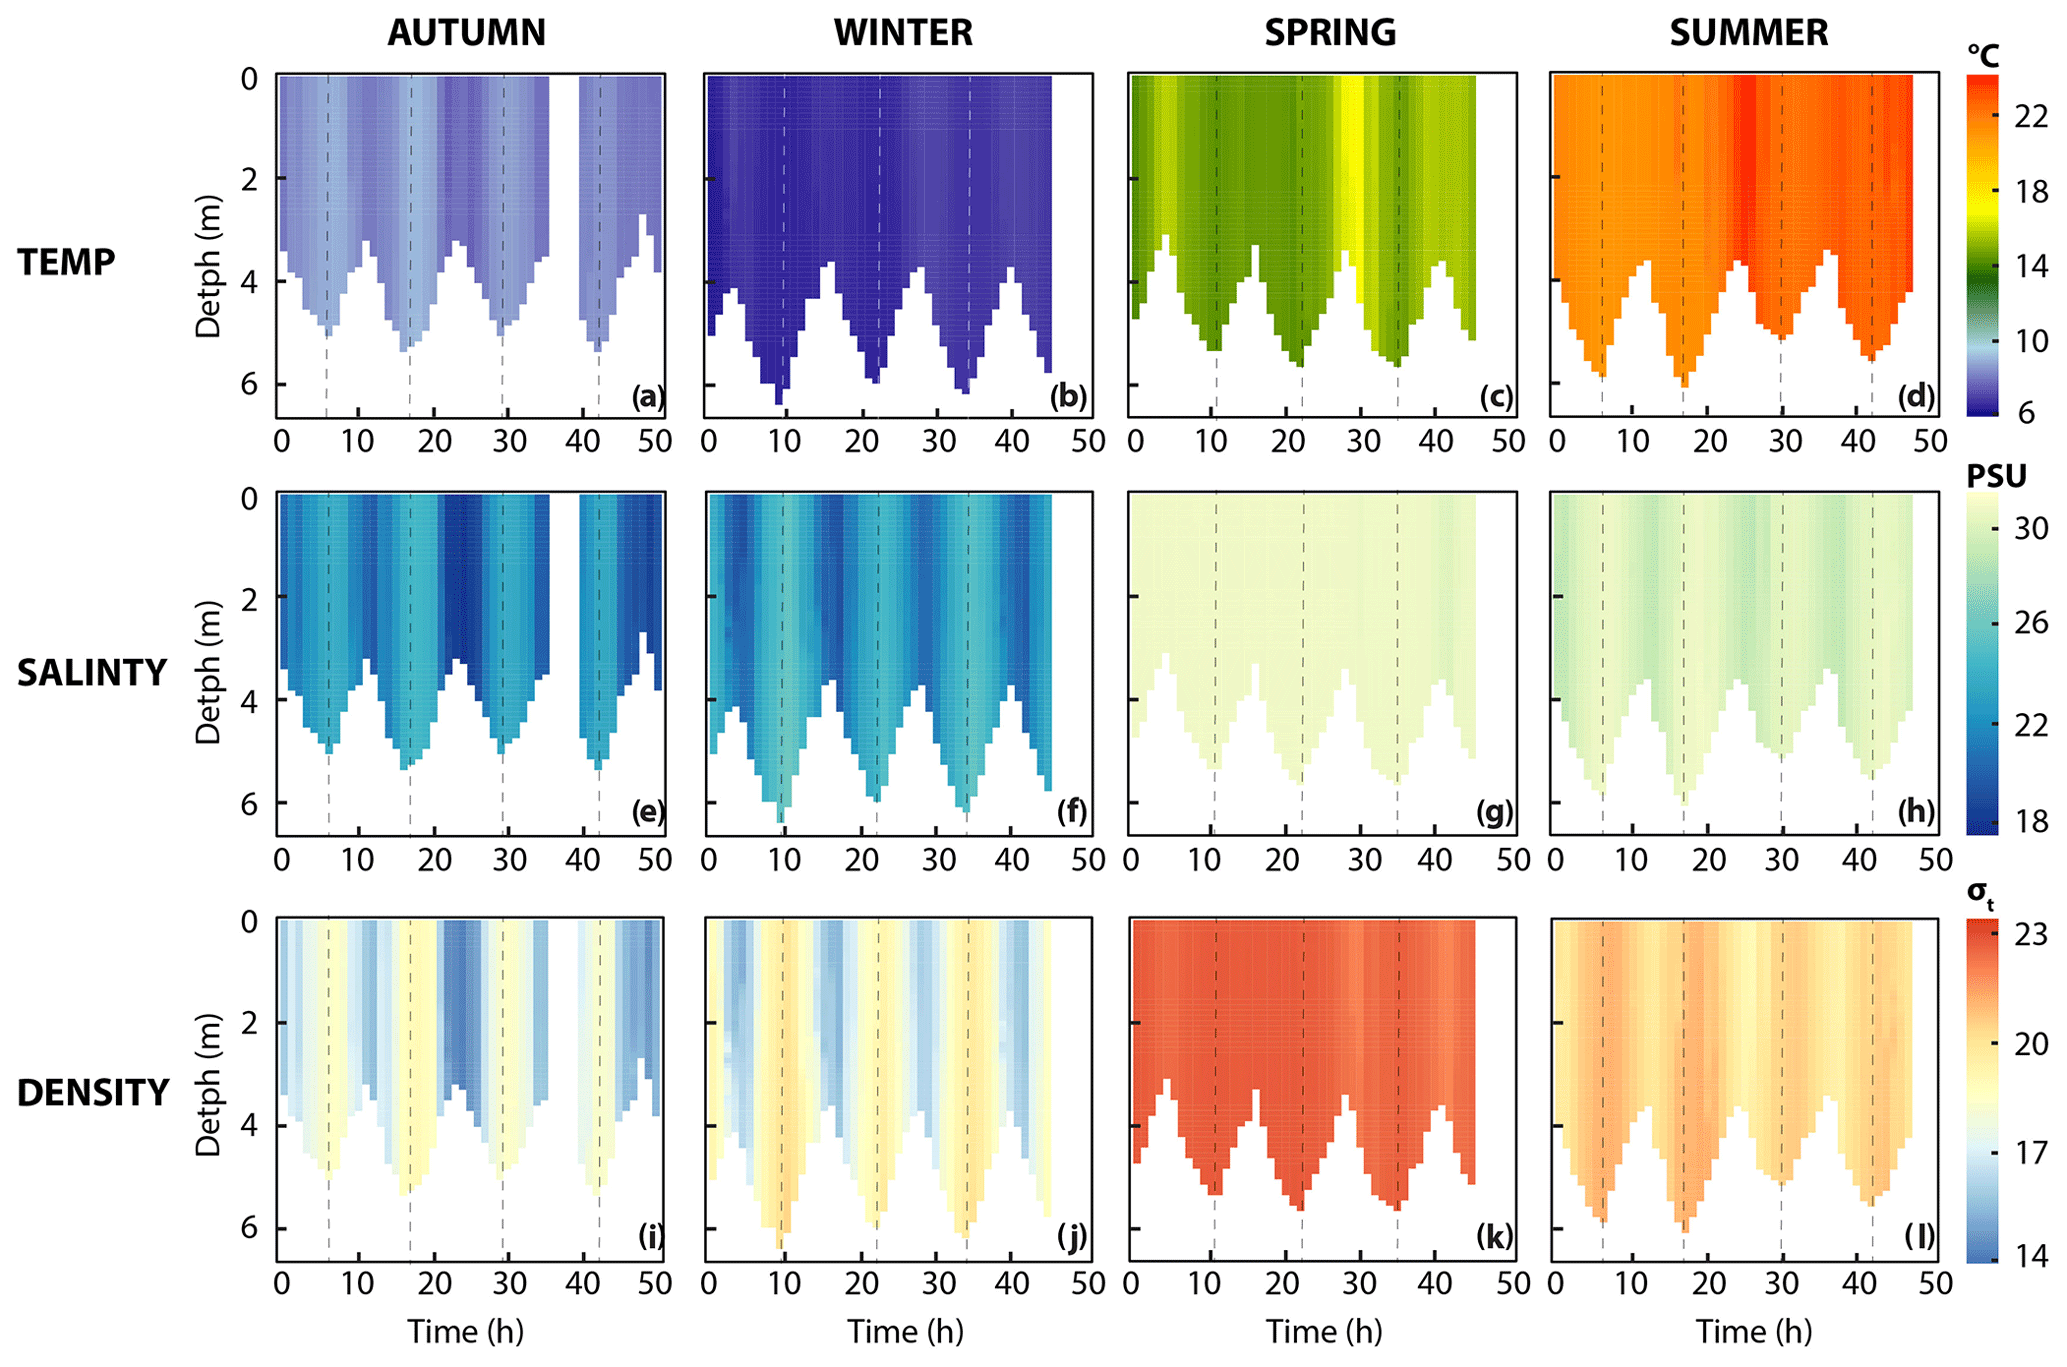
Figure 2Properties of seawater. (a–d) Spatiotemporal distribution of temperature, (e–h) salinity and (i–l) density. Dashed line indicates high tide.
2.4 Diffusive fluxes of methane
The diffusive sea–air methane flux was calculated based on a boundary layer model that considers the relation between wind, temperature and methane concentrations in the atmosphere and a well-mixed surface water layer (Wanninkhof, 2014):
F denotes the diffusive methane flux. pCH4a and pCH4w (in atm) are the partial pressures of methane in the air and in the well-mixed surface water layer, respectively. pCH4a was measured with a Picarro G2301 gas concentration analyser on board. pCH4wwas determined from surface water methane concentrations (see above). K0 is the methane solubility in mol m−3 atm−1 (Wiesenberg and Guinasso, 1979) and was calculated from temperature and salinity obtained from corresponding CTD casts. is the methane gas transfer velocity in metres per day, which was calculated using wind speed (U), the Schmidt number (Sc and the normalized gas transfer velocity (k660) according to Wanninkhof (2014):
Wind speed was measured on board at 10 m a.s.l. The Schmidt number describes the ratio between kinematic viscosity of water and the gas diffusion coefficient, which relates the different k values for different gases (Jähne et al., 1987; Wanninkhof, 2014).
2.5 Statistical analysis
A principal component analysis (PCA) was carried out to study the relationship between environmental variables and methanotrophic activity. The input variables for the PCA were temperature, salinity, density, k, MOx and dissolved methane concentrations. Prior to running the PCA, the variables were centred and scaled. the R software (R Core Team, 2022) with the package “FactoMineR” (Lê et al., 2008) for the PCAs.
3.1 Dynamics of seawater properties
Water column temperature varied between seasons and ranged from 6.3 to 24 ∘C (Fig. 2, Table 1). A clear distinction could be made between colder seasons (autumn and winter), in which temperature ranged from 6.3 to 9.1 ∘C, and warmer (spring and summer) seasons, when temperatures ranged from 14.2 to 24 ∘C. Water temperatures at the reference station were similar in winter (6.9 ∘C) but colder in spring (10.5 ∘C) and summer (20.3 ∘C) and warmer in autumn (11.8 ∘C) when compared to the Wadden Sea.
On a diel scale, variations in water temperature were related to the tidal phase. In winter, spring and summer, maximum water temperatures were observed around low tide (LT, here defined as the time when we encountered the lowest water depth during CTD casts, Fig. 2). This was 7.2 ∘C in winter, 17.3 ∘C in spring and 24.1 ∘C in summer. Minimum water temperatures were around high tide (HT, high tide, here defined as the time when we encountered maximum water depth during CTD casts, Fig. 2). This was 6.3 ∘C in winter, 14.2 ∘C in spring and 20.9 ∘C in summer. In autumn, this pattern was inverted with minimum water temperatures at LT (7.6 ∘C) and maximum ones at HT (9.1 ∘C).
Like temperature, salinity differed strongly between colder (18–27 psu) and warmer seasons (29–32 psu; Fig. 2, Table 1). Furthermore, salinity was higher during HT irrespective of season. Changes in density were caused by salinity rather than temperature during all four seasons, with one exception in spring: after 28 h of the time series, salinity remained stable, but water temperatures decreased, which lowered water density. Salinity levels at the reference station in the North Sea were stable (31.3–32.3 psu) without obvious seasonal fluctuations.
3.2 Methane dynamics
3.2.1 Methane concentrations in the water column and in sediments
Water column methane concentrations showed a high degree of variability and were clearly distinguishable between the colder and warmer seasons (Fig. 3a–d, Table 2). We found a significant difference in average methane concentrations between 1 m (16.0 nM) and 3 m (17.6 nM) water depth in winter (p≤0.007, Welch's t test). In autumn, methane concentrations were also lower at 1 m (15.5 nM) than at 3 m (16.2 nM) water depth, but the difference was not significant. However, it is noteworthy that the methane concentrations at the beginning of the time series were around 35 nM and rapidly decreased to values below 15 nM within 1 d. During warmer seasons, average methane concentrations were similar at the surface and in deeper waters, i.e. 40.9 nM (1 m) and 41.3 nM (3 m) in spring and 69.2 nM (1 m) and 69.4 (3 m) in summer. Methane concentrations at our reference station were ∼3 nM in winter, spring and autumn and ∼6 nM in summer and thus far lower when compared to the Wadden Sea.
On a diel scale, methane concentrations varied during all seasons, roughly matching the tidal regime. In spring at LT, depth-averaged methane concentrations were 42.6 nM, but they decreased by ∼25 % to 34.2 nM at HT. This pattern also occurred in autumn, when methane concentrations decreased by 21 % from 17.4 nM at LT to 14.4 nM at HT. In winter (14.7 nM at LT and 14.3 nM at HT) and summer (72.5 nM at LT and 71.3 nM at HT), the difference between LT and HT was smaller (Table 2).
Sediment methane concentrations increased with depth during all seasons (Fig. S1 in the Supplement). Concentrations were similar in autumn (0.5–2.2 µM), winter (0.4–0.6 µM) and spring (0.5–0.9 µM), but in summer, we found highly elevated sediment methane concentrations ranging from 3.6 to 18.7 µM. The high concentrations in sediments during the summer season are in line with an increase in dissolved methane concentrations in the water column.
Table 2Methane dynamics in the Dutch Wadden Sea. Average and standard deviation of methane concentrations, k, MOx and δD-CH4 during four seasons in 2019. Values represent averages for 1 and 3 m water depth (averaged over the 2 d time series recorded for each season) as well as for low and high tide only (averaged over depth). LT: minimal water depth during CTD casts; HT: maximum water depth during CTD cast. Average wind speed and methane efflux to the atmosphere are averaged over the 2 d time series recorded for each season; ns: not sampled. The reference station represents a single time point.
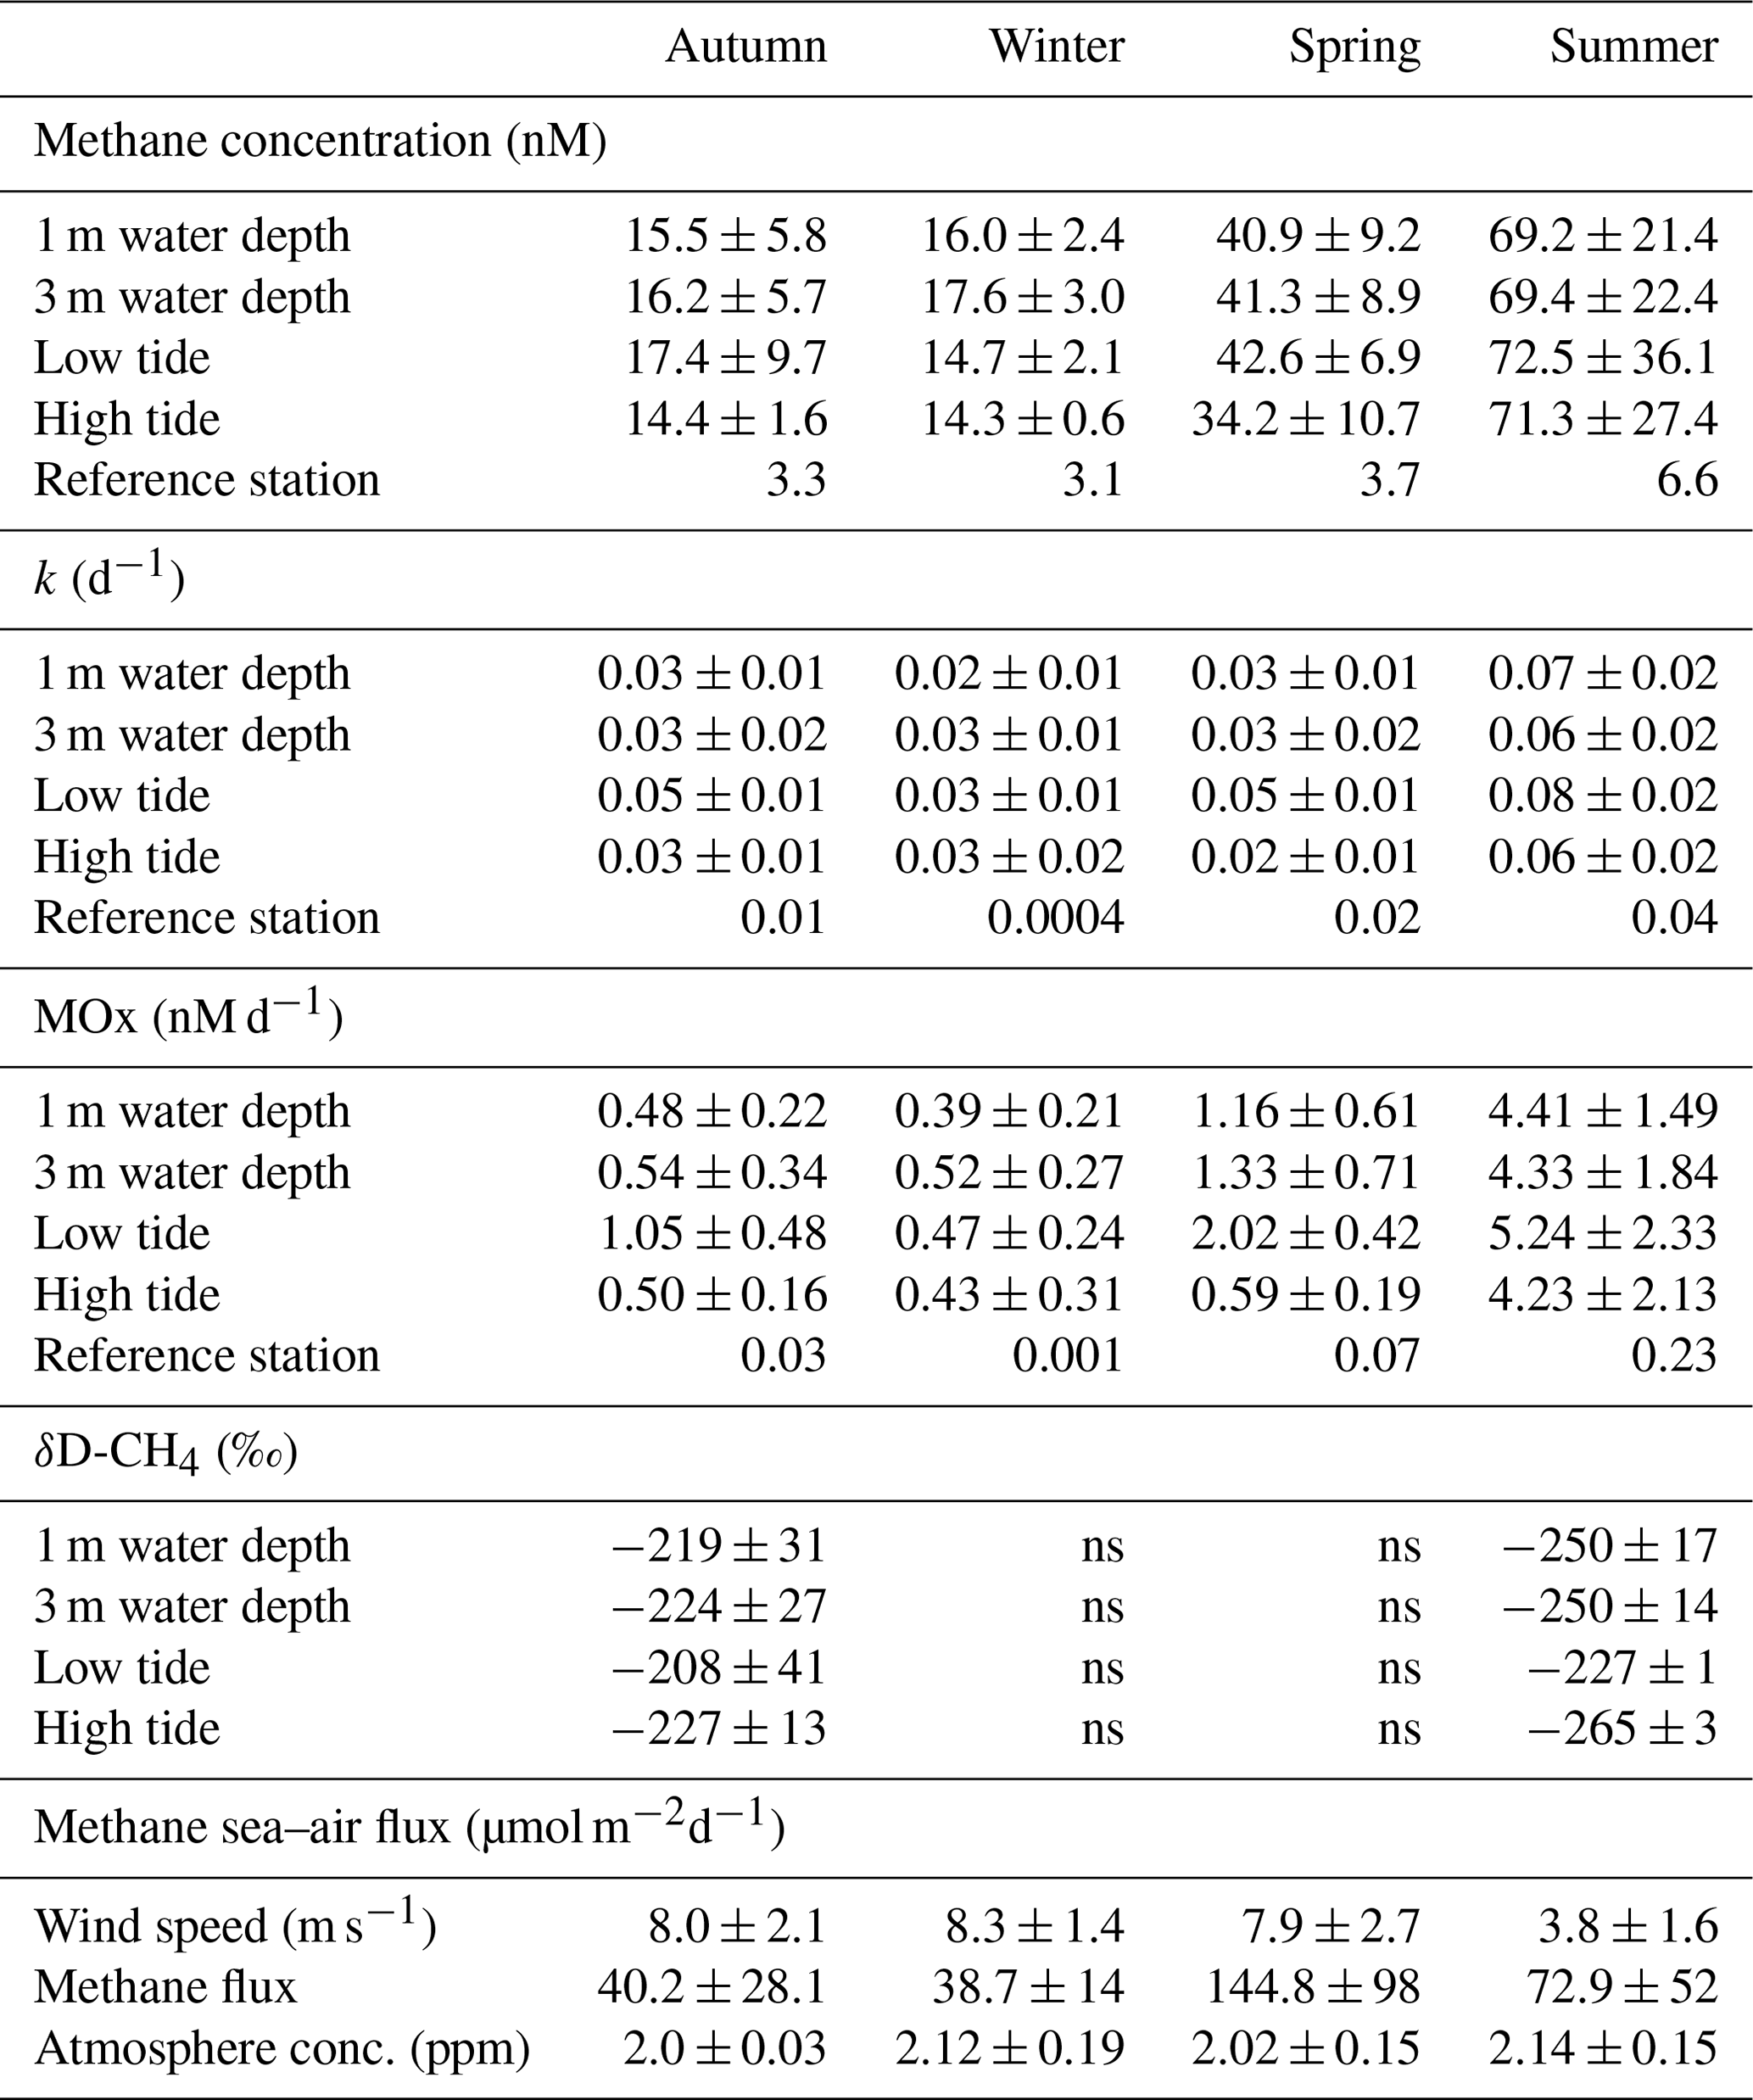
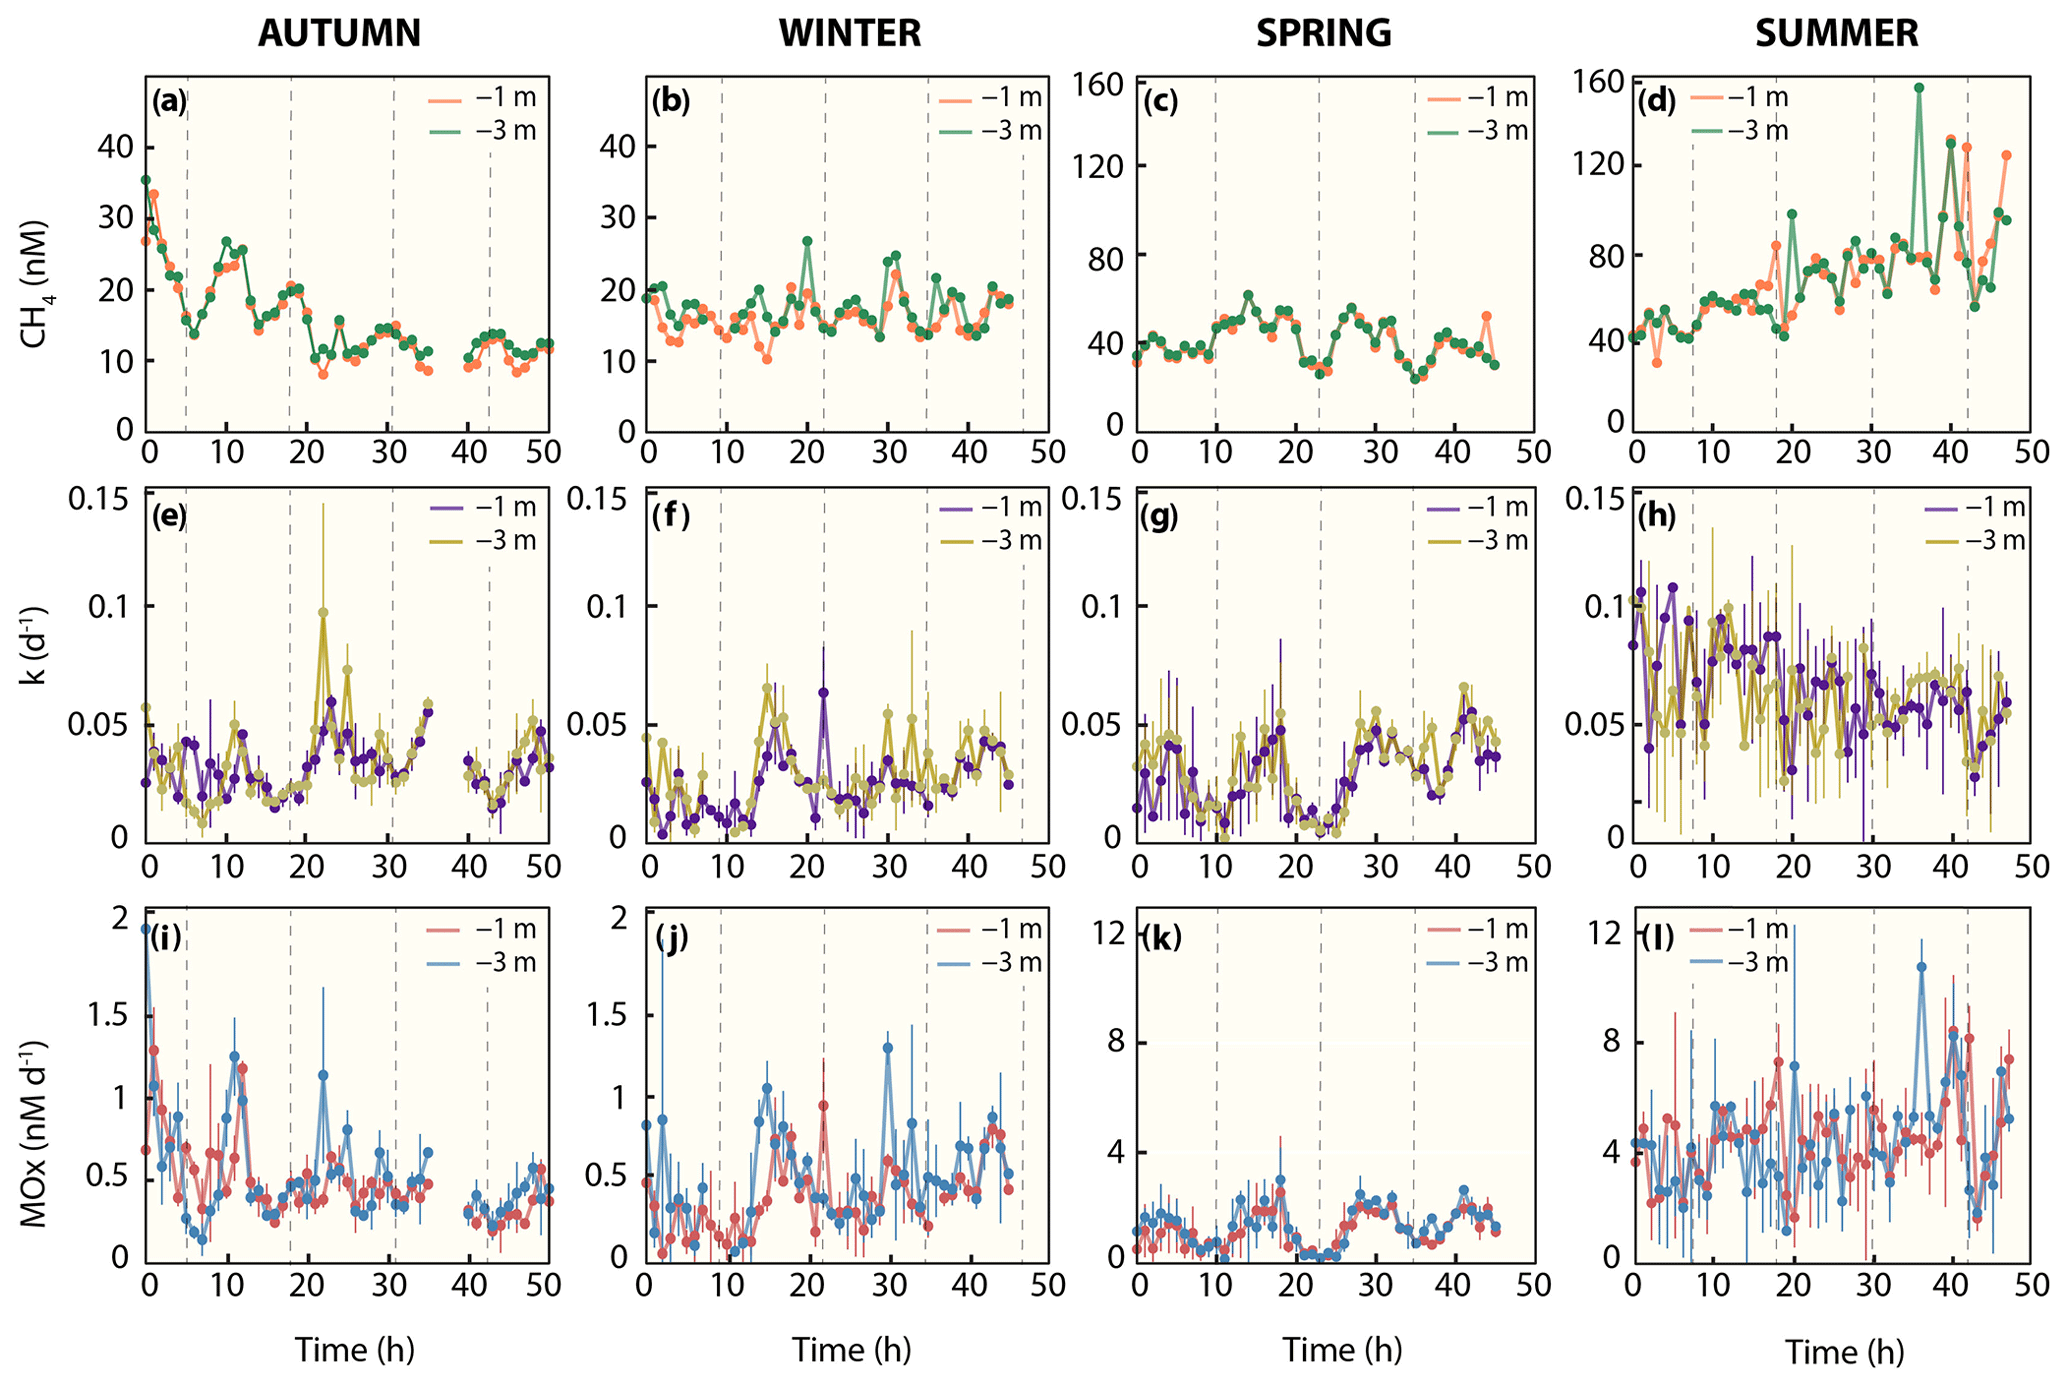
Figure 3Methane dynamics. (a–d) Dissolved methane concentration, (e–d) first-order rate constant, and (i–l) methane oxidation rates. Note that for dissolved methane concentrations in colder seasons (autumn and winter), the y axis differs from warmer seasons (spring and summer). Dashed line indicates high tide.
3.2.2 Methane oxidation rates
Similar to methane concentrations, we observed strong seasonal differences in MOx (Fig. 3i–l, Table 2). Depth-averaged MOx in spring (1.2 nM d−1) and summer (4.4 nM d−1) was ∼3 and ∼9-fold higher than in winter (0.5 nM d−1) and autumn (0.5 nM d−1). MOx values at 1 and 3 m water depth statistically differed from each other in winter (p≤0.01, Welch's t test) but not in spring, summer and autumn. MOx at the reference station was <5 % of MOx in the Wadden Sea, with maxima found in summer (0.2 nM d−1).
On a diel scale, MOx showed fluctuations during all seasons. In general, depth-averaged MOx was higher during LT compared to HT. The autumn average MOx at LT (0.79 nM d−1) was about 2-fold higher and significantly different from MOx at HT (0.38 nM d−1, p≤0.03, Welch's t test).
In winter, the difference between MOx at LT (0.47 nM d−1) and HT (0.43 nM d−1) was small. In spring, depth-averaged MOx at LT (2.02 nM d−1) was about 4-fold and significantly (, Welch's t test) higher than during HT (0.58 nM d−1). In summer, MOx was high at both LT (5.2 nM d−1) and HT (5.4 nM d−1). Similarly, k was substantially higher (16 %–63 %) at LT than HT in all seasons (Fig. 3e–h, Table 2). In fact, the difference in depth-averaged k between LT and HT was significant in autumn (p≤0.003, Welch's t test) and spring (, Welch's t test; Table S1 in the Supplement).
3.2.3 Stable hydrogen isotope signatures
The stable hydrogen isotope composition of dissolved methane was only measured in autumn and summer (Fig. 4, Table 2). In autumn, average δD-CH4 over the entire time series was −219 ‰ at 1 m water depth and −224 ‰ at 3 m water depth, but there was a generally strong trend towards higher δD-CH4 values over the 2 d period from about −260 ‰ to about −180 ‰. In summer the mean δD-CH4 values were homogenous throughout the water column (−250 ‰) and generally lower than in autumn. Except for the first full tidal cycle in autumn, the results showed a tidal imprint on δD-CH4 values with higher δD-CH4 values at LT and lower values at HT independent of depth and season (Fig. 4).
In addition to tidal patterns, the δD-CH4 values in autumn were substantially higher at lower methane concentrations (<21 nM, Fig. 5). Linear mixing alone of (i) well-mixed surface waters in equilibrium with atmospheric methane and (ii) the maximum methane concentration in the water column, both concentrations with their associated isotopic signatures, would result in concentration and isotope data as depicted by the mixing lines in Fig. 5. Results in autumn clearly deviated from this mixing line at low methane concentrations. On the other hand, the open-system Rayleigh fractionation model that we ran for low methane concentration in autumn yielded an ε value of −97 ‰ and matched the steep rise in δD-CH4 with decreasing methane concentration much better (R2=0.79). This directly indicates that MOx is the dominant mechanism driving δD-CH4 to higher values at low concentrations.
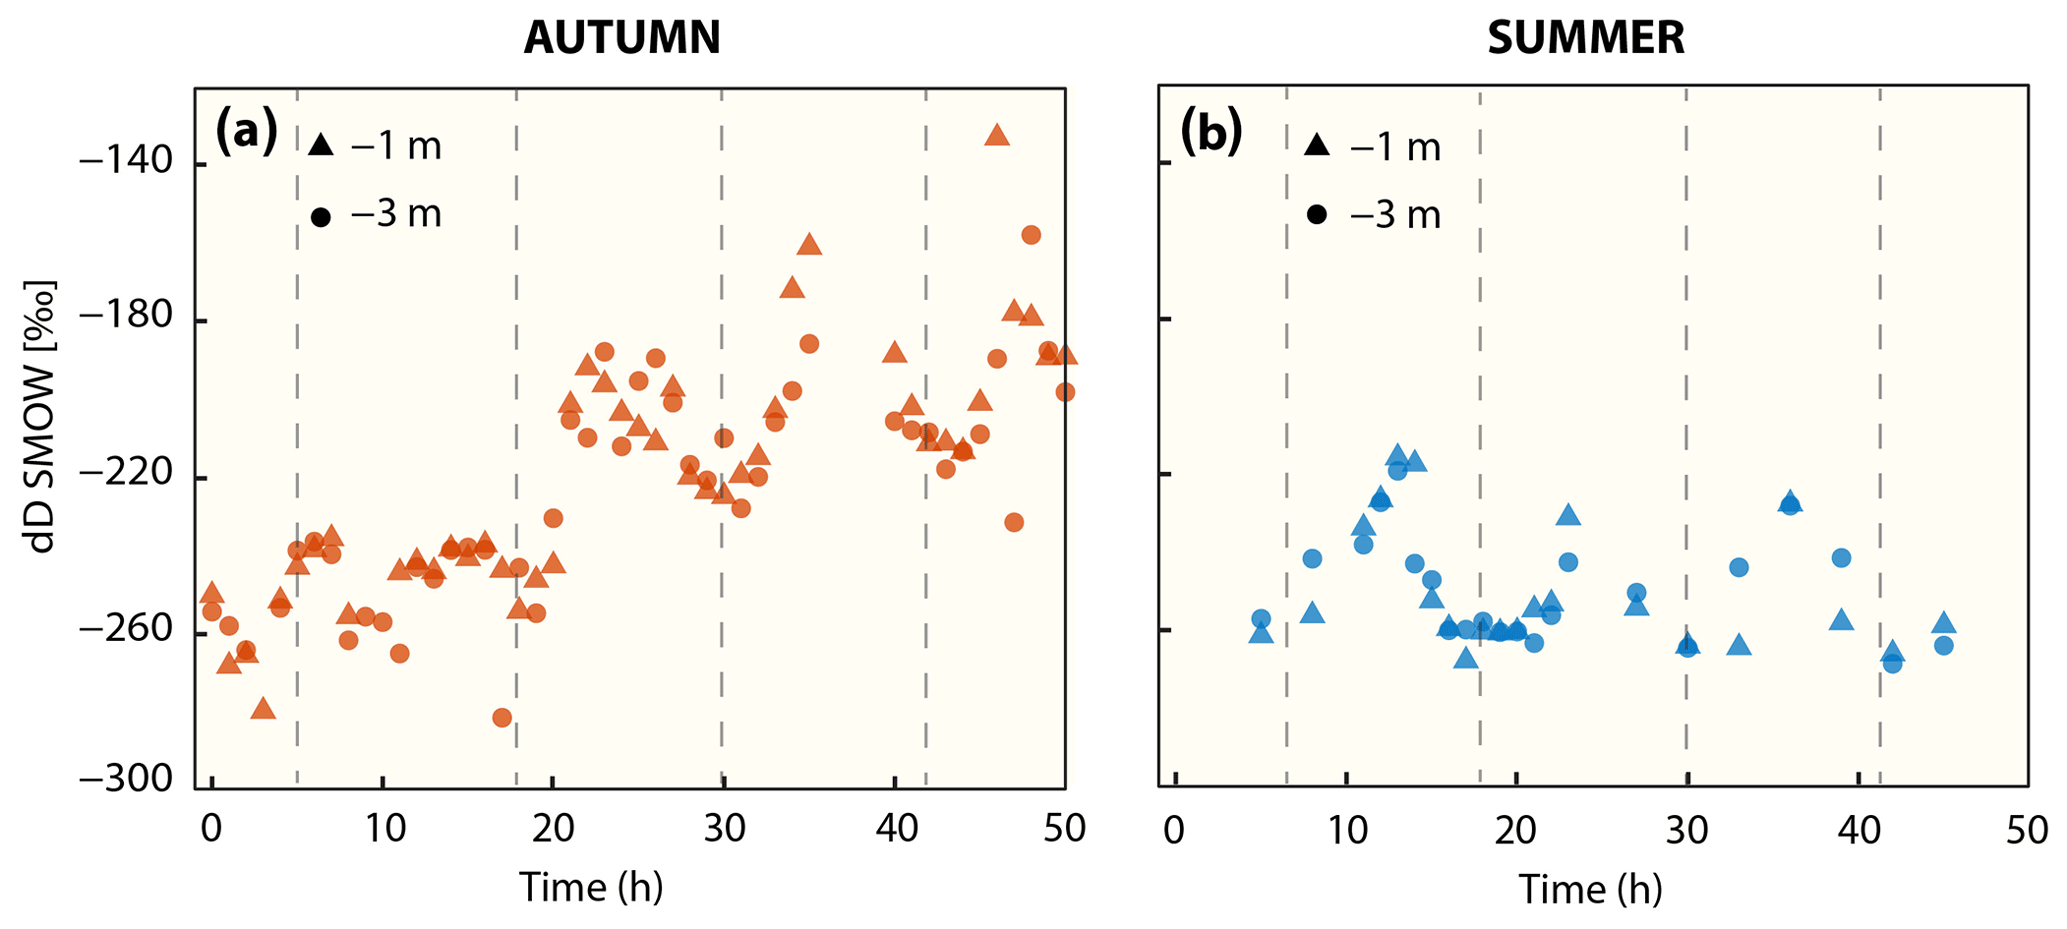
Figure 4Progression of δD-CH4 signatures in (a) autumn and (b) summer at 1 and 3 m water depth. Vertical dashed line indicates high tide.
3.2.4 Diffusive efflux to the atmosphere
The water column in the Wadden Sea was consistently methane supersaturated (>8 nM) with respect to atmospheric equilibrium (∼2.6 nM) during all sampling campaigns (Fig. 3, Table 2), which indicates a continuous release of methane from the water to the atmosphere throughout the measurement series. Atmospheric concentrations were similar, ranging from 1.8 to 2.6 ppm, with relatively constant concentrations in autumn and more erratic concentrations in winter, spring and summer (Fig. 6e–h, Table 2). There is a noteworthy sharp increase in atmospheric methane from 2 to 2.6 ppm between 29 and 38 h in summer before decreasing again to 2 ppm.
Wind speeds in autumn, winter and spring were relatively high (typically >5 ms−1) when compared to calmer conditions in summertime (typically <5 ms−1; Fig. 6i–l, Table 2). As a result of the strong but variable wind forcing, diffusive methane fluctuated in magnitude within, and between season (Fig. 6a–d, Table 2). Average diffusive fluxes in autumn and winter were about 4-fold lower with <40 µmol m−2 d−1 than in spring and 2-fold lower than in summer. Maximum efflux (479 µmol m−2 d−1) in spring occurred after the wind velocity increased rapidly from 6 to 14 ms−1 within 2 h and methane concentrations slightly increased from 38 to 45 nM.
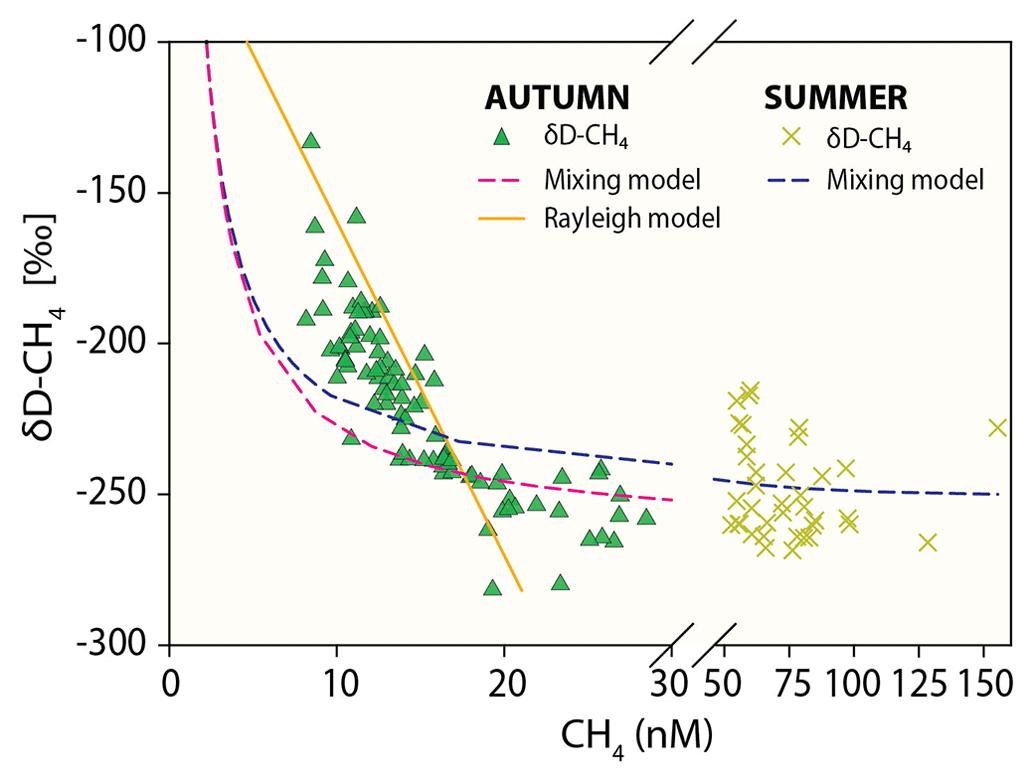
Figure 5Methane concentration versus δD-CH4 mixing and oxidative removal in autumn and summer. Dashed lines show methane concentration/isotope dynamics determined with a two-endmember mixing model considering (i) well-mixed Wadden Sea surface waters and (ii) methane-charged waters as endmembers. Methane concentration and stable hydrogen isotope composition following oxidative removal according to a Rayleigh model for low methane concentrations are depicted as a solid line. Samples with methane concentrations <21 nM (δD-CH ‰) in autumn and <61 nM (δD-CH ‰) in summer were defined as the methane source signal and thus the starting point of the Rayleigh fractionation model. The apparent isotope enrichment (ε see also Fig. S2) was −97 ‰ in autumn with an R2 of 0.79. Neither the mixing nor the Rayleigh model are well constrained for δD-CH4 in summer; the mixing line is thus only shown for comparison and ε could not be calculated.
3.3 Statistical analysis
To study the relationship between environmental variables and methanotrophic activity, we conducted a principal component analysis (PCA). The outcome explained 92 % of the data variability in the first two components (Fig. 7, Table S2 in the Supplements). The main gradient (PC1: 69 %) showed a contrast between autumn and winter and summer and spring. Temperature, salinity, methane concentrations and MOx peaked in summer and spring, while lower values were measured in winter and autumn. The relatively small ellipse in spring indicates that samples show more similarity than in other seasons. The second gradient distinguished the spring samples from the summer samples, with higher k values observed in summer and greater density in spring (PC2: 23 %).
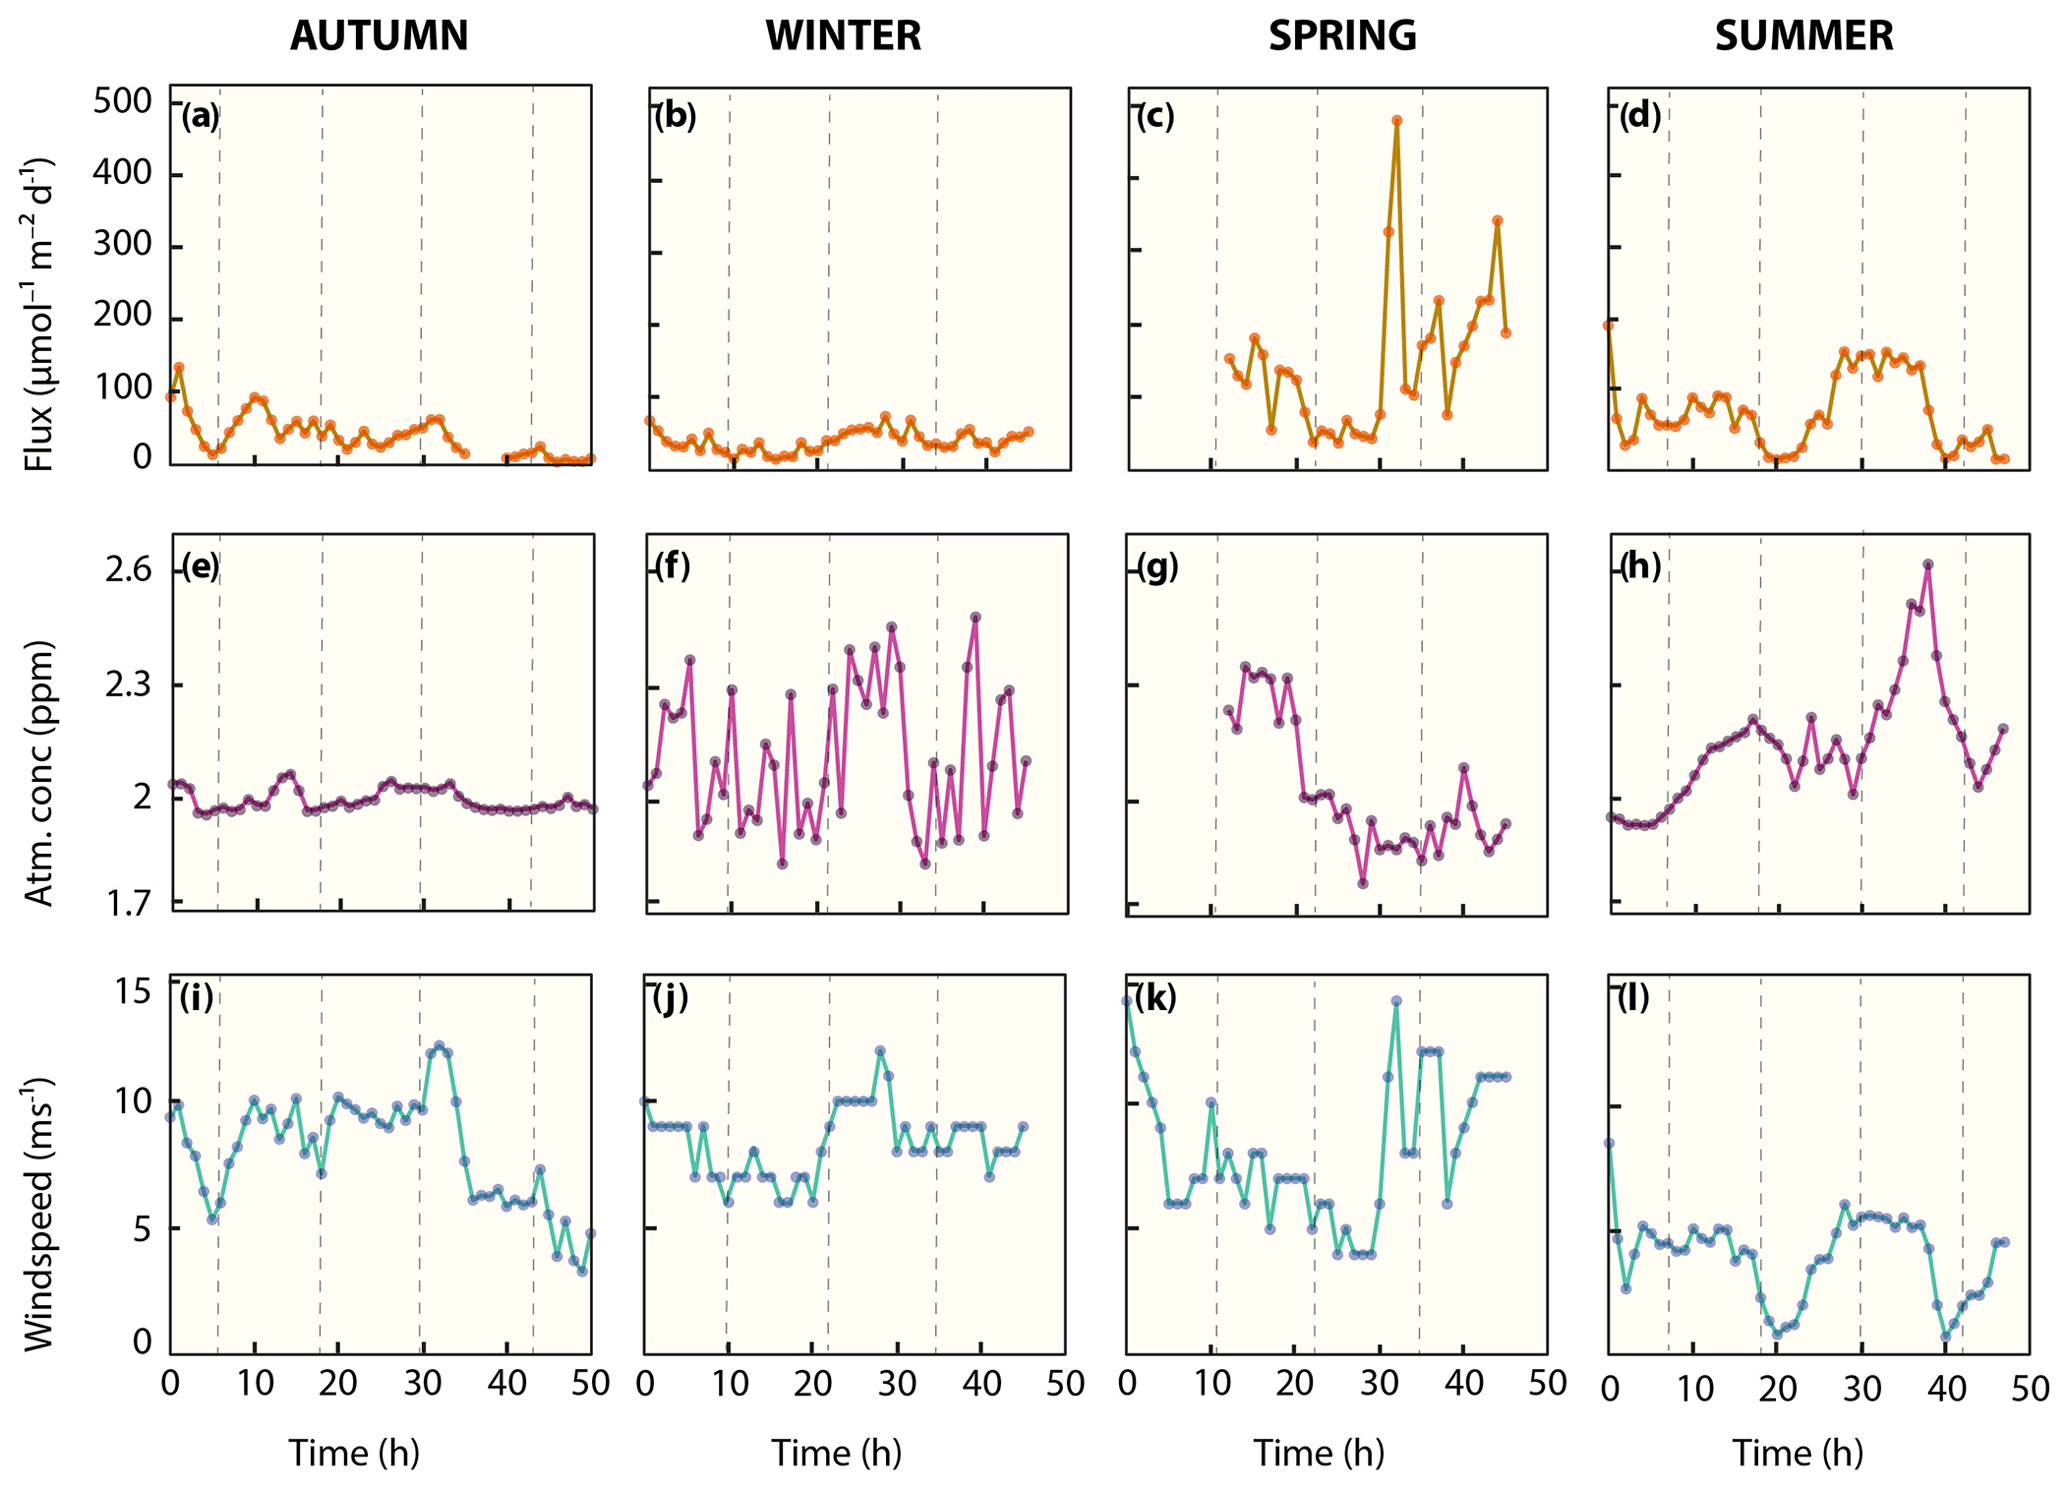
Figure 6Diffusive methane flux. (a–d) Sea surface atmosphere methane fluxes. (e–h) Seasonal atmospheric methane concentrations. (i–l) Local wind speed. Vertical dashed lines indicate high tide.
The Wadden Sea is a highly productive ecosystem (Philippart et al., 2009), where the decay of organic matter supports high rates of methanogenesis in sediments (Røy et al., 2008; Wu et al., 2015), which in turn leads to high methane concentrations in the Wadden Sea's water column (Grunwald et al., 2007; Grunwald et al., 2009). Little knowledge, however, exists of the variability in methane dynamics on short timescales of hours to days or between seasons and the underlying controls on this variability. Here, we measured water column methane concentrations, methane oxidation and the oceanographic regime as well as atmospheric methane mixing ratios and wind velocity in the Dutch sector of the Wadden Sea for 2 d during four consecutive seasons in 2019.
4.1 Water column properties
In general, we found a clear distinction between colder (autumn and winter) and warmer (spring and summer) seasons (Figs. 2, 7). North Sea waters with incoming tide flow through tidal inlets that in turn branch into successively smaller tidal creeks in which the water-flow direction alternates with the tidal phase. This then led to increasing water temperatures in autumn but decreasing water temperatures in winter. The high temperature of Wadden Sea waters during incoming tide in autumn can be explained by the fact that the shallow Wadden Sea cools rapidly once the summer is over, while the North Sea's large water volume takes longer to cool down.
Salinity levels were on average lower in colder seasons compared to warmer seasons, likely because land runoff and groundwater discharge are typically higher in autumn and winter because of the overall higher precipitation levels during the cold seasons (Van Aken, 2008). A higher level of freshwater inflow from land was also evident from the rapidly dropping salinity levels during falling and LT in autumn and winter (Fig. 2). This freshening effect is amplified at times when the Dutch Ministry of Infrastructure and Water management (Rijkswaterstaat) opens water gates to discharge excess water from Lake IJssel (Fig. 1), which occurs more often in colder seasons due to increased input of precipitation, groundwater discharge, and surface and riverine discharge to the lake. During the warmer and dryer seasons, water gates are mostly kept closed to ensure that the lake's water level stays high. However, freshwater inflow into the Wadden Sea was evident during all seasons because incoming North Sea water generally increased salinity levels at HT, independent of sampling time. The North Sea water mass entering the Wadden Sea during the incoming tide hence becomes overprinted in the Wadden Sea area as a result of mixing with waters from terrestrial sources.
4.2 Differences in methane concentrations and isotopic signatures on timescales of seasons
Sediment and water column methane concentrations were highly elevated in summer (Figs. 3, S1 and Table 2). In fact, average sediment methane concentrations increased 17-fold in summer compared to spring 2 months earlier. This increase is probably related to the remineralization of the spring phytoplankton bloom that takes place in the months of April and May (Philippart et al., 2009) leading to elevated rates of methanogenesis in anaerobic sediments (Beck and Brumsack, 2012). A time lag of 1 to 2 months between the peak of the spring bloom and methane release from sediments was also observed in the Baltic Sea (Bange et al., 2010). In the Wadden Sea, where sediments are generally silty and organic-rich, it is likely that temperature plays a crucial role in controlling methanogenesis, in addition to the elevated inputs of organic matter. As water temperatures increase towards summer, microbial methanogenesis in the sediments is further enhanced (Yvon-Durocher et al., 2014; Borges et al., 2018). We indeed observed lower methane concentrations in autumn and winter compared to spring and summer, which is most likely related to both reduced organic-matter input and colder temperatures. It has to be noted that the sediment methane concentrations presented here are comparably low as sediment methane concentrations close to saturation levels were previously found at other locations in Wadden Sea sediments (Røy et al., 2008; Wu et al., 2015). We did not measure sulfate concentrations, but the methane profiles indicate that we only reached the upper part of the methane–sulfate transition zone below which methanogenesis proceeds. Also, sediment methane concentrations can be variable on spatial scales of metres. Depending on the hydrographic regime, the methane–sulfate transition zone can be metres below the tidal flat sediments (Wu et al., 2015), but pore water flow can also transport reduced compounds such as sulfide and methane to the sediment surface (Røy et al., 2008).
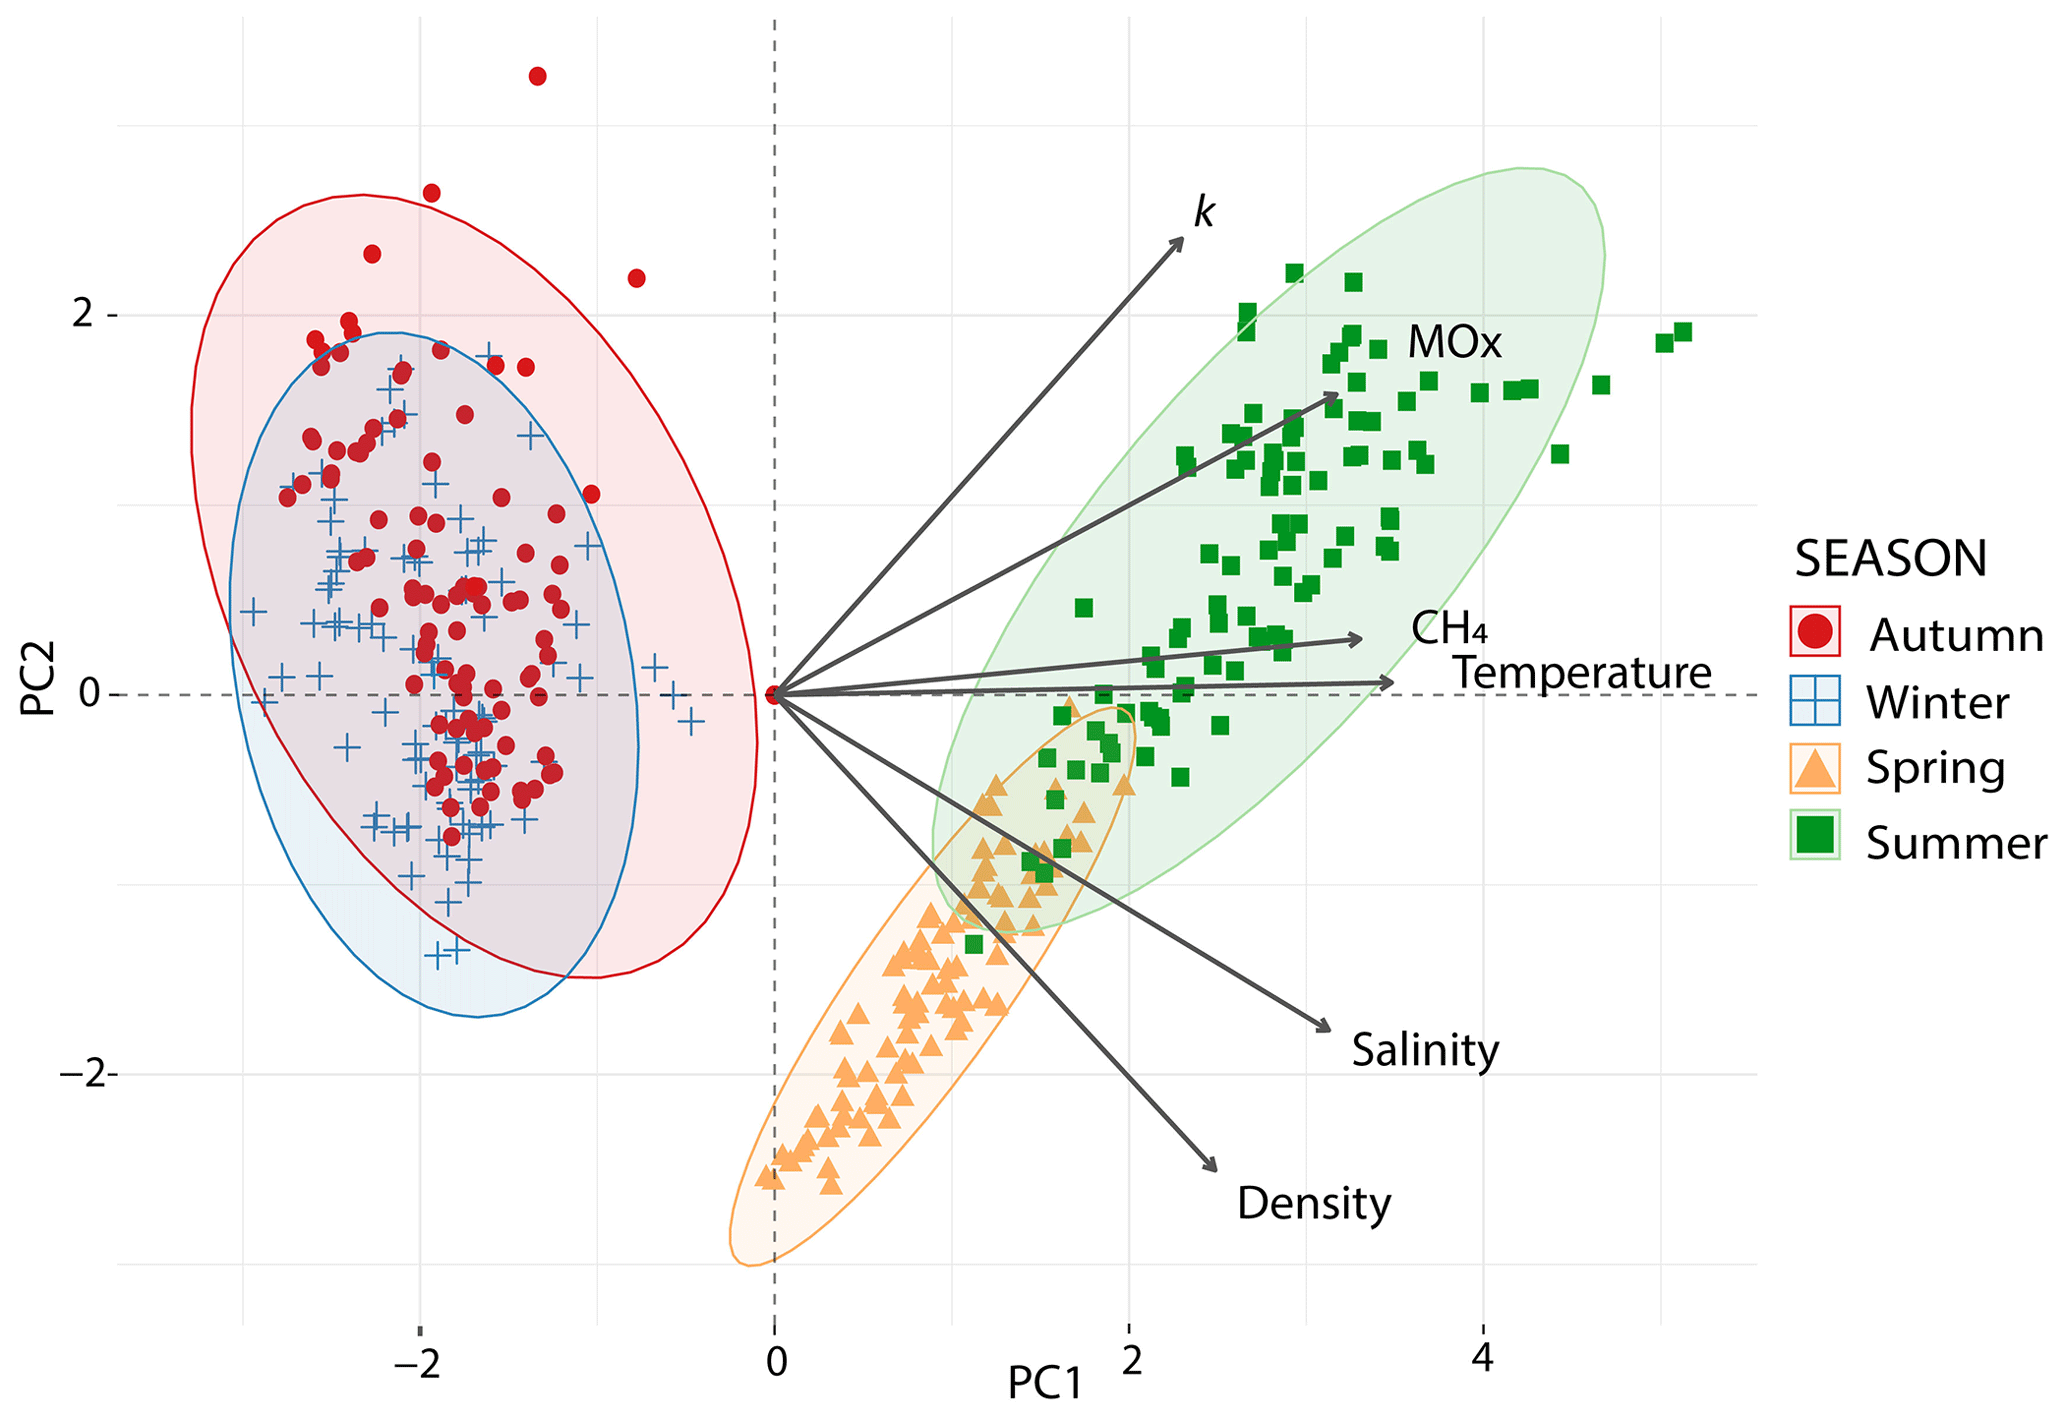
Figure 7Principal component analysis (PCA) of environmental conditions across seasons in the Dutch Wadden Sea. Biplot of a PCA of the explanatory variables as vectors (in black) and observations (marks) of each season on the first (x axis, PC1) and second principal component (y axis, PC2). Coloured concentration ellipses (size determined by a 0.95 probability level) show the observations grouped by season. The magnitude of the vectors (line length) shows the strength of their contribution to the principal components. Vectors pointing in similar directions indicate positively correlated variables and vectors at angles >90∘ indicate no correlation.
Methane release from sediments and the relatively low wind speed (and thus relatively low forcing to drive diffusive efflux) in summer led to charging of the water column with methane. MOx discriminates against isotopically heavy methane and thus causes an isotopic enrichment of residual methane. The isotopic discrimination effect manifests more pronouncedly at low methane concentrations. Indeed, we found more pronounced MOx-induced isotopic discrimination effects in autumn at low methane concentrations (<21 nM). At higher methane concentrations (>21 nM) values were more depleted and were comparable to summer δD-CH4 values. We relate the δD-CH4 values ( ‰ in autumn and ‰ in summer) at higher methane concentrations (>21 nM in autumn and >61 nM in summer) to the δD-CH4 source signal (Figs. 4a, 5). At these concentrations, the isotope effect imposed by MOx is masked by the high background methane and/or is overprinted by methane entering the water column from sediments.
4.3 Differences in MOx on seasonal timescales
The activity of MOB in the water column is determined by the availability of methane oxygen and nutrients and the size of the standing stock of the MOB community (Reeburgh, 2007; Crespo-Medina et al., 2014; Steinle et al., 2015). The Wadden Sea water column is a nutrient-rich and typically oxygenated environment; we hence argue that nutrient and O2 availability are not limiting factors for MOB activity. However, MOB in the Wadden Sea need to cope with high fluctuations in temperature, salinity and methane availability (see above).
We did not measure the size of the MOB community; nevertheless, it seems likely that the highly variable water column properties with admixture of different water masses and resuspension of particles affect the standing stock of the MOB community or its activity or a combination of both. Notably, North Sea waters with potentially low MOB standing stock (indicated by the low k value at the reference station) enter the Wadden Sea during incoming tides. As these waters traverse through the Wadden Sea, they acquire methane and likely carry microbes irrigated from sediments and/or originating from mixing with terrestrial waters; incoming North Sea waters hence undergo oceanographic (see above) and biogeochemical overprinting. On short timescales, microbes carried with the tidal current through the Wadden Sea will consequently be exposed to variable conditions regarding salinity and temperature levels and methane concentration.
Previous studies showed that elevated salinity often led to an immediate decrease in MOx in terrestrial/lacustrine systems (Ho et al., 2018; Zhang et al., 2023). Likewise, marine methanotrophs seem to function best at salinity levels of >20 psu (Osudar et al., 2017), while a sudden decrease in salinity can strongly inhibit MOx (Hirayama et al., 2013; Tavormina et al., 2015). This begs the question of whether waters with rapidly changing salinity levels such as the Wadden Sea are environments that are not especially conducive for MOx, in particular in colder months where salinity levels may drop to ∼20 psu because of elevated freshwater influx (see above). While MOx was indeed lower in autumn and winter, the relative decrease in MOx was moderate in comparison to the previous literature findings (Osudar et al., 2017; Zhang et al., 2023). Also, autumn and winter are colder and defined by lower methane levels, which reduces MOx further. Across seasons, the PCA (Fig. 7) and Pearson correlation coefficients of pairs of variables (Fig. S3) indicated that MOx (or k) and salinity (or density) are not or only weakly correlated. The Wadden Sea thus seems to host a euryhaline MOB community that contrast with MOB communities from terrestrial/lacustrine (Zhang et al., 2023) and oceanic origin (Osudar et al., 2015), which seem less able to cope with varying salinity levels.
Sediments and the water column in the Wadden Sea are increasingly fuelled by methane when ambient temperatures rise. The higher availability of methane could then enhance methanotrophic activity (Reeburgh, 2007). Indeed, we found a seasonal imprint with the highest MOx levels in summer that were 3-fold higher than those observed in spring, 9-fold higher than in autumn and 10-fold higher than in winter (Table 2). A correlation between methane, temperature and MOx was also apparent from the PCA (Figs. 7, S3). We note that not only MOx but also the first-order rate constant k was stimulated by higher methane concentrations (MOx is a function of k and [CH4]; see Eq. 3) and temperature. A positive effect of methane on MOx and k is often associated with changes in methane concentrations over several orders of magnitude (Crespo-Medina et al., 2014; James et al., 2016). Here we found that k doubled in summer compared to spring, while methane concentrations were only 30 nM higher, i.e. 1.7-fold. This suggests that a combination of methane availability and temperature determined k in our study; i.e. the MOB may have been stimulated on the enzymatic level. However, the fact that k remained stable in colder seasons with low water temperatures suggests that additional factors, likely MOB community size (Steinle et al., 2015), might play a more important role in maintaining k. For example, MOB from sediments can be resuspended into the water column due to tidal currents or transported from sediments to the water column with bubbles as has been found at other cold seeps (Steinle et al., 2016; Jordan et al., 2020; Jordan et al., 2021). Resuspension could thus be a key driver of the Wadden Sea water column MOB communities, with major consequences for maintaining a microbial filter under less favourable conditions.
4.4 Methane dynamics on timescales of hours to days
Strong hydraulic dynamics are an important characteristic of the Dutch Wadden Sea, with tidal currents interchanging a large water volume with the North Sea twice per day (Gräwe et al., 2016). With the change in tidal phase, the hydrostatic pressure changes rapidly with water depth, which triggers porewater flow (tidal pumping; Røy et al., 2008; Santos et al., 2015)) but may also trigger the expansion and ebullition of gas bubbles (Schmale et al., 2015; Jordan et al., 2020). Similar effects are caused by tidal currents flowing over bathymetric features, which triggers porewater flow, too, and additionally resuspends sediments and MOB into the water column (Bussmann, 2005; Abril et al., 2007; Røy et al., 2008). On the other hand, incoming water from the open North Sea contains relatively low amounts of methane (<6 nM as measured at our reference station); hence, this will dilute the Dutch Wadden Sea's methane content, and outflowing water will export methane from the Dutch Wadden Sea main waterbody.
Temporal patterns of methane concentration and MOx did indeed correlate well with tidal oscillation (Figs. 3, S1, Table 2). Independent of the seasons, methane concentrations and MOx were elevated at LT. The tidal effect seemed most pronounced in spring, where at LT, methane concentrations (1.3-fold), k (2.5-fold) and MOx (4-fold) were higher than at HT, independent of depth. We found it surprising that, just like methane concentrations, k also was substantially higher during LT compared to HT independent of seasons and despite an overall lower salinity at low tide (Figs. 3, S1, Table 2). To the best of our knowledge, this has not been described before. It seems unlikely that the MOB community substantially grew or that the velocity of the MOB's metabolism increased/decreased in a time frame of a few hours. We argue instead that the observed oscillation is caused by a corresponding oscillation of shear force and hydrostatic pressure, leading to resuspension of MOB from sediments as well as elevated release of methane from the sea floor.
Grunwald et al. (2007, 2009) conducted time series measurements in the German sector of the Wadden Sea near the island of Spiekeroog. There, absolute methane concentrations were ∼3-fold higher in spring and summer and ∼15-fold higher in winter when compared to our study. This might be related to local factors, for example the vicinity of the estuaries of the rivers Ems and more importantly Weser close to Spiekeroog, which increase the background methane concentrations in this sector of the Wadden Sea. Like in our study, Grunwald et al. (2007, 2009) also reported a strong influence of tides, with the highest methane concentrations at low tide, probably related to tidal pumping, while inflowing waters showed concentrations typical for the open North Sea in the German Bight. The temporal aspects and processes determining methane dynamics discussed in our work are thus not a local feature but applicable to the entire Wadden Sea and likely to other mud flat areas influenced by tides, too.
4.5 Methane emissions from the Dutch Wadden Sea
Surface waters were supersaturated with methane with respect to the atmospheric equilibrium during all seasons; the Wadden Sea is consequently a constant source of methane to the atmosphere. Just as for dissolved methane concentrations and MOx, methane efflux to the atmosphere was higher during warmer seasons compared to colder seasons. This was primarily driven by methane concentrations rather than wind velocity: wind speeds were similar in autumn, winter and spring, but 2-fold higher methane concentrations in spring translate to a 4-fold higher sea–air flux when compared to autumn and winter. In summer, meteorological conditions were dominated by a heat wave with extremely low wind speeds. This resulted in a comparably low methane efflux to the atmosphere (though still higher than during the colder seasons) leading to an accumulation of methane in the water column. Previously described diffusive methane fluxes at coastal systems vary over several orders of magnitude and appear site specific. For instance, at the Baltic sea coast, fluxes of up to 15 µmol m−2 d−1 have been reported (Bange et al., 2010; Steinle et al., 2017), while in Arctic shelf seas, diffusive fluxes of up to 240 µmol m−2 d−1 were found (Thornton et al., 2016). In the Southern Bight of the North Sea, reported fluxes at the coast were up to 345 µmol m−2 d−1 (Borges et al., 2018). In comparison, estuarine research along the European Atlantic coast found a median flux of 130 µmol m−2 d−1 (Middelburg et al., 2002), which is similar to the fluxes that we found in the Dutch Wadden Sea (∼39 to 145 µmol m−2 d−1). Globally, tidal flats were estimated to emit CH4 at a median rate of ∼3.6 mg m−2 d−1 (226 µmol m−2 d−1; Rosentreter et al., 2021), which is similar (1.5 to 6-fold higher) than our flux estimates from the Wadden Sea.
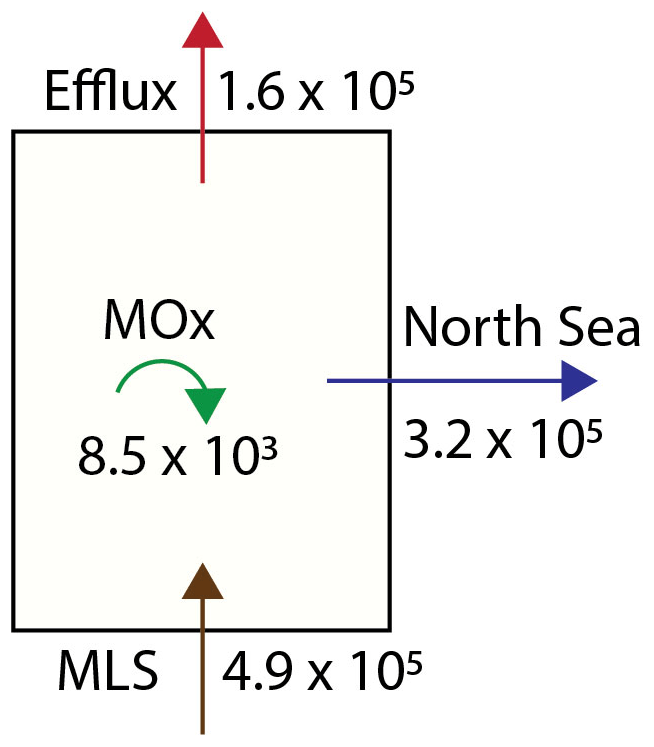
Figure 8The methane budget for the Dutch Wadden Sea is calculated based on values for the Wadden Sea's geometry, tidal displacement volume and biogeochemical parameters as discussed in the text. MLS stands for methane liberation from sediments. All values are presented as mol CH4 d−1.
Towards a roughly estimated methane budget for the Dutch Wadden Sea, we combined our diffusive flux, MOx and methane concentration data (Fig. 8) as well as estimates of the Wadden Sea water volume and tidal prism. Our flux estimates (Table 2) translate to an annual average sea-surface–atmosphere flux of 74 µmol m2 d−1. Extrapolating this to the area of the Dutch sector of the Wadden Sea (∼2200 km2; Materić et al., 2022) implies that 1.6×10⁵ mol CH4 d−1 escapes from the Dutch Wadden Sea to the atmosphere (Table 2). The average water volume of the Dutch Wadden Sea is about 5.15 km3 (Materić et al., 2022); hence the annual average of 1.7 nM d−1 of MOx translates to 0.09×10⁵ mol CH4 d−1 that is oxidized in the water column by MOB. In addition to atmospheric efflux and microbial consumption, methane-rich waters are also flushed into the North Sea. To estimate this, we simplified that the total tidal prism of 4.5 km3 (Gräwe et al., 2016) is an approximation of the net amount of water that leaves the Wadden Sea during LT. With respect to our measured mean methane concentration (36.8 nM), about 1.6×10⁵ mol of methane is thus flushed towards the North Sea twice daily, i.e. 3.2×10⁵ mol d−1. A large uncertainty in this calculation is caused by the delay of ∼3 h in tidal phases between the western and eastern part of the Dutch Wadden Sea. In other words, methane-rich waters flowing out of the tidal inlet in the west can be entrained in the current that starts flowing back into the Wadden Sea at eastern tidal inlets. Therefore, the net loss of methane to the Wadden Sea is probably lower than described above. Still, data from our reference station show only slightly oversaturated methane concentrations (<6 nM) suggesting that the amount of methane flowing back into the Wadden Sea is rather low. A similar observation was found during a tidal inlet study in the German Wadden Sea (Grunwald et al., 2009). Though overall methane concentrations were higher, methane concentrations in North Sea waters flowing into the Wadden Sea were 60 % lower compared to waters flowing out of the Wadden Sea at low tide. Excluding allochthonous methane sources (for example methane influx with freshwater from Lake IJssel), the Dutch Wadden Sea's methane budget must be supported by a total rate of methanogenesis that at least equals the sum of methane efflux to the atmosphere, water column methanotrophy and methane outflow to the North Sea; together these amount to 4.9×10⁵ mol d−1. Per square metre, this is comparable to methanogenesis rates in the Eckernförde Bay in the Baltic Sea (Maltby et al., 2018). Note that this accounts for the amount of methane liberated from sediments, while it neglects methane oxidation in sediments (dominantly anaerobic oxidation of methane), which can retain a substantial fraction of methane in sediments (Reeburgh, 2007). Hence, the total rate of methanogenesis in the Wadden Sea is consequently much higher.
Taken all methane export terms and sinks considered together (MOx, efflux and tidal displacement amounting to 4.9×10⁵ mol d−1), MOx reduces roughly 2 % of the Wadden Sea's methane budget, while about of methane escapes to the atmosphere and the remaining are flushed into the North Sea (where it may be further oxidized and released to the atmosphere). The effect of MOx on the Wadden Sea's methane budget is low when compared to the global ocean, where an estimated >90 % of water column methane is consumed by MOx (Reeburgh, 2007). As the Wadden Sea is very shallow, liberation of methane from sediments to the atmosphere is fast; in other words, MOB have a very limited time to consume methane released from the sediments before it is liberated to the atmosphere or flushed with tides to the North Sea. In a meta-study, Rosentreter et al. (2021) estimated a global median methane efflux from tidal flats (covering ∼128 000 km2 globally; Murray et al., 2019) to the atmosphere of 0.17 Tg yr−1. We found a total annual diffusive sea–air flux from the Dutch sector of the Wadden Sea (2200 km2) of ∼0.001 Tg yr−1, which alone already accounts for 0.6 % of the global methane emissions from tidal flats to the atmosphere.
Our work revealed substantial variations in methane dynamics when comparing colder and warmer seasons; in warmer seasons, methane concentrations, efflux and MOx were higher compared to colder seasons. Still, during colder seasons waters were continuously supersaturated with methane, and higher wind speeds in these seasons led to substantial amounts of methane released to the atmosphere. We show that tidal dynamics are a key control for methanotrophic activity and methane distribution. Although changing water column properties and methane concentrations do not provide continuity, the capacity of the microbial methane filter is seemingly stable, with an active MOB community even under unfavourable conditions. Nevertheless, MOx only consumes a minor fraction of the methane inventory of the highly dynamic Wadden Sea, while most is liberated to the atmosphere and flushed out with tidal currents into the neighbouring North Sea. It appears likely that the contribution of the Wadden Sea to the global atmospheric methane budget will alter in the future due to global warming and changes in nutrient availability and more frequently occurring storm events. Finally, our results highlight the importance of repeated high-frequency sampling strategies in dynamic coastal waters to resolve temporal patterns on diel and seasonal scales.
All data will be archived and made publicly available in the database DAS (Data Archive System, https://doi.org/10.25850/nioz/7b.b.pf, de Groot, 2023).
The supplement related to this article is available online at: https://doi.org/10.5194/bg-20-3857-2023-supplement.
The study was designed by TRdG, TR and HN. On-board sampling was performed by TRdG, AMM, KM, JCE, PR and HN. Further geochemical analysis was conducted by TRdG, AMM, KM and RN. Microbial rates were measured by TRdG and AMM. Statistical analysis was carried out by TRdG and PR. HN supervised the research project. The paper was prepared by TRdG with input from all authors.
At least one of the (co-)authors is a member of the editorial board of Biogeosciences. The peer-review process was guided by an independent editor, and the authors also have no other competing interests to declare.
Publisher’s note: Copernicus Publications remains neutral with regard to jurisdictional claims in published maps and institutional affiliations.
Our gratitude goes to the captain and crew of R/V Navicula as well as the staff of the geochemical, radioisotope and atmospheric laboratories at NIOZ and IMAU, for their exceptional support. We would also like to extend our appreciation to Eric Wagemaakers for regularly calibrating the CTD.
This paper was edited by Hermann Bange and reviewed by two anonymous referees.
Abril, G., Commarieu, M.-V., and Guérin, F.: Enhanced methane oxidation in an estuarine turbidity maximum, Limnol. Oceanogr., 52, 470–475, https://doi.org/10.4319/lo.2007.52.1.0470, 2007.
Bange, H. W., Bartell, U. H., Rapsomanikis, S., and Andreae, M. O.: Methane in the Baltic and North Seas and a reassessment of the marine emissions of methane, Global Biogeochem. Cy. 8, 465–480, https://doi.org/10.1029/94GB02181, 1994.
Bange, H. W., Bergmann, K., Hansen, H. P., Kock, A., Koppe, R., Malien, F., and Ostrau, C.: Dissolved methane during hypoxic events at the Boknis Eck time series station (Eckernförde Bay, SW Baltic Sea), Biogeosciences, 7, 1279–1284, https://doi.org/10.5194/bg-7-1279-2010, 2010.
Barker, J. F. and Fritz, P.: Carbon isotope fractionation during microbial methane oxidation, Nature, 293, 289–291, https://doi.org/10.1038/293289a0, 1981.
Beck, M. and Brumsack, H.-J.: Biogeochemical cycles in sediment and water column of the Wadden Sea: The example Spiekeroog Island in a regional context, Ocean Coast. Manage., 68, 102–113, https://doi.org/10.1016/j.ocecoaman.2012.05.026, 2012.
Boetius, A. and Wenzhöfer, F.: Seafloor oxygen consumption fuelled by methane from cold seeps, Nat. Geosci., 6, 725–734, https://doi.org/10.1038/ngeo1926, 2013.
Borges, A. V., Speeckaert, G., Champenois, W., Scranton, M. I., and Gypens, N.: Productivity and Temperature as Drivers of Seasonal and Spatial Variations of Dissolved Methane in the Southern Bight of the North Sea, Ecosystems, 21, 583–599, https://doi.org/10.1007/s10021-017-0171-7, 2018.
Bussmann, I.: Methane Release through Resuspension of Littoral Sediment, Biogeochemistry, 74, 283–302, https://doi.org/10.1007/s10533-004-2223-2, 2005.
Canadell, J. G., Monteiro, P. M. S., Costa, M. H., Cotrim da Cunha, L., Cox, P. M., Eliseev, A. V., Henson, S., Ishii, M., Jaccard, S., Koven, C., Lohila, A., Patra, P. K., Piao, S., Rogelj, J., Syampungani, S., Zaehle, S., and Zickfeld, K.: Global Carbon and other Biogeochemical Cycles and Feedbacks, in: Climate Change 2021: The Physical Science Basis. Contribution of Working Group I to the Sixth Assessment Report of the Intergovernmental Panel on Climate Change, edited by: Masson-Delmotte, V., Zhai, P., Pirani, A., Connors, S. L., Péan, C., Berger, S., Caud, N., Chen, Y., Goldfarb, L., Gomis, M. I., Huang, M., Leitzell, K., Lonnoy, E., Matthews, J. B. R., Maycock, T. K., Waterfield, T., Yelekçi, O., Yu, R., and Zhou, B., Cambridge University Press, 673–816, https://doi.org/10.1017/9781009157896.007, 2021.
Crespo-Medina, M., Meile, C. D., Hunter, K. S., Diercks, A. R., Asper, V. L., Orphan, V. J., Tavormina, P. L., Nigro, L. M., Battles, J. J., Chanton, J. P., Shiller, A. M., Joung, D. J., Amon, R. M. W., Bracco, A., Montoya, J. P., Villareal, T. A., Wood, A. M., and Joye, S. B.: The rise and fall of methanotrophy following a deepwater oil-well blowout, Nat. Geosci., 7, 423–427, https://doi.org/10.1038/ngeo2156, 2014.
de Groot, T.: Wadden Sea manuscript available data, V4, NIOZ [data set], https://doi.org/10.25850/nioz/7b.b.pf, 2023.
Duran-Matute, M., Gerkema, T., de Boer, G. J., Nauw, J. J., and Gräwe, U.: Residual circulation and freshwater transport in the Dutch Wadden Sea: a numerical modelling study, Ocean Sci., 10, 611–632, https://doi.org/10.5194/os-10-611-2014, 2014.
Etminan, M., Myhre, G., Highwood, E. J., and Shine, K. P.: Radiative forcing of carbon dioxide, methane, and nitrous oxide: A significant revision of the methane radiative forcing, Geophys. Res. Lett., 43, 12614–12623, https://doi.org/10.1002/2016gl071930, 2016.
Gräwe, U., Flöser, G., Gerkema, T., Duran-Matute, M., Badewien, T. H., Schulz, E., and Burchard, H.: A numerical model for the entire Wadden Sea: Skill assessment and analysis of hydrodynamics, J. Geophys. Res.-Oceans, 121, 5231–5251, https://doi.org/10.1002/2016jc011655, 2016.
Green, J. D.: Headspace analysis Static, in: Encyclopedia of Analytical Science (Second Edition), edited by: Worsfold, P., Townshend, A., and Poole, C., Elsevier, Oxford, 229–236, https://doi.org/10.1016/B0-12-369397-7/00254-5, 2005.
Gründger, F., Probandt, D., Knittel, K., Carrier, V., Kalenitchenko, D., Silyakova, A., Serov, P., Ferré, B., Svenning, M. M., and Niemann, H.: Seasonal shifts of microbial methane oxidation in Arctic shelf waters above gas seeps, Limnol. Oceanogr., 66, 1896–1914, https://doi.org/10.1002/lno.11731, 2021.
Grunwald, M., Dellwig, O., Liebezeit, G., Schnetger, B., Reuter, R., and Brumsack, H.-J.: A novel time-series station in the Wadden Sea (NW Germany): First results on continuous nutrient and methane measurements, Mar. Chem., 107, 411–421, https://doi.org/10.1016/j.marchem.2007.04.003, 2007.
Grunwald, M., Dellwig, O., Beck, M., Dippner, J. W., Freund, J. A., Kohlmeier, C., Schnetger, B., and Brumsack, H.-J.: Methane in the southern North Sea: Sources, spatial distribution and budgets, Estuarine, Coast. Shelf Sci., 81, 445–456, https://doi.org/10.1016/j.ecss.2008.11.021, 2009.
Hanson, R. S. and Hanson, T. E.: Methanotrophic Bacteria, Microbiol. Rev., 60, 439–471, 1996.
He, R., Wooller, M. J., Pohlman, J. W., Quensen, J., Tiedje, J. M., and Leigh, M. B.: Shifts in Identity and Activity of Methanotrophs in Arctic Lake Sediments in Response to Temperature Changes, Appl. Environ. Microb., 78, 4715–4723, https://doi.org/10.1128/AEM.00853-12, 2012.
Hirayama, H., Fuse, H., Abe, M., Miyazaki, M., Nakamura, T., Nunoura, T., Furushima, Y., Yamamoto, H., and Takai, K.: Methylomarinum vadi gen. nov., sp. nov., a methanotroph isolated from two distinct marine environments, Int. J. Syst. Evol. Microb., 63, 1073–1082, https://doi.org/10.1099/ijs.0.040568-0, 2013.
Ho, A., Mo, Y., Lee, H. J., Sauheitl, L., Jia, Z., and Horn, M. A.: Effect of salt stress on aerobic methane oxidation and associated methanotrophs; a microcosm study of a natural community from a non-saline environment, Soil Biol. Biochem., 125, 210–214, https://doi.org/10.1016/j.soilbio.2018.07.013, 2018.
Jacques, C., Gkritzalis, T., Tison, J.-L., Hartley, T., van der Veen, C., Röckmann, T., Middelburg, J. J., Cattrijsse, A., Egger, M., Dehairs, F., and Sapart, C. J.: Carbon and Hydrogen Isotope Signatures of Dissolved Methane in the Scheldt Estuary, Estuar. Coasts, 44, 137–146, https://doi.org/10.1007/s12237-020-00768-3, 2021.
Jähne, B., münnich, K. O., Bösinger, R., Dutzi, A., Huber, W., and Libner, P.: On the parameters influencing air-water gas exchange, J. Geophys. Res.-Oceans, 92, 1937–1949, https://doi.org/10.1029/JC092iC02p01937, 1987.
James, R. H., Bousquet, P., Bussmann, I., Haeckel, M., Kipfer, R., Leifer, I., Niemann, H., Ostrovsky, I., Piskozub, J., Rehder, G., Treude, T., Vielstädte, L., and Greinert, J.: Effects of climate change on methane emissions from seafloor sediments in the Arctic Ocean: A review, Limnol. Oceanogr., 61, 283–299, https://doi.org/10.1002/lno.10307, 2016.
Jordan, S. F. A., Gräwe, U., Treude, T., van der Lee, E. M., Schneider von Deimling, J., Rehder, G., and Schmale, O.: Pelagic Methane Sink Enhanced by Benthic Methanotrophs Ejected From a Gas Seep, Geophys. Res. Lett., 48, e2021GL094819, https://doi.org/10.1029/2021GL094819, 2021.
Jordan, S. F. A., Treude, T., Leifer, I., Janssen, R., Werner, J., Schulz-Vogt, H., and Schmale, O.: Bubble-mediated transport of benthic microorganisms into the water column: Identification of methanotrophs and implication of seepage intensity on transport efficiency, Sci. Rep., 10, 4682, https://doi.org/10.1038/s41598-020-61446-9, 2020.
Knief, C.: Diversity and Habitat Preferences of Cultivated and Uncultivated Aerobic Methanotrophic Bacteria Evaluated Based on pmoA as Molecular Marker, Front. Microb., 6, 1346, https://doi.org/10.3389/fmicb.2015.01346, 2015.
Lan, X., Thoning, K. W., and Dlugokencky, E. J.: Trends in globally-averaged CH4, N2O, and SF6 determined from NOAA Global Monitoring Laboratory measurements, Version 2023-06, https://doi.org/10.15138/P8XG-AA10, 2022.
Lê, S., Josse, J., and Husson, F.: FactoMineR: An R Package for Multivariate Analysis, J. Stat. Softw., 25, 1–18, https://doi.org/10.18637/jss.v025.i01, 2008.
Mariotti, A., Germon, J. C., Hubert, P., Kaiser, P., Letolle, R., Tardieux, A., and Tardieux, P.: Experimental determination of nitrogen kinetic isotope fractionation: Some principles; illustration for the denitrification and nitrification processes, Plant Soil, 62, 413–430, 10.1007/BF02374138, 1981.
Materić, D., Holzinger, R., and Niemann, H.: Nanoplastics and ultrafine microplastic in the Dutch Wadden Sea – The hidden plastics debris?, Sci. Total Environ., 846, 157371, https://doi.org/10.1016/j.scitotenv.2022.157371, 2022.
Mau, S., Blees, J., Helmke, E., Niemann, H., and Damm, E.: Vertical distribution of methane oxidation and methanotrophic response to elevated methane concentrations in stratified waters of the Arctic fjord Storfjorden (Svalbard, Norway), Biogeosciences, 10, 6267–6278, https://doi.org/10.5194/bg-10-6267-2013, 2013.
Middelburg, J. J., Nieuwenhuize, J., Iversen, N., Høgh, N., de Wilde, H., Helder, W., Seifert, R., and Christof, O.: Methane distribution in European tidal estuaries, Biogeochemistry, 59, 95–119, https://doi.org/10.1023/A:1015515130419, 2002.
Murray, N. J., Phinn, S. R., DeWitt, M., Ferrari, R., Johnston, R., Lyons, M. B., Clinton, N., Thau, D., and Fuller, R. A.: The global distribution and trajectory of tidal flats, Nature, 565, 222–225, https://doi.org/10.1038/s41586-018-0805-8, 2019.
Niemann, H., Steinle, L., Blees, J., Bussmann, I., Treude, T., Krause, S., Elvert, M., and Lehmann, M. F.: Toxic effects of lab-grade butyl rubber stoppers on aerobic methane oxidation, Limnol. Oceanogr.-Meth., 13, 40–52, https://doi.org/10.1002/lom3.10005, 2015.
Osudar, R., Klings, K. W., Wagner, D., and Bussmann, I.: Effect of salinity on microbial methane oxidation in freshwater and marine environments, Aquat. Microb. Ecol., 80, 181–192, 2017.
Osudar, R., Matoušů, A., Alawi, M., Wagner, D., and Bussmann, I.: Environmental factors affecting methane distribution and bacterial methane oxidation in the German Bight (North Sea), Estuar. Coast. Shelf Sci., 160, 10–21, https://doi.org/10.1016/j.ecss.2015.03.028, 2015.
Philippart, C. J. M., van Iperen, J. M., Cadée, G. C., and Zuur, A. F.: Long-term Field Observations on Seasonality in Chlorophyll-a Concentrations in a Shallow Coastal Marine Ecosystem, the Wadden Sea, Estuar. Coast., 33, 286–294, https://doi.org/10.1007/s12237-009-9236-y, 2009.
Reeburgh, W. S.: Oceanic Methane Biogeochemistry, Chem. Rev., 107, 486–513, https://doi.org/10.1021/cr050362v, 2007.
R Core Team: R: A language and environment for statistical computing. R Foundation for Statistical Computing, Vienna, Austria, R version 4.2.2, https://www.r-project.org/ (last access: 31 October 2022), 2022.
Röckmann, T., Eyer, S., van der Veen, C., Popa, M. E., Tuzson, B., Monteil, G., Houweling, S., Harris, E., Brunner, D., Fischer, H., Zazzeri, G., Lowry, D., Nisbet, E. G., Brand, W. A., Necki, J. M., Emmenegger, L., and Mohn, J.: In situ observations of the isotopic composition of methane at the Cabauw tall tower site, Atmos. Chem. Phys., 16, 10469–10487, https://doi.org/10.5194/acp-16-10469-2016, 2016.
Rosentreter, J. A., Borges, A. V., Deemer, B. R., Holgerson, M. A., Liu, S., Song, C., Melack, J., Raymond, P. A., Duarte, C. M., Allen, G. H., Olefeldt, D., Poulter, B., Battin, T. I., and Eyre, B. D.: Half of global methane emissions come from highly variable aquatic ecosystem sources, Nat. Geosci., 14, 225–230, https://doi.org/10.1038/s41561-021-00715-2, 2021.
Røy, H., Lee, J. S., Jansen, S., and de Beer, D.: Tide-driven deep pore-water flow in intertidal sand flats, Limnol. Oceanogr., 53, 1521–1530, https://doi.org/10.4319/lo.2008.53.4.1521, 2008.
Santos, I. R., Beck, M., Brumsack, H.-J., Maher, D. T., Dittmar, T., Waska, H., and Schnetger, B.: Porewater exchange as a driver of carbon dynamics across a terrestrial-marine transect: Insights from coupled 222Rn and pCO2 observations in the German Wadden Sea, Mar. Chem., 171, 10–20, https://doi.org/10.1016/j.marchem.2015.02.005, 2015.
Saunois, M., Stavert, A. R., Poulter, B., Bousquet, P., Canadell, J. G., Jackson, R. B., Raymond, P. A., Dlugokencky, E. J., Houweling, S., Patra, P. K., Ciais, P., Arora, V. K., Bastviken, D., Bergamaschi, P., Blake, D. R., Brailsford, G., Bruhwiler, L., Carlson, K. M., Carrol, M., Castaldi, S., Chandra, N., Crevoisier, C., Crill, P. M., Covey, K., Curry, C. L., Etiope, G., Frankenberg, C., Gedney, N., Hegglin, M. I., Höglund-Isaksson, L., Hugelius, G., Ishizawa, M., Ito, A., Janssens-Maenhout, G., Jensen, K. M., Joos, F., Kleinen, T., Krummel, P. B., Langenfelds, R. L., Laruelle, G. G., Liu, L., Machida, T., Maksyutov, S., McDonald, K. C., McNorton, J., Miller, P. A., Melton, J. R., Morino, I., Müller, J., Murguia-Flores, F., Naik, V., Niwa, Y., Noce, S., O'Doherty, S., Parker, R. J., Peng, C., Peng, S., Peters, G. P., Prigent, C., Prinn, R., Ramonet, M., Regnier, P., Riley, W. J., Rosentreter, J. A., Segers, A., Simpson, I. J., Shi, H., Smith, S. J., Steele, L. P., Thornton, B. F., Tian, H., Tohjima, Y., Tubiello, F. N., Tsuruta, A., Viovy, N., Voulgarakis, A., Weber, T. S., van Weele, M., van der Werf, G. R., Weiss, R. F., Worthy, D., Wunch, D., Yin, Y., Yoshida, Y., Zhang, W., Zhang, Z., Zhao, Y., Zheng, B., Zhu, Q., Zhu, Q., and Zhuang, Q.: The Global Methane Budget 2000–2017, Earth Syst. Sci. Data, 12, 1561–1623, https://doi.org/10.5194/essd-12-1561-2020, 2020.
Schmale, O., Leifer, I., Deimling, J. S. v., Stolle, C., Krause, S., Kießlich, K., Frahm, A., and Treude, T.: Bubble Transport Mechanism: Indications for a gas bubble-mediated inoculation of benthic methanotrophs into the water column, Cont. Shelf Res., 103, 70–78, https://doi.org/10.1016/j.csr.2015.04.022, 2015.
Steinle, L., Maltby, J., Treude, T., Kock, A., Bange, H. W., Engbersen, N., Zopfi, J., Lehmann, M. F., and Niemann, H.: Effects of low oxygen concentrations on aerobic methane oxidation in seasonally hypoxic coastal waters, Biogeosciences, 14, 1631–1645, https://doi.org/10.5194/bg-14-1631-2017, 2017.
Steinle, L., Schmidt, M., Bryant, L., Haeckel, M., Linke, P., Sommer, S., Zopfi, J., Lehmann, M. F., Treude, T., and Niemannn, H.: Linked sediment and water-column methanotrophy at a man-made gas blowout in the North Sea: Implications for methane budgeting in seasonally stratified shallow seas, Limnol. Oceanogr., 61, 367–386, https://doi.org/10.1002/lno.10388, 2016.
Steinle, L., Graves, A. C., Treude, T., Ferré, B., Biastoch, A., Bussmann, I., Berndt, C., Krastel, S., James, R. H., Behrens, E., Böning, C. W., Greinert, J., Sapart, C., Scheinert, M., Sommer, S., Lehmann, M. F., and Niemann, H.: Water column methanotrophy controlled by a rapid oceanographic switch, Nat. Geosci., 8, 378–382, https://doi.org/10.1038/ngeo2420, 2015.
Tavormina, P. L., Hatzenpichler, R., McGlynn, S., Chadwick, G., Dawson, K. S., Connon, S. A., and Orphan, V. J.: Methyloprofundus sedimenti gen. nov., sp. nov., an obligate methanotroph from ocean sediment belonging to the “deep sea-1” clade of marine methanotrophs, Int. J. Syst. Evol. Microb., 65, 251–259, https://doi.org/10.1099/ijs.0.062927-0, 2015.
Thornton, B. F., Geibel, M. C., Crill, P. M., Humborg, C., and mörth, C.-M.: Methane fluxes from the sea to the atmosphere across the Siberian shelf seas, Geophys. Res. Lett., 43, 5869–5877, https://doi.org/10.1002/2016GL068977, 2016.
van Aken, H. M.: Variability of the salinity in the western Wadden Sea on tidal to centennial time scales, J. Sea Res., 59, 121–132, https://doi.org/10.1016/j.seares.2007.11.001, 2008.
Wanninkhof, R.: Relationship between wind speed and gas exchange over the ocean revisited, Limnol. Oceanogr.-Meth., 12, 351–362, https://doi.org/10.4319/lom.2014.12.351, 2014.
Weber, T., Wiseman, N. A., and Kock, A.: Global ocean methane emissions dominated by shallow coastal waters, Nat. Commun., 10, 1–10, 2019.
Whiticar, M. J.: Carbon and hydrogen isotope systematics of bacterial formation and oxidation of methane, Chem. Geol., 161, 291–314, https://doi.org/10.1016/S0009-2541(99)00092-3, 1999.
Wiesenberg, D. A. and Guinasso, N. L.: Equilibrium Solubilities of Methane, Carbon Monoxide, and Hydrogen in Water and Sea Water, J. Chem. Eng. Data, 24, 356–360, 1979.
Wu, C. S., Røy, H., and de Beer, D.: Methanogenesis in sediments of an intertidal sand flat in the Wadden Sea, Estuarine, Coast. Shelf Sci., 164, 39–45, https://doi.org/10.1016/j.ecss.2015.06.031, 2015.
Yvon-Durocher, G., Allen, A. P., Bastviken, D., Conrad, R., Gudasz, C., St-Pierre, A., Thanh-Duc, N., and del Giorgio, P. A.: Methane fluxes show consistent temperature dependence across microbial to ecosystem scales, Nature, 507, 488–491, https://doi.org/10.1038/nature13164, 2014.
Zhang, S., Yan, L., Cao, J., Wang, K., Luo, Y., Hu, H., Wang, L., Yu, R., Pan, B., Yu, K., Zhao, J., and Bao, Z.: Salinity significantly affects methane oxidation and methanotrophic community in Inner Mongolia lake sediments, Front. Microbiol., 13, 1067017, https://doi.org/10.3389/fmicb.2022.1067017, 2023.