the Creative Commons Attribution 4.0 License.
the Creative Commons Attribution 4.0 License.
 | 27 Sep 2023
Modeling coupled nitrification–denitrification in soil with an organic hotspot
Elisabeth Larsen Kolstad
Wenxin Zhang
Iris Vogeler
Søren O. Petersen
The emission of nitrous oxide (N2O) from agricultural soils to the atmosphere is a significant contributor to anthropogenic greenhouse gas emissions. The recycling of organic nitrogen (N) in manure and crop residues may result in spatiotemporal variability in N2O production and soil efflux which is difficult to capture by process-based models. We propose a multi-species, reactive transport model to provide detailed insight into the spatiotemporal variability in nitrogen (N) transformations around such N2O hotspots, which consists of kinetic reactions of soil respiration, nitrification, nitrifier denitrification, and denitrification represented by a system of coupled partial differential equations. The model was tested with results from an incubation experiment at two different soil moisture levels (−30 and −100 hPa) and was shown to reproduce the recorded N2O and dinitrogen (N2) emissions and the dynamics of important carbon (C) and N components in soil reasonably well. The simulation indicated that the four different microbial populations developed in closely connected but separate layers, with denitrifying bacteria growing within the manure-dominated zone and nitrifying bacteria in the well-aerated soil outside the manure zone and with time also within the manure layer. The modeled N2O production within the manure zone was greatly enhanced by the combined effect of oxygen deficit, abundant carbon source, and supply of nitrogenous substrates. In the wetter soil treatment with a water potential of −30 hPa, the diffusive flux of nitrate (NO) across the manure–soil interface was the main source of NO for denitrification in the manure zone, while at a soil water potential of −100 hPa, diffusion became less dominant and overtaken by the co-occurrence of nitrification and denitrification in the manure zone. Scenarios were analyzed where the diffusive transport of dissolved organic carbon or different mineral N species was switched off, and they showed that the simultaneous diffusion of NO, ammonium (NH), and nitrite (NO) was crucial to simulate the dynamics of N transformations and N2O emissions in the model. Without considering solute diffusion in process-based N2O models, the rapid turnover of C and N associated with organic hotspots can not be accounted for, and it may result in the underestimation of N2O emissions from soil after manure application. The model and its parameters allow for new detailed insights into the interactions between transport and microbial transformations associated with N2O emissions in heterogeneous soil environments.
- Article
(1167 KB) - Full-text XML
-
Supplement
(3439 KB) - BibTeX
- EndNote


Nitrous oxide (N2O) is a long-lived greenhouse gas (LLGHG) that accumulates in the atmosphere, accounting for about 7 % of the radiative forcing by LLGHGs (World Meteorological Organization, 2021). Globally, N2O emissions increased from 10–12 Tg N yr−1 before the industrial era (Davidson, 2009; Syakila and Kroeze, 2011) to an average of ca. 17 Tg N yr−1 in the last decade (Thompson et al., 2019). Agriculture is the dominant contributor to this change, with emissions having increased from 0.3–1.0 Tg N yr−1 in 1850 to 3.9–5.3 Tg N yr−1 in 2010 (Davidson, 2009; Syakila and Kroeze, 2011; Thompson et al., 2019; Tian et al., 2020). Manure from animal production systems is responsible for as much as 30 %–50 % of the global N2O emissions from agriculture (Oenema et al., 2005). The application of manure to arable land is a widely recommended practice to recycle nitrogen (N) and other nutrients for crop production. However, in a wet temperate climate it is also a large and highly variable source of N2O emissions, of which the extent is determined by manure and soil properties and field management, with liquid manure having the greatest risk for emissions (Charles et al., 2017).
Manure has the potential to stimulate two key biochemical processes governing N2O emissions, nitrification and denitrification. They are both regulated by multiple factors such as temperature, acidity, and availability of electron donors and acceptors, among which the interactions are highly nonlinear and difficult to predict with simple approaches (Tian et al., 2020). Such interactions may create hotspots and hot moments of N2O emissions at small scales and have implications at landscape scales (Butterbach-Bahl et al., 2013; Groffman et al., 2009; Wagner-Riddle et al., 2020). Short-lived pulses of N2O emissions can be induced by precipitation if anoxic soil conditions develop owing to impeded oxygen (O2) supply from the atmosphere, provided that mineral nitrogen is present (Christensen et al., 1990a; Sexstone et al., 1985). In agricultural soils, however, manure and crop residues rich in degradable organic matter can also develop anoxic conditions by acting as a temporary sink for O2, leading to local anoxia even in well-drained soil (Christensen et al., 1990b; Kravchenko et al., 2017) with a temporal stability that allows for microbial growth (Petersen et al., 1992, 1996). Accordingly, high spatial and temporal variations in nitrification and denitrification activity, and N2O emissions, have been reported in manure- and plant-residue-amended soils (Kravchenko et al., 2017; Petersen et al., 1992; Taghizadeh-Toosi et al., 2021). When modeling nitrification and denitrification activity in soil, it is important to be able to include the effects of such hotspot environments.
Liquid manure (slurry) containing degradable organic carbon (C) and water is particularly prone to create anoxic hotspots upon field application. A part of the slurry infiltrates the surrounding soil in response to the soil water potential gradient (Olesen et al., 1997a; Petersen et al., 2003), but particulate matter is immobile and suspended organic particles carried with liquid manure may be trapped in the soil matrix. The extent of slurry redistribution depends on the application method, i.e., determining the extent of the manure–soil contact, and on the water retention properties of manure solids and soil (Petersen et al., 2003). Manure-saturated soil can retain a higher water content than the surrounding bulk soil for a long period of time (Olesen et al., 1997a, b). The elevated water content in conjunction with intensified O2 consumption rates will result in gradients in the distribution of oxygen (Petersen et al., 1996; Zhu et al., 2015), which have implications for N transformations.
Ammonium (NH) in liquid manure infiltrating the soil will likely be adsorbed by soil particles (Olesen et al., 1997a), and the growth of nitrifying bacteria can therefore be greatly stimulated at short distance from manure-saturated volumes, where O2 and NH are both non-limiting factors (Petersen et al., 1992). Meanwhile, the lack of oxygen and higher availability of degradable carbon inside the manure-saturated zone can stimulate the activity of heterotrophic denitrifying bacteria provided that NO is available. Controlled experiments (e.g., Nielsen et al., 1996; Nielsen and Revsbech, 1994) showed that denitrification rates in active organic hotspots were promoted by NO from the soil, as well as NO newly produced through nitrification activity, and that coupled nitrification–denitrification around oxic–anoxic interfaces can account for a large proportion of total denitrification in manure-amended soil (Meyer et al., 2002; Nielsen et al., 1996; Nielsen and Revsbech, 1994; Zhu et al., 2015). In a soil without convective water transport, NH and NO ions are transported by diffusion only, and the supply of soil-borne NO for denitrification in manure hotspots will decline over time (Nielsen et al., 1996; Petersen et al., 1996), whereas the availability of NO produced via nitrification will increase, and diffusion rates between nitrifying and denitrifying niches will be especially high around soil–manure interfaces where steep concentration gradients can develop (Petersen et al., 1992).
A close association between nitrification and denitrification activity greatly complicates the description of N transformations and N2O emissions in models. There have been attempts to describe N2O formation processes in soil at millimeter scale through modeling and experiments focusing on soil aggregates, where the effective denitrification rate is governed by the physical constraints on the transport of dissolved O2 associated with aggregate size, external O2 content, and soil respiration (Kremen et al., 2005; Schlüter et al., 2018; Smith, 1980). For example, Kremen et al. (2005) found that, with increasing aggregate radius, anaerobic conditions developed inside the aggregates, and NO availability gradually became the limiting factor for denitrification. However, the implication of solute diffusion for denitrification in models of soil with macroscale heterogeneity has not been widely studied. There are numerous models to describe nitrification and denitrification processes, as well as the production of N2O and dinitrogen (N2). Simplified models (e.g., Conen et al., 2000; Sozanska et al., 2002) are available to use at the field or regional scale, which do not describe solute and gas movement and associated microbial processes. In process-based models (e.g., Jansson and Moon, 2001; Li et al., 2000), a relatively complete suite of biochemical processes is generally embedded to describe cycles of water, C, and N for target ecosystems. These models often include the transport of C and N species due to convective water flow but not always the diffusion process driven by concentration gradients of solutes also in the static water phase. DAISY (Hansen et al., 2012) and APSIM (Holzworth et al., 2014) are examples of models that account for diffusion, but both models do not account for the sequence of oxidation and reduction processes of mineral N, nor do they simulate O2 directly. More commonly, process models include only C and N (or only NO) solute transport in soil, together with water movement, without considering the diffusion process. Example models are DayCent (Parton et al., 1998), DNDC (Li et al., 1992), DSSAT (Jones et al., 1998), PaSim (Riedo et al., 1998), and STICS (Brisson et al., 2003), i.e., models which are widely used for simulating biogeochemical cycles and related outputs (Brilli et al., 2017). This common model design for solute transport can be expected to explain field conditions where water movement (i.e., rainfall and drainage) controls the distribution of O2, degradable C, and mineral N. However, it can lead to difficulties in reflecting the turnover of N in soil with organic hotspots where active transport of N species is important for nitrification and denitrification but uncoupled from water flow, as will be the case for extended periods after spring fertilization. Besides the solute transport module, spatial extrapolations are in most modeling approaches made using average site parameters for soil moisture and other key drivers, and the interactions among these drivers leading to hotspots either are not included or are represented at insufficient resolution (Groffman et al., 2009), making those models unsuitable to describe organic hotspots in soils.
In this work, we propose a depth- and time-varying model of N2O emissions from an organic hotspot that builds on a system of partial differential equations (PDEs) describing the transformation of several organic or inorganic components of interest. The model presented in this study simultaneously accounts for diffusional transport of gases (i.e., O2, CO2, N2O, and N2) and solutes (i.e., dissolved C and N components), as well as biochemical processes including soil respiration, nitrification, nitrifier denitrification, and denitrification. Our main focus in this study was not to fit the model rigorously to reproduce observed N2O emissions and associated components from manure-amended soil but rather to account for the dynamics of relevant biochemical processes around manure hotspots in soil in a way that is consistent with experimental evidence. We hypothesized that diffusion constraints on substrates and O2 play an important role in regulating microbial activity in general and denitrification in particular. More specifically, we modeled a one-dimensional laboratory system, with a manure hotspot embedded within a repacked soil core, during a 4-week incubation period. We aimed to (1) characterize the multi-species temporal and spatial dynamics controlling C and N transformations using a modeling approach and (2) investigate the extent to which solute diffusion is important for simulating N2O fluxes by developing and testing a series of scenarios with the model.
2.1 Conceptual model and governing equations
The system investigated in the current study was a repacked soil core with a stagnant water phase and constant soil temperature. To model the transport and reactions of C and N components, the mass conservation equations were employed to account for time- and depth-varying concentrations of multiple components. The fate of individual components in water-filled pores was governed by biochemical reactions and diffusion, while convection–dispersion was assumed to be negligible. Gas diffusion in air, being about 4 orders of magnitude faster than that in water, was considered to be the only gas transport scheme in the model.
The mass balance equation for every component γ in the model can be described by a PDE:
where γ is dissolved organic carbon (DOC, aq), NO (aq), NO (aq), NH (aq), carbon dioxide (CO2, g), O2(g), N2O (g), N2 (g), aerobic heterotrophs (s), ammonia-oxidizing bacteria (s), denitrifiers (s), and nitrite-oxidizing bacteria (s), in which the letters aq, g, and s indicate whether component γ is associated with the aqueous, the gaseous, or the solid phase in the model; z and t represent soil depth and time, respectively; Cγ is the concentration of substrate γ; θ represents either the water-filled (θaq) or the air-filled porosity (θg) depending on the phase of Cγ; and Dγ is the effective diffusion coefficient for component γ (see Sect. S7.1 for details). For the bacterial populations, the diffusion term is excluded in the equation. Sγ is the source or sink term of a γ component caused by biochemical reactions, which will be depicted in Sect. 2.2. As a component may participate in several reactions, the 12 PDEs for the above components are coupled by the reaction terms and must be solved simultaneously.
For the cationic species NH in the model, the adsorbed and dissolved forms were assumed to be at equilibrium and follow the Freundlich model as defined below (Olesen et al., 1999):
where Cs is the concentration of adsorbed NH, Cw is the concentration of dissolved NH, KF is the Freundlich distribution coefficient, and N is the dimensionless Freundlich isotherm exponent.
A retardation factor , describing the effect of cation adsorption to soil particles causing a transport delay, was multiplied with the left-hand side of Eq. (1):
where ρb is the soil bulk density, and Kd is the distribution coefficient of NH between soil solids and water.
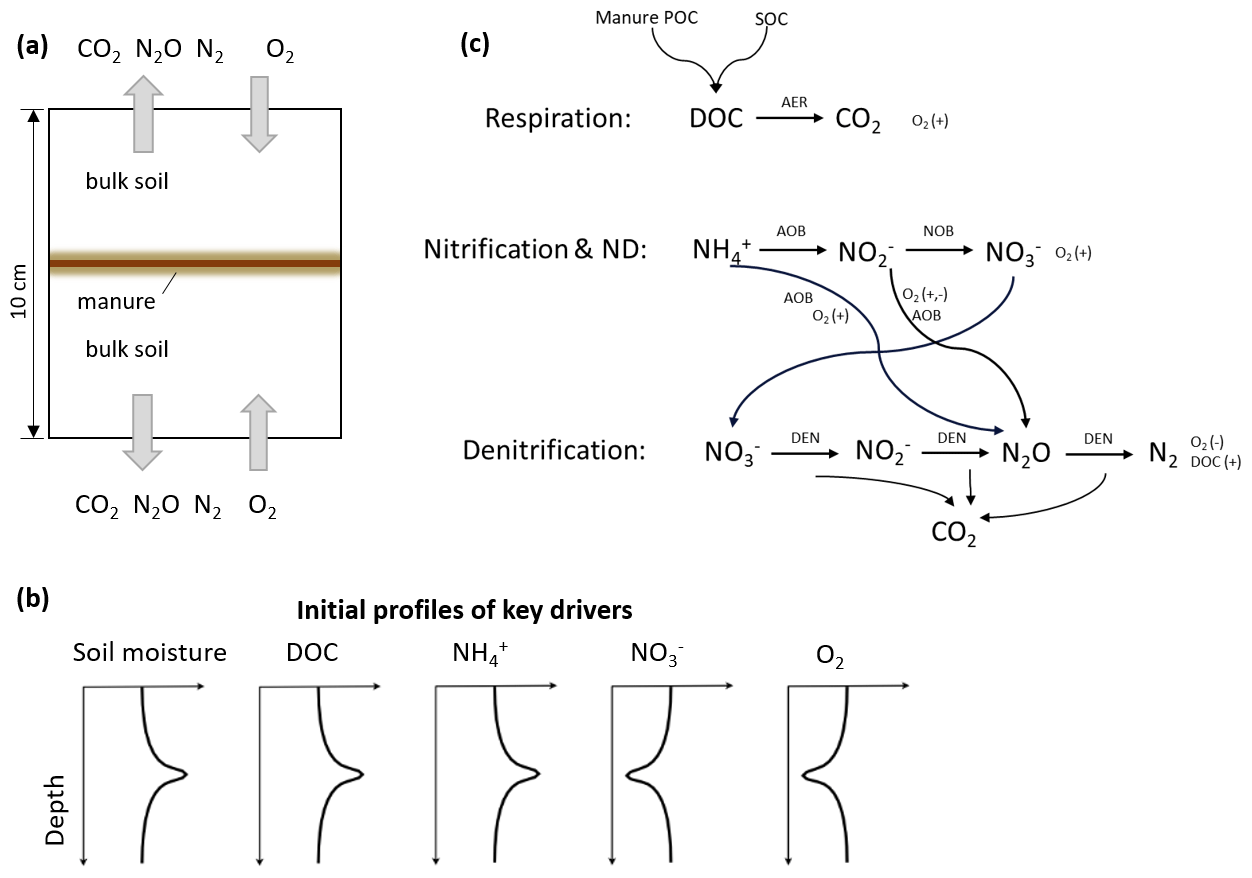
Figure 1Schematic diagrams of (a) the simulated 10 cm soil core with slurry application and two surfaces connected to the ambient air, (b) conceptualized initial profiles of some key drivers of N cycling in the system, and (c) biochemical processes included in the model where the notation (−) and (+) indicate the negative or positive response of the process to O2 or DOC. ND: nitrifier denitrification; AER: aerobic heterotrophs; AOB: ammonia-oxidizing bacteria; NOB: nitrite-oxidizing bacteria; and DEN: denitrifiers.
2.2 Reaction processes
As presented in Fig. 1, the mathematical model developed in this study integrated relevant functional groups of microorganisms in a soil–manure system including aerobic heterotrophs, ammonia-oxidizing bacteria (AOB), nitrite-oxidizing bacteria (NOB), and denitrifying bacteria. The model considered the following processes: aerobic respiration, nitrification, nitrifier denitrification, and denitrification.
In aerobic decomposition, living heterotrophic microorganisms, in the presence of oxygen, feed upon the organic carbon which serves as a source of energy and is respired as CO2:
where (mmol CO2 g−1 biomass d−1) is the maximum reaction rate regarding microbial biomass, BAER (g biomass g−1 dw – dry weight) is the total biomass of aerobic heterotrophs in soil, ρb (g L−1) is the bulk soil density, and kM (mmol L−1) is the half-saturation constant of substrates. Further, [C] and [O2] represent available concentrations of carbon and oxygen at the reactive sites of the enzyme, which will be described in the following. In the subscript of the reaction velocity, S, we use the sign “+” or “−” to indicate production or consumption of the component, and we use the letters “r”, “n”, “nd”, and “dn” to represent the aerobic respiration, nitrification, nitrifier denitrification, and denitrification processes; the same applies to the equations below.
Three pools of organic carbon were considered: immobile C associated with soil organic matter (immobile SOC), immobile C associated with particulate manure solids (manure POC), and DOC. We assumed that only DOC was the substrate for aerobic respiration, and first-order kinetics were used to describe the conversion from immobile SOC and manure POC to DOC:
where SSOC− and SPOC− (g C g−1 dw d−1) are the rates of SOC and POC conversion to DOC, and α (d−1) is the conversion rate.
Other main biochemical reactions in the model, including respiration, nitrification, nitrifier denitrification, and denitrification, were all assumed to follow Michaelis–Menten kinetics. In the nitrification process, the model assumes that NH is oxidized directly to NO by AOB and subsequently to NO by NOB (Eqs. 8 and 9). This setup thus does not include the intermediates NH2OH and NO of ammonia oxidation, in contrast to the explicit description found in Chang et al. (2022) and Chen et al. (2019). N2O is generated as a by-product of incomplete oxidation of NH to NO by AOB (Eq. 10, adapted from Eqs. 1–3 in Chang et al., 2022). The consumption of O2 by nitrifiers is included in the source and sink terms. AOB is also responsible for nitrifier denitrification where NO is reduced to N2O (Eq. 11, adapted from Eqs. 1 and 6 in Chang et al., 2022). A two-sided effect of O2, both promotion and inhibition (Eq. 15), is included on this pathway, wherein O2 is required to support NH oxidation while also inhibiting the reduction of NO to N2O (Wrage et al., 2001).
The governing equations and reaction velocities of nitrification and nitrifier denitrification are
where μ (mmol g−1 biomass d−1) is the maximum reaction rate of microbial biomass in individual steps, BAOB and BNOB (g biomass g−1 dw) are the total microbial biomass of AOB and NOB in soil, and kI (mmol L−1) is the inhibition constant of O2.
In the modeling of denitrification, denitrifiers use the carbon source (DOC) to gain energy and reduce NO stepwise to NO, N2O, and N2 (Eqs. 16–18). The stimulation of denitrification by DOC, as well as the inhibition by O2, is considered in the model. In each modeled step of denitrification, the reduction in nitrogenous oxides is accompanied by anaerobic respiration, whereby CO2 is produced.
The governing equations and reaction velocities of denitrification are
We assumed that substrate concentrations in the reaction velocity equations represent the available substrates at the reactive sites of enzymes and that the availability of substrates is affected by the diffusion of substrates through water films, following the work by Davidson et al. (2012). Therefore, since a decline in soil moisture is accompanied by more disconnected water films, the concentrations of dissolved substrate at the site of enzyme reaction will decline and the available concentration of gaseous reactants will increase. The available concentrations [Caq] in the aqueous phase at the enzyme reaction site are calculated based on a dimensionless diffusivity Daq and water content, and similarly gaseous concentrations Dg and air content are used for calculating the available concentration [Cg] in the gas phase:
where Caq and Cg indicate the actual concentrations of dissolved substrates in water and concentrations in air. Daq and Dg are unitless diffusion coefficients of solute in water and air, respectively (Davidson et al., 2012). The value of Daq was determined by assuming the extreme condition that [Caq]=Caq for saturated soil; i.e., all of the soluble substrate is available at the reaction site under this condition (Papendick and Campbell, 2015). The value of Dg is determined by another assumed extreme condition that all of the gas is available at the reaction site in completely dry soil (Millington, 1959). The effective diffusivity used in Fick's law and in Eq. (1), originated from the same sources we used for the dimensionless diffusivities. See the Supplement (Sects. S6.2 and S7.1) for more details.
In the defined model, the total biomass of each microbe, Bmicrobe, is composed of two parts: an existing biomass associated with the bulk soil (Bbase,microbe) and new biomass produced during the simulation (Bnew,microbe). The growth of microbial biomass in the model is proportional to the rate of substrate consumption following the Monod equation and the microbial decay following first-order kinetics:
where y is the yield coefficient (g C g−1 C or g N g−1 N), fCbio (g C g−1 biomass) is the C content of microbial biomass, fNbio (g N g−1 biomass) is the N content of the microbial biomass, S (g C L−1 soil d−1 or g N L−1 soil d−1) is the rate of substrate consumption, and a (d−1) is the microbial decay rate.
2.3 Incubation experiment
The proposed model was first benchmarked against a lab incubation experiment (Kolstad et al., 2023) investigating the emission of N2O, the total denitrification products, and the spatial distribution of inorganic N after manure incorporation under contrasting levels of soil water content.
In brief, the incubation experiment was set up as follows. Acrylic cylinders (height 5 cm, diameter 8.4 cm) were packed with partially dried and sieved (<6 mm) sandy loam soil collected in November from the plow layer (0–25 cm) of a long-term field experiment at the Foulumgaard research facility, Denmark. On day 0 of the experiment, the injection of liquid cattle manure was simulated by applying the manure to the surface of two uniformly packed soil cores which, after the liquid had infiltrated the two cores, were combined with the manure-saturated zone embedded at the center of the now 10 cm high soil cores. The manure application rate was 0.40 g cm−2 (corresponding to 40 t ha−1), and basic properties of the manure are listed in Table S1 in the Supplement. Two soil–manure treatments having a bulk density of 1.4 g cm−3 and final soil moisture levels at either −30 or −100 hPa (corresponding to a water-filled pore space of 85 % and 70 %, respectively) were used to benchmark the model. For each water potential there was a control treatment, where the soil was packed as described above to the same moisture levels, but slurry was not added. The samples were prepared in triplicate and incubated for 28 d, with gas sampling on days 1, 3, 7, 10, 14, 21, and 28 to determine fluxes of N2O and CO2 using gas chromatography (GC). Separate samples were sectioned on days 1, 14, and 28 to determine the distribution of NH, NO, NO, and water, while loss on ignition (LOI) was analyzed as a measure of organic matter content on day 1 only. The samples were sliced at 0, 2, 6, 10, 14, 18, and 30 mm distance from the center to either side of the manure layer. The samples for sectioning and analysis of soil variables were prepared in duplicate. The soil NO pool was labeled with 15N to allow for both N2O and N2 fluxes to be determined by isotope ratio mass spectrometry (IRMS). Two different solutions of K15NO3 were prepared for addition during packing to ensure the same final concentration at both water potentials. Extra gas samples were collected on days 1, 3, 7, and 14 for IRMS analysis.
The experimental results from the two treatments were used for comparison with model outputs, including the daily fluxes of three gases (N2O, N2, and CO2) and measurements of LOI, NH, NO, and NO. The N2 fluxes were calculated from N2O fluxes determined by GC and ratios determined by IRMS. When N2O or N2 fluxes were below detection limits, were considered invalid, and these sampling values were then treated as missing data.
2.4 Model implementation
2.4.1 Initial conditions
The coupled PDEs, as described by Eq. (1) and associated text, had to obey relevant initial and boundary conditions to complete the model setup for the realistic system investigated. The buildup of the soil–manure system started with the application of manure and redistribution of liquid manure into a larger soil volume until the final water potential in the core reached equilibrium at −30 or −100 hPa, a process with a duration of a few hours. In conceptualizing the experimental setup in a model system, we took conditions from when the slurry redistribution had ceased as the starting point of the model. The soil water distribution was largely constant between day 1 and day 28 (Fig. S4), and therefore Eq. (1), where water convection was excluded, was suitable to use in the model system.
Given the lack of information about the soil–manure system prior to the first soil sampling on day 1, we made a few assumptions to set the initial conditions of the model system:
- i.
Liquid manure was redistributed within a limited “manure zone” and displaced soil pore water resulting in elevated water content compared to before application.
- ii.
During slurry redistribution, the fate of dissolved components including DOC, NH, and NO in the slurry was dominated by water flow, while biochemical reactions and sorption were neglected, entailing that the components were uniformly concentrated in the limited zone with a constant total amount.
- iii.
When slurry redistribution was complete, the concentration of oxygen in the 2 mm center of the limited manure zone, wherein particulate manure solids were concentrated, was zero.
The soil core in the model had a depth of 10 cm from the top (z=0 cm) to the bottom surface (z=10 cm), and the center of manure application was at 5 cm depth. The soil core in the model had the same length as in the experiment with the manure at its center. The vertical extent of the manure zone was determined to be 8 mm, from 4.6 to 5.4 cm depth, in which the amount of water on day 1 corresponded to 20.2 and 17.5 g in the −30 and −100 hPa treatments, respectively, close to the 20.9 g of water in the applied slurry. We used the recorded profiles of water content on day 1 as the constant water condition in the modeled soil core.
Dissolved and particulate C and N
Contributions of DOC, NH, and NO from both soil and manure were considered in the initial conditions. Soil properties of the control soil on day 1 in the two layers closest to the surfaces, i.e., 0–0.01 m and 0.09–0.1 m, were averaged (Table S2). Soil organic carbon (SOC) was estimated from the relationship (Jensen et al., 2018). DOC concentrations in the Foulum soil in winter are fairly constant at 20–25 mg C L−1 (Gjettermann et al., 2008), and a conversion factor of between DOC and SOC was used to make estimates of DOC consistent with this reported range. Concentrations of dissolved NH were calculated from the total content of NH and the abovementioned Freundlich model. NO was assumed to only exist in the water phase. See the Supplement (Sect. S6.1 and S6.3) for details.
Regarding the contributions from the manure, we considered that the total amount of each dissolved component in the applied manure was uniformly distributed in the manure zone of 0.046–0.054 m. Based on the manure application rate and content of volatile solids (VSs) in the manure, we estimated that the total organic carbon (TOC) accounted for a fraction of 0.42 of VSs (Petersen et al., 2016). We also assumed that the fraction of DOC in TOC was 0.5 (Petersen et al., 1996, 2016), and hence the amount of DOC in the applied manure was estimated at 30.9 g C m−2. Particulate organic carbon (POC) in the manure was then defined as (TOC − DOC); assuming that manure POC was not mobile, this fraction was considered to concentrate within 1 mm from the depth of application, i.e., from 0.049 to 0.051 m depth. Dissolved NH from manure was estimated from total NH as above. As there was no detected NO in the manure, the initial NO content in the 8 mm manure zone was set to be zero. The initial NO content was considered to be zero in the entire soil–manure profile. We did not include the mineralization of organic N from POC in the model, as previous studies have associated high with reduced N mineralization in slurry (Barbarika et al., 1985), whereas we considered that mineral N could be immobilized by microbes, i.e., AOB and NOB, and become part of the microbial biomass pool.
The initial content of each component in the 14 sampling layers was thus obtained by summing the contributions of manure and soil.
Gases
We assumed that the initial concentrations of N2, O2, CO2, and N2O corresponded to ambient air, i.e., 0.78, 0.21, , and atm, respectively (World Meteorological Organization, 2021); according to the ideal gas equation, their concentrations in soil air were calculated to be 33.0, 8.9, 0.017, and mmol L−1, respectively. One exception was O2 at the center of the manure zone (i.e., 0.049–0.051 m) where anoxic conditions were assumed and the concentration was zero.
Microbial populations
The initial biomasses of denitrifiers, AOB, and NOB in the bulk soil were all set to be 12.7 mg kg−1 soil, referring to the measurement in an arable soil by Khalil et al. (2005) using chloroform fumigation–extraction and microbial enumeration, while the initial biomass of aerobic heterotrophs was assumed to be 10 times higher. The new biomasses of aerobic heterotrophs, AOB, and NOB initially added with manure were assumed to be zero, as we considered the concentrations of these aerobic organisms to be negligible in the anaerobic liquid manure. In contrast, we expected denitrifiers to survive better in the manure, and the denitrifier biomass at the center of the applied manure (0.049–0.051 m) was assumed (including the contribution from soil) to be 10 times the base value in soil and thus similar to the base value of aerobic heterotrophs.
For all of the above components to be solved with Eq. (1), their initial conditions over the modeled soil core were constructed as continuous profiles by interpolating the middle points of all sampling layers and extrapolating to the two boundaries (see Figs. S1 and S2 in the Supplement).
2.4.2 Boundary conditions
For components dissolved in the water phase and microbial populations, we specified no flux at the two boundaries:
For the concentration of each gaseous component, we specified a constant value for the two boundaries, which was the gas concentration in the ambient air as described in Sect. 2.4.1:
2.4.3 Computation
The system of coupled equations for eight chemical components and four microbial populations was numerically solved using the partial differential equations solver pdepe in MATLAB. The first-order kinetics of SOC and POC were analytically solved and incorporated into the source terms of DOC production to reduce the complexity of the model system. The solver internally uses a dynamic numerical time stepping, and the output time step was set to 6 h. A non-uniform mesh was applied for the discretization of the 0.1 m one-dimensional model domain. The mesh size was 1 mm in the area away from the manure-applied zone (z<0.04 m, z>0.06 m) and 0.1 mm in the interval of 0.04–0.06 m to obtain stable numerical solutions at different parameter values in preliminary tests.
For each component, Eq. (1) was valid when the corresponding θ was above zero. When θ was equal to zero, there is an inequality between the zero left-hand side and the non-zero right-hand side with the reaction term. In simulating the −30 hPa treatment, a narrow 2 mm saturated zone existed at the center of the core, and to avoid the invalid model domain and not to disturb the rest of model system, a small air fraction of 0.01 was allowed for in the saturated zone, corresponding to a few drained macropores. The relevant discussion on model uncertainty is included in Sect. 4.3.
The parameter fitting was performed by a combination of algorithm and manual adjustment. We used the surrogate algorithm as the optimizer, as it is suitable for evaluating time-consuming models such as the complex PDE system. The objective function used for optimization was the sum of relative root mean squared errors (rRMSEs) of simulated variables from the two treatments:
where obj is the value of objective function, yi,j is the ith observation for variable j, is the ith simulation for variable j, nj is the number of observations for variable j, wj is the weight of variable j, and N is the number of variables.
Parameter values of the C module, kC_CO2_r, kO2_CO2_r, and uC_CO2_r, were optimized by fitting model simulations with measured CO2 fluxes in the −30 and −100 hPa treatments ( for both treatments), while the rest of the parameters were fixed to the starting values, as we considered the majority of CO2 fluxes to come from aerobic respiration. The values of parameters in the N module were then optimized by fitting the N-related variables with measured data. The N-related variables here included N2O and N2 fluxes, as well as NO and NO content. DOC and NH were not included as the model-data error was not much affected by parameter fitting in preliminary tests. When presenting the data used to compare with model results in the Results section, we used the labels “measured” and “estimated” to distinguish between the variables obtained directly from measurements (CO2 fluxes, N2O fluxes, NO content, and NO content, where the latter two were considered to only exist in dissolved form) and the variables (N2 fluxes, DOC, and dissolved NH) estimated from relevant experimental data and assumptions stated earlier.
To ensure good agreements with the temporal and spatial dynamics of multiple variables in the experiment, the selection of precise and accurate weights in objective functions was often difficult as small perturbations of the weights can lead to quite different solutions (Konak et al., 2006). By trial and error, we assigned the weights of 0.2, 0.05, 0.012, and 0.001 to the rRMSEs regarding N2O, N2, NO, and NO in the −30 hPa treatment, as well as weights of 0.05, 0.05, 0.001, and 0.001 to the corresponding rRMSEs in the −100 hPa treatment. Model errors for simulated mineral N were prone to be much higher than for gas emissions, and we therefore assigned them smaller weights to avoid overfitting mineral N accompanied by the poor prediction of gas fluxes while minimizing the objective function. Since the peak N2O flux in the −30 hPa treatment was of particular interest, we included also a term representing peak flux error, (, in the objective function to ensure this interest was met. Here, peakobs and peaksim indicate the maximum daily N2O flux found in the experiment and the model, respectively. After checking the optimized model outputs, which in general aligned well with the measurements, we manually adjusted two parameters (μNO2_dn and μN2O_nd) by trials to make the temporal trend of NO profiles more consistent with the measurements. Model input parameters are described in Sect. S7.
2.4.4 Flux calculation
The efflux of gases from the soil cores was calculated according to Fick's first law, where the concentration gradient between the ambient air and the outmost soil layers at the top and bottom was the driving force of gas flux:
where J is the gas fluxes (mol m−2 d−1), Deff,g (m2 d−1) is the effective gas diffusion coefficients at the two depths closest to the borders in the discretization of the model where z1=0.001 m and z2=0.099 m, and Δz is the depth interval of 0.001 m.
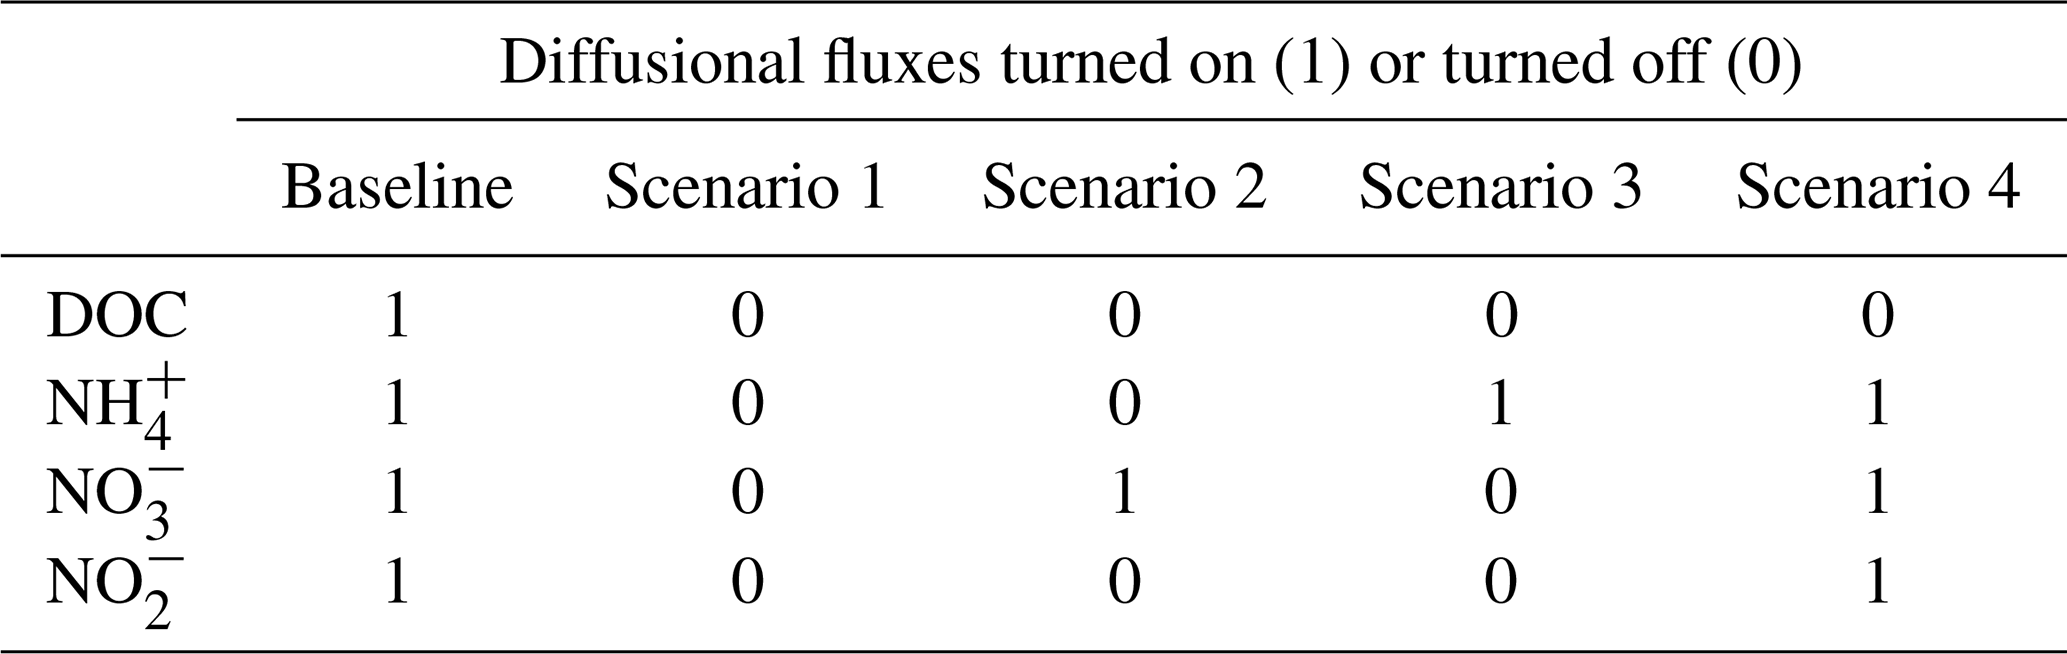
2.4.5 Scenario tests
We took the original setup of the model where the diffusion process of all the solutes was included as the baseline scenario. Based on the calibrated model, we simulated four scenarios in which solute diffusion in the soil–manure system was eliminated to different degrees. Diffusive fluxes of different solutes were selectively turned off in Scenarios 1–4 as shown in Table 1, where Scenario 1 did not allow any solute diffusion; Scenario 2 allowed only NO diffusion; Scenario 3 allowed only NH diffusion; and Scenario 4 allowed diffusion of NH, NO, and NO but not DOC. In Eq. (1), turning off the diffusive flux of component γ meant that the effective diffusion coefficient Dγ was set to zero.
3.1 Testing model predictive capability with experimental data
Emissions of three gases, i.e., N2O, N2, and CO2, during 4 weeks in the experiment were compared with model simulations (Fig. 2). In the −30 hPa treatment with manure application, the model showed a peak N2O flux on day 3 which was comparable with the peak value of 2880 µg N m−2 h−1 observed on day 1 but with a delay of 2 d. In the −100 hPa treatment, the simulated N2O fluxes in the first 3 d were between 500 and 1500 µg N m−2 h−1, which was much higher than the recorded fluxes with a maximum of 130 µg N m−2 h−1. After the first week the simulation results corresponded well with the tail of fluxes recorded in the experiment, and small negative values were obtained in the model for the −100 hPa treatment. The simulated N2 fluxes agreed with the magnitude of N2 fluxes estimated from 15N labeling in the experiment and were approximately 1 order of magnitude higher than the observed N2O fluxes in both treatments. Specifically, the temporal trend of N2 fluxes in the −30 hPa treatment was simulated well despite the limited experimental data available. The simulated CO2 fluxes were in general comparable to those observed, especially in the −100 hPa treatment with an early CO2 peak around day 1 in both model and experiment. In the experiment, CO2 fluxes in the −30 hPa treatment were generally lower than in the −100 hPa treatment, and model results showed the same pattern. A secondary increase in CO2 flux, observed during the second week in the −30 hPa treatment, was not shown in the simulation.
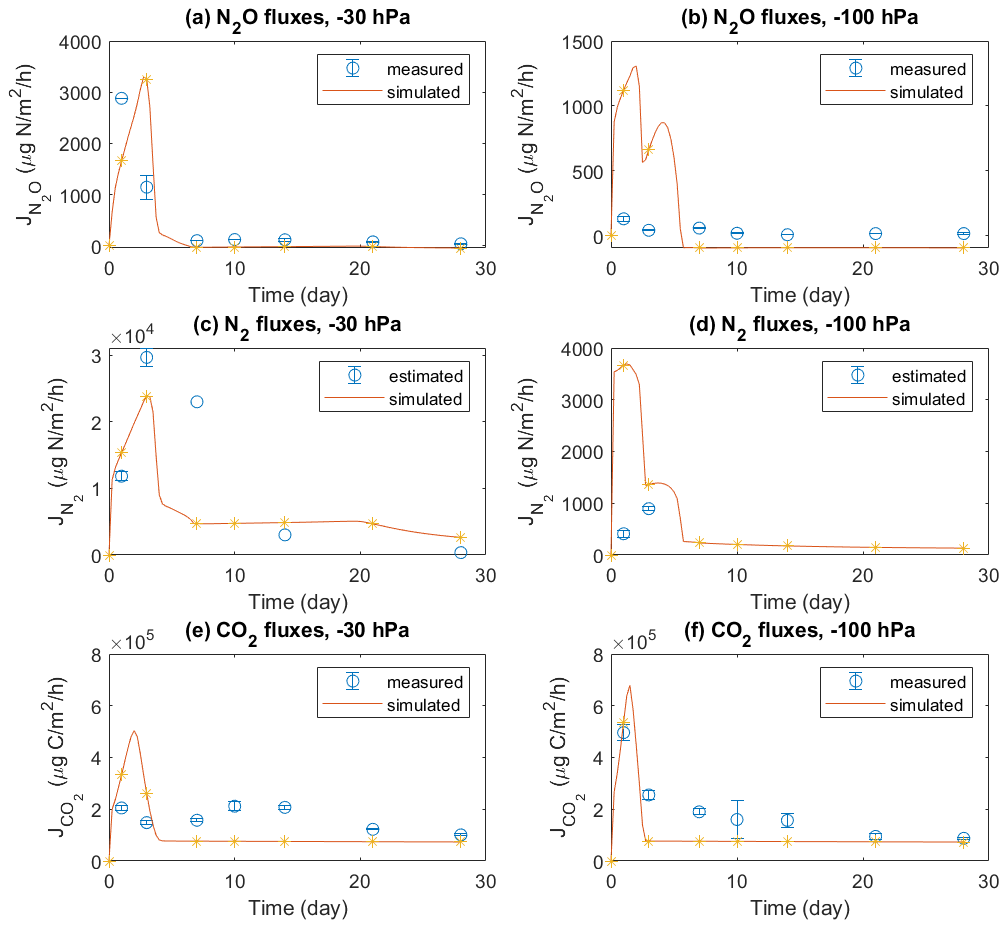
Figure 2Measured and modeled N2O, N2, and CO2 fluxes: (a) N2O fluxes at −30 hPa, (b) N2O fluxes at −100 hPa, (c) N2 fluxes at −30 hPa, (d) N2 fluxes at −100 hPa, (e) CO2 fluxes at −30 hPa, and (f) CO2 fluxes at −100 hPa. The N2 fluxes used for comparison with model results were estimated from the observed N2O fluxes and 15N-labeled ratios. Error bars represent standard deviations (n=3).
Mineral N and DOC concentrations in the soil profile were also compared with model simulations (Figs. 3 and 4). The dissolved NH in Figs. 3a and 4a, used to compare with model results, was estimated according to a Freundlich adsorption isotherm as described in Sect. 2.4.1. In the manure zone, the estimated concentrations of dissolved NH by day 1 had dropped from the initial value of 23.1 to 4.1 mmol L−1 in the −30 hPa treatment and from 24.1 to 4.8 mmol L−1 in the −100 hPa treatment. The total NH content in the manure zone was calculated to be 435 mg N kg−1 initially if distributed within the 8 mm layer, which was approximately 4 times the content actually observed on day 1 of 112 and 123 mg N kg−1 in the −30 and −100 hPa treatments, respectively (Figs. S7a and S8a). In the model, neither the dissolved nor the total NH content decreased as much as that observed in the experiment by day 1, and it took 4 d before the majority of NH was reduced to the level observed by day 1 in the experiment. By day 14, the dissolved NH content in the manure hotspot was reduced to the level in the bulk soil both in the experiment and in the model.
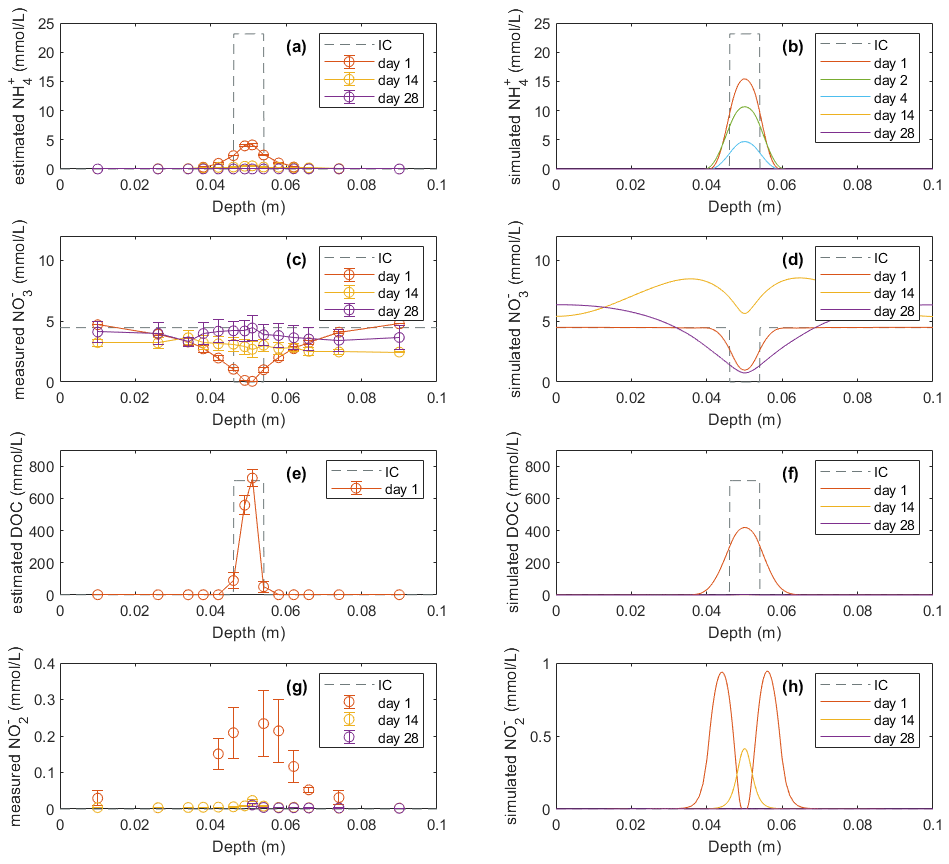
Figure 3Model results (b, d, f, h) of soil variables (DOC and dissolved N species) compared with direct measurements or estimations (a, c, e, g) in the −30 hPa treatment: (a) estimated NH concentrations from the experiment, (b) modeled NH concentrations, (c) measured NO concentrations from the experiment, (d) modeled NO concentrations, (e) estimated DOC concentrations from the experiment, (f) modeled DOC concentrations, (g) measured NO concentrations from the experiment, and (h) modeled NO concentrations. In the legend, IC indicates the initial condition applied in the model to represent the lab experiment with slurry application. Error bars represent standard deviations (n=2).
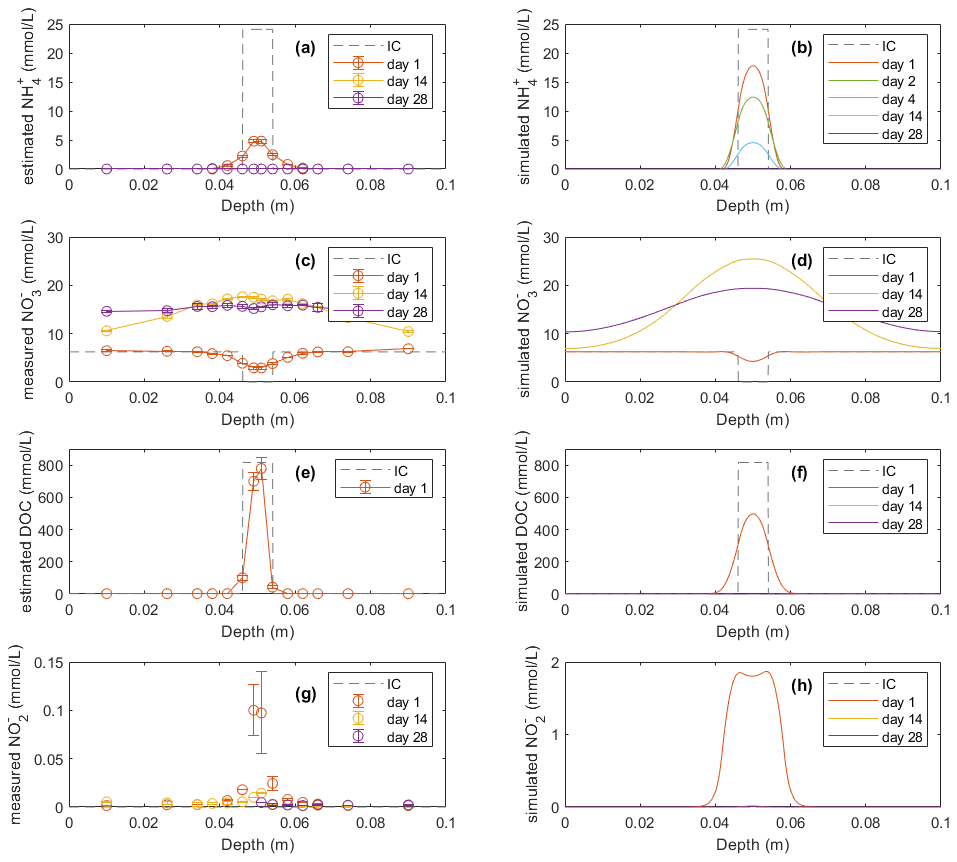
Figure 4Model results (b, d, f, h) of soil variables (DOC and dissolved N species) compared with direct measurements or estimations (a, c, e, g) in the −100 hPa treatment: (a) estimated NH concentrations from the experiment, (b) modeled NH concentrations, (c) measured NO concentrations from the experiment, (d) modeled NO concentrations, (e) estimated DOC concentrations from the experiment, (f) modeled DOC concentrations, (g) measured NO concentrations from the experiment, and (h) modeled NO concentrations. In the legend, IC indicates the initial condition applied in the model to represent the lab experiment with slurry application. Error bars represent standard deviations (n=2).
In the experiment the NO content in the manure zone was negligible 1 d after manure addition in both treatments. In the −30 hPa treatment, NO content then increased and approached the background level in the unamended control soil after 4 weeks. In the simulation, NO content was comparable with the measurements on day 1 and day 14 but showed a net removal of NO in the vicinity of the manure zone on day 28, which was not observed in the experiment. In the −100 hPa treatment of the experiment, NO content showed an overall increase within the soil profile after 2 and 4 weeks compared to day 1 (Fig. 4c). The NO content on day 28 in the soil outside the manure zone was relatively higher than that on day 14, whereas the NO content at the center of the manure zone was lower by day 28 compared to day 14, and this trend was well captured by the model (Fig. 4d).
The DOC content was estimated from measured values of LOI and manure VSs for comparison with model results. The estimated DOC profile on day 1 showed total amounts of 20.9 and 23.9 mmol in the −30 and −100 hPa treatments, respectively. The modeled DOC by day 1 showed comparable total amounts of 27.4 and 26.8 mmol in the −30 and −100 hPa treatments, respectively, but with a wider distribution in the soil than that estimated in the experiment (Figs. 3e, f and 4e, f). According to the model simulation, the DOC in the manure zone was mostly removed within 2 weeks in both treatments, but no further organic matter analyses were done in the experiment to confirm this.
For both treatments the modeled NO content showed a similar temporal trend to the experimental data. The total NO content in the soil was higher on day 1 than after 14 and 28 d of incubation (Figs. 3g, h and 4g, h). The simulation values were generally larger than those recorded, but considering the analytical uncertainty about the low NO levels in the experiment, this discrepancy was not unacceptable. In contrast to the bell-shaped observed NO profile on day 1, the simulated NO profile showed a trough at the center of the manure-saturated zone where NO concentration developed more in the following days.
3.2 Spatiotemporal features of simulated N2O and other variables
Figure 5 shows the modeled process rates related to N2O transformations in the −30 hPa treatment, including N2O production via nitrification, nitrifier denitrification, and denitrification; N2O reduction via denitrification; and rates of N2O change via diffusion. According to the model, N2O production mainly occurred at the depth interval 0.04–0.06 m encompassing the manure zone from 0.046 to 0.054 m (Fig. 5a–d). At the center of the manure zone, around the 2 mm saturated area, denitrification was the major pathway of N2O production, with the highest rate of 6 mmol N2O L−1 soil d−1 on day 3 (Fig. 5d). Nitrification contributed to N2O production in the zone outside the 2 mm saturated area and peaked around the soil–manure interface (Fig. 5b). N2O production via nitrification mainly occurred during the first week, and the reaction rates up to 0.07 mmol N2O L−1 soil d−1 were markedly lower than the simultaneous denitrification rates according to the model. The modeled nitrifier denitrification took place close to the saturated zone where the reaction rates were much higher than in other layers (Fig. 5c). Similar to nitrification and denitrification, N2O production from nitrifier denitrification mainly occurred during the first week, and the highest rate was approx. 0.1 mmol N2O L−1 soil d−1 on day 3.
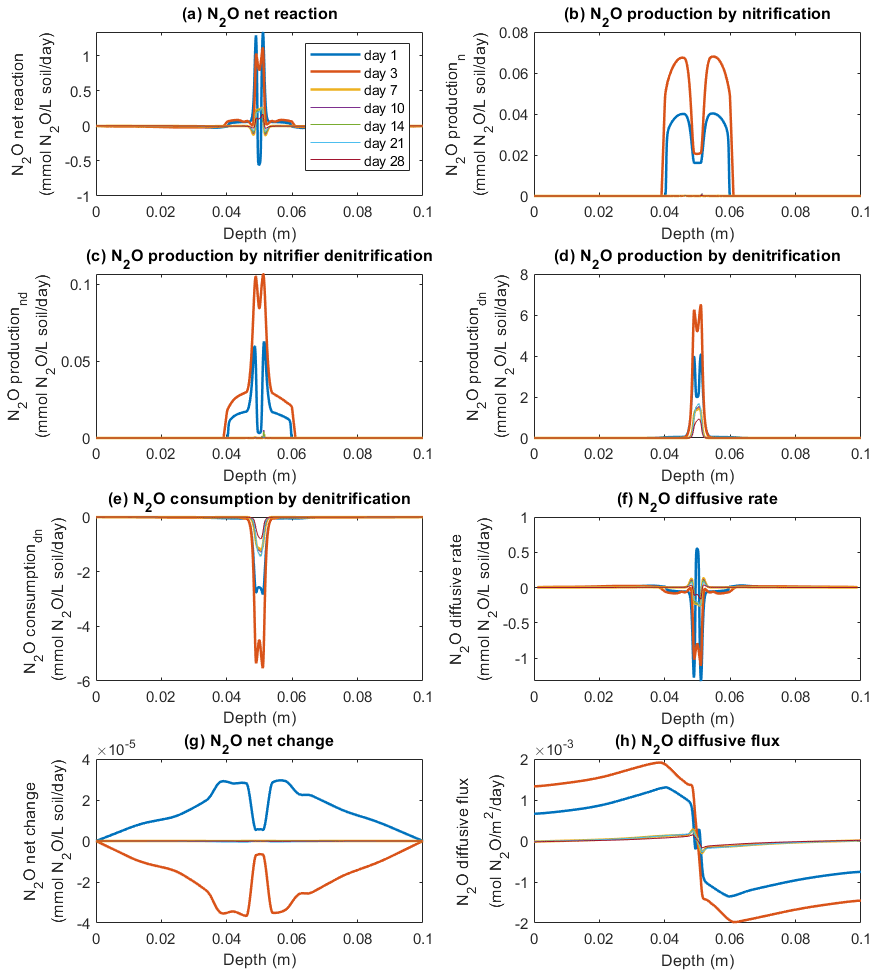
Figure 5Simulated rates of N2O production, consumption, and transport in the −30 hPa treatment: (a) net N2O production rate, (b) N2O production rate by nitrification, (c) N2O production rate by nitrifier denitrification, (d) N2O production rate by denitrification, (e) N2O consumption rate by denitrification, (f) N2O diffusive rate, (g) the net rate of N2O changes by reactions and transport, and (h) N2O diffusive flux, where the negative sign represents the downward movement towards the lower soil–air interface (z=0.1 m) and the positive sign the flow towards the upper soil–air interface (z=0 m).
Microbial reduction in N2O to N2 showed a similar spatiotemporal pattern to N2O production via denitrification (Fig. 5e). In accordance with this, the net reaction, i.e., the sum of production and consumption rates, peaked at the center of the manure zone and had a moderate intensity in the soil volumes mainly associated with nitrification (Fig. 5a). Negative rates around the central manure-saturated zone were paralleled by N2 production (Fig. 5a).
The rates in Fig. 5f, i.e., the first term on the right-hand side of Eq. (1), indicate that N2O concentration change is caused by gas diffusion. The negative values in the soil profile represent the decrease in N2O concentrations owing to efflux to the surrounding soil which mainly occurred in the manure zone. Positive values represent a gain in N2O concentrations due to gas diffusion and mainly occurred in the bulk soil where the generated N2O accumulated before escaping to the atmosphere. The net change in N2O concentrations in the soil showed an overall increase on day 1 and then a decrease on day 3 that was followed by minor changes on the following sampling days according to the simulation (Fig. 5g). The direction and magnitude of the internal gas transport of N2O are illustrated in Fig. 5h.
In the −100 hPa treatment, the intensities of N2O production from the three processes were different from the −30 hPa treatment, whereas the spatial distributions of the individual processes were similar to the patterns observed in the −30 hPa treatment (Fig. S10a–d). Nitrification rates were generally higher than those of the −30 hPa treatment, especially at the center of the manure zone within the first 3 d (Figs. S10b and 5b). Specifically, in the −30 hPa treatment the nitrification rate in the central manure-saturated zone was approx. 0.02 mmol N2O L−1 soil d−1 between day 1 and day 3, which was ca. 50 % lower than the rates at the manure–soil interface (Fig. 5b). In the −100 hPa treatment, the corresponding rate at the manure center increased from 0.04 to 0.06 mmol N2O L−1 soil d−1 between day 1 and day 3 in the model simulation, and a higher rate was also found at the manure–soil interface (Fig. S10b). Denitrification and nitrifier denitrification were less intensive in the −100 hPa treatment compared to the −30 hPa treatment. N2O produced from nitrifier denitrification was up to 0.04 mmol N2O L−1 soil d−1 on day 3 in the −100 hPa treatment compared to a rate of 0.1 mmol N2O L−1 soil d−1 in the −30 hPa treatment (Figs. S10c and 5c). Denitrification-derived N2O showed the highest rate with up to 0.8 mmol N2O L−1 soil d−1 on day 1, markedly lower than the peak value of ca. 6 mmol N2O L−1 soil d−1 on day 3 in the −30 hPa treatment (Figs. S10d and 5d). The net changes in N2O concentrations showed an increase during the first 3 d and slight changes afterwards (Fig. S10g).
The fate of NO in the model was determined by three processes: production via nitrification, consumption via denitrification, and diffusive exchange. According to the model, NO production mainly occurred outside the saturated zone and peaked around the borders of the manure-saturated zone, where the rate was up to 1.4 mmol NO L−1 soil d−1 by day 1, and the peak values continued to increase to reach 2.2 mmol NO L−1 soil d−1 by day 3 (Fig. 6a). The increase in NO production rate continued until day 7, followed by a decrease to the end of the 4-week simulation. The consumption of NO via denitrification dominated at the center of the manure zone (Fig. 6b) where the soil was saturated and the O2 availability was low (Figs. S4 and S9). The NO consumption rate greatly increased during the first week with a maximum value of around 7 mmol NO L−1 soil d−1 on day 3 (Fig. 6b), greater than the simultaneous production rate. A net consumption rate within the manure-saturated zone was therefore simulated (Fig. 6c) based on these two microbial pathways. Besides biochemical reactions, the supply of NO used for denitrification also came from the process of NO diffusion, as depicted in Fig. 6d. Driven by the concentration gradient between the manure zone and the bulk soil, nitrification-derived NO migrated to the center of the manure hotspot where NO was effectively consumed, as indicated in Fig. 6f. Between day 1 and day 3, the NO diffusion rate within the saturated zone doubled from ca. 3 mmol NO L−1 soil d−1 to the maximum value of ca. 6 mmol NO L−1 soil d−1, compensating for the relatively lower nitrification rate to sustain denitrification (Fig. 6d).
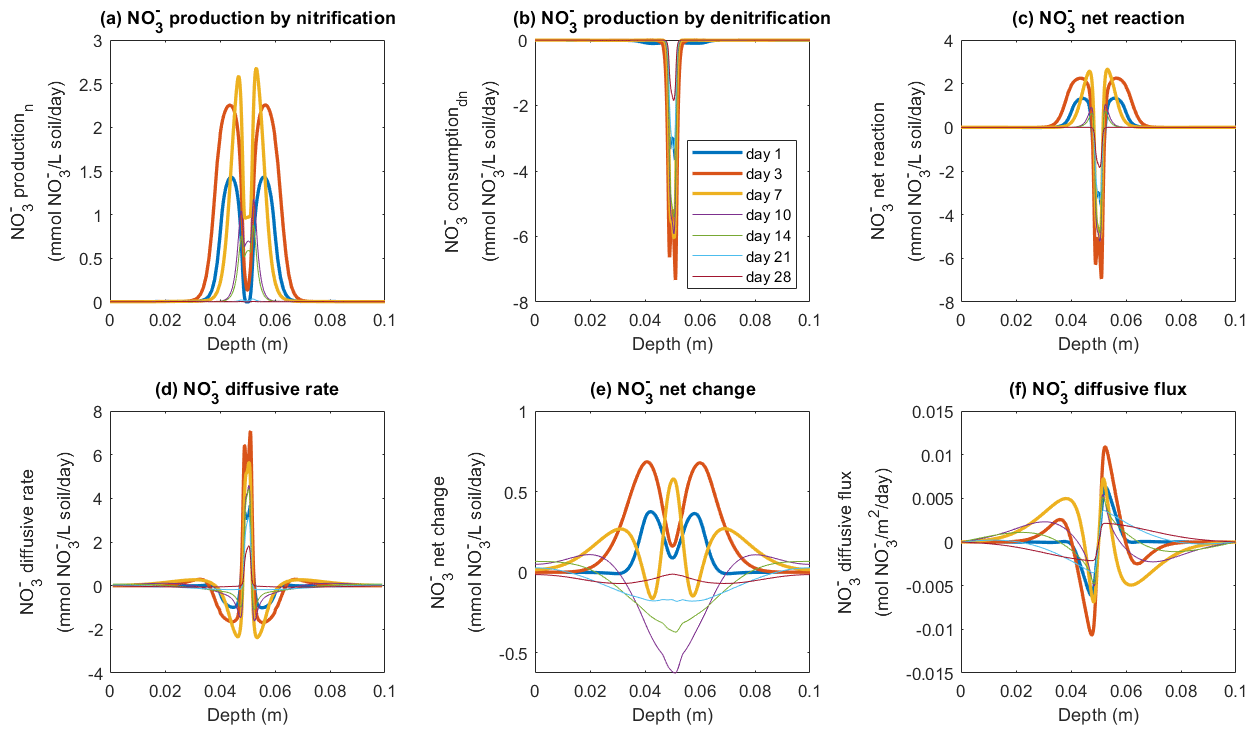
Figure 6Simulated rates of NO production, consumption, and transport in the −30 hPa treatment: (a) NO production rate by nitrification, (b) NO production rate by denitrification, (c) NO net reaction rate, (d) NO diffusive rate, (e) the net rate of NO changes by reactions and transport, and (f) NO diffusive flux. In panel (f), the negative sign represents the downward movement towards the lower soil–air interface (z=0.1 m) and the positive sign the flow towards the upper soil–air interface (z=0 m).
In the −100 hPa treatment, the spatial patterns of NO transformations were different from the −30 hPa treatment, and here high rates of NO production also occurred at the center of the manure zone (Fig. S11) where the water content was relatively higher than in the surrounding soil but lower than in the −30 hPa treatment. The diffusion rate ranged from 0.8 to 1.6 mmol NO L−1 soil d−1 at the center of the manure zone (Fig. S11d), and the production rate ranged from 1.8 to 2.8 mmol NO L−1 soil d−1 (Fig. S11a). Figure S11b shows that NO reduction during denitrification mainly occurred on day 1 at around 1.8 mmol NO L−1 soil d−1, which declined greatly to 0.4 mmol NO L−1 soil d−1 during the following 2 d and thereafter continued to show a declining trend. A net positive change in NO concentration was simulated during the first 3 d, and then a net NO depletion was predicted in the manure zone after 1 week (Fig. S11e).
The biomass of nitrifiers (i.e., AOB and NOB) and denitrifiers increased rapidly during the first week in the simulations (Figs. S5 and S6) and dominated in spatially distinct niches. Thus, the growth of nitrifying bacteria mainly occurred inside and around the manure-affected area, with a visible increase in the soil at 6–8 mm from the initial borders of manure application. The biomasses of AOB and NOB peaked by day 7 close to the soil–manure interface and were by then, respectively, up to 4 times as high and twice as high as the background level in both treatments. Microbial decay then dominated with the result that the nitrifier biomass decreased but still remained above the background level by day 28. The denitrifier biomass was initially unevenly distributed within the soil where the 2 mm center of the manure zone had a denitrifier biomass 10 times that of the bulk soil to account for denitrifiers existing in the liquid manure, as described in Sect. 2.4.1. The growth of denitrifiers mainly occurred inside the manure zone and peaked at up to 30 times the background level in bulk soil by day 10 in the −30 hPa treatment, which was followed by a temporally stable phase until day 21 and then a declining trend until the end of the experiment.
In the −30 hPa treatment, the O2 consumption rate was well aligned with the CO2 production rate through aerobic respiration (Figs. S14b and S16b). By day 1 and day 3, O2 consumption by aerobic respiration () showed peak values of −32 and −83 mmol O2 L−1 soil d−1, respectively, around the soil–manure interface, and simultaneously the O2 consumption via nitrification () had peak values of −4.5 and −7.5 mmol O2 L−1 soil d−1 in the same position. At the center of the manure zone, CO2 was mainly produced by respiration of denitrifiers during the simulated 4-week period (Fig. S14c), with up to 12 mmol CO2 L−1 soil d−1 on day 1, in contrast to the aerobic respiration that dominated in most of the core volume. In the −100 hPa treatment, oxygen consumption was mainly owing to aerobic respiration by day 1, where the peak values of and were −73 and −5 mmol O2 L−1 soil d−1. On day 3 nitrifier denitrification dominated the use of O2 within the manure-application zone (peak: −8.6 mmol O2 L−1 soil d−1), whereas aerobic respiration has greatly declined and was only elevated at the center (peak: −7.4 mmol O2 L−1 soil d−1) (Figs. S15 and S17). CO2 produced by denitrification peaked at the center of the manure zone but was overall less than aerobic respiration during the 4 weeks in the −100 hPa treatment (Fig. S15).
The oxygen diffusion rates closely followed the consumption rates (Figs. S16a, d and S17a, d). This indicates that the overall air-filled porosity within the 10 cm soil core, including a small fraction of air-filled porosity (i.e., 0.01) in the saturated zone, was able to ensure adequate soil aeration at the oxygen consumption rates occurring in the experiment. The simulated oxygen content in the pore air began to increase within 1 d (Figs. S5 and S6). However, the O2 availability to enzyme reaction sites in the model depends not only on the oxygen content in soil pore air but also on the soil tortuosity in relation to the soil water content. As shown in Fig. S9, the simulated O2 availability showed dramatic heterogeneity across the soil profile, with a steep downward slope at the center of the manure zone, but no evident temporal changes were simulated after day 1 in the two treatments. The −100 hPa treatment in general showed a higher level of O2 availability than the −30 hPa treatment, but the O2 available in the near-saturated center (i.e., 0.049–0.051 m) was still lower than that in the −30 hPa bulk soil and thus facilitated local denitrification.
3.3 Scenario tests: the importance of solute diffusion in the model
Figure 7 shows the results of four scenarios to investigate the importance of solute diffusion for gas emissions in the baseline model scenarios and, presumably, measurement results presented above. Switching off the diffusion of all solutes greatly reduced N2O. N2 fluxes during the 4-week simulation of the −30 hPa treatment were compared to the baseline simulation and the observations, and the emission peaks during the first 3 d disappeared (Fig. 7a and c). By allowing the diffusion of NO but not DOC, NH, and NO (Scenario 2), N2O and N2 fluxes were enhanced to some degree but still could not explain the temporal patterns in the observation. Allowing NH diffusion only (Scenario 3) increased the simulated N2O and N2 fluxes at the start of the simulation compared to Scenario 1, although not as much as the change caused by allowing NO diffusion only. The simulated N gas fluxes dropped to negligible levels after 1 week in Scenario 3. In Scenario 4, allowing the diffusion of three N solutes but not DOC, the simulated N2O and N2 fluxes were greatly increased compared to Scenarios 1–3, and the temporal pattern, characterized by an early flux peak and a long tail, was similar to the baseline. However, the timing of peaks came later than in the measurement, and the simulated peak was even higher when preventing DOC flux between manure layer and soil. Simulated CO2 emission showed a peak around day 2 in the baseline scenario, which was delayed by approx. 1 d and declined from ca. 5×10⁵ to ca. 2×10⁵ µg C m−2 h−1 in the four scenarios (Fig. 7e). Not much difference was found in the simulated CO2 emissions between the four scenarios.
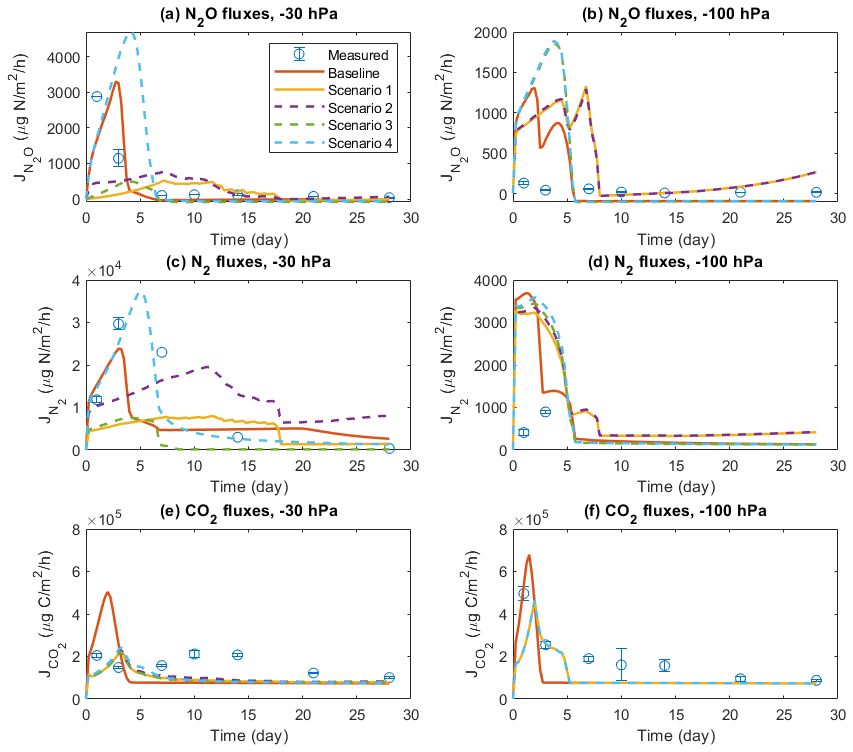
Figure 7Comparison of different scenarios with respect to N2O, N2, and CO2 fluxes: (a) N2O fluxes at −30 hPa, (b) N2O fluxes at −100 hPa, (c) N2 fluxes at −30 hPa, (d) N2 fluxes at −100 hPa, (e) CO2 fluxes at −30 hPa, and (f) CO2 fluxes at −100 hPa. In each panel, there are measured data, a baseline simulation where the diffusion of all solutes is included, and four scenarios (1–4), where Scenario 1 does not allow any solute diffusion; Scenario 2 allows only NO diffusion; Scenario 3 allows only NH diffusion; and Scenario 4 allows diffusion of NH, NO, and NO but not DOC. Error bars represent standard deviations (n=3).
In the −100 hPa treatment, Scenario 1 and Scenario 2 showed similar results in that the early N2O and N2 fluxes within the first 3 d were lower than that in the baseline scenario but still higher than the observations (Fig. 7b and d). The differences between the baseline and the two scenarios were much smaller than that in the −30 hPa treatment. Whereas the inclusion of NO diffusion (Scenario 2) did not show any stimulation of N2O emissions compared to Scenario 1, including NH diffusion resulted in a marked increase in simulated gas fluxes at the early stage which was identical with the result of Scenario 4. The measured gas fluxes were overestimated in Scenario 3 and Scenario 4, similar to the tendency in the −30 hPa treatment. The simulated CO2 peak flux was lower than the baseline simulation and was delayed by approx. 1 d (Fig. 7f).
4.1 Model performance
The model generally reflected the magnitudes of individual N2O and N2 emissions measured in the experiment where two moisture levels were tested, with the larger model errors in simulating the −100 hPa treatment as shown in Table S7. In the −30 hPa treatment, the predicted cumulative N2O and N2 fluxes were close to the measured data with the relative mean error (ME) of 0.19 and −0.29, respectively, while in the −100 hPa treatment, the predicted cumulative fluxes were approx. double or 4 times those of the observed data (relative ME: 0.93–3.54). This is attributed to the overestimation of gas fluxes in the early stage of the −100 hPa treatment, and the total errors indicated by rRMSE are more sensitive to such extreme daily fluxes. Previous studies have also reported high variability in model performance of predicting daily N2O fluxes (e.g., Grosz et al., 2021; Zimmermann et al., 2018). Since the model captured well the higher fluxes of N2O and N2 in the −30 hPa treatment and the temporal trend of observed fluxes with R2 values ranging from 0.43 to 0.71, model predictions were considered acceptable. Also, the main purpose of this study was not to accurately reproduce emissions but to investigate C and N transformations via major microbial pathways in a soil environment with liquid manure representing a type of organic hotspot that is characteristic of intensive agriculture. The different model-data errors under contrasting moisture levels could be related to the use of relationships between soil moisture and diffusivity factors to calculate the availability of substrates at the sites of enzymatic reactions rather than empirical moisture response functions, as process-based models often do. Since the distribution of soil water content in the soil cores remained almost constant during the 4-week incubation (Fig. S4), temporal variations in soil moisture responses and gas diffusivity associated with water movement were less important than solute diffusion in the experimental setup used in this study.
The simulated profiles of solutes, including mineral N and DOC, showed generally the same spatiotemporal patterns as the measured or estimated data from the experiment, albeit with some discrepancies. The overestimation of NH on day 1 (Figs. 3a, b and 4a, b) may have several reasons. First, there was some uncertainty about the NH initial condition set in the model due to a potential for ammonia volatilization from the cattle slurry while infiltrating into the soil during sample preparation. Next, we assumed that a few hours after manure application the NH content was uniformly distributed within an 8 mm depth interval, but the liquid manure could have spread to a wider range and hence become more diluted. These two mechanisms would lead to overestimation of the initial NH concentrations in the modeled manure zone compared to the actual level on day 0 in the experiment. Uncertainty about the NH adsorption isotherm (Hunt and Adamsen, 1985; Sieczka and Koda, 2016) could be another reason for the high model estimates of NH in the manure zone if the modeled NH mobility was lower than the actual mobility in the loamy sandy soil. Ammonium uptake by bacteria as part of osmoregulation could also have contributed to the rapid disappearance of NH in the experiment, since the osmotic pressure of solutes in livestock slurry can exceed −1000 kPa (Petersen and Andersen, 1996), and hyperosmotic conditions induce bacteria to accumulate amino acids (Li et al., 2011). Also, the immobilization of NH would occur in connection with the bacterial growth on the basis of DOC (Recous et al., 1990). The processing of NH by AOB was also included in the model and partly accounted for this process, while the related parameter, yield coefficient, was fixed by taking values from the literature where uncertainty existed.
The spatiotemporal pattern of modeled NO aligned well with measurements in the −100 hPa treatment, while in the −30 hPa treatment a depletion of NO was simulated around the manure zone by day 28, which was absent from the NO profile observed. The rebound of NO in the experiment could be related to the mineralization of labile organic N in the manure followed by nitrification, a mechanism that is currently not included in the model and a potential source of model structure uncertainty. Møller et al. (2004) reported an average protein content of 150 g kg−1 of VSs in cattle slurry, part of which could have been degraded within the first days of incubation. The modeled denitrifier biomass in the −30 hPa treatment remained much higher (>23 times) in the manure zone compared to the background level on day 28, whereas the biomass of AOB and NOB had declined to less than twice the background level (Fig. S5). In an experimental study by Petersen et al. (1992), the potential for denitrification in the manure-saturated zone decreased in the late stage of the incubation, which was explained by the decay of microorganisms or inhibition of enzymatic activities caused by NO toxicity, specifically the unionized nitrous acid species (Abeling and Seyfried, 1992). Microbial decay in the model followed first-order kinetics with a constant decay rate, and it may be possible in future work to improve relevant parameters and consider the response to substrates on microbial decay and maintenance based on previous studies (Ni et al., 2011).
The spatial stratification of nitrifier and denitrifier growth in the model (Figs. S5 and S6) was consistent with experimental results (e.g., Nielsen et al., 1996; Petersen et al., 1992) showing a very high potential for nitrification developing within a few millimeters from the manure–soil interface and the potential for denitrification growing within the manure-saturated zone. In both treatments, after significant growth of microbial populations, the reduction in biomass of aerobic heterotrophs, AOB, NOB, and denitrifiers indicated a predominance of decay over growth which had been gradually limited by the depletion of substrates, i.e., DOC for heterotrophs and denitrifiers, ammonium for AOB, and nitrite for NOB, as the simulated nitrogen removal from the soil continued. The spatial distributions of aerobic heterotrophs and nitrifying bacteria were similar to and distinctly different from that of denitrifying bacteria.
Variation in the availability of O2 at enzymatic sites was the main factor accounting for the stratification of microbial communities in the model, where the growth of denitrifying bacteria was promoted at the center of the manure zone with O2 limitation, while aerobic bacteria preferentially developed outside the saturated or near-saturated zone with better access to O2. The simulated O2 concentration in soil pore air indicated that O2 re-entered the center of the manure zone within the first 24 h (Figs. S5 and S6). If the anoxic volume had been larger, as observed in experiments with centimeter-scale hotspots (Markfoged et al., 2011; Petersen et al., 1996), the O2 depletion zone would probably have been larger and temporally more stable. Thus, micro-sensor measurements showed an oxygen penetration into a manure hotspot of less than 1 mm during the first week (Petersen et al., 1996). The simulated rapid recovery of O2 in the air-filled pores in the manure zone predicted by the model was related to the small extent of the anoxic zone that was predicted for the experimental system, which was as narrow as 2 mm. However, the limited gas diffusivity within the manure zone still led to a low level of O2 available for enzymatic reactions throughout the 4-week simulation (Fig. S9).
4.2 Effects of solute diffusion
Switching off solute diffusion between layers greatly reduced the modeled N2O emissions in the −30 hPa treatment (Fig. 7), whereas at −100 hPa soil water potential the effect was much less and indicated that solute diffusion between manure and soil layers was already low. The contrasting effects that we found in the scenario tests with the complete or partial elimination of solute diffusion were considered to reflect the importance of different mechanisms contributing to N2O emissions at the two moisture levels.
Dissimilatory NO reduction by denitrifying bacteria initiates the chain of reactions resulting in a stepwise reduction in nitrogenous oxides to N2 and emission to the ambient air. In the −30 hPa treatment, a hotspot of NO consumption was present at the center of the manure zone where, by day 1, the diffusive supply was ca. 103 % of the NO demand by denitrification and by day 3 ca. 99 % (Fig. S18). After day 7, NO generated from nitrification accounted for a greater proportion of the demand for denitrification and was 12 %–17 % in the second week. The NO diffusing from the soil–manure interface towards the anoxic center was due to nitrification outside the hotspot, as well as transport of soil NO. Eliminating the diffusion of NO, the initially low NO at the anoxic center could not be replenished by either source, thereby hindering the potential for denitrification in the simulation. The lack of NO transport could account for the dramatic decrease in N2O flux in the Scenario 1 test for the −30 hPa treatment. By day 1, the NO produced from nitrification, which could be estimated from Fig. 6a and soil moisture, was still lower than the initial NO content in the bulk soil, which was 4.5 mmol L−1 in the −30 hPa soil and 6.2 mmol L−1 in the −100 hPa soil (Figs. S5 and S6). Nitrification-derived NO gradually became comparable to, and even exceeded, the soil NO level after day 3. However, the transport of NO from the bulk soil, initially present at z>0.046 m and z>0.054 m, to the anoxic zone (0.049–0.051 m) became less efficient than the nitrification-derived NO which was produced immediately outside the anoxic zone, thus increasing the relative importance of nitrification-derived NO over time, as shown previously in controlled experiments with 15N enrichment of the external NO supply (Nielsen et al., 1996). Allowing NO diffusion only (Scenario 2) did not greatly improve the N2O emission compared to Scenario 1, which reflects the limited role of NO supply from the bulk soil owing to the increasing transport distance and absence of nitrification without access to NH. However, allowing for NO diffusion in the −30 hPa soil was still better than allowing NH diffusion only in this treatment (Scenario 3), and hence the co-occurrence of nitrification and denitrification within the manure zone was insufficient to account for the observed N2O emissions. These limitations could be alleviated by allowing the diffusion of all nitrogenous substrates from the simulation (Scenario 4), allowing for the coupling between nitrification outside the anoxic zone and denitrification inside this zone.
In the −100 hPa treatment, in contrast, the spatial stratification of nitrification and denitrification was less evident because the production of NO within the denitrification zone was only moderately lower than the production around the interface and could cover the demand for denitrification in this scenario (Fig. S11). Specifically, the nitrification rate and diffusion rate within the 0.049–0.051 m interval were, respectively, 103 % and 89 % of the denitrification rate on day 1, and the nitrification rate continued to increase by day 3 (Fig. S19), showing that the NO consumption within the denitrification center in the −100 hPa treatment was much lower than the NO supply, with nitrification rather than solute diffusion as the dominating source. Compared with the −30 hPa treatment, the larger air-filled porosity (Fig. S3) and higher availability of O2 (Fig. S9) in the −100 hPa treatment thus supported a higher nitrification activity which was sufficient to sustain the denitrification activity at the center of the manure zone. The limited solute diffusion in the −100 hPa treatment was due to the much lower effective diffusion coefficients in the aqueous phase, and with more extensive nitrification, gradients of NO concentrations between the soil and the manure zone could be smaller relative to that in the −30 hPa treatment. The simulated N2O emission was not influenced by cutting off the solute diffusion as much as that of the −30 hPa treatment, indicating that tightly coupled nitrification and denitrification within the manure zone, rather than solute diffusion from surrounding soil, sustained denitrification. This is in accordance with the results of Manzoni and Katul (2014), who found that hydrological connectivity may continue to exist at microscale even when macroscale solute diffusivity is interrupted. Hence, the model predicted that when manure is applied to drier soil, the redistribution of water may support an even closer coupling between nitrification and denitrification than is the case in wetter soil with much less redistribution of liquid manure (Petersen et al., 2003).
Some experimental studies (Meyer et al., 2002; Nielsen et al., 1996; Petersen et al., 1991, 1992) have reported that in manure-amended soil there may be a distance of only a few millimeters between active nitrification and denitrification zones, facilitating coupled nitrification–denitrification. These observations are consistent with our model predictions for the −30 hPa treatment, where a very pronounced stratification of microbial populations was simulated. We also found support for an even closer, though short-lived, coupling of nitrification and denitrification in the simulation of the −100 hPa treatment. The manure hotspots investigated here were relatively small, with only a 2 mm layer dominated by manure, and field application of liquid cattle manure is likely to form, depending on application method, centimeter-scale hotspots with a greater potential for developing coupled nitrification–denitrification. Based on the discussion above, we suggest that solute diffusion should be considered a key control of denitrification and N2O emissions in soil–manure systems. The extent will depend on factors such as soil water content and texture controlling water film continuity, as well as manure application rate and application method determining soil–manure contact and stability of anoxic volumes that can support denitrification.
4.3 Model uncertainties and future applications
The model presented was able to qualitatively reflect gaseous emissions and changes in carbon and nitrogen pools in and around an organic hotspot in soil, but several aspects of model uncertainty remain. First, the initial condition used in the model was a simplification of actual conditions due to the lack of detailed soil analysis within the first 24 h of incubation. We considered the stabilized slurry redistribution as a “box”; i.e., liquid manure was redistributed by piston flow away from the initial placement of the added manure. However, in reality the joint effects of dispersion and diffusion could result in a more continuous distribution of dissolved slurry components over a wider zone. Also, some reactive C and N components contained in the manure may have been lost between the time of manure sampling for chemical analyses and the initiation of incubations. These two factors could result in the estimated initial concentrations of manure components in the assumed manure zone being overestimated. We suggest that if incubation experiments are designed to support modeling, more frequent sampling early in the experiment can provide an opportunity to better characterize the behavior of the system.
In the model, we assumed the gases generated from biochemical reactions existed in air-filled pores instead of modeling the water–air exchange. Therefore, the current model is suitable for simulating processes in unsaturated rather than saturated soil where N2O and CO2 can only exist in dissolved form. However, when saturated volumes only account for a small fraction of the total samples, small adaptations can be made in model application. In this study, we included a small fraction of air-filled porosity (i.e., 0.01) in the 2 mm saturated zone when modeling the −30 hPa treatment to ensure the validity of Eq. (1) over the entire model domain. The value of the air-filled porosity did influence the absolute values of simulated gas fluxes. However, when the value of the air-filled porosity was kept within a reasonable range, specifically well below the air-filled porosity (i.e., 0.042) at the center of the −100 hPa treatment samples, the dominating processes associated with the emissions were not influenced much. Thus, when keeping the zero air-filled porosity in the saturated zone or changing the added air-filled porosity to be 0.001, the modeled N2O peak, compared to the baseline simulation and observations, showed an increase in both cases in the −30 hPa treatment, as anoxia dominated more at the center of soil cores, whereas the qualitative results regarding solute diffusion and the spatiotemporal patterns of reaction rates remained the same (Figs. S22 and S23). Based on the above two air-filled porosity settings in the −30 hPa treatment, we also attempted to re-optimize the model parameters in order to specifically reduce the model-data errors, and the main conclusions we obtained were not changed (data not shown).
In describing the microbial activities in the model, the possible substrate inhibition of nitrifiers and denitrifiers was neglected. For example, denitrification may be inhibited by high concentrations of NO (Francis and Mankin, 1977), which has been attributed to toxicity in situations where NO accumulates (Abeling and Seyfried, 1992; Glass et al., 1997). The mineralization of organic N, including the transfer of microbial organic N to mineral pools via microbial death, was also not included in the model at this time and is a topic for future research. However, in the manure hotspot environment the N available for nitrifiers is dominated by ammonium derived from urea in excretal returns or organic matter decomposed during storage (Jost et al., 2013; Webb et al., 2013). Following the study by Chen et al. (2019), only AOB and NOB were capable of N incorporation in the model, and heterotrophic growth was linked to C incorporation. It should be noted that the focus of the study was on the coupled nitrification–denitrification and the resulting spatiotemporal dynamics of multiple C and N species, and the consideration of additional microbial processes, e.g., detailed mineralization and immobilization, would further complicate the system.
The model was able to depict the spatiotemporal patterns of the main N2O forming processes in soil including nitrification, nitrifier denitrification, and denitrification. However, uncertainty exists in the relative contributions of these processes, especially the nitrifier denitrification pathway, as relevant parameters were not well constrained by the available measurements, and the simulated gas fluxes were less sensitive to the parameters regarding nitrifier denitrification than to the parameters regarding the other two processes (Fig. S24). Detailed quantification of N2O sources from different processes was beyond the scope of our study, but isotopic signatures of N2O are a promising tool in this respect, as shown in the modeling study by Chang et al. (2022).
For a complex biochemical model such as the one presented, the detailed parameter design gave physical meaning to each parameter, allowing great flexibility in describing the processes, but there is a potential for parameter equifinality. When analyzing parameter correlations in the posterior ensemble (i.e., 1 % best runs), we found that parameter correlations in the ensemble were mostly between −0.6 and 0.6, although some parameters, such as the maximum reaction rates in the stepwise denitrification process, showed relatively higher correlation coefficients (Fig. S25). The parameter values in the ensemble were overall well-constrained and normally distributed (Fig. S25). Therefore, we consider that parameter equifinality was not a severe issue here, although a formal analysis is required to make more concrete conclusions. Besides, when optimizing parameters, manually adjusting the variable weights in the objective function may have led to biased model-data errors in some variable estimates (Konak et al., 2006). Exploring better designs for multi-objective optimization (e.g., Cheng et al., 2002; Konak et al., 2006; Li et al., 2010; Nguyen et al., 2019), which involve not only temporal variation in gas emissions (e.g., CO2, N2O, and N2) but also spatiotemporal variation in substrates (e.g., DOC and inorganic N) in the soil, is a topic for further studies to improve N2O model performance.
The contributions of different biochemical pathways to N2O emissions have been elaborately studied in wastewater systems (e.g., Chen et al., 2019; Ni et al., 2011; Peng et al., 2014), and the role of solute diffusion has long been a topic in the experimental and modeling field of soil aggregates (e.g., Kremen et al., 2005; Schlüter et al., 2018; Smith, 1980) and permeable sediments (e.g., Kessler et al., 2013). These processes, however, have not been explored well in meso- and large-scale soil modeling. The experiment investigated in this study represented a period immediately after the incorporation of liquid manure with no rainfall causing infiltration or leaching around the surfaces. With this constraint, the proposed diffusion–reaction model is capable of simulating soil conditions for constant soil moisture levels below or at the water holding capacity (i.e., no leaching). Water convection, e.g., during and after rainfall or irrigation, will require an extension of the model concept by adding hydrological processes.
“Hotspot” effects depend not only on application rate but also on the application method which defines the contact area between soil and manure and hence the exchange of gases and solutes. With a high surface-to-volume ratio (i.e., smaller hotspots), more oxygen is available for C turnover, and as a consequence the duration of anoxic conditions is too short for the significant growth of nitrifiers and coupled nitrification–denitrification. For example, Petersen et al. (1992) incubated cattle slurry as 16 or 8 mm hotspots surrounded by soil in cylinders, and a slurry corresponding to a 12 mm layer was fully mixed with soil. The N recovered as denitrification in the samples with 16 and 8 mm hotspots and the mixed sample corresponded to 40 %, 33 %, and 0.3 % of total ammoniacal N in the cattle slurry, respectively. Future applications of the model could include predicting effects of surface-to-volume ratios of manure-amended soil corresponding to different application methods (e.g., incorporated by plowing or injected), which may then be examined in experiments under field conditions. Also, the influence of soil moisture associated with modeled diffusional constraints on soil N2O emissions could be re-assessed based on properly designed experiments.
Understanding the spatiotemporal distribution of nitrification and denitrification in agroecosystems, and particularly that associated with field-applied manure, may be crucial for reducing the uncertainty about agricultural N2O emission estimates in process-based soil biogeochemistry models. The present modeling study, supported by an incubation experiment, gives new insights into the importance of biochemical processes in heterogeneous soil environments. The simulation results confirmed previous experimental work suggesting that nitrifier and denitrifier communities develop in closely coupled but separate niches in soils amended with manure. Denitrifiers mainly developed in the predominantly anoxic zone, whereas nitrifiers and aerobic heterotrophs proliferated around the interface between bulk soil and manure-amended soil. The stratification was affected by soil moisture and became tighter with decreasing soil water content in response to better aeration and constraints on solute diffusion. In accordance with the spatial features of bacterial communities, the saturated or near-saturated center of the manure zone was a hotspot of N2O production by denitrification and possibly nitrifier denitrification, whereas nitrification dominated the N2O production at the better-aerated interface according to the model. In the manure-amended soil volume where NO was initially depleted, the NO demand of denitrification was largely maintained by nitrification, demonstrating a strong coupling of nitrification and denitrification either in the same layer or separated by a short distance depending on soil water content. Breaking down the sources and sinks of NO in the model clearly revealed the important contribution of solute diffusion to the supply of NO for denitrification, and neglecting this process will significantly deteriorate the accuracy of N2O emission estimates, as demonstrated with scenarios without the concurrent transport and reactions of NO, NO, and NH in the vicinity of organic hotspots. The implications of this study are of importance for soil N2O modeling in general by suggesting that if solute transport is not included in process-based models when simulating stagnant soil conditions and if organic hotspots are present, then model-estimated N2O emissions could be much lower than the actual emissions.
The main codes of the model are available as a Zenodo repository (https://doi.org/10.5281/zenodo.8366778, Zhang, 2023).
The laboratory experiment and the simulation data are available from the authors on request.
The supplement related to this article is available online at: https://doi.org/10.5194/bg-20-3895-2023-supplement.
JZ and SOP conceived the study. JZ developed the model and carried out the modeling experiments, with contributions from SOP and WZ. ELK conducted the lab experiment. JZ prepared the manuscript and figures with contributions from all co-authors.
The contact author has declared that none of the authors has any competing interests.
Publisher's note: Copernicus Publications remains neutral with regard to jurisdictional claims in published maps and institutional affiliations.
The authors wish to thank the Danmarks Frie Forskningsfond (grant no. 0136-00118B) for the financial support for this study, as well as Per-Erik Jansson for the insightful feedback. Wenxin Zhang acknowledges grants from the Swedish Research Council VR (2020-05338) and Swedish National Space Agency (209/19).
This research has been supported by the Danmarks Frie Forskningsfond (grant no. 0136-00118B).
This paper was edited by Cindy De Jonge and reviewed by Eric Davidson and two anonymous referees.
Abeling, U. and Seyfried, C. F.: Anaerobic-aerobic treatment of high-strength ammonium wastewater – nitrogen removal via nitrite, Water Sci. Technol., 26, 1007–1015, https://doi.org/10.2166/wst.1992.0542, 1992.
Barbarika, A., Sikora, L. J., and Colacicco, D.: Factors affecting the mineralization of nitrogen in sewage sludge applied to soils, Soil Sci. Soc. Am. J., 49, 1403–1406, https://doi.org/10.2136/sssaj1985.03615995004900060014x, 1985.
Brilli, L., Bechini, L., Bindi, M., Carozzi, M., Cavalli, D., Conant, R., Dorich, C. D., Doro, L., Ehrhardt, F., Farina, R., Ferrise, R., Fitton, N., Francaviglia, R., Grace, P., Iocola, I., Klumpp, K., Léonard, J., Martin, R., Massad, R. S., Recous, S., Seddaiu, G., Sharp, J., Smith, P., Smith, W. N., Soussana, J.-F., and Bellocchi, G.: Review and analysis of strengths and weaknesses of agro-ecosystem models for simulating C and N fluxes, Sci. Total Environ., 598, 445–470, https://doi.org/10.1016/j.scitotenv.2017.03.208, 2017.
Brisson, N., Gary, C., Justes, E., Roche, R., Mary, B., Ripoche, D., Zimmer, D., Sierra, J., Bertuzzi, P., Burger, P., Bussière, F., Cabidoche, Y. M., Cellier, P., Debaeke, P., Gaudillère, J. P., Hénault, C., Maraux, F., Seguin, B., and Sinoquet, H.: An overview of the crop model STICS, Eur. J. Agron., 18, 309–332, https://doi.org/10.1016/S1161-0301(02)00110-7, 2003.
Butterbach-Bahl, K., Baggs, E. M., Dannenmann, M., Kiese, R., and Zechmeister-Boltenstern, S.: Nitrous oxide emissions from soils: how well do we understand the processes and their controls?, Philos. T. Roy. Soc. B, 368, 20130122, https://doi.org/10.1098/rstb.2013.0122, 2013.
Chang, B., Yan, Z., Ju, X., Song, X., Li, Y., Li, S., Fu, P., and Zhu-Barker, X.: Quantifying biological processes producing nitrous oxide in soil using a mechanistic model, Biogeochemistry, 159, 1–14, https://doi.org/10.1007/s10533-022-00912-0, 2022.
Charles, A., Rochette, P., Whalen, J. K., Angers, D. A., Chantigny, M. H., and Bertrand, N.: Global nitrous oxide emission factors from agricultural soils after addition of organic amendments: a meta-analysis, Agr. Ecosyst. Environ., 236, 88–98, https://doi.org/10.1016/j.agee.2016.11.021, 2017.
Chen, X., Ni, B. J., and Sin, G.: Nitrous oxide production in autotrophic nitrogen removal granular sludge: a modeling study, Biotechnol. Bioeng., 116, 1280–1291, https://doi.org/10.1002/bit.26937, 2019.
Cheng, C. T., Ou, C. P., and Chau, K. W.: Combining a fuzzy optimal model with a genetic algorithm to solve multi-objective rainfall–runoff model calibration, J. Hydrol., 268, 72–86, https://doi.org/10.1016/S0022-1694(02)00122-1, 2002.
Christensen, S., Simkins, S., and Tiedje, J. M.: Spatial variation in denitrification: dependency of activity centers on the soil environment, Soil Sci. Soc. Am. J., 54, 1608–1613, https://doi.org/10.2136/SSSAJ1990.03615995005400060016X, 1990a.
Christensen, S., Simkins, S., and Tiedje, J. M.: Temporal patterns of soil denitrification: their stability and causes, Soil Sci. Soc. Am. J., 54, 1614–1618, https://doi.org/10.2136/SSSAJ1990.03615995005400060017X, 1990b.
Conen, F., Dobbie, K. E., and Smith, K. A.: Predicting N2O emissions from agricultural land through related soil parameters, Global Change Biol., 6, 417–426, https://doi.org/10.1046/j.1365-2486.2000.00319.x, 2000.
Davidson, E. A.: The contribution of manure and fertilizer nitrogen to atmospheric nitrous oxide since 1860, Nat. Geosci., 2, 659–662, https://doi.org/10.1038/ngeo608, 2009.
Davidson, E. A., Samanta, S., Caramori, S. S., and Savage, K.: The Dual Arrhenius and Michaelis – Menten kinetics model for decomposition of soil organic matter at hourly to seasonal time scales, Global Change Biol., 18, 371–384, https://doi.org/10.1111/j.1365-2486.2011.02546.x, 2012.
Francis, C. W. and Mankin, J. B.: High nitrate denitrification in continuous flow-stirred reactors, Water Res., 11, 289–294, https://doi.org/10.1016/0043-1354(77)90061-6, 1977.
Gjettermann, B., Styczen, M., Hansen, H. C. B., Vinther, F. P., and Hansen, S.: Challenges in modelling dissolved organic matter dynamics in agricultural soil using DAISY, Soil Biol. Biochem., 40, 1506–1518, https://doi.org/10.1016/J.SOILBIO.2008.01.005, 2008.
Glass, C., Silverstein, J., and Oh, J.: Inhibition of denitrification in activated sludge by nitrite, Water Environ. Res., 69, 1086–1093, https://doi.org/10.2175/106143097X125803, 1997.
Groffman, P. M., Butterbach-Bahl, K., Fulweiler, R. W., Gold, A. J., Morse, J. L., Stander, E. K., Tague, C., Tonitto, C., and Vidon, P.: Challenges to incorporating spatially and temporally explicit phenomena (hotspots and hot moments) in denitrification models, Biogeochemistry, 93, 49–77, https://doi.org/10.1007/s10533-008-9277-5, 2009.
Grosz, B., Well, R., Dechow, R., Köster, J. R., Khalil, M. I., Merl, S., Rode, A., Ziehmer, B., Matson, A., and He, H.: Evaluation of denitrification and decomposition from three biogeochemical models using laboratory measurements of N2, N2O and CO2, Biogeosciences, 18, 5681–5697, https://doi.org/10.5194/bg-18-5681-2021, 2021.
Hansen, S., Abrahamsen, P., Petersen, C. T., and Styczen, M.: Daisy: model use, calibration, and validation, T. ASABE, 55, 1317–1335, https://doi.org/10.13031/2013.42244, 2012.
Holzworth, D. P., Huth, N. I., deVoil, P. G., Zurcher, E. J., Herrmann, N. I., McLean, G., Chenu, K., van Oosterom, E. J., Snow, V., Murphy, C., Moore, A. D., Brown, H., Whish, J. P. M., Verrall, S., Fainges, J., Bell, L. W., Peake, A. S., Poulton, P. L., Hochman, Z., Thorburn, P. J., Gaydon, D. S., Dalgliesh, N. P., Rodriguez, D., Cox, H., Chapman, S., Doherty, A., Teixeira, E., Sharp, J., Cichota, R., Vogeler, I., Li, F. Y., Wang, E., Hammer, G. L., Robertson, M. J., Dimes, J. P., Whitbread, A. M., Hunt, J., van Rees, H., McClelland, T., Carberry, P. S., Hargreaves, J. N. G., MacLeod, N., McDonald, C., Harsdorf, J., Wedgwood, S., and Keating, B. A.: APSIM – Evolution towards a new generation of agricultural systems simulation, Environ. Model. Softw., 62, 327–350, https://doi.org/10.1016/J.ENVSOFT.2014.07.009, 2014.
Hunt, H. W. and Adamsen, F. J.: Empirical representation of ammonium adsorption in two soils, Soil Sci., 139, 205–210, https://doi.org/10.1097/00010694-198503000-00003, 1985.
Jansson, P.-E. and Moon, D. S.: A coupled model of water, heat and mass transfer using object orientation to improve flexibility and functionality, Environ. Model. Softw., 16, 37–46, https://doi.org/10.1016/S1364-8152(00)00062-1, 2001.
Jensen, J. L., Christensen, B. T., Schjønning, P., Watts, C. W., and Munkholm, L. J.: Converting loss-on-ignition to organic carbon content in arable topsoil: pitfalls and proposed procedure, Eur. J. Soil Sci., 69, 604–612, https://doi.org/10.1111/EJSS.12558, 2018.
Jones, J. W., Tsuji, G. Y., Hoogenboom, G., Hunt, L. A., Thornton, P. K., Wilkens, P. W., Imamura, D. T., Bowen, W. T., and Singh, U.: Decision support system for agrotechnology transfer: DSSAT v3, Springer, Dordrecht, 157–177, https://doi.org/10.1007/978-94-017-3624-4, 1998.
Jost, D. I., Aschemann, M., Lebzien, P., Joergensen, R. G., and Sundrum, A.: Microbial biomass in faeces of dairy cows affected by a nitrogen deficient diet, Arch. Anim. Nutr., 67, 104–118, https://doi.org/10.1080/1745039X.2013.776326, 2013.
Kessler, A. J., Glud, R. N., Cardenas, M. B., and Cook, P. L. M.: Transport zonation limits coupled nitrification-denitrification in permeable sediments, Environ. Sci. Technol., 47, 13404–13411, https://doi.org/10.1021/es403318x, 2013.
Khalil, K., Renault, P., Guerin, N., and Mary, B.: Modelling denitrification including the dynamics of denitrifiers and their progressive ability to reduce nitrous oxide: comparison with batch experiments, Eur. J. Soil Sci., 56, 491–504, https://doi.org/10.1111/j.1365-2389.2004.00681.x, 2005.
Kolstad, E., Well, R., Grosz, B., and Petersen, S. O.: Nitrogen dynamics and nitrous oxide emissions of a manure hotspot as influenced by bulk density and soil water potential, in preparation, 2023.
Konak, A., Coit, D. W., and Smith, A. E.: Multi-objective optimization using genetic algorithms: a tutorial, Reliab. Eng. Syst. Safe., 91, 992–1007, https://doi.org/10.1016/J.RESS.2005.11.018, 2006.
Kravchenko, A. N., Toosi, E. R., Guber, A. K., Ostrom, N. E., Yu, J., Azeem, K., Rivers, M. L., and Robertson, G. P.: Hotspots of soil N2O emission enhanced through water absorption by plant residue, Nat. Geosci., 10, 496–500, https://doi.org/10.1038/ngeo2963, 2017.
Kremen, A., Bear, J., Shavit, U., and Shaviv, A.: Model demonstrating the potential for coupled nitrification denitrification in soil aggregates, Environ. Sci. Technol., 39, 4180–4188, https://doi.org/10.1021/es048304z, 2005.
Li, C., Frolking, S., and Frolking, T. A.: A model of nitrous oxide evolution from soil driven by rainfall events: 1. model structure and sensitivity, J. Geophys. Res.-Atmos., 97, 9759–9776, https://doi.org/10.1029/92JD00509, 1992.
Li, C., Aber, J., Stange, F., Butterbach-Bahl, K., and Papen, H.: A process-oriented model of N2O and NO emissions from forest soils: 1. model development, J. Geophys. Res.-Atmos., 105, 4369–4384, https://doi.org/10.1029/1999JD900949, 2000.
Li, X., Weller, D. E., and Jordan, T. E.: Watershed model calibration using multi-objective optimization and multi-site averaging, J. Hydrol., 380, 277–288, https://doi.org/10.1016/J.JHYDROL.2009.11.003, 2010.
Li, Z. H., Alvarez, V. E., De Gaudenzi, J. G., Sant'Anna, C., Frasch, A. C. C., Cazzulo, J. J., and Docampo, R.: Hyperosmotic stress induces aquaporin-dependent cell shrinkage, polyphosphate synthesis, amino acid accumulation, and global gene expression changes in Trypanosoma cruzi, J. Biol. Chem., 286, 43959–43971, https://doi.org/10.1074/JBC.M111.311530, 2011.
Manzoni, S. and Katul, G.: Invariant soil water potential at zero microbial respiration explained by hydrological discontinuity in dry soils, Geophys. Res. Lett., 41, 7151–7158, https://doi.org/10.1002/2014GL061467, 2014.
Markfoged, R., Nielsen, L. P., Nyord, T., Ottosen, L. D. M., and Revsbech, N. P.: Transient N2O accumulation and emission caused by O2 depletion in soil after liquid manure injection, Eur. J. Soil Sci., 62, 541–550, https://doi.org/10.1111/j.1365-2389.2010.01345.x, 2011.
Meyer, R. L., Kjaer, T., and Revsbech, N. P.: Nitrification and denitrification near a soil-manure interface studied with a nitrate-nitrite biosensor, Soil Sci. Soc. Am. J., 66, 498–506, https://doi.org/10.2136/SSSAJ2002.4980, 2002.
Millington, R. J.: Gas diffusion in porous media, Science, 130, 100–102, https://doi.org/10.1126/science.130.3367.100.b, 1959.
Møller, H. B., Sommer, S. G., and Ahring, B. K.: Methane productivity of manure, straw and solid fractions of manure, Biomass Bioenerg., 26, 485–495, https://doi.org/10.1016/j.biombioe.2003.08.008, 2004.
Nguyen, T. H., Nong, D., and Paustian, K.: Surrogate-based multi-objective optimization of management options for agricultural landscapes using artificial neural networks, Ecol. Model., 400, 1–13, https://doi.org/10.1016/J.ECOLMODEL.2019.02.018, 2019.
Ni, B. J., Sheng, G. P., and Yu, H. Q.: Model-based characterization of endogenous maintenance, cell death and predation processes of activated sludge in sequencing batch reactors, Chem. Eng. Sci., 66, 747–754, https://doi.org/10.1016/J.CES.2010.11.033, 2011.
Nielsen, T. H. and Revsbech, N. P.: Diffusion chamber for nitrogen-15 determination of coupled nitrification-denitrification around soil-manure interfaces, Soil Sci. Soc. Am. J., 58, 795–800, https://doi.org/10.2136/sssaj1994.03615995005800030022x, 1994.
Nielsen, T. H., Nielsen, L. P., and Revsbech, N. P.: Nitrification and coupled nitrification-denitrification associated with a soil-manure interface, Soil Sci. Soc. Am. J., 60, 1829–1840, https://doi.org/10.2136/sssaj1996.03615995006000060031x, 1996.
Oenema, O., Wrage, N., Velthof, G. L., Van Groenigen, J. W., Dolfing, J., and Kuikman, P. J.: Trends in global nitrous oxide emissions from animal production systems, Nutr. Cycl. Agroecosyst., 72, 51–65, https://doi.org/10.1007/s10705-004-7354-2, 2005.
Olesen, T., Griffiths, B. S., Henriksen, K., Moldrup, P., and Wheatley, R.: Modeling diffusion and reaction in soils: V. Nitrogen transformations in organic manure-amended soil, Soil Sci., 162, 157–168, 1997a.
Olesen, T., Moldrup, P., and Henriksen, K.: Modeling diffusion and reaction in soils: VI. Ion diffusion and water characteristics in organic manure-amended soil, Soil Sci., 162, 399–409, 1997b.
Olesen, T., Moldrup, P., and Gamst, J.: Solute diffusion and adsorption in six soils along a soil texture gradient, Soil Sci. Soc. Am. J., 63, 519–524, https://doi.org/10.2136/sssaj1999.03615995006300030014x, 1999.
Papendick, R. I. and Campbell, G. S.: Theory and measurement of water potential, in: Water Potential Relations in Soil Microbiology, vol. 9, Soil Science Society of America Special Publications, Madison, WI, 1–22, https://doi.org/10.2136/sssaspecpub9.c1, 2015.
Parton, W. J., Hartman, M., Ojima, D., and Schimel, D.: DAYCENT and its land surface submodel: description and testing, Global Planet. Change, 19, 35–48, https://doi.org/10.1016/S0921-8181(98)00040-X, 1998.
Peng, L., Ni, B. J., Erler, D., Ye, L., and Yuan, Z.: The effect of dissolved oxygen on N2O production by ammonia-oxidizing bacteria in an enriched nitrifying sludge, Water Res., 66, 12–21, https://doi.org/10.1016/j.watres.2014.08.009, 2014.
Petersen, S. O. and Andersen, M. N.: Influence of soil water potential and slurry type on denitrification activity, Soil Biol. Biochem., 28, 977–980, https://doi.org/10.1016/0038-0717(96)00067-3, 1996.
Petersen, S. O., Henriksen, K., and Blackburn, T. H.: Coupled nitrification-denitrification associated with liquid manure in a gel-stabilized model system, Biol. Fertil. Soils, 12, 19–27, 1991.
Petersen, S. O., Nielsen, A. L., Haarder, K., and Henriksen, K.: Factors controlling nitrification and denitrification: a laboratory study with gel-stabilized liquid cattle manure, Microb. Ecol., 23, 239–255, https://doi.org/10.1007/BF00164099, 1992.
Petersen, S. O., Nielsen, T. H., Frostegård, Å., and Olesen, T.: O2 uptake, C metabolism and denitrification associated with manure hot-spots, Soil Biol. Biochem., 28, 341–349, https://doi.org/10.1016/0038-0717(95)00150-6, 1996.
Petersen, S. O., Nissen, H. H., Lund, I., and Ambus, P.: Redistribution of slurry components as influenced by injection method, soil, and slurry properties, J. Environ. Qual., 32, 2399–2409, https://doi.org/10.2134/jeq2003.2399, 2003.
Petersen, S. O., Olsen, A. B., Elsgaard, L., Triolo, J. M., and Sommer, S. G.: Estimation of methane emissions from slurry pits below pig and cattle confinements, PLoS One, 11, 1–16, https://doi.org/10.1371/journal.pone.0160968, 2016.
Recous, S., Mary, B., and Faurie, G.: Microbial immobilization of ammonium and nitrate in cultivated soils, Soil Biol. Biochem., 22, 913–922, https://doi.org/10.1016/0038-0717(90)90129-N, 1990.
Riedo, M., Grub, A., Rosset, M., and Fuhrer, J.: A pasture simulation model for dry matter production, and fluxes of carbon, nitrogen, water and energy, Ecol. Model., 105, 141–183, https://doi.org/10.1016/S0304-3800(97)00110-5, 1998.
Schlüter, S., Henjes, S., Zawallich, J., Bergaust, L., Horn, M., Ippisch, O., Vogel, H. J., and Dörsch, P.: Denitrification in soil aggregate analogues-effect of aggregate size and oxygen diffusion, Front. Environ. Sci., 6, 1–10, https://doi.org/10.3389/fenvs.2018.00017, 2018.
Sexstone, A. J., Parkin, T. B., and Tiedje, J. M.: Temporal response of soil denitrification rates to rainfall and irrigation, Soil Sci. Soc. Am. J., 49, 99–103, https://doi.org/10.2136/SSSAJ1985.03615995004900010020X, 1985.
Sieczka, A. and Koda, E.: Kinetic and equilibrium studies of sorption of ammonium in the soil-water environment in agricultural areas of central poland, Appl. Sci., 6, 269, https://doi.org/10.3390/app6100269, 2016.
Smith, K. A.: A model of the extent of anaerobic zones in aggregated soils, and its potential application to estimates of denitrification, J. Soil Sci., 31, 263–277, https://doi.org/10.1111/j.1365-2389.1980.tb02080.x, 1980.
Sozanska, M., Skiba, U. and Metcalfe, S.: Developing an inventory of N2O emissions from British soils, Atmos. Environ., 36, 987–998, https://doi.org/10.1016/S1352-2310(01)00441-1, 2002.
Syakila, A. and Kroeze, C.: The global nitrous oxide budget revisited, Greenh. Gas Meas. Manage., 1, 17–26, https://doi.org/10.3763/GHGMM.2010.0007, 2011.
Taghizadeh-Toosi, A., Janz, B., Labouriau, R., Olesen, J. E., Butterbach-Bahl, K., and Petersen, S. O.: Nitrous oxide emissions from red clover and winter wheat residues depend on interacting effects of distribution, soil N availability and moisture level, Plant Soil, 466, 121–138, https://doi.org/10.1007/s11104-021-05030-8, 2021.
Thompson, R. L., Lassaletta, L., Patra, P. K., Wilson, C., Wells, K. C., Gressent, A., Koffi, E. N., Chipperfield, M. P., Winiwarter, W., Davidson, E. A., Tian, H., and Canadell, J. G.: Acceleration of global N2O emissions seen from two decades of atmospheric inversion, Nat. Clim. Change, 9, 993–998, https://doi.org/10.1038/s41558-019-0613-7, 2019.
Tian, H., Xu, R., Canadell, J. G., Thompson, R. L., Winiwarter, W., Suntharalingam, P., Davidson, E. A., Ciais, P., Jackson, R. B., Janssens-Maenhout, G., Prather, M. J., Regnier, P., Pan, N., Pan, S., Peters, G. P., Shi, H., Tubiello, F. N., Zaehle, S., Zhou, F., Arneth, A., Battaglia, G., Berthet, S., Bopp, L., Bouwman, A. F., Buitenhuis, E. T., Chang, J., Chipperfield, M. P., Dangal, S. R. S., Dlugokencky, E., Elkins, J. W., Eyre, B. D., Fu, B., Hall, B., Ito, A., Joos, F., Krummel, P. B., Landolfi, A., Laruelle, G. G., Lauerwald, R., Li, W., Lienert, S., Maavara, T., MacLeod, M., Millet, D. B., Olin, S., Patra, P. K., Prinn, R. G., Raymond, P. A., Ruiz, D. J., van der Werf, G. R., Vuichard, N., Wang, J., Weiss, R. F., Wells, K. C., Wilson, C., Yang, J., and Yao, Y.: A comprehensive quantification of global nitrous oxide sources and sinks, Nature, 586, 248–256, https://doi.org/10.1038/s41586-020-2780-0, 2020.
Wagner-Riddle, C., Baggs, E. M., Clough, T. J., Fuchs, K., and Petersen, S. O.: Mitigation of nitrous oxide emissions in the context of nitrogen loss reduction from agroecosystems: managing hot spots and hot moments, Curr. Opin. Environ. Sustain., 47, 46–53, https://doi.org/10.1016/j.cosust.2020.08.002, 2020.
Webb, J., Sørensen, P., Velthof, G., Amon, B., Pinto, M., Rodhe, L., Salomon, E., Hutchings, N., Burczyk, P., and Reid, J.: An assessment of the variation of manure nitrogen efficiency throughout Europe and an appraisal of means to increase manure-N efficiency, Adv. Agron., 119, 371–442, https://doi.org/10.1016/B978-0-12-407247-3.00007-X, 2013.
World Meteorological Organization: WMO Greenhouse gas bulletin: the state of greenhouse gases in the atmosphere based on global observations through 2020, https://library.wmo.int/index.php?lvl=notice_display&id=21975#.YgFFTrrMJaQ (last access: 7 February 2022), 2021.
Wrage, N., Velthof, G. L., van Beusichem, M. L., and Oenema, O.: Role of nitrifier denitrification in the production of nitrous oxide, Soil Biol. Biochem., 33, 1723–1732, https://doi.org/10.1016/S0038-0717(01)00096-7, 2001.
Zhang, J.: Source code of the N2O model, Zenodo [code], https://doi.org/10.5281/zenodo.8366778, 2023.
Zhu, K., Bruun, S., Larsen, M., Glud, R. N., and Jensen, L. S.: Heterogeneity of O2 dynamics in soil amended with animal manure and implications for greenhouse gas emissions, Soil Biol. Biochem., 84, 96–106, https://doi.org/10.1016/J.SOILBIO.2015.02.012, 2015.
Zimmermann, J., Carolan, R., Forrestal, P., Harty, M., Lanigan, G., Richards, K. G., Roche, L., Whitfield, M. G., and Jones, M. B.: Assessing the performance of three frequently used biogeochemical models when simulating N2O emissions from a range of soil types and fertiliser treatments, Geoderma, 331, 53–69, https://doi.org/10.1016/j.geoderma.2018.06.004, 2018.