the Creative Commons Attribution 4.0 License.
the Creative Commons Attribution 4.0 License.
 | 04 Oct 2023
Methane emissions due to reservoir flushing: a significant emission pathway?
Ole Lessmann
Jorge Encinas Fernández
Karla Martínez-Cruz
Frank Peeters
Reservoirs represent a globally significant source of the greenhouse gas methane (CH4), which is emitted via different emission pathways. In some reservoirs, reservoir flushing is employed as a sediment management strategy to counteract growing sediment deposits that threaten reservoir capacity. Reservoir flushing utilizes the eroding force of water currents during water level drawdown to mobilize and transport sediment deposits through the dam outlet into the downstream river. During this process, CH4 that is stored in the sediment can be released into the water and degas to the atmosphere, resulting in CH4 emissions. Here, we assess the significance of this CH4 emission pathway and compare it to other CH4 emission pathways from reservoirs. We measured seasonal and spatial CH4 concentrations in the sediment of Schwarzenbach Reservoir, providing one of the largest datasets on CH4 pore water concentrations in freshwater systems. Based on this dataset we determined CH4 fluxes from the sediment and estimated potential CH4 emissions due to reservoir flushing. CH4 emissions due to one flushing operation can constitute 7 %–14 % of the typical annual CH4 emissions from Schwarzenbach Reservoir, whereby the amount of released CH4 depends on the seasonal timing of the flushing operation and can differ by a factor of 2. Larger flushing events that mobilize deeper sediment layers lead to non-linear increases in CH4 mobilization. This suggests that regular flushing of smaller sediment layers releases less CH4 than removal of the same sediment volume in fewer flushing events of thicker sediment layers. However, additional indirect CH4 emissions pathways contributing to the total CH4 emissions may vary with the flushing operation. In other reservoirs with higher sediment loadings than Schwarzenbach Reservoir, reservoir flushing could cause substantial CH4 emissions, especially when flushing operations are conducted frequently. Our study recognizes CH4 emissions due to reservoir flushing as an important pathway, identifies potential management strategies to mitigate these CH4 emissions and emphasizes the need for further research.
- Article
(2233 KB) - Full-text XML
-
Supplement
(459 KB) - BibTeX
- EndNote


Worldwide millions of reservoirs have been constructed (Lehner et al., 2011; Couto and Olden, 2018), and their number is projected to increase substantially in the near future (Zarfl et al., 2015) because of rising demand for hydropower. Besides being used for electricity generation and energy storage, reservoirs can serve multiple purposes such as water supply, flood control, irrigation and navigation (WCD (World Commission on Dams), 2000). In the past, hydropower was widely considered a greenhouse gas (GHG)-neutral form of energy (Hoffert et al., 1998). Today, we know that reservoirs represent a significant source of GHG emissions, especially of the potent GHG methane (CH4), and researchers have estimated that reservoirs contribute around 10–52 Tg CH4 yr−1 to the global budget of atmospheric CH4 (Lauerwald et al., 2023).
CH4 can be emitted from reservoirs via different pathways such as ebullition, plant-mediated transport, diffusion across the water–atmosphere interface, and degassing during turbination and during spring or fall turnover as storage flux (Bastviken et al., 2011). CH4 is typically produced in the anoxic part of the sediment (Le Mer and Roger, 2001). At oxic interfaces within the sediment, at the sediment surface or within the water column, CH4 is at least partly oxidized by methane-oxidizing bacteria (Bastviken et al., 2002) before it reaches the water surface, from where it is emitted as diffusive flux to the atmosphere. CH4 flux via ebullition and plant mediation, on the other hand, can bypass oxic interfaces, thus avoiding oxidation (Chanton and Whiting, 1995). In anoxic deep water of lakes and reservoirs, CH4 typically accumulates and can reach large concentrations of stored CH4 (Ragg et al., 2021). Intensive vertical mixing during spring and fall overturn causes rapid transport of the stored CH4 to the water surface, from where it diffuses to the atmosphere (Bastviken et al., 2004). This storage flux can substantially exceed the annual diffusive emissions during stratified conditions (Encinas Fernández et al., 2014).
While most of these emission pathways usually exist in both lakes and reservoirs, the degassing of CH4 during turbination occurs only in reservoirs where it can become the dominant source of CH4 emissions (Kemenes et al., 2007; Harrison et al., 2021), especially if the turbinated water is drawn from anoxic deep water where large amounts of CH4 are stored. Ebullition of CH4 is often observed as the dominant emission pathway, especially in shallow reservoirs (DelSontro et al., 2010; Sobek et al., 2012). It is well known that changes in hydrostatic pressure can induce bubble formation and release from sediments (Maeck et al., 2014; Harrison et al., 2017; Encinas Fernández et al., 2020). Therefore, water level drawdowns in reservoirs can substantially increase the ebullition flux of CH4 due to decreasing pressure, which can become particularly large during fall drawdown or occur regularly during diel pumped-storage operations, as well as hydropeaking and ship lock operations (Maeck et al., 2014; Harrison et al., 2017; Almeida et al., 2020; Encinas Fernández et al., 2020).
Growing sediment deposits in reservoirs, caused by particles introduced from the catchment and organic matter produced within the system, pose a challenge to maintaining reservoir capacity (e.g., by decreasing reservoir storage volume). Globally, reservoir storage capacity is decreasing and is estimated to be completely lost for most reservoirs within 200–300 years if sediment management strategies are not adopted (ICOLD, 2009). Sediment management strategies are applied in reservoirs to reduce sediment yield, route sediments or remove already-deposited sediment (Morris, 2020; Petkovšek et al., 2020). Deposited sediment can be removed by mechanical removal (e.g., dredging) or hydraulic flushing, which utilizes the eroding force of water currents. Drawdown flushing represents a typical form of hydraulic flushing, which consists of three steps: completely drawing down the water level, maintaining a free-flow state and recovering water levels (Kondolf et al., 2014). During the free-flow state, sediment is mobilized and flushed through a dam outlet to the downstream river section. Consequently, any CH4 previously stored in the sediment pore water is also mobilized into the water stream and can eventually degas to the atmosphere at the water surface, during turbination or downstream of the reservoir, leading to CH4 emissions. Sediment flushing operations have been conducted worldwide in reservoirs of all sizes, with (initial) storage capacities ranging widely from 0.8×10⁶ to 9640×106 m3 (Sumi et al., 2017; Antoine et al., 2020). Among reservoirs with relatively regular flushing operations, flushing frequencies of between twice a year and once every 5 years have been reported (Brandt and Swenning, 1999; Chang et al., 2003; Kantoush and Sumi, 2010; Fruchard and Camenen, 2012; Grimardias et al., 2017; Sumi et al., 2017; Antoine et al., 2020), but there are also reservoirs that are flushed irregularly (Sumi et al., 2017). Reservoirs with higher sediment yield need to be flushed more frequently than others. For instance, the Tapu Reservoir in Taiwan is characterized by high sedimentation rates induced by heavy rainfall and steeply sloped mountains and was flushed 10 times between 1991 and 1996 (Chang et al., 2003). The total amount of flushed sediment depends on reservoir geometry, sediment characteristics and operation strategy (Morris, 2020; Petkovšek et al., 2020), and the conditions for a successful flushing operation are typically optimal in smaller reservoirs that are long and narrow (Kondolf et al., 2014).
In this study, we investigated CH4 emissions due to reservoir flushing, a pathway that has not yet been included in estimates of CH4 emissions from reservoirs. We determined the amount of CH4 stored in the sediment pore water of a reservoir in different seasons and estimated potential CH4 emissions resulting from reservoir flushing scenarios. Furthermore, we assessed the relative importance of reservoir flushing in comparison to other typical CH4 emission pathways in reservoirs.
2.1 Study site
Field measurements were conducted in Schwarzenbach Reservoir, which is located in the northern part of the Black Forest in southwest Germany ( N, E) at ∼660 m above sea level (m a.s.l.). The reservoir is operated as a pumped-storage hydroelectric energy system. At a maximum storage capacity of 14.4×10⁶ m3, the reservoir is 47 m deep and covers a surface area of ∼0.66 km2. The reservoir's alkalinity and salinity are typically on the order of 0.3 mmoleq L−1 and 0.04 g kg−1, respectively. The reservoir receives input from two natural creeks (Schwarzenbach and Seebach) located at the western end of the basin and from an artificial channel in the south (Raumünzachstollen) that collects water from the immediate catchment area (Fig. 1a). Due to a sediment trap located upstream of the artificial channel, the Seebach and Schwarzenbach are the only sources for sediment transport into the reservoir. For the pumped-storage operation, an inlet and outlet are based near the dam at ∼5 m above ground. The contributions of the individual inputs are described in Mouris et al. (2018). Since the dam was completed in 1926, the reservoir has been completely emptied on three occasions, in 1935, 1952 and 1997.
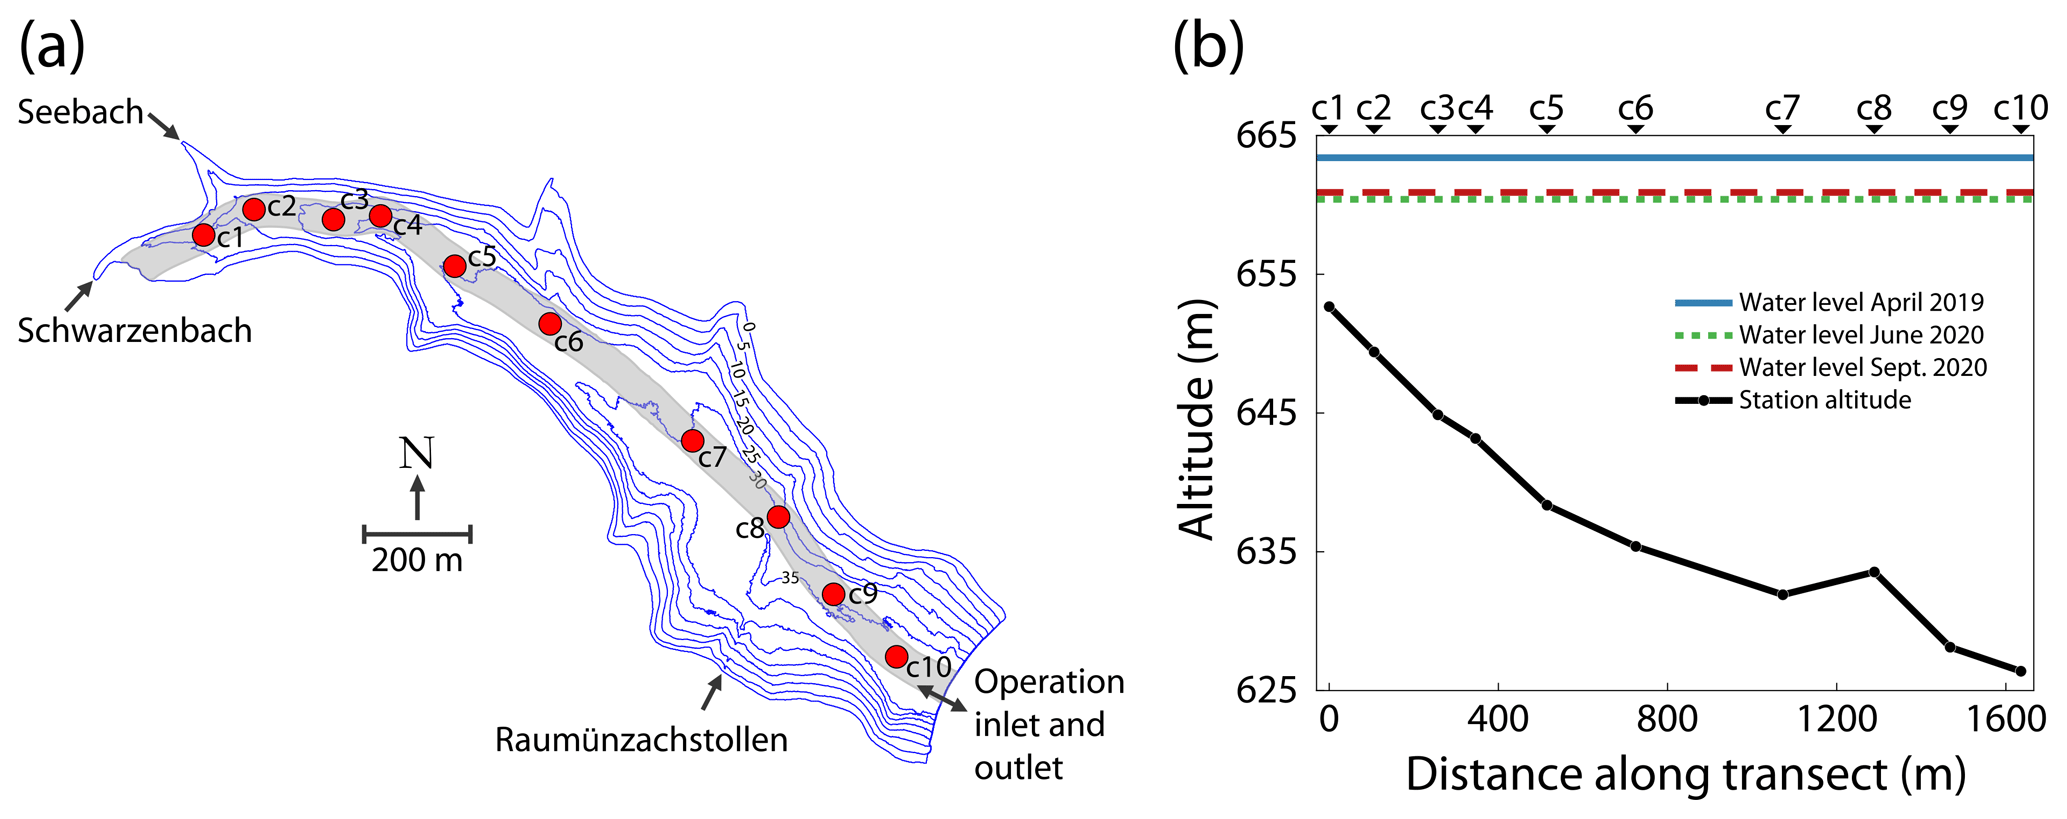
Figure 1(a) Bathymetric map of Schwarzenbach Reservoir showing in- and outflows and the position of the sampling stations (c1–c10). The grey-shaded area symbolizes the estimated basin-wide erosion channel with a 60 m width. (b) Sediment altitude at the sampling stations and water level during the three field campaigns (April 2019, June 2020 and September 2020). The individual sampling stations are indicated above the panel.
2.2 Field measurements
Three field campaigns (April 2019, June 2020 and September 2020) were conducted at Schwarzenbach Reservoir, during which a total of 47 sediment cores were retrieved, i.e., 13 in April 2019 and 17 in each of the campaigns in June and September. The sediment cores were sampled along the transect close to the thalweg (Fig. 1a). At each sampling station, two sediment cores were retrieved, except for station c5 in April 2019 and June 2020 and station c3 in September 2020, when only one sediment core was retrieved each time. The transect length was ∼1.6 km, and the altitude of the sediment cores ranged between 626.4 and 652.7 m (Fig. 1b). In April 2019, the reservoir's water level was around 3 m higher than in June and September 2020. In April 2019, sediment cores were taken at stations c1, c2, c4, c5, c6, c7 and c9 and in June and September 2020 at stations c1, c2, c3, c5, c6, c7, c8, c9 and c10. Vertical temperature and dissolved oxygen (DO) profiles were measured in the water column at the respective stations with a multiparameter probe (conductivity–temperature–depth (CTD) probe, RBR Ltd., Ottawa, Canada, equipped with an RBRcoda3 T.ODO fast temperature and oxygen optode). The temperature of the water overlaying the sediment (∼0.5 m above the sediment surface) served as a proxy for the sediment temperature. Water samples for CH4 analysis were taken using a 2 L water sampler (Limnos, Finland).
2.3 Measurements of CH4 concentrations
Sediment cores were taken with a gravity corer equipped with a PVC liner of 600 mm length and an inner diameter of 58 mm. The liner was capped using a rubber stopper or a liner cap. Within 1–3 h of sampling, the sediment cores were processed at the nearest shore. Sediment subsamples were taken through 0.6 cm pre-drilled holes (1 cm vertical spacing) in the PVC liner using 1 mL cutoff syringes at sediment depths of 0.25, 1.25, 2.25, 3.25, 4.25, 5.25, 7.25, 10.25 and 15.25 cm. Each sediment subsample was immediately inserted into a 100 mL glass bottle (DWK Life Sciences GmbH, Germany). The glass bottles were filled completely with demineralized water and closed using a PTFE-coated silicone septum (DWK Life Sciences GmbH, Germany). The bottle was shaken vigorously, enabling the pore water to dissolve into the water. The procedure to measure the CH4 concentration in the water was adapted from Hofmann et al. (2010). Briefly, 50 mL of liquid was sampled with a 50 mL syringe after sediment settling and injected into a 100 mL glass injection vial (DWK Life Sciences GmbH, Germany) containing 20–30 g of NaCl (≥99.5 %, p.a., ACS, ISO, Carl Roth GmbH, Germany) and 30–40 mL of demineralized water. After sample injection, the CH4 degassed into the headspace (∼35 mL) due to the oversaturated NaCl solution. The bottles were stored upside down until further processing to prevent CH4 loss over time through the septum. The CH4 concentration in the equilibrated headspace of the injection vial was measured using a gas chromatograph equipped with a flame ionization detector (GC 6000, Carlo Erba Instruments, UK). The CH4 concentration in the water sample was obtained by referring the measured CH4 concentration in the headspace to the volume of the respective water sample. With the concentration of CH4 in the water sample , the volume of the glass bottle Vgb, the volume of the sediment sample Vss, the volume of the pore water Vpw and the porosity ϕ, the concentration of CH4 per sediment volume and the concentration of CH4 in the pore water were calculated as
The porosity of the sediment describes the ratio of void volume that is occupied by the pore water to the total volume (Brimhall and Dietrich, 1987) and was calculated for each sediment subsample accordingly:
However, because the difference between Vss and Vpw was small, the uncertainty in the volume ratios determined from weight measurements was rather large for individual sediment samples from specific depths and locations. Therefore, we determined the average vertical profile of porosity in the sediment by fitting a cubic function of depth to all porosity profiles from all sampling campaigns (Fig. S1 in the Supplement). The porosities of this average porosity profile were used to calculate the pore water concentrations . Vertical profiles of were obtained by measuring at sediment depths between 0.25 and 15.25 cm. Missing data were estimated by bilinear interpolation of the CH4 distribution. Missing values at boundaries were estimated by extrapolation, assuming constant concentrations below the depth of the deepest available measurement. Interpolated and extrapolated values constituted ∼10 % of all data points.
2.4 Diffusive CH4 flux from the sediment into the water column
Assuming molecular diffusion within the sediment and using Fick's first law of diffusion accounting for the porosity and the tortuosity of the sediment, the vertical flux of CH4 in the sediment is given by Berner (1980):
where is the molecular diffusivity of CH4 in water (m2 d−1), ϕ is the porosity (–), θ is the tortuosity (–) and is the vertical gradient of the CH4 pore water concentration (mmol m−3). The diffusive flux of CH4 at the sediment–water interface, Fsed (), was assumed to correspond to the diffusive flux of CH4 in the uppermost part of the sediment (see also Berner, 1980) and was determined using the gradient of the CH4 pore water concentration obtained by linear regression of the values from 0.25, 1.25 and 2.25 cm depth in the respective sediment core. was calculated from the Schmidt number of CH4 (Wanninkhof, 1992) and the viscosity of the water (Weast, 1988), taking temperature and salinity into account. We assumed the sediment's temperature and salinity were the same as in the water overlaying the sediment. As porosity, we used the median of the porosity measurements in the upper 2.25 cm of all sediment cores (ϕ=0.97). The tortuosity was determined using the porosity according to Boudreau (1997):
2.5 Stored CH4 in the potentially eroded sediment volume due to reservoir flushing
For the estimation of the CH4 storage in the sediment, missing values in the measured profiles of were estimated by interpolation and extrapolation using the same procedure as in the case of . Additionally, profiles of were extended to 100 cm sediment depth assuming that below 15 cm sediment depth is constant. Finally, the profiles of were linearly interpolated to obtain a regular 1 cm vertical resolution starting at 0.5 cm sediment depth. From these profiles, the total amount of CH4 stored at different depths within the sediments of Schwarzenbach Reservoir was calculated by lateral and vertical integration.
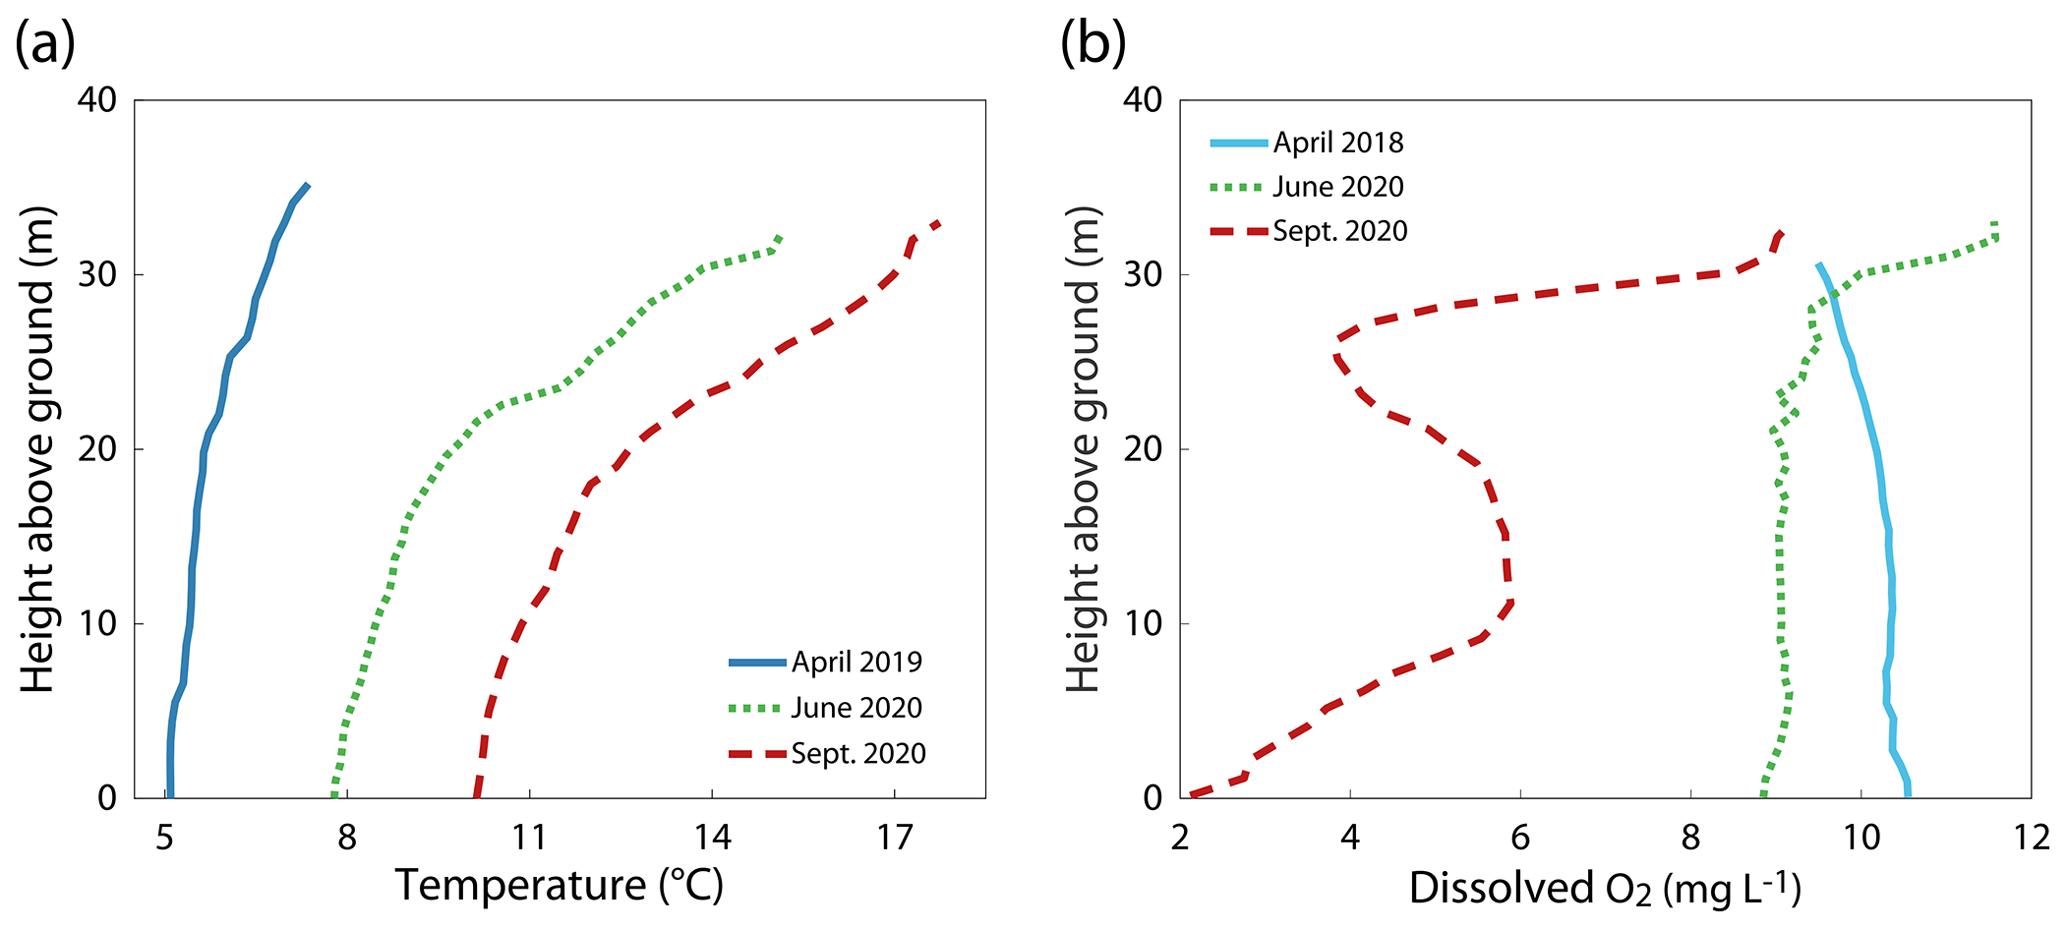
Figure 2Profiles of (a) temperature and (b) dissolved oxygen at station c9 during different seasons in Schwarzenbach Reservoir.
Assumptions about the flushing channel width (60 m) were based on reported values for Dashidaira Reservoir, a reservoir of similar size (storage capacity: 9×10⁶ m3; surface area: 0.35 km2) that has been extensively studied in terms of flushing operations (Kantoush et al., 2010; Esmaeili et al., 2015, 2017). Furthermore, the flushing channel was assumed to extend basin-wide along the thalweg of Schwarzenbach Reservoir (Fig. 1a). The total surface area covered by this channel was about 1.1×10⁵ m2. We assumed that the CH4 profile from a sampling station represents the CH4 concentrations also in the sediment in the proximity of the sampling station. Respective sediment areas were calculated by extending laterally to the half distance of bordering stations. For the outermost stations, sediment areas extended to the respective end of the basin. With all stations representing complementary parts of the total sediment surface area, profiles measured at the different stations and their corresponding sediment areas were used to calculate the amount of CH4 stored per unit depth at different sediment depths across the entire channel, (mmol m−1). The average concentration and the total amount of CH4 in the potentially eroded sediment volume due to reservoir flushing ( (mol m−3) and (mol), respectively) depend on the thickness of the flushed sediment layer. was estimated from the stored methane by integrating vertically down to the depth of sediment erosion during flushing (Ze):
was obtained by dividing by the volume of mobilized sediment.
The relevance of for overall CH4 emissions from Schwarzenbach Reservoir was assessed by comparing the stored in the potentially eroded sediment volume during a flushing event with other pathways of CH4 emission from Schwarzenbach Reservoir (ebullition, diffusive CH4 emissions from the reservoir surface and degassing during turbination) (Peeters et al., 2019; Encinas Fernández et al., 2020).
3.1 Reservoir characterization
Schwarzenbach Reservoir is a pumped-storage system, and reservoir management can substantially change the water level. In April 2019, water levels were about 3 m higher than in June and September 2020 (Fig. 1b). The water column of Schwarzenbach Reservoir was stably stratified during all three campaigns (Fig. 2a). In June and September 2020, DO concentrations were oversaturated near the water surface and above 2 mg L−1 throughout the entire water column (Fig. 2b). In April 2019 the DO sensor failed, but DO concentrations can be expected to be around 10 mg L−1 as is indicated by a DO profile measured in April 2018 (Fig. 2b).
3.2 Spatiotemporal dynamics of CH4 in sediment pore water
The CH4 concentrations in the pore water of the sediment of the reservoir differed spatially and seasonally (Fig. 3). In April 2019 and June 2020, regions with particularly large CH4 concentrations were located in the center of the transect at deep sediment layers, whereas at the same depth within the sediment, CH4 concentrations near the dam and the western end of the basin were considerably lower (Fig. 3a and b). In September 2020, the largest CH4 concentrations were still found in the middle of the transect but were, in general, more evenly distributed across the transect and larger at shallower depth than in June 2020 (Fig. 3c). For each sampling campaign, we determined a median CH4 pore water profile by compiling the medians of all measurements from the same sediment depth into a vertical profile (Fig. 3d). With the progressing season, we observed an increase in median CH4 pore water concentrations and stronger vertical CH4 gradients in the uppermost 5 cm of the sediment. In April 2019, the median CH4 concentration profile was characterized by relatively low concentrations and a weak vertical gradient in the upper sediment layers, followed by an almost linear increase in CH4 concentrations. In contrast, the median CH4 profiles in June and September 2020 both showed stronger gradients in the upper sediment layers with a more saturated curve in deeper layers. However, in September 2020, the overall CH4 concentrations were much larger in all but the deepest sampled sediment layers. The mean and median CH4 concentrations across all measurements were 0.27 and 0.16 mmol L−1 in April 2019, 0.37 and 0.34 mmol L−1 in June 2020, and 0.63 and 0.68 mmol L−1 in September 2020, respectively, indicating an increase in overall CH4 concentration in the pore water with the progressing season.
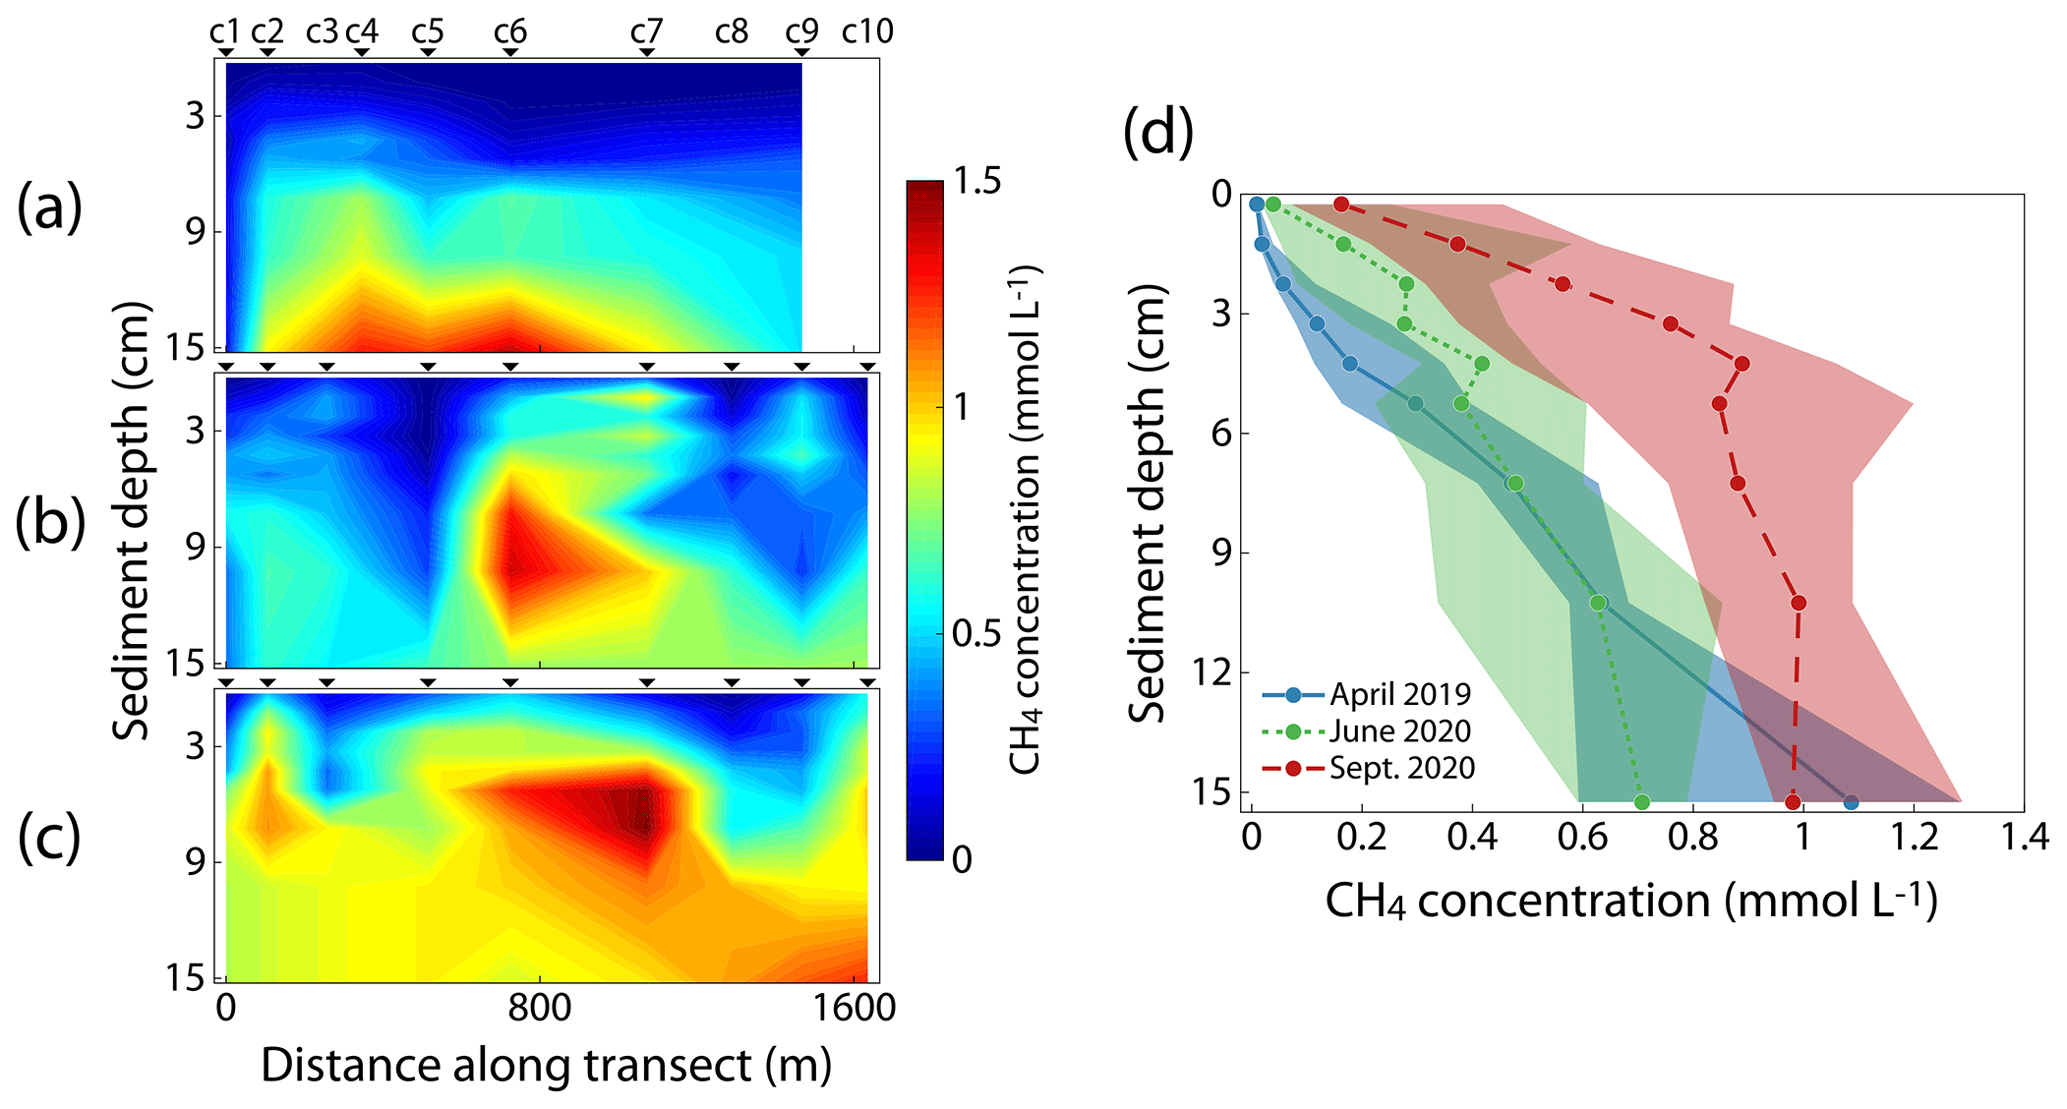
Figure 3(a–c) Spatial distribution of CH4 pore water concentration in the top 15 cm of the sediment along the transect in April 2019 (a), June 2020 (b) and September 2020 (c). The individual sampling stations are indicated above the panels. (d) Median CH4 concentration of all pore water profiles within each campaign. Shaded areas display the 25th and 75th percentiles.
3.3 CH4 storage estimation
To estimate the stored CH4 that is potentially emitted due to sediment erosion during reservoir flushing of Schwarzenbach Reservoir, we calculated , the amount of CH4 stored between the top of the sediment and a hypothetical erosion depth within the 60 m wide erosion channel centered around the thalweg along the basin (Fig. 4; the channel is indicated in Fig. 1a). With the progressing season, was consistently higher at all erosion depths. At an erosion depth of 15 cm, was 6.5, 8.1 and 12.5 kmol CH4 in April 2019, June 2020 and September 2020, respectively.
3.4 CH4 fluxes at the sediment–water interface
Diffusive CH4 fluxes at the sediment–water interface, Fsed, were determined for each campaign at each station along the transect (Fig. 5c). The overall variability in Fsed from all stations measured during a campaign increased with the progressing season from April to September (Fig. 5a). Compared to the range of Fsed values in April 2019, the range of Fsed values was ∼3.5 times larger in June 2020 and ∼4 times larger in September 2020. While the lowest measured Fsed values were very similar across the three campaigns (between 0.02 and 0.06 ), the median and maximum CH4 fluxes increased from April to September. The average CH4 flux over all measurements was 1.02 . Sediment temperatures, approximated by water temperature ∼0.5 m above the sediment, increased with the season (Fig. 5b). In April 2019, the temperatures along the transect were rather uniform, ranging between 5.1 ∘C (c9) and 5.9 ∘C (c1). Temperatures were higher in June 2020, ranging from 7.7 ∘C (c10) to 12.3 ∘C (c1), and in September 2020, ranging between 10.1 ∘C (c9) and 16.0 ∘C (c1). In June and September 2020, temperatures were more elevated in the shallower part of the basin.
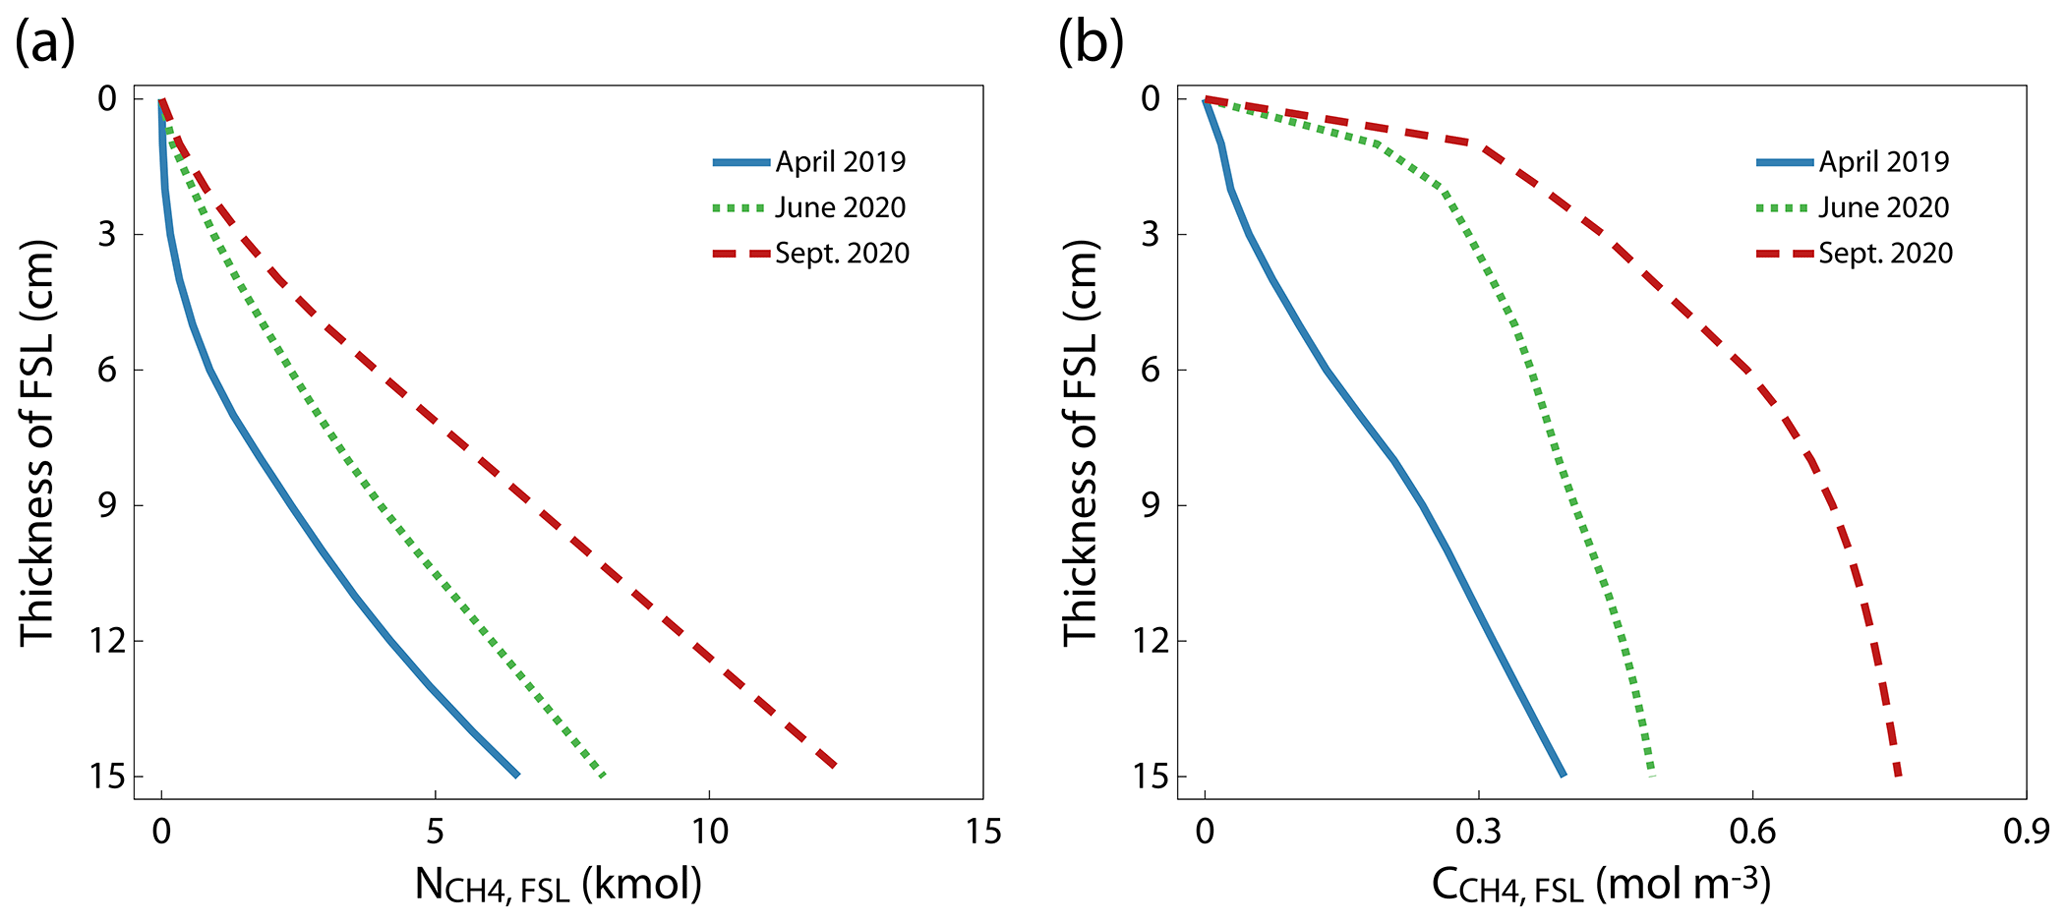
Figure 4(a) Stored amount of CH4 in the flushed sediment layer, , as a function of layer thickness. The thickness of the flushed sediment layer corresponds to the erosion depth of the sediment in the 60 m wide erosion channel. (b) The average CH4 concentration in the flushed sediment layer.
4.1 Seasonal and spatial differences in pore water CH4 concentrations
CH4 pore water concentrations in Schwarzenbach Reservoir ranged between 0.002 and 1.530 mmol L−1, which is comparable to what other studies have found in the sediment of freshwater systems (Schulz and Conrad, 1995; Murase and Sugimoto, 2001; Huttunen et al., 2006; Maeck et al., 2013; Norði et al., 2013; Donis et al., 2017). The CH4 pore water concentrations typically increased with increasing sediment depth (Fig. 3), which is consistent with observations in other studies (Frenzel et al., 1990; Huttunen et al., 2006; Deutzmann et al., 2014). The CH4 pore water concentrations showed seasonal and spatial differences (Fig. 3). The median CH4 concentration in the pore water across all measured profiles in September 2020 (0.68 mmol L−1) was almost 2 times larger than in June 2020 (0.37 mmol L−1) and about 4 times larger than in April 2019 (0.16 mmol L−1) (Fig. 3b). The increase in pore water concentration with the season may be explained by differences in CH4 production within the sediment. Many studies have demonstrated that CH4 production rates in sediments are enhanced at higher temperatures relative to CH4 oxidation rates (Schulz et al., 1997; Lofton et al., 2014; Marotta et al., 2014; Sepulveda-Jauregui et al., 2018), although, in some systems, CH4 oxidation rates may keep up with CH4 production rates (Shelley et al., 2015). In Schwarzenbach Reservoir, sediment temperatures increased as the season progressed (Fig. 5b), supporting the hypothesis that higher production was responsible for larger pore water CH4 concentrations later in the season. Enhanced CH4 concentrations were present, especially in deeper sediment layers, which are more strongly affected by changes in production and less affected by CH4 losses due to oxidation and vertical transport compared to the upper sediment layers. However, the spatial distributions of pore water CH4 along the transect during the different campaigns cannot be explained by temperature alone. Sediment temperatures were elevated in the shallow water zone in June and September 2020, but CH4 concentrations were generally largest near the center of the transect and lowest towards the western and eastern end of the basin (Fig. 3a). Availability of organic matter in the sediment is another factor that correlates with CH4 production (Duc et al., 2010) or CH4 concentrations (Murase and Sugimoto, 2001) in lake sediments and is considered a major limiting factor for CH4 production (Segers, 1998). Settling of organic matter is known to correlate with the current velocity of the inflows (Kufel, 1991). Fewer organic particles might be deposited close to the inflows than in the open water because the water current velocity is likely to be smaller in the open water of the central basin than near the inflows.
4.2 Significance of the potentially released amount of CH4 due to reservoir flushing
Assuming that the CH4 stored in the sediment is completely released into the water during the sediment flushing process and degasses quickly to the atmosphere when the water is rapidly transported out of the reservoir, provides a measure of the potential CH4 emission from the reservoir due to flushing. The amount of CH4 mobilized during a flushing operation depends on the depth of sediment erosion and on the season (Fig. 4a). Flushing operation eroding a 15 cm thick sediment layer in the assumed 60 m wide flushing channel along the thalweg of Schwarzenbach Reservoir implies a flushed sediment volume of 16.5×10³ m3, which agrees well with the study by Saam et al. (2019), who assessed the feasibility of flushing in Schwarzenbach Reservoir and obtained a flushed sediment volume of 13.6×10³ m3 in a simulation of a full-drawdown flushing scenario. At an erosion depth of 15 cm, the resulting values are 6.5, 8.1 and 12.5 kmol CH4 if the flushing operation is conducted in April, June and September, respectively. This suggests that conducting a reservoir flushing operation in spring rather than in late summer would reduce flushing-induced CH4 emissions in Schwarzenbach Reservoir by a factor of 2.
Typical CH4 emission pathways in Schwarzenbach Reservoir include CH4 emissions due to ebullition (212 mol d−1 during normal operation mode), diffusive CH4 emissions (27 mol d−1) and CH4 emissions due to degassing during turbination (14 mol d−1) (Peeters et al., 2019; Encinas Fernández et al., 2020). Together, CH4 emissions by these pathways add up to 253 mol d−1 or 92.4 kmol yr−1. Hence, one flushing operation with 15 cm erosion depth potentially causes CH4 emissions that would account for 7 % (flushing in April) to 14 % (flushing in September) of the typical annual CH4 emission in Schwarzenbach Reservoir.
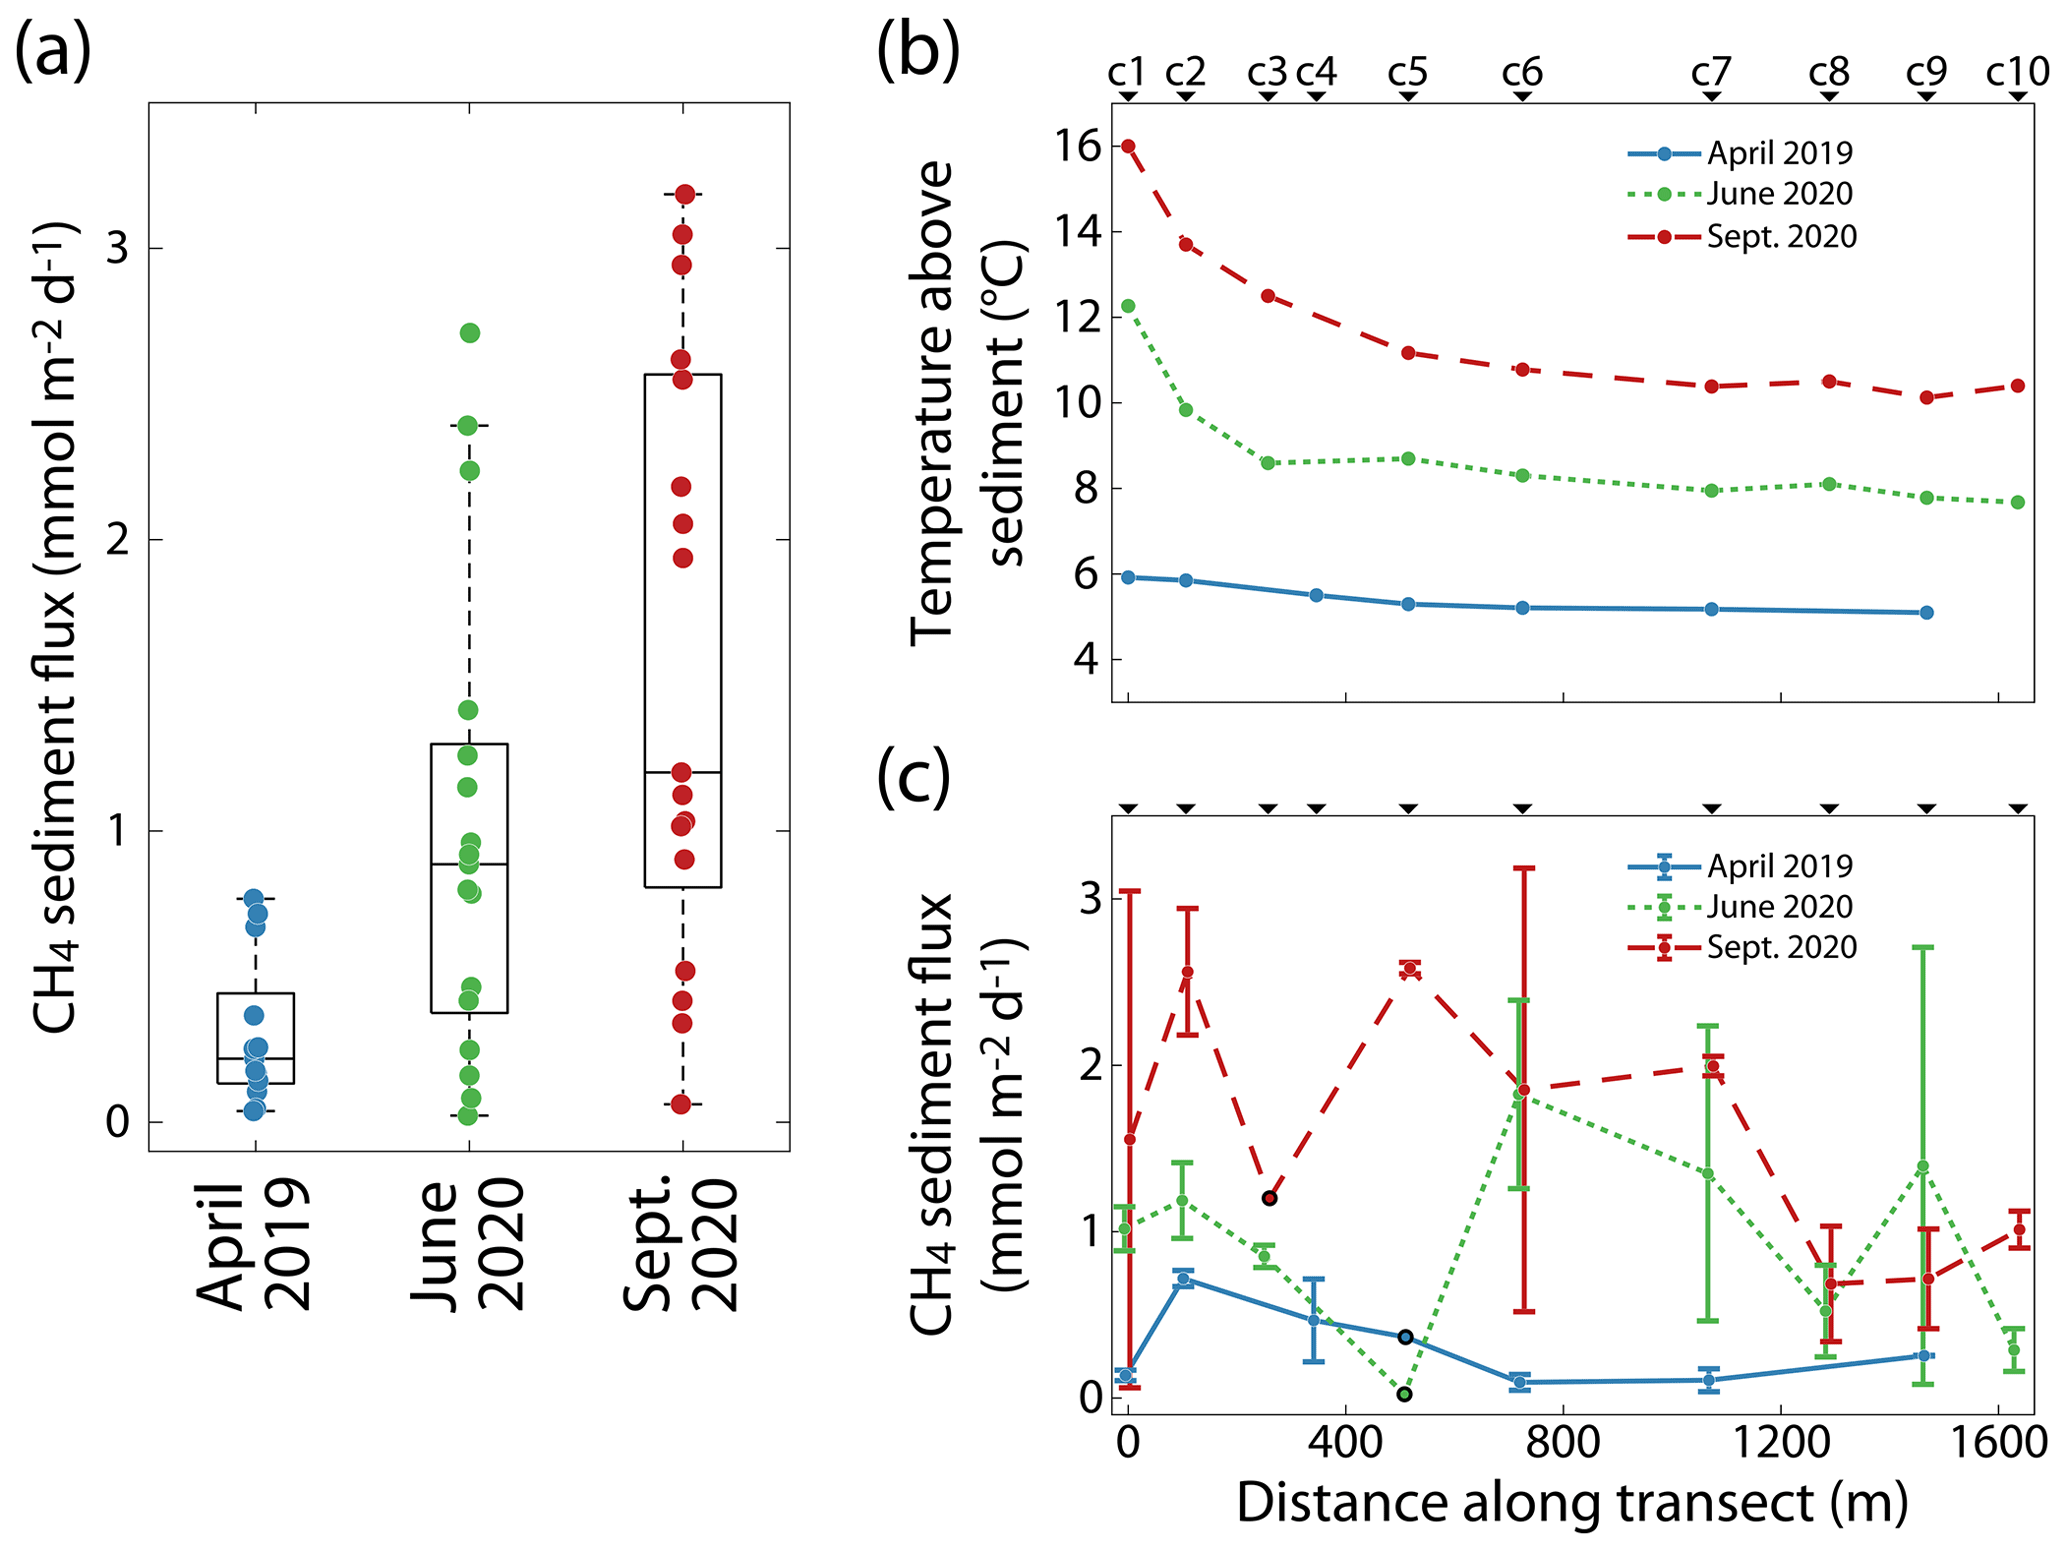
Figure 5(a) Diffusive CH4 flux at the sediment–water interface of each campaign. The middle lines of the boxes represent the medians; the boxes demarcate the 25th and 75th percentiles; and the whiskers extend to the most extreme data points, not considering outliers. (b) Water temperature 0.5 m above the sediment and (c) the mean diffusive CH4 flux at each station of the transect with either one sediment core (indicated by black outline) or two sediment cores per station at each campaign (error bars represent the range of values). The individual sampling stations are indicated above the panels.
Not only the total amount of CH4 but also the average CH4 concentration in the flushed sediment increase with increasing erosion depth (Fig. 4b). This implies that overall less CH4 is released if an equivalent sediment volume is eroded by several flushings that mobilize thin layers of sediment instead of a few flushings that mobilize thicker sediment layers. For instance, if flushing in April mobilizes the top 5, 10 or 100 cm of sediment, is 0.10, 0.27 and 0.74 mmol L−1, respectively (Figs. 4b and S2 in the Supplement). Hence, the potential release of CH4 during one flushing event of a 100 cm thick sediment layer is about 2.7 or 7.5 times larger than 10 flushing events of 10 cm and 20 flushing events of 5 cm thick sediment layers, respectively. Below ∼50 cm of sediment, is essentially constant (Fig. S2). Thus, in flushing events that erode more than 50 cm of sediment increases essentially linearly with the volume of sediment eroded.
Note that Schwarzenbach Reservoir has been emptied only three times since its completion. However, many reservoirs worldwide are flushed regularly, such as Dashidaira Reservoir in Japan, a reservoir of similar size, where a flushing operation with full water level drawdown is conducted annually (Esmaeili et al., 2017; Sumi et al., 2017). In this reservoir, flushed sediment volumes of between 60×103 and 590×103 m3 with an average flushed sediment volume of 287×103 m3 have been reported (Sumi et al., 2009; Esmaeili et al., 2017). Therefore, the average flushed sediment volume in Dashidaira Reservoir is 17–21 times larger than the estimated flushed sediment volumes in the study of Saam et al. (2019) and in this study.
Unfortunately, no data are available on CH4 concentration in the sediment or CH4 emissions of Dashidaira Reservoir. However, assuming that CH4 concentrations in the sediment of Dashidaira Reservoir are comparable to those in Schwarzenbach Reservoir and that the erosion depth is 100 cm or more, the average concentration in the flushed sediment can be approximated by a of 0.73 mol m−3, which is the average CH4 concentration (seasonal average) in a 100 cm thick flushed sediment layer in Schwarzenbach Reservoir (Fig. S2). Therefore, the average flushed sediment volume in Dashidaira Reservoir of 287×103 m3 would contain 210 kmol CH4. Because the reservoir is flushed each year, the potential emissions from this reservoir due to flushing would be 210 kmol yr−1 or, with consideration of the reservoir's surface area, 0.6 , i.e., 2.3 or 4.3 times larger, respectively, than the typical annual emissions from Schwarzenbach Reservoir. Hence, CH4 emissions due to reservoir flushing operations can contribute substantially to overall CH4 emissions from reservoirs.
CH4 emissions due to reservoir flushing can represent a significant contributing pathway to overall CH4 emissions from reservoirs only if CH4 production in the sediment can replenish the amount of CH4 in the flushed sediment volumes between flushing operations. In Schwarzenbach Reservoir, the measured CH4 flux at the sediment–water interface was 1.02 (average over all measurements). Typically, 60 %–90 % of CH4 produced in the sediment is oxidized (Le Mer and Roger, 2001). Compensating for the flux from the sediment and the loss due to oxidation of the produced CH4 requires a CH4 production rate per unit sediment surface of 2.6–10.2 . Considering a 100 cm thick layer of sediment, this implies a CH4 production rate of 2.6–10.2 . This estimated production rate is compatible with the median production rate of 10 obtained from direct measurements of production rates in sediments of lakes (the median of a data compilation of 93 samples of different lake sediments; Martinez-Cruz et al., 2018). At a CH4 production rate of 2.6–10.2 , the time required to produce the average CH4 concentration in the flushed sediment of mol m−3 is 73–291 d. This estimation suggests that CH4 production in the sediments provides sufficient CH4 in the flushed sediment layers between annual flushing operations.
The CH4 emissions associated with a flushing event may be smaller than the above-estimated potential CH4 emissions because some of the mobilized CH4 may be oxidized in the water before reaching the atmosphere. Most of the CH4 is mobilized during the free-flow state of drawdown flushing, which is typically maintained for several hours, depending on the desired amount of flushed sediment (Kondolf et al., 2014). The residence time of the CH4 after mobilization until spill-out at the dam may be in the range of a few hours; thus, the potential for oxidation of the mobilized CH4 is rather limited.
4.3 Additional indirect CH4 emissions due to reservoir flushing
In addition to CH4 emissions driven by sediment erosion, the water level drawdown that is necessary during reservoir flushing operations may also lead to enhanced CH4 emissions. During a drawdown flushing operation, the water is released through one or more outlets and the water level is decreased dramatically, resulting in additional CH4 emissions, as the CH4 stored in the released water can degas during turbination and downstream of the reservoir. Furthermore, as water level fluctuations in reservoirs can enhance CH4 ebullition due to changing hydrostatic pressure (Harrison et al., 2017; Encinas Fernández et al., 2020), lowering the water level during the drawdown period would cause an additional CH4 ebullition flux. If the ebullition originates from the sediment that is mobilized during flushing, the total CH4 emissions during the entire operation do not differ substantially from the above estimates of CH4 release during sediment erosion. However, CH4 ebullition may originate from sediment layers deeper than the eroded sediment. As a result, total CH4 emissions might be larger than the CH4 emissions estimated by sediment erosion alone. The relative contribution of each pathway to the overall CH4 emissions due to reservoir flushing may be an area for future studies. Lastly, throughout a flushing operation, large sediment areas may fall dry and become inundated again. Drying and rewetting of sediments are known to affect CH4 emissions from these sediments and are an important area for more research (Yang et al., 2012; Kosten et al., 2018).
Assessing the significance of CH4 emissions due to reservoir flushing in comparison to other pathways requires consideration of the flushing frequency, the flushed sediment volume, the erosion depth during the flushing event, and the vertical and lateral distribution of CH4 concentrations in the sediment. In Schwarzenbach Reservoir, we estimated that one flushing operation could potentially cause CH4 emissions that are comparable to 7 %–14 % of the reservoir's typical annual emissions. Seasonal differences in CH4 concentrations in the sediment suggest that the timing of the flushing operation during the season affects the amount of CH4 emitted. Because the CH4 concentration increases with depth in the sediment, removal of the same sediment volume by regular flushing of shallow sediment layers might cause fewer CH4 emissions than few flushings of thicker sediment layers. However, additional indirect CH4 emissions may vary with the flushing operation and affect the total CH4 emissions due to reservoir flushing. In Schwarzenbach Reservoir, flushing is not conducted regularly. Nevertheless, there are many reservoirs where flushing operations mobilize much larger volumes of sediment and are conducted more regularly than in Schwarzenbach Reservoir. In these reservoirs, CH4 emission due to reservoir flushing is likely substantial, and thus their overall CH4 emission will be underestimated if this pathway is ignored. Our findings highlight CH4 emissions due to reservoir flushing as an important area for future research and emphasize the need for field studies during reservoir flushing operations to better understand underlying processes.
Data used in this work are available upon request.
The supplement related to this article is available online at: https://doi.org/10.5194/bg-20-4057-2023-supplement.
OL: conceptualization, formal analysis, investigation, project administration, software, visualization and writing (original draft; review and editing). JEF: investigation, project administration and writing (review and editing). KMC: resources and writing (review and editing). FP: conceptualization, formal analysis, funding acquisition, project administration, resources, software, supervision and writing (review and editing).
The contact author has declared that none of the authors has any competing interests.
Publisher's note: Copernicus Publications remains neutral with regard to jurisdictional claims in published maps and institutional affiliations.
We thank Enzo Gronchi, Ramona Ragg, Raymund Hackett, Louis Lauber and Beatrix Rosenberg for technical assistance in the field, and we are grateful to the members of our group for valuable feedback in the early stage of developing the article. We also would like to thank the reviewers for insightful comments that significantly improved the quality of this article.
This work was financially supported by the Ministry of Science, Research and the Arts of the federal state of Baden-Württemberg, Germany (grant for Water Research Network project: Challenges of Reservoir Management – Meeting Environmental and Social Requirements).
This paper was edited by Tyler Cyronak and reviewed by Bridget Deemer and one anonymous referee.
Almeida, R. M., Hamilton, S. K., Rosi, E. J., Barros, N., Doria, C. R. C., Flecker, A. S., Fleischmann, A. S., Reisinger, A. J., and Roland, F.: Hydropeaking Operations of Two Run-of-River Mega-Dams Alter Downstream Hydrology of the Largest Amazon Tributary, Front. Environ. Sci., 8, 120, https://doi.org/10.3389/fenvs.2020.00120, 2020.
Antoine, G., Camenen, B., Jodeau, M., Némery, J., and Esteves, M.: Downstream erosion and deposition dynamics of fine suspended sediments due to dam flushing, J. Hydrol., 585, 124763, https://doi.org/10.1016/j.jhydrol.2020.124763, 2020.
Bastviken, D., Ejlertsson, J., and Tranvik, L.: Measurement of methane oxidation in lakes: A comparison of methods, Environ. Sci. Technol., 36, 3354–3361, https://doi.org/10.1021/es010311p, 2002.
Bastviken, D., Cole, J., Pace, M., and Tranvik, L.: Methane emissions from lakes: Dependence of lake characteristics, two regional assessments, and a global estimate, Global Biogeochem. Cy., 18, 1–12, https://doi.org/10.1029/2004GB002238, 2004.
Bastviken, D., Tranvik, L. J., Downing, J. A., Crill, P. M., and Enrich-Prast, A.: Freshwater Methane Emissions Offset the Continental Carbon Sink, Science, 331, 50, https://doi.org/10.1126/science.1196808, 2011.
Berner, R. A.: Early Diagenesis: a Theoretical Approach, Princeton Univ. Press, Princeton, N. J., ISBN 9780691082608, 1980.
Boudreau, B. P.: Diagenetic Models and Their Implementation: Modelling Transport and Reactions in Aquatic Sediments, 1st edn., Springer, Heidelberg, 436 pp., ISBN 9783642643996, 1997.
Brandt, S. A. and Swenning, J.: Sedimentological and geomorphological effects of reservoir flushing: the cachí reservoir, Costa Rica, 1996, Geogr. Ann. A, 81, 391–407, https://doi.org/10.1111/j.0435-3676.1999.00069.x, 1999.
Brimhall, G. H. and Dietrich, W. E.: Constitutive mass balance relations between chemical composition, volume, density, porosity, and strain in metasomatic hydrochemical systems: Results on weathering and pedogenesis, Geochim. Cosmochim. Ac., 51, 567–587, https://doi.org/10.1016/0016-7037(87)90070-6, 1987.
Chang, F., Lai, J., and Kao, L.: Optimization of operation rule curves and flushing schedule in a reservoir, Hydrol. Process., 17, 1623–1640, https://doi.org/10.1002/hyp.1204, 2003.
Chanton, J. P. and Whiting, G. J.: Trace gas exchange in freshwater and coastal marine environments: ebullition and transport by plants, Biog. trace gases Meas. Emiss. from soil water, Blackwell Publishing, 98–125, ISBN 9780632036417, 1995.
Couto, T. B. A. and Olden, J. D.: Global proliferation of small hydropower plants – science and policy, Front. Ecol. Environ., 16, 91–100, https://doi.org/10.1002/fee.1746, 2018.
DelSontro, T., McGinnis, D. F., Sobek, S., Ostrovsky, I., and Wehrli, B.: Extreme methane emissions from a Swiss hydropower reservoir: contribution from bubbling sediments, Environ. Sci. Technol., 44, 2419–2425, https://doi.org/10.1021/es9031369, 2010.
Deutzmann, J. S., Stief, P., Brandes, J., and Schink, B.: Anaerobic methane oxidation coupled to denitrification is the dominant methane sink in a deep lake, P. Natl. Acad. Sci. USA, 111, 18273–18278, https://doi.org/10.1073/pnas.1411617111, 2014.
Donis, D., Flury, S., Stöckli, A., Spangenberg, J. E., Vachon, D., and McGinnis, D. F.: Full-scale evaluation of methane production under oxic conditions in a mesotrophic lake, Nat. Commun., 8, 1–11, https://doi.org/10.1038/s41467-017-01648-4, 2017.
Duc, N. T., Crill, P., and Bastviken, D.: Implications of temperature and sediment characteristics on methane formation and oxidation in lake sediments, Biogeochemistry, 100, 185–196, https://doi.org/10.1007/s10533-010-9415-8, 2010.
Encinas Fernández, J., Peeters, F., and Hofmann, H.: Importance of the Autumn Overturn and Anoxic Conditions in the Hypolimnion for the Annual Methane Emissions from a Temperate Lake, Environ. Sci. Technol., 48, 7297–7304, https://doi.org/10.1021/es4056164, 2014.
Encinas Fernández, J., Hofmann, H., and Peeters, F.: Diurnal pumped-storage operation minimizes methane ebullition fluxes from hydropower reservoirs, Water Resour. Res., 56, e2020WR027221, https://doi.org/10.1029/2020WR027221, 2020.
Esmaeili, T., Sumi, T., Kantoush, S. A., Kubota, Y., and Haun, S.: Numerical study on flushing channel evolution, case study of Dashidaira reservoir, Kurobe river, J. Jpn. Soc. Civ. Eng. Ser. B1, 71, I_115–I_120, https://doi.org/10.2208/jscejhe.71.I_115, 2015.
Esmaeili, T., Sumi, T., Kantoush, S. A., Kubota, Y., Haun, S., and Rüther, N.: Three-dimensional numerical study of free-flow sediment flushing to increase the flushing efficiency: a case-study reservoir in Japan, Water, 9, 900, https://doi.org/10.3390/w9110900, 2017.
Frenzel, P., Thebrath, B., and Conrad, R.: Oxidation of methane in the oxic surface layer of a deep lake sediment (Lake Constance), FEMS Microbiol. Lett., 73, 149–158, https://doi.org/10.1016/0378-1097(90)90661-9, 1990.
Fruchard, F. and Camenen, B.: Reservoir sedimentation: different type of flushing-friendly flushing example of genissiat dam flushing, in: ICOLD International Symposium on Dams for a changing world, Kyoto, Japan, 5 June 2012, 6 pp., hal-00761305, 2012.
Grimardias, D., Guillard, J., and Cattanéo, F.: Drawdown flushing of a hydroelectric reservoir on the Rhône River: Impacts on the fish community and implications for the sediment management, J. Environ. Manage., 197, 239–249, https://doi.org/10.1016/j.jenvman.2017.03.096, 2017.
Harrison, J. A., Deemer, B. R., Birchfield, M. K., and O'Malley, M. T.: Reservoir Water-Level Drawdowns Accelerate and Amplify Methane Emission, Environ. Sci. Technol., 51, 1267–1277, https://doi.org/10.1021/acs.est.6b03185, 2017.
Harrison, J. A., Prairie, Y. T., Mercier-Blais, S., and Soued, C.: Year-2020 Global Distribution and Pathways of Reservoir Methane and Carbon Dioxide Emissions According to the Greenhouse Gas From Reservoirs (G-res) Model, Global Biogeochem. Cy., 35, e2020GB006888, https://doi.org/10.1029/2020GB006888, 2021.
Hoffert, M. I., Caldeira, K., Jain, A. K., Haites, E. F., Harvey, L. D. D., Potter, S. D., Schlesinger, M. E., Schneider, S. H., Watts, R. G., Wigley, T. M. L., and Wuebbles, D. J.: Energy implications of future stabilization of atmospheric CO2 content, Nature, 395, 881–884, https://doi.org/10.1038/27638, 1998.
Hofmann, H., Federwisch, L., and Peeters, F.: Wave-induced release of methane: Littoral zones as a source of methane in lakes, Limnol. Oceanogr., 55, 1990–2000, https://doi.org/10.4319/lo.2010.55.5.1990, 2010.
Huttunen, J. T., Väisänen, T. S., Hellsten, S. K., and Martikainen, P. J.: Methane fluxes at the sediment-water interface in some boreal lakes and reservoirs, Boreal Environ. Res., 11, 27–34, 2006.
International Commission On Large Dams (ICOLD): Sedimentation and sustainable use of reservoir and river systems, Draft ICOLD Bull. Sediment. Comm., Paris, 2009.
Kantoush, S., Sumi, T., Suzuki, T., and Murasaki, M.: Impacts of sediment flushing on channel evolution and morphological processes: Case study of the Kurobe River, Japan, in: River Flow 2010: Proceedings of 5th International Conference on Fluvial Hydraulics, ISBN 3939230006, Braunschweig, 1165–1176, 2010
Kantoush, S. A. and Sumi, T.: River morphology and sediment management strategies for sustainable reservoir in Japan and European Alps, Disaster Prevention Research Institute Annuals, Kyoto Univ., 53, 821–839, 2010.
Kemenes, A., Forsberg, B. R., and Melack, J. M.: Methane release below a tropical hydroelectric dam, Geophys. Res. Lett., 34, L12809, https://doi.org/10.1029/2007GL029479, 2007.
Kondolf, G. M., Gao, Y., Annandale, G. W., Morris, G. L., Jiang, E., Zhang, J., Cao, Y., Carling, P., Fu, K., Guo, Q., Hotchkiss, R., Peteuil, C., Sumi, T., Wang, H.-W., Wang, Z., Wei, Z., Wu, B., Wu, C., and Yang, C. T.: Sustainable sediment management in reservoirs and regulated rivers: Experiences from five continents, Earths Future, 2, 256–280, https://doi.org/10.1002/2013EF000184, 2014.
Kosten, S., van den Berg, S., Mendonça, R., Paranaíba, J. R., Roland, F., Sobek, S., Van Den Hoek, J., and Barros, N.: Extreme drought boosts CO2 and CH4 emissions from reservoir drawdown areas, Inland Waters, 8, 329–340, https://doi.org/10.1080/20442041.2018.1483126, 2018.
Kufel, L.: Nutrient sedimentation at the river inflow to a lake, SIL Proceedings, 1922–2010, 24, 1772–1774, https://doi.org/10.1080/03680770.1989.11899069, 1991.
Lauerwald, R., Allen, G. H., Deemer, B. R., Liu, S., Maavara, T., Raymond, P., Alcott, L., Bastviken, D., Hastie, A., Holgerson, M. A., Johnson, M. S., Lehner, B., Lin, P., Marzadri, A., Ran, L., Tian, H., Yang, X., Yao, Y., and Regnier, P.: Inland Water Greenhouse Gas Budgets for RECCAP2: 1. State-Of-The-Art of Global Scale Assessments, Global Biogeochem. Cy., 37, e2022GB007657, https://doi.org/10.1029/2022GB007657, 2023.
Le Mer, J. and Roger, P.: Production, oxidation, emission and consumption of methane by soils: a review, Eur. J. Soil Biol., 37, 25–50, https://doi.org/10.1016/S1164-5563(01)01067-6, 2001.
Lehner, B., Liermann, C. R., Revenga, C., Vörösmarty, C., Fekete, B., Crouzet, P., Döll, P., Endejan, M., Frenken, K., Magome, J., Nilsson, C., Robertson, J. C., Rödel, R., Sindorf, N., and Wisser, D.: High-resolution mapping of the world's reservoirs and dams for sustainable river-flow management, Front. Ecol. Environ., 9, 494–502, https://doi.org/10.1890/100125, 2011.
Lofton, D. D., Whalen, S. C., and Hershey, A. E.: Effect of temperature on methane dynamics and evaluation of methane oxidation kinetics in shallow Arctic Alaskan lakes, Hydrobiologia, 721, 209–222, https://doi.org/10.1007/s10750-013-1663-x, 2014.
Maeck, A., Delsontro, T., McGinnis, D. F., Fischer, H., Flury, S., Schmidt, M., Fietzek, P., and Lorke, A.: Sediment trapping by dams creates methane emission hot spots, Environ. Sci. Technol., 47, 8130–8137, https://doi.org/10.1021/es4003907, 2013.
Maeck, A., Hofmann, H., and Lorke, A.: Pumping methane out of aquatic sediments – ebullition forcing mechanisms in an impounded river, Biogeosciences, 11, 2925–2938, https://doi.org/10.5194/bg-11-2925-2014, 2014.
Marotta, H., Pinho, L., Gudasz, C., Bastviken, D., Tranvik, L. J., and Enrich-Prast, A.: Greenhouse gas production in low-latitude lake sediments responds strongly to warming, Nat. Clim. Change, 4, 467–470, https://doi.org/10.1038/nclimate2222, 2014.
Martinez-Cruz, K., Sepulveda-Jauregui, A., Casper, P., Anthony, K. W., Smemo, K. A., and Thalasso, F.: Ubiquitous and significant anaerobic oxidation of methane in freshwater lake sediments, Water Res., 144, 332–340, https://doi.org/10.1016/j.watres.2018.07.053, 2018.
Morris, G. L.: Classification of management alternatives to combat reservoir sedimentation, Water, 12, 861, https://doi.org/10.3390/w12030861, 2020.
Mouris, K., Beckers, F., and Haun, S.: Three-dimensional numerical modeling of hydraulics and morphodynamics of the Schwarzenbach reservoir, E3S Web Conf., 40, 03005, https://doi.org/10.1051/e3sconf/20184003005, 2018.
Murase, J. and Sugimoto, A.: Spatial distribution of methane in the Lake Biwa sediments and its carbon isotopic compositions, Geochem. J., 35, 257–263, https://doi.org/10.2343/geochemj.35.257, 2001.
Norði, K. à., Thamdrup, B., and Schubert, C. J.: Anaerobic oxidation of methane in an iron-rich Danish freshwater lake sediment, Limnol. Oceanogr., 58, 546–554, https://doi.org/10.4319/lo.2013.58.2.0546, 2013.
Peeters, F., Encinas Fernandez, J., and Hofmann, H.: Sediment fluxes rather than oxic methanogenesis explain diffusive CH4 emissions from lakes and reservoirs, Sci. Rep.-UK, 9, 1–10, https://doi.org/10.1038/s41598-018-36530-w, 2019.
Petkovšek, G., Roca, M., and Kitamura, Y.: Sediment flushing from reservoirs: a review, Dams Reserv., 30, 12–21, https://doi.org/10.1680/jdare.20.00005, 2020.
Ragg, R. B., Peeters, F., Ingwersen, J., Teiber-Siessegger, P., and Hofmann, H.: Interannual Variability of Methane Storage and Emission During Autumn Overturn in a Small Lake, J. Geophys. Res.-Biogeo., 126, e2021JG006388, https://doi.org/10.1029/2021JG006388, 2021.
Saam, L., Mouris, K., Wieprecht, S., and Haun, S.: Threedimensional numerical modelling of reservoir flushing to obtain long-term sediment equilibrium, in: Proceedings of the 38th IAHR World Congress (Panama), Panama City, Panama, 1–6 September 2019, https://doi.org/10.3850/38WC092019-0742, 2019.
Schulz, S. and Conrad, R.: Effect of algal deposition on acetate and methane concentrations in the profundal sediment of a deep lake (Lake Constance), FEMS Microbiol. Ecol., 16, 251–259, https://doi.org/10.1016/0168-6496(94)00088-E, 1995.
Schulz, S., Matsuyama, H., and Conrad, R.: Temperature dependence of methane production from different precursors in a profundal sediment (Lake Constance), FEMS Microbiol. Ecol., 22, 207–213, https://doi.org/10.1111/j.1574-6941.1997.tb00372.x, 1997.
Segers, R.: Methane production and methane consumption: a review of processes underlying wetland methane fluxes, Biogeochemistry, 41, 23–51, https://doi.org/10.1023/A:1005929032764, 1998.
Sepulveda-Jauregui, A., Hoyos-Santillan, J., Martinez-Cruz, K., Walter Anthony, K. M., Casper, P., Belmonte-Izquierdo, Y., and Thalasso, F.: Eutrophication exacerbates the impact of climate warming on lake methane emission, Sci. Total Environ., 636, 411–419, https://doi.org/10.1016/j.scitotenv.2018.04.283, 2018.
Shelley, F., Abdullahi, F., Grey, J., and Trimmer, M.: Microbial methane cycling in the bed of a chalk river: oxidation has the potential to match methanogenesis enhanced by warming, Freshwater Biol., 60, 150–160, https://doi.org/10.1111/fwb.12480, 2015.
Sobek, S., DelSontro, T., Wongfun, N., and Wehrli, B.: Extreme organic carbon burial fuels intense methane bubbling in a temperate reservoir, Geophys. Res. Lett., 39, L01401, https://doi.org/10.1029/2011GL050144, 2012.
Sumi, T., Nakamura, S., and Hayashi, K.: The effect of sediment flushing and environmental mitigation measures in the Kurobe River, in: 23rd ICOLD Congress, Brasilia, Brazil, 25–29 May 2009, Q89-R6, 2009.
Sumi, T., Kantoush, S., Esmaeili, T., and Ock, G.: Reservoir sediment flushing and replenishment below dams: insights from Japanese case studies, in: Gravel-Bed Rivers: Processes and Disasters, edited by: Tsutsumi, D. and Laronne, J. B., Wiley Online Library, New York, 385–414, https://doi.org/10.1002/9781118971437.ch14, 2017.
Wanninkhof, R.: Relationship between wind speed and gas exchange over the ocean, J. Geophys. Res.-Oceans, 97, 7373–7382, https://doi.org/10.1029/92JC00188, 1992.
WCD (World Commission on Dams): Dams and development: A new framework for decision-making: The report of the world 20 commission on dams, Earthscan, London, ISBN 1853837989, 2000.
Weast, R. C. (Ed.): CRC Handbook of Chemistry and Physics, 69th edn., CRC Press, Inc., Boca Raton, Florida, F-37-F-40, ISBN 0-8493-0369-5, 1988.
Yang, L., Lu, F., Wang, X., Duan, X., Song, W., Sun, B., Chen, S., Zhang, Q., Hou, P., Zheng, F., Zhang, Y., Zhou, X., Zhou, Y., and Ouyang, Z.: Surface methane emissions from different land use types during various water levels in three major drawdown areas of the Three Gorges Reservoir, J. Geophys. Res.-Atmos., 117, D10109, https://doi.org/10.1029/2011JD017362, 2012.
Zarfl, C., Lumsdon, A. E., Berlekamp, J., Tydecks, L., and Tockner, K.: A global boom in hydropower dam construction, Aquat. Sci., 77, 161–170, https://doi.org/10.1007/s00027-014-0377-0, 2015.